Exhibit 99.1
People’s United Financial, Inc. A Premium Brand Built Over 175 Years Investor Presentation February 2018
Forward-Looking Statement Certain statements contained in this presentation are forward-looking in nature. These include all statements about People’s United Financial, Inc. (“People’s United”) plans, objectives, expectations and other statements that are not historical facts, and usually use words such as “expect,” “anticipate,” “believe,” “should” and similar expressions. Such statements represent management’s current beliefs, based upon information available at the time the statements are made, with regard to the matters addressed. All forward-looking statements are subject to risks and uncertainties that could cause People’s United’ actual results or financial condition to differ materially from those expressed in or implied by such statements. Factors of particular importance to People’s United include, but are not limited to: (1) changes in general, international, national or regional economic conditions; (2) changes in interest rates; (3) changes in loan default andcharge-off rates; (4) changes in deposit levels; (5) changes in levels of income and expense innon-interest income and expense related activities; (6) changes in accounting and regulatory guidance applicable to banks; (7) price levels and conditions in the public securities markets generally; (8) competition and its effect on pricing, spending, third-party relationships and revenues; (9) the successful integration of acquisitions; and (10) changes in regulation resulting from or relating to financial reform legislation. People’s United does not undertake any obligation to update or revise any forward-looking statements, whether as a result of new information, future events or otherwise. 1
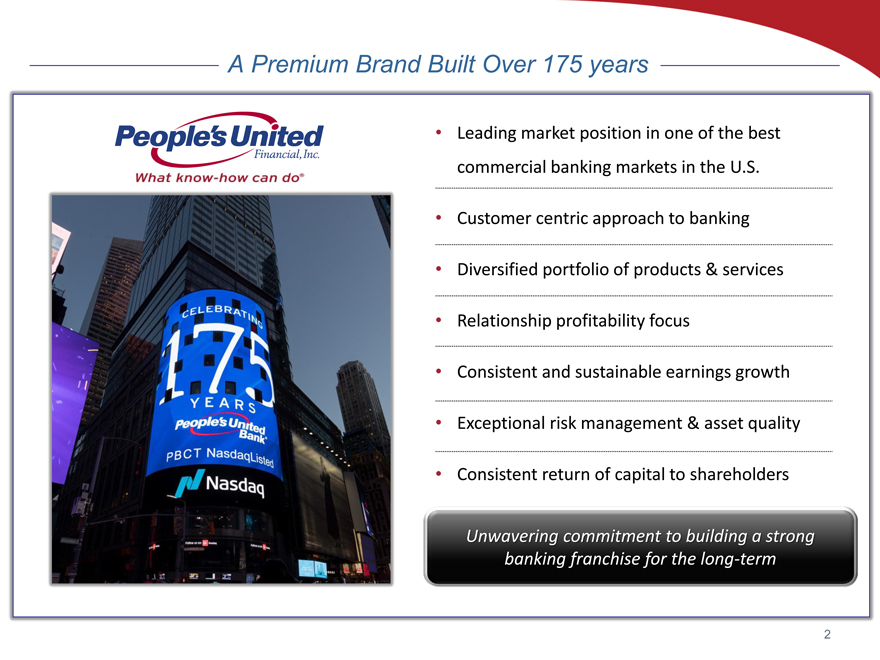
A Premium Brand Built Over 175 years • Leading market position in one of the best commercial banking markets in the U.S. • Customer centric approach to banking • Diversified portfolio of products & services • Relationship profitability focus • Consistent and sustainable earnings growth • Exceptional risk management & asset quality • Consistent return of capital to shareholders Unwavering commitment to building a strong banking franchise for the long ter 2
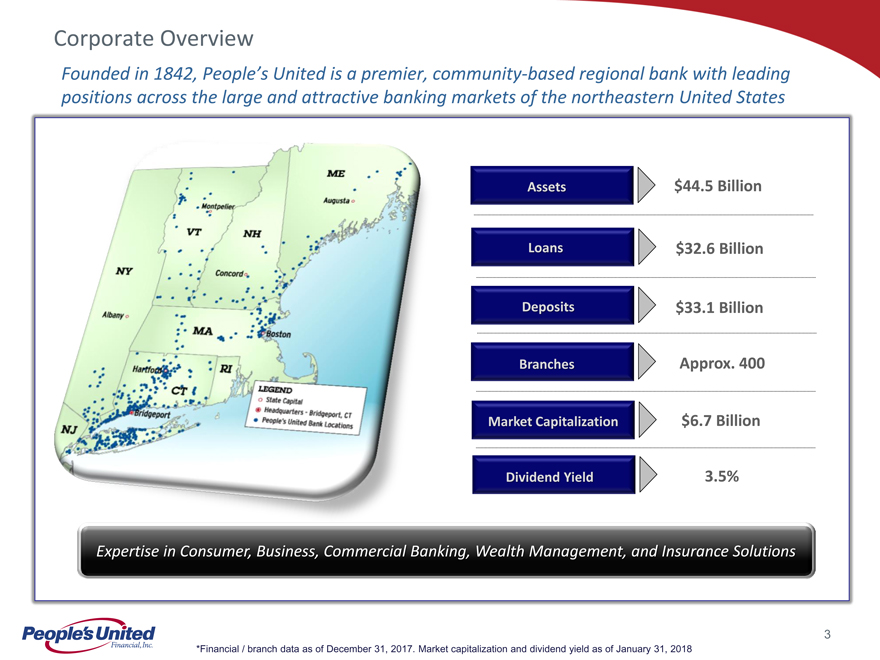
Corporate Overview Founded in 1842, People’s United is a premier, community-based regional bank with leading positions across the large and attractive banking markets of the northeastern United States Assets $44.5 Billion Loans $32.6 Billion Deposits $33.1 Billion Branches Approx. 400 Market Capitalization $6.7 Billion Dividend Yield 3.5% Expertise in Consumer, Business, Commercial Banking, Wealth Management, and Insurance Solution 3 *Financial / branch data as of December 31, 2017. Market capitalization and dividend yield as of January 31, 2018
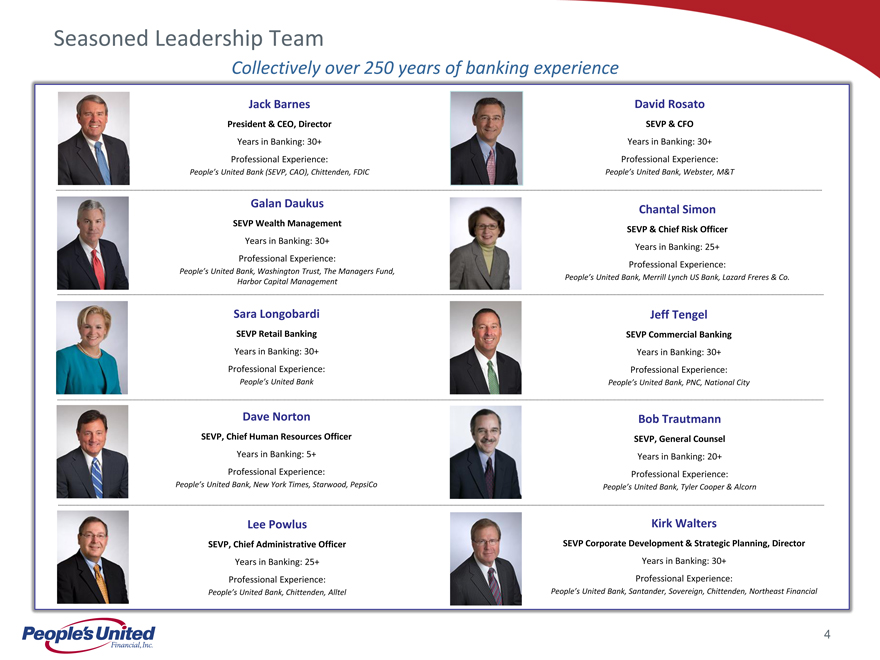
Seasoned Leadership Team Collectively over 250 years of banking experience Jack Barnes David Rosato President & CEO, Director SEVP & CFO Years in Banking: 30+ Years in Banking: 30+ Professional Experience: Professional Experience: People’s United Bank (SEVP, CAO), Chittenden, FDIC People’s United Bank, Webster, M&T Galan Daukus Chantal Simon SEVP Wealth Management SEVP & Chief Risk Officer Years in Banking: 30+ Years in Banking: 25+ Professional Experience: People’s United Bank, Washington Trust, The Managers Fund, Professional Experience: People’s United Bank, Merrill Lynch US Bank, Lazard Freres & Co. Harbor Capital Management Sara Longobardi Jeff Tengel SEVP Retail Banking SEVP Commercial Banking Years in Banking: 30+ Years in Banking: 30+ Professional Experience: Professional Experience: People’s United Bank People’s United Bank, PNC, National City Dave Norton Bob Trautmann SEVP, Chief Human Resources Officer SEVP, General Counsel Years in Banking: 5+ Years in Banking: 20+ Professional Experience: Professional Experience: People’s United Bank, New York Times, Starwood, PepsiCo People’s United Bank, Tyler Cooper & Alcorn Lee Powlus Kirk Walters SEVP, Chief Administrative Officer SEVP Corporate Development & Strategic Planning, Director Years in Banking: 25+ Years in Banking: 30+ Professional Experience: Professional Experience: People’s United Bank, Chittenden, Alltel People’s United Bank, Santander, Sovereign, Chittenden, Northeast Financial 4
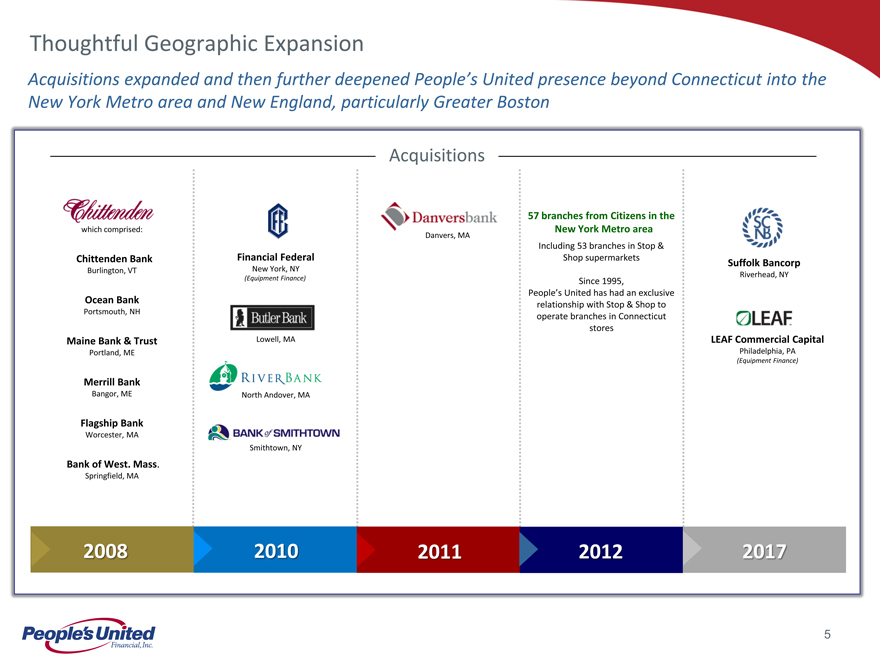
Thoughtful Geographic Expansion Acquisitions expanded and then further deepened People’s United presence beyond Connecticut into the New York Metro area and New England, particularly Greater Boston Acquisitions 57 branches from Citizens in the New York Metro area Danvers, MA Including 53 branches in Stop & Chittenden Bank Financial Federal Shop supermarkets Suffolk Bancorp Burlington, VT New York, NY Riverhead, NY (Equipment Finance) Since 1995, People’s United has had an exclusiveOcean Bank Portsmouth, NH relationship with Stop & Shop to operate branches in Connecticut stores Maine Bank & Trust Lowell, MA LEAF Commercial Capital Portland, ME Philadelphia, PA c (Equipment Finance) Merrill Bank Bangor, ME North Andover, MA Flagship Bank Worcester, MA Smithtown, NY Bank of West. Mass. Springfield, MA 2008 2010 2011 2012 2017 5
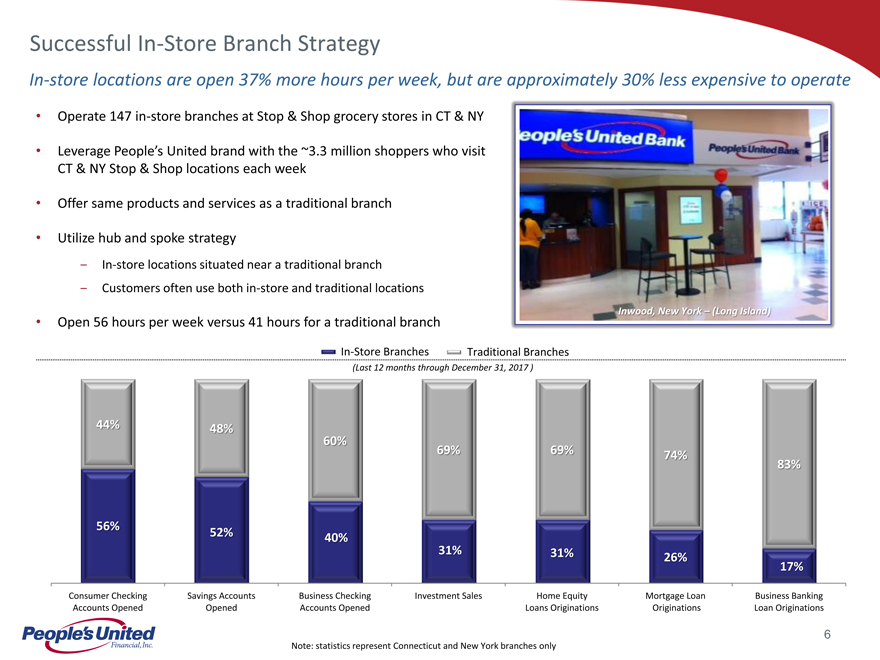
SuccessfulIn-Store Branch StrategyIn-store locations are open 37% more hours per week, but are approximately 30% less expensive to operate Operate 147in-store branches at Stop & Shop grocery stores in CT & NY Leverage People’s United brand with the 3.3 million shoppers who visitCT & NY Stop & Shop locations each week Offer same products and services as a traditional branch Utilize hub and spoke strategyIn-store locations situated near a traditional branch Customers often use bothin-store and traditional locations Inwood, New York – (Long Island) Open 56 hours per week versus 41 hours for a traditional branchIn-Store Branches Traditional Branches (Last 12 months through December 31, 2017 ) 44% 48% 60% 69% 69% 74% 83% 56% 52% 40% 31% 31% 26% 17% Consumer Checking Savings Accounts Business Checking Investment Sales Home Equity Mortgage Loan Business Banking Accounts Opened Opened Accounts Opened Loans Originations Originations Loan Originations 6 Note: statistics represent Connecticut and New York branches only
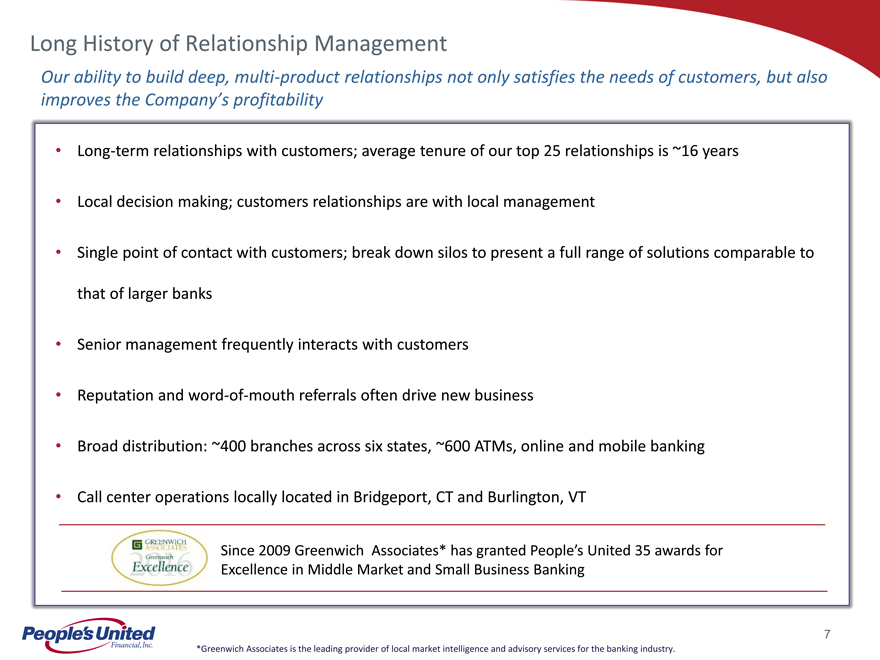
Long History of Relationship Management Our ability to build deep, multi-product relationships not only satisfies the needs of customers, but also improves the Company’s profitability Long-term relationships with customers; average tenure of our top 25 relationships is ~16 years Local decision making; customers relationships are with local management Single point of contact with customers; break down silos to present a full range of solutions comparable to that of larger banks Senior management frequently interacts with customers • Reputation andword-of-mouth referrals often drive new business Broad distribution: ~400 branches across six states, ~600 ATMs, online and mobile banking Call center operations locally located in Bridgeport, CT and Burlington, VT Since 2009 Greenwich Associates* has granted People’s United 35 awards for Excellence in Middle Market and Small Business Banking 7 *Greenwich Associates is the leading provider of local market intelligence and advisory services for the banking industry.
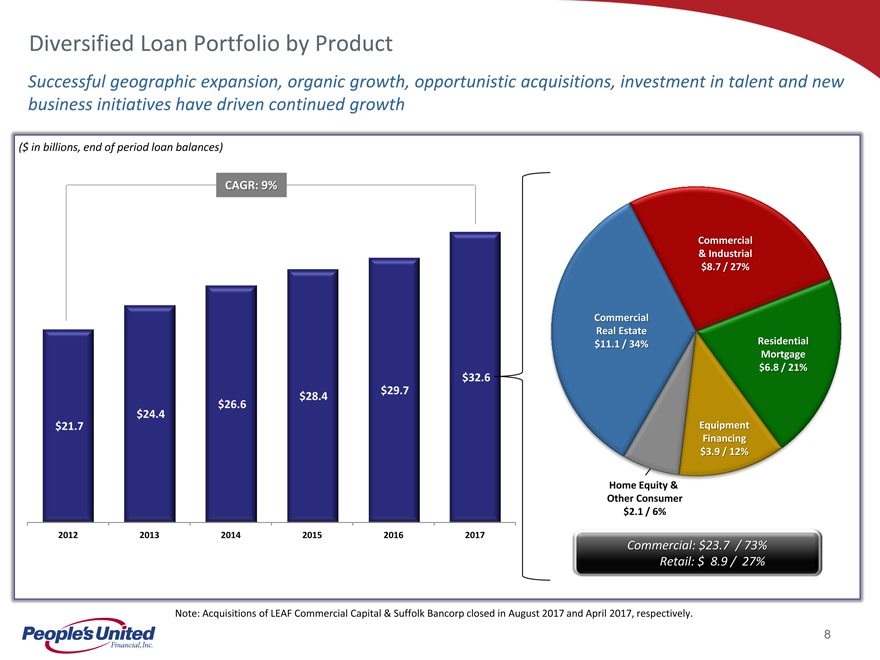
Diversified Loan Portfolio by Product Successful geographic expansion, organic growth, opportunistic acquisitions, investment in talent and new business initiatives have driven continued growth ($ in billions, end of period loan balances) CAGR: 9% Commercial & Industrial $8.7 / 27% Commercial Real Estate $11.1 / 34% Residential Mortgage $6.8 / 21% $32.6 $29.7 $28.4 $26.6 $24.4 $21.7 Equipment Financing $3.9 / 12% Home Equity & Other Consumer $2.1 / 6% 2012 2013 2014 2015 2016 2017Commercial: $23.7 / 73 Retail: $ 8.9 / 27% Note: Acquisitions of LEAF Commercial Capital & Suffolk Bancorp closed in August 2017 and April 2017, respectively. 8
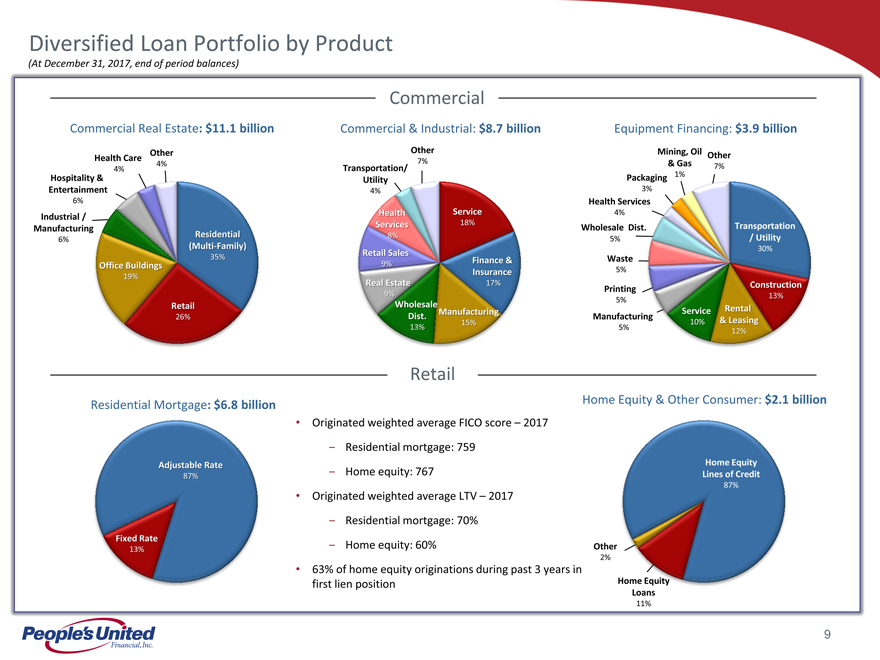
Diversified Loan Portfolio by Product (At December 31, 2017, end of period balances) Commercial Commercial Real Estate: $11.1 billion Commercial & Industrial: $8.7 billion Equipment Financing: $3.9 billion Other Other Mining, Oil Health Care Other 4% 7% & Gas 4% Transportation/ 7% Hospitality & Packaging 1% Utility Entertainment 4% 3% 6% Health Services Health Service 4% Industrial / Services 18% Transportation Manufacturing Residential Wholesale Dist. 8% / Utility 6% (Multi-Family) 5% 30% Retail Sales 35% 9% Finance & Waste Office Buildings 19% Insurance 5% Real Estate 17% Construction Printing 9% 5% 13% Retail holesale Dist. Manufacturing Service Rental 26% Manufacturing 13% 15% 5% 10% & Leasing 12% Retail Home Equity & Other Consumer: $2.1 billion Residential Mortgage: $6.8 billion • Originated weighted average FICO score – 2017 Residential mortgage: 759 Adjustable Rate Home Equity Home equity: 767 Lines of Credit 87% 87% Originated weighted average LTV – 2017 Residential mortgage: 70% Fixed Rate Home equity: 60% Other 13% 2% • 63% of home equity originations during past 3 years in first lien position Home Equity Loans 11% 9
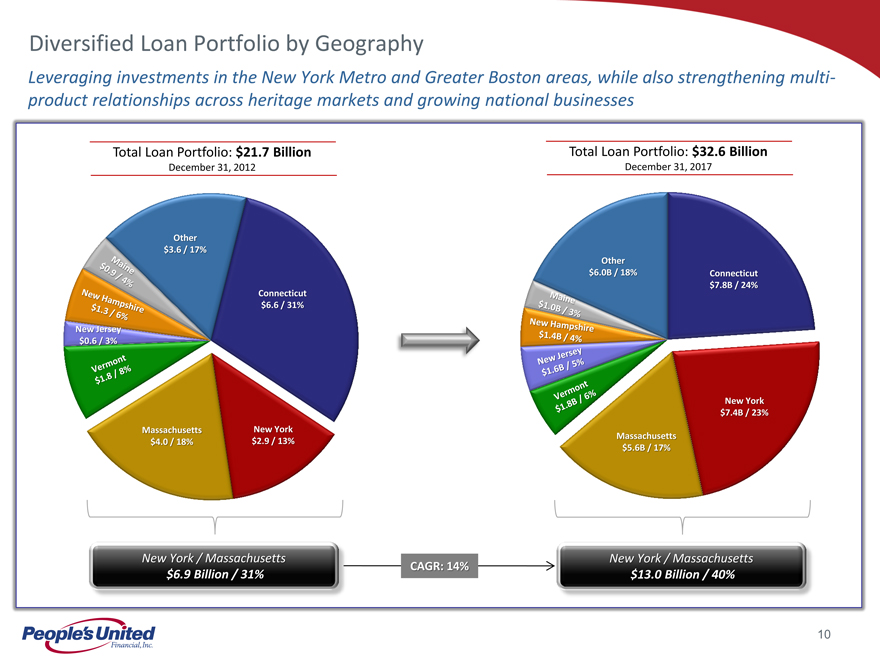
Diversified Loan Portfolio by Geography Leveraging investments in the New York Metro and Greater Boston areas, while also strengthening multi-product relationships across heritage markets and growing national businesses Total Loan Portfolio: $21.7 Billion Total Loan Portfolio: $32.6 Billion December 31, 2012 December 31, 2017 Other $3.6 / 17% Other $6.0B / 18% Connecticut $7.8B / 24% Connecticut $6.6 / 31% New Jersey $0.6 / 3% c New York $7.4B / 23% Massachusetts New York Massachusetts $4.0 / 18% $2.9 / 13% $5.6B / 17% New York / Massachuset New York / Massachuset CAGR: 14% $6.9 Billion / 31% $13.0 Billion / 40 10
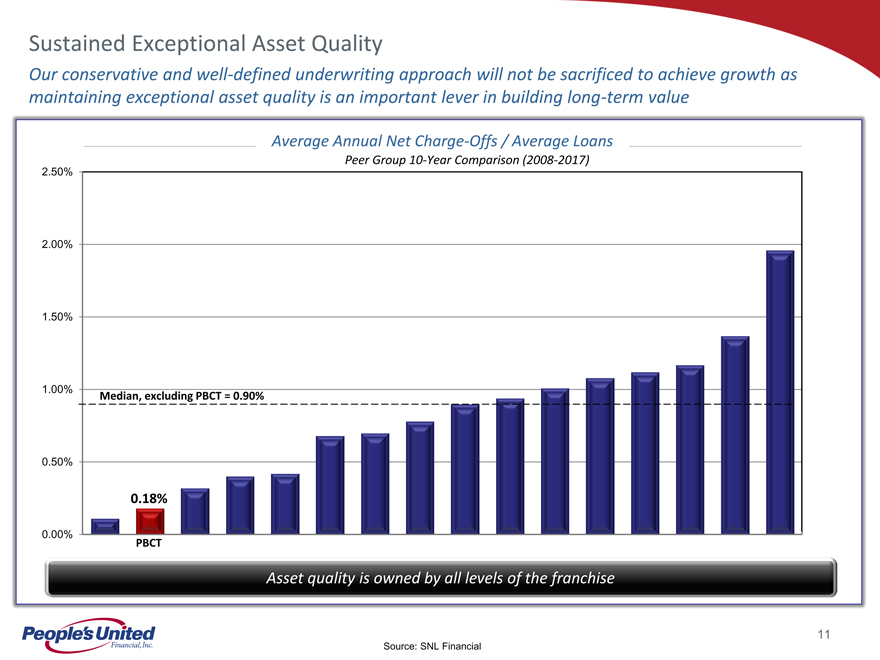
Sustained Exceptional Asset Quality Our conservative and well-defined underwriting approach will not be sacrificed to achieve growth as maintaining exceptional asset quality is an important lever in building long-term value Average Annual Net Charge-Offs / Average Loans Peer Group10-Year Comparison (2008-2017) 2.50%2.00%1.50%1.00%Median, excluding PBCT = 0.90% 0.50%0.18% 0.00% PBCT Asset quality is owned by all levels of the franch 11 Source: SNL Financial
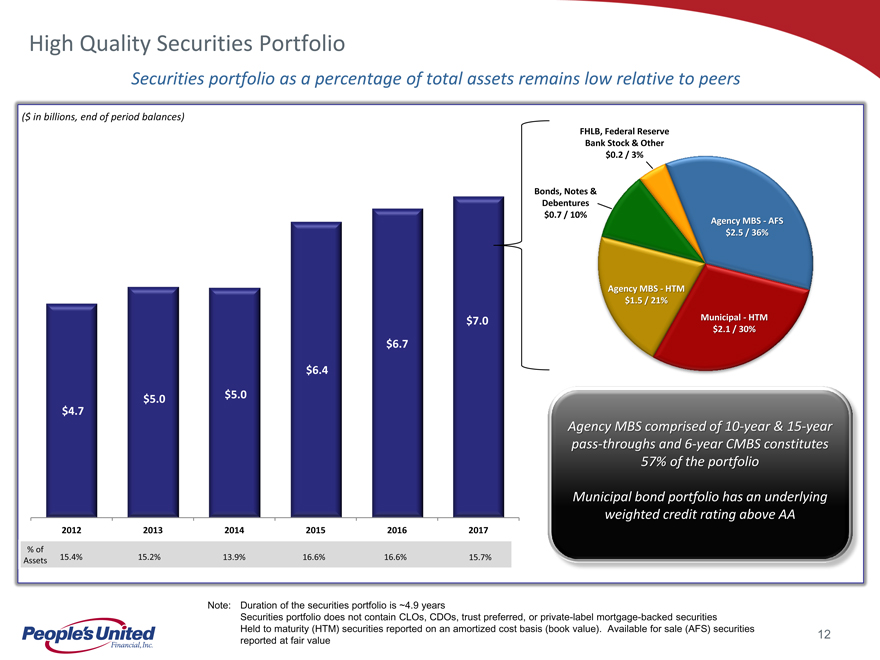
High Quality Securities Portfolio Securities portfolio as a percentage of total assets remains low relative to peers ($ in billions, end of period balances) FHLB, Federal Reserve Bank Stock & Other $0.2 / 3% Bonds, Notes & Debentures $0.7 / 10% Agency MBS—AFS $2.5 / 36% Agency MBS—HTM $1.5 / 21% $7.0 Municipal—HTM $2.1 / 30% $6.7 $6.4 $5.0 $5.0 $4.7 Agency MBS comprised of year & 1 year pass through and year CMBS constitutes 57% of the portfo Municipal bond portfolio has an underlying weighted credit rating above 2012 2013 2014 2015 2016 2017% of 15.4% 15.2% 13.9% 16.6% 16.6% 15.7% Assets Note: Duration of the securities portfolio is ~4.9 years Securities portfolio does not contain CLOs, CDOs, trust preferred, or private-label mortgage-backed securities Held to maturity (HTM) securities reported on an amortized cost basis (book value). Available for sale (AFS) securities 12 reported at fair value
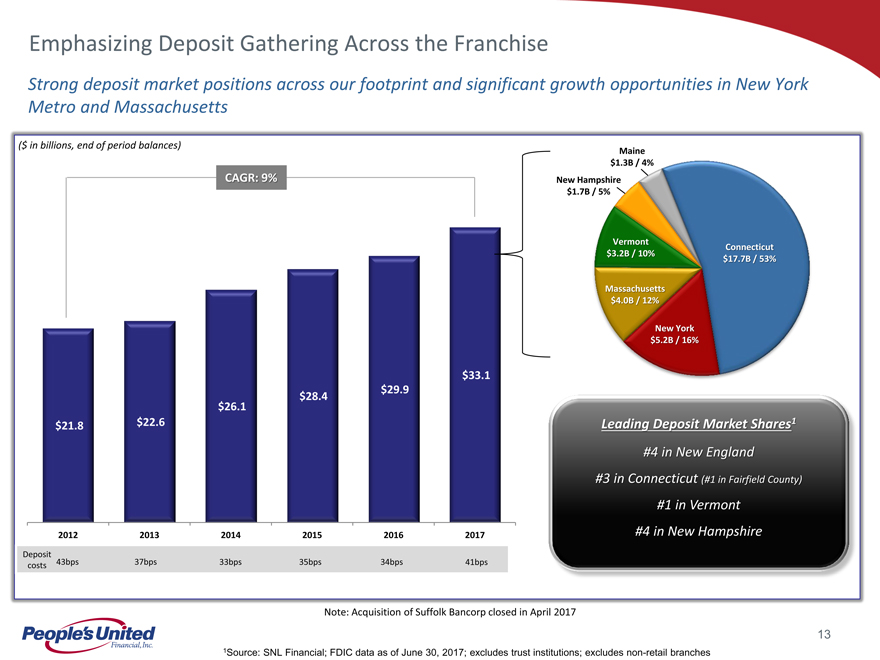
Emphasizing Deposit Gathering Across the Franchise Strong deposit market positions across our footprint and significant growth opportunities in New York Metro and Massachusetts ($ in billions, end of period balances) Maine $1.3B / 4% CAGR: 9% New Hampshire $1.7B / 5% Vermont Connecticut $3.2B / 10% $17.7B / 53% Massachusetts $4.0B / 12% New York $5.2B / 16% $33.1 $29.9 $28.4 $26.1 $21.8 $22.6 Leading Deposit Market Shares #4 in New Englan #3 in Connecticu (#1 in Fairfield Coun #1 in Vermon 2012 2013 2014 2015 2016 2017 #4 in New Hampshir Deposit 43bps 37bps 33bps 35bps 34bps 41bps costs Note: Acquisition of Suffolk Bancorp closed in April 2017 13 1Source: SNL Financial; FDIC data as of June 30, 2017; excludes trust institutions; excludesnon-retail branches
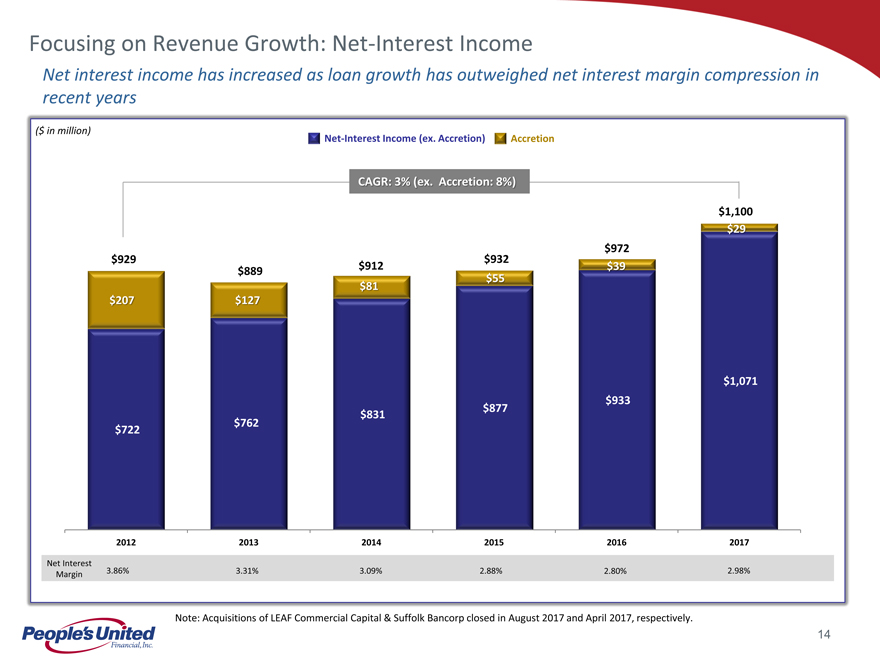
Focusing on Revenue Growth:Net-Interest Income Net interest income has increased as loan growth has outweighed net interest margin compression in recent years ($ in million)Net-Interest Income (ex. Accretion) Accretion CAGR: 3% (ex. Accretion: 8%) $1,100 $29 $972 $929 $932 $912 $39 $889 $55 $81 $207 $127 $1,071 $933 $877 $831 $762 $722 2012 2013 2014 2015 2016 2017Net Interest 3.86% 2.98% 3.31% 3.09% 2.88% 2.80% Margin Note: Acquisitions of LEAF Commercial Capital & Suffolk Bancorp closed in August 2017 and April 2017, respectively. 14
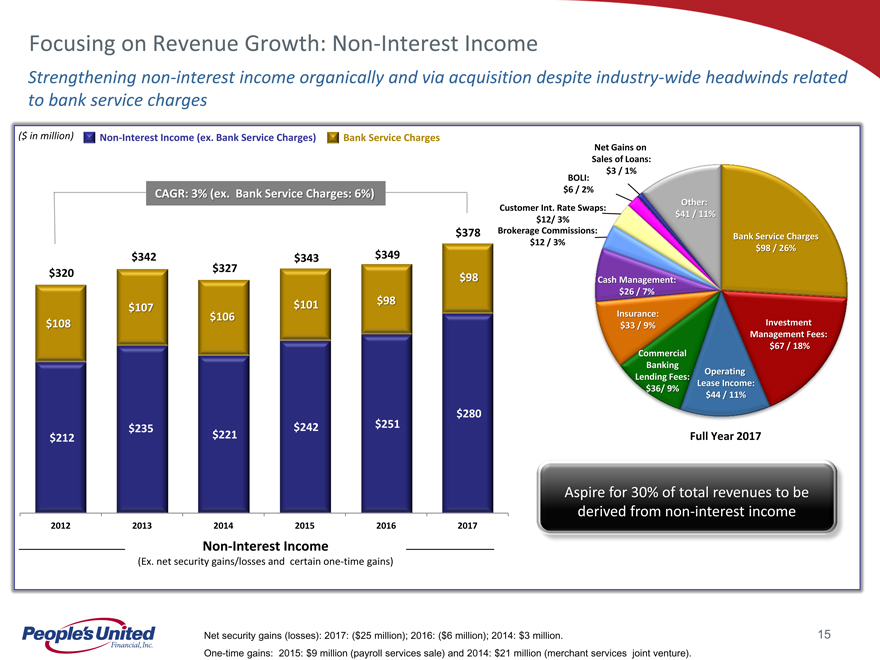
Focusing on Revenue Growth:Non-Interest Income Strengtheningnon-interest income organically and via acquisition despite industry-wide headwinds related to bank service charges ($ in million)Non-Interest Income (ex. Bank Service Charges) Bank Service Charges Net Gains on Sales of Loans: BOLI: $3 / 1% CAGR: 3% (ex. Bank Service Charges: 6%) $6 / 2% Other: Customer Int. Rate Swaps: $41 / 11% $12/ 3% $378 Brokerage Commissions: Bank Service Charges $12 / 3% $98 / 26% $342 $343 $349 $327 $320 $98 Cash Management: $26 / 7% $101 $98 $107 $106 Insurance: $108 $33 / 9% Investment Management Fees: Commercial $67 / 18% Banking Operating Lending Fees: Lease Income: $36/ 9% $44 / 11% $280 $235 $242 $251 $212 $221 Full Year 2017 Aspire for 30% of total revenues to be derived from non interest incom 2012 2013 2014 2015 2016 2017Non-Interest Income (Ex. net security gains/losses and certainone-time gains) Net security gains (losses): 2017: ($25 million); 2016: ($6 million); 2014: $3 million. 15One-time gains: 2015: $9 million (payroll services sale) and 2014: $21 million (merchant services joint venture).
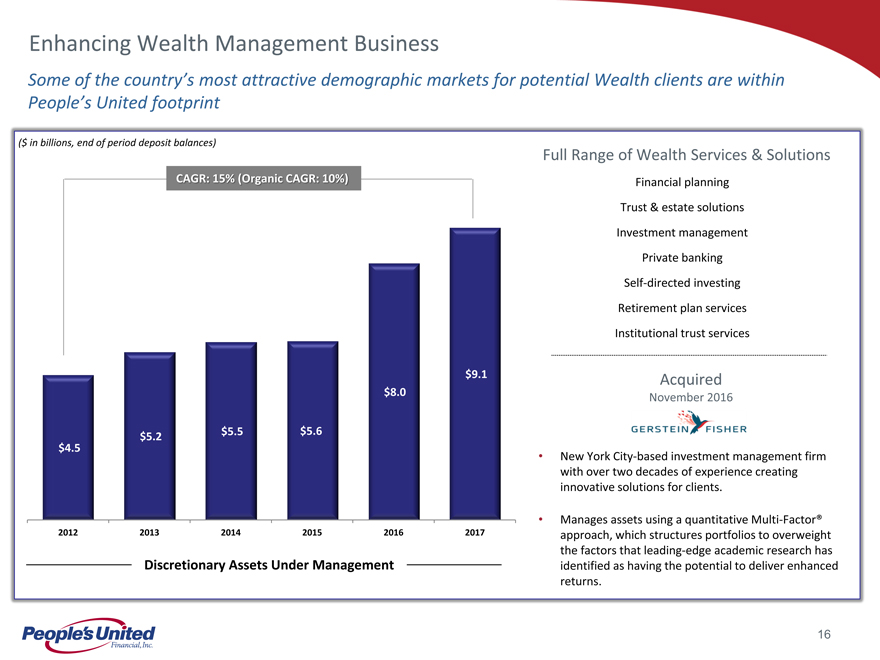
Enhancing Wealth Management Business Some of the country’s most attractive demographic markets for potential Wealth clients are within People’s United footprint ($ in billions, end of period deposit balances) Full Range of Wealth Services & Solutions CAGR: 15% (Organic CAGR: 10%) Financial planning Trust & estate solutions Investment management Private banking Self-directed investing Retirement plan services Institutional trust services $9.1 Acquired $8.0 November 2016 $5.5 $5.6 $5.2 $4.5 New York City-based investment management firm with over two decades of experience creating innovative solutions for clients. Manages assets using a quantitative Multi-Factor® 2012 2013 2014 2015 2016 2017 approach, which structures portfolios to overweight the factors that leading-edge academic research has Discretionary Assets Under Management identified as having the potential to deliver enhanced returns. 16
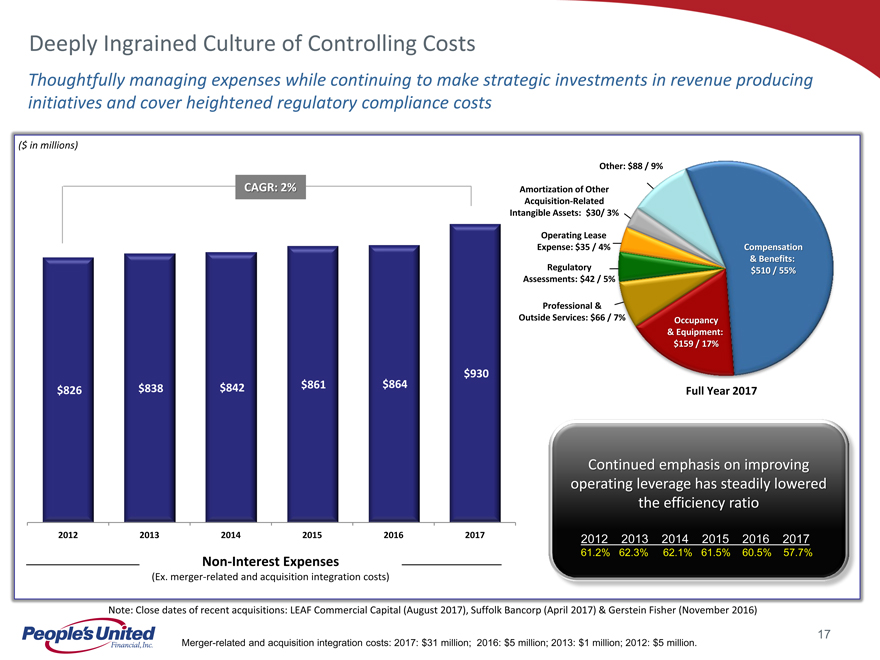
Deeply Ingrained Culture of Controlling Costs Thoughtfully managing expenses while continuing to make strategic investments in revenue producing initiatives and cover heightened regulatory compliance costs ($ in millions) Other: $88 / 9% CAGR: 2% Amortization of Other Acquisition-Related Intangible Assets: $30/ 3% Operating Lease Expense: $35 / 4% Compensation & Benefits: Regulatory $510 / 55% Assessments: $42 / 5% Professional & Outside Services: $66 / 7% Occupancy & Equipment: $159 / 17% $930 $838 $842 $861 $864 $826 Full Year 2017 Continued emphasis on improving operating leverage has steadily lowered the efficiency ratio 2012 2013 2014 2015 2016 2017 2012 2013 2014 2015 2016 2017 61.2% 62.3% 62.1% 61.5% 60.5% 57.7%Non-Interest Expenses (Ex. merger-related and acquisition integration costs) Note: Close dates of recent acquisitions: LEAF Commercial Capital (August 2017), Suffolk Bancorp (April 2017) & Gerstein Fisher (November 2016) 17 Merger-related and acquisition integration costs: 2017: $31 million; 2016: $5 million; 2013: $1 million; 2012: $5 million.
Preparing for the $50 Billion Asset Threshold Goal is to complete the process internally and avoid unusualone-time costs In 2015, People’s United formed a program, “B50B” or “Be $50 Billion”, designed to further drive the organization to meet the heightened expectations with predictability, sustainability and scalability. At the foundation of the program are the following core elements: Corporate governance Organizational structure / staffing Policy / process / procedure Control, model and data governance Given the strategic priority of B50B, a steering committee was established to oversee the program’s success Committee is chaired by the CEO Reports to the Executive Risk Oversight Committee and, at the Board level, the Enterprise Risk Committee Within B50B, cross-functional readiness review teams were assigned to key requirements identified as critical to crossing the $50 billion asset threshold Readiness review teams include seniors leaders from the impacted area as well senior leaders from Information Technology, Legal, Compliance/Risk, and Audit These teams have completed gap analyses on each of these requirements As a result of this analysis, the Company continues to build out modeling, data management and staff capabilities In recent years, the Company has made investments to its corporate infrastructure in areas such as enterprise risk management, model development and validation, internal audit, compliance, operational risk, and BSA/AML 18
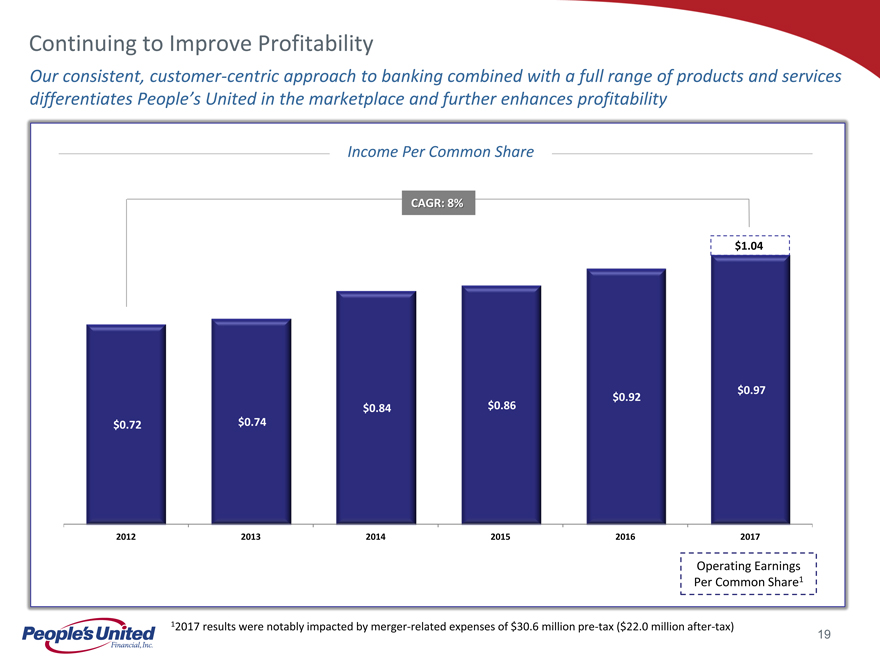
Continuing to Improve Profitability Our consistent, customer-centric approach to banking combined with a full range of products and services differentiates People’s United in the marketplace and further enhances profitability Income Per Common Share CAGR: 8% $1.04 $0.97 $0.92 $0.84 $0.86 $0.72 $0.74 2012 2013 2014 2015 2016 2017 Operating Earnings Per Common Share1 12017 results were notably impacted by merger-related expenses of $30.6 millionpre-tax ($22.0 millionafter-tax) 19
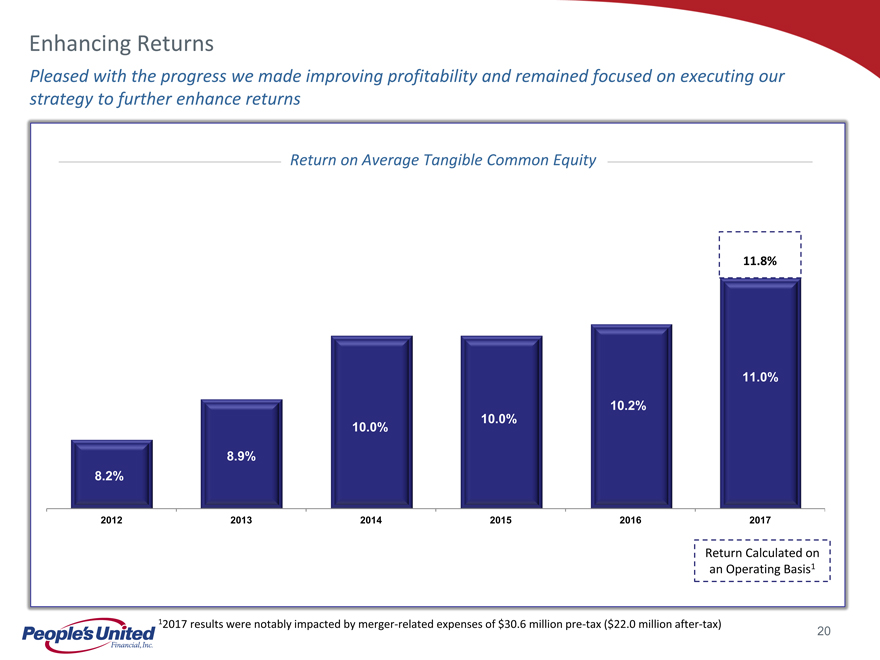
Enhancing Returns Pleased with the progress we made improving profitability and remained focused on executing our strategy to further enhance returns Return on Average Tangible Common Equity 11.8% 11.0% 10.2% 10.0% 10.0% 8.9% 8.2% 2012 2013 2014 2015 2016 2017Return Calculated on an Operating Basis1 12017 results were notably impacted by merger-related expenses of $30.6 millionpre-tax ($22.0 millionafter-tax) 20
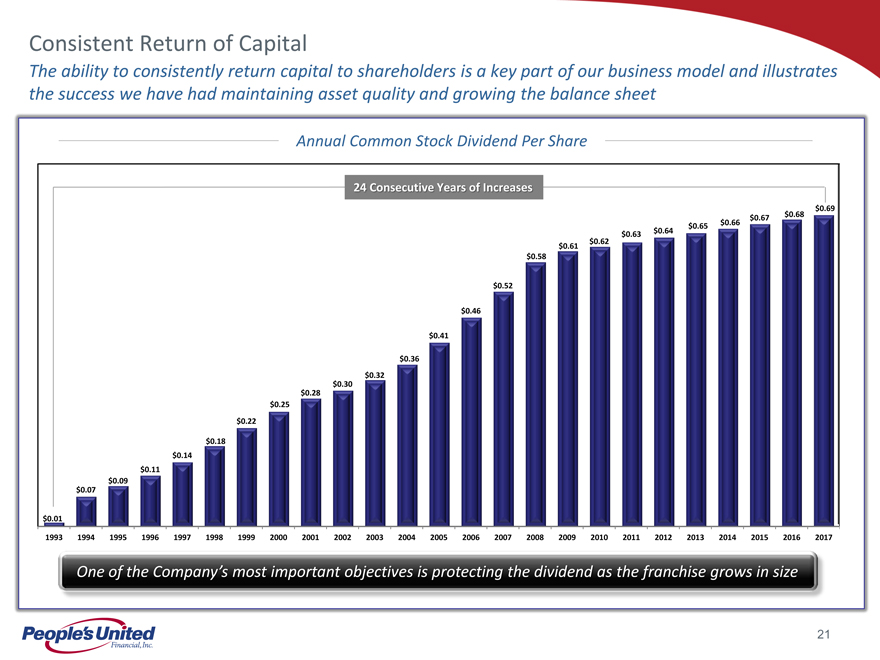
Consistent Return of Capital The ability to consistently return capital to shareholders is a key part of our business model and illustrates the success we have had maintaining asset quality and growing the balance sheet Annual Common Stock Dividend Per Share 24 Consecutive Years of Increases $0.68 $0.69 $0.67 $0.66 $0.65 $0.64 $0.63 $0.62 $0.61 $0.58 $0.52 $0.46 $0.41 $0.36 $0.32 $0.30 $0.28 $0.25 $0.22 $0.18 $0.14 $0.11 $0.09 $0.07 $0.01 1993 1994 1995 1996 1997 1998 1999 2000 2001 2002 2003 2004 2005 2006 2007 2008 2009 2010 2011 2012 2013 2014 2015 2016 2017One of the Company’s most important objectives is protecting the dividend as the franchise grows in siz 21
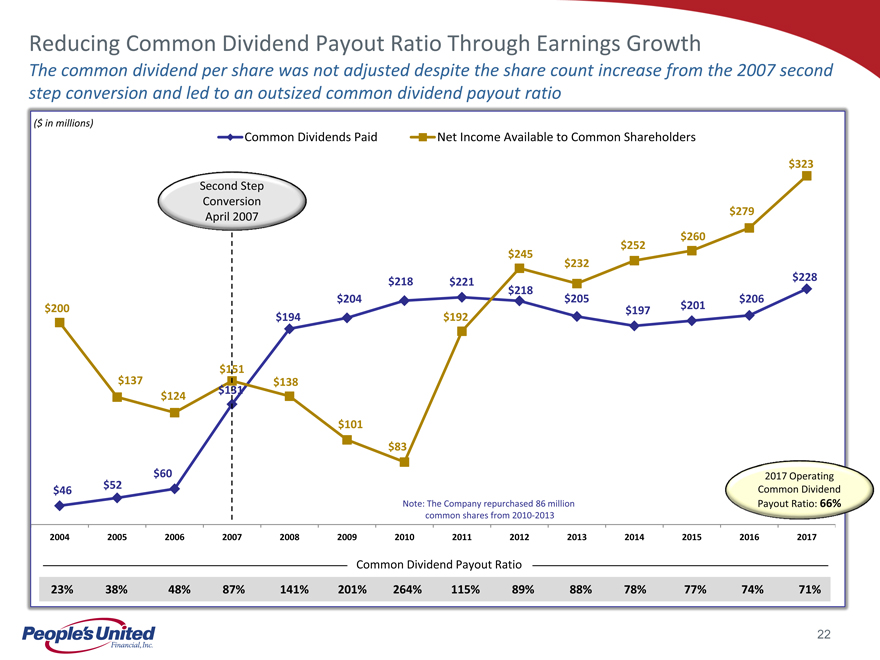
Reducing Common Dividend Payout Ratio Through Earnings Growth The common dividend per share was not adjusted despite the share count increase from the 2007 second step conversion and led to an outsized common dividend payout ratio ($ in millions) Common Dividends Paid Net Income Available to Common Shareholders $323 Second Step Conversion $279 April 2007 $252 $260 $245 $232 $218 $228 $221 $218 $204 $205 $206 $200 $201 $197 $194 $192 $151 $137 $131 $138 $124 $101 $83 $60 2017 Operating $52 Common Dividend $46 Note: The Company repurchased 86 million Payout Ratio: 66% common shares from 2010-2013 2004 2005 2006 2007 2008 2009 2010 2011 2012 2013 2014 2015 2016 2017Common Dividend Payout Ratio 23% 38% 48% 87% 141% 201% 264% 115% 89% 88% 78% 77% 74% 71% 22
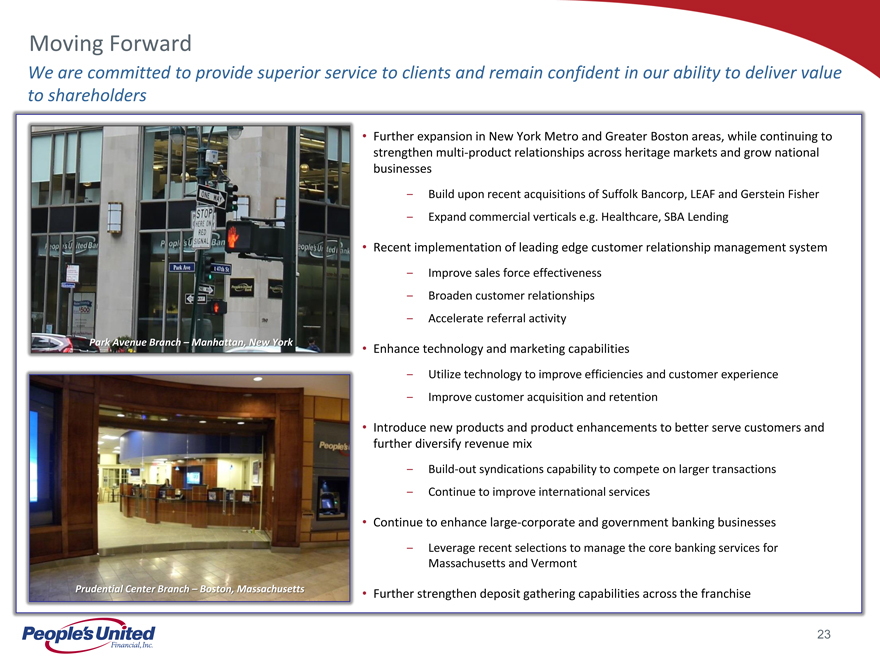
Moving Forward We are committed to provide superior service to clients and remain confident in our ability to deliver value to shareholders Further expansion in New York Metro and Greater Boston areas, while continuing to strengthen multi-product relationships across heritage markets and grow national businesses Build upon recent acquisitions of Suffolk Bancorp, LEAF and Gerstein Fisher Expand commercial verticals e.g. Healthcare, SBA Lending Recent implementation of leading edge customer relationship management system Improve sales force effectiveness Broaden customer relationships Accelerate referral activity Park Avenue Branch – Manhattan, New York • Enhance technology and marketing capabilities c Utilize technology to improve efficiencies and customer experience Improve customer acquisition and retention Introduce new products and product enhancements to better serve customers and further diversify revenue mixBuild-out syndications capability to compete on larger transactions Continue to improve international services Continue to enhance large-corporate and government banking businesses Leverage recent selections to manage the core banking services for Massachusetts and Vermont Prudential Center Branch – Boston, Massachusetts Further strengthen deposit gathering capabilities across the franchise 23
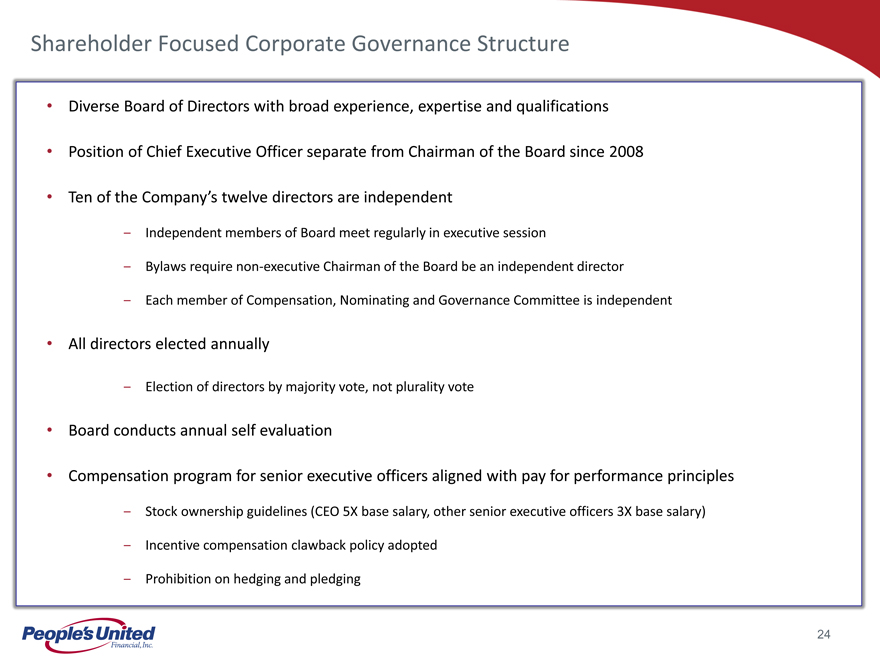
Shareholder Focused Corporate Governance Structure Diverse Board of Directors with broad experience, expertise and qualifications Position of Chief Executive Officer separate from Chairman of the Board since 2008 Ten of the Company’s twelve directors are independent Independent members of Board meet regularly in executive session Bylaws requirenon-executive Chairman of the Board be an independent director Each member of Compensation, Nominating and Governance Committee is independent All directors elected annually c Election of directors by majority vote, not plurality vote Board conducts annual self evaluation Compensation program for senior executive officers aligned with pay for performance principles Stock ownership guidelines (CEO 5X base salary, other senior executive officers 3X base salary) Incentive compensation clawback policy adopted Prohibition on hedging and pledging 24
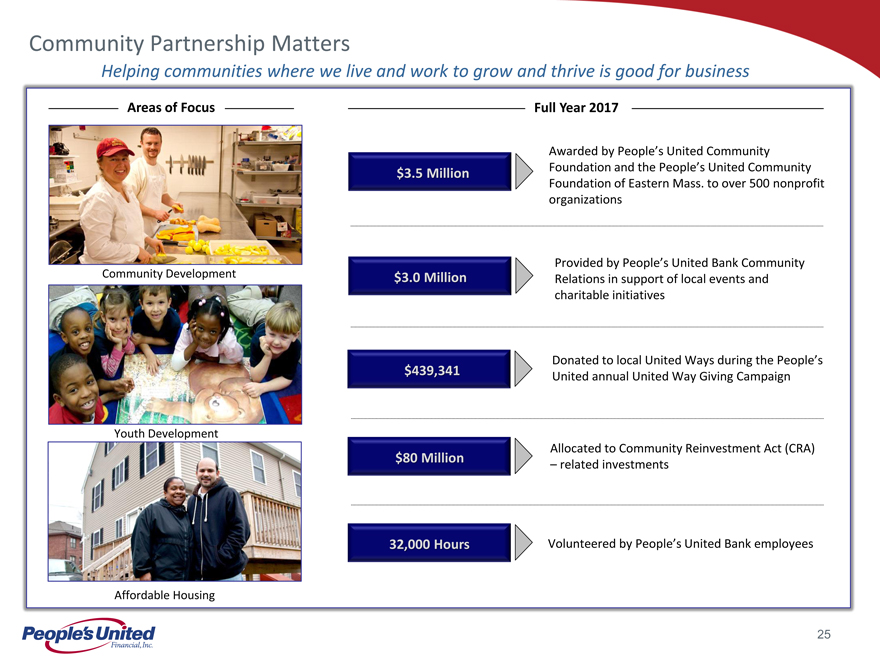
Community Partnership Matters Helping communities where we live and work to grow and thrive is good for business Areas of Focus Full Year 2017 Awarded by People’s United Community Foundation and the People’s United Community$3.5 Million Foundation of Eastern Mass. to over 500 nonprofit organizations Provided by People’s United Bank CommunityCommunity Development $3.0 Million Relations in support of local events and charitable initiatives c $439,341 Donated to local United Ways during the People’sUnited annual United Way Giving Campaign Youth Development Allocated to Community Reinvestment Act (CRA) $80 Million – related investments 32,000 Hours Volunteered by People’s United Bank employees Affordable Housing 25
Fourth Quarter and Full Year 2017 Results
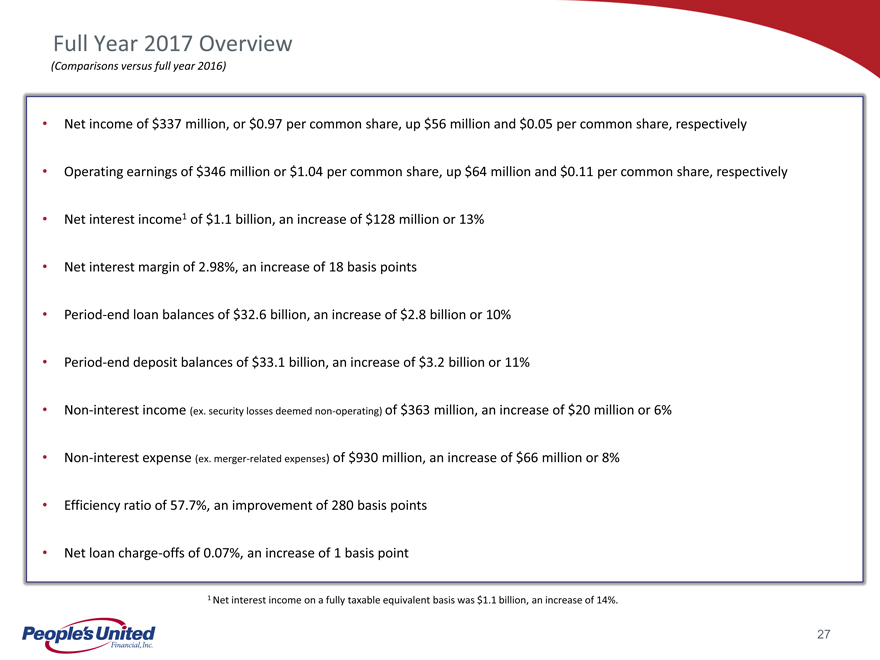
Full Year 2017 Overview (Comparisons versus full year 2016) Net income of $337 million, or $0.97 per common share, up $56 million and $0.05 per common share, respectively Operating earnings of $346 million or $1.04 per common share, up $64 million and $0.11 per common share, respectively Net interest income1 of $1.1 billion, an increase of $128 million or 13% Net interest margin of 2.98%, an increase of 18 basis pointsPeriod-end loan balances of $32.6 billion, an increase of $2.8 billion or 10%Period-end deposit balances of $33.1 billion, an increase of $3.2 billion or 11%Non-interest income (ex. security losses deemednon-operating) of $363 million, an increase of $20 million or 6%Non-interest expense (ex. merger-related expenses) of $930 million, an increase of $66 million or 8% Efficiency ratio of 57.7%, an improvement of 280 basis points Net loan charge-offs of 0.07%, an increase of 1 basis point 1 Net interest income on a fully taxable equivalent basis was $1.1 billion, an increase of 14%. 27
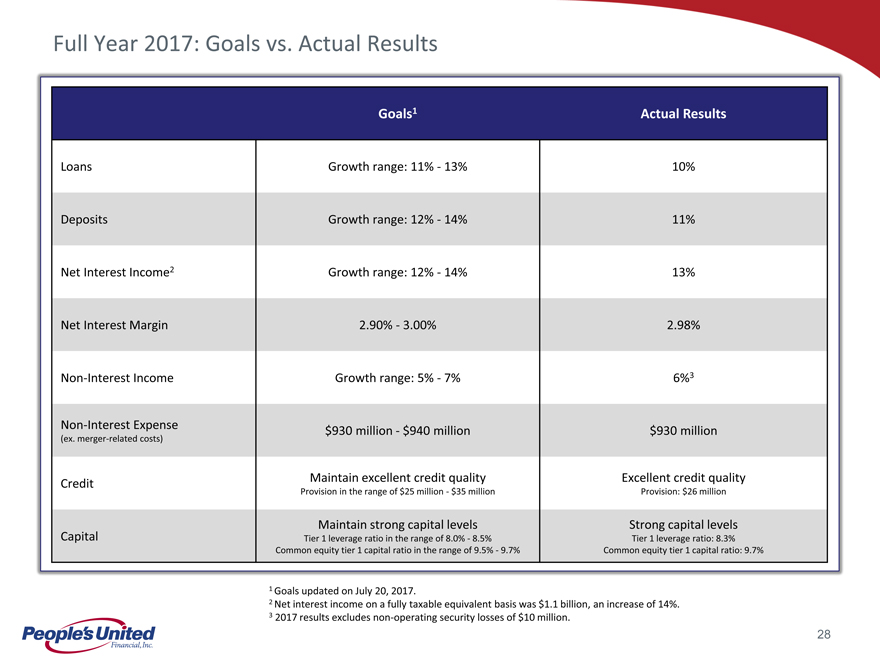
Full Year 2017: Goals vs. Actual Results Goals1 Actual Results Loans Growth range: 11%—13% 10% Deposits Growth range: 12%—14% 11% Net Interest Income2 Growth range: 12%—14% 13% Net Interest Margin 2.90%—3.00% 2.98%Non-Interest Income Growth range: 5%—7% 6%3Non-Interest Expense (ex. merger-related costs) $930 million—$940 million $930 million Maintain excellent credit quality Excellent credit quality Credit Provision in the range of $25 million—$35 million Provision: $26 million Maintain strong capital levels Strong capital levels Capital Tier 1 leverage ratio in the range of 8.0%—8.5% Tier 1 leverage ratio: 8.3% Common equity tier 1 capital ratio in the range of 9.5%—9.7% Common equity tier 1 capital ratio: 9.7% 1 Goals updated on July 20, 2017. 2 Net interest income on a fully taxable equivalent basis was $1.1 billion, an increase of 14%. 3 2017 results excludesnon-operating security losses of $10 million. 28
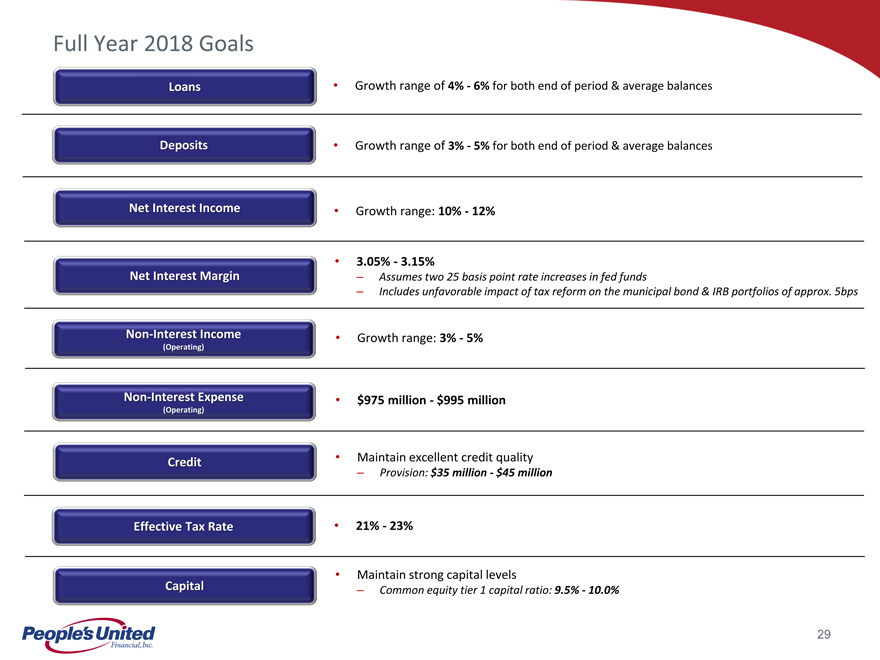
Full Year 2018 Goals Loans Growth range of 4%—6% for both end of period & average balances Deposit Growth range of 3%—5% for both end of period & average balances Net Interest Income Growth range: 10%—12% 3.05%—3.15% Net Interest Margin Assumes two 25 basis point rate increases in fed funds Includes unfavorable impact of tax reform on the municipal bond & IRB portfolios of approx. 5bps Non Interest Income Growth range: 3%—5% (Operatin Non Interest Expense $975 million—$995 million (Operatin Credit Maintain excellent credit quality Provision: $35 million—$45 million Effective Tax Rat 21%—23% Maintain strong capital levels Capit Common equity tier 1 capital ratio: 9.5%—10.0% 29
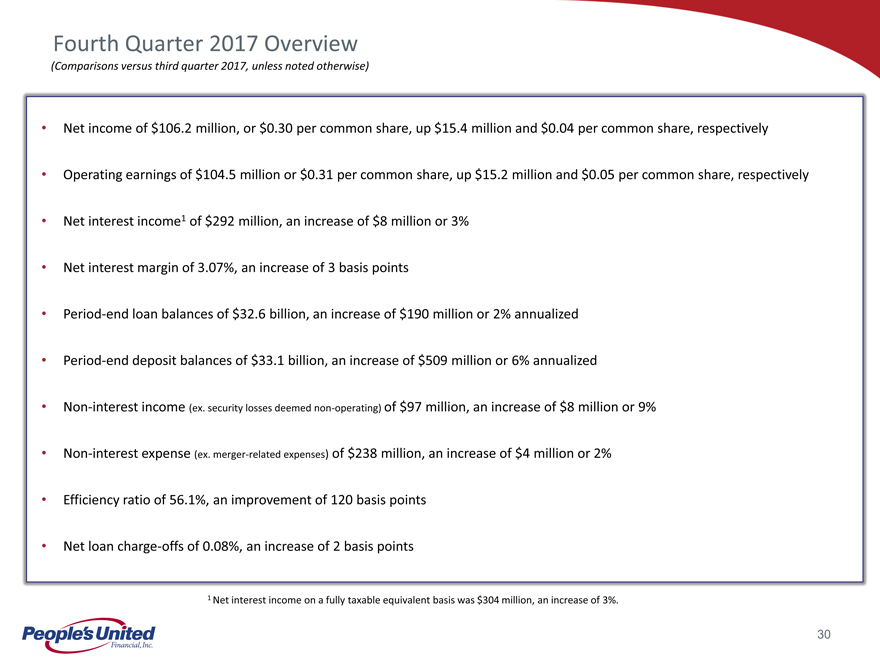
Fourth Quarter 2017 Overview (Comparisons versus third quarter 2017, unless noted otherwise) • Net income of $106.2 million, or $0.30 per common share, up $15.4 million and $0.04 per common share, respectively • Operating earnings of $104.5 million or $0.31 per common share, up $15.2 million and $0.05 per common share, respectively • Net interest income1 of $292 million, an increase of $8 million or 3% • Net interest margin of 3.07%, an increase of 3 basis points •Period-end loan balances of $32.6 billion, an increase of $190 million or 2% annualized •Period-end deposit balances of $33.1 billion, an increase of $509 million or 6% annualized •Non-interest income (ex. security losses deemednon-operating) of $97 million, an increase of $8 million or 9% •Non-interest expense (ex. merger-related expenses) of $238 million, an increase of $4 million or 2% • Efficiency ratio of 56.1%, an improvement of 120 basis points • Net loan charge-offs of 0.08%, an increase of 2 basis points 1 Net interest income on a fully taxable equivalent basis was $304 million, an increase of 3%. 30
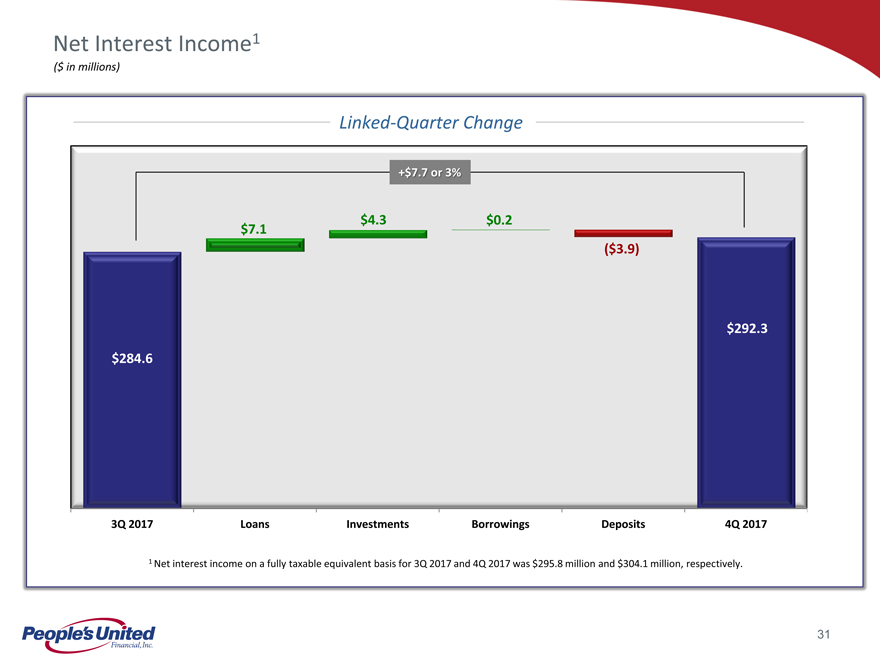
Net Interest Income1 ($ in millions) Linked-Quarter Change +$7.7 or 3% $4.3 $0.2 $7.1 ($3.9) $292.3 $284.6 3Q 2017 Loans Investments Borrowings Deposits 4Q 20171 Net interest income on a fully taxable equivalent basis for 3Q 2017 and 4Q 2017 was $295.8 million and $304.1 million, respectively. 31
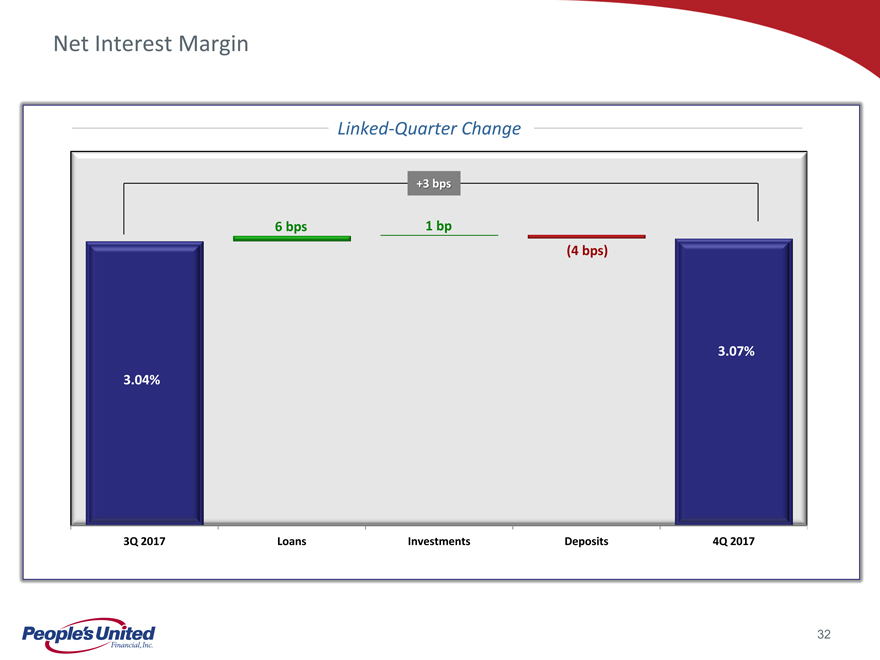
Net Interest Margin Linked-Quarter Change +3 bps 6 bps 1 bp (4 bps) 3.07% 3.04% 3Q 2017 Loans Investments Deposits 4Q 201732
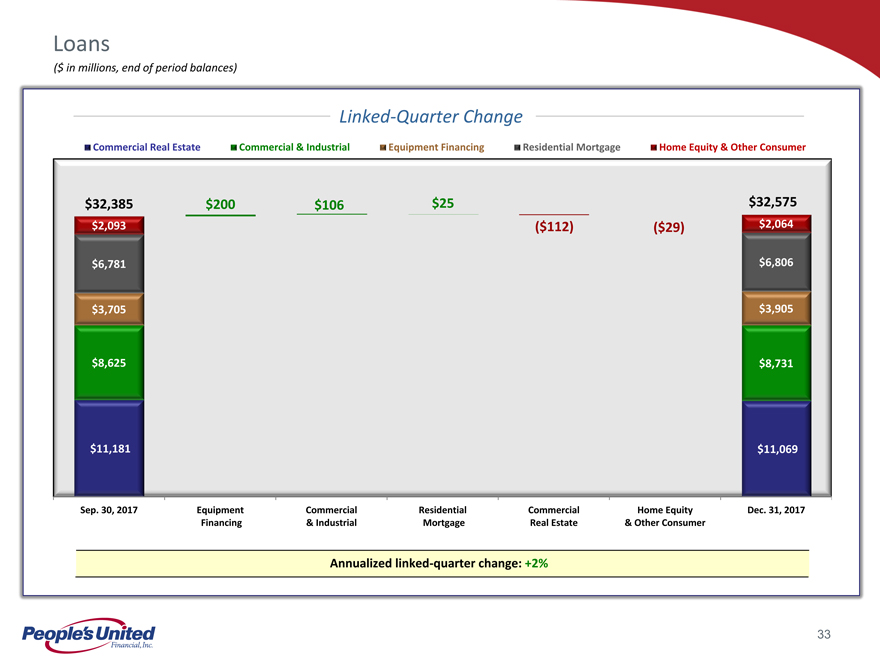
Loans ($ in millions, end of period balances) Linked-Quarter Change Commercial Real Estate Commercial & Industrial Equipment Financing Residential Mortgage Home Equity & Other Consumer$32,385 $200 $106 $25 $32,575 $2,093 ($112) ($29) $2,064 $6,781 $6,806 $3,705 $3,905 $8,625 $8,731 $11,181 $11,069 Sep. 30, 2017 Equipment Commercial Residential Commercial Home Equity Dec. 31, 2017 Financing & Industrial Mortgage Real Estate & Other ConsumerAnnualized linked-quarter change: +2% 33
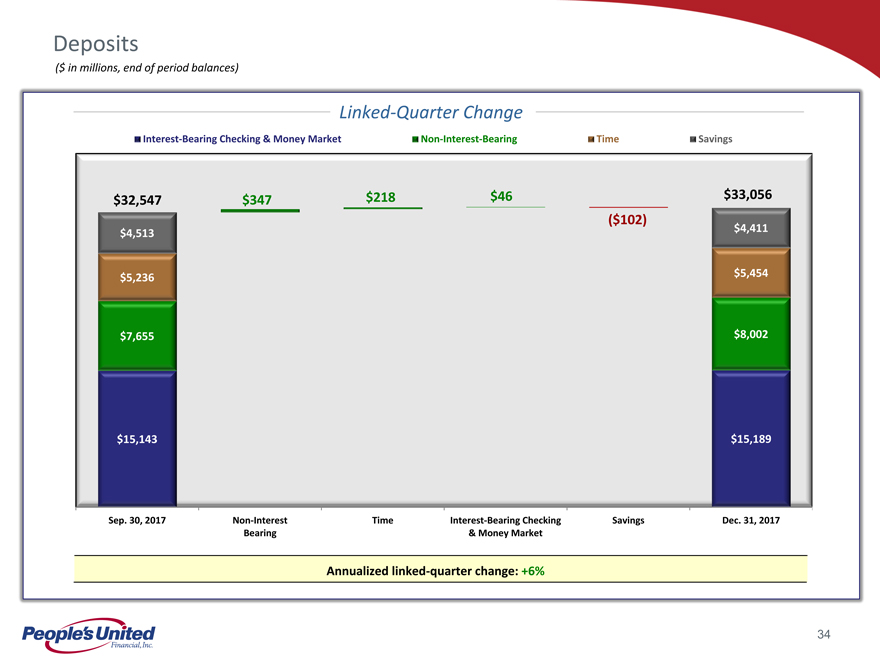
Deposits ($ in millions, end of period balances) Linked-Quarter Change Interest-Bearing Checking & Money MarketNon-Interest-Bearing Time Savings$218 $46 $33,056 $32,547 $347 ($102) $4,411 $4,513 $5,236 $5,454 $7,655 $8,002 $15,143 $15,189 Sep. 30, 2017Non-Interest Time Interest-Bearing Checking Savings Dec. 31, 2017 Bearing & Money MarketAnnualized linked-quarter change: +6% 34
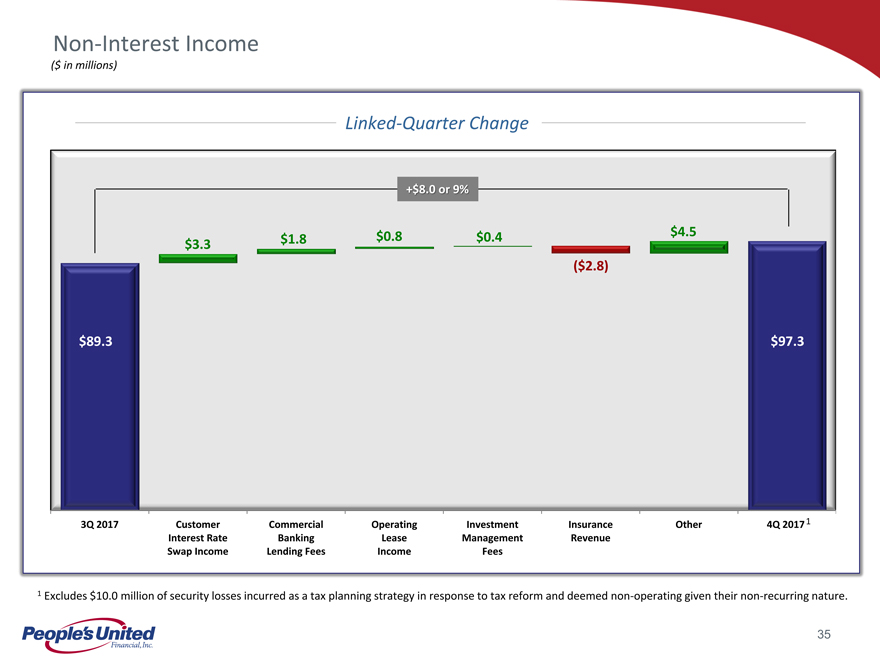
Non-Interest Income ($ in millions) Linked-Quarter Change +$8.0 or 9% $0.8 $0.4 $4.5 $3.3 $1.8 ($2.8) $89.3 $97.3 3Q 2017 Customer Commercial Operating Investment Insurance Other 4Q 20171 Interest Rate Banking Lease Management Revenue Swap Income Lending Fees Income Fees1 Excludes $10.0 million of security losses incurred as a tax planning strategy in response to tax reform and deemednon-operating given theirnon-recurring nature. 35
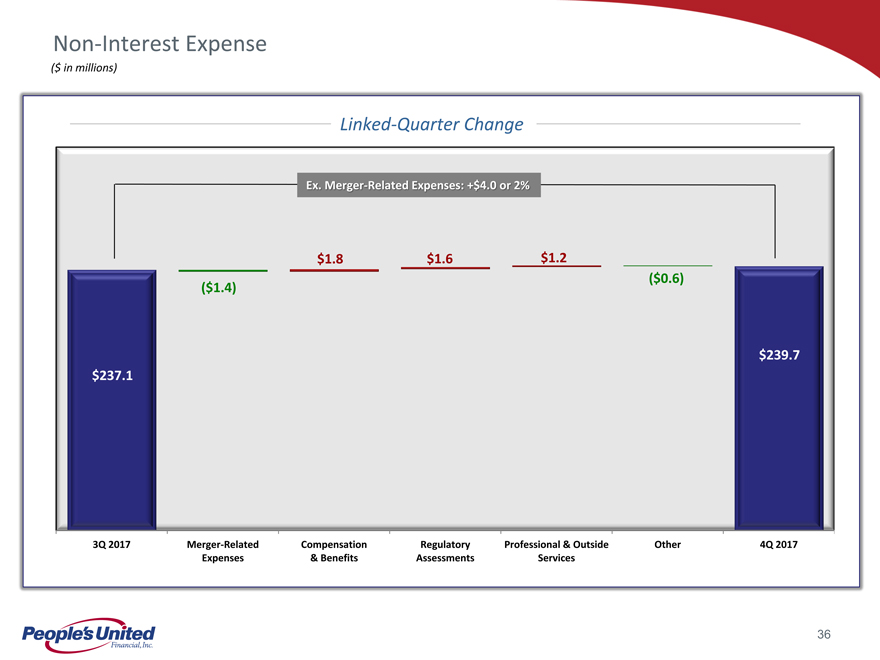
Non-Interest Expense ($ in millions) Linked-Quarter Change Ex. Merger-Related Expenses: +$4.0 or 2% $1.8 $1.6 $1.2 ($0.6) ($1.4) $239.7 $237.1 3Q 2017 Merger-Related Compensation Regulatory Professional & Outside Other 4Q 2017 Expenses & Benefits Assessments Services36
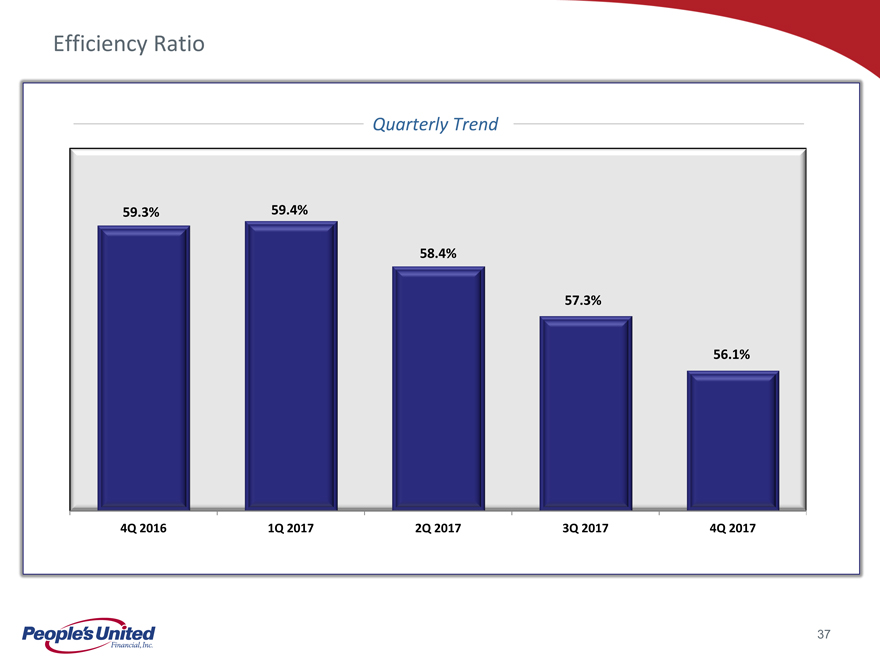
Efficiency Ratio Quarterly Trend 59.3% 59.4% 58.4% 57.3% 56.1% 4Q 2016 1Q 2017 2Q 2017 3Q 2017 4Q 201737
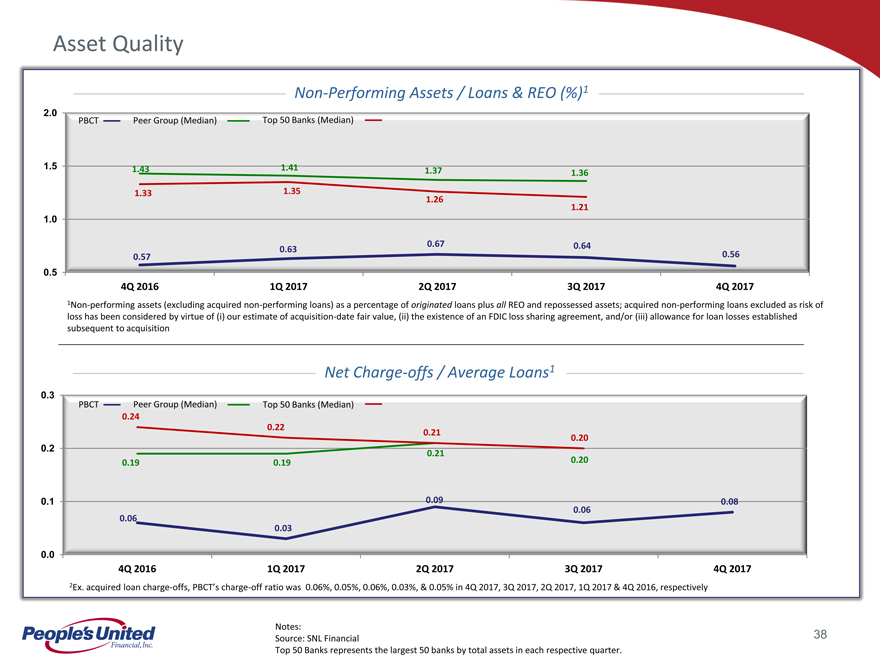
Asset QualityNon-Performing Assets / Loans & REO (%)1 2.0 PBCT Peer Group (Median) Top 50 Banks (Median) 1.5 1.43 1.41 1.37 1.36 1.33 1.35 1.26 1.21 1.00.67 0.64 0.63 0.57 0.56 0.54Q 2016 1Q 2017 2Q 2017 3Q 2017 4Q 20171Non-performing assets (excluding acquirednon-performing loans) as a percentage of originated loans plus all REO and repossessed assets; acquirednon-performing loans excluded as risk of loss has been considered by virtue of (i) our estimate of acquisition-date fair value, (ii) the existence of an FDIC loss sharing agreement, and/or (iii) allowance for loan losses established subsequent to acquisition Net Charge-offs / Average Loans1 0.3PBCT Peer Group (Median) Top 50 Banks (Median) 0.24 0.22 0.21 0.20 0.20.21 0.19 0.19 0.20 0.1 0.09 0.08 0.06 0.06 0.03 0.04Q 2016 1Q 2017 2Q 2017 3Q 2017 4Q 20172Ex. acquired loan charge-offs, PBCT’scharge-off ratio was 0.06%, 0.05%, 0.06%, 0.03%, & 0.05% in 4Q 2017, 3Q 2017, 2Q 2017, 1Q 2017 & 4Q 2016, respectively Notes: Source: SNL Financial 38 Top 50 Banks represents the largest 50 banks by total assets in each respective quarter.
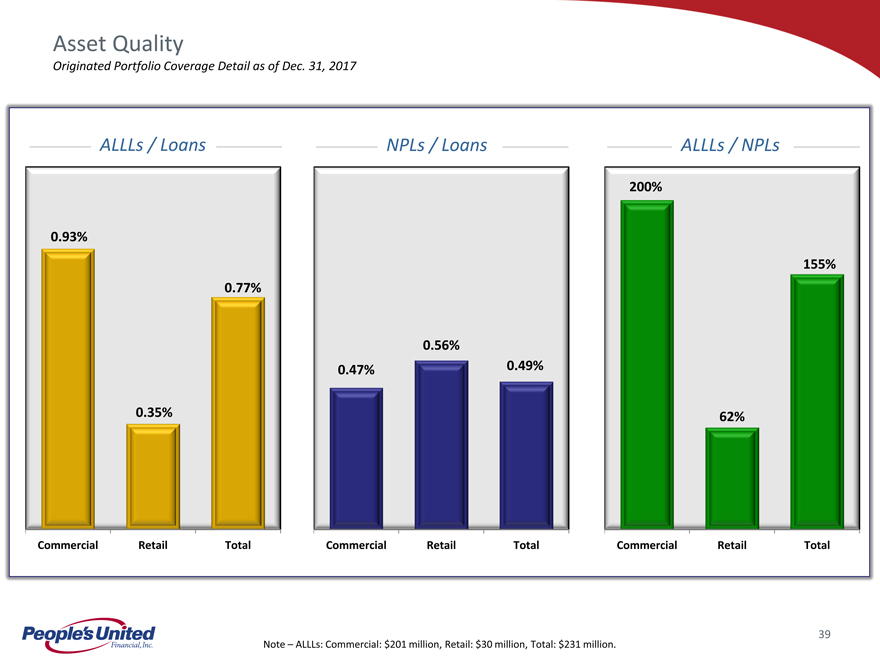
Asset Quality Originated Portfolio Coverage Detail as of Dec. 31, 2017 ALLLs / Loans NPLs / Loans ALLLs / NPLs 200% 0.93% 155% 0.77% 0.56% 0.47% 0.49% 0.35% 62% Commercial Retail Total Commercial Retail Total Commercial Retail Total39 Note – ALLLs: Commercial: $201 million, Retail: $30 million, Total: $231 million.
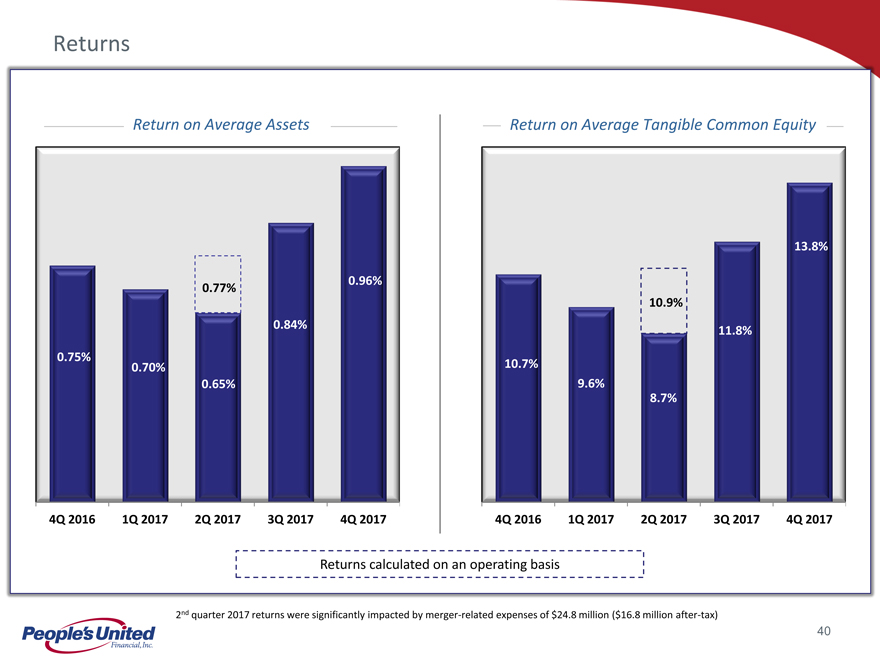
Returns Return on Average Assets Return on Average Tangible Common Equity 13.8% 0.96% 0.77% 10.9% 0.84% 11.8% 0.75% 0.70% 10.7% 0.65% 9.6% 8.7% 4Q 2016 1Q 2017 2Q 2017 3Q 2017 4Q 2017 4Q 2016 1Q 2017 2Q 2017 3Q 2017 4Q 2017Returns calculated on an operating basis 2nd quarter 2017 returns were significantly impacted by merger-related expenses of $24.8 million ($16.8 millionafter-tax) 40
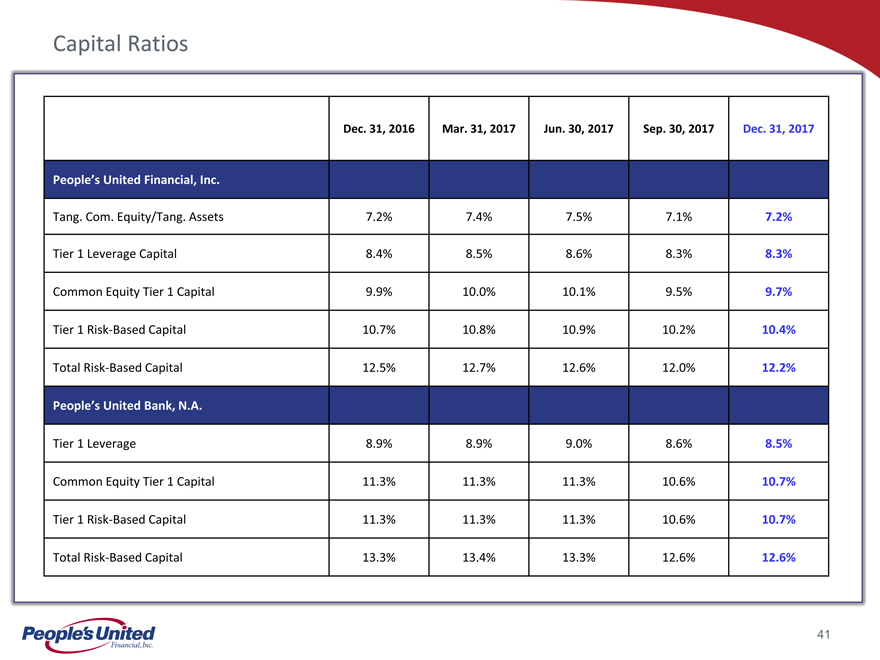
Capital Ratios Dec. 31, 2016 Mar. 31, 2017 Jun. 30, 2017 Sep. 30, 2017 Dec. 31, 2017 People’s United Financial, Inc. Tang. Com. Equity/Tang. Assets 7.2% 7.4% 7.5% 7.1% 7.2% Tier 1 Leverage Capital 8.4% 8.5% 8.6% 8.3% 8.3% Common Equity Tier 1 Capital 9.9% 10.0% 10.1% 9.5% 9.7% Tier 1 Risk-Based Capital 10.7% 10.8% 10.9% 10.2% 10.4% Total Risk-Based Capital 12.5% 12.7% 12.6% 12.0% 12.2% People’s United Bank, N.A. Tier 1 Leverage 8.9% 8.9% 9.0% 8.6% 8.5% Common Equity Tier 1 Capital 11.3% 11.3% 11.3% 10.6% 10.7% Tier 1 Risk-Based Capital 11.3% 11.3% 11.3% 10.6% 10.7% Total Risk-Based Capital 13.3% 13.4% 13.3% 12.6% 12.6% 41

Interest Rate Risk Profile Dec. 31, 2017 Sep. 30, 2017 Net Interest Income (NII) Sensitivity Immediate Parallel Shock 13.3% Est. Change in NII 11.8% 10.3% 9.3% 7.3% 6.5% 3.4% 3.9%-4.9%-6.0% Down 100 Up 100 Up 200 Up 300 Up 400Yield Curve Twist1 Est. Change in NII 3.6% 4.2% 3.1% 3.4% 1.7% 1.8% 1.8% 2.2%-2.5%-2.8%-2.3%-3.0% Short End-100 Short End +100 Short End +200 Long End-100 Long End +100 Long End +2001Yield curve twist pivot point is 18 month point on yield curve. Short End defined as overnight to 18 months. 42 Long End defined as terms greater than 18 months.
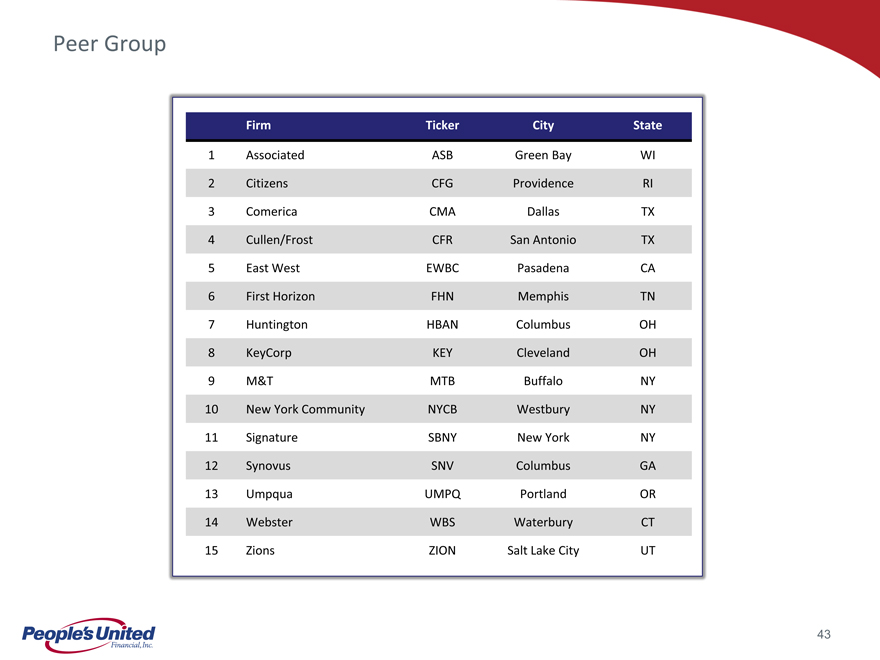
Peer Group Firm Ticker City State 1 Associated ASB Green Bay WI 2 Citizens CFG Providence RI 3 Comerica CMA Dallas TX 4 Cullen/Frost CFR San Antonio TX 5 East West EWBC Pasadena CA 6 First Horizon FHN Memphis TN 7 Huntington HBAN Columbus OH 8 KeyCorp KEY Cleveland OH 9 M&T MTB Buffalo NY 10 New York Community NYCB Westbury NY 11 Signature SBNY New York NY 12 Synovus SNV Columbus GA 13 Umpqua UMPQ Portland OR 14 Webster WBS Waterbury CT 15 Zions ZION Salt Lake City UT 43
Non-GAAP Financial Measures and Reconciliation to GAAP In addition to evaluating People’s United Financial Inc. (“People’s United”) results of operations in accordance with U.S. generally accepted accounting principles (“GAAP”), management routinely supplements its evaluation with an analysis of certainnon-GAAP financial measures, such as the efficiency and tangible common equity ratios, tangible book value per common share and operating earnings metrics. Management believes thesenon-GAAP financial measures provide information useful to investors in understanding People’s United’s underlying operating performance and trends, and facilitates comparisons with the performance of other financial institutions. Further, the efficiency ratio and operating earnings metrics are used by management in its assessment of financial performance, includingnon-interest expense control, while the tangible common equity ratio and tangible book value per common share are used to analyze the relative strength of People’s United’s capital position. The efficiency ratio, which represents an approximate measure of the cost required by People’s United to generate a dollar of revenue, is the ratio of (i) totalnon-interest expense (excluding operating lease expense, goodwill impairment charges, amortization of other acquisition-related intangible assets, losses on real estate assets andnon-recurring expenses, (the numerator) to (ii) net interest income on a fully taxable equivalent (“FTE”) basis plus totalnon-interest income (including the FTE adjustment on bank-owned life insurance (“BOLI”) income, the netting of operating lease expense and excluding gains and losses on sales of assets other than residential mortgage loans and acquired loans, andnon-recurring income) (the denominator). People’s United generally considers an item of income or expense to benon-recurring if it is not similar to an item of income or expense of a type incurred within the last two years and is not similar to an item of income or expense of a type reasonably expected to be incurred within the following two years. 44
Non-GAAP Financial Measures and Reconciliation to GAAP Operating earnings exclude from net income available to common shareholders those items that management considers to be of such anon-recurring or infrequent nature that, by excluding such items (net of income taxes), People’s United’s results can be measured and assessed on a more consistent basis from period to period. Items excluded from operating earnings, which include, but are not limited to:(i) non-recurring gains/losses; (ii) merger-related expenses, including acquisition integration and other costs; (iii) writedowns of banking house assets and related lease termination costs; (iv) severance-related costs; and (v) charges related to executive-level management separation costs, are generally also excluded when calculating the efficiency ratio. Effective in 2016, recurring writedowns of banking house assets and certain severance-related costs are no longer considered to benon-operating expenses. Operating earnings per common share is derived by determining the per common share impact of the respective adjustments to arrive at operating earnings and adding (subtracting) such amounts to (from) earnings per common share, as reported. Operating return on average assets is calculated by dividing operating earnings (annualized) by average total assets. Operating return on average tangible common equity is calculated by dividing operating earnings (annualized) by average tangible common equity. The operating common dividend payout ratio is calculated by dividing common dividends paid by operating earnings for the respective period. The tangible common equity ratio is the ratio of (i) tangible common equity (total stockholders’ equity less preferred stock, goodwill and other acquisition-related intangible assets) (the numerator) to (ii) tangible assets (total assets less goodwill and other acquisition-related intangible assets) (the denominator). Tangible book value per common share is calculated by dividing tangible common equity by common shares (total common shares issued, less common shares classified as treasury shares and unallocated Employee Stock Ownership Plan (“ESOP”) common shares). In light of diversity in presentation among financial institutions, the methodologies used by People’s United for determining thenon-GAAP financial measures discussed above may differ from those used by other financial institutions. 45

People’s United Financial, Inc. For more information, investors may contact: Andrew S. Hersom (203)338-4581 andrew.hersom@ peoples.com