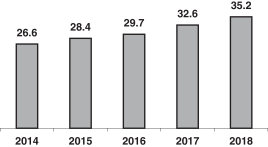
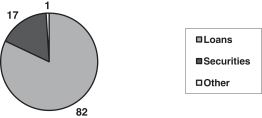
Comparison of Financial Condition at December 31, 2018 and 2017. Total assets at December 31, 2018 were $47.9 billion, a $3.4 billion increase from December 31, 2017, reflecting increases of $2.7 billion in total loans, $274 million in goodwill and $191 million in total securities, partially offset by a $111 million decrease in short-term investments. The increase in total loans from December 31, 2017 to December 31, 2018 reflects increases of $1.4 billion in commercial loans and $1.3 billion in retail loans. Originated loans increased $539 million from December 31, 2017 to $30.6 billion (commercial loans increased $464 million and retail loans increased $75 million) and acquired loans increased $2.1 billion. At the respective acquisition dates, the fair values of First Connecticut’s and Vend Lease’s loans and leases totaled $2.8 billion and $69 million, respectively. At December 31, 2018, the carrying amount of the acquired loan portfolio totaled $4.6 billion. The increase in total securities primarily reflects net purchases of state and municipal securities, partially offset by principal repayments and maturities of government sponsored enterprise (“GSE”) mortgage-backed securities.
Non-performing assets (excluding acquired non-performing loans) totaled $185.8 million at December 31, 2018, a $17.7 million increase from December 31, 2017. At December 31, 2018, acquirednon-performing loans totaled $50.1 million compared to $29.7 million at December 31, 2017. The allowance for loan losses was $240.4 million at December 31, 2018 ($236.3 million on originated loans and $4.1 million on acquired loans) compared to $234.4 million at December 31, 2017 ($230.8 million on originated loans and $3.6 million on acquired loans). At December 31, 2018, the originated allowance for loan losses as a percentage of originated loans was 0.77% and as a percentage of originated non-performing loans was 140.9%, compared to 0.77% and 155.2%, respectively, at December 31, 2017.
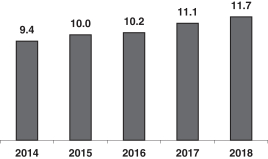
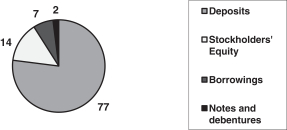
At December 31, 2018, total liabilities were $41.3 billion, a $2.7 billion increase from December 31, 2017, reflecting a $3.1 billion increase in total deposits, partially offset by a $510 million decrease in total borrowings. At the acquisition date, the fair value of First Connecticut’s deposits totaled $2.4 billion.
People’s United’s total stockholders’ equity was $6.5 billion at December 31, 2018, a $714.0 million increase from December 31, 2017. As a percentage of total assets, stockholders’ equity was 13.6% and 13.1% at December 31, 2018 and 2017, respectively. Tangible common equity as a percentage of tangible assets was 7.6% and 7.2% at December 31, 2018 and 2017, respectively.
People’s United’s (consolidated) Tier 1 Leverage capital ratio and its CET 1, Tier 1 and Total risk-based capital ratios were 8.7%, 10.3%, 10.9% and 12.5%, respectively, at December 31, 2018, compared to 8.3%, 9.7%, 10.4% and 12.2%, respectively, at December 31, 2017. The Bank’s Tier 1 Leverage capital ratio and its CET 1, Tier 1 and Total risk-based capital ratios were 9.0%, 11.4%, 11.4% and 13.2%, respectively, at December 31, 2018, compared to 8.5%, 10.7%, 10.7% and 12.6%, respectively, at December 31, 2017.
Comparison of Results of Operations for the Years Ended December 31, 2018 and 2017. People’s United reported net income of $468.1 million, or $1.29 per diluted common share, for the year ended December 31, 2018, compared to $337.2 million, or $0.97 per diluted common share, for the 2017 period. Included in the 2018 results are merger-related costs totaling $11.4 million ($8.9 million after-tax) or $0.02 per common share. Results for 2017 include merger-related costs totaling $30.6 million ($22.0 millionafter-tax) or $0.07 per common share. The results for 2018 reflect the benefits from recent acquisitions, continued loan and deposit growth, and meaningful cost control. People’s United’s return on average assets was 1.04% for 2018 compared to 0.79% for the 2017 period. Return on average tangible common equity was 14.3% for 2018 compared to 11.0% for the 2017 period.
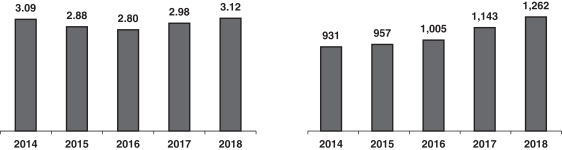
FTE net interest income totaled $1.3 billion in 2018, a $119.2 million increase from the year-ago period, and the net interest margin increased 14 basis points from 2017 to 3.12%. The increase in the net interest margin primarily reflects higher yields on the loan portfolio.
29