 1 U.S. Auto Parts Network, Inc. Leading online source for automotive aftermarket parts and repair information Investor Presentation May 20, 2013 Exhibit 99.1 |
 Safe Harbor 2 |
 Company History Launched first internet site selling automotive Collision Line Launches a network of sites catered to various consumer segments Company begins significantly expanding its private label engine line JC Whitney completely integrated 1995 2000 2010 2005 2006 2011 Launch AutoMD / Acquires JC Whitney Adds Accessories Line USAP founded to serve local collision shops in Los Angeles IPO (NASDAQ: PRTS) Uniquely positioned to capitalize on market growth. 2/2007 2008 2012 Acquires PartsBin Adds Engine Line 3 10/2007 Hires Shane Evangelist Raised $16.5M in capital 2013 Initiated Site Consolidation |
 Competitive Advantages Low Customer Acquisition Cost 4 Nearly 12 million unique monthly visitors to USAP’s websites Less than a $7 customer acquisition cost (“CAC”) Efficient Supply Chain Over 29,000 private label collision SKUs Over 9,500 private label engine SKUs Over 3,000 private label accessory SKUs Over 1.5M branded SKUs Robust supply chain consisting of both branded and private label products Nearly 50% of product sales directly sourced from Asia |
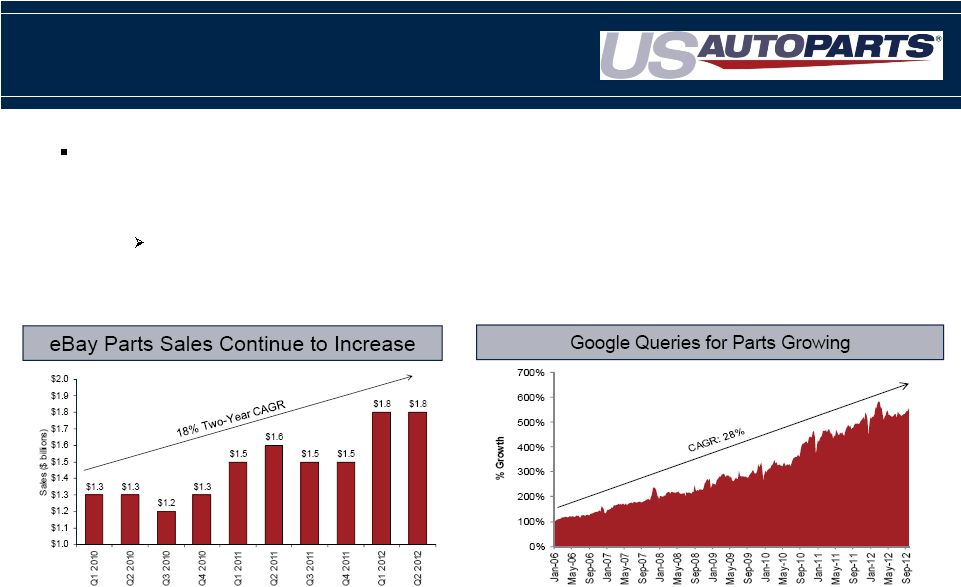 Online sales of automotive parts and accessories continue to grow – Google has experienced a 6 year compound annual growth rate (“CAGR”) of 28% in queries for automotive parts before conversion increases which are between 5%-10% annually - making real online growth closer to 35% annually Mobile queries increased 100% and 800% for cellphones and tablets, respectively, from Sept. 11 to Sept. 12 Online Market is Vibrant and Growing Aftermarket e-Commerce Overview Source: Google 5 Source: eBay filings, press releases |
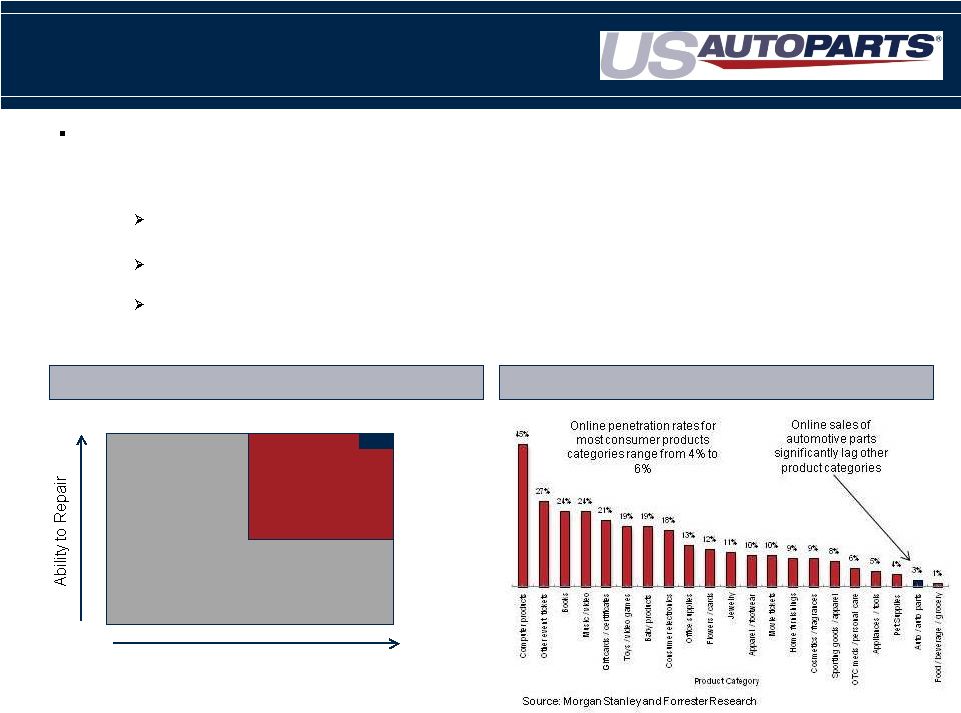 Online penetration for auto parts has trailed penetration rates of other consumer product categories for two reasons: 1) Auto parts are traditionally bought by demographics that have lower internet penetration at home and less of a propensity to purchase products online Internet penetration will grow at home but, more importantly, mobile devices will drive online buying going forward 2) Shopping for auto parts online can be difficult for consumers The complexity required to buy an auto part (applications and attributes) has limited consumption online because consumers need to feel comfortable that they have found the “right” part Online retailers have made vast improvements to the online shopping experience • The continued growth of website conversion rates over the last five years demonstrates the progress that online retailers have made to make consumers feel comfortable Size and Penetration of Online Automotive Parts Aftermarket e-Commerce Overview 6 Low Automotive Online Sales Penetration Source: AAIA Estimate based on AAAI Fact book - $85B in parts, $70B in labor * Excludes eBay Automotive Aftermarket by Segment Desire to Repair High Low $155B Do-It-For-Me $45B Do-It-Yourself (USAP Target Market) $3.1B-$4.0B Online Sales* High |
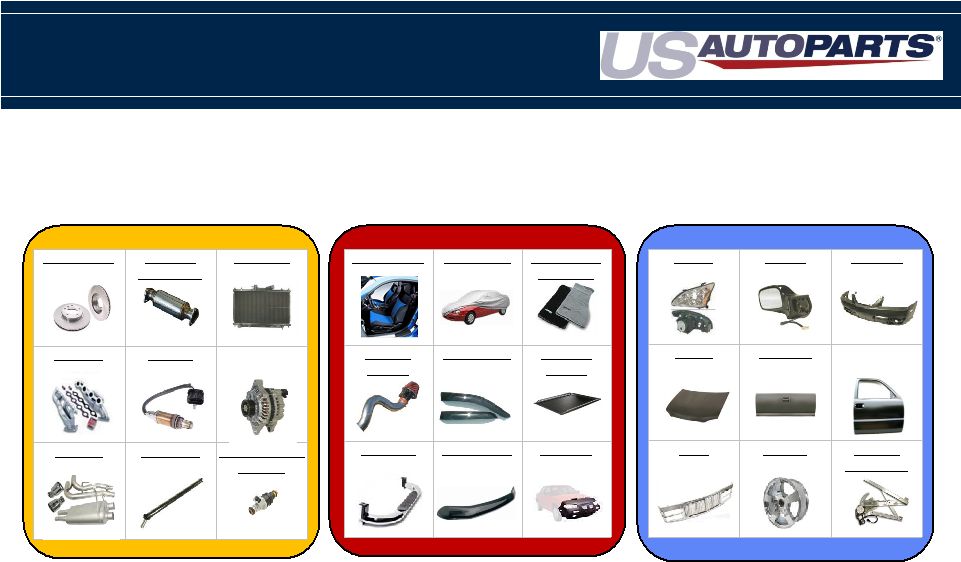 7 Broad Product Offering Across the Auto Parts Spectrum Brake Discs Catalytic Converters Radiators Headers Oxygen Sensors Alternators Exhaust Driveshaft Fuel Injection / Delivery Lamps Mirrors Bumpers Hoods Tailgates Doors Grills Wheels Window Regulators Seat Covers Car Covers Floor Mats / Carpeting Cold Air Intakes Vent Visors Tonneau Covers Nerf Bars Bug Shields Car Bras Body Parts Engine Parts Performance & Accessories *Represents online mix, **Source; AAIA Factbook Research 21% 40% 39% $15B $15B Revenue* Overall Market** $50B |
 USAP’s ability to competitively price products while maintaining healthy margins is a function of the Company’s ability to leverage its robust supply chain The Company is working to increase margins by shifting its product mix toward increased private label and in-stock products - current margins range from 29% - 31% The Company sources product directly from over 250 factories in Asia Margin % In-Stock Private Label (Asia Sourced) Branded (U.S. Sourced) 40% - 70% 25% - 40% 10% - 25% Drop Shipped Current Mix 49% 51% Current Mix 63% 37% 75% 25% Goal 60% 40% Goal USAP’s Supply Chain Creates Pricing Advantage 8 |
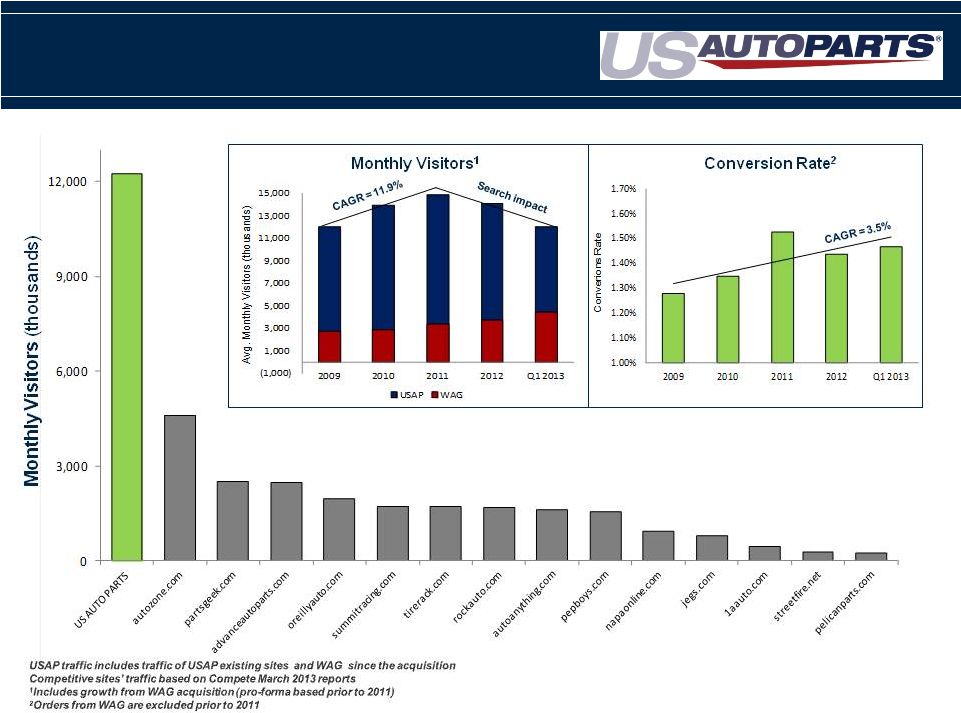 US Auto Parts Dominant Reach- Largest Pure Play Internet Retailer (some overlap of monthly visitors across websites) 9 |
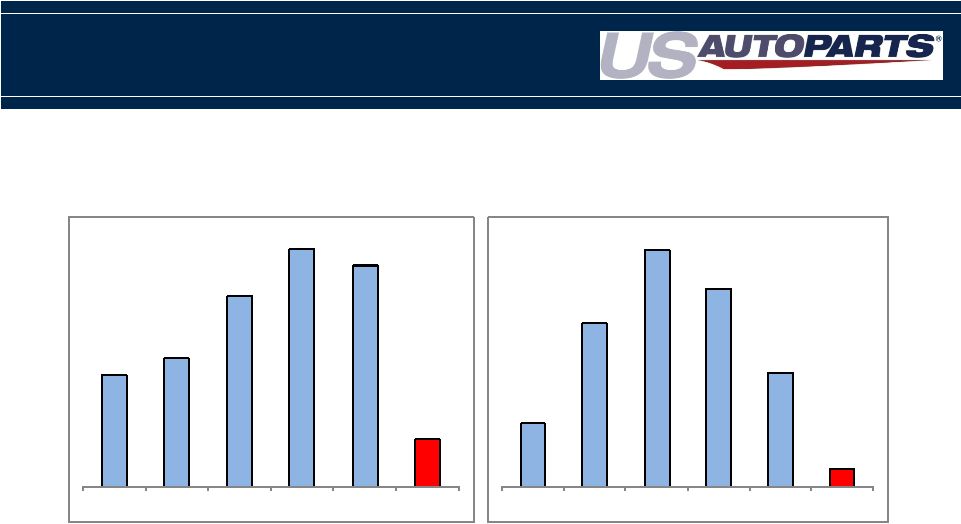
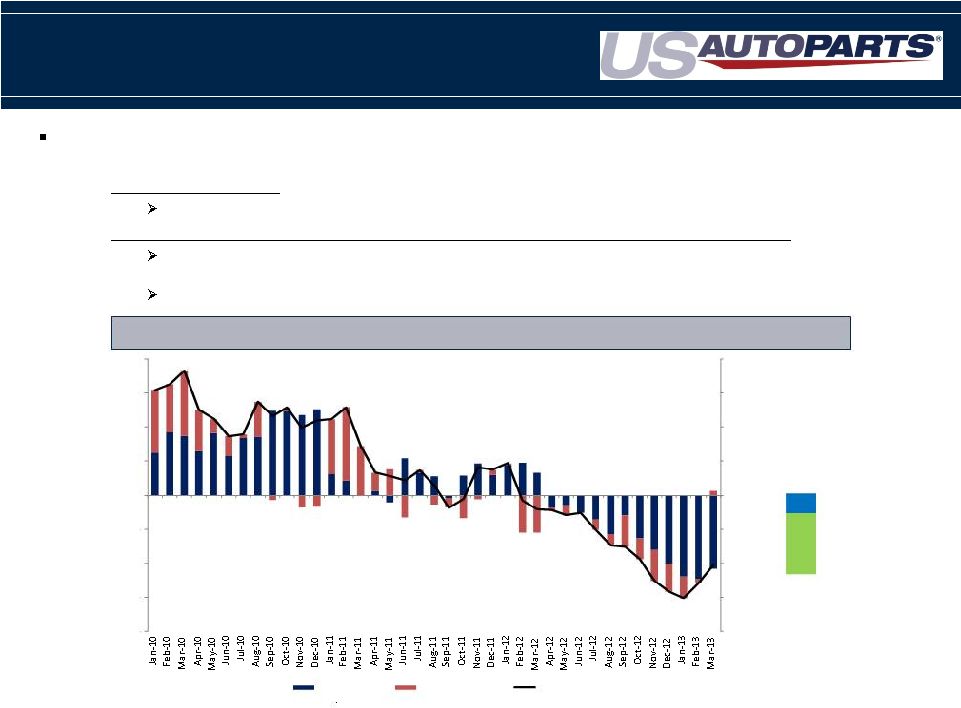 USAP’s Current Operating Environment 10 After eight consecutive quarters of 20% revenue and EBITDA growth, USAP’s financial performance has been impacted by decreased visitors driven by two main factors: 1. Reduced SEO Traffic: Changes made by search engines have impacted traffic Addressing the loss in traffic by consolidating websites 2. Margin Compression: Increased competition has hurt pricing, impacting marketing spend Marketing spend is based on variable contribution from each SKU. As overall margin has compressed, marketing spend on a year-over-year (“YoY”) basis has lead to lower traffic Addressing margin compression by increasing private label mix * YoY web orders for top USAP sites that comprise 82% of total sales Paid Traffic (5%) Organic Traffic (16%) -40.0% -30.0% -20.0% -10.0% 0.0% 10.0% 20.0% 30.0% 40.0% -30.0% -20.0% -10.0% 0.0% 10.0% 20.0% 30.0% 40.0% -40.0% Year over Year Order Impact from Site Traffic and Conversion* YoY Traffic Impact YoY Conversion Impact YoY Orders |
 $153.4 $176.3 $262.3 $327.1 $304.0 $65.4 2008 2009 2010 2011 2012 Q1-13 $5.2 $13.5 $19.5 $16.3 $9.4 $1.5 2008 2009 2010 2011 2012 Q1-13 11 Sales & Adjusted EBITDA Consolidated Sales¹ Consolidated Adjusted EBITDA² ($ In Millions) ($ In Millions) 1. JC Whitney was acquired in Aug 2010 adding revenue of $39.1M in 2010 and $83.4M in 2011. Amounts not separately disclosed after 2011. Adj. EBITDA Margin 3% 5% 8% 7% 3% 2% Non-GAAP financial measure EBITDA consists of net income before (a) interest expense, net; (b) income tax provisions; (c) amortization of intangible assets; (d) depreciation and amortization. Adjusted EBITDA excludes restructuring costs and other one time charges of $0.4M, $5.8M, $8.0M, $.7M and $0.5M in 2009, 2010, 2011, 2012 and Q1-13, respectively, stock based compensation of $2.9M, $3.3M, $2.7M, $2.6M, $1.7M and $0.4M in 2008, 2009, 2010, 2011, 2012 and Q1-13 respectively. There were no restructuring or other one time charges in 2008. 2. |
 1) Improve Customer Experience Continue to improve all customer touch points Focus on two flagship sites, Autopartswarehouse and JCWhitney Ensure rich and unique content for our customers 2) Increase Unique Visitors Consolidate websites 3) Increase Selection Expand product offering within existing categories as well as entering new categories 4) Lower Prices Launch disruptive price points through supply chain efficiencies 5) Be the Consumer Advocate for Auto Repair Reduce consumer spending on vehicle repair and bring transparency to the market place Revenue 100% Gross Margins 29% - 31% Variable OPEX Costs 15% Fixed Costs 0% Incremental Flow Thru 14% - 16% 12 2013 Growth and Profitability Revenue Growth Incremental Flow Thru |
 AutoMD- Largest DIY Site Repositioned to Target $140B DIFM Market 13 |
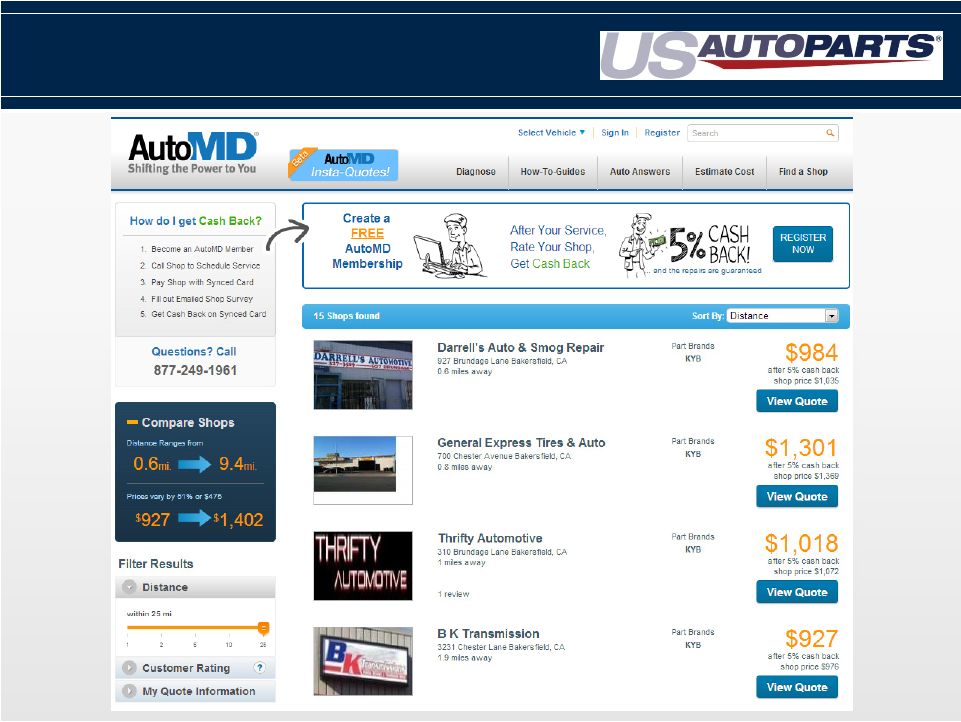 AutoMD – Results page 14 |
 Adjusted EBITDA 15 Thirteen Weeks Ended March 30 March 31 (unaudited, amounts shown in thousands) 2013 2012 Net loss (3,343) $ (788) $ Interest expense, net 185 199 Income tax provision 21 124 Amortization of intangible assets 106 340 Depreciation and amortization expense 3,638 3,747 EBITDA 607 3,622 Share-based compensation expense 409 584 Restructuring costs 498 - Adjusted EBITDA 1,514 $ 4,206 $ |
 Income Statement 16 Thirteen Weeks Ended March 30 March 31 (unaudited, amounts shown in thousands except per share data) 2013 2012 Net sales 65,405 $ 87,436 $ Cost of sales (1) 45,667 60,808 Gross profit 19,738 26,628 Operating expenses: Marketing 11,191 13,450 General and administrative 4,687 5,870 Fulfillment 5,381 5,918 Technology 1,515 1,536 Amortization of intangible assets 106 340 Total operating expenses 22,880 27,114 Loss from operations (3,142) (486) Other income (expense): Other income, net 7 31 Interest expense (187) (209) Total other expense, net (180) (178) Loss before income tax provision (3,322) (664) Income tax provison 21 124 Net loss (3,343) (788) Other comprehensive (loss) income, net of tax: Foreign currency translation adjustments (6) 27 Unrealized gains on investments - 25 Total other comprehensive (loss) income (6) 52 Comprehensive loss (3,349) $ (736) $ Basic and diluted net loss per share (0.11) $ (0.03) $ Shares used in computation of basic and diluted net loss per share 31,141 30,638 (1) Excludes depreciation and amortization expense which is included in marketing, general and administrative and fulfillment expense. |
 Balance Sheet 17 (amounts in thousands, except par and liquidation value) March 30 December 29 2013 2012 ASSETS (Unaudited) Current assets: Cash and cash equivalents 1,297 $ 1,030 $ Short-term investments 111 110 Accounts receivable, net of allowances of $242 and $221 at March 30, 2013 and December 29, 2012, respectively 7,040 7,431 Inventory 37,633 42,727 Deferred income taxes 44 39 Other current assets 3,310 4,176 Total current assets 49,435 55,513 Property and equipment, net 27,123 28,559 Intangible assets, net 3,120 3,227 Other non-current assets 1,669 1,578 Total assets 81,347 $ 88,877 $ LIABILITIES AND STOCKHOLDERS' EQUITY Current liabilities: Accounts payable 23,055 $ 28,025 $ Accrued expenses 9,475 10,485 Revolving loan payable 12,125 16,222 Current portion of capital leases payable 35 70 Other current liabilities 4,704 4,738 Total current liabilities 49,394 59,540 Capital leases payable, net of current portion 69 70 Deferred income taxes 350 314 Other non-current liabilities 1,711 1,309 Total liabilities 51,524 61,233 Commitments and contingencies Stockholders' equity: Series A convertible preferred stock, $0.001 par value; $1.45 per share liquidation value or aggregate of $5.8 million; 4000 and 0 shares issued and outstanding as of 3/30/13 & 12/29/12 respectively Common stock, $0.001 par value; 31,151 shares and 31,128 shares issued 4 - and outstanding as of 3/30/13 and 12/29/12. respectively 31 31 Additional paid-in capital 165,305 159,781 Accumulated other comprehensive income 378 384 Accumulated deficit (135,895) (132,552) Total stockholders' equity 29,823 27,644 Total liabilities and equity 81,347 $ 88,877 $ |
 Thank You 18 * * * * * * * * |