 Investor Presentation Exhibit 99.1 |
 Safe Harbor 2 This presentation may contain certain forward-looking statements and management may make additional forward-looking statements in response to your questions. These statements do not guarantee future performance and speak only as of the date hereof, and qualify for the safe harbor provided by Section 21E of the Securities Exchange Act of 1934, as amended, and Section 27A of the Securities Act of 1933. We refer all of you to the risk factors contained in US Auto Parts Annual Report on Form 10-K and quarterly reports on Form 10-Q filed with the Securities and Exchange Commission, for more detailed discussion on the factors that can cause actual results to differ materially from those projected in any forward-looking statements. |
 Case for Investment 3 Large and Growing Online Market Significant Customer Reach Significant Private Label Offering Experienced Leadership Team |
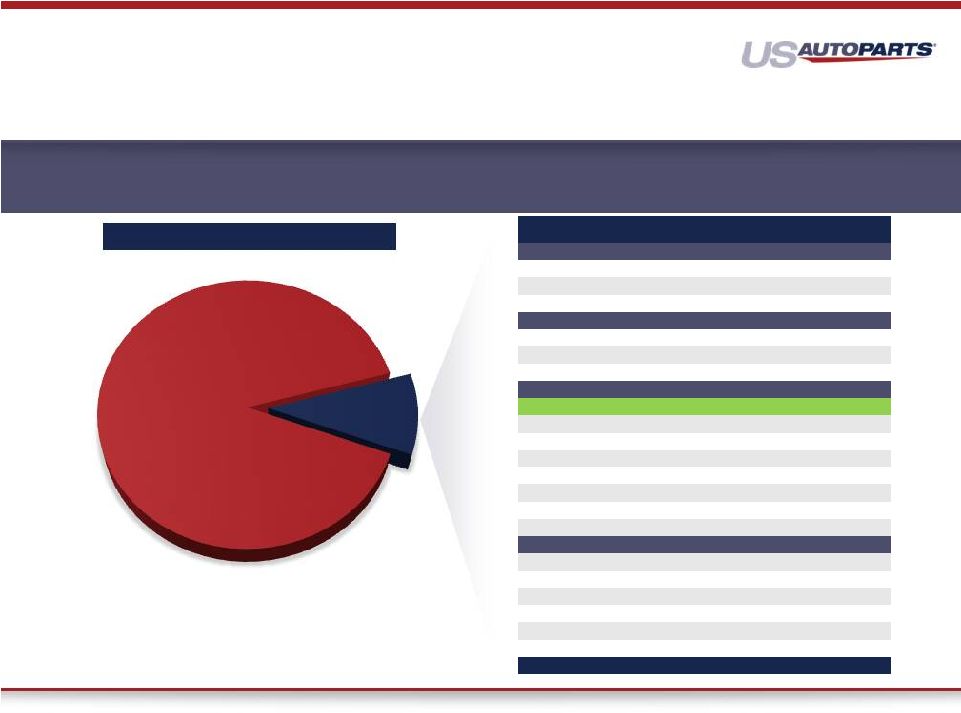 4 At 9.7% online market penetration, auto parts still lags industry average in the teens. US Auto Parts is the largest pure-play online retailer of auto parts 1 AASA estimates 2 Estimates by US Auto Parts where amounts are not publicly reported & we estimate the total online DIY market to be larger than the $3.8B that is reported in the 2014 AAIA Fact Book 3 Excludes AutoAnything which is wholly owned by AutoZone Do It Yourself (DIY) Market Size Company 2013 Est. Rev % of total Marketplaces (in million) eBay Motors $2,200 47.6% Amazon $600 13.0% Sub Total $2,800 60.6% Wholesale Online Tire Rack (online) $440 9.5% Other Tire Companies $190 4.1% Sub Total $630 13.6% Pure Play US Auto Parts $250 5.4% Rock Auto $180 3.9% Summit $170 3.7% Auto Anything (AutoZone) $120 2.6% JEGS $70 1.5% CarID $60 1.3% All Other Pure Play $90 1.9% Sub Total $940 20.3% Brick & Mortar Retailers AutoZone (w/o AA) $110 2.4% Advance $80 1.7% Pep $30 0.6% O'Reilly $20 0.4% NAPA $10 0.2% Sub Total $250 5.4% Total 4,620 100.0% Total DIY Market Size for 2013 of 47.2B 1 $42.6B 90.3% $4.6B 9.7% 2 3 |
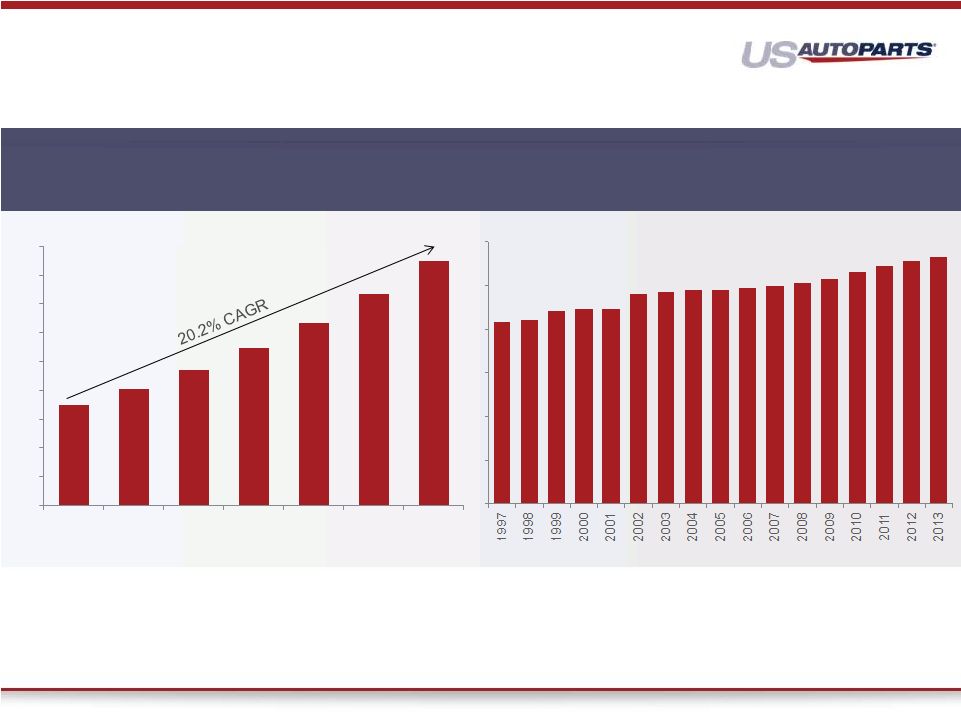 Booz & Co. estimates by 2018 that Online DIY could reach 17% of the total DIY market 5 Online Market is Vibrant and Growing Aftermarket e-Commerce Overview DIY Online Penetration 8.3 8.4 8.8 8.9 8.9 9.6 9.7 9.8 9.8 9.9 10.0 10.1 10.3 10.6 10.9 11.1 11.3 0 2 4 6 8 10 12 Mean Light Vehicle age Source: R.L. Polk and BB&TCM Source: Booz & Co. The average age of a light vehicle on the road continues to increase each year since 1997 0.0% 2.0% 4.0% 6.0% 8.0% 10.0% 12.0% 14.0% 16.0% 18.0% 2012 2013 2014 2015 2016 2017 2018 |
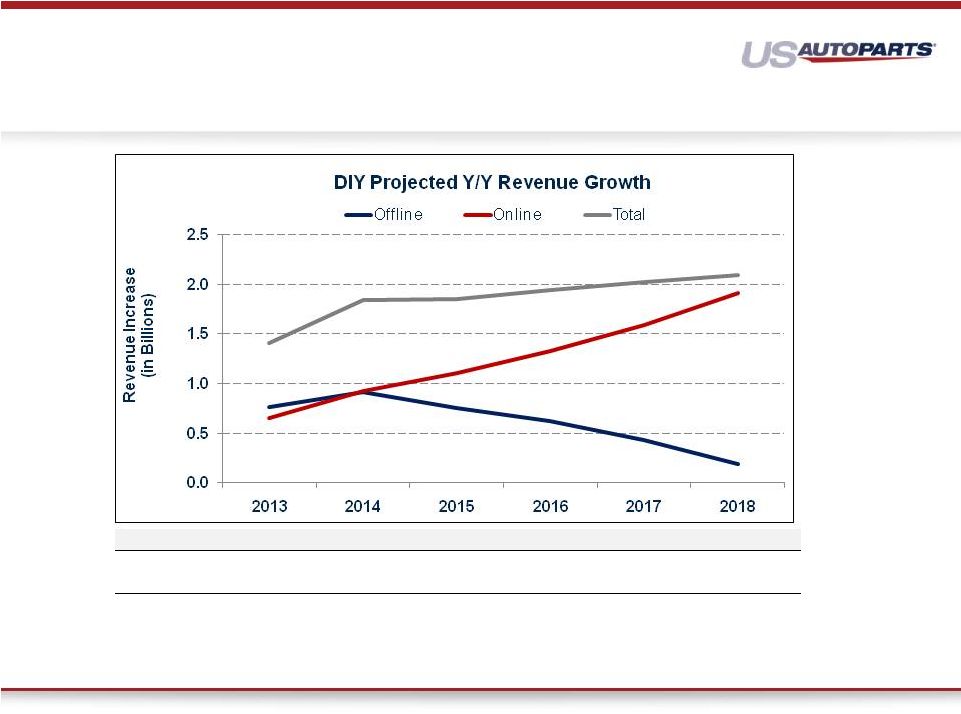 Offline $42.6 $43.5 $44.2 $44.8 $45.3 $45.5 Online 4.6 5.5 6.6 8.0 9.5 11.5 Total $47.2 $49.0 $50.9 $52.8 $54.8 $56.9 % Online 9.8% 11.3% 13.0% 15.1% 17.4% 20.1% 6 Do It Yourself (DIY) Projections 1 1 Projections obtained from AAIA 2014 Digital Automotive Aftermarket Fact Book and March 2014 AASA Digital Disruption: e-tailing in the Automotive Aftermarket Report DIY Projected Revenue (in Billions) |
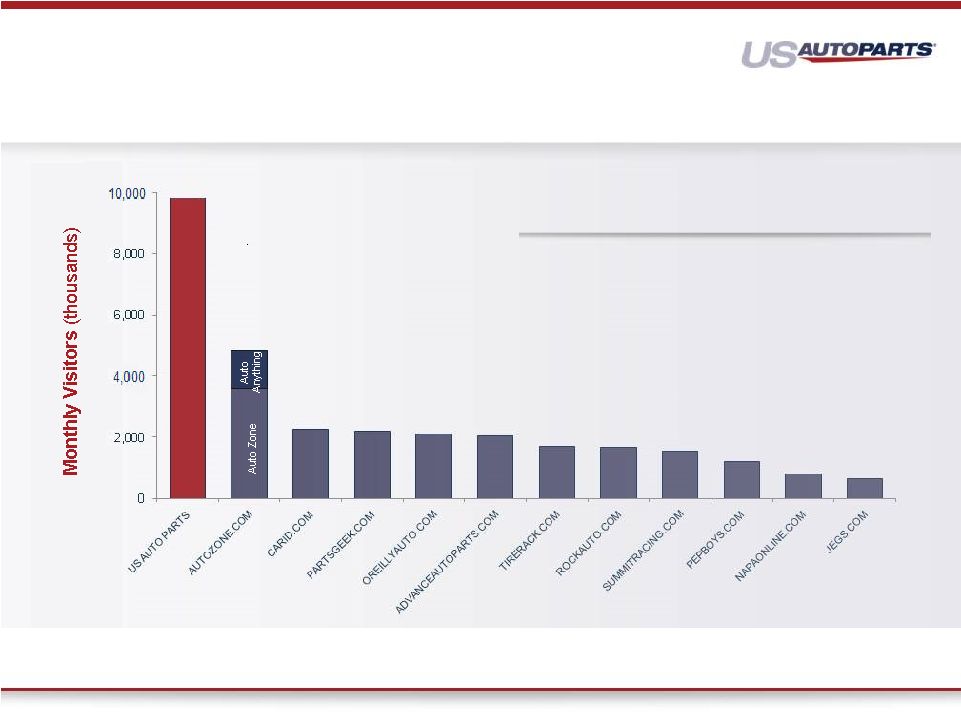 (some overlap of monthly visitors across websites) 7 USAP traffic includes traffic from continued sales channels Competitive sites’ traffic based on Compete September 2014 reports US Auto Parts Dominant Reach- Largest Pure Play Internet Retailer Customer Reach is a Competitive Moat • Over 500 man years of hand written unique content • Long domain history to help indexing in search • Multiple website management |
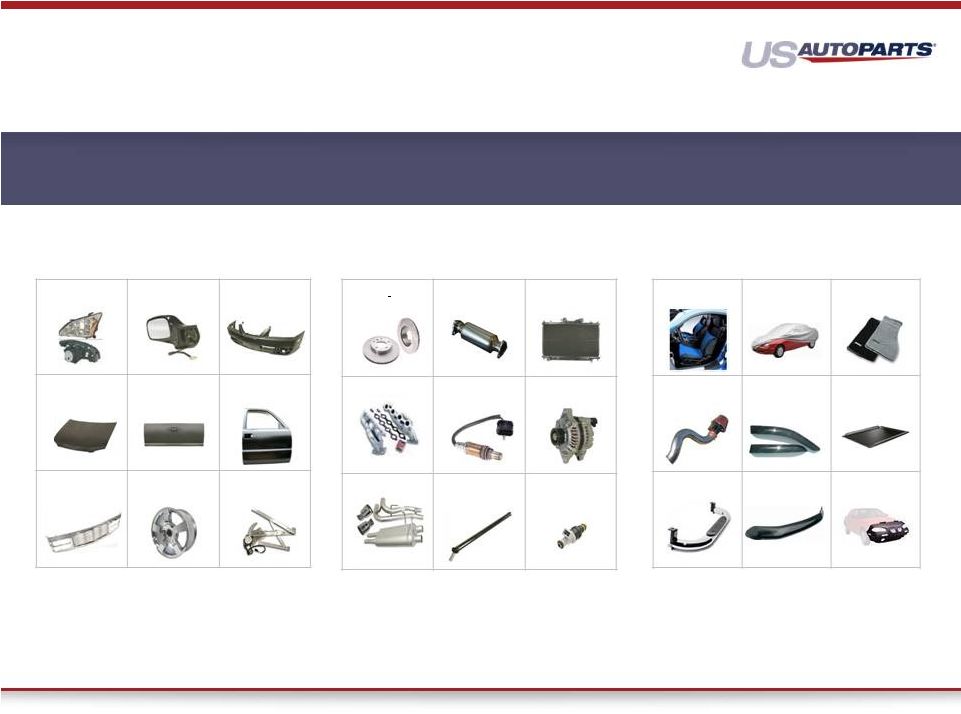 8 Broad Auto Parts Product Offering Body Parts Engine Parts Performance & Accessories *Represents USAP online mix 36% 48% 16% Revenue* US Auto Parts has one of the largest product offerings with over 1.5 million products across body parts, engine parts, and performance & accessories Broad Auto Parts Product Offering Lamps Mirrors Bumpers Hoods Tailgates Doors Grills Wheels Window Regulators Catalytic Converters Radiators Headers Oxygen Sensors Alternators Exhaust Driveshaft Fuel Injection / Delivery Seat Covers Car Covers Floor Mats / Carpeting Cold Air Intakes Vent Visors Tonneau Covers Nerf Bars Bug Shields Car Bras Brake Discs |
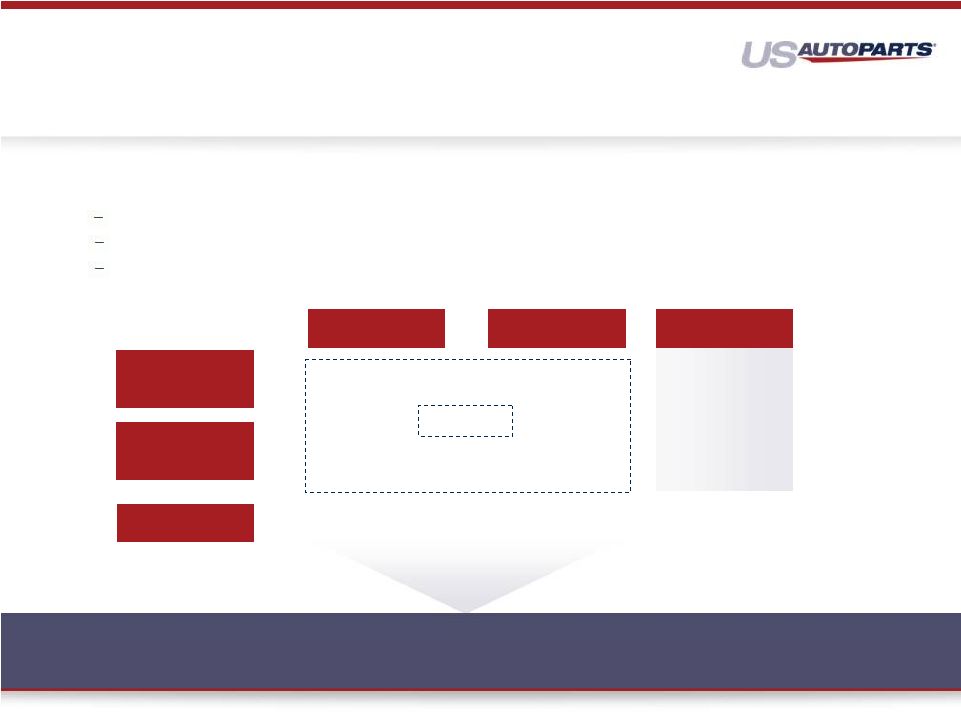 USAP’s ability to competitively price products while maintaining healthy margins is a function of the Company’s ability to leverage its robust private label supply chain. Currently over 40,000 Private Label Products. Adding 4,000 – 5,000 Private Label SKUs this year The Company sources product directly from over 200 factories in Asia 9 Margin % In-Stock Private Label (Asia Sourced) Branded (U.S. Sourced) 30% - 60% 15% - 30% 5% - 20% Drop Shipped Current Mix 57% 43% Current Mix 65% 35% USAP’s Supply Chain Creates Pricing Advantage The breadth of our Private Label products provides a significant competitive moat |
 Revenue 100% Gross Margins 25% - 28% Variable OPEX Costs 15% Fixed Cost 0% Incremental Flow 10% - 13% 10 Incremental Flow Thru Growth and Profitability We anticipate to have double digit comps in the back half of the year |
    11 Our business model has significant cost leverage as revenues grow 1. Excludes stock based compensation, depreciation and amortization 2. For every incremental year required to achieve growth levels, fixed expenses increase $1.0M or 3% Financial Sensitivity Base 18% 27% 45% 64% 82% $275 $325 $350 $400 $450 $500 25.0% – 28.0% 25.0% – 28.0% 25.0% – 28.0% 25.0% – 28.0% 25.0% – 28.0% 25.0% – 28.0% 3.2% 3.2% 3.2% 3.2% 3.2% 3.2% 9.4% 9.4% 9.4% 9.4% 9.4% 9.4% 0.6% 0.6% 0.6% 0.6% 0.6% 0.6% 1.8% 1.8% 1.8% 1.8% 1.8% 1.8% 15.0% 15.0% 15.0% 15.0% 15.0% 15.0% 1.9% 1.6% 1.5% 1.3% 1.2% 1.1% 3.6% 3.2% 2.9% 2.6% 2.3% 2.1% 0.9% 0.9% 0.8% 0.7% 0.6% 0.6% 3.9% 3.6% 3.4% 3.0% 2.6% 2.4% 10.3% 9.3% 8.7% 7.6% 6.7% 6.1% -0.3% – 2.7% 0.7% – 3.7% 1.3% – 4.3% 2.4% – 5.4% 3.2% – 6.2% 3.9% – 6.9% ($1) – $7 $2 – $12 $5 – $15 $10 – $22 $15 – $28 $20 – $35 Revenue Gross Margin % Variable: Fulfillment Marketing Technology G&A Total Variable Fixed: Fulfillment Marketing Technology G&A Total Fixed Adjusted EBITDA % Adjusted EBITDA $ ($1) |
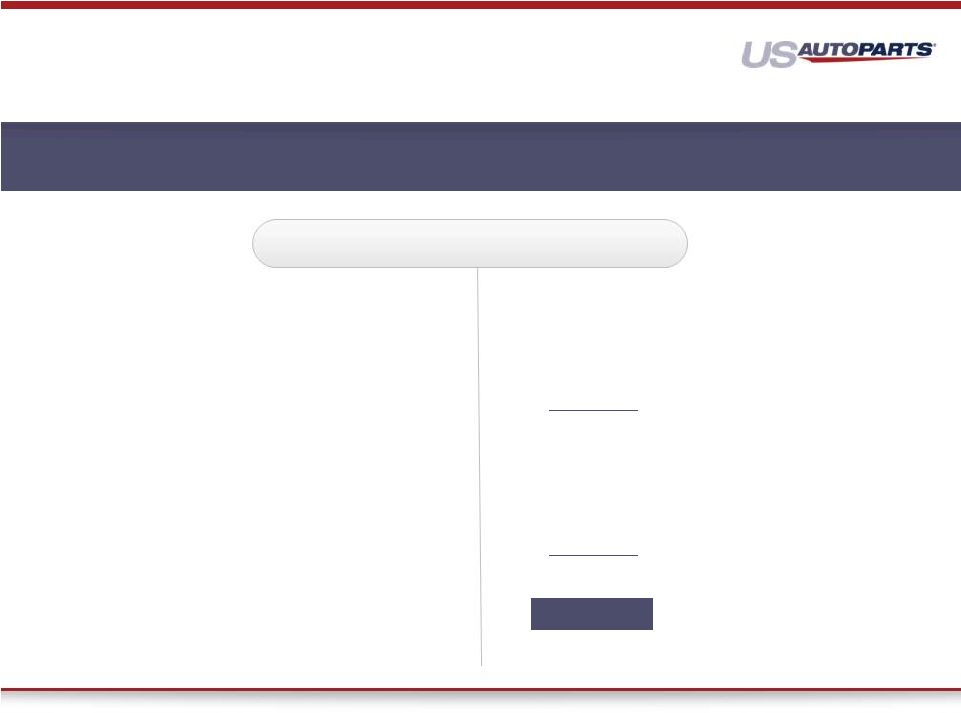
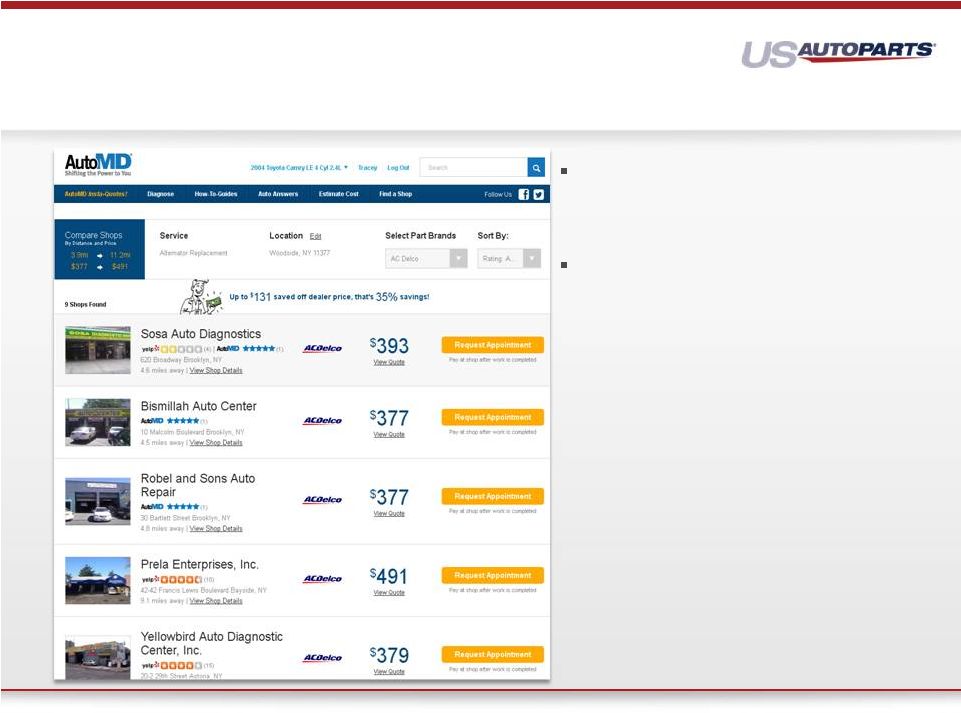 AutoMD – Repair Lead Generation Site Overview • Repair lead generation site addresses the DIFM market Recent Strategic Investment • $12.5M pre-money valuation • Raised $7.0M in capital • Fed Mogul: $3.0M • Cox Automotive: $2.0M • Insiders: $2.0M • Post-funding valuation of $19.5M • USAP in control with 64% of the business • There are over 1,000 shops on the program and growing 12 |
 Case for Investment 13 Large and Growing Online Market Significant Customer Reach Significant Private Label Offering Experienced Leadership Team |
 14 Shane Evangelist - Chief Executive Officer Chief Executive Officer since October 2007 with over 10 years of leading internet businesses Senior Vice President and General Manager of Blockbuster Online Vice President of Strategic Planning for Blockbuster Inc. B.A. degree in Business Administration from the University of New Mexico and a M.B.A. from Southern Methodist University Michael Yoshida - Interim Chief Financial Officer Interim Chief Financial Officer since September 2014 Prior to his appointment as the Company's Principal Accounting Officer and Interim Chief Financial Officer, Mr. Yoshida has served as the Controller of the Company since 2009. Vice President Finance and Controller for Hot Topic, Inc. Senior Director of Finance and Controller for Bristol Farms Chief Financial Officer, Vice President Finance at Farmers Market B.S. degree in Accounting from the University of Southern California and an M.B.A. from the California State University, Los Angeles and is a Certified Public Accountant. Aaron E. Coleman - Chief Operating Officer Chief Operating Officer since September 2010, and was Executive Vice President of Operations and CIO from April 2008 until September 2010 with over 18 years of e-commerce experience Senior Vice President – Online Systems at Blockbuster Inc. Multiple positions with internet and technology companies including American Airlines, Travelweb (Priceline), Baan B.A. degree in Business Administration from Gonzaga University Leadership Team Charles Fischer - Senior Vice President of Global Procurement Senior Vice President of Global Sourcing and Procurement since May 2008 with over 30 years of global sourcing experience Vice President, Supply Chain Management for Keystone Automotive Industries Director, Business Development for Modern Engineering Multiple leadership positions with multiple companies in the automotive aftermarket industry |
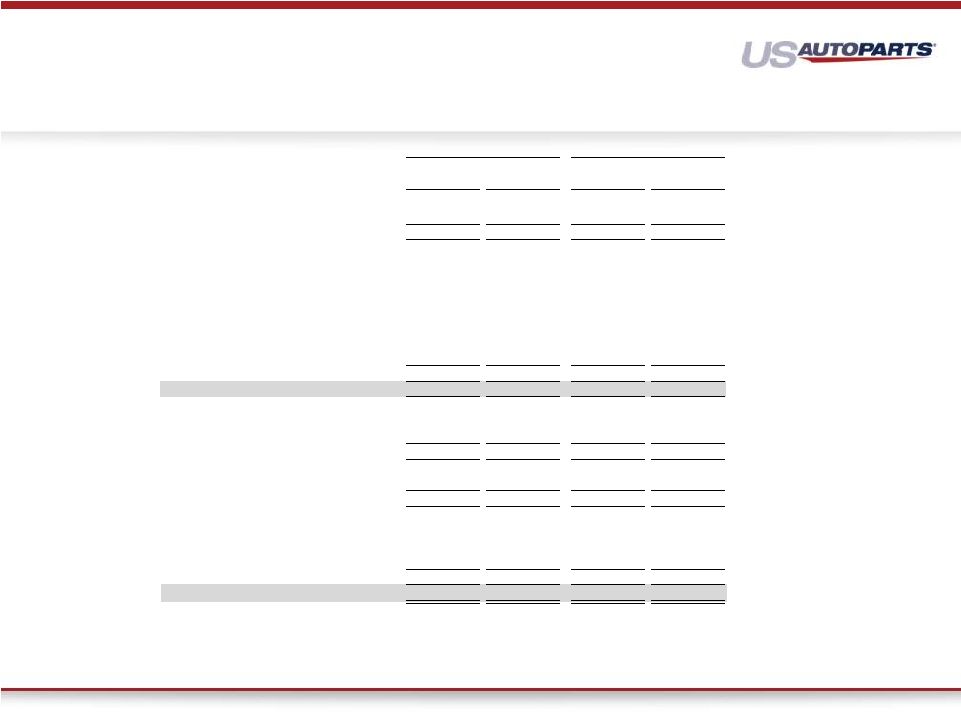
 15 Over $19M of costs have been reduced over a two year period Adjusted EBITDA (Non-GAAP Financial Measure – in thousands) Thirteen Weeks Ended Twenty-Six Weeks Ended September 27 September 28 September 27 September 28 2014 2013 2014 2013 Net loss (2,494) $ (1,399) $ (4,473) $ (14,309) $ Interest expense, net 283 285 774 696 Income tax provision 15 1 68 91 Amortization of intangible assets 106 86 316 299 Depreciation and amortization expense 2,213 2,472 6,833 9,736 EBITDA 123 1,445 3,518 (3,487) Share-based compensation expense 686 315 1,691 1,065 Impairment loss on property and equipment - - - 4,832 Impairment loss on intangible assets - - - 1,245 Inventory write-down related to Carson closure - - 478 - Restructuring costs 410 - 1,035 723 Adjusted EBITDA 1,219 $ 1,760 $ 6,722 $ 4,378 $ |
 16 Consolidated Statements of Comprehensive Operations (Unaudited, in Thousands, Except Per Share Data) (1) Excludes depreciation and amortization expense which is included in marketing, general and administrative and fulfillment expense. Thirteen Weeks Ended Twenty-Six Weeks Ended September 27 September 28 September 27 September 28 2014 2013 2014 2013 Net sales 67,965 $ 61,724 $ 212,940 $ 195,018 $ Cost of sales (1) 49,551 43,817 153,405 138,360 Gross profit 18,414 17,907 59,535 56,658 Operating expenses: Marketing 10,278 9,385 31,356 31,762 General and administrative 3,762 4,261 12,532 13,626 Fulfillment 5,256 4,217 15,351 14,589 Technology 1,228 1,204 3,640 4,035 Impairment loss on property and equipment - - - 4,832 Impairment loss on intangible assets - - - 1,245 Amortization of intangible assets 106 86 316 299 Total operating expenses 20,630 19,153 63,195 70,388 Loss from operations (2,216) (1,246) (3,660) (13,730) Other income (expense): Other income, net 24 135 39 214 Interest expense (287) (287) (784) (702) Total other expense, net (263) (152) (745) (488) Loss before income tax provision (2,479) (1,398) (4,405) (14,218) Income tax provision 15 1 68 91 Net loss (2,494) (1,399) (4,473) (14,309) Other comprehensive income (loss), net of tax: Foreign currency translation adjustments 23 6 19 31 Net unrealized losses on derivative instruments (48) - (70) - Unrealized gains on investments - 2 - 4 Total other comprehensive income (loss) (25) 8 (51) 35 Comprehensive loss (2,519) $ (1,391) $ (4,524) $ (14,274) $ Basic and diluted net loss per share (0.08) $ (0.04) $ (0.14) $ (0.40) $ Shares used in computation of basic and diluted net loss per share 33,532 33,218 33,459 32,493 |
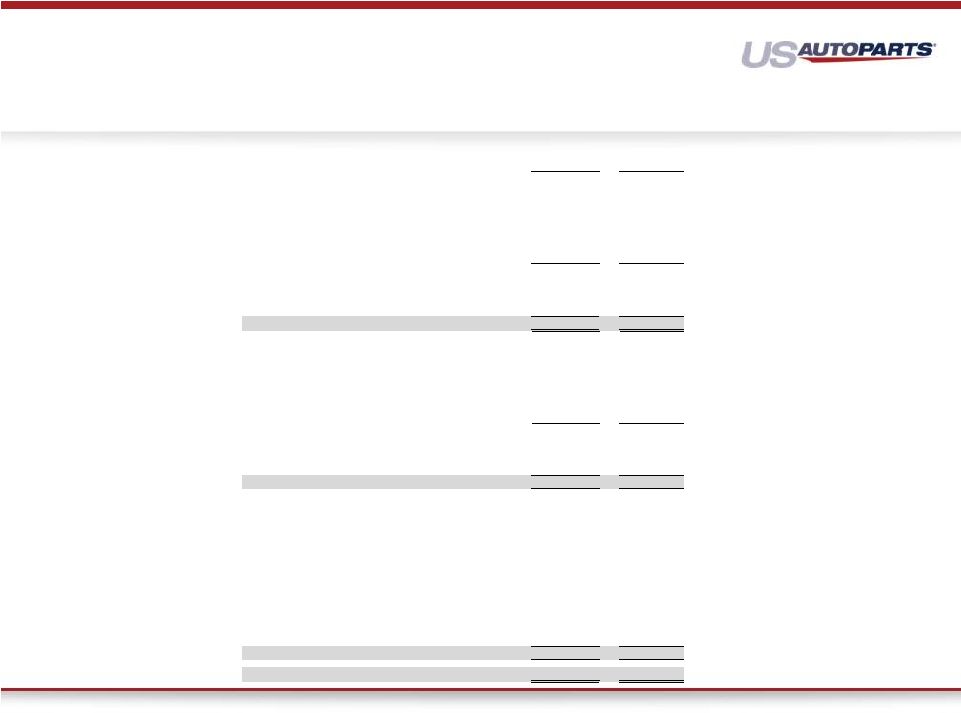 17 Consolidated Balance Sheet (Unaudited, in Thousands, Except Par and Per Share Liquidation value) September 27 December 28 ASSETS 2014 2013 Current assets: Cash and cash equivalents 1,255 $ 818 $ Short-term investments 39 47 Accounts receivable, net of allowances of $295 and $213 at June 28, 2014 and December 28, 2013, respectively 3,958 5,029 Inventory 44,816 36,986 Other current assets 3,052 3,234 Total current assets 53,120 46,114 Property and equipment, net 17,321 19,663 Intangible assets, net 1,822 1,601 Other non-current assets 1,421 1,804 Total assets 73,684 $ 69,182 $ LIABILITIES AND STOCKHOLDERS' EQUITY Current liabilities: Accounts payable 21,715 $ 19,669 $ Accrued expenses 6,902 5,959 Revolving loan payable 10,869 6,774 Current portion of capital leases payable 209 269 Other current liabilities 3,982 3,682 Total current liabilities 43,677 36,353 Capital leases payable, net of current portion 9,392 9,502 Deferred income taxes 321 335 Other non-current liabilities 1,854 2,126 Total liabilities 55,244 48,316 Stockholders' equity: Series A convertible preferred stock, $0.001 par value; $1.45 per share liquidation value or aggregate of $6,017; 4,150 shares authorized; 4,150 shares issued and outstanding at September 27, 2014 and December 28, 2013, respectively 4 4 Common stock, $0.001 par value; 100,000 shares authorized; 33,542 shares and 33,352 shares issued and outstanding at September 27, 2014 and December 28, 2013, respectively 34 33 Additional paid-in capital 170,969 168,693 Common stock dividend distributable 61 60 Accumulated other comprehensive income 395 446 Accumulated deficit (153,023) (148,370) Total stockholders' equity 18,440 20,866 Total liabilities and equity 73,684 $ 69,182 $ |
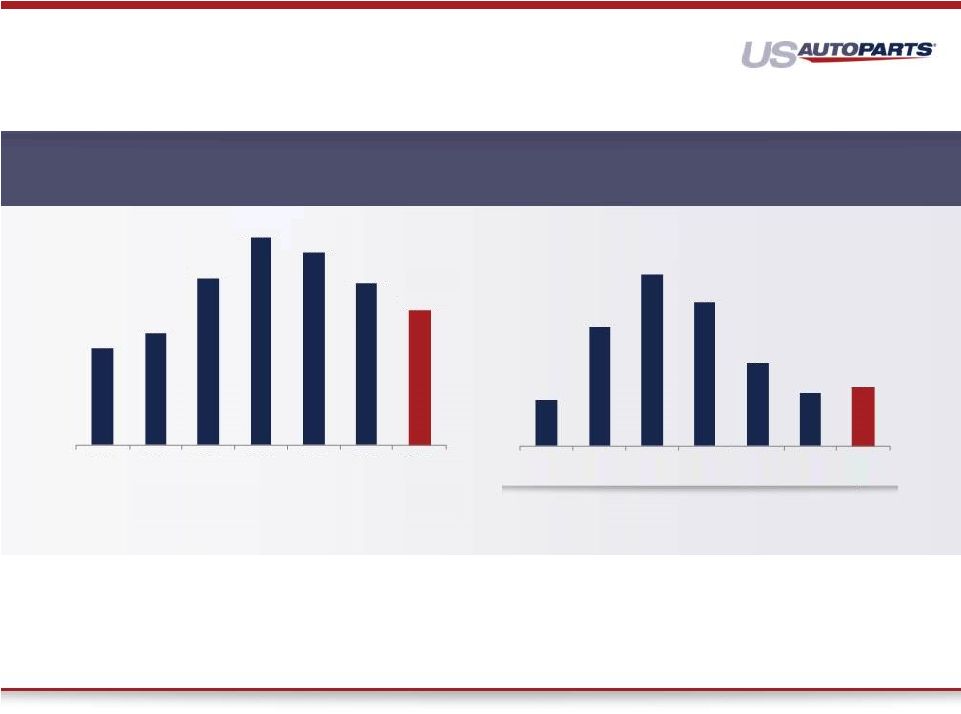 Consolidated Sales 1 ($ In Millions) Sales & Adjusted EBITDA 18 Adj. EBITDA Margin 3% 5% 8% 7% 3% 2% 3% $5.2 $13.5 $19.5 $16.3 $9.4 $6.0 $6.7 2008 2009 2011 2011 2012 2013 Q1.14 - Q3.14 $153.4 $176.3 $262.3 $327.1 $304.0 $254.8 $212.9 2008 2009 2011 2011 2012 2013 Q1.14 - Q3.14 Consolidated Adjusted EBITDA 2 ($ In Millions) 1. JC Whitney was acquired in Aug 2010 adding revenue of $39.1M in 2010 and $83.4M in 2011. Amounts not separately disclosed after 2011. 2. Non-GAAP financial measure EBITDA consists of net income before (a) interest expense, net; (b) income tax provisions; (c) amortization of intangible assets; (d) depreciation and amortization. Adjusted EBITDA excludes Stock based compensation of $2.9M, $3.3M, $2.7M, $2.6M, $1.7M, $1.3M and $1.7M in 2008, 2009, 2010, 2011, 2012, 2013, and Q1-14 through Q3-14, respectively and restructuring costs and other one time charges of $23.4M, $0.4M, $5.8M, $12.9M, $27.5M, $6.8M, and $1.5 in 2008, 2009, 2010, 2011, 2012, 2013 and Q1-14, through Q3-14, respectively. |