KBW
Annual Insurance Conference
September 5, 2007
Safe Harbor Disclosure
This slide presentation is for informational purposes only. It should be read in conjunction with our Form 10-K for the year 2006, our Form
10-Q for the second quarter 2007 and our Form 8-Ks filed with the Securities and Exchange Commission (SEC) and available in the
“Investor Relations” section of our website at www.employers.com.
Non-GAAP Financial Measures
In presenting Employers Holdings, Inc.’s (EMPLOYERSSM) results, management has included and discussed certain non-GAAP financial
measures, as defined in Regulation G. Management believes these non-GAAP measures better explain EMPLOYERS results allowing for a
more complete understanding of underlying trends in our business. These measures should not be viewed as a substitute for those
determined in accordance with GAAP. The reconciliation of these measures to their most comparable GAAP financial measures is included
in this presentation or in our Form 10-K for the year 2006, our Form 10-Q for the second quarter 2007 and our Form 8-Ks filed with the
Securities and Exchange Commission (SEC) and available in the “Investor Relations” section of our website at www.employers.com.
Forward-looking Statements
This presentation contains certain forward-looking statements within the meaning of the Private Securities Litigation Reform Act of 1995.
Forward-looking statements include statements regarding anticipated future results and can be identified by the fact that they do not relate
strictly to historical or current facts. They often include words like "believe”, "expect”, "anticipate”, "estimate" and "intend" or future or
conditional verbs such as "will”, "would”, "should”, "could" or "may”. Certain factors that could cause actual results to differ materially from
expected results include increased competitive pressures, changes in the interest rate environment, general economic conditions, and
legislative and regulatory changes that could adversely affect the business of EMPLOYERS and its subsidiaries. All subsequent written and
oral forward-looking statements attributable to us or individuals acting on our behalf are expressly qualified in their entirety by these
cautionary statements. We undertake no obligation to publicly update or revise any forward-looking statements, whether as a result of new
information, future events or otherwise.
EMPLOYERS is a service mark and trade name for a group of companies which provides workers’ compensation insurance and services. Insurance is
offered through Employers Compensation Insurance Company, except in Nevada, where insurance is offered through Employers Insurance Company of
Nevada. Employers Compensation Insurance Company does not do business in all jurisdictions. For more information please visit www.employers.com.
Copyright © 2007 EMPLOYERS. All rights reserved.
Contents Page
18
California Rates and Rate Setting
13
Customer Selection
19
Insurance Operations Summary
17
Workers’ Compensation Industry
16
Policy Count
15
Strategic Distribution Partners
14
Focused Marketing and Distribution
12
Focus on Low to Medium Hazard Groups
11
Disciplined Underwriting – Five Basic Elements
Insurance Operations
9
Seasoned Executives with Extensive Experience
8
Expanding Geographic Footprint
7
Strategies
6
Financial Snapshot
5
Key Strengths
4
Overview
Corporate Overview
31-32
Summary
28
29
Mortgage-backed Securities
Capital Management
23
Selected Operating Results
SUMMARY
27
Investment Portfolio
26
Reinsurance Program
25
Underwriting Profitability
24
Earnings and EPS
22
Loss Portfolio Transfer
21
Four Key Elements of our Financial Strength
Financial Results
Overview
Business
Specialty provider of workers’ compensation insurance
18th largest private writer in the U.S. (1)
8th largest private writer in California (1)
2nd largest writer in Nevada (1)
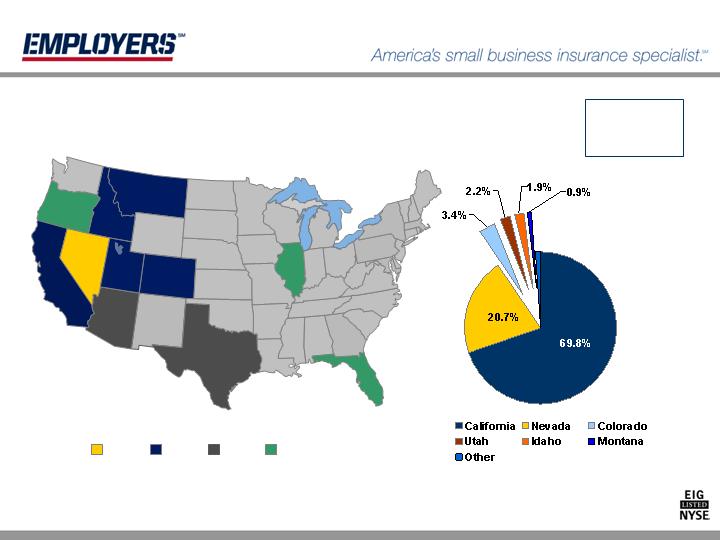
Geographic
Focused in Western U.S. – direct premiums written as of the second quarter of 2007
70% in California
21% in Nevada
9% in nine other states
Customers
Small businesses in low to medium hazard industries
Distribution through independent agents and strategic partners
31,902 policies in force at 6/30/2007
Average annual policy premium of approximately $11,000
(1) Based on “One-Year Premium and Loss Study,” U.S., California and Nevada, A.M. Best Company, 2006
4
Key Strengths
Established enterprise with 94 year operating history
Focused operations and disciplined underwriting – target an attractive
and underserved market segment with growth opportunities
Unique and long-standing strategic distribution relationships
Financial strength and flexibility - strong balance sheet and conservative
reserving
Experienced management team with deep knowledge of workers’
compensation
5
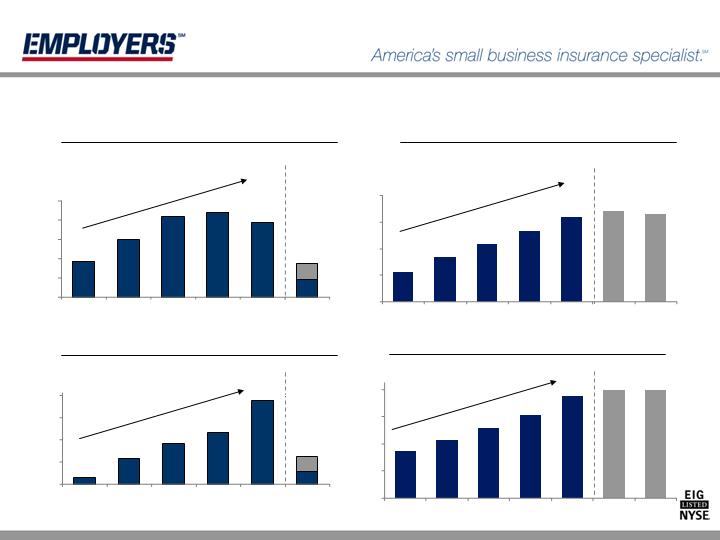
’02 – ’06 CAGR = 20%
6
Capital management plans include dividends and share
repurchases
Loss trends and investments are driving net income
Strong growth provides a solid basis for underwriting
Premium growth has reversed due to California rate
decreases
($ million)
Statutory Surplus
Equity Incl. Deferred Gain - LPT
Net Premium Written
Financial Snapshot
93
387
440
418
298
187
82
0
100
200
300
400
500
2002
2003
2004
2005
2006
1st & 2nd
Qtr 2007
655
682
339
431
531
640
224
0
200
400
600
800
2002
2003
2004
2005
2006
3/31/07
6/30/07
’02 – ’06 CAGR = 30%
94
152
73
46
11
23
26
0
40
80
120
160
2002
2003
2004
2005
2006
1st & 2nd
Qtr 2007
’02 – ’06 CAGR = 93%
Net Income Before Loss Portfolio Transfer (LPT)
351
747
607
516
424
790
795
0
200
400
600
800
2002
2003
2004
2005
2006
3/31/07
6/30/07
’02 – ’06 CAGR = 21%
Strategies
Focus on
Profitability
Target attractive, underserved small business market
Maintain disciplined risk selection, underwriting and
pricing
Pursue
Organic
Growth
Opportunities
Expand in current markets and in our new states
Leverage infrastructure, technology and systems
Utilize existing and new strategic distribution partners
Optimize
Capital
Structure
Invest in operations and manage capital prudently
Return capital to shareholders
Consider opportunistic strategic transactions
7
Expanding GeographicFootprint
2000
2002
2006
2007
FL
NM
MD
TX
OK
KS
NE
SD
ND
MT
WY
CO
UT
ID
AZ
NV
WA
CA
OR
KY
ME
NY
PA
MI
NH
MA
CT
VA
WV
OH
IN
IL
NC
TN
SC
AL
AR
LA
MO
IA
MN
WI
GA
MS
VT
NJ
DE
RI
8
NEW STATES
Florida, Oregon,
Texas, Arizona
and Illinois = 1.1%
Direct Premiums Written (%) for six months ended 6/30/07
Seasoned Executives with Extensive Experience
31
EVP, Chief Financial Officer
William E. Yocke
28
SVP, Chief Underwriting Officer
Jeff J. Gans
25
SVP, Chief Claims Officer
Stephen V. Festa
19
SVP, President of Western Region
George Tway
22
SVP, President of Strategic Markets Region
David M. Quezada
16
SVP, President of Pacific Region
T. Hale Johnston
29
President and Chief Operating Officer
Martin J. Welch
22
Chief Executive Officer
Douglas D. Dirks
Experience
(Years)
Title
Name
Average experience of senior operating leadership = 24 years
9
Disciplined Underwriting
37.9% statutory loss and LAE ratio in 2006
Risk Selection
Expertise
Strong
Underwriting
Culture
Focused
Guidelines and
Consistent
Automated
Approach
Disciplined
Underwriting
Local Knowledge
Pricing of
Individual Risks
Five Basic Elements
11
Focus on Low to Medium Hazard Groups
EMPLOYERS
Focus on low to medium hazard risks allows us to optimize risk selection and pricing adequacy
Hazard Group A
Industry (1)
% of Premiums Written, 12/31/06
12
Hazard Group B
Hazard Group C
Hazard Group D
Hazard Group E
Hazard Group F
Hazard Group G
Hazard Groups A through D
Lower
Risk
Higher
Risk
(1) NCCI 2006 Premium Distribution by Hazard Group (as presented at 2007 Annual Issues Symposium).
Industry = 56%
EMPLOYERS = 82%
Customer Selection
35.1%
$136,883
Top 10
1.7
6,458
Automobile
D
2.0
7,939
Dentists & Dental Surgeons & Clerical
C
2.3
9,040
Clothing Manufacturers
C
2.4
9,455
Machine Shops
D
2.5
9,846
Clerical Office Employees
C
2.9
11,189
Store: Retail
B
3.0
11,590
College: Professional Employees & Clerical
B
4.8
18,854
Store: Wholesale
B
6.4
24,858
Physicians & Clerical
C
7.1%
$ 27,654
Restaurants
A
Percent of
Total
Direct Premiums
Written (000s)
Class
Hazard
Group
EMPLOYERS further differentiates risks within industry-defined customer classes
Top Ten Classes in 2006
13
Focused Marketing and Distribution
Independent Agents and Brokers
PACIFIC REGION
California
In 2006, 44% of direct
premiums written
STRATEGIC REGION
Largely ADP & Wellpoint;
added E-CHX in Qtr 4, 2006
Primarily California today
In 2006, 30% of direct premiums
written
Three business units target customer segments with a focused underwriting approach
WESTERN REGION
Nevada, Colorado, Utah,
Montana, Idaho, Texas,
Arizona, Illinois, Oregon,
Florida
In 2006, 26% of direct
premiums written
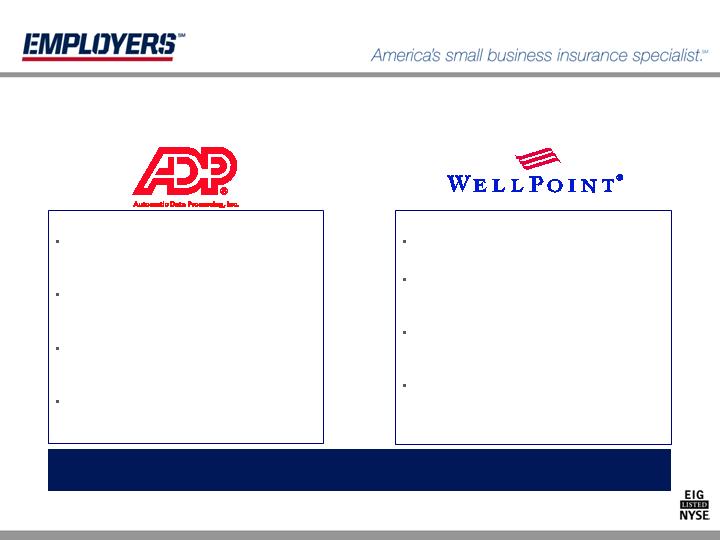
Strategic Distribution Partners
14
Strategic Distribution Partners
Largest payroll services company in the
U.S. with over 450,000 clients
Partner since entering California market
in 2002
Business originated by ADP’s field sales
staff and insurance agency
“Pay-by-Pay” premium collection
Strategic partners expand market reach and produce business with high persistency
15
Largest group health carrier in California
Partner since entering California market
in 2002
Business originated by Wellpoint’s health
insurance agents
Single bill to customers
16
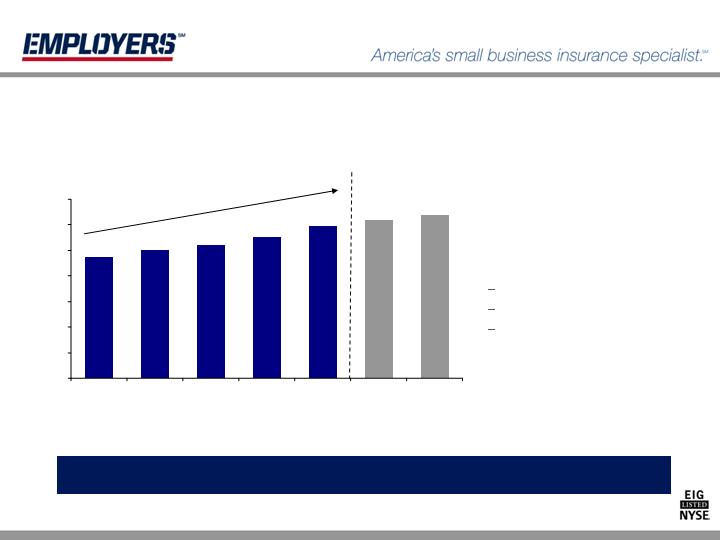
Solid in force policy count growth
continued in the second quarter,
2007
31,902 at 6/30/07
28,294 at 6/30/06
Total increase of 3,608 or
12.8%
In Force Policy Count
Total in force policy count has grown consistently with a 2002 – 2006 CAGR of 6%
23,657
24,967
26,005
27,686
29,742
30,922
31,902
0
5,000
10,000
15,000
20,000
25,000
30,000
35,000
2002
2003
2004
2005
2006
3/31/07
6/30/07
’02 – ’06 CAGR = 6%
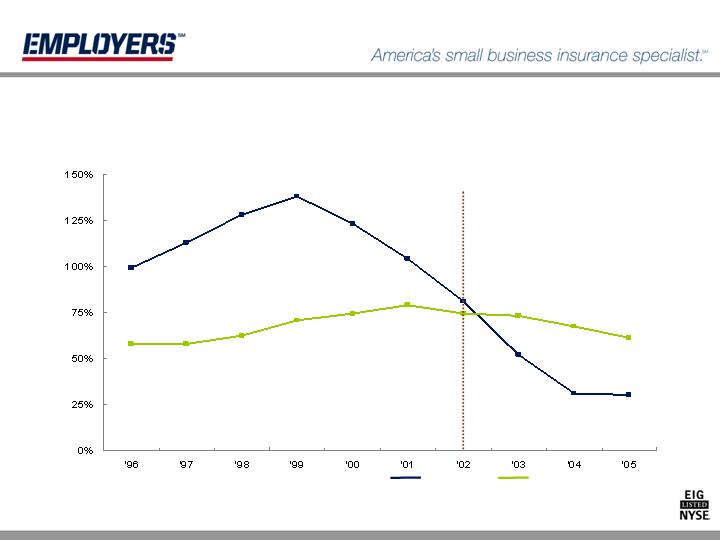
Workers’ Compensation Industry
Historical Pure Loss Ratio
California
Total U.S.
Source: WCIRB as of 09/30/06 (California); Insurance Information Institute as of 12/31/05 (Total U.S.)
2002: EMPLOYERS
entry into California
17
18
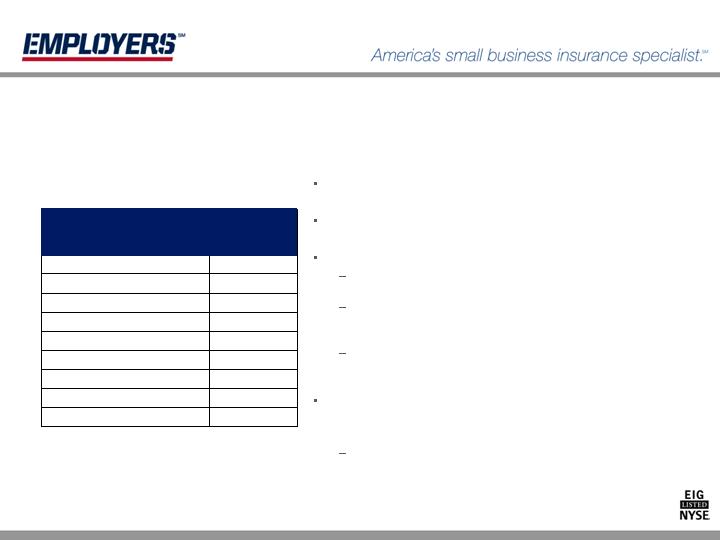
California Rates and Rate Setting
- 14.2%
July 1, 2007
- 9.5%
January 1, 2007
-65.1%
Cumulative Change
-16.4%
July 1, 2006
-15.3%
January 1, 2006
-18.0%
July 1, 2005
- 2.2%
January 1, 2005
- 7.0%
July 1, 2004
-14.9%
January 1, 2004
Workers’ Compensation Insurance Rating Bureau
(WCIRB) recommended decrease of 11.3%
Insurance Commissioner ordered decrease of 14.2% in
advisory rates
Company’s choice to implement rate changes
Internal analyses are compared to Bureau’s view of the
industry to confirm actual experience
Filed loss cost multipliers (LCMs) account for loss
adjustment, underwriting and commission expenses and
targeted unlevered return of 12% to 13%
Rate deviation plans modify full premium rates based on
individual or group risk characteristics to yield “effective
rates”
EMPLOYERS filed a 4.5% decrease premium for
California policies incepting on or after September 15,
2007
Rate filing accepted August, 2007
Recent Commissioner Ordered
Advisory Pure Premium Changes
High performing insurance operation, built upon four key
elements
A highly focused customer base
A disciplined underwriting culture
An efficient -- and scalable – infrastructure
Strong producer and strategic partner relationships, providing us
with:
broader access to markets
enhanced value delivery to our customers
more cost effective production
Insurance Operations Summary
19
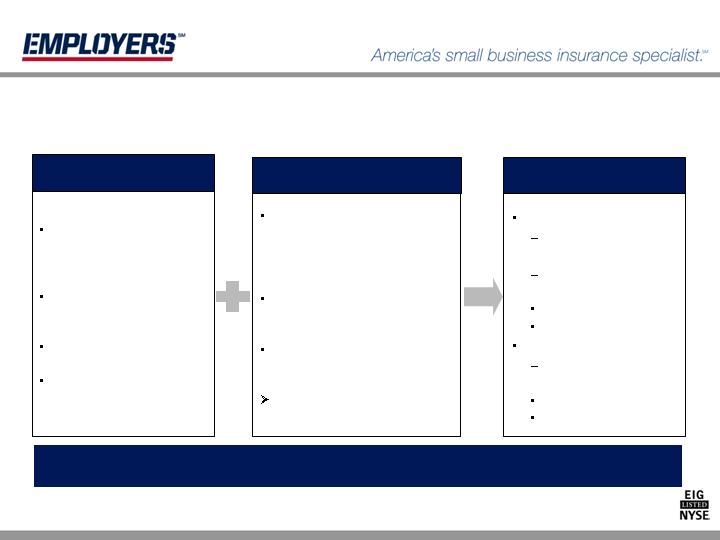
Four Key Elements of Our Financial Strength
Surplus of
$640MM
at 12/31/2006
Conservative
Reserving
High Quality
Investment
Portfolio
Catastrophe
Reinsurance
Program
0.6:1 NPW / Surplus
at 12/31/2006
Over 90% fixed maturity
with average rating AA
Coverage up to
$200MM loss
Track record of
reserve strength
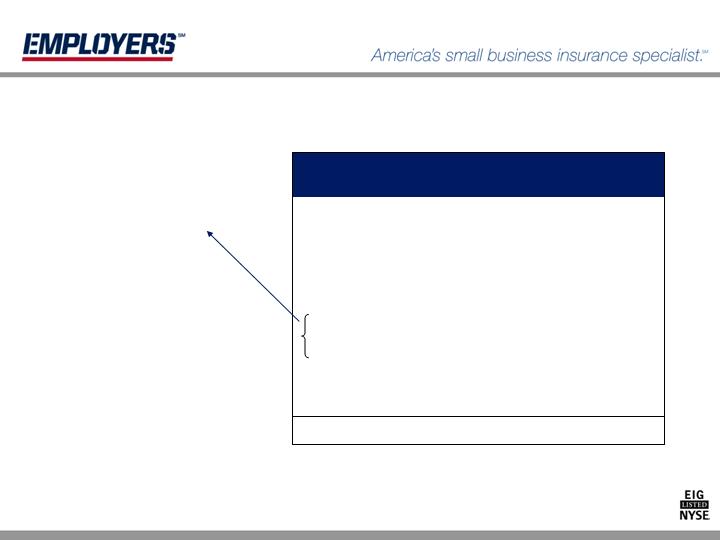
21
Loss Portfolio Transfer (LPT)
$ millions
$602.5
Gain at 6/30/2007
(147.5)
Subsequent Reserve Adjustments
750
Gain at 1/1/2000
$ 775
Consideration
$1,525
Original Reserves Transferred
$2,000
Total Coverage
Contract
$ millions
$433.9
GAAP: Deferred Reinsurance
Gain – LPT Agreement
(168.6)
Cumulative Amortization To Date
$602.5
Statutory Surplus Created
Accounting at 6/30/07
Non-recurring transaction with no ongoing cash benefits or charges to current operations
Retroactive 100% quota share reinsurance coverage for all losses occurring prior to 7/1/95
Gain on transaction booked as statutory surplus; deferred and amortized under GAAP
22
Selected Operating Results
795.5
361.6
2,294.3
3,221.2
149.3
1,695.2
26.2
30.8
19.3
84.1
81.5
$84.6
746.8
303.8
2,307.8
3,195.7
80.0
1,715.7
152.2
171.6
68.2
393.0
387.2
$ 401.8
790.4
352.0
2,307.2
3,221.2
66.5
1,768.6
23.3
27.9
20.8
89.8
93.2
$ 96.5
144.6
Shareholders’ equity
Balance Sheet Data
1,595.8
Total investments
61.1
Cash and cash equivalents
3,094.2
Total assets
2,350.0
Reserves for loss & LAE
607.0
Equity including LPT deferred gain
58.7
137.6
Net Income
49.5
93.8
Net Income Before LPT
40.1
54.4
Net Investment Income
173.9
438.3
Net Earned Premium
174.7
439.7
Net Written Premium
$181.0
$ 458.7
Gross Written Premium
Income Statement Data
$ million
December 31
2005 2006
23
Q1
2007
Q2
2007
YTD
2007
Premiums are
declining due to
California rate
decreases
Loss trends and
Investments are
driving net income
While premiums have
declined in California, losses
have also declined
Portfolio re-allocation (equity
sales) in Q4 of 2006 reduced
volatility
Earnings and EPS
53,500,722
$ .49
.09
.58
--
--
--
26.2
(4.6)
$30.8
52,832,048
52,155,944
50,000,002
50,000,002
Weighted Average Shares Outstanding, pro forma (2)
$ .94
$ .45
EPS Before Impacts of the LPT, pro forma (2)
.17
$ 1.11
.97
--
--
49.5
(9.2)
$58.7
.40
EPS for Feb. 5 through the period
--
$3.43
$2.75
GAAP Pro forma EPS – assuming conversion
--
3.04
1.88
EPS (Net Income Before LPT) – assuming
conversion
.08
EPS attributable to LPT (2)
.53
EPS for the period
$27.9
$171.6
$137.6
Net Income
(4.6)
(19.4)
(43.8)
Less: LPT Deferred Gain Amortization
23.3
152.2
93.8
Net Income Before LPT
$ million, except per share data
(1)
Based on 50,000,002 shares assumed outstanding before the conversion.
(2)
Pro forma EPS computed using the actual weighted average shares outstanding as of the end of the period. This includes shares outstanding for the period after the
Company’s IPO and prior to the IPO. Options have been excluded in computing the diluted earnings per share for the period 2/5/07 through 6/30/07 because their
inclusion would be anti-dilutive.
(3)
Pro forma EPS computed using the actual weighted average shares outstanding as of 6/30/2007.
December 31
2005 2006
24
Q1
2007
Q2
2007
YTD
2007
(2)
(2)
(3)
(1)
(1)
(1)
(1)
Underwriting Profitability
$36.0
85.7%
26.5%
13.4%
45.8%
5.3%
40.5%
$15.6
90.5%
25.9%
13.1%
51.5%
5.1%
46.4%
$20.4
$107.1
$78.1
Favorable Reserve Development ($ million)
106.4%
26.5%
13.4%
66.5%
5.3%
61.2%
Excluding
reserve
development for
6 mos., 2007 (1)
80.6%
27.0%
13.9%
39.6%
5.4%
34.2%
72.6%
84.9%
Combined Ratio (excl. LPT)
22.3%
16.0%
Underwriting & Other Expense Ratio (3)
12.3%
10.7%
Commission Expense Ratio (3)
37.9%
58.3%
Loss & LAE Ratio (excl. LPT)
4.9%
10.0%
Less: Impact of LPT (2)
33.0%
48.3%
Loss & LAE Ratio
COMBINED RATIO
(GAAP and excluding the LPT)
(1)
Excluding $36 million of favorable development in the first six months of 2007, our loss ratio before the LPT would have been 66.5% and our combined ratio would
have been 106.4%. We target a combined ratio of 100. The total combined ratio includes three items causing upward pressure: (1) one shock loss requiring
additional reserves that may run in excess of $3.5 million; (2) one-time conversion costs; and (3) decreasing earned premium.
(2)
Total deferred gain amortization and LPT reserve adjustment of $43.8 million in 2005, $19.4 million in 2006, $4.6 million in the first and $4.6 million in the second
quarters of 2007.
(3)
Our higher expense ratio is largely a function of falling California rates.
Q1
2007
December 31
2005 2006
25
Q2
2007
YTD
2007
Retention
$10M xs $10M
Catastrophe per Occurrence
First Excess of Loss Layer
$30M xs $20M
Catastrophe per Occurrence
Second Excess of Loss Layer
$50M xs $50M
Catastrophe per Occurrence
Third Excess of Loss Layer
$50M xs $100M
Catastrophe per Occurrence
Fourth Excess of Loss Layer
$50M xs $150M
Catastrophe per Occurrence
Fifth Excess of Loss Layer
$5M xs $5M
$20M Aggregate
First Excess of Loss Layer
$200M
$ 5M
$10M
$20M
$50M
$100M
$150M
Expires 7/1/08
Priced annually
Includes terrorism, except nuclear,
biological, chemical and radiological
Increased retention to $5.0M
from $4.0M from previous treaty
Increased total limits by $25.0M from
previous treaty
Catastrophe Excess of Loss includes
maximum any one life of $10.0M
Reinsurance Program
26
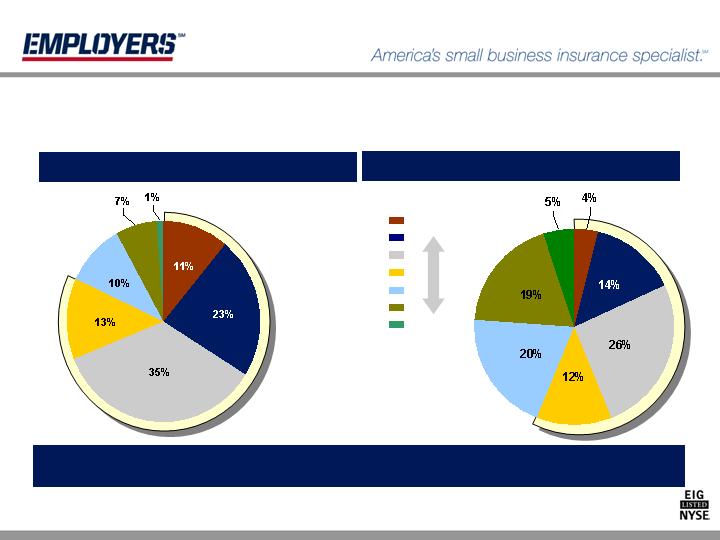
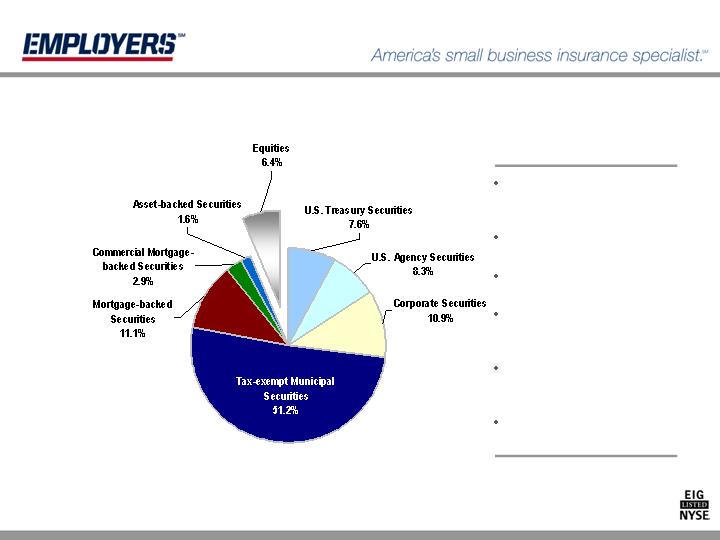
Investment Portfolio
$1.7 billion of
investment securities
Over 90% AA+ rated
Book yield of 4.3%
Tax equivalent book
yield of 5.3%
Effective duration of
5.68
Outsourced to Conning
Asset Management
Portfolio Mix at 6/30/07
27
Mortgage-backed Securities
28
Approximately 97% of
MBS are agency-backed
Of these:
Fannie Mae = 48%
Freddie Mac = 32%
Ginnie Mae = 20%
(less than .03% in three fully-
insured securities that could
be defined as sub-prime)
6.4%
107.9
Equities
100%
1,695.2
TOTAL
1.6%
27.9
Asset-backed Securities
2.9%
48.9
Commercial MB Securities
11.1%
187.7
Mortgage-backed Securities
51.2%
868.0
Tax-exempt Municipals
10.9%
184.8
Corporate Securities
8.3%
140.3
US Agency Securities
7.6%
129.7
US Treasury Securities
PORTFOLIO at 6/30/07
($ million)
Commercial mortgage-backed
securities are all AAA rated
Capital Management
$38 million ordinary
dividend capacity
(unassigned surplus at
12/31/2006), plus
$9.7 million in net proceeds
from the IPO, plus
$55 million up-streamed
extraordinary dividend
Greater than $100 million
available cash in 2007
Holding Company
Cash Flow
Strong Capital Position
$790 million GAAP
adjusted equity at
3/31/2007
0.6:1 NPW/surplus at
12/31/2006
No debt
Reserve strength
Our goal is to drive shareholder value through an improving ROE resulting from (i) profitability
consistent with historical results, (ii) disciplined growth and (iii) prudent capital management
29
Capital Management
Tools
Shareholder dividends
$0.06 per share
quarterly dividend
Two quarters
declared and paid
$3.2 million Q2, 2007
$3.1 million Q3, 2007
Share repurchase
Up to $75 million in
open market in 2007
135,716 at 6/30/07
1,618,270 at 8/10/07
Summary
Established enterprise with 94 year operating history
Focused operations and disciplined underwriting – target an attractive
and underserved market segment with growth opportunities
Unique and long-standing strategic distribution relationships
Financial strength and flexibility - strong balance sheet and conservative
reserving
Experienced management team with deep knowledge of workers’
compensation
31
Douglas D. Dirks
President & Chief Executive Officer
Employers Holdings, Inc.
William E. (Ric) Yocke
Chief Financial Officer
Employers Holdings, Inc.
Martin J. Welch
President and Chief Operating Officer
Employers Insurance Company of Nevada and
Employers Compensation Insurance Company
Analyst Contact:
Vicki Erickson
Vice President, Investor Relations
Employers Holdings, Inc.
(775) 327-2794
verickson@employers.com
9790 Gateway Drive
Reno, NV. 89521-5906
(775) 327-2700
32