Exhibit 99.1
The Association of Insurance
and Financial Analysts
33rd Annual Conference
March, 2008

This slide presentation is for informational purposes only. It should be read in conjunction with our Form 10-K for the year 2006, our Form 10-Q for the
quarters of 2007 and our Form 8-Ks filed with the Securities and Exchange Commission (SEC), all of which are available on the “Investor Relations”
section of our website at www.employers.com.
quarters of 2007 and our Form 8-Ks filed with the Securities and Exchange Commission (SEC), all of which are available on the “Investor Relations”
section of our website at www.employers.com.
Non-GAAP Financial Measures
In presenting Employers Holdings, Inc.’s (EMPLOYERS) results, management has included and discussed certain non-GAAP financial measures, as
defined in Regulation G. Management believes these non-GAAP measures better explain EMPLOYERS results allowing for a more complete
understanding of underlying trends in our business. These measures should not be viewed as a substitute for those determined in accordance with GAAP.
The reconciliation of these measures to their most comparable GAAP financial measures is included in this presentation or in our Form 10-K for the year
2006, our Form 10-Q for the quarters of 2007 and our Form 8-Ks filed with the Securities and Exchange Commission (SEC) and available in the “Investor
Relations” section of our website at www.employers.com.
Forward-looking Statements
This presentation contains certain forward-looking statements within the meaning of the Private Securities Litigation Reform Act of 1995. Forward-
looking statements include statements regarding anticipated future results and can be identified by the fact that they do not relate strictly to historical or
current facts. They often include words like "believe”, "expect”, "anticipate”, "estimate" and "intend" or future or conditional verbs such as "will”, "would”,
"should”, "could" or "may”. Certain factors that could cause actual results to differ materially from expected results include increased competitive pressures,
changes in the interest rate environment, general economic conditions, and legislative and regulatory changes that could adversely affect the business of
EMPLOYERS and its subsidiaries. All subsequent written and oral forward-looking statements attributable to us or individuals acting on our behalf are
expressly qualified in their entirety by these cautionary statements.
All forward-looking statements made in this presentation, related to the anticipated acquisition of AmCOMP, Inc. or otherwise, reflect EMPLOYERS
current views with respect to future events, business transactions and business performance and are made pursuant to the safe harbor provisions of the
Private Securities Litigation Reform Act of 1995. Such statements involve risks and uncertainties, which may cause actual results to differ materially from
those set forth in these statements. The following factors, among others, could cause or contribute to such material differences: failure to satisfy any of the
conditions of closing, including the failure to obtain AmCOMP stockholder approval or any required regulatory approvals; the risks that EMPLOYERS and
AmCOMP's businesses will not be integrated successfully; the risk that EMPLOYERS will not realize estimated cost savings and synergies; costs relating
to the proposed transaction; and disruption from the transaction making it more difficult to maintain relationships with customers, employees, agents or
producers. We undertake no obligation to publicly update or revise any forward-looking statements, whether as a result of new information, future events
or otherwise.
Copyright © 2007 EMPLOYERS. All rights reserved. EMPLOYERS and America’s small business insurance specialists are registered trademarks
of Employers Insurance Company of Nevada. Workers’ compensation insurance and services are offered through Employers Compensation
Insurance Company and Employers Insurance Company of Nevada.
of Employers Insurance Company of Nevada. Workers’ compensation insurance and services are offered through Employers Compensation
Insurance Company and Employers Insurance Company of Nevada.
Safe Harbor Disclosure
Compelling Transactions | 6 | |
Expands EMPLOYERS Geographic Footprint | 7 | |
Diversifies EMPLOYERS Geographic Footprint | 8 |
Corporate Overview and Operations | ||
Overview | 1 | |
Geographic Footprint | 2 | |
Key Strengths | 3 | |
Strategies | 4 | |
Acquisition of AmCOMP - Key Terms | 5 |
Financial Results | ||
Four Key Elements of our Financial Strength | 10 | |
Financial Snapshot | 11 | |
Capital Management | 12 | |
SUMMARY | ||
Summary | 14 | |
APPENDIX | ||
Disciplined Underwriting - Five Basic Elements | 16 | |
Focus on Low to Medium Hazard Groups | 17 | |
Strategic Distribution Partners | 18 | |
Loss Portfolio Transfer (LPT) | 19 | |
Selected Operating Results | 20 | |
Earnings and EPS | 21 | |
Underwriting Profitability | 22 | |
Investment Portfolio | 23 |
Contents Page

Corporate Overview
Business
· Specialty provider of workers’ compensation insurance
– 18th largest private writer in the U.S. (1)
– 8th largest private writer in California (1)
– 2nd largest writer in Nevada (1)
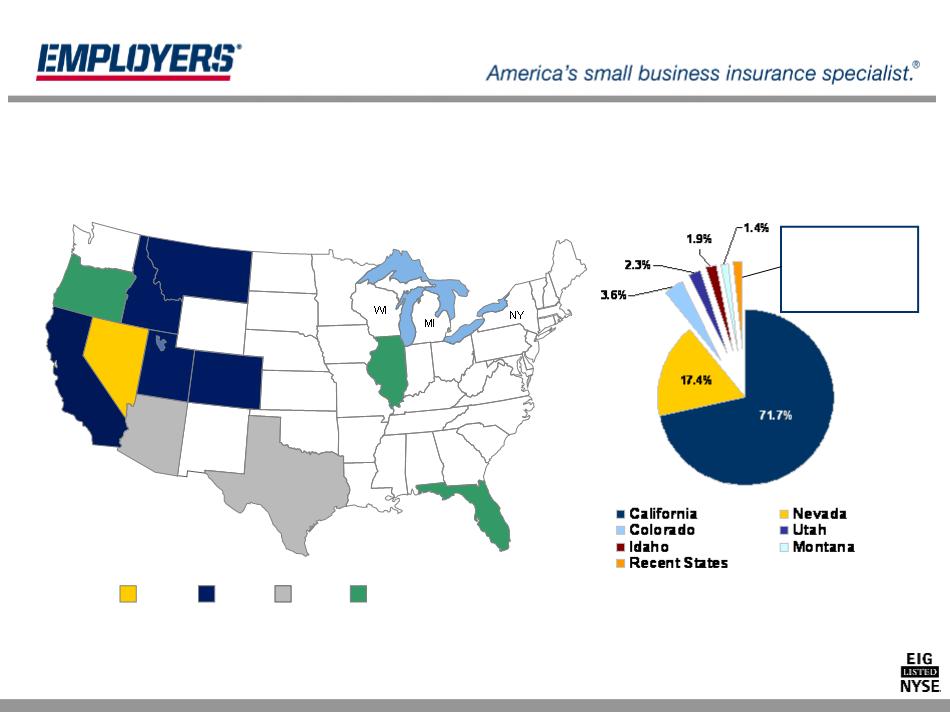
Geographic
· Focused in Western U.S. - direct premiums written at 12/31/07
– 72% in California
– 17% in Nevada
– 11% in nine other states
Customers
· Small businesses in low-to-medium hazard industries
· Distribution through independent agents and strategic partners
· 33,699 policies in force at 12/31/07, 13.3% growth rate since 12/31/06
· Average annual policy premium of approximately $10,000
(1) Based on “One-Year Premium and Loss Study,” United States., California and Nevada, A.M. Best Company, 2006
1
Overview
2000
2002
2006
2007
FL
NM
MD
TX
OK
KS
NE
SD
ND
MT
WY
CO
UT
ID
AZ
NV
WA
CA
OR
KY
ME
PA
NH
MA
CT
VA
WV
OH
IN
IL
NC
TN
SC
AL
AR
LA
MO
IA
MN
GA
MS
VT
NJ
DE
RI
RECENT STATES
Florida, Oregon,
Texas, Arizona and
Illinois = 1.7%
Texas, Arizona and
Illinois = 1.7%
2
Direct Premiums Written (%) at 12/31/07
Geographic Footprint

3
Key Strengths
• Established enterprise with 95 year operating history
• Focused operations and disciplined underwriting - target an attractive
and underserved market segment with growth opportunities
and underserved market segment with growth opportunities
• Unique and long-standing strategic distribution relationships
• Financial strength and flexibility - strong balance sheet and conservative
reserving
reserving
• Experienced management team with deep knowledge of workers’
compensation insurance
compensation insurance
Focus on
Profitability
Profitability
· Target attractive, underserved small business market
· Maintain disciplined risk selection, underwriting and
pricing
pricing
Pursue
Organic
Growth
Opportunities
Organic
Growth
Opportunities
· Expand in current markets and in our new states
· Leverage infrastructure, technology and systems
· Utilize existing and new strategic distribution partners
Optimize
Capital
Structure
Capital
Structure
· Invest in operations and manage capital prudently
· Consider opportunistic strategic transactions
· Return capital to shareholders
4
Strategies
23%
Consideration /
Financing
Financing
· $12.50 per share, $194 million equity value, $230 million
including assumed debt
including assumed debt
· 100% cash consideration
· Expected financing sources: combination of debt and cash
Timing
· Announced 1/10/08
· Estimated closing: 2Q 2008
· Subject to regulatory approvals and AmCOMP shareholder vote
5
Acquisition of AmCOMP - Key Terms
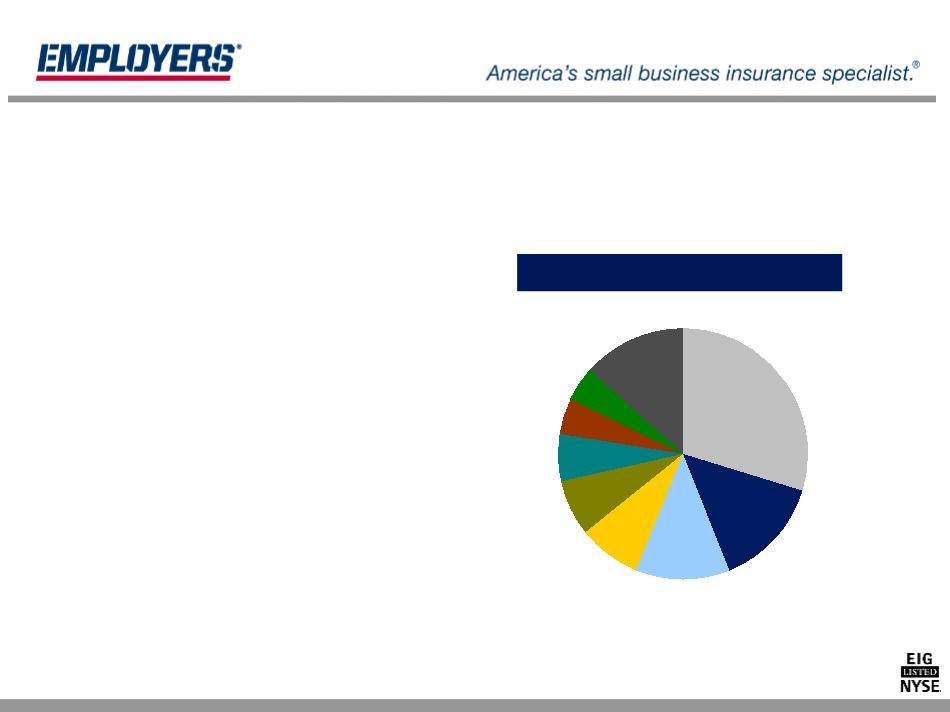
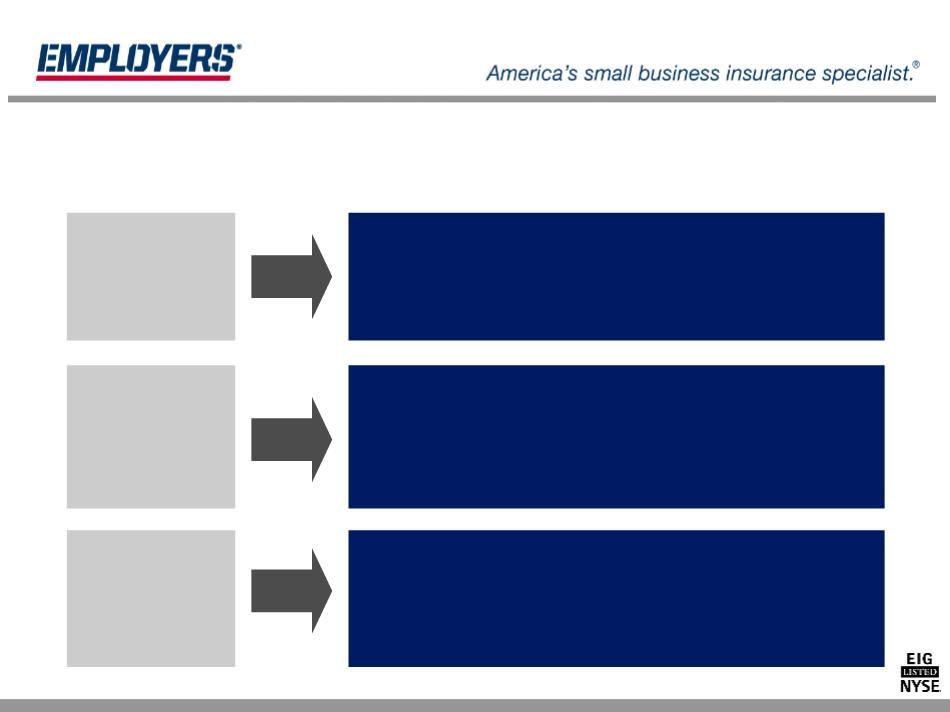
Acquisition of AmCOMP - Compelling Transaction
Written Premium by State: $175 M
AmCOMP % of Direct Premiums Written, 09/30/07
6
Wisconsin
Texas
Florida
Other
29%
13%
14%
8%
6%
7%
Indiana
Tennessee
Georgia
Kentucky
5%
13%
Illinois
5%
• Excellent strategic fit
– Mono-line workers’ compensation
company, disciplined underwriting, small
to mid-sized businesses
company, disciplined underwriting, small
to mid-sized businesses
• Immediate premium volume growth
– 18 states
– Average premium size $24,000 at
9/30/07
9/30/07
– Over 900 independent agencies
• Increased scale
– Diversified earnings base
• Meaningful synergies
– $10 million annual pre-tax cost savings
achievable by 2010
achievable by 2010
• Elimination of public company
expenses, systems integration,
lower reinsurance costs
expenses, systems integration,
lower reinsurance costs
• Financial benefits
– Efficient use of capital and debt capacity
– Accretive to EPS and ROE in first full
year
year
FL
NM
MD
TX
OK
KS
NE
SD
ND
MT
WY
CO
UT
ID
AZ
NV
WA
CA
OR
KY
ME
NY
PA
NH
MA
CT
VA
WV
OH
IN
IL
NC
TN
SC
AL
AR
LA
MO
IA
MN
GA
MS
VT
NJ
DE
RI
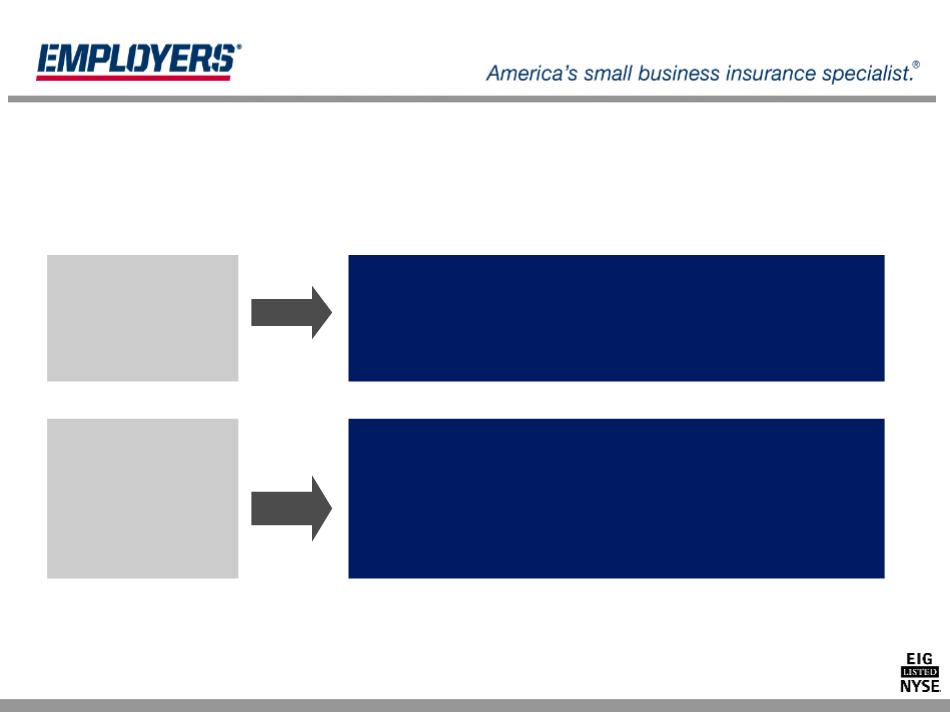
AmCOMP
EMPLOYERS
Overlap
Expands EMPLOYERS Geographic Footprint
Pro-Forma Rankings (1) | |
CA | 8 |
NV | 2 |
FL | 10 |
TX | 14 |
WI | 14 |
Total U.S. | 14 |
(1) By 2006 Direct Premiums Written for states, by 2006 Net Premiums Written for total U.S., A.M. Best
7
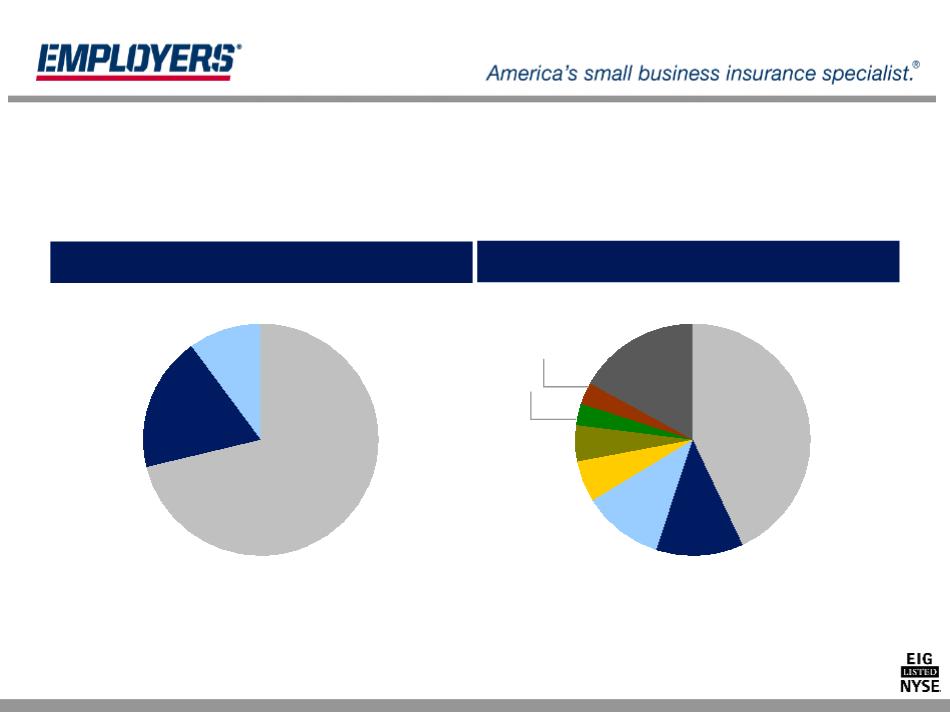
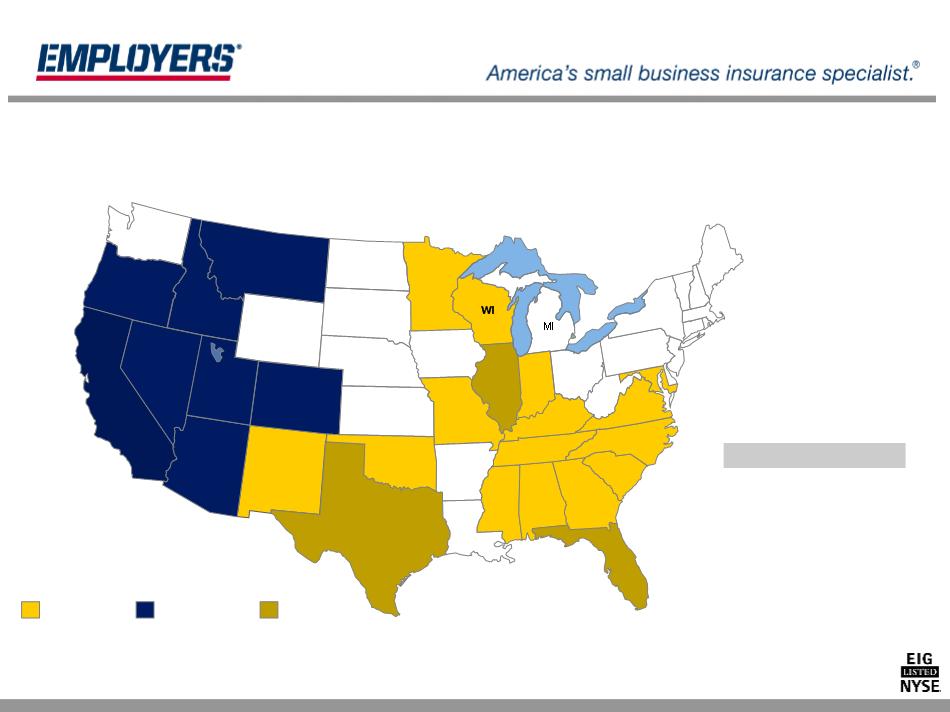
EMPLOYERS
EMPLOYERS + AmCOMP Pro Forma
% of Direct Premiums Written, 09/30/07
California
Indiana
3%
3%
Texas
Other
43%
12%
17%
11%
5%
6%
Wisconsin
Florida
Nevada
California
Nevada
Other
71%
19%
10%
Direct Premiums Written: $ 268 Million
Direct Premiums Written: $ 443 Million
Tennessee
3%
3%
8
Diversifies EMPLOYERS Geographic Footprint
Financial Results
Surplus of
$698 MM
$698 MM
Conservative
Reserving
Reserving
High Quality
Investment
Portfolio
Investment
Portfolio
Catastrophe
Reinsurance
Program
Reinsurance
Program
0.5:1 NPW / Surplus
at 12/31/07
at 12/31/07
Approximately 93%
fixed maturity with
average rating AA
fixed maturity with
average rating AA
Coverage up to
$200MM loss
$200MM loss
Track record of
reserve strength
reserve strength
10
Four Key Elements of Our Financial Strength
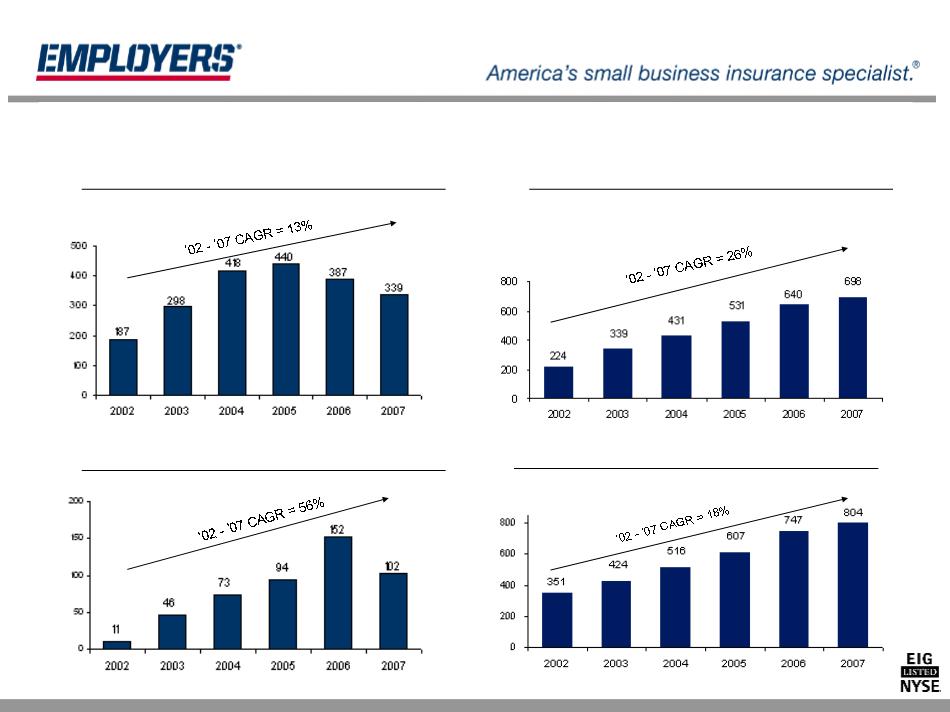
Net Premium Written (GAAP)
Net Income Before Loss Portfolio Transfer (LPT) (GAAP)
Equity Incl. Deferred Gain - LPT (GAAP)
Statutory Surplus
($ million)
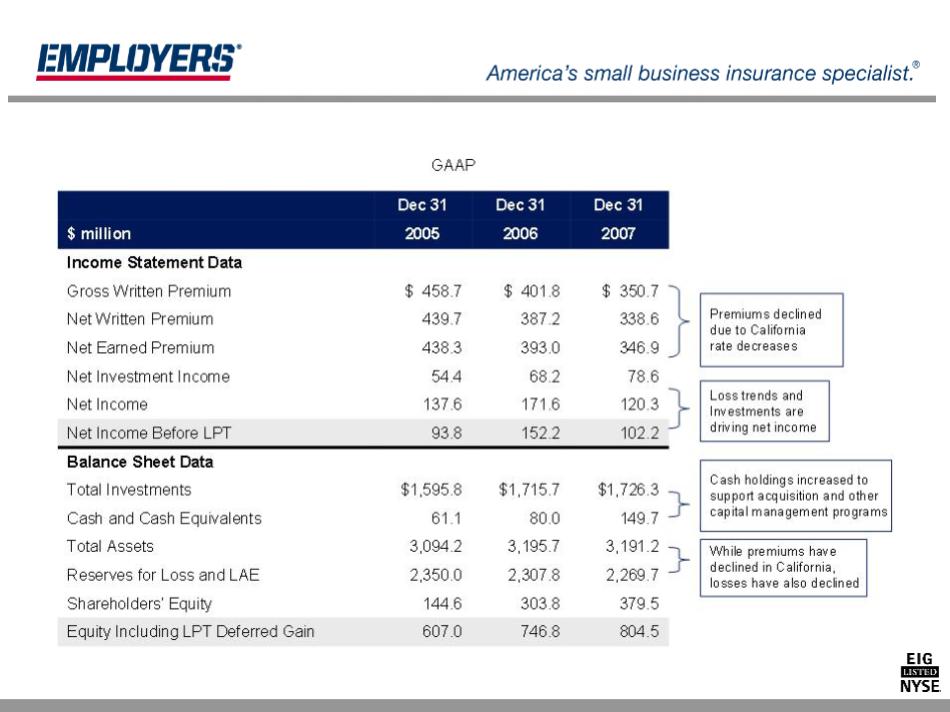
Premium growth has declined due to California rate
decreases
decreases
Strong growth provides a solid basis for underwriting
Loss trends and investments are driving net income
Capital management plans include dividends and share
repurchases
repurchases
11
Financial Snapshot
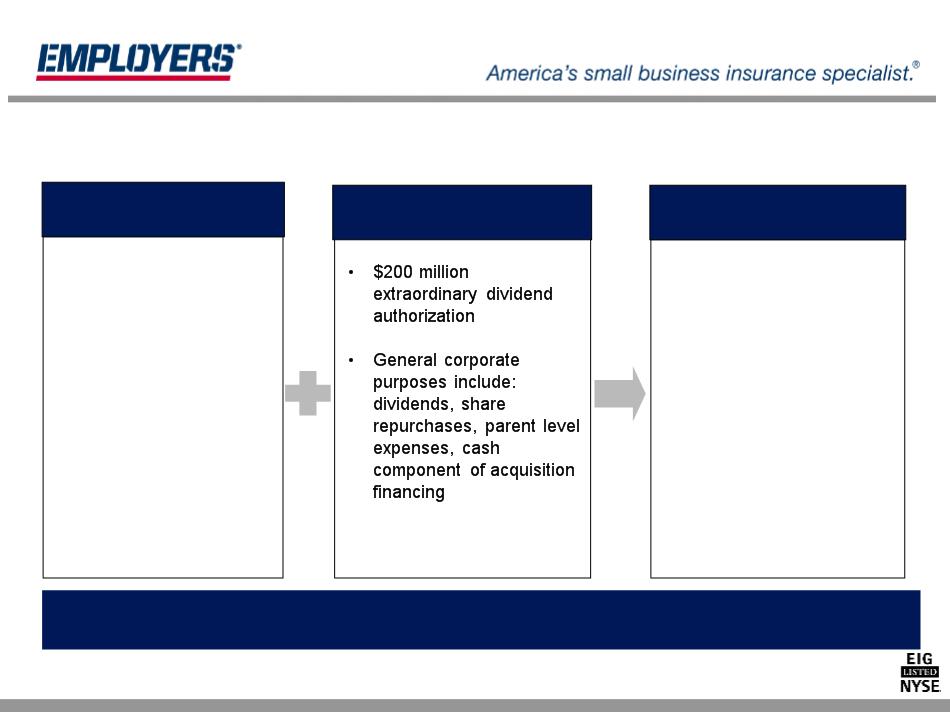
Holding Company
Cash Flow
Cash Flow
Strong Capital Position
• $804 million GAAP
adjusted equity at
12/31/07
adjusted equity at
12/31/07
• 0.5:1 NPW/surplus at
12/31/2007
12/31/2007
• No debt pre-acquisition
• Reserve strength
Our goal is to drive shareholder value through an improving ROE resulting from (i) profitability
consistent with historical results, (ii) disciplined growth and (iii) prudent capital management
consistent with historical results, (ii) disciplined growth and (iii) prudent capital management
Capital Management Tools
• Shareholder dividends
– $0.06 per share
quarterly dividend
quarterly dividend
– Four quarters for a
total of $12.3 million
total of $12.3 million
• Share repurchases
– Completed $75 million
on 10/17/2007,
3,911,272 total shares
on 10/17/2007,
3,911,272 total shares
– $100 million
authorized in February
2008, authorization
through June 30 2009
authorized in February
2008, authorization
through June 30 2009
12
Capital Management
Summary
14
Summary
• Established enterprise with 95 year operating history
• Focused operations and disciplined underwriting - target an attractive and
underserved market segment with growth opportunities
underserved market segment with growth opportunities
• Pending acquisition - when closed, immediate growth in premium
• Unique and long-standing strategic distribution relationships
• Financial strength and flexibility - strong balance sheet and conservative reserving
• Experienced management team with deep knowledge of workers’
compensation
compensation
Appendix

46.5% statutory loss and LAE ratio as of 12/31/07
Risk Selection
Expertise
Strong
Underwriting
Culture
Focused
Guidelines and
Consistent
Automated
Approach
Disciplined
Underwriting
Local Knowledge
Pricing of
Individual Risks
Five Basic Elements
16
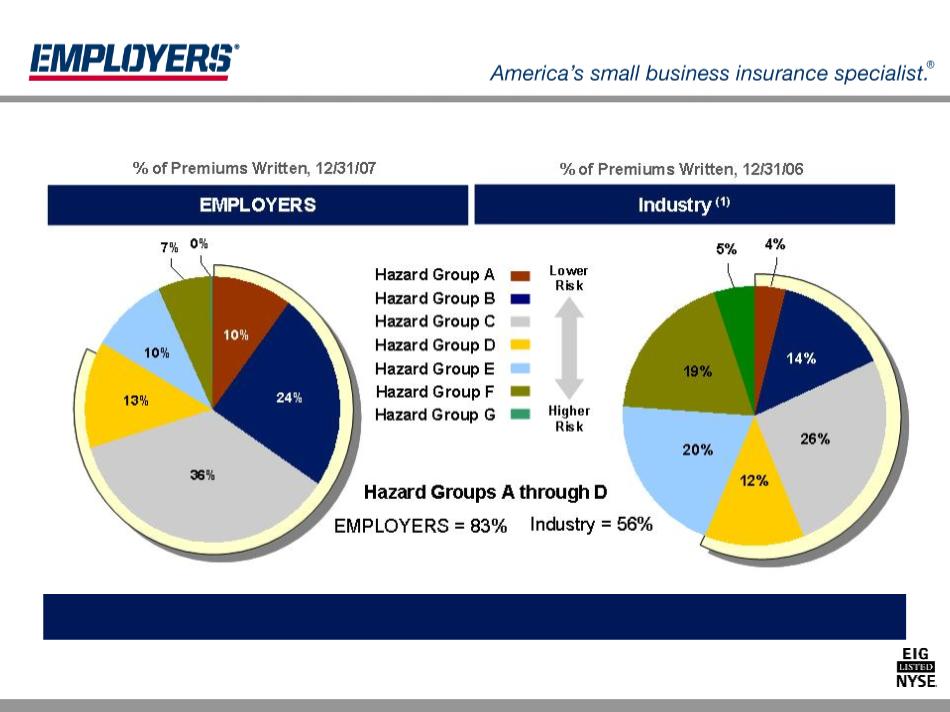
Disciplined Underwriting
17
(1) NCCI 2006 Premium Distribution by Hazard Group (as presented at 2007 Annual Issues Symposium).
Our top ten classes are in the lowest four hazard groups and represent 33% of direct premium
written and 42% of in force policies at 12/31/07
written and 42% of in force policies at 12/31/07
Focus on Low to Medium Hazard Groups
• Largest payroll services company in
the U.S. with over 450,000 clients
the U.S. with over 450,000 clients
• Partner since entering California
market in 2002
market in 2002
• Business originated by ADP’s field
sales staff and insurance agency
sales staff and insurance agency
• “Pay-by-Pay” premium collection
Strategic partners expand market reach and produce business with high persistency
• Largest group health carrier in
California
California
• Partner since entering California
market in 2002
market in 2002
• Business originated by
Wellpoint’s health insurance
agents
Wellpoint’s health insurance
agents
• Single bill to customers
E-chx, Inc.
• Since Q 4 2006
• Specialty provider of
payroll services
payroll services
Intego Insurance
Services, LLC
Services, LLC
• Since Q 4 2007
• Provider of insurance
software services
software services
18
Strategic Distribution Partners
Contract | |
$ millions | |
Total Coverage | $2,000 |
Original Reserves Transferred | $1,525 |
Consideration | $ 775 |
Gain at 1/1/2000 | 750 |
Subsequent Reserve Adjustments | (147.5) |
Gain at 12/31/2007 | $602.5 |
Accounting at 12/31/07 | |
$ millions | |
Statutory Surplus Created | $602.5 |
Cumulative Amortization To Date | (177.5) |
GAAP: Deferred Reinsurance Gain - LPT Agreement | $425.0 |
19
Loss Portfolio Transfer (LPT)
• Non-recurring transaction with no ongoing cash benefits or charges to current operations
• Retroactive 100% quota share reinsurance coverage for all losses occurring prior to 7/1/95
• Gain on transaction booked as statutory surplus; deferred and amortized under GAAP
20
Selected Operating Results
21
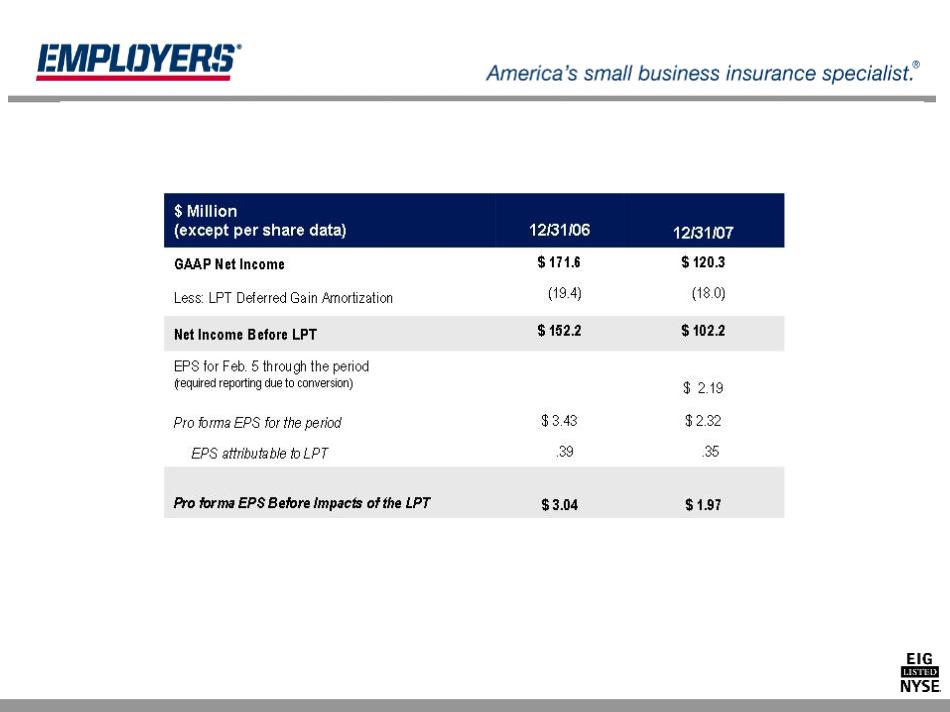
(1) Pro Forma EPS for 2006 assumes 50,000,002 shares outstanding before the conversion.
(2) Pro forma basic and diluted EPS computed using the weighted average shares outstanding during the period after the Company’s IPO and assumes the
50,000,002 shares outstanding prior to the IPO.
50,000,002 shares outstanding prior to the IPO.
(3) Basic EPS and Diluted EPS round to the same amount for the periods.
(4) EPS before the impact of the LPT for the period February 5 through December 31, 2007 has not been calculated.
NOTES:
Earnings and EPS
NOTE: Excluding $60.0 million of favorable development in 2007, our loss ratio before LPT would have been 63.8% and our combined
ratio would have been 102.9% We target a combined ratio of 100. The total combined ratio includes three items causing upward pressure:
(1) one shock loss requiring additional reserves; (2) one-time conversion costs; and (3) decreasing earned premium.
ratio would have been 102.9% We target a combined ratio of 100. The total combined ratio includes three items causing upward pressure:
(1) one shock loss requiring additional reserves; (2) one-time conversion costs; and (3) decreasing earned premium.
_____________________________________________________
Total deferred gain amortization and LPT reserve adjustment of $43.8 million in 2005, $19.4 million in 2006, and $18 million in 2007.
Our recent expense ratios are largely a function of falling California rates.
Net of $1.6 million commutation in the third quarter.
COMBINED RATIO (GAAP and excluding the LPT) | December 31 2005 | December 31 2006 | December 31 2007 |
Loss and LAE Ratio | 48.3% | 33.0% | 41.3% |
Less: Impact of LPT | 10.0% | 4.9% | 5.2% |
Loss and LAE Ratio (excluding LPT) | 58.3% | 37.9% | 46.5% |
Commission Expense Ratio | 10.7% | 12.3% | 12.8% |
Underwriting and Other Expense Ratio | 16.0% | 22.3% | 26.3% |
Combined Ratio (excluding LPT) | 84.9% | 72.6% | 85.6% |
Favorable Reserve Development ($ million) | $78.1 | $107.1 | $60.0 (3) |
(1)
(2)
(2)
(2)
(1)
GAAP
(3)
22
Underwriting Profitability
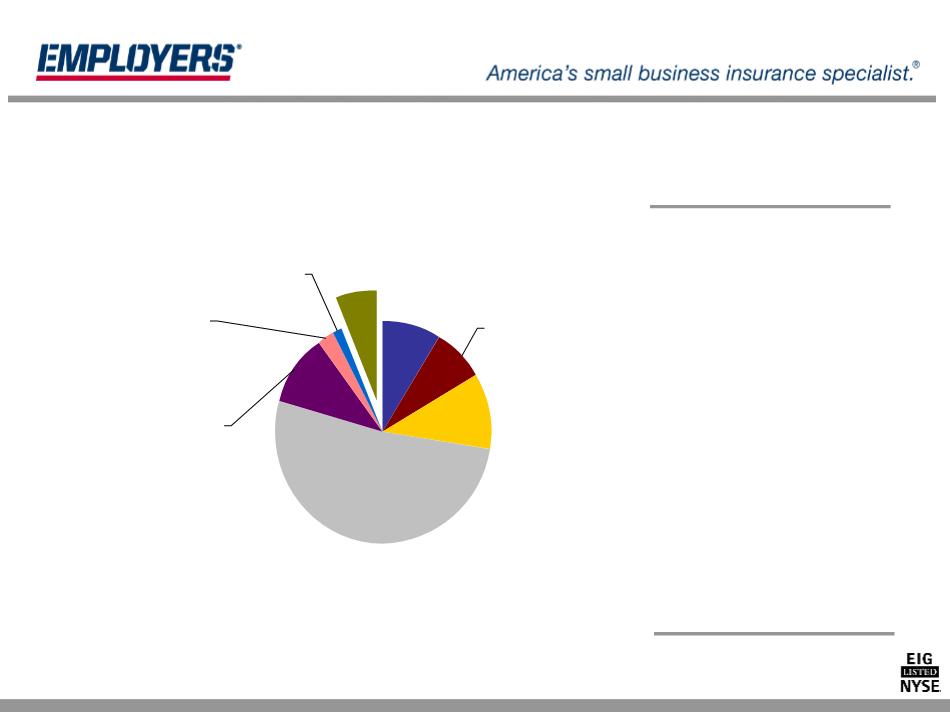
Portfolio Mix at 12/31/07
23
U.S. Treasury
Securities
9.0%
Corporate
Securities
10.8%
U.S. Agency
Securities
7.7%
Tax-exempt
Municipal
Securities
51.9%
Mortgage-backed
Securities
10.5%
Commercial
Mortgage-backed
Securities
2.7%
Asset-backed
Securities
1.2%
Equities
6.2%
• $1.7 billion of investment
securities
securities
- Less than .03% related to
sub-prime
- Less than 6% related to
financials
• Approximately 90% AA rated
• Book yield of 4.37%
• Tax equivalent book yield of
5.37%
5.37%
• Effective duration of 5.82
• Outsourced to Conning Asset
Management
Management
Investment Portfolio
Analyst Contact:
Vicki Erickson
Vice President, Investor Relations
Employers Holdings, Inc.
(775) 327-2794
verickson@employers.com
Vicki Erickson
Vice President, Investor Relations
Employers Holdings, Inc.
(775) 327-2794
verickson@employers.com
9790 Gateway Drive
Reno, NV. 89521-5906
(775) 327-2700
Reno, NV. 89521-5906
(775) 327-2700
Douglas D. Dirks
President & Chief Executive Officer
Employers Holdings, Inc.
William E. (Ric) Yocke
Chief Financial Officer
Employers Holdings, Inc.
President & Chief Executive Officer
Employers Holdings, Inc.
William E. (Ric) Yocke
Chief Financial Officer
Employers Holdings, Inc.