UNITED STATES
SECURITIES AND EXCHANGE COMMISSION
Washington, D.C. 20549
FORM N-CSR
CERTIFIED SHAREHOLDER REPORT OF REGISTERED
MANAGEMENT INVESTMENT COMPANIES
Investment Company Act file number: | 333-134096 |
|
Alpine Total Dynamic Dividend Fund |
(Exact name of registrant as specified in charter) |
|
2500 Westchester Avenue, Suite 215, Purchase, NY | | 10577 |
(Address of principal executive offices) | | (Zip code) |
|
Alpine Woods Capital Investors, LLC 2500 Westchester Avenue, Suite 215 Purchase, New York, 10577 |
(Name and address of agent for service) |
|
Registrant’s telephone number, including area code: | (914) 251-0880 | |
|
Date of fiscal year end: | October 31 | |
|
Date of reporting period: | April 30, 2007 | |
| | | | | | | | |
Form N-CSR is to be used by management investment companies to file reports with the Commission not later than 10 days after the transmission to stockholders of any report that is required to be transmitted to stockholders under Rule 30e-1 under the Investment Company Act of 1940 (17 CFR 270.30e-1). The Commission may use the information provided on Form N-CSR in its regulatory, disclosure review, inspection, and policymaking roles.
A registrant is required to disclose the information specified by Form N-CSR, and the Commission will make this information public. A registrant is not required to respond to the collection of information contained in Form N-CSR unless the Form displays a currently valid Office of Management and Budget (“OMB”) control number. Please direct comments concerning the accuracy of the information collection burden estimate and any suggestions for reducing the burden to Secretary, Securities and Exchange Commission, 450 Fifth Street, NW, Washington, DC 20549-0609. The OMB has reviewed this collection of information under the clearance requirements of 44 U.S.C. ss. 3507.
Item 1. Reports to Stockholders.

Alpine
Experience
Performance
Innovation
Shareholder & Investor Information
1(800) 617.7616 | www.alpinecef.com

| TABLE OF CONTENTS |
Manager Commentary | 1 |
| |
Schedule of Portfolio Investments | 6 |
| |
Statement of Assets and Liabilities | 9 |
| |
Statement of Operations | 10 |
| |
Statement of Changes in Net Assets | 11 |
| |
Financial Highlights | 12 |
| |
Notes to Financial Statements | 13 |
| |
Additional Information | 15 |

| MANAGER COMMENTARY April 30, 2007 |
We are pleased to report that the Alpine Total Dynamic Dividend Fund (AOD) is off to a strong start since it began trading on the NYSE on January 26th, 2007. While we only have a short performance history, we believe AOD is on track toward achieving the investment goals that we pledged to our investors. The Fund’s primary objective is high current dividend income that is not restricted to tax-qualified dividend distributions, while also focusing on long-term growth of capital. In addition, we seek to provide global diversification and flexibility, with the potential for up to 100% our holdings to be in international companies.
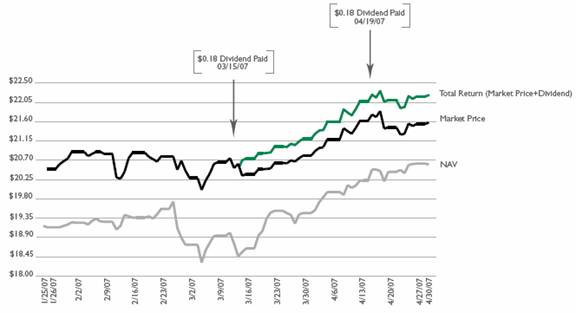
AOD Has Traded at an Average 7.63% Premium to its Nav Since Inception, Reflecting its Strong Dividend Yield and Total Return Potential
AOD began trading on January 26, 2007 at $20 per share and closed on April 30, 2007 at $21.58, providing a total return including dividends of 7.17%. This compares to the total return for the S&P 500 Index of 3.54% during that same time period. AOD’s NAV on January 26th was $19.06 per share and closed on 4/30/07 at $20.44, representing a total return of 9.12% during that 94 day time period which includes two dividend payments of $0.18 each in March and April.
AOD’s price of $21.58 on April 30, 2007 represented a 5.58% premium above the closing NAV of $20.44. Since inception, AOD has traded at an average premium of 7.63% above its NAV and has never closed below its $20 IPO price.
AOD Declared its Initial Monthly Dividend Distribution of $0.18 Per Share In February
AOD declared its first dividend payment of $0.18 per share per month or $2.16 per share annualized, on February 15, 2007. This represents an annualized dividend yield of 10.80% on the IPO price of $20. The monthly dividend was declared through August, 2007 and reflects our confidence in the visibility of attractive dividend payouts throughout 2007.
Many International Markets Offer Dividend Yields that are Significantly Higher than the S&p 500 Yield
We believe that AOD is well positioned to take advantage of the attractive dividend opportunities that are available outside of the U.S. As of April 30, 2007, AOD had invested 60.50% of the market value of its portfolio in international companies and 27.40% of its market value in domestic U.S. companies, with the remaining 12.10% in cash and short term equivalents.
Shortly after AOD’s inception, the global equity markets had a short term correction that began in late February. For example, the S&P 500 Index declined 5.90% from a high on February 20, 2007 of 1,459.7 to 1,374.1 on March 5, 2007. The Index did not return to the February levels until April 16, 2007. We took advantage of the market weakness by investing the funds raised in AOD’s IPO at more attractive entry points, but we still were left with a cash position of 12% which is higher than the level we intend under normal circumstances. We have since continued to invest our cash to earn dividends.
AOD is currently invested in equities based in 18 different countries, all of which are considered mature countries and not emerging markets. Following the United States, the countries in which we invest the greatest percentage of AOD’s assets are Great Britain, Sweden, Finland, Italy and Switzerland. The average dividend yield for the major indices in these five countries is currently 3.5% which is almost double the yield on the S&P 500 Index of 1.8%.
AOD’s Unique Investment Approach Combines Four Sub-strategies: Dividend Capture, Special Dividend, Value, and Growth
We believe AOD offers a unique and balanced approach to optimizing both dividend income and long-term growth of capital while offering investors diversification through international equity exposure. We scan the globe seeking for the best dividend opportunities for our investors, employing a multi-cap, multi-sector, and multi-style investment approach. The Fund combines four research-driven investment strategies – Dividend Capture, Special Dividend, Value, and Growth –to maximize the amount of earned dividend income and to identify companies globally with the potential for dividend increases and capital appreciation.
In addition, AOD is different from many other closed-end funds in that it does not utilize covered calls or managed distribution to achieve its objectives. All of AOD’s dividend income is earned income. Management does, however, have the flexibility to leverage up to 33% of the Fund’s value if we believe there are extraordinary opportunities for either dividend capture or capital appreciation. However, on an ongoing basis we do not expect to use a meaningful amount of leverage as reflected in our current large cash position
Our “Dividend Capture Strategy” and “Special Dividend Strategy” Enhances the Dividend Income Generated by the Fund
We run a portion of our portfolio with a dividend capture strategy and special dividend strategy, where we invest in typically high dividend yielding stocks or in special situations where large cash balances are being returned to shareholders as one-time special dividends. We enhance the return of this portfolio by electively rotating a portion of our high yielding holdings after the 61-day ownership period required to obtain the 15% dividend tax rate.
Three of our top 10 holdings as of April 30, 2007 were international companies that announced large special dividends payments associated with restructurings or excess cash or both, and we believe there is additional upside value to be realized following the dividend payments. Our largest holding as of April 30, 2007 was Atlas Copco AB. Based in Sweden, Atlas is the world’s largest maker of air compressors and construction and mining equipment such as rock drills and underground vehicles. The company has benefited as higher metal prices and global economic growth spurred demand for its equipment and services. Atlas is committed to returning excess cash to shareholders with its regular annual 2.2% dividend paid in April plus the company paid a special dividend in May 2007.
Another top 10 holding is Altana AG, based in Germany. The company paid a special dividend following the sale of its pharmaceuticals division and is now a pure-play niche chemical maker of products in the electronics industry, including
1(800) 617.7616 | Semi-Annual Report April 30, 2007 | |
www.alpinecef.com | |
1
pigments, coatings, paint additives and electrical insulation. In addition, Cairn Energy is a UK-based oil and gas exploration company that returned about 20% of its market capitalization to shareholders following the proceeds received from the IPO of its subsidiary, Cairn India.
Our “Value/restructuring Strategy” Looks for Attractively Valued or Restructuring Dividend Payers
Our second major strategy is what we call “value with a catalyst or restructuring strategy”, where our internal research identifies under-valued or mis-priced equity opportunities for companies with attractive dividend yields. We also look for turnaround situations or depressed earnings where we believe there is a catalyst for an earnings recovery or a restructuring or major corporate action that is expected to add value. The key characteristic for this strategy is low valuation relative to historical averages and above average dividend yields for the combined result of capital appreciation and high qualified dividend income.
We would categorize four of our top holdings in this category, with two being in the financial services sector and two being energy companies. First, UBS and Allianz are plays on one of our favorite global investment themes, which is aging demographics and the need for asset management as older and wealthier populations save more.
Based in Switzerland, UBS is one of the world’s largest wealth managers and provider of financial services, with assets under management growing by over 10% per year in recent years. Plus, investment banking income is benefiting from strong global merger and acquisition activity and strong performance in its fixed income division. UBS currently has a 2.1% dividend yield and we expect it will increase its payout next year. Allianz is a German financial supermarket that offers insurance, banking and asset management and also provides a 2% dividend yield. Their life insurance and asset management businesses are benefiting from the aging population and they are pursuing cross selling opportunities amongst their diverse customer base for additional earnings growth.
In the energy sector, two of our top 10 holdings are well positioned take advantage of our positive long term outlook for oil and oil services. First, Diamond Offshore Drilling is one of the largest operators of mid-deepwater rigs and experiencing strong demand for its services as oil is getting harder to find and exploration is moving further out to sea. This is resulting in substantial increases on rates for its long term contracts and the expectation of a doubling of earnings in the next two-three years, which we do not believe is reflected in its current valuation. Diamond Offshore is generating significant free cash flows and has been returning it to shareholders as annual special dividends, having paid a special dividend in February of 2007. We would expect another large cash return in early 2008 as the company is committed to paying out about 80% of earnings as dividends.
We also believe that Statoil ASA offers attractive valuations relative to its future earnings outlook. The company is well positioned as an integrated oil and gas company that operates drilling rigs in the North Sea, refineries in northern Europe, and retails gasoline in Scandinavia. Like Diamond Offshore, the company has an annual dividend yield of about 2.3% and also has returned excess cash to shareholders over the past few years.
Our “Growth and Income Strategy” Targets Capital Appreciation in Addition to Yield
Our third strategy identifies core growth and income stocks that may have slightly lower but still attractive current dividend yields and predictable earnings streams plus a catalyst for capital appreciation and dividend increases. We would categorize three of our top ten holdings in this category: Nokia; LVMH; and Sandvik. Each company is forecasted to grow consensus earnings by 10-20% annually and each has been consistently raising its dividend every year in recent years.
Nokia offers very attractive growth prospects plus a 2% dividend yield. The company is the most dominant producer of cell phones in the world and controls more than half of the market in emerging markets such as India and China where mobile penetration is growing rapidly.
LVMH Moet Hennesy Louis Vuitton provides a 1.7% divided yield and is well positioned as one of the world’s leading provider of luxury goods. Their elite range of perfume, jewelry, champagne, haute couture and luggage is enjoying strong demand in emerging markets and existing mature markets. Luxury products are our preferred consumer exposure as their customer base is less sensitive than the lower end consumers to current macro economic challenges associated with rising gasoline prices, short term interest rates, and the slowdown in housing.
Sandvik, based in Sweden, produces tools for industrial and mining companies and currently pays a 2.5% dividend yield. The company is benefiting from strong demand from mining and emerging market industrial companies as well as an uptick in the European industrial investment cycle.
Outlook For 2007: We Believe Domestic and International Dividend Payers Will Outperform
As we look out to the remainder of 2007, we continue to be optimistic about the prospect for the dividend paying stocks in our portfolio. While we need to be selective in our investments in a potentially slowing U.S. economy, we are encouraged by the growth opportunities in our international dividend paying markets. We believe investments outside the U.S. look even more attractive based on the outlook for stronger earnings growth, higher dividend payouts, and our belief of a long term secular decline in the U.S. dollar.
Recently, equity markets have been volatile as bond yields shot up on signs of stronger than expected U.S. economic data, commentary by U.S. Federal Reserve governors about inflationary pressures, and increases in interest rates internationally. This recent volatility has caused us to be a bit more defensive, with about 12% of the portfolio being held in cash as of April 30th versus our expected average of less than 5%. In addition, our portfolio, which is about 60% invested in international stocks, has been negatively impacted by the recent rise in the U.S. dollar, particularly against the Euro, which declined 2.5% to 1.3303 on June 12th after peaking on April 27th at 1.3651.
2
Through this uncertain period in the markets, we continue to believe that there exists substantial opportunity for our investors to benefit from interesting growth opportunities and attractive dividend yields, particularly overseas. We are committed to our fundamental research approach and look for companies both domestically and internationally with sustainable earnings growth and compelling valuations in a rising global interest rate environment, and we continue to find attractive investment prospects.
In addition, many companies are sitting on high levels of cash. As expected, we have seen a record of merger and acquisition activity in 2006 and early 2007 as companies look to use some of their excess cash to supplement slowing organic growth and to expand globally. However, we still expect a substantial amount of cash will be returned to shareholders in 2007 and 2008 either in the form of share repurchases or increased dividend payouts. Companies in the S&P 500 index currently payout approximately 37% of their earnings in the form of dividends versus a long term historical average of 54%. Given large cash positions, still solid earnings potential, low payout ratios and lack of other uses of cash, we continue to believe that companies will increase their dividends in 2007 and beyond.
We continue to concentrate on opportunities in long term secular themes on the aging demographics of the world, with some of our favorite sectors being asset managers and financial services and niche healthcare. The aging population will need to save more and also manage their assets more directly as countries and companies have cut back significantly on their pension promises. We believe this is very positive for the asset managers around the globe. In addition, we like niche healthcare which is being stimulated by demographic trends and advances in biotechnology and yet there is limited generic risk.
We also are very bullish on global engineering and construction stocks, as the rest of the world tries to catch up with the industrialized countries with regards to power plants, phones, roads, electricity, water treatment, sewage, and airports. In addition, the industrialized nations of the world have neglected their aging infrastructure and are now rebuilding and reinvesting. Therefore, some of our favorite stocks are the companies that will supply this growth for what we believe will be many years to come and at much higher prices than achieved in the past.
We also still like the long term secular story for many commodities in the basic materials and energy sectors based also on constrained supply and growing global demand. We will continue to be nimble in these volatile yet potentially highly profitable sectors and we would look for attractive entry and exit points and we are aware of the impact of shorter term seasonal trading pattern. In addition, many of these companies are producing record amounts of free cash flow and we expect continued increases in regular and special dividend payouts.
We also favor the industrial and machinery companies that are supplying the commodity providers and the aerospace and defense sectors. We also participate in a variation on investing in commodity companies, and that is through increasing global trade. We look to participate in the increasing need for the movement of commodities globally through producers, financers, and operators in the shipping industry.
In summary, in a moderate growth environment, we believe investors will be drawn to high quality, internationally oriented, and more defensive stocks and that should bode well for dividend payers and our fundamental strategy of investing globally and in multiple capitalization levels and sectors. These positive fundamentals will be balanced with the risks of high oil prices, rising global interest rates, uncertain global economic growth and continued geopolitical uncertainties.
Our approach is to remain broadly diversified within the dividend-paying universe while actively seeking undervalued opportunities. We believe we will continue to be able to distribute attractive dividend payouts to our shareholders by capitalizing on our research driven approach to identifying attractive situations as well as through our active management of the portfolio.
Thank you for your participation and we look forward to a prosperous year.
Sincerely,
Jill K. Evans & Kevin Shacknofsky
Co-Portfolio Managers
3
PERFORMANCE (1) AS OF APRIL 30, 2007
| | EndingValue
as of 10/31/06 | | One
Month | | Three
Month | | Since
Inception (2) | |
AlpineTotal Dynamic Dividend Fund | NAV | | $ | 20.44 | | 6.40 | % | 8.78 | % | 9.12 | % |
AlpineTotal Dynamic Dividend Fund | Market Price | | $ | 21.58 | | 4.61 | % | 5.93 | % | 7.17 | % |
S&P 500 | | | | 4.43 | % | 3.54 | % | 3.54 | % |
(1) | | Performance information calculated after consideration of dividend reinvestment. All returns for periods of less than one year are not annualized. |
(2) | | Commenced operations on January 26, 2007 |
(3) | | IPO price of $20 used in calculating performance information |
PORTFOLIO DISTRIBUTIONS *

TOP TEN HOLDINGS *
Atlas Copco AB | | 2.3 | % |
Nokia Oyj. | | 2.2 | % |
Altana AG | | 2.1 | % |
Allianz SE | | 2.0 | % |
UBS AG -Registered | | 2.0 | % |
LVMH Moet Hennessy Louis Vuitton SA | | 1.8 | % |
Sandvik AB | | 1.8 | % |
Cairn Energy Plc. | | 1.7 | % |
Diamond Offshore Drilling, Inc. | | 1.7 | % |
Statoil ASA | | 1.7 | % |
Top 10 Holdings | | 19.3 | % |
* As a percentage of portfolio value
4
REGIONAL ALLOCATION*
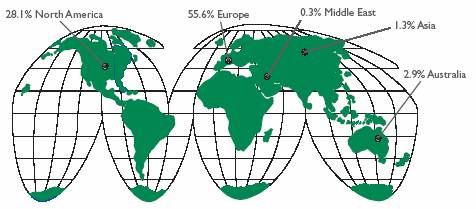
Top Five Countries
United States | | 27.4 | % |
Great Britian | | 12.7 | % |
Sweden | | 11.4 | % |
Finland | | 5.5 | % |
Italy | | 4.4 | % |
* As a percentage of net assets, excluding any short-term investments.
NAV, MARKET PRICE, AND TOTAL RETURN [ SINCE INCEPTION ]
5

| SCHEDULE OF PORTFOLIO INVESTMENTS |
April 30, 2007 (Unaudited) |
|
Description | | Shares | | Value | |
| | | | | |
COMMON STOCKS (87.9%) | | | | | |
Australia (2.9%) | | | | | |
AMP Ltd. | | 1,900,000 | | $ | 16,964,004 | |
AXA Asia Pacific Holdings Ltd. | | 4,500,000 | | 27,619,973 | |
Boart Longyear Group * | | 7,700,000 | | 12,342,818 | |
Macquarie Bank Ltd. | | 400,000 | | 28,903,174 | |
Minara Resources Ltd. | | 830,000 | | 5,121,925 | |
Suncorp-Metway Ltd. | | 1 | | 12 | |
Zinifex Ltd. | | 2,000,000 | | 27,491,238 | |
| | | | 118,443,144 | |
| | | | | |
Canada (0.7%) | | | | | |
Biovail Corp. | | 1,125,000 | | 27,438,750 | |
| | | | | |
Denmark (1.3%) | | | | | |
Danske Bank AS * | | 140,000 | | 6,589,744 | |
FLSmidth & Co.AS | | 258,100 | | 19,712,033 | |
GN Store Nord * | | 2,425,000 | | 27,980,769 | |
| | | | 54,282,546 | |
| | | | | |
Finland (5.5%) | | | | | |
Elisa Oyj. | | 310,741 | | 9,104,394 | |
Fortum Oyj. | | 1,718,530 | | 53,587,536 | |
Metso Oyj. | | 600,000 | | 33,177,309 | |
Nokia Oyj. (1) | | 3,600,000 | | 90,900,000 | |
Sampo Oyj. | | 1,250,000 | | 39,165,382 | |
| | | | 225,934,621 | |
| | | | | |
France (3.4%) | | | | | |
BNP Paribas | | 210,000 | | 24,545,231 | |
LVMH Moet Hennessy Louis Vuitton SA * | | 650,000 | | 76,257,181 | |
Vinci SA * | | 250,000 | | 40,444,739 | |
| | | | 141,247,151 | |
| | | | | |
Germany (4.2%) | | | | | |
Allianz SE | | 370,000 | | 84,220,581 | |
Altana AG | | 1,195,256 | | 88,813,561 | |
| | | | 173,034,142 | |
| | | | | |
Great Britain (12.7%) | | | | | |
Antofagasta Plc. * | | 2,590,000 | | 27,838,046 | |
Barclays Plc. | | 4,100,000 | | 59,645,457 | |
Cairn Energy Plc. | | 2,073,967 | | 70,337,713 | |
Cairn Energy Plc. - Class B * | | 2,552,575 | | — | |
Close Brothers Group Plc. | | 1,200,940 | | 23,486,628 | |
Drax Group Plc. | | 3,339,809 | | 53,228,046 | |
Intercontinental Hotels Group Plc. | | 2,021,857 | | 49,163,696 | |
Kelda Group Plc. | | 3,618,224 | | 67,432,906 | |
Legal & General Group Plc. | | 10,000,000 | | 30,935,050 | |
Rank Group Plc. | | 10,267,476 | | 41,012,007 | |
Smiths Group Plc. | | 1,893,379 | | 41,079,751 | |
Tullett Prebon Plc. * | | 2,190,000 | | 22,137,358 | |
United Business Media Plc. | | 2,456,627 | | 40,012,050 | |
| | | | 526,308,708 | |
| | | | | |
Greece (0.5%) | | | | | |
OPAP SA | | 600,000 | | $ | 22,844,198 | |
| | | | | |
Hong Kong (1.3%) | | | | | |
Esprit Holdings Ltd. | | 2,500,000 | | 30,521,323 | |
Hutchison Telecommuncations International Ltd.* (1) | | 2,021,857 | | 24,020,031 | |
| | | | 54,541,354 | |
| | | | | |
Ireland (2.7%) | | | | | |
Anglo Irish Bank Corp. Plc. | | 1,870,000 | | 42,284,829 | |
C&C Group Plc. | | 4,040,000 | | 68,418,510 | |
| | | | 110,703,339 | |
| | | | | |
Israel (0.3%) | | | | | |
Bank Leumi Le-Israel BM | | 2,843,100 | | 10,761,299 | |
| | | | | |
Italy (4.4%) | | | | | |
Azimut Holding S.p.A | | 1,759,000 | | 28,420,912 | |
Banca Popolare Italiana Scrl * | | 690,000 | | 11,581,763 | |
Fiat S.p.A. * | | 1,600,000 | | 46,267,007 | |
Finmeccanica S.p.A | | 991,000 | | 30,698,699 | |
Intesa Sanpaolo S.p.A. | | 8,000,000 | | 67,468,170 | |
| | | | 184,436,551 | |
| | | | | |
Malta (0.3%) | | | | | |
Unibet Group Plc. | | 400,000 | | 13,253,633 | |
| | | | | |
Netherlands (0.5%) | | | | | |
Nutreco Holding NV | | 254,000 | | 18,859,619 | |
| | | | | |
Norway (4.0%) | | | | | |
Aker Kvaerner ASA | | 2,297,450 | | 54,736,127 | |
Aker Yards ASA | | 1,305,000 | | 23,688,589 | |
Fred Olsen Energy ASA * | | 398,500 | | 19,959,494 | |
Statoil ASA | | 2,450,000 | | 69,488,798 | |
| | | | 167,873,008 | |
| | | | | |
Sweden (11.4%) | | | | | |
Atlas Copco AB | | 2,500,000 | | 96,267,938 | |
Boliden AB | | 2,700,000 | | 68,305,460 | |
Hennes & Mauritz AB | | 400,000 | | 26,656,518 | |
Sandvik AB | | 3,800,000 | | 73,589,003 | |
Scania AB | | 440,000 | | 42,357,893 | |
Skanska AB | | 1,840,150 | | 43,119,611 | |
SKF AB | | 3,000,000 | | 66,380,102 | |
TeliaSonera AB | | 3,096,000 | | 25,299,214 | |
Volvo AB (2) | | 1,800,000 | | 30,559,474 | |
| | | | 472,535,213 | |
| | | | | |
Switzerland (4.4%) | | | | | |
Nestle SA | | 140,000 | | 55,611,675 | |
Roche Holding AG | | 240,000 | | 45,347,133 | |
UBS AG - Registered | | 1,260,000 | | 82,574,208 | |
| | | | 183,533,016 | |
6
Description | | Shares | | Value | |
| | | | | |
United States (27.4%) | | | | | |
American Capital Strategies Ltd. | | 675,000 | | $ | 32,859,000 | |
AT&T, Inc. | | 230,000 | | 8,905,600 | |
Bank of America Corp. | | 515,000 | | 26,213,500 | |
Bristol-Myers Squibb Co. | | 540,000 | | 15,584,400 | |
Cambrex Corp. | | 200,000 | | 4,852,000 | |
Caterpillar, Inc. | | 150,000 | | 10,893,000 | |
CBS Corp. - Class B | | 525,600 | | 16,698,312 | |
Dean Foods Co. | | 1,200,000 | | 43,716,000 | |
Diamond Offshore Drilling, Inc. | | 817,000 | | 69,935,200 | |
Dominion Resources, Inc. | | 175,000 | | 15,960,000 | |
Dover Corp. | | 596,643 | | 28,710,461 | |
ENSCO International, Inc. | | 51,800 | | 2,920,484 | |
Fluor Corp. | | 425,000 | | 40,638,500 | |
Foot Locker, Inc. | | 575,400 | | 13,688,766 | |
Fortress Investment Group LLC | | 700,000 | | 20,307,000 | |
GateHouse Media, Inc. | | 515,000 | | 10,500,850 | |
GlobalSantaFe Corp. | | 225,000 | | 14,384,250 | |
Health Management Associates, Inc. - Class A | | 2,634,600 | | 28,163,874 | |
Johnson & Johnson | | 560,000 | | 35,963,200 | |
JPMorgan Chase & Co. | | 470,000 | | 24,487,000 | |
Lamar Advertising Co. | | 626,000 | | 37,772,840 | |
Macquarie Infrastructure Co.Trust | | 302,900 | | 12,897,482 | |
Merrill Lynch & Co. Inc | | 608,000 | | 54,859,840 | |
Morgan Stanley | | 350,000 | | 29,403,500 | |
Noble Corp. | | 722,000 | | 60,799,620 | |
PennantPark Investment Corp.* | | 1,400,000 | | 20,972,000 | |
PepsiCo, Inc. | | 800,000 | | 52,872,000 | |
Pharmaceutical Product Development, Inc. | | 829,000 | | 29,902,030 | |
PolyMedica Corp. | | 540,243 | | 21,847,427 | |
Procter & Gamble Co. | | 550,000 | | 35,370,500 | |
Regal Entertainment Group | | 1,456,300 | | 31,674,525 | |
Rowan Cos, Inc. | | 1,815,000 | | 66,501,600 | |
The Scotts Miracle-Gro Co. - Class A | | 608,124 | | 27,347,337 | |
Staples, Inc. | | 675,000 | | 16,740,000 | |
Textron, Inc. | | 253,615 | | 25,785,037 | |
United Technologies Corp. | | 425,000 | | 28,530,250 | |
US Bancorp | | 635,000 | | 21,812,250 | |
Verizon Communications, Inc. | | 245,000 | | 9,354,100 | |
VF Corp. | | 492,700 | | 43,263,987 | |
Wyeth | | 750,000 | | 41,625,000 | |
| | | | 1,134,712,722 | |
| | | | | |
TOTAL COMMON STOCKS
(Identified Cost $3,472,538,501) | | | | 3,640,743,014 | |
| | | | | | |
Description | | Maturity Date | | Shares | | Value | |
| | | | | | | |
EQUITY - LINKED STRUCTURED NOTES (0.3%) | | | | | | | |
Belgium (0.2%) | | | | | | | |
Morgan Stanley - KBC Groep* (4) | | 4/21/2008 | | 40,000 | | $ | 5,320,487 | |
| | | | | | | |
Germany (0.1%) | | | | | | | |
Morgan Stanley - E.ON AG* (4) | | 4/30/2008 | | 34,000 | | 5,142,292 | |
| | | | | | | |
TOTAL EQUITY - LINKED STRUCTURED NOTES
(Identified Cost $10,180,811) | | | | | | 10,462,779 | |
| | | | | | | | |
Description | | Maturity Date | | Prinicpal Amount | | Value | |
SHORT TERM INVESTMENTS (12.0%) | | | | | | | |
| | | | | | | |
Commercial Paper (4.7%) | | | | | | | |
BP Capital Markets | | 5/1/2007 | | 14,000,000 | | 14,000,000 | |
UBS Finance | | 5/1/2007 | | 180,000,000 | | 180,000,000 | |
| | | | | | | |
| | | | | | 194,000,000 | |
Money Market (7.3%) | | | | | | | |
Alpine Municipal Money Market Fund (3) | | | | 132,100,000 | | 132,100,000 | |
Credit Suisse Institutional Money Market Fund (3) | | | | 165,200,000 | | 165,200,000 | |
Morgan Stanley Money Market Fund (3) | | | | 6,502,984 | | 6,502,984 | |
| | | | | | | |
| | | | | | 303,802,984 | |
| | | | | | | |
TOTAL SHORT TERM INVESTMENTS
(Identified Cost $497,802,984) | | | | | | 497,802,984 | |
| | | | | | | |
TOTAL INVESTMENTS (100.2%)
(Identified Cost $3,980,522,296) | | | | | | 4,149,008,777 | |
| | | | | | | |
TOTAL LIABILITIES LESS OTHER ASSETS (-0.2%) | | | | | | (6,384,156 | ) |
| | | | | | | |
TOTAL NET ASSETS (100.0%) | | | | | | $ | 4,142,624,621 | |
| | | | | | | | |
* | | Non Income Producing Security |
(1) | | ADR - American Depository Receipt |
(2) | | Fair valued security under procedures established by the Fund’s Board of Directors. |
(3) | | Investments in other funds are calculated at their respective net asset value as determined by those funds, in accordance with the Investment Company Act of 1940. |
(4) | | Security exempt from registration under Rule 144A of the Securities Act of 1933. These securities may be resold in transactions exempt from registration, normally to qualified institutional buyers. These securities have been determined to be liquid in accordance with procedures adopted by the Fund’s Board. |
See Notes to Financial Statements
7
| | Maturity | | Units Per | | | | Currency Value | | Unrealized | |
Contract Description | | Date | | Contract | | | | In $USD | | Gain/(Loss) | |
| | | | | | | | | |
OUTSTANDING FORWARD CURRENCY EXCHANGE CONTRACTS, OPEN | | | | | | | | | |
| | | | | | | | | |
Contracts Purchased: | | | | | | | | | |
European Euro | | 5/2/07 | | 12,019,861 | (EUR) | | $ | 16,402,873 | | $ | (30,602 | ) |
Great Britain Pound Sterling | | 5/1/07 | | 10,692,012 | (GBP) | | 21,380,603 | | (3,421 | ) |
Great Britain Pound Sterling | | 5/2/07 | | 2,803,748 | (GBP) | | 5,606,600 | | (5,383 | ) |
| | | | | | 43,390,076 | | (39,406 | ) |
Contracts Sold: | | | | | | | | | |
Australian Dollar | | 5/1/07 | | 19,615,439 | (AUD) | | 16,291,622 | | (42,193 | ) |
Danish Krone | | 5/1/07 | | 37,354,693 | (DKK) | | 6,841,519 | | (13,756 | ) |
Danish Krone | | 5/2/07 | | 10,183,389 | (DKK) | | 1,865,089 | | — | |
Swedish Krone | | 5/2/07 | | 27,209,125 | (SEK) | | 4,061,033 | | (15,668 | ) |
Swedish Krone | | 5/3/07 | | 53,090,545 | (SEK) | | 7,923,903 | | 59 | |
| | | | | | 36,983,166 | | (71,558 | ) |
| | | | | | | | | | | | | |
See Notes to Financial Statements
8

| STATEMENT OF ASSETS AND LIABILITIES April 30, 2007 (Unaudited) |
ASSETS | | | |
| | | |
Investments, at value (1) | | $ | 4,149,008,777 | |
Receivable for fund shares reinvested | | 8,395,147 | |
Dividends receivable | | 26,960,109 | |
Interest receivable | | 557,044 | |
Receivable for investments sold | | 44,483,852 | |
Unrealized appreciation of forward currency contracts | | 59 | |
Total Assets | | 4,229,404,988 | |
| | | |
LIABILITIES | | | |
| | | |
Payable for investment securities purchased | | 76,756,748 | |
Unrealized depreciation of forward currency contracts | | 111,023 | |
Accrued expenses and other liabilities: | | | |
Investment advisory fees | | 3,334,957 | |
Administrative fees | | 433,544 | |
Offering cost | | 5,765,626 | |
Trustee fees | | 15,095 | |
Officer fees | | 26,027 | |
Other | | 337,347 | |
Total Liabilities | | 86,780,367 | |
| | | |
Net Assets | | $ | 4,142,624,621 | |
| | | |
NET ASSETS REPRESENTED BY | | | |
| | | |
Paid-in-capital | | $ | 3,866,234,186 | |
Undistributed net investment income | | 107,793,884 | |
Accumulated net realized loss on investments and foreign currency transactions | | (45,390 | ) |
Net unrealized appreciation on investments and foreign currency translations | | 168,641,941 | |
Total Net Assets | | $ | 4,142,624,621 | |
Net asset value | | | |
Net assets | | $ | 4,142,624,621 | |
Shares of beneficial interest issued and outstanding | | 202,695,487 | |
Net asset value per share | | $ | 20.44 | |
(1) Cost of Investments | | $ | 3,980,522,296 | |
See Notes to Financial Statements.
9
| STATEMENT OF OPERATIONS For the Period January 26, 2007 (Inception) to April 30, 2007 (Unaudited) |
INCOME | | | |
| | | |
Dividends* | | $ | 186,985,950 | |
Interest | | 5,880,491 | |
Total Income | | 192,866,441 | |
| | | |
EXPENSES | | | |
| | | |
Investment advisory fee | | 10,455,613 | |
Administrative fee | | 1,359,230 | |
Audit fees | | 10,930 | |
Custodian fees | | 253,197 | |
Officer fees | | 26,027 | |
Legal fees | | 26,027 | |
Printing fees | | 76,585 | |
Trustee fees | | 15,095 | |
Miscellaneous fees | | 114,390 | |
Total Expenses | | 12,337,094 | |
| | | |
Net Investment Income | | 180,529,347 | |
| | | |
REALIZED AND UNREALIZED GAIN/(LOSS) ON INVESTMENTS AND FOREIGN CURRENCY | | | |
| | | |
Net realized gain/(loss) on investments: | | | |
Securities transactions | | (17,459,202 | ) |
Foreign Currency transactions | | 17,413,812 | |
Net realized gain/(loss) on investments | | (45,390 | ) |
Change in unrealized appreciation of investments and foreign currency translations: | | | |
Investments | | 89,181,231 | |
Foreign currency translations | | 79,460,710 | |
Net unrealized appreciation of investments | | 168,641,941 | |
Net realized/unrealized gain on investments and foreign currency translations | | 168,596,551 | |
Net Increase in Net Assets Resulting From Operations | | $ | 349,125,898 | |
* Net of foreign taxes withheld | | $ | 12,852,557 | |
See Notes to Financial Statements.
10
| STATEMENT OF CHANGES IN NET ASSETS |
| | For the Period | |
| | January 26, 2007 (Inception) | |
| | to April 30, 2007 (Unaudited) | |
| | | |
OPERATIONS | | | |
| | | |
Net investment income | | $ | 180,529,347 | |
Net realized gain/(loss) on investments: | | | |
Securities transactions | | (17,459,202 | ) |
Foreign currency transactions | | 17,413,812 | |
Change in net unrealized appreciation of investments and foreign currency translations: | | | |
Investments | | 89,181,231 | |
Foreign currency translations | | 79,460,710 | |
Net unrealized appreciation of investments | | 168,641,941 | |
Net increase in net assets resulting from operations | | 349,125,898 | |
| | | |
DISTRIBUTIONS TO SHAREHOLDERS | | | |
| | | |
From net investment income | | (72,735,463 | ) |
Net decrease in net assets resulting from distributions to shareholders | | (72,735,463 | ) |
| | | |
CAPITAL SHARE TRANSACTIONS | | | |
| | | |
Proceeds from sales of common shares, net of offering costs | | 3,356,320,000 | |
Proceeds from underwriters’ over-allotment option of common shares exercised, net of offering costs | | 491,916,371 | |
Net asset value of common stock issued to stockholders from capital share transactions | | 17,897,815 | |
Net increase in net assets derived from capital share transactions | | 3,866,134,186 | |
Net Increase in Net Assets | | 4,142,524,621 | |
Net Assets | | | |
Beginning of period | | 100,000 | |
End of period* | | $ | 4,142,624,621 | |
* Including undistributed net investment income of: | | $ | 107,793,884 | |
See Notes to Financial Statements.
11
| FINANCIAL HIGHLIGHTS (For a share outstanding throughout the period) |
| | Period Ended | |
| | April 30, 2007(a) (Unaudited) | |
| | | |
PER COMMON SHARE OPERATING PERFORMANCE | | | |
| | | |
Net asset value per share, beginning of period | | $ | 19.10 | |
Income from investment operations: | | | |
Net investment income | | 0.89 | |
Net realized and unrealized gain on investments | | 0.84 | |
Total from investment operations | | 1.73 | |
| | | |
LESS DISTRIBUTIONS TO COMMON SHAREHOLDERS | | | |
| | | |
From net investment income | | (0.36 | ) |
Total distributions | | (0.36 | ) |
| | | |
CAPITAL SHARE TRANSACTIONS | | | |
| | | |
Common share offering costs charged to paid in capital | | (0.03 | ) |
Total capital share transactions | | (0.03 | ) |
Net asset value per share, end of period | | $ | 20.44 | |
Per share market value, end of period | | $ | 21.58 | |
| | | |
Total return based on: | | | |
Net Asset Value | | 7.17 | %(b) |
Market value | | 9.12 | %(b) |
| | | |
RATIOS/SUPPLEMENTAL DATA | | | |
| | | |
Net Assets attributable to common shares, at end of period (000) | | $ | 4,142,625 | |
Ratio of net expenses to average net assets | | 1.25 | %(c) |
Ratio of net investment income to average net assets | | 18.34 | %(c) |
Portfolio turnover rate | | 41.73 | %(d) |
(a) | | For the period from January 26, 2007 (inception of fund) to April 30, 2007. |
(b) | | Total investment return is calculated assuming a purchase of a common share at the opening on the first day and a sale at closing on the last day of each period reported. Total investment return on net asset value reflects a sales load of $.90 per share. Dividends and distributions, if any, are assumed for purposes of this calculation to be reinvested at prices obtained under the Trust’s dividend reinvestment plan. Total investment returns do not reflect brokerage commissions. Total investment returns for less than a full year are not annualized. Past performances is not a guarantee of future results. |
(c) | | Annualized. |
(d) | | Not Annualized. |
See Notes to Financial Statements.
12

| NOTES TO FINANCIAL STATEMENTS April 30, 2007 (Unaudited) |
1. ORGANIZATION AND SIGNIFICANT ACCOUNTING POLICIES
Alpine Total Dynamic Dividend Fund (the “Fund”) is a newly organized, diversified, closed-end management investment company. The Fund was organized as a Delaware statutory trust on October 27, 2006, and has no operating history. The Fund has an investment objective to invest in equity securities that provide high current dividend income. The Fund also focuses on long-term growth of capital as a secondary investment objective.
The Fund has no operations to date other than matters relating to its organization and the sale and issuance of 5,235.602 shares of beneficial interest in the Fund to Alpine Woods Capital Investors, LLC (“Alpine Woods”) at a net asset value of $19.10 per share. Alpine Woods serves as the Fund’s investment adviser. The Fund’s Common Shares are listed on the New York Stock Exchange (“NYSE”) under the symbol “AOD”.
The following summarizes the significant accounting policies of the Fund.
Security Valuation: The net asset value (“NAV”) of shares of the Fund is calculated by dividing the value of the Fund’s net assets by the number of outstanding shares. NAV is determined each day the New York Stock Exchange (the “NYSE”) is open as of the close of regular trading (normally, 4:00 p.m., Eastern time). In computing NAV, portfolio securities of the Fund are valued at their current market values determined on the basis of market quotations. In computing the Fund’s net asset value, portfolio securities that are traded on a securities exchange in the United States, except for option securities, are valued at the last reported sale price as of the time of valuation, or lacking any current reported sale at the time of valuation, at the mean between the most recent bid and asked quotations. Each option security - traded on a securities exchange in the United States is valued at the last current reported sale price as of the time of valuation if the last current reported sale price falls within the consolidated bid/ask quote for the option security. If the last current reported sale price as of the time of valuation does not fall within the consolidated bid/ask quote for the option security, the security is valued at the mid-point of the consolidated bid/ask quote for the option security. Each security traded in the over-the-counter market and quoted on the NASDAQ National Market System, is valued at the NASDAQ Official Closing Price (“NOCP”), as determined by NASDAQ, or lacking an NOCP, the last current reported sale price as of the time of valuation by NASDAQ, or lacking any current reported sale on NASDAQ at the time of valuation, at the mean between the most recent bid and asked quotations. Each over-the counter option that is not traded through the Options Clearing Corporation is valued by the counterparty, or if the counterparty’s price is not readily available then by using the Black-Scholes method. Each other security traded over-the-counter is valued at the mean between the most recent bid and asked quotations. Short-term securities with maturities of 60 days or less are valued at amortized cost, which approximates market value.
When market quotations are not readily available or when the valuation methods mentioned above are not reflective of a fair value of the security, the security is valued at a fair value following procedures and/or guidelines approved by the Board of Trustees, which may include utilizing a systematic fair valuation model provided by an independent pricing system. The Fund may also use fair value pricing, if the value of a security it holds is, pursuant to Board of Trustees guidelines, materially affected by events occurring before the Fund’s pricing time but after the close of the primary market or exchange on which the security is traded. These procedures may utilize valuations furnished by pricing services approved by the Board of Trustees, which may be based on market transactions for comparable securities and various relationships between securities that are generally recognized by institutional traders, a computerized matrix system, or appraisals derived from information concerning the securities or similar securities received from recognized dealers in those securities. When fair value pricing is employed, the value of the portfolio security used to calculate the Fund’s net asset value may differ from quoted or official closing prices.
Securities that are principally traded in a foreign market are valued at the last current sale price at the time of valuation or lacking any current or reported sale, at the time of valuation, at the mean between the most recent bid and asked quotations as of the close of the appropriate exchange or other designated time. Trading in securities on European and Far Eastern securities exchanges and over-the-counter markets is normally completed at various times before the close of business on each day on which the NYSE is open. Trading of these securities may not take place on every NYSE business day. In addition, trading may take place in various foreign markets on Saturdays or on other days when the NYSE is not open and on which the Fund’s net asset value is not calculated. As stated above, if the market prices are not readily available or are not reflective of the fair value of the security, the security will be priced at a fair value following procedures approved by the Board of Trustees. In light of the judgment involved in fair value decisions, there can be no assurance that a fair value assigned to a particular security is accurate.
Foreign Securities: The Fund may invest a portion of its assets in foreign securities. In the event that the Fund executes a foreign security transaction, the Fund will generally enter into a forward foreign currency contract to settle the foreign security transaction. Foreign securities may carry more risk than U.S. securities, such as political, market and currency risks.
The accounting records of the Fund are maintained in U.S. dollars. Prices of securities denominated in foreign currencies are translated into U.S. dollars at the closing rates of exchange at period end. Amounts related to the purchase and sale of foreign securities and investment income are translated at the rates of exchange prevailing on the respective dates of such transactions.
The effect of changes in foreign currency exchange rates on investments is included with the fluctuations arising from changes in market values of securities held and reported with all other foreign currency gains and losses in the Fund’s Statement of Operations.
Distributions to Shareholders: The Fund intends to make a level dividend distribution each month to its shareholders of the net investment income of the Fund after payment of Fund operating expenses. The level dividend rate may be modified by the Board of Trustees from time to time. If, for any monthly distribution, investment company taxable income, if any (which term includes net short-term capital gain) and net tax-exempt income, if any, is less than the amount of the distribution, the difference will generally be a tax-free return of capital distributed from the Fund’s assets. The Fund’s final distribution for each calendar year will include any remaining investment company taxable income and net tax-exempt income undistributed during the year, as well as all net capital
13
gain realized during the year. If the total distributions made in any calendar year exceed investment company taxable income, net tax exempt income and net capital gain, such excess distributed amount would be treated as ordinary dividend income to the extent of the Fund’s current and accumulated earnings and profits. Distributions in excess of the earnings and profits would first be a tax-free return of capital to the extent of the adjusted tax basis in the shares. After such adjusted tax basis is reduced to zero, the distribution would constitute capital gain (assuming the shares are held as capital assets).Distributions to shareholders are recorded by the Fund on the ex-dividend date.
Income Taxes: The Fund’s policy is to comply with the provisions of the Internal Revenue Code applicable to regulated investment companies and to distribute all of its taxable income to its shareholders. Therefore, no federal income tax provision is required.
In June 2006, the Financial Accounting Standards Board (FASB) issued FASB Interpretation No. 48 – Accounting for Uncertainty in Income Taxes, that requires the tax effects of certain tax positions to be recognized. These tax positions must meet a “more likely than not” standard that, based on their technical merits, have a more than 50 percent likelihood of being sustained upon examination. FASB Interpretation No. 48 is effective for fiscal periods beginning after December 15, 2006. At adoption, the financial statements must be adjusted to reflect only those tax positions that are more likely than not of being sustained. Management of the Fund is currently evaluating the impact that FASB Interpretation No. 48 will have on the Fund’s financial statements.
Securities Transactions and Investment Income: Investment security transactions are accounted for as of trade date. Dividend income is recorded on the ex-dividend date. Interest income is recorded on the accrual basis, which includes amortization of premium and accretion of discounts. Realized gains and losses from securities transactions and unrealized appreciation and depreciation of securities are determined using the highest cost basis for both financial reporting and income tax purposes.
Use of Estimates: The Fund’s financial statements are prepared in accordance with accounting principles generally accepted in the United States of America. This requires management to make estimates and assumptions that affect the reported amounts of assets and liabilities and disclosure of contingent assets and liabilities at the date of the financial statements and the reported amounts of increases and decreases in net assets from operations during the reporting period. Actual results could differ from these estimates.
2. INCOME TAXES
As of April 30, 2007, net unrealized appreciation/(depreciation) of investments based on federal tax costs was as follows:
Gross appreciation on investments
(excess of value over tax cost) | | $ | 285,745,454 | |
Gross depreciation on investments
(excess of tax cost over value) | | (117,696,454 | ) |
Net unrealized appreciation | | 168,049,000 | |
Total cost for federal income tax purposes | | $ | 3,980,959,777 | |
The differences between book and tax net unrealized appreciation and cost were primarily due to the differing tax treatment of foreign currency, investments in partnerships, and certain other investments.
3. CAPITAL TRANSACTIONS
| | For the | |
| | Period January 26, | |
| | 2007 (Inception) to | |
| | April 30, 2007 | |
| | | |
Common shares outstanding - beginning of period | | 5,236 | |
Common shares issued in connection with initial public offering | | 176,000,000 | |
Common shares issued from underwriter’s over-allotment option exercised | | 25,795,300 | |
Common shares issued as reinvestment of dividends | | 894,951 | |
Common shares outstanding - end of period | | 202,695,487 | |
4. PORTFOLIO SECURITIES
Purchases and sales of investment securities, other than short-term securities, for the period ended April 30, 2007 aggregated $4,790,777,312 and $1,311,375,692, respectively. The Fund did not have purchases and sales of U.S. Government obligations for the period ended April 30, 2007.
5. INVESTMENT ADVISORY AND ADMINISTRATION AGREEMENTS
Alpine Woods serves as the Fund’s investment adviser pursuant to an Investment Advisory Agreement with the Fund. As compensation for its services to the Fund, Alpine Woods receives an annual investment advisory fee of 1.00% based on the Fund’s average daily total assets, computed daily and payable monthly.
ALPS Fund Services, Inc. (“ALPS”) serves as the Fund’s administrator pursuant to an Administration, Bookkeeping and Pricing Services Agreement with the Fund. As compensation for its services to the Fund, ALPS receives an annual administration fee of 0.13% based on the Fund’s average daily total assets, computed daily and payable monthly.
6. OTHER
Compensation of Trustees: The Independent Trustees of the Fund receive $4,000 for each meeting attended.
7. SUBSEQUENT EVENTS
Distributions: The Fund paid a distribution of $36,485,188 or $0.18 per common share on May 25, 2007 to common shareholders of record on May 21, 2007.
The Fund paid a distribution of $36,557,833 or $0.18 per common share on June 22, 2007 to common shareholders of record on June 18, 2007.
14
| ADDITIONAL INFORMATION April 30, 2007 (Unaudited) |
DIVIDEND REINVESTMENT PLAN
Unless the registered owner of common shares elects to receive cash by contacting The Bank of New York (the “Plan Administrator”), all dividends declared on common shares will be automatically reinvested by the Plan Administrator for shareholders in the Fund’s Dividend Reinvestment Plan (the “Plan”), in additional common shares of the Fund. Shareholders that are not permitted to participate through their broker or nominee or who elect not to participate in the Plan will receive all dividends and other distributions in cash paid by check mailed directly to the shareholder of record (or, if the common shares are held in street or other nominee name, then to such nominee) by the Plan Administrator, as dividend disbursing agent. You may elect not to participate in the Plan and to receive all dividends in cash by contacting the Plan Administrator, as dividend disbursing agent, at the address set forth below. Participation in the Plan is completely voluntary and may be terminated or resumed at any time without penalty by notice if received and processed by the Plan Administrator prior to the dividend record date; otherwise such termination or resumption will be effective with respect to any subsequently declared dividend or other distribution. If you hold your shares through a broker, and you wish for all dividends declared on your common shares to be automatically reinvested pursuant to the Plan, please contact your broker.
The Plan Administrator will open an account for each shareholder under the Plan in the same name in which such shareholder’s common shares are registered. Whenever the Fund declares a dividend or other distribution (together, a “Dividend”) payable in cash, non-participants in the Plan will receive cash and participants in the Plan will receive the equivalent in common shares. The common shares will be acquired by the Plan Administrator for the participants’ accounts, depending upon the circumstances described below, either (i) through receipt of additional unissued but authorized common shares from the Fund (“Newly Issued common shares”) or (ii) by purchase of outstanding common shares on the open market (“Open-Market Purchases”) on the NYSE or elsewhere. If, on the payment date for any Dividend, the closing market price plus estimated brokerage commissions per share is equal to or greater than the net asset value per share, the Plan Administrator will invest the Dividend amount in Newly Issued common shares on behalf of the participants. The number of Newly Issued common shares to be credited to each participant’s account will be determined by dividing the dollar amount of the Dividend by the net asset value per share on the payment date; provided that, if the net asset value is less than or equal to 95% of the closing market value on the payment date, the dollar amount of the Dividend will be divided by 95% of the closing market price per share on the payment date. If, on the payment date for any Dividend, the net asset value per share is greater than the closing market value plus estimated brokerage commissions, the Plan Administrator will invest the Dividend amount in common shares acquired on behalf of the participants in Open-Market Purchases.
In the event of a market discount on the payment date for any Dividend, the Plan Administrator will have until the last business day before the next date on which the common shares trade on an “ex-dividend” basis or 30 days after the payment date for such Dividend, whichever is sooner (the “Last Purchase Date”), to invest the Dividend amount in common shares acquired in Open-Market Purchases. It is contemplated that the Fund will pay monthly income Dividends. If, before the Plan Administrator has completed its Open-Market Purchases, the market price per share exceeds the net asset value per share, the average per share purchase price paid by the Plan Administrator may exceed the net asset value of the common shares, resulting in the acquisition of fewer common shares than if the Dividend had been paid in Newly Issued common shares on the Dividend payment date. Because of the foregoing difficulty with respect to Open-Market Purchases, the Plan provides that if the Plan Administrator is unable to invest the full Dividend amount in Open-Market Purchases during the purchase period or if the market discount shifts to a market premium during the purchase period, the Plan Administrator may cease making Open-Market Purchases and may invest the uninvested portion of the Dividend amount in Newly Issued common shares at the net asset value per share at the close of business on the Last Purchase Date provided that, if the net asset value is less than or equal to 95% of the then current market price per share, the dollar amount of the Dividend will be divided by 95% of the market price on the payment date for purposes of determining the number of shares issuable under the Plan.
The Plan Administrator maintains all shareholders’ accounts in the Plan and furnishes written confirmation of all transactions in the accounts, including information needed by shareholders for tax records. Common shares in the account of each Plan participant will be held by the Plan Administrator on behalf of the Plan participant, and each shareholder proxy will include those shares purchased or received pursuant to the Plan. The Plan Administrator will forward all proxy solicitation materials to participants and vote proxies for shares held under the Plan in accordance with the instructions of the participants.
In the case of the Fund’s shareholders such as banks, brokers or nominees which hold shares for others who are the beneficial owners, the Plan Administrator will administer the Plan on the basis of the number of common shares certified from time to time by the record shareholder’s name and held for the account of beneficial owners who participate in the Plan.
There will be no brokerage charges with respect to common shares issued directly by the Fund. However, each participant will pay a pro rata share of brokerage commissions incurred in connection with Open-Market Purchases. The automatic reinvestment of Dividends will not relieve participants of any federal, state or local income tax that may be payable (or required to be withheld) on such Dividends. See “Federal Income Tax Matters.” Participants that request a sale of common shares through the Plan Administrator are subject to brokerage commissions.
Shareholders participating in the Plan may receive benefits not available to shareholders not participating in the Plan. If the market price plus commissions of the Fund’s shares is higher than the net asset value, participants in the Plan will receive shares of the Fund for less than they could otherwise purchase them and will have shares with a cash value greater than the value of any cash distribution they would have received on their shares. If the market price plus commissions is below the net asset value, participants receive distributions of shares with a net asset value greater than the value of any cash distribution they would have received on their shares. However, there may be insufficient shares available in the market to make distributions in shares at prices below the net asset value. Also, because the Fund
15
does not redeem its shares, the price on resale may be more or less than the net asset value.
The Fund reserves the right to amend or terminate the Plan. There is no direct service charge to participants with regard to purchases in the Plan; however, the Fund reserves the right to amend the Plan to include a service charge payable by the participants.
All correspondence or questions concerning the Plan should be directed to the Plan Administrator, The Bank of New York, at One Wall Street, New York, NY 10286 (800) 432-8224.
CONSIDERATION OF APPROVAL OF THE INVESTMENT ADVISORY AGREEMENT
Mr. Samuel Lieber presented information regarding the Adviser’s desire and ability to serve as the investment adviser to the Fund. Mr. Samuel Lieber discussed the Adviser’s performance as investment adviser for the Alpine closed-end funds and the Alpine open-end mutual funds for which each Trustee serves as trustee and the Adviser’s strategy and qualifications for providing advisory services to the Fund. Mr. Samuel Lieber discussed the Adviser’s services and fees in comparison to those by the investment advisers of other closed-end investment companies in the market. The Independent Trustees asked several questions of the Adviser including the Adviser’s belief in the validity of the proposed model for the Fund’s performance, discussion of the comparison data prepared by Lipper and the impact of the distinguishing characteristics of the Fund in comparison to the Alpine closed-end funds including the use of leverage and the flexibility to invest without regard to Qualified Dividend Income. The Board evaluated the comparative data and noted certain distinctions as between the Fund and the comparables presented including the fact that several were fixed income or index funds and the impact of those distinctions. Fund counsel then presented to the Independent Trustees on their responsibilities in approving the investment advisory agreement. Fund counsel directed their attention to the Gartenberg memorandum that had been provided for their careful review in the Board Book. Fund counsel discussed the Gartenberg memorandum and the instructions to the Board which should be taken from it. The Trustees asked several questions about the role of the Adviser in a closed-end fund and the powers of the shareholders with respect to the Adviser.
The Independent Trustees meeting in executive session then discussed their familiarity with the Adviser, its policies and procedures, and its staff and their confidence in their ability to perform based on this experience. They further discussed the depth of resources and skill that the Adviser has demonstrated in its management of Alpine’s other funds. The Independent Trustees also noted the efficiencies that should be expected by the Adviser also serving as investment adviser to the other Alpine Funds. In addition, the Independent Trustees noted the Adviser’s demonstrated ability to comply with dynamic regulatory requirements and the Adviser’s responsiveness to their requests in the past. The Independent Trustees then had a question and answer session with officers of the Adviser. They discussed their understanding of what the Adviser’s role will be and what responsibilities the Adviser will have regarding oversight of ALPS as the Fund’s administrator, who will be paid separate from the Adviser pursuant to an administration agreement. They discussed the information that had been provided to them regarding the Adviser’s fees, its profitability and expenses of the Fund and how this information compared to the data prepared by Lipper regarding other closed-end funds. The Independent Trustees clarified which fees and expenses of the Fund will be paid by the Adviser and which will be borne by the Fund. In their deliberations, the independent Trustees did not identify any particular information that was all-important or controlling, and the Independent Trustees attributed different weights to the various factors.
Based on the independent Trustees’ review and consultation with the Fund’s independent counsel during an executive session of the material aspects of the Investment Advisory Agreement, including the foregoing factors and such other information believed to be reasonably necessary to evaluate the terms of the Investment Advisory Agreement, the Trustees, including all of the independent Trustees voting separately, concluded that the approval of the Investment Advisory Agreement is in the best interest of the Fund and determined that the compensation to the Adviser provided for in the Investment Advisory Agreement is fair and equitable.
FUND PROXY VOTING POLICIES & PROCEDURES
Policies and procedures used in determining how to vote proxies relating to portfolio securities and a summary of proxies voted by the Fund are available without a charge, upon request, by contacting the Fund at 1-800-910-1434 and on the Commission’s web site at http://www.sec.gov.
PORTFOLIO HOLDINGS
The Fund files its complete schedule of portfolio holdings with the Commission for the first and third quarters of each fiscal year on Form N-Q within 60 days after the end of the period. Copies of the Fund’s Forms N-Q are available without a charge, upon request, by contacting the Fund at 1-800-617-7616 and on the Commission’s web site at http://www.sec.gov. You may also review and copy Form N-Q at the Commission’s Public Reference Room in Washington, D.C. For more information about the operation of the Public Reference Room, please call the Commission at 1-800-SEC-0330.
NOTICE
Notice is hereby given in accordance with Section 23(c) of the Investment Company Act of 1940 that the Fund may purchase at market prices from time to time its common shares in the open market.
16
INDEPENDENT TRUSTEES*
| | | | | | # of | | |
| | | | | | Portfolios | | |
| | Position(s) Held | | Principal Occupation During | | in Fund | | Other Directorships |
Name and Age | | with the Fund | | Past Five Years | | Complex** | | Held by Trustee |
Laurence B. Ashkin (78) | | Independent Trustee | | Real estate developer and construction consultant since 1980; Founder and President of Centrum Properties, Inc. since 1980. | | 12 | | Trustee, Alpine Family of Funds.* |
| | | | | | | | |
H. Guy Leibler (52) | | Independent Trustee | | Vice Chair and Chief Operating Officer of L&L Holding Company, LLC since 2004; President, Skidmore, Owings & Merrill LLP (2001-2003). | | 12 | | Chairman, White Plains Hospital Center; Dressage for Kids; Trustee, Alpine Family of Funds. |
| | | | | | | | |
Jeffrey E. Wacksman (46) | | Independent Trustee | | Partner, Loeb, Block & Partners LLP since 1994. | | 12 | | Dynasty Holdings, Inc.; Bondi Icebergs Inc.; MH Properties, Inc.; Trustee, Alpine Family of Funds |
* | | The Independent Trustees identified above are the members of the Board of Trustees for each of the Alpine Series Trust, Alpine Equity Trust and Alpine Income Trust (collectively, the “Alpine Family of Funds”). |
** | | Alpine Woods Capital Investors, LLC manages nine other fund portfolios within the three Alpine Trusts. Each of the Alpine Trusts is registered as an openend management investment company. The Trustees oversee each of the nine portfolios within the Alpine Trusts. |
INTERESTED TRUSTEE
| | | | | | # of | | |
| | | | | | Portfolios | | |
| | Position(s) Held | | Principal Occupation During | | in Fund | | Other Directorships |
Name and Age | | with the Fund | | Past Five Years | | Complex** | | Held by Trustee |
Samuel A. Lieber* (49) | | Interested Trustee and President | | CEO of Alpine Woods Capital Investors, LLC since 1997. President of Alpine Trusts since 1998. | | 12 | | Trustee, Alpine Family of Funds. |
* | | Samuel A. Lieber has been a Trustee of the Fund since its inception. He is the son of Stephen A. Lieber. |
** | | Alpine Woods Capital Investors, LLC manages nine other fund portfolios within the three Alpine Trusts. Each of the Alpine Trusts is registered as an open-end management investment company. The Trustees oversee each of the nine portfolios within the Alpine Trusts. |
17
In addition to Mr. Samuel A. Lieber, the table below identifies the Fund’s executive officers.
| | | | | | # of | | |
| | | | | | Portfolios | | |
| | Position(s) Held | | Principal Occupation During | | in Fund | | Other Directorships |
Name and Age | | with the Fund | | Past Five Years | | Complex** | | Held by Trustee |
Stephen A. Lieber (80)* | | ExecutiveVice President | | Chief Investment Officer, Alpine Woods Capital Investors, LLC since 2003. Chairman and Senior Portfolio Manager, Saxon Woods Advisors, LLC since 1999. | | N/A | | None |
| | | | | | | | |
Sheldon R. Flamm (58) | | Treasurer/Chief Compliance Officer | | Chief Financial Officer and Senior Managing Director, Alpine Woods Capital Investors, LLC, since 2001; Chief Financial Officer, Saxon Woods Advisors, LLC since 1999. | | N/A | | None |
| | | | | | | | |
Oliver Sun (41) | | Secretary | | Controller of Alpine Woods Capital Investors, LLC since 1998. | | N/A | | None |
* | | Stephen A. Lieber is the father of Samuel A. Lieber. |
** | | Alpine Woods Capital Investors, LLC manages nine other fund portfolios within the three Alpine Trusts. Each of the Alpine Trusts is registered as an open-end management investment company. The Trustees oversee each of the nine portfolios within the Alpine Trusts. |
18
THIS PAGE INTENTIONALLY LEFT BLANK

Alpine
Experience
Performance
Innovation
Alpine Total Dynamic Dividend Fund
Alpine Total Dynamic Dividend Fund

INVESTMENT ADVISER | | Alpine Woods Capital Investors, LLC |
| | 2500 Westchester Ave., Suite 215 |
| | Purchase, NY 10577 |
| | |
ADMINISTRATOR | | ALPS Fund Services, Inc. |
| | 1290 Broadway, Suite 1100 |
| | Denver, CO 80203 |
| | |
TRANSFER AGENT & | | The Bank of New York |
CUSTODIAN | | One Wall Street |
| | New York, NY 10286 |
| | |
INDEPENDENT REGISTERED | | Deloitte & Touche LLP |
PUBLIC ACCOUNTING FIRM | | 555 East Wells Street |
| | Milwaukee,WI 53202 |
| | |
FUND COUNSEL | | Blank Rome LLP |
| | The Chrysler Building |
| | 405 Lexington Avenue |
| | New York, NY 10174 |
Shareholder & Investor Information
1(800) 617.7616 | www.alpinecef.com
Item 2. | | Code of Ethics. |
| | |
| | Not applicable to semi-annual report. |
| | |
Item 3. | | Audit Committee Financial Expert. |
| | |
| | Not applicable to semi-annual report. |
| | |
Item 4. | | Principal Accountant Fees and Services. |
| | |
| | Not applicable to semi-annual report. |
| | |
Item 5. | | Audit Committee of Listed Registrants. |
| | |
| | Not applicable to semi-annual report. |
| | |
Item 6. | | Schedule of Investments. |
| | |
| | The Schedule of Investments is included as part of the Report to Stockholders filed under Item 1 of this form. |
| | |
Item 7. | | Disclosure of Proxy Voting Policies and Procedures for Closed-End Management Investment Companies. |
| | |
| | Not applicable to semi-annual report. |
| | |
Item 8. | | Portfolio Managers of Closed-End Management Investment Companies. |
| | |
| | Not applicable to semi-annual report. |
| | |
Item 9. | | Purchases of Equity Securities by Closed-End Management Investment Company and Affiliated Purchasers. |
| | |
| | Not applicable. |
2
Item 10. | | Submission of Matters to Vote of Security Holders. |
| | |
| | There have been no material changes to the procedures by which shareholders may recommend nominees to the registrant’s board of trustees. |
| | |
Item 11. | | Controls and Procedures. |
| | |
| | (a) The registrant’s principal executive officer and principal financial officer have evaluated the registrant’s disclosure controls and procedures (as defined in Rule 30a-3(c) under the Investment Company Act of 1940, as amended) within 90 days of this filing and have concluded that the registrant’s disclosure controls and procedures were effective, as of that date. |
| | |
| | (b) There was no change in the registrant’s internal control over financial reporting (as defined in Rule 30a-3(d) under the Investment Company Act of 1940, as amended) during the second fiscal quarter of the period covered by this report that has materially affected, or is reasonably likely to materially affect, the registrant’s internal control over financial reporting. |
| | |
Item 12. | | Exhibits. |
| | |
| | (a)(1) Not applicable to semi-annual report |
| | |
| | (a)(2) The certifications required by Rule 30a-2(a) of the Investment Company Act of 1940, as amended, and Section 302 of the Sarbanes-Oxley Act of 2002 are attached hereto as Ex99.Cert. |
| | |
| | (a)(3) Not applicable. |
| | |
| | (b) The certifications by the registrant’s Principal Executive Officer and Principal Financial Officer, as required by Rule 30a-2(b) of the Investment Company Act of 1940, as amended, and Section 906 of the Sarbanes-Oxley Act of 2002 are attached hereto as Ex99.906Cert. |
3
SIGNATURES
Pursuant to the requirements of the Securities Exchange Act of 1934 and the Investment Company Act of 1940, the registrant has duly caused this report to be signed on its behalf by the undersigned, thereunto duly authorized.
Alpine Total Dynamic Dividend Fund |
| | |
By: | | /s/ Samuel A. Lieber | |
| | Samuel A. Lieber |
| | Chief Executive Officer (Principal Executive Officer) |
| | |
Date: | | July 9, 2007 |
Pursuant to the requirements of the Securities Exchange Act of 1934 and the Investment Company Act of 1940, this report has been signed below by the following persons on behalf of the registrant and in the capacities and on the dates indicated.
By: | | /s/ Samuel A. Lieber | |
| | Samuel A. Lieber |
| | Chief Executive Officer (Principal Executive Officer) |
| | |
Date: | | July 9, 2007 |
| | |
| | |
By: | | /s/ Sheldon R. Flamm | |
| | Sheldon R. Flamm |
| | Chief Financial Officer (Principal Financial Officer) |
| | |
Date: | | July 9, 2007 |
| | | | |
4