UNITED STATES
SECURITIES AND EXCHANGE COMMISSION
Washington, D.C. 20549
FORM N-CSR
CERTIFIED SHAREHOLDER REPORT OF REGISTERED MANAGEMENT INVESTMENT COMPANIES
| Investment Company Act file number: | 811-21980 | |
| Exact name of registrant as specified in charter: | abrdn Total Dynamic Dividend Fund | |
| Address of principal executive offices: | 1900 Market Street, Suite 200 | |
| Philadelphia, PA 19103 | ||
| Name and address of agent for service: | Sharon Ferrari | |
| abrdn Inc. | ||
| 1900 Market Street Suite 200 | ||
| Philadelphia, PA 19103 | ||
| Registrant’s telephone number, including area code: | 1-800-522-5465 | |
| Date of fiscal year end: | October 31 | |
| Date of reporting period: | October 31, 2023 |
Item 1. Reports to Stockholders.


| AGD | AOD | |
| NAV2,3 | 7.00% | 8.01% |
| Market Price2 | 2.29% | 5.41% |
| MSCI AC World Index (Net DTR)4 | 10.50% | 10.50% |
| AGD | |||
| NAV | Closing Market Price | Premium(+)/ Discount(-) | |
| 10/31/2023 | $9.90 | $8.40 | -15.15% |
| 10/31/2022 | $10.05 | $8.92 | -11.24% |
| AOD | |||
| NAV | Closing Market Price | Premium(+)/ Discount(-) | |
| 10/31/2023 | $8.54 | $7.26 | -14.99% |
| 10/31/2022 | $8.61 | $7.50 | -12.89% |
| 1 | Past performance is no guarantee of future results. Investment returns and principal value will fluctuate and shares, when sold, may be worth more or less than original cost. Current performance may be lower or higher than the performance quoted. NAV return data includes investment management fees, custodial charges and administrative fees (such as Trustee and legal fees) and assumes the reinvestment of all distributions. |
| 2 | Assuming the reinvestment of dividends and distributions. |
| 3 | The Funds' total return is based on the reported NAV for each financial reporting period end and may differ from what is reported on the Financial Highlights due to financial statement rounding or adjustments. |
| 4 | The Morgan Stanley Capital International (MSCI) All Country (AC) World Index Net DailyTotal Return (DTR) is an unmanaged index considered representative of developed and emerging market stock markets.The index is calculated net of withholding taxes to which the Funds are generally subject. Indexes are unmanaged and have been provided for comparison purposes only. No fees or expenses are reflected. You cannot invest directly in an index. |
| 2023 Annual Report | 1 |
| Fund | Distribution per share | NAV annualized distribution rate | Market Price annualized distribution rate |
| AGD | $0.78 | 7.88% | 9.29% |
| AOD | $0.69 | 8.08% | 9.50% |
| 2 | 2023 Annual Report |
| • | Visit: https://www.abrdn.com/en-us/cefinvestorcenter |
| • | Email: Investor.Relations@abrdn.com; or |
| • | Call: 1-800-522-5465 (toll free in the U.S.). |
Christian Pittard
President
| 2023 Annual Report | 3 |
| 1 | If the price of a fund moves significantly over a short period of time it is said to be 'volatile' or has 'high volatility'. If the price remains relatively stable, it is said to have 'low volatility'. Volatility can be used as a measure of risk. |
| 2 | The maximum amount of money that the U.S. government is allowed to borrow to meet its obligations. |
| 3 | A key measure of the value of a company, fund, or trust is the total value of assets less liabilities, divided by the number of shares. |
| 4 | A portfolio holding less of a particular security (or sector or region) than the security’s weight in the benchmark portfolio. |
| 5 | A portfolio holding an excess amount of a particular security (or sector or region) compared to the security’s weight in the benchmark portfolio. |
| 4 | 2023 Annual Report |
| 6 | Also abbreviated as 'xd', this is a share sold without the right to receive the declared dividend payment which is marked as due to those shareholders who are on the share register. The stock market authorities usually specify the date on which a share will begin trading 'xd'. The share price invariably drops when the share goes 'xd' taking the known income of the dividend out of the share price. |
| 7 | The payment of any income generated by a fund. |
| 2023 Annual Report | 5 |
| 1 | If the price of a fund moves significantly over a short period of time it is said to be 'volatile' or has 'high volatility'. If the price remains relatively stable, it is said to have 'low volatility'. Volatility can be used as a measure of risk. |
| 2 | The maximum amount of money that the U.S. government is allowed to borrow to meet its obligations. |
| 3 | A key measure of the value of a company, fund, or trust is the total value of assets less liabilities, divided by the number of shares. |
| 4 | A portfolio holding less of a particular security (or sector or region) than the security’s weight in the benchmark portfolio. |
| 5 | A portfolio holding an excess amount of a particular security (or sector or region) compared to the security’s weight in the benchmark portfolio. |
| 6 | 2023 Annual Report |
| 6 | Also abbreviated as 'xd', this is a share sold without the right to receive the declared dividend payment which is marked as due to those shareholders who are on the share register. The stock market authorities usually specify the date on which a share will begin trading 'xd'. The share price invariably drops when the share goes 'xd' taking the known income of the dividend out of the share price. |
| 7 | The payment of any income generated by a fund. |
| 2023 Annual Report | 7 |
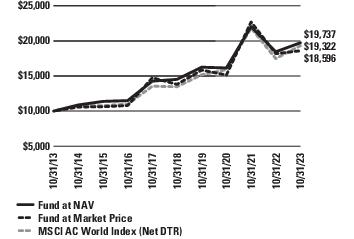
| AGD | 1 Year | 3 Years | 5 Years | 10 Years |
| Net Asset Value (NAV) | 7.00% | 6.92% | 6.33% | 7.04% |
| Market Price | 2.29% | 7.09% | 6.13% | 6.40% |
| MSCI AC World Index (Net DTR) | 10.50% | 6.68% | 7.47% | 6.81% |
| 8 | 2023 Annual Report |
| Sectors-AGD | |
| Information Technology | 18.4% |
| Financials | 17.0% |
| Health Care | 12.8% |
| Industrials | 9.6% |
| Consumer Discretionary | 8.3% |
| Consumer Staples | 8.0% |
| Utilities | 6.0% |
| Materials | 5.7% |
| Communication Services | 5.4% |
| Energy | 4.8% |
| Real Estate | 2.9% |
| Short-Term Investment | 0.6% |
| Assets in Excess of Other Liabilities | 0.5% |
| 100.0% |
| Countries-AGD | |
| United States | 61.5% |
| United Kingdom | 6.8% |
| France | 6.2% |
| Netherlands | 4.3% |
| Germany | 2.5% |
| China | 2.2% |
| Other, less than 2% each | 15.4% |
| Short-Term Investment | 0.6% |
| Assets in Excess of Other Liabilities | 0.5% |
| 100.0% |
| Top Ten Holdings-AGD | |
| Apple, Inc. | 3.7% |
| Microsoft Corp. | 3.5% |
| Alphabet, Inc. | 1.8% |
| Broadcom, Inc. | 1.8% |
| Engie SA | 1.7% |
| Newmont Corp., CDI | 1.7% |
| TJX Cos., Inc. (The) | 1.6% |
| BE Semiconductor Industries NV | 1.6% |
| Enbridge, Inc. | 1.5% |
| Eli Lilly & Co. | 1.5% |
| 2023 Annual Report | 9 |
| Shares or Principal Amount | Value | ||
| COMMON STOCKS—97.7% | |||
| AUSTRALIA—0.8% | |||
| Materials—0.8% | |||
| Rio Tinto PLC, ADR | 31,500 | $ 2,026,710 | |
| BRAZIL—1.8% | |||
| Industrials—0.9% | |||
| CCR SA | 969,000 | 2,302,498 | |
| Materials—0.9% | |||
| Vale SA, ADR | 152,000 | 2,083,920 | |
| Total Brazil | 4,386,418 | ||
| CANADA—1.5% | |||
| Energy—1.5% | |||
| Enbridge, Inc.(a) | 116,600 | 3,735,864 | |
| CHINA—2.2% | |||
| Communication Services—0.9% | |||
| Tencent Holdings Ltd. | 56,700 | 2,098,395 | |
| Financials—0.9% | |||
| Ping An Insurance Group Co. of China Ltd., H Shares | 435,700 | 2,210,078 | |
| Real Estate—0.4% | |||
| China Vanke Co. Ltd., H Shares | 1,165,300 | 1,090,203 | |
| Total China | 5,398,676 | ||
| DENMARK—1.4% | |||
| Financials—1.4% | |||
| Tryg A/S | 170,500 | 3,329,448 | |
| EGYPT—0.5% | |||
| Energy—0.5% | |||
| Energean PLC | 125,800 | 1,302,738 | |
| FINLAND—0.6% | |||
| Information Technology—0.6% | |||
| Nokia OYJ | 416,406 | 1,386,915 | |
| FRANCE—6.2% | |||
| Consumer Discretionary—0.9% | |||
| LVMH Moet Hennessy Louis Vuitton SE | 3,200 | 2,290,977 | |
| Consumer Staples—1.7% | |||
| Danone SA | 49,000 | 2,915,032 | |
| Pernod Ricard SA | 6,600 | 1,172,004 | |
| 4,087,036 | |||
| Energy—1.4% | |||
| TotalEnergies SE, ADR(a) | 50,900 | 3,389,940 | |
| Industrials—0.5% | |||
| Teleperformance SE | 11,800 | 1,357,492 | |
| Utilities—1.7% | |||
| Engie SA | 260,900 | 4,149,584 | |
| Total France | 15,275,029 | ||
| GERMANY—2.5% | |||
| Financials—1.2% | |||
| Muenchener Rueckversicherungs-Gesellschaft AG in Muenchen | 7,200 | 2,889,417 | |
| Shares or Principal Amount | Value | ||
| Utilities—1.3% | |||
| RWE AG | 81,900 | $ 3,133,937 | |
| Total Germany | 6,023,354 | ||
| HONG KONG—1.0% | |||
| Financials—1.0% | |||
| Hong Kong Exchanges & Clearing Ltd. | 70,600 | 2,469,775 | |
| JAPAN—1.8% | |||
| Financials—1.1% | |||
| Mitsubishi UFJ Financial Group, Inc. | 319,000 | 2,676,138 | |
| Real Estate—0.7% | |||
| GLP J-REIT | 2,000 | 1,791,314 | |
| Total Japan | 4,467,452 | ||
| NETHERLANDS—4.3% | |||
| Consumer Staples—0.5% | |||
| Heineken NV | 13,300 | 1,194,918 | |
| Financials—1.1% | |||
| ING Groep NV, Series N | 209,500 | 2,685,900 | |
| Information Technology—2.7% | |||
| ASML Holding NV | 4,600 | 2,765,154 | |
| BE Semiconductor Industries NV | 39,100 | 4,039,018 | |
| 6,804,172 | |||
| Total Netherlands | 10,684,990 | ||
| NORWAY—0.9% | |||
| Communication Services—0.9% | |||
| Telenor ASA | 224,700 | 2,296,972 | |
| SINGAPORE—1.3% | |||
| Financials—1.3% | |||
| Oversea-Chinese Banking Corp. Ltd. | 342,000 | 3,170,720 | |
| SPAIN—0.9% | |||
| Consumer Discretionary—0.9% | |||
| Amadeus IT Group SA | 36,660 | 2,092,289 | |
| SWEDEN—0.6% | |||
| Industrials—0.6% | |||
| Atlas Copco AB, A Shares | 105,900 | 1,371,301 | |
| TAIWAN—1.1% | |||
| Information Technology—1.1% | |||
| Taiwan Semiconductor Manufacturing Co. Ltd., ADR | 170,200 | 2,779,793 | |
| UNITED KINGDOM—6.8% | |||
| Communication Services—0.8% | |||
| Vodafone Group PLC, ADR(a) | 208,700 | 1,928,388 | |
| Consumer Discretionary—1.1% | |||
| Taylor Wimpey PLC | 2,071,592 | 2,797,980 | |
| Energy—0.2% | |||
| Capricorn Energy PLC | 226,942 | 430,883 | |
| Financials—1.4% | |||
| Allfunds Group PLC | 177,100 | 906,420 | |
| London Stock Exchange Group PLC | 25,700 | 2,593,002 | |
| 3,499,422 | |||
| 10 | 2023 Annual Report |
| Shares or Principal Amount | Value | ||
| COMMON STOCKS (continued) | |||
| UNITED KINGDOM (continued) | |||
| Health Care—2.3% | |||
| AstraZeneca PLC, ADR(a) | 49,900 | $ 3,155,177 | |
| Dechra Pharmaceuticals PLC | 54,234 | 2,513,690 | |
| 5,668,867 | |||
| Industrials—1.0% | |||
| Melrose Industries PLC | 433,033 | 2,465,591 | |
| Total United Kingdom | 16,791,131 | ||
| UNITED STATES—61.5% | |||
| Communication Services—2.8% | |||
| Alphabet, Inc., Class C(a)(b) | 36,000 | 4,510,800 | |
| TKO Group Holdings, Inc. | 30,271 | 2,481,617 | |
| 6,992,417 | |||
| Consumer Discretionary—5.4% | |||
| Aptiv PLC(a)(b) | 24,400 | 2,127,680 | |
| Genuine Parts Co.(a) | 18,600 | 2,396,796 | |
| Las Vegas Sands Corp. | 35,400 | 1,680,084 | |
| Lowe's Cos., Inc.(a) | 16,100 | 3,068,177 | |
| TJX Cos., Inc. (The)(a) | 46,100 | 4,060,027 | |
| 13,332,764 | |||
| Consumer Staples—5.8% | |||
| Coca-Cola Co. (The)(a) | 58,700 | 3,315,963 | |
| Keurig Dr Pepper, Inc. | 81,100 | 2,459,763 | |
| Mondelez International, Inc., Class A(a) | 50,300 | 3,330,363 | |
| Nestle SA | 25,210 | 2,718,614 | |
| Target Corp.(a) | 21,700 | 2,404,143 | |
| 14,228,846 | |||
| Energy—1.2% | |||
| Williams Cos., Inc. (The)(a) | 85,585 | 2,944,124 | |
| Financials—7.6% | |||
| Bank of America Corp.(a) | 86,500 | 2,278,410 | |
| Blackstone, Inc., Class A | 27,354 | 2,526,142 | |
| CME Group, Inc. | 13,300 | 2,839,018 | |
| Fidelity National Information Services, Inc. | 43,339 | 2,128,378 | |
| Goldman Sachs Group, Inc. (The) | 9,500 | 2,884,295 | |
| Huntington Bancshares, Inc. | 235,700 | 2,274,505 | |
| JPMorgan Chase & Co. | 20,900 | 2,906,354 | |
| MetLife, Inc. | 16,000 | 960,160 | |
| 18,797,262 | |||
| Health Care—10.5% | |||
| AbbVie, Inc.(a) | 24,212 | 3,418,250 | |
| Baxter International, Inc. | 49,700 | 1,611,771 | |
| Bristol-Myers Squibb Co.(a) | 42,408 | 2,185,284 | |
| CVS Health Corp. | 37,100 | 2,560,271 | |
| Eli Lilly & Co.(a) | 6,600 | 3,655,938 | |
| Medtronic PLC(a) | 29,000 | 2,046,240 | |
| Merck & Co., Inc. | 23,985 | 2,463,259 | |
| Roche Holding AG | 8,210 | 2,115,796 | |
| Sanofi SA | 30,900 | 2,805,913 | |
| UnitedHealth Group, Inc.(a) | 5,592 | 2,994,852 | |
| 25,857,574 | |||
| Industrials—6.6% | |||
| FedEx Corp.(a) | 13,500 | 3,241,350 | |
| Shares or Principal Amount | Value | ||
| Ferrovial SE | 103,000 | $ 3,099,892 | |
| Norfolk Southern Corp. | 11,200 | 2,136,848 | |
| Schneider Electric SE | 20,000 | 3,077,146 | |
| Stanley Black & Decker, Inc. | 22,800 | 1,939,140 | |
| Waste Management, Inc. | 16,500 | 2,711,445 | |
| 16,205,821 | |||
| Information Technology—12.8% | |||
| Amdocs Ltd. | 36,500 | 2,925,840 | |
| Analog Devices, Inc. | 18,100 | 2,847,673 | |
| Apple, Inc.(a) | 54,000 | 9,221,580 | |
| Broadcom, Inc.(a) | 5,326 | 4,481,136 | |
| Cisco Systems, Inc. | 63,600 | 3,315,468 | |
| Microsoft Corp.(a) | 25,626 | 8,664,407 | |
| 31,456,104 | |||
| Materials—4.0% | |||
| Air Products & Chemicals, Inc. | 7,900 | 2,231,276 | |
| Linde PLC | 9,200 | 3,514,950 | |
| Newmont Corp., CDI(b) | 107,160 | 4,106,487 | |
| 9,852,713 | |||
| Real Estate—1.8% | |||
| American Tower Corp., REIT | 11,500 | 2,049,185 | |
| Gaming and Leisure Properties, Inc., REIT(a) | 53,991 | 2,450,652 | |
| 4,499,837 | |||
| Utilities—3.0% | |||
| CMS Energy Corp.(a) | 43,800 | 2,380,092 | |
| FirstEnergy Corp. | 59,600 | 2,121,760 | |
| NextEra Energy Partners LP | 22,800 | 617,196 | |
| NextEra Energy, Inc.(a) | 37,100 | 2,162,930 | |
| 7,281,978 | |||
| Total United States | 151,449,440 | ||
| Total Common Stocks | 240,439,015 | ||
| CORPORATE BONDS—0.0% | |||
| UNITED STATES—0.0% | |||
| Diversified Financial Services—0.0% | |||
| Fixed Income Pass-Through Trust, Class B, Series 2007-C, 0.00%, 01/15/2087(c) | $ | 500,000 | 500 |
| Total Corporate Bonds | 500 | ||
| PREFERRED STOCKS—1.2% | |||
| SOUTH KOREA—1.2% | |||
| Information Technology—1.2% | |||
| Samsung Electronics Co. Ltd. | 75,400 | 3,010,323 | |
| Total Preferred Stocks | 3,010,323 | ||
| SHORT-TERM INVESTMENT—0.6% | |||
| State Street Institutional U.S. Government Money Market Fund, Premier Class, 5.30%(d) | 1,616,230 | 1,616,230 | |
| Total Short-Term Investment | 1,616,230 | ||
| Total Investments (Cost $236,488,786)(e)—99.5% | 245,066,068 | ||
| Other Assets in Excess of Liabilities—0.5% | 1,152,300 | ||
| Net Assets—100.0% | $246,218,368 | ||
| 2023 Annual Report | 11 |
| (a) | All or a portion of the security has been designated as collateral for the line of credit. |
| (b) | Non-income producing security. |
| (c) | Denotes a security issued under Regulation S or Rule 144A. |
| (d) | Registered investment company advised by State Street Global Advisors. The rate shown is the 7 day yield as of October 31, 2023. |
| (e) | See accompanying Notes to Financial Statements for tax unrealized appreciation/(depreciation) of securities. |
| ADR | American Depositary Receipt |
| EUR | Euro Currency |
| PLC | Public Limited Company |
| REIT | Real Estate Investment Trust |
| USD | U.S. Dollar |
| At October 31, 2023, the Fund held the following forward foreign currency contracts: |
| Sale Contracts Settlement Date | Counterparty | Currency Purchased | Amount Purchased | Currency Sold | Amount Sold | Fair Value | Unrealized Appreciation/ (Depreciation) | |
| United States Dollar/Euro | ||||||||
| 01/19/2024 | Royal Bank of Canada | USD | 20,666,921 | EUR | 19,400,000 | $20,604,104 | $62,817 | |
| 12 | 2023 Annual Report |
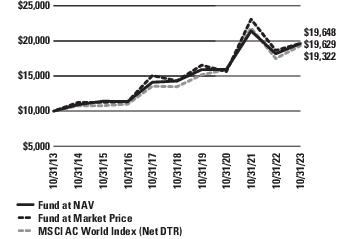
| AOD | 1 Year | 3 Years | 5 Years | 10 Years |
| Net Asset Value (NAV) | 8.01% | 7.21% | 6.56% | 6.98% |
| Market Price | 5.41% | 7.91% | 6.54% | 6.99% |
| MSCI AC World Index (Net DTR) | 10.50% | 6.68% | 7.47% | 6.81% |
| 2023 Annual Report | 13 |
| Sectors-AOD | |
| Information Technology | 19.6% |
| Financials | 16.8% |
| Health Care | 12.6% |
| Industrials | 10.1% |
| Consumer Discretionary | 9.0% |
| Consumer Staples | 8.7% |
| Communication Services | 6.4% |
| Utilities | 6.3% |
| Materials | 5.9% |
| Energy | 4.8% |
| Real Estate | 3.3% |
| Short-Term Investment | 0.7% |
| Liabilities in Excess of Other Assets | (4.2%) |
| 100.0% |
| Countries-AOD | |
| United States | 64.8% |
| France | 7.1% |
| United Kingdom | 5.6% |
| Netherlands | 4.6% |
| Germany | 2.7% |
| China | 2.3% |
| Other, less than 2% each | 16.4% |
| Short-Term Investment | 0.7% |
| Liabilities in Excess of Other Assets | (4.2%) |
| 100.0% |
| Top Ten Holdings-AOD | |
| Apple, Inc. | 4.1% |
| Microsoft Corp. | 3.6% |
| Broadcom, Inc. | 1.9% |
| Alphabet, Inc. | 1.9% |
| TotalEnergies SE, ADR | 1.8% |
| BE Semiconductor Industries NV | 1.8% |
| Newmont Corp., CDI | 1.7% |
| TJX Cos., Inc. (The) | 1.7% |
| Engie SA | 1.7% |
| Eli Lilly & Co. | 1.7% |
| 14 | 2023 Annual Report |
| Shares | Value | ||
| COMMON STOCKS—102.3% | |||
| AUSTRALIA—0.8% | |||
| Materials—0.8% | |||
| Rio Tinto PLC, ADR | 118,000 | $ 7,592,120 | |
| BRAZIL—1.9% | |||
| Industrials—1.0% | |||
| CCR SA | 3,650,100 | 8,673,218 | |
| Materials—0.9% | |||
| Vale SA, ADR | 585,500 | 8,027,205 | |
| Total Brazil | 16,700,423 | ||
| CANADA—1.6% | |||
| Energy—1.6% | |||
| Enbridge, Inc. | 444,600 | 14,244,984 | |
| CHINA—2.3% | |||
| Communication Services—0.9% | |||
| Tencent Holdings Ltd. | 220,200 | 8,149,323 | |
| Financials—0.9% | |||
| Ping An Insurance Group Co. of China Ltd., H Shares | 1,652,900 | 8,384,294 | |
| Real Estate—0.5% | |||
| China Vanke Co. Ltd., H Shares | 4,490,800 | 4,201,394 | |
| Total China | 20,735,011 | ||
| DENMARK—1.4% | |||
| Financials—1.4% | |||
| Tryg A/S | 634,900 | 12,398,045 | |
| FINLAND—0.6% | |||
| Information Technology—0.6% | |||
| Nokia OYJ | 1,531,806 | 5,101,957 | |
| FRANCE—7.1% | |||
| Consumer Discretionary—1.1% | |||
| LVMH Moet Hennessy Louis Vuitton SE | 13,550 | 9,700,856 | |
| Consumer Staples—1.9% | |||
| Danone SA | 203,300 | 12,094,410 | |
| Pernod Ricard SA | 30,500 | 5,416,078 | |
| 17,510,488 | |||
| Energy—1.8% | |||
| TotalEnergies SE, ADR(a) | 240,300 | 16,003,980 | |
| Industrials—0.6% | |||
| Teleperformance SE | 44,600 | 5,130,858 | |
| Utilities—1.7% | |||
| Engie SA | 976,200 | 15,526,348 | |
| Total France | 63,872,530 | ||
| GERMANY—2.7% | |||
| Financials—1.2% | |||
| Muenchener Rueckversicherungs-Gesellschaft AG in Muenchen | 27,800 | 11,156,361 | |
| Utilities—1.5% | |||
| RWE AG | 343,400 | 13,140,340 | |
| Total Germany | 24,296,701 | ||
| HONG KONG—1.0% | |||
| Financials—1.0% | |||
| Hong Kong Exchanges & Clearing Ltd. | 266,500 | 9,322,874 | |
| Shares | Value | ||
| JAPAN—1.9% | |||
| Financials—1.1% | |||
| Mitsubishi UFJ Financial Group, Inc. | 1,232,700 | $ 10,341,302 | |
| Real Estate—0.8% | |||
| GLP J-REIT | 7,600 | 6,806,993 | |
| Total Japan | 17,148,295 | ||
| NETHERLANDS—4.6% | |||
| Consumer Staples—0.6% | |||
| Heineken NV | 62,500 | 5,615,216 | |
| Financials—1.1% | |||
| ING Groep NV, Series N | 793,700 | 10,175,651 | |
| Information Technology—2.9% | |||
| ASML Holding NV | 16,800 | 10,098,823 | |
| BE Semiconductor Industries NV | 152,800 | 15,784,194 | |
| 25,883,017 | |||
| Total Netherlands | 41,673,884 | ||
| NORWAY—1.0% | |||
| Communication Services—1.0% | |||
| Telenor ASA | 890,530 | 9,103,347 | |
| SINGAPORE—1.3% | |||
| Financials—1.3% | |||
| Oversea-Chinese Banking Corp. Ltd. | 1,298,471 | 12,038,269 | |
| SPAIN—1.7% | |||
| Communication Services—0.8% | |||
| Cellnex Telecom SA(b)(c) | 241,800 | 7,107,975 | |
| Consumer Discretionary—0.9% | |||
| Amadeus IT Group SA | 138,600 | 7,910,292 | |
| Total Spain | 15,018,267 | ||
| SWEDEN—0.6% | |||
| Industrials—0.6% | |||
| Atlas Copco AB, A Shares | 404,400 | 5,236,583 | |
| TAIWAN—1.4% | |||
| Information Technology—1.4% | |||
| Taiwan Semiconductor Manufacturing Co. Ltd., ADR | 752,000 | 12,282,045 | |
| UNITED KINGDOM—5.6% | |||
| Communication Services—0.8% | |||
| Vodafone Group PLC, ADR | 777,900 | 7,187,796 | |
| Consumer Discretionary—1.2% | |||
| Taylor Wimpey PLC | 7,944,607 | 10,730,324 | |
| Energy—0.1% | |||
| Capricorn Energy PLC | 655,111 | 1,243,825 | |
| Financials—1.1% | |||
| London Stock Exchange Group PLC | 98,400 | 9,928,071 | |
| Health Care—1.3% | |||
| AstraZeneca PLC, ADR | 192,300 | 12,159,129 | |
| Industrials—1.1% | |||
| Melrose Industries PLC | 1,664,770 | 9,478,821 | |
| Total United Kingdom | 50,727,966 | ||
| 2023 Annual Report | 15 |
| Shares | Value | ||
| COMMON STOCKS (continued) | |||
| UNITED STATES—64.8% | |||
| Communication Services—2.9% | |||
| Alphabet, Inc., Class C(a)(c) | 136,200 | $ 17,065,860 | |
| TKO Group Holdings, Inc. | 114,866 | 9,416,715 | |
| 26,482,575 | |||
| Consumer Discretionary—5.8% | |||
| Aptiv PLC(a)(c) | 91,100 | 7,943,920 | |
| Genuine Parts Co. | 72,500 | 9,342,350 | |
| Las Vegas Sands Corp. | 138,600 | 6,577,956 | |
| Lowe's Cos., Inc.(a) | 68,000 | 12,958,760 | |
| TJX Cos., Inc. (The)(a) | 177,700 | 15,650,039 | |
| 52,473,025 | |||
| Consumer Staples—6.2% | |||
| Coca-Cola Co. (The) | 239,400 | 13,523,706 | |
| Keurig Dr Pepper, Inc. | 303,500 | 9,205,155 | |
| Mondelez International, Inc., Class A(a) | 190,200 | 12,593,142 | |
| Nestle SA | 100,300 | 10,816,224 | |
| Target Corp.(a) | 85,500 | 9,472,545 | |
| 55,610,772 | |||
| Energy—1.3% | |||
| Williams Cos., Inc. (The) | 326,200 | 11,221,280 | |
| Financials—7.7% | |||
| Bank of America Corp.(a) | 306,700 | 8,078,478 | |
| Blackstone, Inc., Class A | 110,000 | 10,158,500 | |
| CME Group, Inc. | 50,700 | 10,822,422 | |
| Fidelity National Information Services, Inc. | 148,900 | 7,312,479 | |
| Goldman Sachs Group, Inc. (The) | 34,800 | 10,565,628 | |
| Huntington Bancshares, Inc.(a) | 766,300 | 7,394,795 | |
| JPMorgan Chase & Co. | 77,300 | 10,749,338 | |
| MetLife, Inc. | 61,900 | 3,714,619 | |
| 68,796,259 | |||
| Health Care—11.3% | |||
| AbbVie, Inc. | 91,000 | 12,847,380 | |
| Baxter International, Inc. | 157,300 | 5,101,239 | |
| Bristol-Myers Squibb Co.(a) | 162,900 | 8,394,237 | |
| CVS Health Corp. | 139,300 | 9,613,093 | |
| Eli Lilly & Co. | 27,100 | 15,011,503 | |
| Medtronic PLC(a) | 118,900 | 8,389,584 | |
| Merck & Co., Inc. | 89,100 | 9,150,570 | |
| Roche Holding AG | 42,200 | 10,875,344 | |
| Sanofi SA | 118,593 | 10,768,984 | |
| UnitedHealth Group, Inc.(a) | 21,900 | 11,728,764 | |
| 101,880,698 | |||
| Industrials—6.8% | |||
| FedEx Corp.(a) | 51,800 | 12,437,180 | |
| Ferrovial SE | 384,314 | 11,566,330 | |
| Norfolk Southern Corp.(a) | 39,400 | 7,517,126 | |
| Schneider Electric SE | 80,800 | 12,431,670 | |
| Stanley Black & Decker, Inc. | 87,400 | 7,433,370 | |
| Waste Management, Inc. | 62,100 | 10,204,893 | |
| 61,590,569 | |||
| Shares | Value | ||
| Information Technology—13.5% | |||
| Amdocs Ltd. | 142,100 | $ 11,390,736 | |
| Analog Devices, Inc. | 68,600 | 10,792,838 | |
| Apple, Inc.(a) | 213,600 | 36,476,472 | |
| Broadcom, Inc.(a) | 20,800 | 17,500,496 | |
| Cisco Systems, Inc.(a) | 245,300 | 12,787,489 | |
| Microsoft Corp.(a) | 97,200 | 32,864,292 | |
| 121,812,323 | |||
| Materials—4.2% | |||
| Air Products & Chemicals, Inc. | 30,700 | 8,670,908 | |
| Linde PLC | 35,700 | 13,639,534 | |
| Newmont Corp., CDI(c) | 410,840 | 15,743,832 | |
| 38,054,274 | |||
| Real Estate—2.0% | |||
| American Tower Corp., REIT | 46,400 | 8,268,016 | |
| Gaming and Leisure Properties, Inc., REIT | 206,800 | 9,386,652 | |
| 17,654,668 | |||
| Utilities—3.1% | |||
| CMS Energy Corp.(a) | 156,000 | 8,477,040 | |
| FirstEnergy Corp.(a) | 238,000 | 8,472,800 | |
| NextEra Energy Partners LP | 84,900 | 2,298,243 | |
| NextEra Energy, Inc.(a) | 146,000 | 8,511,800 | |
| 27,759,883 | |||
| Total United States | 583,336,326 | ||
| Total Common Stocks | 920,829,627 | ||
| PREFERRED STOCKS—1.2% | |||
| SOUTH KOREA—1.2% | |||
| Information Technology—1.2% | |||
| Samsung Electronics Co. Ltd. | 288,800 | 11,530,256 | |
| Total Preferred Stocks | 11,530,256 | ||
| SHORT-TERM INVESTMENT—0.7% | |||
| State Street Institutional U.S. Government Money Market Fund, Premier Class, 5.30%(d) | 6,062,282 | 6,062,282 | |
| Total Short-Term Investment | 6,062,282 | ||
| Total Investments (Cost $825,158,467)(e)—104.2% | 938,422,165 | ||
| Liabilities in Excess of Other Assets—(4.2%) | (38,157,740) | ||
| Net Assets—100.0% | $900,264,425 | ||
| (a) | All or a portion of the security has been designated as collateral for the line of credit. |
| (b) | Denotes a security issued under Regulation S or Rule 144A. |
| (c) | Non-income producing security. |
| (d) | Registered investment company advised by State Street Global Advisors. The rate shown is the 7 day yield as of October 31, 2023. |
| (e) | See accompanying Notes to Financial Statements for tax unrealized appreciation/(depreciation) of securities. |
| ADR | American Depositary Receipt |
| PLC | Public Limited Company |
| REIT | Real Estate Investment Trust |
| 16 | 2023 Annual Report |
| At October 31, 2023, the Fund held the following forward foreign currency contracts: |
| Sale Contracts Settlement Date | Counterparty | Currency Purchased | Amount Purchased | Currency Sold | Amount Sold | Fair Value | Unrealized Appreciation/ (Depreciation) | |
| United States Dollar/Euro | ||||||||
| 01/19/2024 | Royal Bank of Canada | USD | 78,301,417 | EUR | 73,500,000 | $78,061,941 | $239,476 | |
| 2023 Annual Report | 17 |
| Assets | abrdn Global Dynamic Dividend Fund | abrdn Total Dynamic Dividend Fund |
| Investments, at value | $ 243,449,838 | $ 932,359,883 |
| Short-term investments, at value | 1,616,230 | 6,062,282 |
| Cash | 211,645 | 746,526 |
| Receivable for investments sold | 776,454 | 3,004,170 |
| Interest and dividends receivable | 1,191,150 | 4,477,122 |
| Unrealized appreciation on forward foreign currency exchange contracts | 62,817 | 239,476 |
| Tax reclaim receivable | 1,023,352 | 4,417,690 |
| Prepaid expenses | 4,805 | 17,590 |
| Other assets | 42,701 | — |
| Total assets | 248,378,992 | 951,324,739 |
| Liabilities | ||
| Line of credit payable (Note 7) | 1,536,822 | 49,051,955 |
| Due to custodian | 225,682 | 862,565 |
| Investment management fees payable (Note 3) | 162,743 | 659,399 |
| Administration fees payable (Note 3) | 16,954 | 62,004 |
| Investor relations fees payable (Note 3) | 11,862 | 20,768 |
| Interest payable on line of credit | 2,280 | 207,460 |
| Other accrued expenses | 204,281 | 196,163 |
| Total liabilities | 2,160,624 | 51,060,314 |
| Net Assets | $246,218,368 | $900,264,425 |
| Cost: | ||
| Investments | 234,872,556 | 819,096,185 |
| Short-Term Investments | 1,616,230 | 6,062,282 |
| Composition of Net Assets | ||
| Paid-in capital in excess of par | 270,690,204 | 990,459,099 |
| Distributable accumulated loss | (24,471,836) | (90,194,674) |
| Net Assets | $246,218,368 | $900,264,425 |
| Net asset value per share | $9.90 | $8.54 |
| Shares issued and outstanding | 24,865,081 | 105,430,999 |
| 18 | 2023 Annual Report |
| abrdn Global Dynamic Dividend Fund | abrdn Total Dynamic Dividend Fund | |
| Net Investment Income | ||
| Investment Income: | ||
| Dividends | $ 19,652,286 | $ 81,099,979 |
| Interest and other income | 32,335 | 8,745 |
| Foreign taxes withheld | (1,744,510) | (7,135,892) |
| Total investment income | 17,940,111 | 73,972,832 |
| Expenses: | ||
| Investment management fee (Note 3) | 2,197,909 | 9,980,478 |
| Administration fee (Note 3) | 175,833 | 782,162 |
| Reports to shareholders and proxy solicitation | 95,608 | 187,540 |
| Investor relations fees and expenses (Note 3) | 77,734 | 251,396 |
| Custodian’s fees and expenses | 72,057 | 86,635 |
| Trustees' fees and expenses | 62,254 | 124,067 |
| Legal fees and expenses | 61,276 | 255,148 |
| Independent auditors’ fees and expenses | 46,110 | 77,610 |
| Transfer agent’s fees and expenses | 17,185 | 16,985 |
| Miscellaneous | 118,022 | 282,093 |
| Total operating expenses, excluding interest expense | 2,923,988 | 12,044,114 |
| Interest expense (Note 7) | 12,465 | 1,254,874 |
| Total operating expenses before reimbursed/waived expenses | 2,936,453 | 13,298,988 |
| Expenses waived (Note 3) | (317,076) | (840,966) |
| Net expenses | 2,619,377 | 12,458,022 |
| Net Investment Income | 15,320,734 | 61,514,810 |
| Net Realized/Unrealized Gain/(Loss) from Investments and Foreign Currency Related Transactions: | ||
| Net realized gain/(loss) from: | ||
| Investment transactions | (7,455,131) | (27,107,002) |
| Forward foreign currency exchange contracts | 201,771 | (537,447) |
| Foreign currency transactions | (256,914) | (406,718) |
| (7,510,274) | (28,051,167) | |
| Net change in unrealized appreciation/(depreciation) on: | ||
| Investments | (968,444) | 30,665,131 |
| Forward foreign currency exchange contracts | 102,221 | 595,365 |
| Foreign currency translation | 10,400 | 248,782 |
| (855,823) | 31,509,278 | |
| Net realized and unrealized gain (loss) from investments, forward foreign currency exchange contracts and foreign currencies | (8,366,097) | 3,458,111 |
| Change in Net Assets Resulting from Operations | $6,954,637 | $64,972,921 |
| 2023 Annual Report | 19 |
| abrdn Global Dynamic Dividend Fund | abrdn Total Dynamic Dividend Fund | |||
| For the Year Ended October 31, 2023 | For the Year Ended October 31, 2022 | For the Year Ended October 31, 2023 | For the Year Ended October 31, 2022 | |
| Increase/(Decrease) in Net Assets: | ||||
| Operations: | ||||
| Net investment income | $15,320,734 | $8,590,195 | $61,514,810 | $66,785,656 |
| Net realized gain from investments, forward foreign currency exchange contracts and foreign currency transactions | (7,510,274) | (1,672,175) | (28,051,167) | (14,762,307) |
| Net change in unrealized appreciation on investments, forward foreign currency exchange contracts and foreign currency translation | (855,823) | (33,562,796) | 31,509,278 | (228,759,665) |
| Net increase in net assets resulting from operations | 6,954,637 | (26,644,776) | 64,972,921 | (176,736,316) |
| Distributions to Shareholders From: | ||||
| Distributable earnings | (15,666,124) | (9,164,069) | (63,774,379) | (72,747,390) |
| Return of capital | (526,610) | (624,605) | (8,973,011) | – |
| Net increase in net assets from distributions | (16,192,734) | (9,788,674) | (72,747,390) | (72,747,390) |
| Proceeds from shares issued from the reorganization resulting in the addition of 12,315,499, 0, 0 and 0 shares of common stock, respectively (Note 11) | 129,362,047 | – | – | – |
| Change in net assets | 120,123,950 | (36,433,450) | (7,774,469) | (249,483,706) |
| Net Assets: | ||||
| Beginning of year | 126,094,418 | 162,527,868 | 908,038,894 | 1,157,522,600 |
| End of year | $246,218,368 | $126,094,418 | $900,264,425 | $908,038,894 |
| 20 | 2023 Annual Report |
| For the Fiscal Years Ended October 31, | |||||
| 2023 | 2022 | 2021 | 2020 | 2019 | |
| PER SHARE OPERATING PERFORMANCE(a): | |||||
| Net asset value, beginning of year | $10.05 | $12.95 | $10.16 | $11.14 | $10.80 |
| Net investment income | 0.75 | 0.68 | 0.82 | 0.70 | 0.76 |
| Net realized and unrealized gains/(losses) on investments, forward foreign currency exchange contracts and foreign currency transactions | (0.12) | (2.80) | 2.75 | (0.90) | 0.36 |
| Total from investment operations | 0.63 | (2.12) | 3.57 | (0.20) | 1.12 |
| Distributions to common shareholders from: | |||||
| Net investment income | (0.75) | (0.73) | (0.78) | (0.76) | (0.78) |
| Return of capital | (0.03) | (0.05) | – | (0.02) | – |
| Total distributions | (0.78) | (0.78) | (0.78) | (0.78) | (0.78) |
| Net asset value, end of year | $9.90 | $10.05 | $12.95 | $10.16 | $11.14 |
| Market price, end of year | $8.40 | $8.92 | $12.01 | $8.58 | $9.78 |
| Total Investment Return Based on(b): | |||||
| Market price | 2.29% | (19.88%) | 49.84% | (4.43%) | 14.71% |
| Net asset value | 7.00% | (16.28%) | 36.44% | (0.65%) | 11.91% |
| Ratio to Average Net Assets Applicable to Common Shareholders/Supplementary Data: | |||||
| Net assets applicable to common shareholders, end of year (000 omitted) | $246,218 | $126,094 | $162,528 | $127,512 | $139,776 |
| Average net assets applicable to common shareholders (000 omitted) | $219,791 | $146,601 | $157,694 | $132,667 | $134,835 |
| Net operating expenses, net of fee waivers | 1.19% | 1.18% | 1.18% | 1.18% | 1.21% |
| Net operating expenses, excluding fee waivers | 1.34% | 1.37% | 1.31% | 1.36% | 1.34% |
| Net operating expenses, net of fee waivers and excluding interest expense | 1.19% | 1.16% | 1.17% | 1.17% | 1.16% |
| Net Investment income | 6.97% | 5.86% | 6.56% | 6.59% | 7.06% |
| Portfolio turnover | 78%(c) | 81% | 71% | 105% | 119% |
| Line of credit payable outstanding (000 omitted) | $1,537 | $– | $311 | $– | $211 |
| Asset coverage ratio on revolving credit facility at year end(d) | 16,121% | – | 52,338% | – | 66,335% |
| Asset coverage per $1,000 on line of credit payable at year end | $161,213 | $– | $523,384 | $– | $663,350 |
| (a) | Based on average shares outstanding. |
| (b) | Total investment return is calculated assuming a purchase of common stock on the first day and a sale on the last day of each reporting period. Dividends and distributions, if any, are assumed, for purposes of this calculation, to be reinvested at prices obtained under the Fund’s dividend reinvestment plan. Total investment return does not reflect brokerage commissions. |
| (c) | The portfolio turnover calculation excludes $100,050,254 and $90,865,012 of proceeds received and cost of investments related to rebalancing the portfolio after the fund reorganization which occurred on March 10, 2023. |
| (d) | Asset coverage ratio is calculated by dividing net assets plus the amount of any borrowings, for investment purposes by the amount of the Line of Credit. |
| 2023 Annual Report | 21 |
| For the Fiscal Years Ended October 31, | |||||
| 2023 | 2022 | 2021 | 2020 | 2019 | |
| PER SHARE OPERATING PERFORMANCE(a): | |||||
| Net asset value, beginning of year | $8.61 | $10.98 | $8.76 | $9.56 | $9.33 |
| Net investment income | 0.58 | 0.63 | 0.66 | 0.63 | 0.64 |
| Net realized and unrealized gains/(losses) on investments, forward foreign currency exchange contracts and foreign currency transactions | 0.04 | (2.31) | 2.25 | (0.74) | 0.27 |
| Total from investment operations | 0.62 | (1.68) | 2.91 | (0.11) | 0.91 |
| Distributions to common shareholders from: | |||||
| Net investment income | (0.60) | (0.69) | (0.69) | (0.67) | (0.65) |
| Return of capital | (0.09) | – | – | (0.02) | (0.04) |
| Total distributions | (0.69) | (0.69) | (0.69) | (0.69) | (0.69) |
| Capital Share Transactions: | |||||
| Anti-Dilutive effect of share repurchase program | – | – | – | – | 0.01 |
| Net asset value, end of year | $8.54 | $8.61 | $10.98 | $8.76 | $9.56 |
| Market price, end of year | $7.26 | $7.50 | $10.05 | $7.31 | $8.44 |
| Total Investment Return Based on(b): | |||||
| Market price | 5.41% | (19.25%) | 47.64% | (5.47%) | 15.55% |
| Net asset value | 8.01% | (15.15%) | 34.60%(c) | 0.00%(c) | 11.39% |
| Ratio to Average Net Assets Applicable to Common Shareholders/Supplementary Data: | |||||
| Net assets applicable to common shareholders, end of year (000 omitted) | $900,264 | $908,039 | $1,157,523 | $924,011 | $1,007,850 |
| Average net assets applicable to common shareholders (000 omitted) | $977,703 | $1,049,849 | $1,129,413 | $964,667 | $981,093 |
| Net operating expenses, net of fee waivers | 1.27% | 1.16% | 1.16% | 1.15% | 1.22% |
| Net operating expenses, excluding fee waivers | 1.36% | 1.21% | 1.20% | 1.18% | 1.24% |
| Net operating expenses, net of fee waivers and excluding interest expense | 1.15% | 1.14% | 1.14% | 1.14% | 1.18% |
| Net Investment income | 6.29% | 6.36% | 6.14% | 6.93% | 6.94% |
| Portfolio turnover | 79% | 83% | 72% | 115% | 135% |
| Line of credit payable outstanding (000 omitted) | $49,052 | $12,250 | $4,092 | $– | $– |
| Asset coverage ratio on line of credit payable at year end(d) | 1,935% | 7,512% | 28,385% | – | – |
| Asset coverage per $1,000 on line of credit payable at year end | $19,353 | $75,124 | $283,852 | $– | $– |
| (a) | Based on average shares outstanding. |
| (b) | Total investment return is calculated assuming a purchase of common stock on the first day and a sale on the last day of each reporting period. Dividends and distributions, if any, are assumed, for purposes of this calculation, to be reinvested at prices obtained under the Fund’s dividend reinvestment plan. Total investment return does not reflect brokerage commissions. |
| (c) | The total return shown above includes the impact of financial statement rounding of the NAV per share and/or financial statement adjustments. |
| (d) | Asset coverage ratio is calculated by dividing net assets plus the amount of any borrowings, for investment purposes by the amount of the Line of Credit. |
| 22 | 2023 Annual Report |
October 31, 2023
| Acquired Fund | AGD NAV per Share ($) March 10, 2023 | Conversion Ratio | Shares Issued |
| Delaware Enhanced Global Dividend and Income Fund (“DEX”) | 10.5040 | 0.835659 | 6,212,854 |
| Delaware Investments® Dividend and Income Fund, Inc. (“DDF”) | 10.5040 | 0.801802 | 6,102,645 |
| 2023 Annual Report | 23 |
October 31, 2023
| 24 | 2023 Annual Report |
October 31, 2023
| Security Type | Standard Inputs |
| Debt and other fixed-income securities | Reported trade data, broker-dealer price quotations, benchmark yields, issuer spreads on comparable securities, credit quality, yield, and maturity. |
| Foreign equities utilizing a fair value factor | Depositary receipts, indices, futures, sector indices/ETFs, exchange rates, and local exchange opening and closing prices of each security. |
| Forward foreign currency contracts | Forward exchange rate quotations. |
| abrdn Global Dynamic Dividend Fund | ||||
| Investments, at Value | Level 1 – Quoted Prices | Level 2 – Other Significant Observable Inputs | Level 3 – Significant Unobservable Inputs | Total |
| abrdn Global Dynamic Dividend Fund | ||||
| Assets | ||||
| Investments in Securities | ||||
| Common Stocks | $154,042,364 | $86,396,651 | $– | $240,439,015 |
| Corporate Bonds | – | 500 | – | 500 |
| Preferred Stocks | – | 3,010,323 | – | 3,010,323 |
| Short-Term Investment | 1,616,230 | – | – | 1,616,230 |
| Total Investments | $155,658,594 | $89,407,474 | $– | $245,066,068 |
| Other Financial Instruments | ||||
| Foreign Currency Exchange Contracts | $– | $62,817 | $– | $62,817 |
| Total Investment Assets | $155,658,594 | $89,470,291 | $– | $245,128,885 |
| abrdn Total Dynamic Dividend Fund | ||||
| Investments, at Value | Level 1 – Quoted Prices | Level 2 – Other Significant Observable Inputs | Level 3 – Significant Unobservable Inputs | Total |
| abrdn Total Dynamic Dividend Fund | ||||
| Assets | ||||
| Investments in Securities | ||||
| Common Stocks | $587,126,672 | $333,702,955 | $– | $920,829,627 |
| Preferred Stocks | – | 11,530,256 | – | 11,530,256 |
| Short-Term Investment | 6,062,282 | – | – | 6,062,282 |
| Total Investments | $593,188,954 | $345,233,211 | $– | $938,422,165 |
| Other Financial Instruments | ||||
| Foreign Currency Exchange Contracts | $– | $239,476 | $– | $239,476 |
| Total Investment Assets | $593,188,954 | $345,472,687 | $– | $938,661,641 |
| 2023 Annual Report | 25 |
October 31, 2023
| 26 | 2023 Annual Report |
October 31, 2023
| Risk Exposure Category | |||||||
| Interest Rate Contracts | Foreign Currency Contracts | Credit Contracts | Equity Contracts | Commodity Contracts | Other | Total | |
| abrdn Global Dynamic Dividend Fund | |||||||
| Assets: | |||||||
| Unrealized appreciation on: | |||||||
| Forward Foreign Currency Exchange Contracts | $– | $62,817 | $– | $– | $– | $– | $62,817 |
| Total | $– | $62,817 | $– | $– | $– | $– | $62,817 |
| Risk Exposure Category | |||||||
| Interest Rate Contracts | Foreign Currency Contracts | Credit Contracts | Equity Contracts | Commodity Contracts | Other | Total | |
| abrdn Total Dynamic Dividend Fund | |||||||
| Assets: | |||||||
| Unrealized appreciation on: | |||||||
| Forward Foreign Currency Exchange Contracts | $– | $239,476 | $– | $– | $– | $– | $239,476 |
| Total | $– | $239,476 | $– | $– | $– | $– | $239,476 |
| 2023 Annual Report | 27 |
October 31, 2023
| abrdn Global Dynamic Dividend Fund | ||||||||
| Gross Amounts Not Offset in the Statement of Assets and Liabilities | Gross Amounts Not Offset in the Statement of Assets and Liabilities | |||||||
| Gross Amounts of Assets Presented in Statement of Assets and Liabilities | Financial Instruments | Collateral Received(1) | Net Amount(2) | Gross Amounts of Liabilities Presented in Statement of Assets and Liabilities | Financial Instruments | Collateral Pledged(1) | Net Amount(2) | |
| Description | Assets | Liabilities | ||||||
| Foreign Currency Exchange Contracts(3) | ||||||||
| Royal Bank of Canada | $62,817 | $– | $– | $62,817 | $– | $– | $– | $– |
| (1) | In some instances, the actual collateral received and/or pledged may be more than the amount shown here due to overcollateralization. |
| (2) | Net amounts represent the net receivables/(payable) that would be due from/to the counterparty in the event of default. Exposure from financial derivative instruments can only be netted across transactions governed under the same master netting agreement with the same legal entity. |
| (3) | Includes financial instrument which are not subject to a master netting arrangement across funds, or another similar arrangement. |
| abrdn Total Dynamic Dividend Fund | ||||||||
| Gross Amounts Not Offset in the Statement of Assets and Liabilities | Gross Amounts Not Offset in the Statement of Assets and Liabilities | |||||||
| Gross Amounts of Assets Presented in Statement of Assets and Liabilities | Financial Instruments | Collateral Received(1) | Net Amount(2) | Gross Amounts of Liabilities Presented in Statement of Assets and Liabilities | Financial Instruments | Collateral Pledged(1) | Net Amount(2) | |
| Description | Assets | Liabilities | ||||||
| Foreign Currency Exchange Contracts(3) | ||||||||
| Royal Bank of Canada | $239,476 | $– | $– | $239,476 | $– | $– | $– | $– |
| (1) | In some instances, the actual collateral received and/or pledged may be more than the amount shown here due to overcollateralization. |
| (2) | Net amounts represent the net receivables/(payable) that would be due from/to the counterparty in the event of default. Exposure from financial derivative instruments can only be netted across transactions governed under the same master netting agreement with the same legal entity. |
| (3) | Includes financial instrument which are not subject to a master netting arrangement across funds, or another similar arrangement. |
| 28 | 2023 Annual Report |
October 31, 2023
| Risk Exposure Category | ||||||
| Interest Rate Contracts | Foreign Currency Contracts | Credit Contracts | Equity Contracts | Commodity Contracts | Total | |
| abrdn Global Dynamic Dividend Fund | ||||||
| Realized Gain/(Loss) on Derivatives Recognized as a Result of Operations: | ||||||
| Net realized gain/(loss) on: | ||||||
| Forward Currency Contracts | $– | $201,771 | $– | $– | $– | $201,771 |
| Total | $– | $201,771 | $– | $– | $– | $201,771 |
| Net Change in Unrealized Appreciation/(Depreciation) on Derivatives Recognized as a Result of Operations: | ||||||
| Net change in unrealized appreciation/(depreciation) of: | ||||||
| Forward Currency Contracts | $– | $102,221 | $– | $– | $– | $102,221 |
| Total | $– | $102,221 | $– | $– | $– | $102,221 |
| Risk Exposure Category | ||||||
| Interest Rate Contracts | Foreign Currency Contracts | Credit Contracts | Equity Contracts | Commodity Contracts | Total | |
| abrdn Total Dynamic Dividend Fund | ||||||
| Realized Gain/(Loss) on Derivatives Recognized as a Result of Operations: | ||||||
| Net realized gain/(loss) on: | ||||||
| Forward Currency Contracts | $– | $(537,447) | $– | $– | $– | $(537,447) |
| Total | $– | $(537,447) | $– | $– | $– | $(537,447) |
| Net Change in Unrealized Appreciation/(Depreciation) on Derivatives Recognized as a Result of Operations: | ||||||
| Net change in unrealized appreciation/(depreciation) of: | ||||||
| Forward Currency Contracts | $– | $595,365 | $– | $– | $– | $595,365 |
| Total | $– | $595,365 | $– | $– | $– | $595,365 |
| Derivative held in AGD | Average Notional Value |
| Foreign Currency Contracts Sold | $17,084,620 |
| Derivative held in AOD | Average Notional Value |
| Foreign Currency Contracts Sold | $75,550,527 |
| 2023 Annual Report | 29 |
October 31, 2023
| 30 | 2023 Annual Report |
October 31, 2023
| Amount Fiscal Year 2021 (Expires 10/31/24) | $209,854 | |
| Amount Fiscal Year 2022 (Expires 10/31/25) | $281,603 | |
| Amount Fiscal Year 2023 (Expires 10/31/26) | $317,076 | |
| Total* | $808,533 |
| * | Amounts reported are due to expire throughout the respective 3-year expiration period presented above. |
| Amount Fiscal Year 2021 (Expires 10/31/24) | $491,643 | |
| Amount Fiscal Year 2022 (Expires 10/31/25) | $593,179 | |
| Amount Fiscal Year 2023 (Expires 10/31/26) | $840,966 | |
| Total* | $1,925,788 |
| * | Amounts reported are due to expire throughout the respective 3-year expiration period presented above. |
| 2023 Annual Report | 31 |
October 31, 2023
| Fund | Max Borrowing | Average Borrowing | Average interest rate on Borrowing | Interest expense related to Line of Credit |
| AGD | $5,155,816 | $1,486,562 | 5.73% | $12,465 |
| AOD | $60,553,874 | $21,767,067 | 5.80% | $1,254,874 |
| 32 | 2023 Annual Report |
October 31, 2023
| 2023 Annual Report | 33 |
October 31, 2023
| Fund | Tax Cost of Securities | Unrealized Appreciation | Unrealized Depreciation | Net Unrealized Appreciation/ (Depreciation) |
abrdn Global Dynamic Dividend Fund | $238,857,748 | $35,422,859 | $(29,214,539) | $6,208,320 |
abrdn Total Dynamic Dividend Fund | 840,597,331 | 221,313,326 | (123,488,492) | 97,824,834 |
| Distributions paid from | ||||
| Fund | Ordinary Income | Net Long Term Capital Gains | Return of Capital | Total tax character of distributions |
| abrdn Global Dynamic Dividend Fund | $15,666,124 | $– | $526,610 | $16,192,734 |
| abrdn Total Dynamic Dividend Fund | 63,774,379 | – | 8,973,011 | 72,747,390 |
| 34 | 2023 Annual Report |
October 31, 2023
| Distributions paid from | ||||
| Fund | Ordinary Income | Net Long Term Capital Gains | Return of Capital | Total tax character of distributions |
| abrdn Global Dynamic Dividend Fund | $9,164,069 | $– | $624,605 | $9,788,674 |
| abrdn Total Dynamic Dividend Fund | 72,747,390 | – | – | 72,747,390 |
| Fund | Undistributed Ordinary Income | Undistributed Long-Term Capital Gains | Capital loss carryforward* | Other currency gains | Other Temporary Differences | Unrealized Appreciation/ (Depreciation)** | Total Accumulated Earnings/(losses) - net |
| abrdn Global Dynamic Dividend Fund | $- | $- | $(30,653,718) | $- | $(26,438) | $6,208,320 | $(24,471,836) |
| abrdn Total Dynamic Dividend Fund | - | - | (188,126,550) | - | 107,042 | 97,824,834 | (90,194,674) |
| * | On October 31, 2023, the Funds had net capital loss carryforwards which will be available to offset like amounts of any future taxable gains. The Funds are permitted to carry forward capital losses for an unlimited period, and capital losses that are carried forward will retain their character as either short-term or long-term capital losses. |
| ** | The difference between book-basis and tax-basis unrealized appreciation/(depreciation) is attributable to the tax deferral of wash sales and corporate actions. |
| Fund | Amounts | Expires |
| abrdn Global Dynamic Dividend Fund | $25,767,768 | Unlimited (Short—Term) |
| abrdn Global Dynamic Dividend Fund | 4,885,950 | Unlimited (Long—Term) |
| abrdn Total Dynamic Dividend Fund | 188,126,550 | Unlimited (Short—Term) |
| Fund | Paid-in Capital | Distributable Earnings/ (Accumulated Loss) |
| abrdn Global Dynamic Dividend Fund | $8,891,820 | $(8,891,820) |
| abrdn Total Dynamic Dividend Fund | (4,156,063) | 4,156,063 |
| 2023 Annual Report | 35 |
October 31, 2023
| Net investment income | $15,776,428 |
| Net realized and unrealized loss from investments | (130,691) |
| Net increase in net assets from operations | 15,645,737 |
| Shares Outstanding | Net Assets | Net Asset Value Per Share | Net Unrealized Appreciation (Depreciation) | Accumulated Net Realized Gain/(Loss) | |
| Before Reorganization | |||||
| Delaware Enhanced Global Dividend and Income Fund | 7,434,680 | $ 65,259,860 | $ 8.78 | $ (2,610,551) | $ (17,659,389) |
| Delaware Investments® Dividend and Income Fund, Inc. | 7,611,158 | 64,102,187 | 8.42 | 2,889,325 | 48,264,144 |
| abrdn Global Dynamic Dividend Fund | 12,549,582 | 131,820,591 | 10.50 | 15,599,066 | (22,032,091) |
| Total | $261,182,638 | $ 15,877,840 | $ 8,572,664 |
| Shares Outstanding | Net Assets | Net Asset Value Per Share | Net Unrealized Appreciation (Depreciation) | Accumulated Net Realized Gain/(Loss) | |
| After Reorganization | |||||
| abrdn Global Dynamic Dividend Fund | 24,865,081 | $261,182,638 | $10.50 | $15,877,840 | $8,572,664 |
| 36 | 2023 Annual Report |
October 31, 2023
| 2023 Annual Report | 37 |
abrdn Global Dynamic Dividend Fund and abrdn Total Dynamic Dividend Fund:

December 28, 2023
| 38 | 2023 Annual Report |
| 2023 Annual Report | 39 |
| Votes For | Votes Against/ Withheld | Votes Abstained | |
| 6,515,118 | 594,880 | 231,261 |
| Votes For | Votes Against/ Withheld | |
| Nancy Yao | 16,990,343 | 1,963,612 |
| Stephen Bird | 17,208,832 | 1,745,123 |
| Votes For | Votes Against/ Withheld | |
| Nancy Yao | 75,140,466 | 11,978,073 |
| Stephen Bird | 80,745,035 | 6,373,505 |
| 40 | 2023 Annual Report |
| 2023 Annual Report | 41 |
| • | the nature, quality, cost and extent of administrative services and investor relations services provided by abrdn Inc., an affiliate of the Adviser, under separate agreements covering administrative services and investor relations services. |
| • | whether each Fund has operated in accordance with its respective investment objective and each Fund’s record of compliance with its investment restrictions, and the compliance programs of the Adviser. The Trustees also considered the compliance-related resources the Adviser and its affiliates were providing to the Funds. |
| • | the effect of any market and economic volatility on the performance, asset levels and expense ratios of the Funds. |
| • | so-called “fallout benefits” to the Adviser and its affiliates, including indirect The Trustees considered any possible conflicts of interest associated with these fallout and other benefits, and the reporting, disclosure and other processes in place to disclose and monitor such possible conflicts of interest. |
| 42 | 2023 Annual Report |
| 2023 Annual Report | 43 |
| 44 | 2023 Annual Report |
| 2023 Annual Report | 45 |
| 46 | 2023 Annual Report |
| 2023 Annual Report | 47 |
| 48 | 2023 Annual Report |
| 2023 Annual Report | 49 |
| 50 | 2023 Annual Report |
| 2023 Annual Report | 51 |
| 52 | 2023 Annual Report |
| 2023 Annual Report | 53 |
| 54 | 2023 Annual Report |
| 2023 Annual Report | 55 |
| 56 | 2023 Annual Report |
| • | the likelihood of greater volatility of NAV and market price of common shares because changes in value of the Fund's portfolio (including changes in the value of any interest rate swap, if applicable) are borne entirely by the common shareholders; |
| • | the possibility either that share income will fall if the interest rate on any borrowings or the dividend rate on any preferred shares issued rises, or that share income and distributions will fluctuate because the interest rate on any borrowings or the dividend rate on any preferred shares issued varies; and |
| • | if the Fund leverages through issuing preferred shares or borrowings, the Fund may not be permitted to declare dividends or other distributions with respect to its common shares or purchase its capital stock, unless at the time thereof the Fund meets certain asset coverage requirements. |
| 2023 Annual Report | 57 |
| 58 | 2023 Annual Report |
| 2023 Annual Report | 59 |
| 60 | 2023 Annual Report |
| 1. | Borrow money, except as permitted by the 1940 Act. The Fund may borrow money as a temporary measure for extraordinary or emergency purposes, including the payment of dividends and the settlement of securities transactions which otherwise might require untimely dispositions of Fund securities. The 1940 Act currently requires that any indebtedness incurred by a closed-end investment company have an asset coverage of at least 300%. The Fund may not pledge, mortgage, hypothecate or otherwise encumber its assets, except to secure permitted borrowings and to implement collateral and similar arrangements incident to permitted investment practices; |
| 2. | Issue senior securities, as defined in the 1940 Act, other than (a) preferred shares which immediately after issuance will have asset coverage of at least 200%, (b) indebtedness which immediately after issuance will have asset coverage of at least 300% or (c) the borrowings permitted by investment restriction (1) above. The 1940 Act currently defines "senior security" as any bond, debenture, note or similar obligation or instrument constituting a security and evidencing indebtedness, and any stock of a class having priority over any other class as to distribution of assets or payment of dividends. Debt and equity securities issued by a closed-end investment company meeting the foregoing asset coverage provisions are excluded from the general 1940 Act prohibition on the issuance of senior securities; |
| 3. | Purchase securities on margin (but the Fund may obtain such short-term credits as may be necessary for the clearance of purchases and sales of securities). The purchase of investment assets with the proceeds of a permitted borrowing or securities offering will not be deemed to be the purchase of securities on margin; |
| 4. | Underwrite securities issued by other persons, except insofar as it may technically be deemed to be an underwriter under the Securities Act in selling or disposing of a portfolio investment; |
| 5. | Make loans to other persons, except by (a) the acquisition of loan interests, debt securities and other obligations in which the Fund is authorized to invest in accordance with its investment objectives and policies and (b) entering into repurchase agreements; |
| 6. | Purchase or sell real estate, although it may purchase and sell securities which are secured by interests in real estate and securities of issuers which invest or deal in real estate. The Fund |
| 2023 Annual Report | 61 |
| reserves the freedom of action to hold and to sell real estate acquired as a result of the ownership of securities; |
| 7. | Purchase or sell physical commodities or contracts for the purchase or sale of physical commodities. Physical commodities do not include futures contracts with respect to securities, securities indices, currencies, interest or other financial instruments; and |
| 8. | With respect to 75% of its total assets, invest more than 5% of its total assets in the securities of a single issuer or purchase more than 10% of the outstanding voting securities of a single issuer, except obligations issued or guaranteed by the U.S. government, its agencies or instrumentalities and except securities of other investment companies; or invest 25% or more of its total assets in any single industry or group of industries (other than securities issued or guaranteed by the U.S. government or its agencies or instrumentalities). |
| 9. | Sell a security short if, as a result of such sale, the current value of securities sold short by that Fund would exceed 10% of the value of that Fund's total assets; provided, however, if the Fund owns or has the right to obtain securities equivalent in kind and amount to the securities sold short (i.e., short sales "against the box"), this limitation is not applicable. The Fund has no current intention to take short positions in securities. However, if the Fund does take any short positions, it will maintain sufficient segregated liquid assets to cover the short position. |
| Assumed annual returns on the Fund's portfolio (net of expenses) | (10%) | (5%) | 0% | 5% | 10% |
| Corresponding return of shareholder | (10.1%) | (5.1%) | (0.0%) | 5.0% | 10.0% |
| 62 | 2023 Annual Report |
| 2023 Annual Report | 63 |
| 64 | 2023 Annual Report |
| 2023 Annual Report | 65 |
| 66 | 2023 Annual Report |
| 2023 Annual Report | 67 |
| 68 | 2023 Annual Report |
| 2023 Annual Report | 69 |
| 70 | 2023 Annual Report |
| 2023 Annual Report | 71 |
| 72 | 2023 Annual Report |
| 2023 Annual Report | 73 |
| 74 | 2023 Annual Report |
| 2023 Annual Report | 75 |
| 76 | 2023 Annual Report |
| • | the likelihood of greater volatility of NAV and market price of common shares because changes in value of the Fund's portfolio (including changes in the value of any interest rate swap, if applicable) are borne entirely by the common shareholders; |
| • | the possibility either that share income will fall if the interest rate on any borrowings or the dividend rate on any preferred shares issued rises, or that share income and distributions will fluctuate because the interest rate on any borrowings or the dividend rate on any preferred shares issued varies; and |
| 2023 Annual Report | 77 |
| • | if the Fund leverages through issuing preferred shares or borrowings, the Fund may not be permitted to declare dividends or other distributions with respect to its common shares or purchase its capital stock, unless at the time thereof the Fund meets certain asset coverage requirements. |
| 78 | 2023 Annual Report |
| 2023 Annual Report | 79 |
| 80 | 2023 Annual Report |
| 2023 Annual Report | 81 |
| 1. | Borrow money, except as permitted by the 1940 Act. The Fund may borrow money for investment purposes, commonly referred to as leverage, and for extraordinary or emergency purposes, including the payment of dividends and the settlement of securities transactions which otherwise might require untimely dispositions of Fund securities. The 1940 Act currently requires that any indebtedness incurred by a closed-end investment company have an asset coverage of at least 300%. The Fund may not pledge, mortgage, hypothecate or otherwise encumber its assets, except to secure permitted |
| 82 | 2023 Annual Report |
| borrowings and to implement collateral and similar arrangements incident to permitted investment practices; |
| 2. | Issue senior securities, as defined in the 1940 Act, other than (a) preferred shares which immediately after issuance will have asset coverage of at least 200%, (b) indebtedness which immediately after issuance will have asset coverage of at least 300% or (c) the borrowings permitted by investment restriction (1) above. The 1940 Act currently defines "senior security" as any bond, debenture, note or similar obligation or instrument constituting a security and evidencing indebtedness, and any stock of a class having priority over any other class as to distribution of assets or payment of dividends. Debt and equity securities issued by a closed-end investment company meeting the foregoing asset coverage provisions are excluded from the general 1940 Act prohibition on the issuance of senior securities; |
| 3. | Purchase securities on margin (but the Fund may obtain such short-term credits as may be necessary for the clearance of purchases and sales of securities). The purchase of investment assets with the proceeds of a permitted borrowing or securities offering will not be deemed to be the purchase of securities on margin; |
| 4. | Underwrite securities issued by other persons, except insofar as it may technically be deemed to be an underwriter under the Securities Act in selling or disposing of a portfolio investment; |
| 5. | Make loans to other persons, except by (a) the acquisition of loan interests, debt securities and other obligations in which the Fund is authorized to invest in accordance with its investment objectives and policies and (b) entering into repurchase agreements; |
| 6. | Purchase or sell real estate, although it may purchase and sell securities which are secured by interests in real estate and securities of issuers which invest or deal in real estate. The Fund reserves the freedom of action to hold and to sell real estate acquired as a result of the ownership of securities; |
| 7. | Purchase or sell physical commodities or contracts for the purchase or sale of physical commodities. Physical commodities do not include futures contracts with respect to securities, securities indices, currencies, interest or other financial instruments; and |
| 8. | With respect to 75% of its total assets, invest more than 5% of its total assets in the securities of a single issuer or purchase more than 10% of the outstanding voting securities of a single issuer, except obligations issued or guaranteed by the U.S. government, its agencies or instrumentalities and except securities of other investment companies; or invest 25% or more of its total assets in any single industry or group of industries |
| (other than securities issued or guaranteed by the U.S. government or its agencies or instrumentalities). |
| Assumed annual returns on the Fund's portfolio (net of expenses) | (10%) | (5%) | 0% | 5% | 10% |
| Corresponding return of shareholder | (10.9%) | (5.6%) | (0.3%) | 4.9% | 10.2% |
| 2023 Annual Report | 83 |
| 84 | 2023 Annual Report |
| 2023 Annual Report | 85 |
| 86 | 2023 Annual Report |
| Name, Address and Year of Birth | Position(s) Held with the Funds | Term of Office and Length of Time Served | Principal Occupation(s) During at Least the Past Five Years | Number of Registered Investment Companies ("Registrants") consisting of Investment Portfolios ("Portfolios") in Fund Complex* Overseen by Board Members | Other Directorships Held by Board Member** |
| Interested Board Members | |||||
| Stephen Bird† c\o abrdn Inc. 1900 Market Street Suite 200 Philadelphia, PA 19103 Year of Birth: 1967 | Class III Trustee | Term as Trustee expires 2026; Trustee since 2021 | Mr. Bird joined the Board of abrdn plc in July 2020 as Chief Executive-Designate, and was formally appointed Chief Executive Officer in September 2020. Previously, Mr. Bird served as chief executive officer of global consumer banking at Citigroup from 2015, retiring from the role in November 2019. His responsibilities encompassed all consumer and commercial banking businesses in 19 countries, including retail banking and wealth management, credit cards, mortgages, and operations and technology supporting these businesses. Prior to this, Mr. Bird was chief executive for all of Citigroup’s Asia Pacific business lines across 17 markets in the region, including India and China. Mr. Bird joined Citigroup in 1998, and during his 21 years with the company he held a number of leadership roles in banking, operations and technology across its Asian and Latin American businesses. Before this, he held management positions in the UK at GE Capital – where he was director of UK operations from 1996 to 1998 – and at British Steel. | 15 Registrants consisting of 33 Portfolios | None. |
| 2023 Annual Report | 87 |
| Name, Address and Year of Birth | Position(s) Held with the Funds | Term of Office and Length of Time Served | Principal Occupation(s) During at Least the Past Five Years | Number of Registered Investment Companies ("Registrants") consisting of Investment Portfolios ("Portfolios") in Fund Complex* Overseen by Board Members | Other Directorships Held by Board Member** |
| Independent Board Members | |||||
| P. Gerald Malone c\o abrdn Inc. 1900 Market Street Suite 200 Philadelphia, PA 19103 Year of Birth: 1950 | Chair of the Board; Class II Trustee | Term expires 2025; Trustee since 2018 | Mr. Malone is, by profession, a lawyer of over 40 years. Currently, he is a non-executive director of a number of U.S. companies, including Medality Medical (medical technology company) since 2018. He is also Chairman of many of the open and closed end funds in the Fund Complex. He previously served as a non-executive director of U.S. healthcare company Bionik Laboratories Corp. (2018 - July 2022), as Independent Chairman of UK companies Crescent OTC Ltd (pharmaceutical services) until February 2018; and fluidOil Ltd. (oil services) until June 2018; U.S. company Rejuvenan llc (wellbeing services) until September 2017 and as chairman of UK company Ultrasis plc (healthcare software services company) until October 2014. Mr. Malone was previously a Member of Parliament in the U.K. from 1983 to 1997 and served as Minister of State for Health in the U.K. government from 1994 to 1997. | 9 Registrants consisting of 27 Portfolios | None. |
| Todd Reit c\o abrdn Inc. 1900 Market Street Suite 200 Philadelphia, PA 19103 Year of Birth: 1968 | Class II Trustee | Term expires 2025, Trustee since 2023 | Mr. Reit is a a Managing Member of Cross Brook Partners LLC, a real estate investment and management company since 2017. Mr. Reit is also Director and Financial Officer of Shelter Our Soldiers, a charity to support military veterans, since 2016. Mr. Reit was formerly a Managing Director and Global Head of Asset Management Investment Banking for UBS AG, where he was responsible for overseeing all the bank’s asset management client relationships globally, including all corporate security transactions, mergers and acquisitions. Mr. Reit retired from UBS in 2017 after an over 25-year career at the company and its predecessor company, PaineWebber Incorporated (merged with UBS AG in 2000). | 9 Registrants consisting of 9 Portfolios | None. |
| 88 | 2023 Annual Report |
| Name, Address and Year of Birth | Position(s) Held with the Funds | Term of Office and Length of Time Served | Principal Occupation(s) During at Least the Past Five Years | Number of Registered Investment Companies ("Registrants") consisting of Investment Portfolios ("Portfolios") in Fund Complex* Overseen by Board Members | Other Directorships Held by Board Member** |
| John Sievwright c\o abrdn Inc. 1900 Market Street Suite 200 Philadelphia, PA 19103 Year of Birth: 1955 | Class I Trustee | Term expires 2024; Trustee since 2018 | Mr. Sievwright is a Non-Executive Director of Burford Capital Ltd (since May 2020) (provider of legal, finance, complex strategies, post-settlement finance and asset management services and products) and Revolut Limited, a UK-based digital banking firm (since August 2021); and Chair of the Board of LoopFX (fin-tech start-up operating in large foreign currency institutional transactions) (since Sept. 2022). | 6 Registrants consisting of 8 Portfolios | Non-Executive Director of Burford Capital Ltd (provider of legal finance, complex strategies, post-settlement finance and asset management services and products) since May 2020. |
| Nancy Yao c\o abrdn Inc. 1900 Market Street Suite 200 Philadelphia, PA 19103 Year of Birth: 1972 | Class III Trustee | Term expires 2026; Trustee since 2018 | Ms. Yao is a lecturer on accounting and governance at Yale University. She is also a strategic consultant. Ms. Yao was the President of the Museum of Chinese in America from 2015 until 2023. Prior to that, she served as the executive director of the Yale-China Association and managing director of the corporate program at the Council on Foreign Relations. Prior to her work in non-profit, Ms. Yao launched the Asia coverage at the Center for Financial Research and Analysis (currently known as RiskMetrics), served as the inaugural director of policy research of Goldman Sachs’ Global Markets Institute, and was an investment banker at Goldman Sachs (Asia) L.L.C. Ms. Yao is a board member of the National Committee on U.S.-China Relations, a member of the Council on Foreign Relations. | 8 Registrants consisting of 8 Portfolios | None. |
| * | As of the most recent fiscal year end, the Fund Complex has a total of 18 Registrants with each Board member serving on the Boards of the number of Registrants listed. Each Registrant in the Fund Complex has one Portfolio except for two Registrants that are open-end funds, abrdn Funds and abrdn ETFs, which each have multiple Portfolios. The Registrants in the Fund Complex are as follows: abrdn Asia-Pacific Income Fund, Inc., abrdn Global Income Fund, Inc., abrdn Australia Equity Fund, Inc., abrdn Emerging Markets Equity Income Fund, Inc., The India Fund, Inc., abrdn Japan Equity Fund, Inc., abrdn Income Credit Strategies Fund, abrdn Global Dynamic Dividend Fund, abrdn Global Premier Properties Fund, abrdn Total Dynamic Dividend Fund, abrdn Global Infrastructure Income Fund, abrdn National Municipal Income Fund, abrdn Healthcare Investors, abrdn Life Sciences Investors, abrdn Healthcare Opportunities Fund, abrdn World Healthcare Fund, abrdn Funds (19 Portfolios), and abrdn ETFs (3 Portfolios). |
| ** | Current directorships (excluding Fund Complex) as of the most recent fiscal year end held in (1) any other investment companies registered under the 1940 Act, (2) any company with a class of securities registered pursuant to Section 12 of the Securities Exchange Act of 1934, as amended (the “1934 Act”) or (3) any company subject to the requirements of Section 15(d) of the Exchange Act. |
| † | Mr. Bird is considered to be an “interested person” of the Fund as defined in the 1940 Act because of his affiliation with abrdn. |
| 2023 Annual Report | 89 |
| Name, Address and Year of Birth | Position(s) Held with the Funds | Term of Office* and Length of Time Served | Principal Occupation(s) During at Least the Past Five Years |
| Joseph Andolina** c\o abrdn Inc. 1900 Market Street Suite 200 Philadelphia, PA 19103 Year of Birth: 1978 | Chief Compliance Officer and Vice President –Compliance | Since 2018 | Currently, Chief Risk Officer – Americas for abrdn Inc. and serves as the Chief Compliance Officer for abrdn Inc. Prior to joining the Risk and Compliance Department, he was a member of abrdn Inc.'s Legal Department, where he served as US Counsel since 2012. |
| Martin Connaghan** c\o abrdn Inc. 1900 Market Street Suite 200 Philadelphia, PA 19103 Year of Birth: 1980 | Vice President | Since 2018 | Currently an Investment Director on the Global Equity Team at abrdn. Martin joined abrdn in 2001, via the acquisition of Murray Johnstone. |
| Katherine Corey** c\o abrdn Inc. 1900 Market Street Suite 200 Philadelphia, PA 19103 Year of Birth: 1985 | Vice President | Since 2023 | Currently, Senior Legal Counsel, Product Governance US for abrdn Inc. Ms. Corey joined abrdn Inc. as U.S. Counsel in 2013. |
| Joshua Duitz** c\o abrdn Inc. 1900 Market Street Suite 200 Philadelphia, PA 19103 Year of Birth: 1970 | Vice President | Since 2018 | Currently, Head of Global Income at abrdn Inc. Mr. Duitz joined abrdn Inc. in 2018 from Alpine Woods Capital Investors LLC where he was a Portfolio Manager. |
| Sharon Ferrari** c\o abrdn Inc. 1900 Market Street Suite 200 Philadelphia, PA 19103 Year of Birth: 1977 | Treasurer and Chief Financial Officer | Treasurer and Chief Financial Officer Since 2023; Fund Officer Since 2018 | Currently, Director, Product Management for abrdn Inc. Ms. Ferrari joined abrdn Inc. as a Senior Fund Administrator in 2008. |
| Katie Gebauer** c\o abrdn Inc. 1900 Market Street Suite 200 Philadelphia, PA 19103 Year of Birth: 1986 | Vice President | Since 2023 | Currently, Chief Compliance Officer—ETFs and serves as the Chief Compliance Officer for abrdn ETFs Advisors LLC. Ms. Gebauer joined abrdn Inc. in 2014. |
| Alan Goodson** c\o abrdn Inc. 1900 Market Street Suite 200 Philadelphia, PA 19103 Year of Birth: 1974 | Vice President | Since 2018 | Currently, Executive Director, Product & Client Solutions – Americas for abrdn Inc., overseeing Product Management & Governance , Product Development and Client Solutions for registered and unregistered investment companies in the U.S., Brazil and Canada. Mr. Goodson is Director and Vice President of abrdn Inc. and joined abrdn Inc. in 2000. |
| Heather Hasson** c\o abrdn Inc. 1900 Market Street Suite 200 Philadelphia, PA 19103 Year of Birth: 1982 | Vice President | Since 2018 | Currently, Senior Product Solutions and Implementation Manager, Product Governance US for abrdn Inc. Ms. Hasson joined the company in 2006. |
| Robert Hepp** c\o abrdn Inc. 1900 Market Street Suite 200 Philadelphia, PA 19103 Year of Birth: 1986 | Vice President | Since 2022 | Currently, Senior Product Governance Manager – US for abrdn Inc. Mr. Hepp joined abrdn Inc. as a Senior Paralegal in 2016. |
| 90 | 2023 Annual Report |
| Name, Address and Year of Birth | Position(s) Held with the Funds | Term of Office* and Length of Time Served | Principal Occupation(s) During at Least the Past Five Years |
| Megan Kennedy** c\o abrdn Inc. 1900 Market Street Suite 200 Philadelphia, PA 19103 Year of Birth: 1974 | Vice President and Secretary | Since 2018 | Currently, Senior Director, Product Governance for abrdn Inc. Ms. Kennedy joined abrdn Inc. in 2005. |
| Andrew Kim** c\o abrdn Inc. 1900 Market Street Suite 200 Philadelphia, PA 19103 Year of Birth: 1983 | Vice President | Since 2022 | Currently, Senior Product Governance Manager – US for abrdn Inc. Mr. Kim joined abrdn Inc. as a Product Manager in 2013. |
| Brian Kordeck** c\o abrdn Inc. 1900 Market Street Suite 200 Philadelphia, PA 19103 Year of Birth: 1978 | Vice President | Since 2022 | Currently, Senior Product Manager – US for abrdn Inc. Mr. Kordeck joined abrdn Inc. as a Senior Fund Administrator in 2013. |
| Michael Marsico** c\o abrdn Inc. 1900 Market Street Suite 200 Philadelphia, PA 19103 Year of Birth: 1980 | Vice President | Since 2022 | Currently, Senior Product Manager – US for abrdn Inc. Mr. Marsico joined abrdn Inc. as a Fund Administrator in 2014. |
| Christian Pittard** c/o abrdn Investments Limited 280 Bishopsgate London, EC2M 4AG Year of Birth: 1973 | President | Since 2018 | Currently, Head of Closed End Funds & Managing Director - Corporate Finance. Mr. Pittard joined abrdn from KPMG in 1999. |
| Lucia Sitar** c\o abrdn Inc. 1900 Market Street Suite 200 Philadelphia, PA 19103 Year of Birth: 1971 | Vice President | Since 2018 | Currently, Vice President and Head of Product Management and Governance for abrdn Inc. since 2020. Previously, Ms. Sitar was Managing U.S. Counsel for abrdn Inc. She joined abrdn Inc. as U.S. Counsel in 2007. |
| * | Officers hold their positions with the Fund until a successor has been duly elected and qualifies. Officers are appointed annually at a meeting of the Fund Board. |
| ** | Each officer may hold officer position(s) in one or more other funds which are part of the Fund Complex. |
| 2023 Annual Report | 91 |
Stephen Bird
Nancy Yao
Todd Reit
John Sievwright
10 Queen's Terrace
Aberdeen, AB10 1XL
Scotland, United Kingdom
1900 Market Street, Suite 200
Philadelphia, PA 19103
One Congress Street, Suite 1
Boston, MA 02114-2016
P.O. Box 43006
Providence, RI 02940-3078
1601 Market Street
Philadelphia, PA 19103
1900 K Street N.W.
Washington D.C. 20006
1900 Market Street, Suite 200
Philadelphia, PA 19103
1-800-522-5465
Investor.Relations@abrdn.com

Item 2. Code of Ethics.
| (a) | As of October 31, 2023, abrdn Total Dynamic Dividend Fund (the “Fund” or the “Registrant”) had adopted a Code of Ethics that applies to the Registrant’s principal executive officer, principal financial officer, principal accounting officer or controller, or persons performing similar functions, regardless of whether these individuals are employed by the Registrant or a third party (the “Code of Ethics”). |
| (b) | Definitional. |
| (c) | There have been no amendments, during the period covered by this report, to a provision of the Code of Ethics. |
| (d) | During the period covered by this report, there were no waivers to the provisions of the Code of Ethics. |
| (e) | Not applicable |
| (f) | A copy of the Code of Ethics has been filed as an exhibit to this Form N-CSR. |
Item 3. Audit Committee Financial Expert.
The Registrant's Board of Trustees has determined that John Sievwright, a member of the Board of Trustees’ Audit Committee, possesses the attributes, and has acquired such attributes through means, identified in instruction 2 of Item 3 to Form N-CSR to qualify as an “audit committee financial expert,” and has designated Mr. Sievwright as the Audit Committee’s financial expert. Mr. Sievwright is considered to be an “independent” trustee, as such term is defined in paragraph (a)(2) of Item 3 to Form N-CSR.
Item 4. Principal Accountant Fees and Services.
(a) – (d) Below is a table reflecting the fee information requested in Items 4(a) through (d):
| Fiscal Year Ended | (a) Audit Fees1 | (b) Audit-Related Fees2 | (c) Tax Fees3 | (d) All Other Fees4 | ||||||||||||
| October 31, 2023 | $ | 81,000 | $ | 0 | $ | 0 | $ | 0 | ||||||||
| Percentage approved pursuant to pre-approval exception5 | 0 | % | 0 | % | 0 | % | 0 | % | ||||||||
| October 31, 2022 | $ | 69,270 | $ | 0 | $ | 0 | $ | 0 | ||||||||
| Percentage approved pursuant to pre-approval exception5 | 0 | % | 0 | % | 0 | % | 0 | % | ||||||||
1 “Audit Fees” are the aggregate fees billed for professional services for the audit of the Fund’s annual financial statements and services provided in connection with statutory and regulatory filings or engagements.
2 “Audit Related Fees” are the aggregate fees billed for assurance and related services reasonably related to the performance of the audit or review of financial statements that are not reported under “Audit Fees”. These fees include offerings related to the Fund’s common shares.
3 “Tax Fees” are the aggregate fees billed for professional services for tax advice, tax compliance, and tax planning. These fees include: federal and state income tax returns, review of excise tax distribution calculations and federal excise tax return.
4 “All Other Fees” are the aggregate fees billed for products and services other than “Audit Fees”, “Audit-Related Fees” and “Tax Fees”.
5 Pre-approval exception under Rule 2-01 of Regulation S-X. The pre-approval exception for services provided directly to the Fund waives the pre-approval requirement for services other than audit, review or attest services if: (A) the aggregate amount of all such services provided constitutes no more than 5% of the total amount of revenues paid by the Fund to its accountant during the fiscal year in which the services are provided; (B) the Fund did not recognize the services as non-audit services at the time of the engagement; and (C) the services are promptly brought to the Audit Committee’s attention, and the Committee (or its delegate) approves the services before the audit is completed.
| (e)(1) | The Registrant’s Audit Committee (the “Committee”) has adopted a Charter that provides that the Committee shall annually select, retain or terminate, and recommend to the Independent Trustees for their ratification, the selection, retention or termination, the Registrant’s independent auditor and, in connection therewith, to evaluate the terms of the engagement (including compensation of the independent auditor) and the qualifications and independence of the independent auditor, including whether the independent auditor provides any consulting, auditing or tax services to the Registrant’s investment adviser (the “Adviser”) or any sub-adviser, and to receive the independent auditor’s specific representations as to their independence, delineating all relationships that may affect the independent auditor’s independence, including the disclosures required by PCAOB Rule 3526 or any other applicable auditing standard. PCAOB Rule 3526 requires that, at least annually, the auditor: (1) disclose to the Committee in writing all relationships between the auditor and its related entities and the Registrant and its related entities that in the auditor’s professional judgment may reasonably be thought to bear on independence; (2) confirm in the letter that, in its professional judgment, it is independent of the Registrant within the meaning of the Securities Acts administered by the SEC; and (3) discuss the auditor’s independence with the audit committee. The Committee is responsible for actively engaging in a dialogue with the independent auditor with respect to any disclosed relationships or services that may impact the objectivity and independence of the independent auditor and for taking, or recommending that the full Board take, appropriate action to oversee the independence of the independent auditor. The Committee Charter also provides that the Committee shall review in advance, and consider approval of, any and all proposals by Management or the Adviser that the Registrant, the Adviser or their affiliated persons, employ the independent auditor to render “permissible non-audit services” to the Registrant and to consider whether such services are consistent with the independent auditor’s independence. “Permissible non-audit services” include any professional services, including tax services, provided to the Registrant by the independent auditor, other than those provided to the Registrant in connection with an audit or a review of the financial statements of the Registrant. Permissible non-audit services may not include: (i) bookkeeping or other services related to the accounting records or financial statements of the Registrant; (ii) financial information systems design and implementation; (iii) appraisal or valuation services, fairness opinions or contribution-in-kind reports; (iv) actuarial services; (v) internal audit outsourcing services; (vi) management functions or human resources; (vii) broker or dealer, investment adviser or investment banking services; (viii) legal services and expert services unrelated to the audit; and (ix) any other service the PCAOB determines, by regulation, is impermissible. Pre-approval by the Committee of any permissible non-audit services is not required so long as: (i) the aggregate amount of all such permissible non-audit services provided to the Registrant constitutes not more than 5% of the total amount of revenues paid by the Registrant to its auditor during the fiscal year in which the permissible non-audit services are provided; (ii) the permissible non-audit services were not recognized by the Registrant at the time of the engagement to be non-audit services; and (iii) such services are promptly brought to the attention of the Committee and approved by the Committee or its Delegate(s) prior to the completion of the audit. The Committee may delegate to one or more of its members (“Delegates”) authority to pre-approve permissible non-audit services to be provided to the Registrant. Any pre-approval determination of a Delegate shall be presented to the full Committee at its next meeting. Any pre-approval determination of a Delegate shall be presented to the full Committee at its next meeting. Pursuant to this authority, the Registrant’s Committee delegates to the Committee Chair, subject to subsequent ratification by the full Committee, up to a maximum amount of $25,000, which includes any professional services, including tax services, provided to the Registrant by its independent registered public accounting firm other than those provided to the Registrant in connection with an audit or a review of the financial statements of the Registrant. The Committee shall communicate any pre-approval made by it or a Delegate to the Adviser, who will ensure that the appropriate disclosure is made in the Registrant’s periodic reports required by Section 30 of the Investment Company Act of 1940, as amended, and other documents as required under the federal securities laws. |
| (e)(2) | None of the services described in each of paragraphs (b) through (d) of this Item involved a waiver of the pre-approval requirement by the Audit Committee pursuant to Rule 2-01 (c)(7)(i)(C) of Regulation S-X. |
| (f) | Not applicable. |
| (g) | Non-Audit Fees |
The following table shows the amount of fees that KPMG LLP billed during the Fund’s last two fiscal years for non-audit services to the Registrant, and to the Adviser, and any entity controlling, controlled by or under common control with the Adviser that provides ongoing services to the Fund (“Affiliated Fund Service Provider”):
| Fiscal Year Ended | Total Non-Audit Fees Billed to Fund | Total Non-Audit Fees billed to Adviser and Affiliated Fund Service Providers (engagements related directly to the operations and financial reporting of the Fund) | Total Non-Audit Fees billed to Adviser and Affiliated Fund Service Providers (all other engagements) | Total | ||||||||||||
| October 31, 2023 | $ | 0 | $ | 0 | $ | 1,171,994 | $ | 1,171,994 | ||||||||
| October 31, 2022 | $ | 0 | $ | 0 | $ | 1,108,929 | $ | 1,108,929 | ||||||||
“Non-Audit Fees billed to Fund” for both fiscal years represent “Tax Fees” and “All Other Fees” billed to Fund in their respective amounts from the previous table.
| (h) | Not applicable. |
(i) Not applicable.
(j) Not applicable.
Item 5. Audit Committee of Listed Registrants.
| (a) | The Registrant has a separately-designated standing Audit Committee established in accordance with Section 3(a)(58)(A) of the Exchange Act (15 U.S.C. 78c(a)(58)(A)). |
As of the fiscal year ended October 31, 2023, the Audit Committee members were:
Nancy Yao Maasbach
P. Gerald Malone
John Sievwright
| (b) | Not applicable. |
Item 6. Schedule of Investments.
(a) Included as part of the Report to Shareholders filed under Item 1 of this Form N-CSR.
(b) Not applicable.
Item 7. Disclosure of Proxy Voting Policies and Procedures for Closed-End Management Investment Companies.
Pursuant to the Registrant's Proxy Voting Policy and Procedures, the Registrant has delegated responsibility for its proxy voting to its Adviser, provided that the Registrant's Board of Trustees has the opportunity to periodically review the Adviser's proxy voting policies and material amendments thereto.
The proxy voting policies of the Registrant are included herewith as Exhibit (c) and policies of the Adviser are included as Exhibit (d).
Item 8. Portfolio Managers of Closed-End Management Investment Companies.
(a)(1) PORTFOLIO MANAGER BIOGRAPHIES
The Fund is managed by abrdn’s Global Equity team. The Global Equity team works in a truly collaborative fashion; all team members have both portfolio management and research responsibilities. The team is responsible for the day-to-day management of the Fund. As of the date of filing this report, the following individuals have primary responsibility for the day-to-day management of the Fund’s portfolio:
| Individual & Position | Past Business Experience |
Martin Connaghan Investment Director, Global Equities | Martin Connaghan is an Investment Director on the Developed Markets Equity Team at abrdn. He is one of the managers of Murray International Trust Plc and is also responsible for a range of Global Equity, Global Equity Income, Dynamic Dividend and Shariah compliant strategies. Martin joined Murray Johnstone in 1998, which was subsequently acquired by Aberdeen Asset Management in 2001. Martin has held a number of roles including Trader, Credit Analyst and ESG Analyst and has been focused on the management of Global Equity mandates for 17 years.
|
Josh Duitz Head of the Global Equities Team | Josh Duitz is Head of Global Income at abrdn. He is a Portfolio Manager of our global dynamic dividend and global infrastructure funds. Josh joined the company in 2018 from Alpine Woods Capital Management where he was a Portfolio Manager. Previously, Josh worked for Bear Stearns where he was a Managing Director, Principal and traded international equities. Prior to that, Josh worked for Arthur Andersen where he was a senior auditor.
|
Ruairidh Finlayson, CFA® Investment Director, Global Equities | Ruairidh Finlayson is an Investment Director at abrdn. He is the portfolio manager of abrdn’s Dynamic Dividend and World Resources funds. Ruairidh joined the company in 2018 from Polar Capital Partners where he worked as an Equity Analyst for the North America and Global Alpha funds. Previously, Ruairidh worked as an Equity Analyst for Brewin Dolphin after qualifying as a Chartered Accountant with Ernst & Young.
|
(a)(2) OTHER ACCOUNTS MANAGED BY PORTFOLIO MANAGERS.
The following chart summarizes information regarding other accounts for which each portfolio manager has day-to-day management responsibilities. Accounts are grouped into the following three categories: (1) registered investment companies; (2) other pooled investment vehicles; and (3) other accounts. To the extent that any of these accounts pay advisory fees that are based on account performance (“performance-based fees”), information on those accounts is provided separately. The figures in the chart below for the category of “registered investment companies” include the Fund. The “Other Accounts Managed” represents the accounts managed by the teams of which the portfolio manager is a member. The information in the table below is as of October 31, 2023.
| Name of Portfolio Manager | Type of Accounts | Other Accounts Managed | Total Assets ($M) | Number of Accounts Managed for Which Advisory Fee is Based on Performance | Total Assets for Which Advisory Fee is Based on Performance ($M) | |||||||||||||
| Josh Duitz1 | Registered Investment Companies | 8 | $ | 2,029.78 | 0 | $ | 0 | |||||||||||
| Pooled Investment Vehicles | 34 | $ | 5,793.64 | 0 | $ | 0 | ||||||||||||
| Other Accounts | 9 | $ | 2,796.03 | 0 | $ | 0 | ||||||||||||
| Martin Connaghan1 | Registered Investment Companies | 8 | $ | 2,029.78 | 0 | $ | 0 | |||||||||||
| Pooled Investment Vehicles | 34 | $ | 5,793.64 | 0 | $ | 0 | ||||||||||||
| Other Accounts | 9 | $ | 2,796.03 | 0 | $ | 0 | ||||||||||||
| Ruairidh Finlayson1 | Registered Investment Companies | 8 | $ | 2,029.78 | 0 | $ | 0 | |||||||||||
| Pooled Investment Vehicles | 34 | $ | 5,793.64 | 0 | $ | 0 | ||||||||||||
| Other Accounts | 9 | $ | 2,796.03 | 0 | $ | 0 | ||||||||||||
1 Includes accounts managed by the Global Equities Team, of which the portfolio manager is a member.
POTENTIAL CONFLICTS OF INTEREST
The Adviser and its affiliates (collectively referred to herein as “abrdn”) serve as investment advisers for multiple clients, including the Registrant and other investment companies registered under the 1940 Act and private funds (such clients are also referred to below as “accounts”). The portfolio managers’ management of “other accounts” may give rise to potential conflicts of interest in connection with their management of the Registrant’s investments, on the one hand, and the investments of the other accounts, on the other. The other accounts may have the same investment objective as the Registrant. Therefore, a potential conflict of interest may arise as a result of the identical investment objectives, whereby the portfolio manager could favor one account over another. However, the Adviser believes that these risks are mitigated by the fact that: (i) accounts with like investment strategies managed by a particular portfolio manager are generally managed in a similar fashion, subject to exceptions to account for particular investment restrictions or policies applicable only to certain accounts, differences in cash flows and account sizes, and similar factors; and (ii) portfolio manager personal trading is monitored to avoid potential conflicts. In addition, the Adviser has adopted trade allocation procedures that require equitable allocation of trade orders for a particular security among participating accounts.
In some cases, another account managed by the same portfolio manager may compensate Aberdeen based on the performance-based fees with qualified clients. The existence of such a performance-based fee may create additional conflicts of interest for the portfolio manager in the allocation of management time, resources and investment opportunities.
Another potential conflict could include instances in which securities considered as investments for the Registrant also may be appropriate for other investment accounts managed by the Adviser or its affiliates. Whenever decisions are made to buy or sell securities for the Registrant and one or more of the other accounts simultaneously, the Adviser may aggregate the purchases and sales of the securities and will allocate the securities transactions in a manner that it believes to be equitable under the circumstances. As a result of the allocations, there may be instances where the Registrant will not participate in a transaction that is allocated among other accounts. While these aggregation and allocation policies could have a detrimental effect on the price or amount of the securities available to the Registrant from time to time, it is the opinion of the Adviser that the benefits from the policies outweigh any disadvantage that may arise from exposure to simultaneous transactions. The Registrant has adopted policies that are designed to eliminate or minimize conflicts of interest, although there is no guarantee that procedures adopted under such policies will detect each and every situation in which a conflict arises.
With respect to non-discretionary model delivery accounts (including UMA accounts) and discretionary SMA accounts, abrdn Inc. will utilize a third party service provider to deliver model portfolio recommendations and model changes to the Sponsors. abrdn Inc. seeks to treat clients fairly and equitably over time, by delivering model changes to our service provider and investment instructions for our other discretionary accounts to our trading desk, simultaneously or approximately at the same time. The service provider will then deliver the model changes to each Sponsor on a when-traded, randomized full rotation schedule. All Sponsors will be included in the rotation schedule, including SMA and UMA.
UMA Sponsors will be responsible for determining how and whether to implement the model portfolio or model changes and implementation of any client specific investment restrictions. The Sponsors are solely responsible for determining the suitability of the model portfolio for each model delivery client, executing trades and seeking best execution for such clients.
As it relates to SMA accounts, abrdn Inc. will be responsible for managing the account on the basis of each client’s financial situation and objectives, the day to day investment decisions, best execution, accepting or rejecting client specific investment restrictions and performance. The SMA Sponsors will collect suitability information and will provide a summary questionnaire for our review and approval or rejection. For dual contract SMAs, abrdn Inc. will collect a suitability assessment from the client, along with the Sponsor suitability assessment. Our third party service provider will monitor client specific investment restrictions on a day to day basis. For SMA accounts, model trades will be traded by the Sponsor or may be executed through a “step-out transaction,”- or traded away- from the client’s Sponsor if doing so is consistent with abrdn’s obligation to obtain best execution. When placing trades through Sponsor Firms (instead of stepping them out), we will generally aggregate orders where it is possible and in the client’s best interests. In the event we are not comfortable that a Sponsor can obtain best execution for a specific security and trading away is infeasible, we may exclude the security from the model.
Trading costs are not covered by the Wrap Program fee and may result in additional costs to the client. In some instances, step-out trades are executed without any additional commission, mark-up, or mark-down, but in many instances, the executing broker-dealer may impose a commission or a mark-up or mark-down on the trade. Typically, the executing broker will embed the added costs into the price of the trade execution, making it difficult to determine and disclose the exact added cost to clients. In this instance, these additional trading costs will be reflected in the price received for the security, not as a separate commission, on trade confirmations or on account statements. In determining best execution for SMA accounts, abrdn Inc. takes into consideration that the client will not pay additional trading costs or commission if executing with the Sponsor.
While UMA accounts are invested in the same strategies as and may perform similarly to SMA accounts, there are expected to be performance differences between them. There will be performance dispersions between UMAs and other types of accounts because abrdn does not have discretion over trading and there may be client specific restrictions for SMA accounts.
abrdn may have already commenced trading for its discretionary client accounts before the model delivery accounts have executed abrdn's recommendations. In this event, trades placed by the model delivery clients may be subject to price movements, particularly with large orders or where securities are thinly traded, that may result in model delivery clients receiving less favorable prices than our discretionary clients. abrdn has no discretion over transactions executed by model delivery clients and is unable to control the market impact of those transactions.
Timing delays or other operational factors associated with the implementation of trades may result in non-discretionary and model delivery clients receiving materially different prices relative to other client accounts. In addition, the constitution and weights of stocks within model portfolios may not always be exactly aligned with similar discretionary accounts. This may create performance dispersions within accounts with the same or similar investment mandate.
(a)(3)
DESCRIPTION OF COMPENSATION STRUCTURE
abrdn’s remuneration policies are designed to support its business strategy as a leading international asset manager. The objective is to attract, retain and reward talented individuals for the delivery of sustained, superior returns for abrdn’s clients and shareholders. abrdn operates in a highly competitive international employment market, and aims to maintain its strong track record of success in developing and retaining talent.
abrdn’s policy is to recognize corporate and individual achievements each year through an appropriate annual bonus scheme. The bonus is a single, fully discretionary variable pay award. The aggregate value of awards in any year is dependent on the group’s overall performance and profitability. Consideration is also given to the levels of bonuses paid in the market. Individual awards, which are payable to all members of staff, are determined by a rigorous assessment of achievement against defined objectives.
The variable pay award is composed of a mixture of cash and a deferred award, the portion of which varies based on the size of the award. Deferred awards are by default abrdn plc shares, with an option to put up to 50% of the deferred award into funds managed by abrdn. Overall compensation packages are designed to be competitive relative to the investment management industry.
Base Salary
abrdn’s policy is to pay a fair salary commensurate with the individual’s role, responsibilities and experience, and having regard to the market rates being offered for similar roles in the asset management sector and other comparable companies. Any increase is generally to reflect inflation and is applied in a manner consistent with other abrdn employees; any other increases must be justified by reference to promotion or changes in responsibilities.
Annual Bonus
The Remuneration Committee determines the key performance indicators that will be applied in considering the overall size of the bonus pool. In line with practices amongst other asset management companies, individual bonuses are not subject to an absolute cap. However, the aggregate size of the bonus pool is dependent on the group’s overall performance and profitability. Consideration is also given to the levels of bonuses paid in the market. Individual awards are determined by a rigorous assessment of achievement against defined objectives, and are reviewed and approved by the Remuneration Committee.
abrdn has a deferral policy which is intended to assist in the retention of talent and to create additional alignment of executives’ interests with abrdn’s sustained performance and, in respect of the deferral into funds managed by abrdn, to align the interest of portfolio managers with our clients.
Staff performance is reviewed formally at least once a year. The review process evaluates the various aspects that the individual has contributed to abrdn, and specifically, in the case of portfolio managers, to the relevant investment team. Discretionary bonuses are based on client service, asset growth and the performance of the respective portfolio manager. Overall participation in team meetings, generation of original research ideas and contribution to presenting the team externally are also evaluated.
In the calculation of a portfolio management team’s bonus, abrdn takes into consideration investment matters (which include the performance of funds, adherence to the company investment process, and quality of company meetings) as well as more subjective issues such as team participation and effectiveness at client presentations through key performance indicator scorecards. To the extent performance is factored in, such performance is not judged against any specific benchmark and is evaluated over the period of a year - January to December. The pre- or after-tax performance of an individual account is not considered in the determination of a portfolio manager’s discretionary bonus; rather the review process evaluates the overall performance of the team for all of the accounts the team manages.
Portfolio manager performance on investment matters is judged over all of the accounts the portfolio manager contributes to and is documented in the appraisal process. A combination of the team’s and individual’s performance is considered and evaluated.
Although performance is not a substantial portion of a portfolio manager’s compensation, abrdn also recognizes that fund performance can often be driven by factors outside one’s control, such as (irrational) markets, and as such pays attention to the effort by portfolio managers to ensure integrity of our core process by sticking to disciplines and processes set, regardless of momentum and ‘hot’ themes. Short-terming is thus discouraged and trading-oriented managers will thus find it difficult to thrive in the abrdn environment. Additionally, if any of the aforementioned undue risks were to be taken by a portfolio manager, such trend would be identified via abrdn’s dynamic compliance monitoring system.
In rendering investment management services, the Adviser may use the resources of additional investment adviser subsidiaries of abrdn plc. These affiliates have entered into a memorandum of understanding (“MOU”) pursuant to which investment professionals from each affiliate may render portfolio management, research or trading services to abrdn clients. Each investment professional who renders portfolio management, research or trading services under a MOU or personnel sharing arrangement (“Participating Affiliate”) must comply with the provisions of the Advisers Act, the 1940 Act, the Securities Act of 1933, the Exchange Act, and the Employee Retirement Income Security Act of 1974, and the laws of states or countries in which the Adviser does business or has clients. No remuneration is paid by the Fund with respect to the MOU/personnel sharing arrangements.
(a)(4)
| Dollar Range of Equity Securities in the Registrant Beneficially Owned by the Portfolio Manager as of October 31, 2023 | ||
| Martin Connaghan | None | |
| Josh Duitz | $10,001-$50,000 | |
| Ruairidh Finlayson | None | |
(b) Not applicable.
Item 9. Purchases of Equity Securities by Closed-End Management Investment Company and Affiliated Purchasers.
No such purchases were made by or on behalf of the Registrant during the period covered by the report.
Item 10. Submission of Matters to a Vote of Security Holders.
During the period ended October 31, 2023, there were no material changes to the procedures by which shareholders may recommend nominees to the Registrant’s Board of Trustees.
Item 11. Controls and Procedures.
| (a) | The Registrant’s principal executive and principal financial officers, or persons performing similar functions, have concluded that the Registrant’s disclosure controls and procedures (as defined in Rule 30a-3(c) under the Investment Company Act of 1940 (the “Act”) (17 CFR 270.30a-3(c)) are effective, as of a date within 90 days of the filing date of the report that includes the disclosure required by this paragraph, based on the evaluation of these controls and procedures required by Rule 30a-3(b) under the Act (17 CFR 270.30a3(b)) and Rule 13a-15(b) or 15d-15(b) under the Securities Exchange Act of 1934, as amended (17 CFR 240.13a-15(b) or 240.15d15(b)). |
| (b) | There were no changes in the Registrant’s internal control over financial reporting (as defined in Rule 30a-3(d) under the Act (17 CFR 270.30a-3(d))) that occurred during the second fiscal quarter of the period covered by this report that has materially affected, or is reasonably likely to materially affect, the Registrant’s internal control over financial reporting. |
Item 12. Disclosure of Securities Lending Activities for Closed-End Management Investment Companies
Not applicable
Item 13. Exhibits.
| (a)(1) | Code of Ethics of the Registrant for the period covered by this report as required pursuant to Item 2 of this Form N-CSR. |
| (a)(2) | The certifications of the registrant as required by Rule 30a-2(a) under the Act are exhibits to this Form N-CSR. |
| (a)(3) | Any written solicitation to purchase securities under Rule 23c-1 under the 1940 Act (17 CFR 270.23c-1) sent or given during the period covered by the report by or on behalf of the registrant to 10 or more persons. Not applicable. |
| (a)(4) | Change in Registrant’s independent public accountant. Not applicable. |
| (b) | The certifications of the registrant as required by Rule 30a-2(b) under the Act are exhibits to this Form N-CSR. |
| (c) | Proxy Voting Policy of Registrant |
| (d) | Proxy Voting Policies and Procedures of Adviser. |
SIGNATURES
Pursuant to the requirements of the Securities Exchange Act of 1934 and the Investment Company Act of 1940, the Registrant has duly caused this report to be signed on its behalf by the undersigned, thereunto duly authorized.
abrdn Total Dynamic Dividend Fund
| By: | /s/ Christian Pittard | |
| Christian Pittard, | ||
| Principal Executive Officer of | ||
| abrdn Total Dynamic Dividend Fund | ||
| Date: January 8, 2024 | ||
Pursuant to the requirements of the Securities Exchange Act of 1934 and the Investment Company Act of 1940, this report has been signed below by the following persons on behalf of the Registrant and in the capacities and on the dates indicated.
| By: | /s/ Christian Pittard | |
| Christian Pittard, | ||
| Principal Executive Officer of | ||
| abrdn Total Dynamic Dividend Fund | ||
| Date: January 8, 2024 | ||
| By: | /s/ Sharon Ferrari | |
| Sharon Ferrari, | ||
| Principal Financial Officer of | ||
| abrdn Total Dynamic Dividend Fund | ||
| Date: January 8, 2024 | ||