Exhibit 99.2
| Investor Day January 17, 2013 |
| Forward-Looking Statements Cautionary Statement Regarding Forward-Looking Statements This presentation contains statements reflecting assumptions, expectations, projections, intentions or beliefs about future events that are intended as “forward looking statements.” You can identify these statements by the fact that they do not relate strictly to historical or current facts. Management cautions that any or all of Dynegy’s forward-looking statements may turn out to be wrong. Please read Dynegy’s annual, quarterly and current reports filed under the Securities Exchange Act of 1934, including its 2011 Form 10-K, as amended, and first, second and third quarter 2012 Forms 10-Q, for additional information about the risks, uncertainties and other factors affecting these forward-looking statements and Dynegy generally. Dynegy’s actual future results may vary materially from those expressed or implied in any forward-looking statements. All of Dynegy’s forward-looking statements, whether written or oral, are expressly qualified by these cautionary statements and any other cautionary statements that may accompany such forward-looking statements. In addition, Dynegy disclaims any obligation to update any forward-looking statements to reflect events or circumstances after the date hereof. Non-GAAP Financial Measures This presentation contains non-GAAP financial measures including EBITDA, Adjusted EBITDA and Free Cash Flow. Reconciliations of these measures to the most directly comparable GAAP financial measures to the extent available without unreasonable effort are contained herein. To the extent required, statements disclosing the definitions utility and purposes of these measures are set forth in Item 7.01 to our current report on Form 8-K filed with the SEC on January 17, 2012, which is available on our website free of charge, www.dynegy.com. 2 |
| 3 Agenda I. Introductions II. Why Invest in Dynegy? – Bob Flexon III. Commercial Review– Mike Gray IV. CoalCo Review – Brian Despard V. GasCo Review – Alan Padgett VI. Regulatory Update – Dean Ellis VII. 2012 – 2013 Guidance Estimates and Financial Review – Clint Freeland VIII Closing Remarks and Q&A – Bob Flexon |
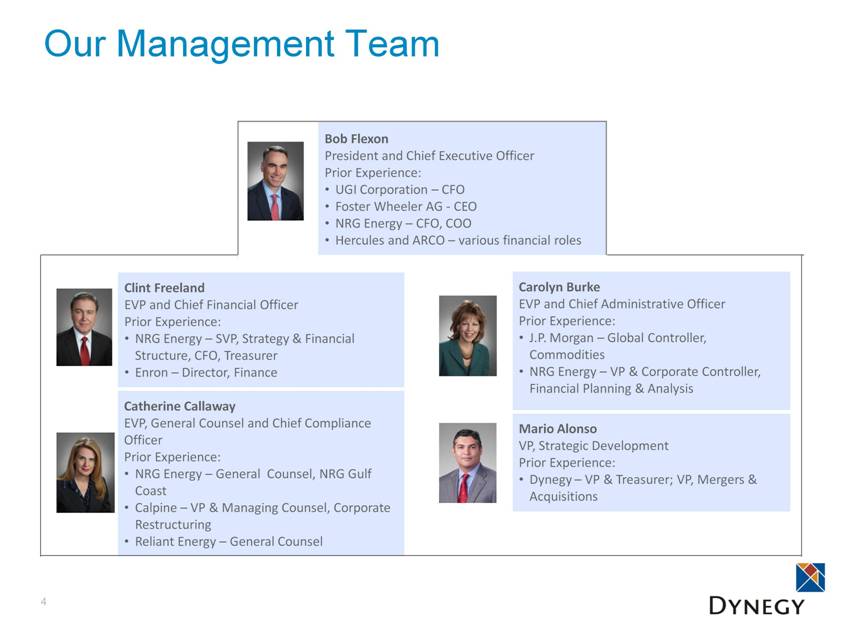
| Our Management Team 4 Carolyn Burke EVP and Chief Administrative Officer Prior Experience: J.P. Morgan – Global Controller, Commodities NRG Energy – VP & Corporate Controller, Financial Planning & Analysis Mario Alonso VP, Strategic Development Prior Experience: Dynegy – VP & Treasurer; VP, Mergers & Acquisitions Clint Freeland EVP and Chief Financial Officer Prior Experience: NRG Energy – SVP, Strategy & Financial Structure, CFO, Treasurer Enron – Director, Finance Catherine Callaway EVP, General Counsel and Chief Compliance Officer Prior Experience: NRG Energy – General Counsel, NRG Gulf Coast Calpine – VP & Managing Counsel, Corporate Restructuring Reliant Energy – General Counsel Bob Flexon President and Chief Executive Officer Prior Experience: UGI Corporation – CFO Foster Wheeler AG - CEO NRG Energy – CFO, COO Hercules and ARCO – various financial roles |
| Pat Wood Chairman of the Board Principal – Wood3 Resources Currently serves on Board of Directors of Quanta Services Inc. and SunPower Corp. Prior Experience: Federal Energy Regulatory Commission - Chairman Public Utility Commission of Texas - Chairman Hilary E. Ackermann Prior Experience: Goldman Sachs Bank USA – Chief Risk Officer; Chaired Operational Risk, Credit Risk and Middle Market Loan Committees, Vice Chair of Bank Risk Committee; Chair GS Group level Operational Risk Committee Goldman Sachs & Co – Managing Director, Credit Risk Management & Advisory Swiss Bank Corporation – Assistant Department Head Paul M. Barbas Prior Experience: DPL Inc. and DP&L – President and Chief Executive Officer; Served on Board of Directors Chesapeake Utilities Corporation – Executive Vice President & Chief Operating Officer; Vice President; Chesapeake Service Company – President; Allegheny Power – Executive Vice President; President of Ventures unit Bob Flexon President and Chief Executive Officer Prior Experience: UGI Corporation – CFO Foster Wheeler AG - CEO NRG Energy – CFO, COO Hercules and ARCO – various financial roles Board of Directors 5 Richard Kuersteiner Currently serves on Board of Directors of Dex One Corporation Prior Experience: Franklin Templeton Investments – Associate General Counsel; Director of Restructuring; Managing Corporate Counsel Member of Stanford Institutional Investors Forum Jeffrey S. Stein Co-Founder and Managing Partner of Power Capital Partners LLC Currently serves on Board of Directors of Granite Ridge Holdings, LLC and US Power Generating Company Prior Experience: Durham Asset Management LLC – Co-Founder and Principal; Co-Director of Research The Delaware Bay Company – Director Shearson Lehman Brothers – Associate in Capital Preservation & Restructuring Group John R. Sult Prior Experience: El Paso Corporation – Executive Vice President Chief Financial Officer and Director; Senior V.P. and CFO; Senior V.P. and Controller; Chief Accounting Officer El Paso Pipeline GP Company – Executive Vice President and Chief Financial Officer; Senior Vice President and CFO and Controller El Paso Pipeline Group - Senior Vice President, CFO and Controller Halliburton Energy Services – Vice President and Controller Arthur Andersen LLP – Audit Partner |
| 6 Alan Padgett VP, GasCo Asset Management Prior Experience: Dynegy – Managing Director, West Commercial Operations Calpine – Manager, West Commercial Operations Dean Ellis Senior Director, Government Affairs Prior Experience: Dynegy – Director, Asset Management NYISO – Manager, Transmission Studies Prior engineering design and construction roles Other Speakers Today Mike Gray VP, Commercial Operations Prior Experience: Dynegy – VP, Fuels and Emissions; VP, Business Development & Carrier Relations, Dynegy Global Communications; VP, Business Development & Technical Service, Dynegy Midstream Services Chevron USA – Commercials roles, Natural Gas Business Unit; Commercial and technical positions, Warren Petroleum, Inc. Brian Despard VP, CoalCo Asset Management Prior Experience: Dynegy – Managing Director, Midwest Commercial Ops; Managing Director, Northeast Commercial Ops; Director, West Asset Management TVA – Finance and commercial roles |
| II. Why Invest in Dynegy? Robert C. Flexon – President and CEO |
| Why invest in Dynegy? 8 Dynegy represents an attractive value-oriented investment opportunity with a compelling risk/reward profile Capital Allocation Opportunities Multiple Avenues for Substantial Earnings Upside Limited Downside Risk 1 2 3 |
| The market effectively assigns zero value to CoalCo 9 Enterprise Valuation as of 1/2/2013(1) $ millions Total Debt $1,355 Equity Value: Stock 1,939 Less: Cash and Restricted Cash (718) Firm Value $2,576 Ascribing all value to GasCo Total GasCo MW 6,771 GasCo Valuation $380/kW Leaves “no” value for CoalCo Total CoalCo MW 2,980 CoalCo Valuation $0/kW Valuation Comparables(2) $/kW 1 A $240/kw valuation for CoalCo would equal ~$7 per share Implied Segment Valuations $/kW (1) See Appendix, Slide 88, for detailed calculations; (2) 2012 Asset level transactions for CCGTs and coal-fired generation assets, Source: SNL, company filings and Wall Street research |
| Our flexible hedging strategy limits downside risk while allowing participation in market recovery 10 Value Creation We hedge power and fuel to meet or exceed targeted EBITDA and Free Cash Flow requirements Our coal portfolio is largely open to realize upside in natural gas and power market recovery Upside Participation Downside Protection Extrinsic Value Capture Financial Targets Intrinsic Value Capture For our at-the-money assets, we pursue commercial strategies to capture temporary opportunities that exist as spark spreads change due to volatility in power and gas markets For our assets that operate deeper in-the-money, we transact to capture intrinsic value We employ “collar” strategies, to provide downside price protection while retaining exposure to improved pricing Primarily Coal Portfolio Total Portfolio Total Portfolio 1 |
| Dynegy’s portfolio generates free cash flow in both high and low gas environments 11 Environmentally Compliant Coal Fleet If gas prices stay low If gas prices rise Benefits from rising capacity payments and “heat rates” due to increased retirements Significant upside leverage in a rising natural gas environment Benefits from increased capacity factors and rising capacity payments due to increased retirements Benefits from spark spread expansion as energy prices rise If gas prices stay low If gas prices rise CoalCo GasCo Efficient Combined-Cycle Gas Fleet 1 |
| MISO is projecting a 11.7GW shortfall by 2016 12 2 Resources 2013 Potential Resources 2016 Expected Retirements New Resources Potential Shortfall 2016 Resource Requirement (0.8% growth) Potential Gas Derates Winter Resource Adequacy 2013 – 2016 ( GW ) 112.0 3.0 (12.5) 95.4 (11.7) (18.8) 83.7 |
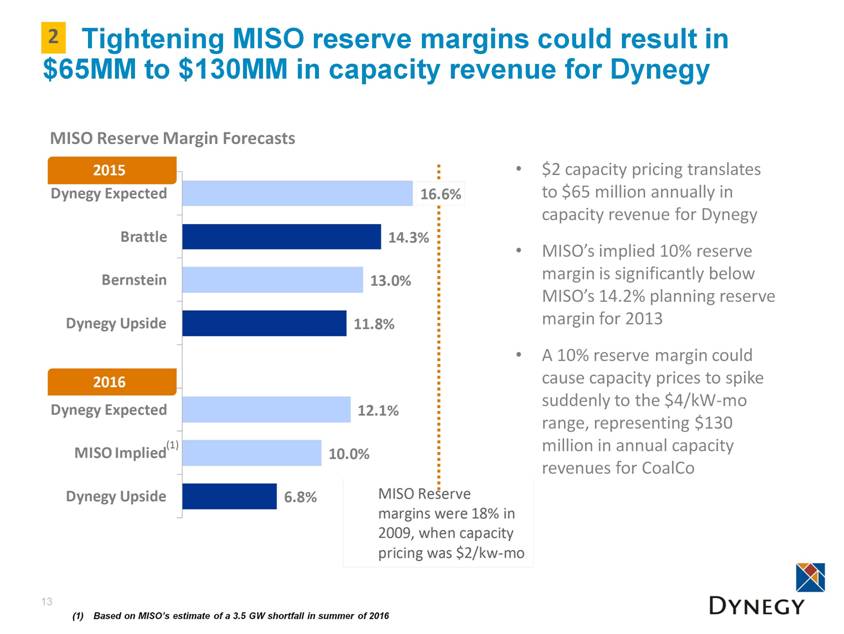
| Tightening MISO reserve margins could result in $65MM to $130MM in capacity revenue for Dynegy 13 2 MISO Reserve Margin Forecasts $2 capacity pricing translates to $65 million annually in capacity revenue for Dynegy MISO’s implied 10% reserve margin is significantly below MISO’s 14.2% planning reserve margin for 2013 A 10% reserve margin could cause capacity prices to spike suddenly to the $4/kW-mo range, representing $130 million in annual capacity revenues for CoalCo Based on MISO’s estimate of a 3.5 GW shortfall in summer of 2016 • MISO Reserve margins were 18% in 2009, when capacity pricing was $2/kw - mo 6.8% 10.0% 12.1% 11.8% 13.0% 14.3% 16.6% Dynegy Upside MISO Implied Dynegy Expected Dynegy Upside Bernstein Brattle Dynegy Expected 2016 2015 (1) |
| Retirements also have the potential to increase power prices around our fleet and generate ~$85 - $90M per year 14 Baseload Average Peak MISO Central Dispatch Stacks (1) Current Generation Stack vs. Excluding 2.7GW Expected Retirements, net of Additions (1) Assumptions for MISO Central are: 2.7GW of capacity exiting by 2016 (retirements net of additions); $4.00 Henry Hub natural gas price, Dynegy variable costs of $20.50/MWh, Prairie State fully online Total Marginal Cost $/MWh Total Marginal Cost $/MWh After 2.7GW Retirements 2 With less efficient coal plants coming off the grid, the dispatch curve shifts, potentially increasing power pricing Based on 2012 load, MISO Central power prices would have risen ~$4/MWh ATC with retirements CoalCo generates ~22M mwh annually Stack compresses resulting in higher clearing prices |
| Rising gas prices could generate up to ~$230 million in increased EBITDA by 2016 as compared to 2013 price levels 15 Natural Gas Price Forecast As of 01/02/2013 ~$140MM EBITDA upside ~$230MM EBITDA upside (1) PIRA, Bentek, Goldman, Barclays, Credit Suisse, Macquarie, BNP Paribas 2 (1) $ 3.46 $3.97 $4.19 $4.38 $3.0 $3.5 $4.0 $4.5 $5.0 $5.5 2013 2014 2015 2016 $/MMBtu Third Party Expert Range NYMEX |
| PRIDE drives efficiencies and is expected to deliver ~$36 MM of improvement in 2013 with a further $30-$50MM by 2015 16 Fixed Cash Savings $ mm Gross Margin Improvements $ mm Balance Sheet Efficiency $ mm Producing Results through Innovation by Dynegy Employees 51 38 16 105 Fixed cash costs in 2013 are expected to be $105M below 2010 baseline Over a half billion dollars released from balance sheet since program inception 2013 is expected to see an additional $20M in gross margin from PRIDE initiatives 2 |
| 17 Capital Allocation Options Balance Sheet Management Manage Leverage Profile Reduce Cash Interest Expense Optimize Cost of Capital Maintain Strong Liquidity Investments in Existing Portfolio Maintenance, environmental and safety CapEx Uprates at existing facilities Brownfield development at existing locations Transmission upgrades to relieve congestion Acquisitions Portfolio acquisitions Asset acquisitions Return to Shareholders Return excess capital to shareholders Share repurchases Capital structure optimization 17 Financial flexibility provides a range of value-creating capital allocation options 3 |
| We enjoy considerable financial flexibility due to our strong balance sheet and liquidity profile 18 Total Debt $1,355 Less: Unrestricted Cash (382) Less: Restricted Cash (336) Total Net Debt $637 Net Debt / 2013 Adj. EBITDA(1) Dynegy 2.4x NRG 5.3x Calpine 5.1x Total Net Debt / kW ($) (2) Dynegy $65 NRG $386 Calpine $342 (1) Based on midpoint of $262MM for Dynegy’s 2013 Adjusted EBITDA guidance; Competitor EBITDA and debt based on 3Q2012 earnings materials; Does not include impact of NRG/GenOn merger; (2) Excludes DNE MW; (3) Restricted Cash as part of the Term Loan Agreement; (4) Letters of Credit are cash collateralized; amount includes a required reserve of 3% (5) Release of restricted cash ($275MM) plus midpoint of FCF guidance, excluding the net benefit of the refinancing, before assumed debt paydown 3 Dynegy 2013 Liquidity Profile ($ MM) Dynegy Leverage Profile As of January 2, 2013 ($ MM) |
| 19 Balance Sheet Management Strategic Considerations: Liquidity requirements Cost of capital Leverage levels Investments in Existing Portfolio Strategic Considerations: Safety and environmental needs Plant reliability Returns on invested capital Acquisitions Strategic Considerations: Strategic fit – clear value driver Execution/Integration Risk Environmental compliance profile Return to Shareholders Strategic Considerations: Fundamental view on value Share repurchases – alternative structures Excess liquidity Reinvest in the Business Return to Shareholders/Debtholders Capital allocation is determined by the highest risk-adjusted rate of returns 3 |
| Dynegy represents an attractive value-oriented investment opportunity with a compelling risk/reward profile 20 Capital Allocation Opportunities Multiple Avenues for Substantial Upside Limited Downside Risk Conservatively valued Hedging program focused on risk reduction Portfolio of assets in the market for the long term Environmentally compliant coal fleet generates positive cash flow Modern combined-cycle gas fleet that excels in low gas environment 2013 Adjusted EBITDA Guidance of $250-$275mm (1); $3.46 natural gas Industry retirements should benefit Dynegy through higher capacity payments and power prices - ~$165-$230mm(2) Rising natural gas prices offers significant earnings upside - ~$140-$215mm(3) Continued focus on cost reductions and balance sheet improvements through PRIDE program - ~$30-$50mm(4) Strong balance sheet with leading IPP sector credit profile Capital allocation process awards projects with highest risk-adjusted return 1 2 3 (1) Excludes impact of potential settlement for Morro Bay tolling and Moss Landing capacity contracts; Adjusted EBITDA is a non-GAAP measure; for reconciliations, please see the Appendix, Slide 102 (2) See Slides 46 and 47 for further information; (3) See Slide 15 for further information (4) PRIDE forecast for 2015 primarily based on projects either underway or identified and planned to be initiated |
| I. Commercial Review Mike Gray – VP, Commercial |
| Dynegy takes a bullish view on natural gas, but within experts’ forecast range 22 The market expectation is natural gas prices will increase over time, though fundamental factors are in flux EIA positive revisions to 2010 – 2012 industrial natural gas consumption figures point to a more bullish view, though industrial demand recovery is still being digested by the market Natural Gas Price Forecast Range PIRA, Bentek, Goldman, Barclays, Credit Suisse, Macquarie, BNP Paribas; (2) As of 1/2/2013 (2) (1) |
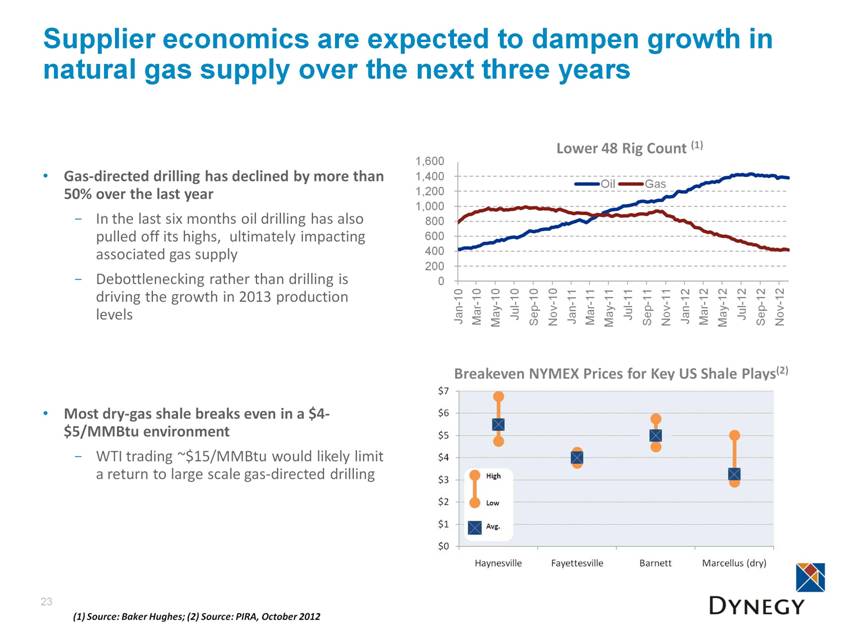
| Supplier economics are expected to dampen growth in natural gas supply over the next three years 23 Gas-directed drilling has declined by more than 50% over the last year In the last six months oil drilling has also pulled off its highs, ultimately impacting associated gas supply Debottlenecking rather than drilling is driving the growth in 2013 production levels Most dry-gas shale breaks even in a $4-$5/MMBtu environment WTI trading ~$15/MMBtu would likely limit a return to large scale gas-directed drilling Breakeven NYMEX Prices for Key US Shale Plays(2) Lower 48 Rig Count (1) (1) Source: Baker Hughes; (2) Source: PIRA, October 2012 |
| Power sector’s demand for natural gas is expected to outpace natural gas supply growth, pushing natural gas prices higher 24 Supply growth expected to lag growth in demand over next three years Coal retirements and new gas-fired capacity expected to add 3 to 4 Bcf/day of gas demand by 2017 Annual growth in industrial demand expected to be moderate through 2016 – less than 0.5 Bcf/day LNG exports expected to become a factor in the 2015/16 timeframe, reaching 1 Bcf/day by the end of 2016 (1) Source: Bentek Natural Gas Supply Growth vs. Demand Growth(1) |
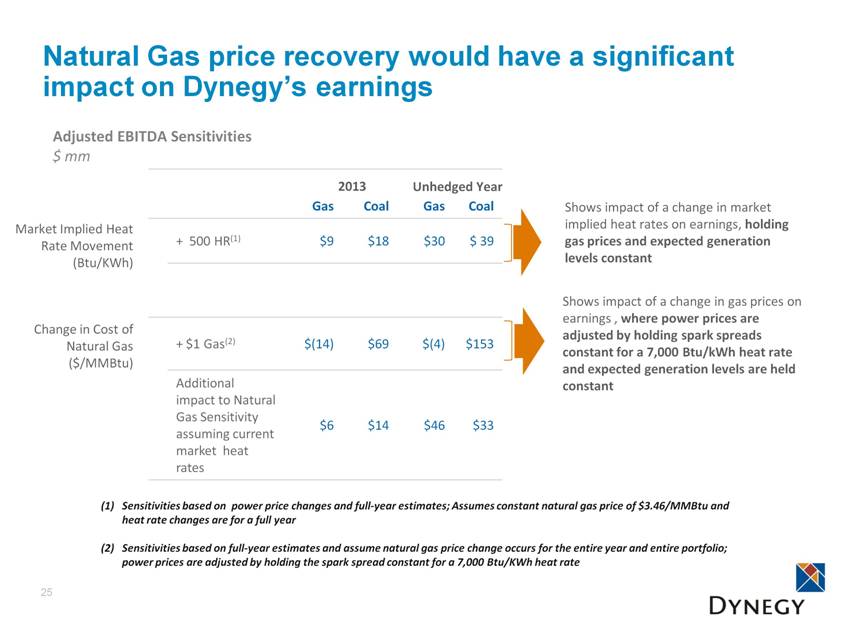
| Natural Gas price recovery would have a significant impact on Dynegy’s earnings 25 Gas Coal Gas Coal + 500 HR(1) $9 $18 $30 $ 39 + $1 Gas(2) $(14) $69 $(4) $153 Additional impact to Natural Gas Sensitivity assuming current market heat rates $6 $14 $46 $33 Adjusted EBITDA Sensitivities $ mm Market Implied Heat Rate Movement (Btu/KWh) Change in Cost of Natural Gas ($/MMBtu) Sensitivities based on power price changes and full-year estimates; Assumes constant natural gas price of $3.46/MMBtu and heat rate changes are for a full year Sensitivities based on full-year estimates and assume natural gas price change occurs for the entire year and entire portfolio; power prices are adjusted by holding the spark spread constant for a 7,000 Btu/KWh heat rate Shows impact of a change in market implied heat rates on earnings, holding gas prices and expected generation levels constant Shows impact of a change in gas prices on earnings , where power prices are adjusted by holding spark spreads constant for a 7,000 Btu/kWh heat rate and expected generation levels are held constant Unhedged Year 2013 |
| Our flexible hedging strategy limits downside risk while allowing participation in market recovery 26 Value Creation We hedge power and fuel to meet or exceed targeted EBITDA and Free Cash Flow requirements Our coal portfolio is largely open to realize upside in natural gas and power market recovery Upside Participation Downside Protection Extrinsic Value Capture Financial Targets Intrinsic Value Capture For our at-the-money assets, we pursue commercial strategies to capture temporary opportunities when spark spreads change due to volatility in power and gas markets For our assets that operate deeper in-the-money, we transact to capture intrinsic value We employ “Collar” strategies, to provide downside price protection while retaining exposure to improved pricing Primarily Coal Portfolio Total Portfolio Total Portfolio |
| We are relatively unhedged beyond 2013, which allows us to participate in market recovery (1) Hedge percentages are based upon expected on and off-peak generation and hedges in place as of the dates shown Increasing hedge levels as spark spreads widen Portfolio is hedged unit-specific at closest liquid trading hubs 5% hedged for 2014 Increase hedge levels when market liquidity and hedges accomplish the company’s risk management objectives Increasing hedge levels as INDY Hub improves Implemented collar option strategy in April 2012 Provides downside protection while leaving portfolio room to capture upside up to option strike price No hedges on for 2014 Increase hedge levels when market liquidity and hedges accomplish the company’s risk management objectives HEDGING POSITIONS(1) Swaps 27 Swaps Options |
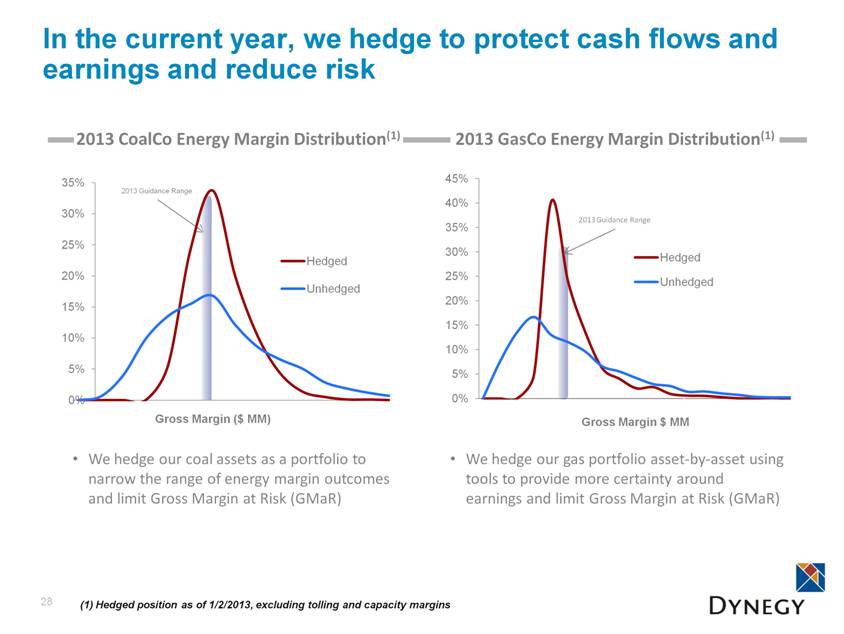
| In the current year, we hedge to protect cash flows and earnings and reduce risk 28 We hedge our coal assets as a portfolio to narrow the range of energy margin outcomes and limit Gross Margin at Risk (GMaR) (1) Hedged position as of 1/2/2013, excluding tolling and capacity margins 2013 CoalCo Energy Margin Distribution(1) 2013 GasCo Energy Margin Distribution(1) We hedge our gas portfolio asset-by-asset using tools to provide more certainty around earnings and limit Gross Margin at Risk (GMaR) 2013 Guidance Range 2013 Guidance Range |
| Finally, we look for opportunities to capture both the intrinsic value and extrinsic value of our assets 29 At-the-money Out-of-the-money In-the-money Gross Margin PEAKERS CCGT COAL Opportunistic value capture in real time and intra-month markets for peaking assets Commercial strategies focused on capturing option value through re-balancing positions as market-based generation expectations change Commercial strategies focused on capturing intrinsic value and protecting against downside risk for baseload assets while maintaining upside participation Extrinsic Value Intrinsic Value Spread Value Intrinsic Value = Inherent value today that can be captured by hedging the spread today and taking the hedge to delivery Extrinsic Value = Additional value that could be realized if prices changed (volatility) between now and the time of delivery |
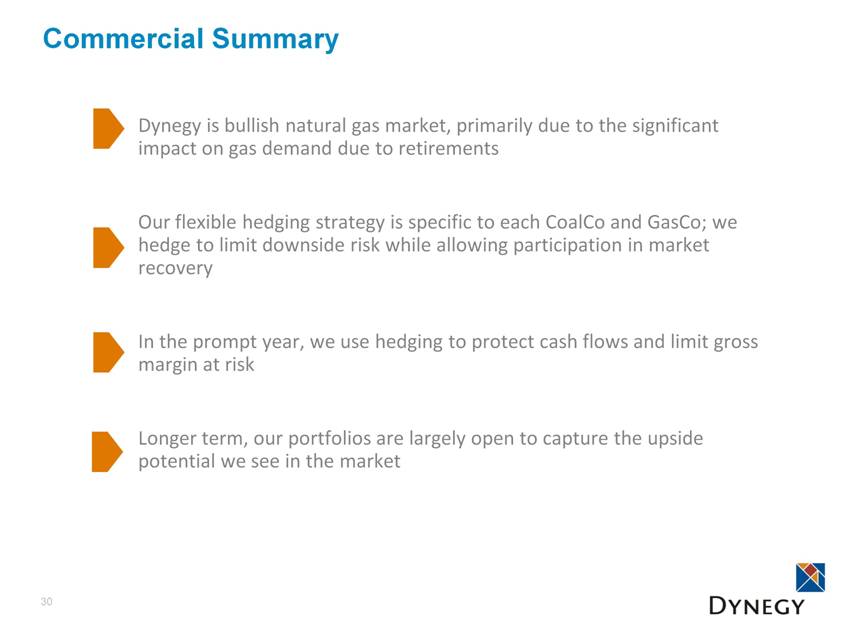
| Commercial Summary Dynegy is bullish natural gas market, primarily due to the significant impact on gas demand due to retirements Our flexible hedging strategy is specific to each CoalCo and GasCo; we hedge to limit downside risk while allowing participation in market recovery In the prompt year, we use hedging to protect cash flows and limit gross margin at risk Longer term, our portfolios are largely open to capture the upside potential we see in the market 30 |
| IV. CoalCo Review Brian Despard – VP, CoalCo Asset Management |
| CoalCo runs an environmentally compliant, low-cost fleet with a highly favorable outlook 32 Earnings positive for 2013 despite a low gas price environment CoalCo’s cost structure and capital expenditure outlook provide low-cost stability PRIDE initiatives underway for further gross margin improvement Positioned to benefit from market trends 1 2 3 4 |
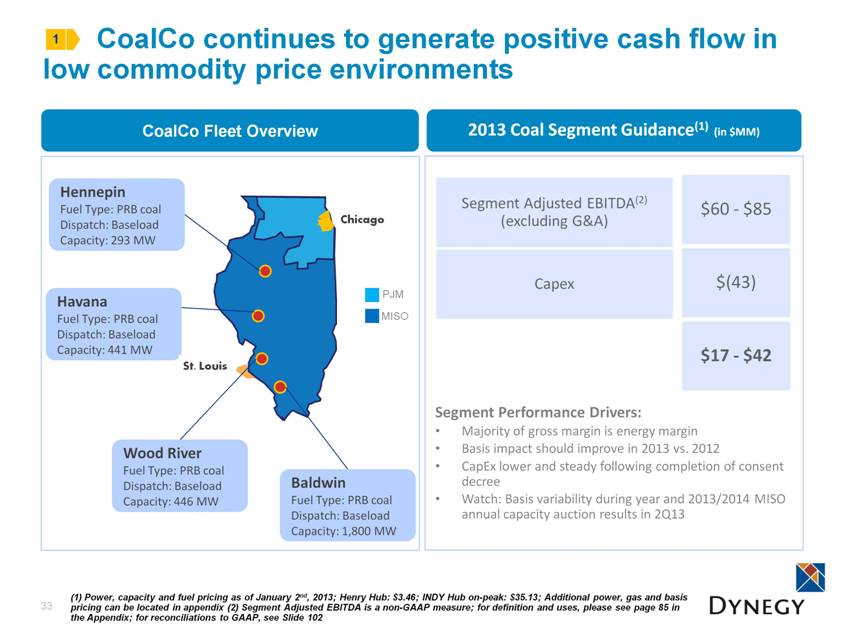
| CoalCo continues to generate positive cash flow in low commodity price environments 33 CoalCo Fleet Overview PJM MISO Chicago 1 (1) Power, capacity and fuel pricing as of January 2nd, 2013; Henry Hub: $3.46; INDY Hub on-peak: $35.13; Additional power, gas and basis pricing can be located in appendix (2) Segment Adjusted EBITDA is a non-GAAP measure; for definition and uses, please see page 85 in the Appendix; for reconciliations to GAAP, see Slide 102 Baldwin Fuel Type: PRB coal Dispatch: Baseload Capacity: 1,800 MW Havana Fuel Type: PRB coal Dispatch: Baseload Capacity: 441 MW Wood River Fuel Type: PRB coal Dispatch: Baseload Capacity: 446 MW Hennepin Fuel Type: PRB coal Dispatch: Baseload Capacity: 293 MW St. Louis Segment Adjusted EBITDA(2) (excluding G&A) $60 - $85 Capex $(43) $17 - $42 2013 Coal Segment Guidance(1) (in $MM) Segment Performance Drivers: Majority of gross margin is energy margin Basis impact should improve in 2013 vs. 2012 CapEx lower and steady following completion of consent decree Watch: Basis variability during year and 2013/2014 MISO annual capacity auction results in 2Q13 |
| With a sustainable low-cost competitive advantage, Dynegy’s coal fleet is positioned for the long term 34 MISO-CENTRAL 2014 DISPATCH COSTS(1) ($/MWh) MISO-CENTRAL DISPATCH ORDER Uneconomic plants in portfolio have been retired Burns low cost PRB coal Advantageous rail contract for coal delivery PRIDE improvements to operating cost structure Region has limited coal-to-gas switching as MISO is a coal-dominated market Impact of environmental retrofits on operating costs below competitors 2 COMMENTS COAL FLEET CAPACITY FACTORS(2) (1) Based on Dynegy analysis; $4.00 Henry Hub (2) Source: Ventyx, 2012 data is YTD through September 2012 (3) Based on weighted-average of CoalCo fleet CoalCo plants Average Peak Baseload |
| With all environmental retrofits in place, capital expenditures will reduce significantly for 2013-2015 35 Routine major maintenance outages scheduled for 2014-2015, resulting in slightly higher CapEx compared to 2013 Will continue to work towards reducing costs while maintaining a safe and reliable fleet (1) Abbreviations for environmental control equipment can be found in the Appendix; (2) The enterprise capital expenditure outlook, including Gas segment, corporate, discretionary and capitalized interest can be found in the Appendix, Slide 89 2 Over $1 billion investment in environmental controls Uneconomic plants already retired All units expected to be fully MATS compliant Units are in the market for the long term CoalCo Environmental Control Equipment by Plant (1) How Dynegy Complies Particulate Controls Nox Controls SO2 Controls Mercury Controls Baldwin 1 ESP, FF SCR Dry FGD ACI Baldwin 2 ESP, FF SCR Dry FGD ACI Baldwin 3 ESP, FF Low NOx burner Dry FGD ACI CaBR Havana 6 ESP, FF SCR and Low NOx burner Dry FGD ACI Hennepin 1-2 ESP, FF Low NOx burner Ultra low sulfur coal ACI CaBR Wood River 4 ESP Low NOx burner Ultra low sulfur coal ACI CaBR Wood River 5 ESP Low NOx burner Ultra low sulfur coal ACI CaBR CoalCo Anticipated Capital Expenditures(2) $ MM $89 $43 $57 $61 |
| 36 2012 basis greater than normal, primarily due to severe summer drought and increased transmission outages 3 Ameren transmission outages + Prairie State Drought induced unit outages during high demand 2012 basis levels were higher than normal, in large part due to transmission outages and drought conditions Transmission outages were higher in 2012 than we have experienced in years Increased basis congestion in 4Q2012 primarily due to Ameren transmission outages and Prairie State 4Q2012 basis averaged $(10.37) on-peak and $(6.48) off-peak 2012 CoalCo Gen-Weighted Basis to INDY Hub ($/MWh) |
| 37 Expect a return to more normal levels in 2013 3 ($/MWh) 2008 2009 2010 2011 2012 2013E On-Peak $(7.07) $(5.27) $(4.88) $(5.10) $(7.54) $(5.27) Off-Peak $(4.91) $(4.17) $(3.78) $(4.06) ($4.08) $(3.36) Around-the-clock $(5.92) $(4.68) $(4.29) $(4.54) $(5.80) $(4.32) Historic CoalCo Gen-Weighted Basis to INDY Hub 2013 basis estimates were modeled to reflect the impact of Prairie State Fewer transmission outages are expected in 2013 compared to 2012 2013 basis predictions include: Higher than average historical on-peak basis for Baldwin and Wood River Lower than average on and off-peak at Havana and Hennepin due to greater congestion to the south benefits plants to north |
| We are addressing basis issues going forward with two parallel efforts Retail Offering Physical Transmission Upgrades Secure sales closer to facility bus bar by directly serving local C&I customers as an Illinois retail energy supplier Detailed study with Quanta Technology initiated last year to identify opportunities where we can make improvements to congestion We expect results from the study 2H 2013 3 38 |
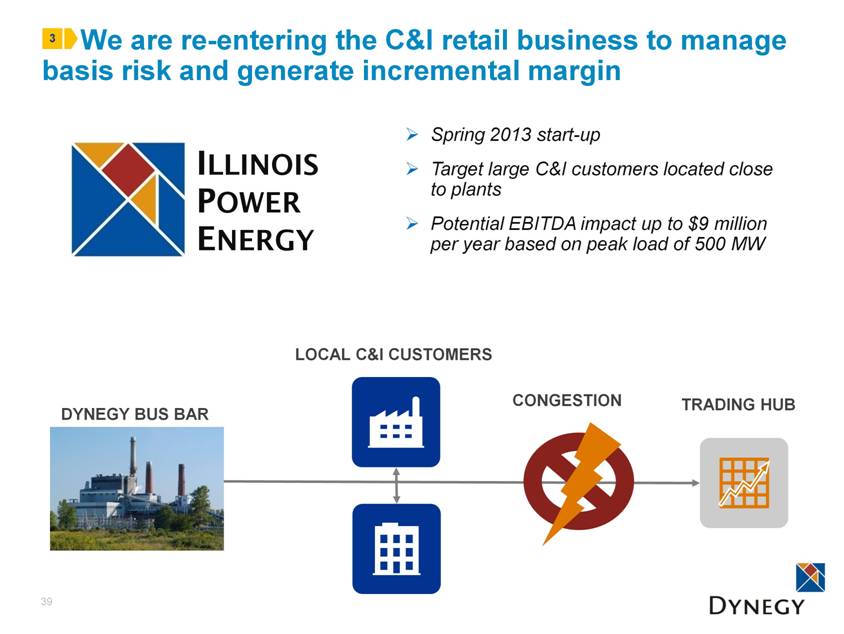
| 39 3 DYNEGY BUS BAR LOCAL C&I CUSTOMERS TRADING HUB CONGESTION We are re-entering the C&I retail business to manage basis risk and generate incremental margin Spring 2013 start-up Target large C&I customers located close to plants Potential EBITDA impact up to $9 million per year based on peak load of 500 MW ILLINOIS POWER ENERGY |
| Ameren, Illinois Territory Monthly Electricity Usage by Customer Size (1) 40 85 Target Customers 1-6 MW <1 MW Residential > 6 MW 75 10 Retail Customers Ameren-IL Customers Benefits for Dynegy Our focus is limited to mid and large size Commercial & Industrial customers 3 (1) Actual data for January – November 2012 and estimate for December 2012; Source: Illinois Commerce Commission and company research Competitive Advantages Secure sales closer to the plant to reduce basis volatility Collect retail premiums Realize portfolio effects Generation located close to load for efficient basis risk management Volume risk can be managed more effectively with physical assets Basis advantage versus out-of-state suppliers Total = 36.9 million MWhs |
| We are identifying opportunities to reduce basis through transmission upgrades that relieve local congestion 41 We are analyzing opportunities for incremental investment in transmission upgrades that will alleviate congestion around our plants. Analysis could result in various projects, including: Transformer upgrade Line reconductoring Switch upgrade Parallel path additions Voltage upgrades Transmission Upgrades to Relieve Local Congestion 3 Baldwin Wood River Havana Hennepin A $1.00/MWh improvement in ATC basis improves earnings by ~$22 million |
| CoalCo is more than a natural gas play; retirements will have a positive impact on pricing 42 4 Natural Gas Prices Energy Prices As coal generation is retired, increased gas consumption by gas-fired generation is expected to be the critical component driving increasing natural gas demand Power prices in MISO should improve as coal unit retirements cause gas units to increasingly set the marginal price Capacity Prices Retirements driven by MATS regulation and economics are expected to improve higher MISO capacity prices |
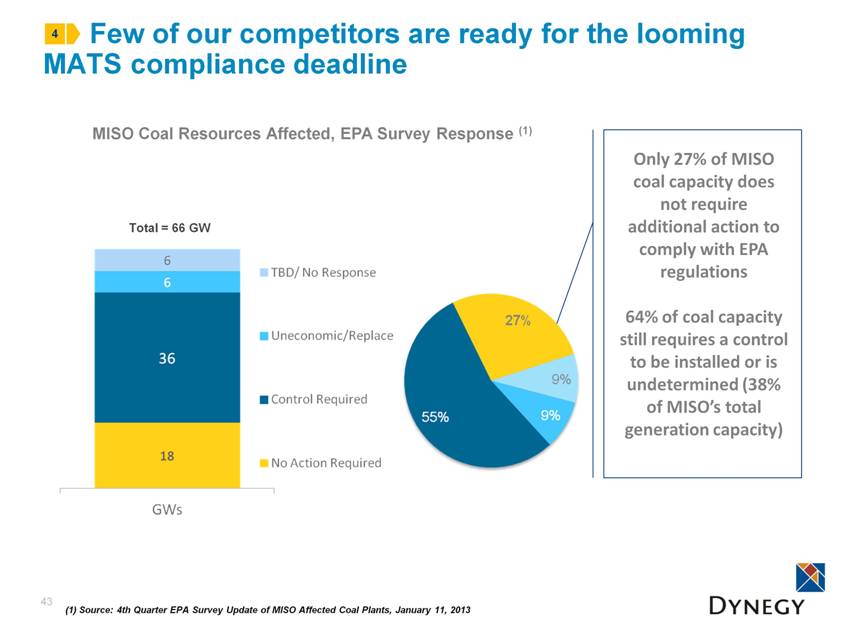
| MISO Coal Resources Affected, EPA Survey Response (1) Total = 66 GW Few of our competitors are ready for the looming MATS compliance deadline 43 4 (1) Source: 4th Quarter EPA Survey Update of MISO Affected Coal Plants, January 11, 2013 Only 27% of MISO coal capacity does not require additional action to comply with EPA regulations 64% of coal capacity still requires a control to be installed or is undetermined (38% of MISO’s total generation capacity) |
| Between now and 2016, we expect total net MISO retirements to be in the 10 - 11 GW range 44 (1) Source: MISO, Ventyx and Dynegy Analysis 4 1,500 MW of coal additions including Prairie State 545 MW likely CC/CT Gas additions Additions 13,400 MW of retirements, including 5,500 already announced Majority of retirements take place in 2015-2016 as MATS rules take effect Retirements Expected MISO Retirements, Net of Additions (2013 – 2016) MWs (1) Key Assumptions 11 GW of net retirements = 10% of MISO total capacity (10,953) 2013 2014 2015 2016 Net Retirements 1,616 127 (9,187) (3,224) |
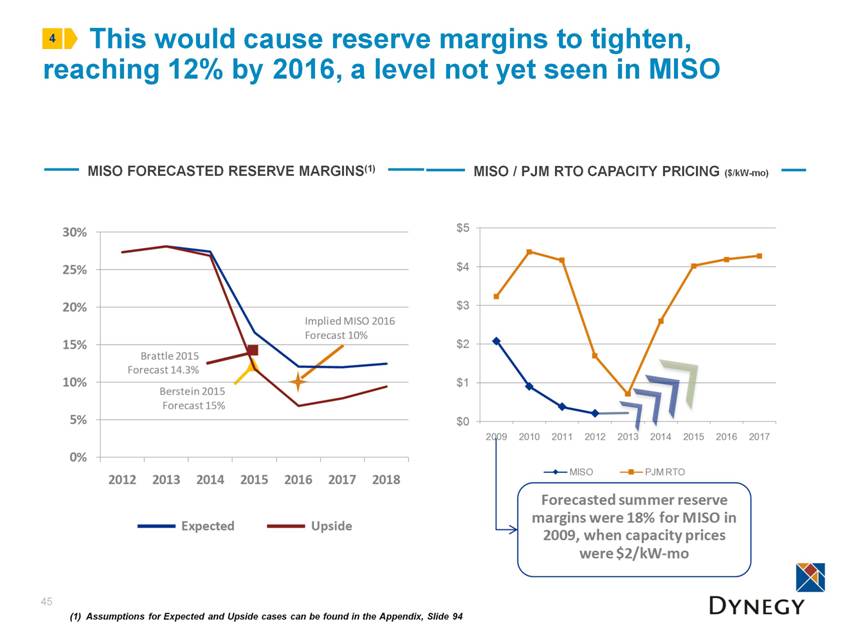
| This would cause reserve margins to tighten, reaching 12% by 2016, a level not yet seen in MISO 45 MISO / PJM RTO CAPACITY PRICING ($/kW-mo) 4 MISO FORECASTED RESERVE MARGINS(1) (1) Assumptions for Expected and Upside cases can be found in the Appendix, Slide 94 $0 $1 $2 $3 $4 $5 2009 2010 2011 2012 2013 2014 2015 2016 2017 MISO PJM RTO Forecasted summer reserve margins were 18% for MISO in 2009, when capacity prices were $2/kW - mo Upside Expected 0% 5% 10% 15% 20% 25% 30% 2012 2013 2014 2015 2016 2017 2018 Brattle 2015 Forecast 14.3% Implied MISO 2016 Forecast 10% Berstein 2015 Forecast 15% |
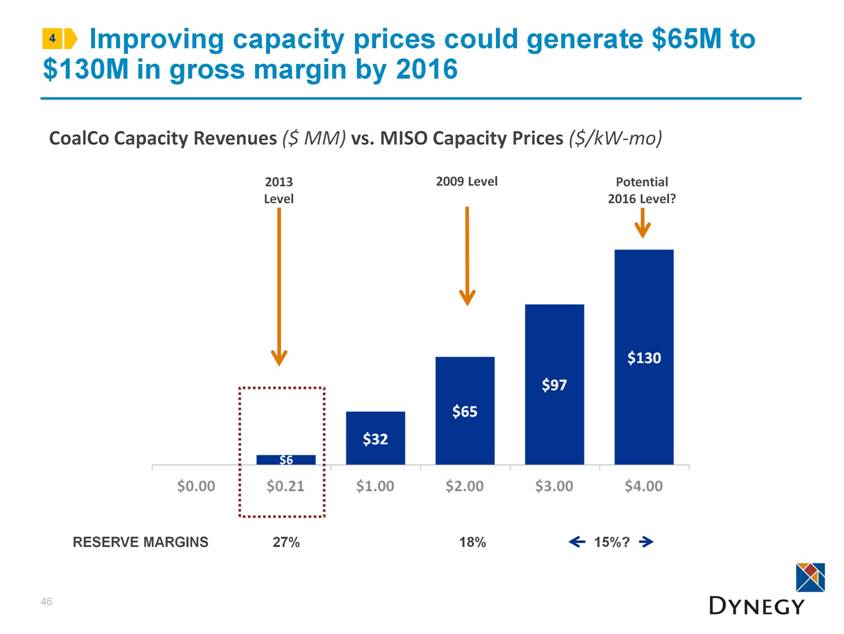
| 46 CoalCo Capacity Revenues ($ MM) vs. MISO Capacity Prices ($/kW-mo) 2013 Level Improving capacity prices could generate $65M to $130M in gross margin by 2016 4 RESERVE MARGINS 27% 18% 2009 Level 15%? Potential 2016 Level? |
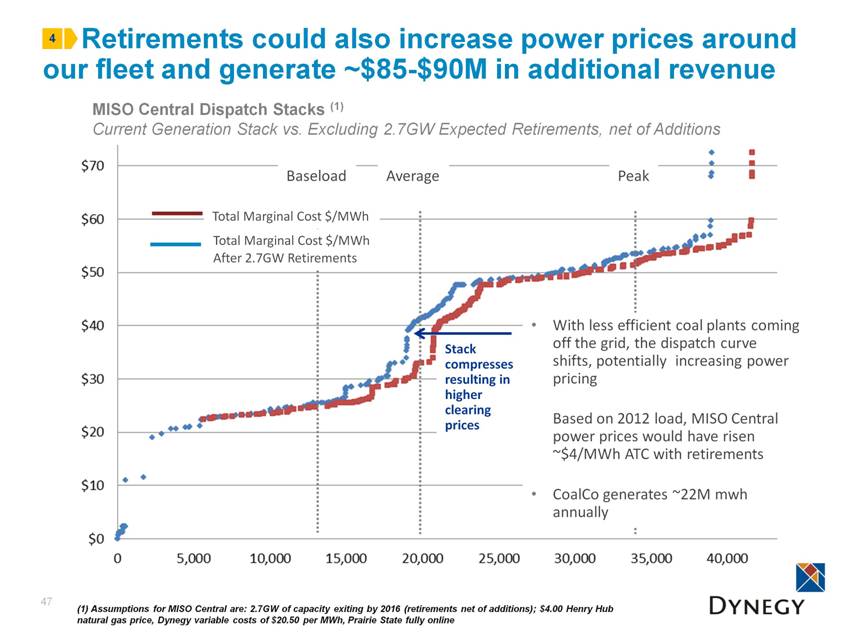
| Retirements could also increase power prices around our fleet and generate ~$85-$90M in additional revenue 47 MISO Central Dispatch Stacks (1) Current Generation Stack vs. Excluding 2.7GW Expected Retirements, net of Additions (1) Assumptions for MISO Central are: 2.7GW of capacity exiting by 2016 (retirements net of additions); $4.00 Henry Hub natural gas price, Dynegy variable costs of $20.50 per MWh, Prairie State fully online 4 With less efficient coal plants coming off the grid, the dispatch curve shifts, potentially increasing power pricing Based on 2012 load, MISO Central power prices would have risen ~$4/MWh ATC with retirements CoalCo generates ~22M mwh annually Baseload Average Peak Total Marginal Cost $/MWh Total Marginal Cost $/MWh After 2.7GW Retirements Stack compresses resulting in higher clearing prices |
| CoalCo Summary 48 CoalCo’s low dispatch costs and completed environmental compliance position the fleet for long-term success Opportunities to mitigate basis risk and improve margin being pursued through retail sales and transmission projects We expect coal retirements to favorably impact CoalCo earnings in three ways: Places increased pressure on national supply of natural gas, which could lead to higher natural gas prices Lower reserve margins likely to improve capacity prices Increases gas units serving load, setting marginal price and increasing power prices |
| V. GasCo Review Alan Padgett – VP, GasCo Asset Management 49 |
| GasCo operates a diverse fleet of assets generating steady cash flow in 2013 50 Earnings in 2013 continue to provide support through the current commodity environment California assets with unique capabilities critical to the state’s evolving generation mix PJM assets are poised to benefit from increasing coal plant retirements, Marcellus supply and upgrade opportunities NYISO asset will benefit from increasing natural gas supply from the Marcellus region and retirements Potential for development opportunities in California and PJM 1 2 3 4 5 |
| In 2013 GasCo is expected to generate strong earnings and cash flow 51 $255 - $280 $(63) $192 - $217 1 (1) Power, capacity and fuel pricing as of January 2nd, 2013; Henry Hub Price: $3.46; Additional power, gas and basis pricing can be located in appendix; (2) Segment Adjusted is a non-GAAP measure; for definition and uses, please see the Appendix, Slide 85; reconciliation to GAAP can be found on Slide 102 Segment Adjusted EBITDA(2) (excluding G&A) Capex Segment Performance Drivers 2013 Gas Segment Guidance(1) Excludes impact of potential settlement of Morro Bay tolling and Moss Landing capacity contracts Approximately 75% gross margin from tolling and capacity revenues; remainder primarily from energy margin We expect capacity factors to decrease from 2012 levels, primarily impacting less economic off-peak hours Ontelaunee’s basis risk hedged 50% Watch: Spark spreads, power basis |
| GasCo’s fleet is located across four different markets 52 GasCo Fleet Overview Ontelaunee Fuel Type: Gas CCGT Dispatch: Intermed. Capacity: 580 MW ISO: PJM MAAC Capacity Zone Kendall Fuel Type: Gas CCGT Dispatch: Intermediate Capacity: 1,200 MW ISO: PJM RTO Capacity Zone Casco Bay Fuel Type: CCGT Gas Dispatch: Intermediate Capacity: 540 MW ISO: ISO-NE Independence Fuel Type: CCGT Gas Dispatch: Intermediate Capacity: 1,064 MW ISO: NYISO Moss Landing 1&2 Fuel Type: CCGT Gas Dispatch: Intermediate Capacity: 1,020 MW Moss Landing 6&7 Fuel Type: Gas Dispatch: Peaking Capacity: 1,509 MW Morro Bay Fuel Type: Gas Dispatch: Peaking Capacity: 650 MW Oakland Fuel Type: Oil Dispatch: Peaking Capacity: 165 MW Philadelphia Chicago |
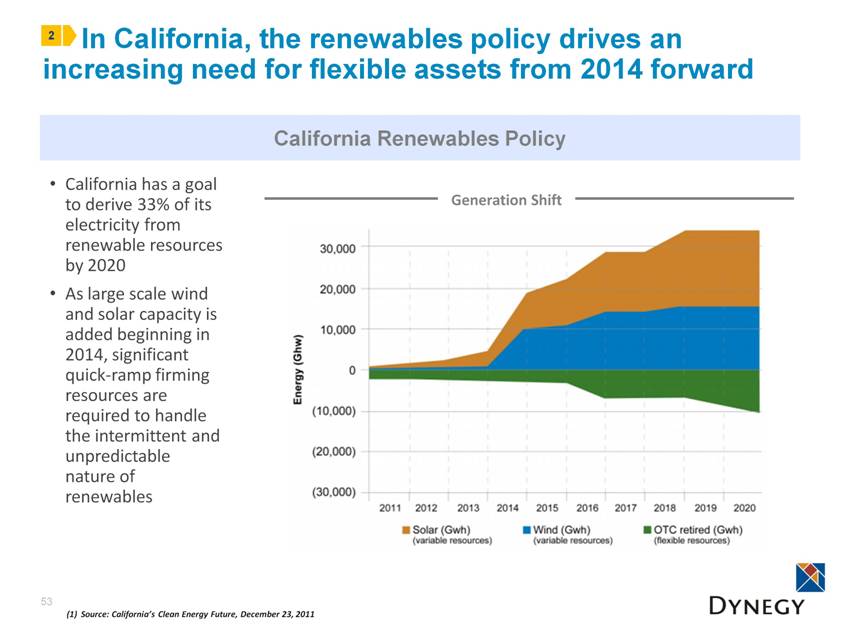
| In California, the renewables policy drives an increasing need for flexible assets from 2014 forward 53 California has a goal to derive 33% of its electricity from renewable resources by 2020 As large scale wind and solar capacity is added beginning in 2014, significant quick-ramp firming resources are required to handle the intermittent and unpredictable nature of renewables 2 (1) Source: California’s Clean Energy Future, December 23, 2011 California Renewables Policy Generation Shift |
| Moss Landing 6&7’s firming capabilities are unique and valuable to the grid 54 54 California 2020 Net Load Requirements(1) 2 (1) Source: CAISO (2) Assumes CCGT operating at 2x1 at a min/max range of 350-550 mw Solar Power Hours Generation Capability within 2 hours (2) MW Moss 6&7 is capable of fulfilling more than 10% of CAISOs steepest expected increase in power needs Aggressively market capabilities : Continue working with CPUC, CAISO and PG&E Participate in the RFO process upon end of current contract: Anticipate RTO process in summer 2013 for energy needs in 2014 and beyond Action Plan |
| In PJM, we expect capacity pricing to continue to reflect coal plant retirements and tighter reserve margins 55 3 Ontelaunee (MAAC) Kendall (RTO) PJM load forecast reduction Increased transmission import capability Potential new builds (~1-2 GW) Potential coal retirements in MAAC (0-2 GW) Higher capacity price bid caps for coal plants Limited incremental Demand Response potential PJM load forecast reduction Potential incremental Demand Response Potential coal retirements in RTO (1-4 GW) Higher capacity price bid caps for coal plants Increased transmission export capability PJM Capacity Auction Results $ mm Key Drivers for 2016/2017 Auction $25 M |
| Retirements beyond those announced in PJM could increase power prices generating an additional ~$9-$10M 56 PJM Dispatch Stacks (1) Generation Stack Excluding 18GW Announced Retirements vs. Excluding 22.6GW Expected Retirements 3 With less efficient coal plants coming off the grid, the dispatch curve shifts, potentially increasing power pricing Based on an average 2012 load and an average 2011/2012 volume dispatch for Kendall and Ontelaunee, PJM power prices would rise an incremental ~$1.35/MWh ATC for both plants with 22.6GW retirements vs. 18GW retirements Baseload Average Peak Stack compresses resulting in higher clearing prices (1) Assumes that in addition to 18GW of retirements already announced in PJM, that 4.6GW of uneconomic coal capacity comes off line Total Marginal Cost $/MWh After 22.6GW Retirements Total Marginal Cost $/MWh After 18GW Retirements |
| Bilateral contract expires Oct. 31, 2014 Going forward, we will continue to pursue bilateral sales and participate in the NYISO administered auctions Recent favorable FERC buyer-side mitigation ruling and retirement announcements driving clearing prices in Rest of State (ROS) monthly spot auction higher Longer term, we expect continuing strong ROS capacity market from: ~2.4-4.4 GW of announced and at risk retirements Limited in-state generation development pipeline Demand Response participation near saturation levels Transmission import projects still a number of years away 57 In NYISO, auction prices mean post-contract capacity revenue for Independence could reach ~$30M 4 (1) Reflects Danskammer retirements, excludes possible Indian Point retirement NYISO Monthly Spot Auction Price ($/kW-mo) Expected NYISO Net Retirements(1) (MW) NYISO Capacity Market |
| Additionally, we expect ~$28M improvement for Independence delivered fuel costs; combined with ROS capacity offsets ~50% of expiring capacity contract 58 Long term objective: Eliminate dependence on relatively expensive Canadian supply and other non-core legacy transportation by the end of October 2015 Improving Independence Fuel Supply 4 Action Plan Source physical gas supply from the Marcellus shale area; target 100% supply from Marcellus by 2015 Seek storage and/or park-and-loan type flexibility options on the U.S. side of the border Optimize under-utilized Canadian transportation and storage Estimated Fuel and Transportation Savings $ MM |
| GasCo has near-term development opportunities 59 Repower Oakland Expand Kendall Oakland’s RMR contract with CAISO provides marginal contribution to Dynegy’s EBITDA; excellent location near load The Opportunity The Oakland site provides a brownfield opportunity to repower with efficient gas fired peakers in a local reliability area that should receive premium capacity payments Rising use of intermittent resources (renewables) will increase real-time volatility and the need for peaking plants Conversion from oil to gas will be viewed positively by local community Next Steps Garner local support Evaluate development costs and requirements Kendall, located near the Chicago load, has room for expansion The Opportunity Robust capacity market in PJM with projections over $4/kW-mo in the forward market supports economic rationale Rising use of intermittent resources (renewables) will increase real-time volatility Kendall is a good candidate for potential steam turbine upgrade to increase unit capability by 60-90 MW per turbine Also considering new flexible technology that combines CCGT efficiency and peaker ramp time capabilities Next Steps Evaluate development costs and requirements 5 |
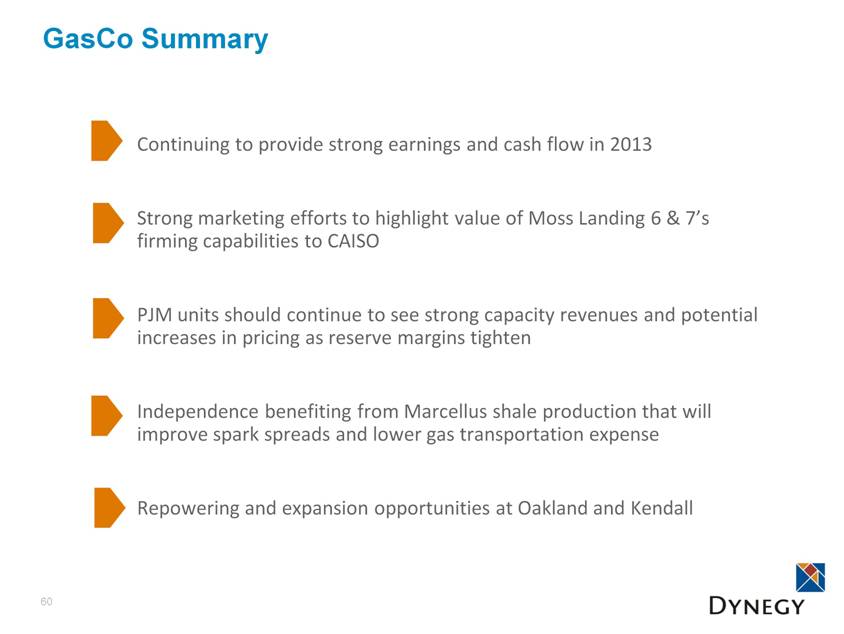
| GasCo Summary Continuing to provide strong earnings and cash flow in 2013 Strong marketing efforts to highlight value of Moss Landing 6 & 7’s firming capabilities to CAISO PJM units should continue to see strong capacity revenues and potential increases in pricing as reserve margins tighten Independence benefiting from Marcellus shale production that will improve spark spreads and lower gas transportation expense Repowering and expansion opportunities at Oakland and Kendall 60 |
| VI. Regulatory Update Dean Ellis – Senior Director, Government Affairs |
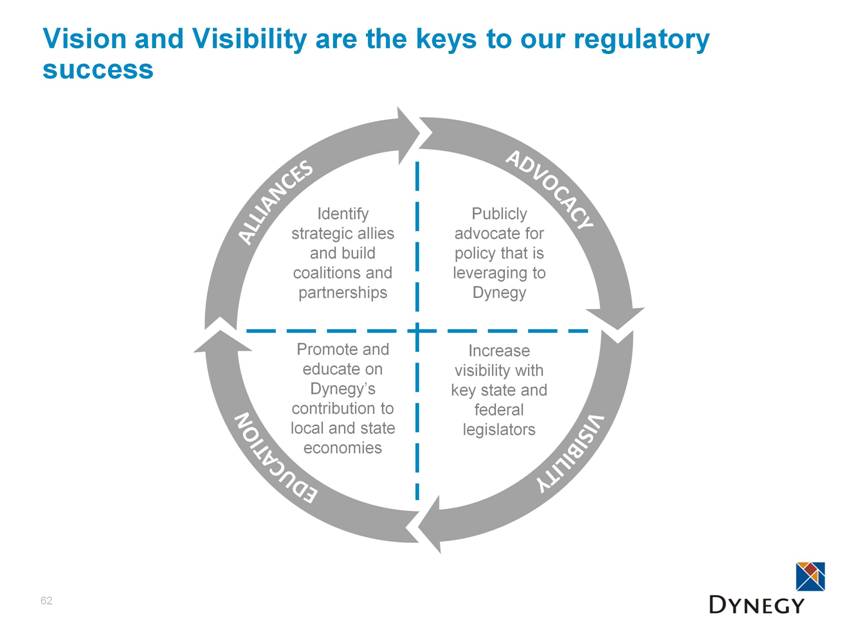
| Vision and Visibility are the keys to our regulatory success 62 Identify strategic allies and build coalitions and partnerships Publicly advocate for policy that is leveraging to Dynegy Promote and educate on Dynegy’s contribution to local and state economies Increase visibility with key state and federal legislators |
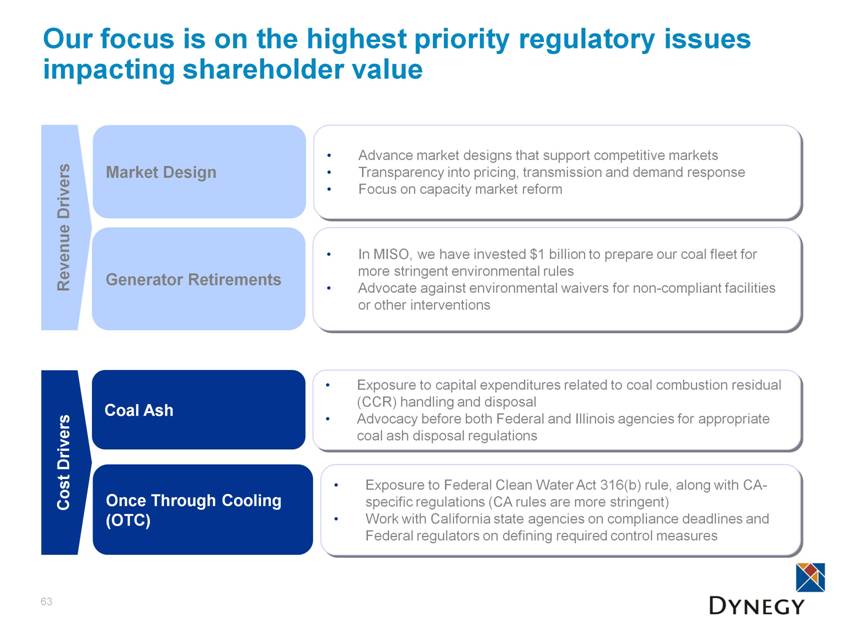
| Our focus is on the highest priority regulatory issues impacting shareholder value 63 Market Design Advance market designs that support competitive markets Transparency into pricing, transmission and demand response Focus on capacity market reform Once Through Cooling (OTC) Coal Ash Generator Retirements In MISO, we have invested $1 billion to prepare our coal fleet for more stringent environmental rules Advocate against environmental waivers for non-compliant facilities or other interventions |
| The time is now to effectuate a number of Market Design efforts, focusing on capacity markets Support transition from a vertical demand curve toward a sloping demand curve, which more accurately reflects the value of capacity Work toward comprehensive capacity reform, beginning with support for a forward Resource Adequacy (RA) program, and subsequently a “capabilities” market Minimum Offer Price Rule (MOPR) revisions and comparable treatment for demand response to ensure adequate price signals Enforcement of buyer-side mitigation rules and continued engagement in triennial demand curve reset (2014-2017 market period) to ensure adequate cost of new entry (CONE) Support strict buyer-side mitigation rules, and evolution to a sloped demand curve to ensure price certainty 64 MISO PJM CAISO NYISO ISO- NE Market Design Priorities Targets of Advocacy Efforts Tools ISOs State regulators Strategic allies ISO stakeholder processes Education Direct outreach Interventions and briefs |
| Vigorously advocate for a level playing field Advocating for retirement of non-compliant plants in PJM and MISO is a critical area of regulatory effort 65 Generator Retirement Priorities All generation owners should be held equally to environmental regulations and pollution control agreements Key Message Ease exit for retiring units Market rules should not impede uneconomic and/or non-compliant units from retiring Political and economic impact of retirements must be proactively managed Key Messages Target Targets ISOs Regulators Policy makers Regulators Tools Tools Stakeholder process Direct outreach Education Direct outreach Legal challenges Interventions Direct outreach |
| After a thorough and lengthy development process, we believe MATS is unlikely to be overturned 66 12/1997 EPA issued Mercury Study Report to Congress 1/2004 EPA proposed rule for controlling mercury from power plants with two approaches 3/2005 EPA issued final Clean Air Mercury Rule (CAMR) 2/2008 DC Circuit Court vacated CAMR 3/2011 EPA proposed new rule to replace the vacated CAMR – Mercury and Air Toxics Standards (MATS) 12/2011 Final MATS rule issued 4/2012 MATS rule became effective 6/2012 Senate defeated a Republican measure to overturn MATS; the measure required 50 votes but only received 46; had it passed, the President would have vetoed it 4/2015 Compliance deadline 4/2016 Second compliance deadline (with State’s extension) 4/2017 Final compliance deadline (with Presidential exemption) MATS is currently under judicial review; however, we believe it is unlikely that the court would vacate the entire rule The rule has undergone a thorough and lengthy development process over the last 15 years The EPA is under a consent decree to develop MATS Many generator owners, including Calpine and Exelon, have intervened in the MATS litigation process on the side of EPA to advocate for implementation of the rule Mercury and Air Toxics Standards Timeline Source: EPA |
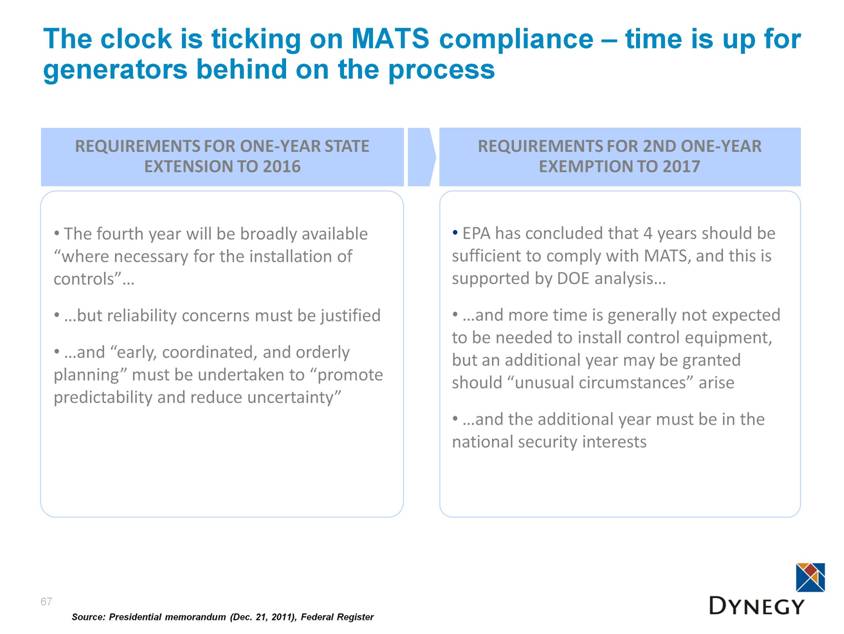
| The clock is ticking on MATS compliance – time is up for generators behind on the process 67 The fourth year will be broadly available “where necessary for the installation of controls” but reliability concerns must be justified and “early, coordinated, and orderly planning” must be undertaken to “promote predictability and reduce uncertainty” EPA has concluded that 4 years should be sufficient to comply with MATS, and this is supported by DOE analysis and more time is generally not expected to be needed to install control equipment, but an additional year may be granted should “unusual circumstances” arise and the additional year must be in the national security interests Source: Presidential memorandum (Dec. 21, 2011), Federal Register REQUIREMENTS FOR ONE-YEAR STATE EXTENSION TO 2016 REQUIREMENTS FOR 2ND ONE-YEAR EXEMPTION TO 2017 |
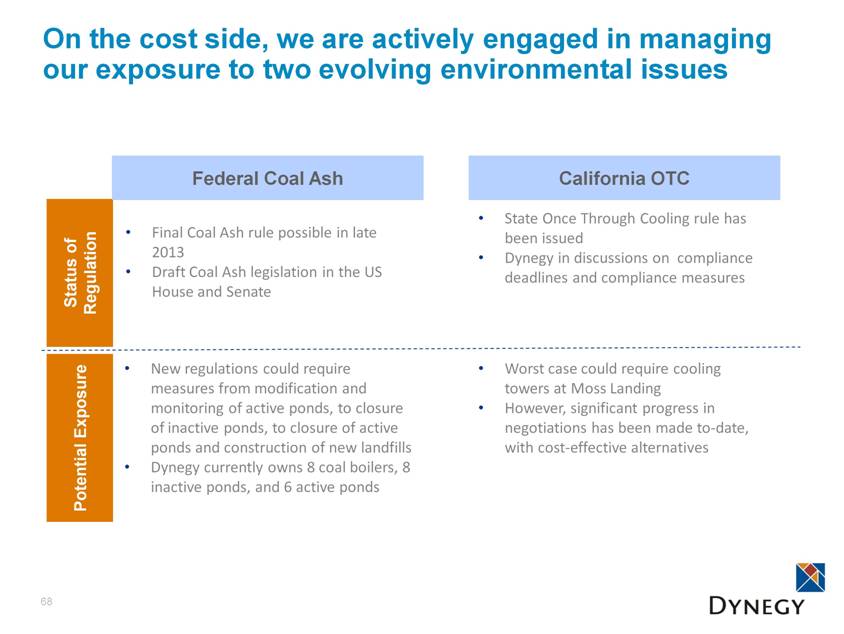
| 68 Federal Coal Ash California OTC State Once Through Cooling rule has been issued Dynegy in discussions on compliance deadlines and compliance measures Worst case could require cooling towers at Moss Landing However, significant progress in negotiations has been made to-date, with cost-effective alternatives New regulations could require measures from modification and monitoring of active ponds, to closure of inactive ponds, to closure of active ponds and construction of new landfills Dynegy currently owns 8 coal boilers, 8 inactive ponds, and 6 active ponds Final Coal Ash rule possible in late 2013 Draft Coal Ash legislation in the US House and Senate |
| Regulatory Summary Our Regulatory approach is to ensure high visibility around issues that most impact our revenues and costs Market Design efforts are focused on MISO and CAISO, where capacity market reform is most needed and has the biggest impact on Dynegy We are focusing on MISO and PJM in advocating for generator retirements as MATS compliance deadlines draw near Federal Coal Ash and Once through Cooling regulations in California are environmental issues on the horizon that we are actively addressing 69 |
| VII. 2012-2013 Guidance Estimates and Financial Review Clint Freeland - CFO |
| 71 2013 Financial Review and Goals Deliver on Financial Targets for 2013 Improve capital structure efficiencies through refinancing of existing term loans and other near-term measures Increase capacity for capital allocation program and pursue investments with the highest risk-adjusted return 1 2 3 |
| 2013 Guidance – Notes and Major Assumptions Segment Adjusted EBITDA is provided to more clearly demonstrate financial results of each business Corporate allocations and legacy financing structure obscure contributions that each segment makes To increase transparency, segment Adjusted EBITDA reflects segment gross margin less operating expenses Updated approach demonstrates how much cash each business generates to help pay for corporate cost structure and capital structure A non-GAAP measure 72 Notes Major Assumptions* Impact of potential settlement for Morro Bay tolling and Moss Landing capacity contracts are excluded from guidance; plant is modeled as a merchant operators without any re-contracting assumption Commodity curves as of January 2, 2013 NYMEX natural gas of $3.46/MMBtu for Cal ’13 Debt refinancing in August 2013 Assumes that $150MM of the restricted cash released by refinancing used to pay down debt * Additional power, gas and basis pricing can be located in Appendix, by segment 1 |
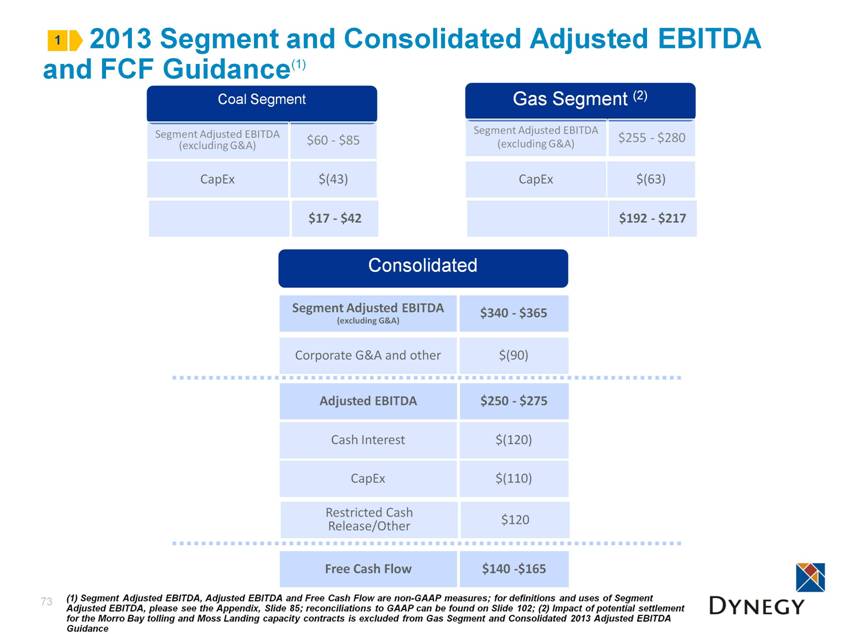
| 2013 Segment and Consolidated Adjusted EBITDA and FCF Guidance(1) 73 Gas Segment (2) Segment Adjusted EBITDA (excluding G&A) $255 - $280 Consolidated Segment Adjusted EBITDA (excluding G&A) $340 - $365 Cash Interest $(120) Free Cash Flow $140 -$165 CapEx $(110) CapEx $(63) Coal Segment Segment Adjusted EBITDA (excluding G&A) $60 - $85 CapEx $(43) $17 - $42 $192 - $217 Restricted Cash Release/Other $120 (1) Segment Adjusted EBITDA, Adjusted EBITDA and Free Cash Flow are non-GAAP measures; for definitions and uses of Segment Adjusted EBITDA, please see the Appendix, Slide 85; reconciliations to GAAP can be found on Slide 102; (2) Impact of potential settlement for the Morro Bay tolling and Moss Landing capacity contracts is excluded from Gas Segment and Consolidated 2013 Adjusted EBITDA Guidance Corporate G&A and other $(90) Adjusted EBITDA $250 - $275 1 |
| Full year 2012 results were negatively impacted by Q4 74 1 Estimated Range of $50-60 million for 2012 Q4 2012 Performance Drivers Adjusted EBITDA impacted significantly by basis differentials in the Midwest and settlement of legacy put options at GasCo Adjusted EBITDA Q3 YTD 2012 to Preliminary, Unaudited YE 2012 ($MM) |
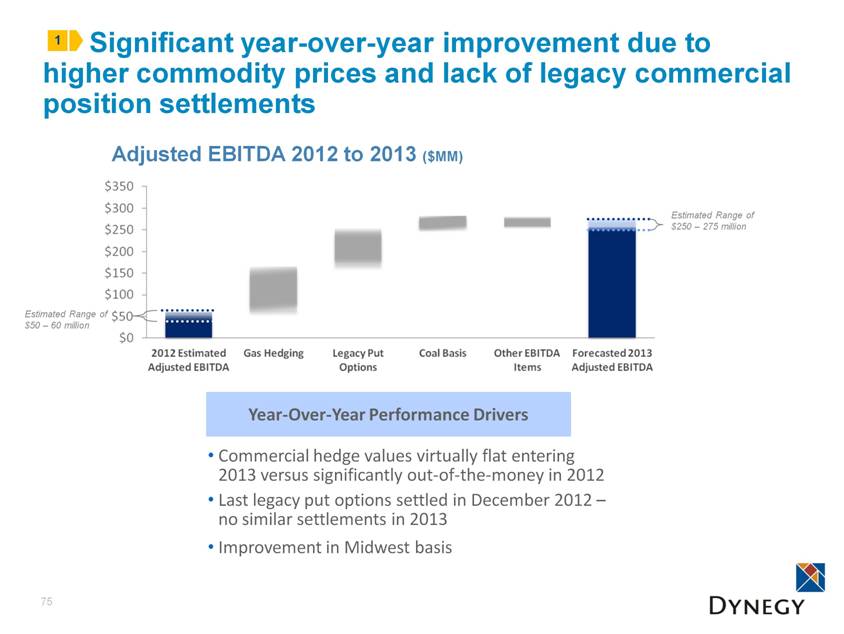
| 75 Adjusted EBITDA 2012 to 2013 ($MM) Estimated Range of $250 – 275 million Estimated Range of $50 – 60 million 1 Significant year-over-year improvement due to higher commodity prices and lack of legacy commercial position settlements Year-Over-Year Performance Drivers Commercial hedge values virtually flat entering 2013 versus significantly out-of-the-money in 2012 Last legacy put options settled in December 2012 – no similar settlements in 2013 Improvement in Midwest basis |
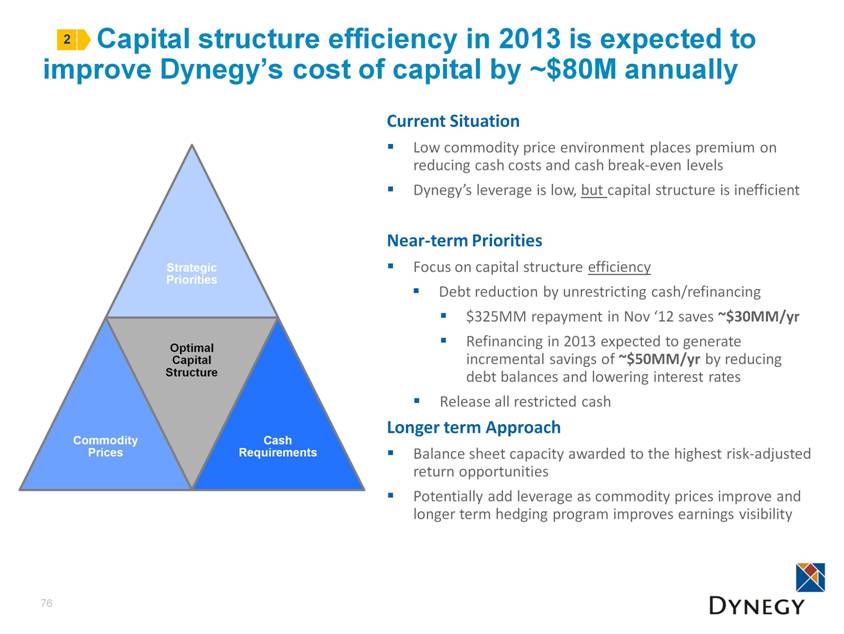
| Capital structure efficiency in 2013 is expected to improve Dynegy’s cost of capital by ~$80M annually 76 2 Current Situation Low commodity price environment places premium on reducing cash costs and cash break-even levels Dynegy’s leverage is low, but capital structure is inefficient Near-term Priorities Focus on capital structure efficiency Debt reduction by unrestricting cash/refinancing $325MM repayment in Nov ‘12 saves ~$30MM/yr Refinancing in 2013 expected to generate incremental savings of ~$50MM/yr by reducing debt balances and lowering interest rates Release all restricted cash Longer term Approach Balance sheet capacity awarded to the highest risk-adjusted return opportunities Potentially add leverage as commodity prices improve and longer term hedging program improves earnings visibility |
| Refinancing Objectives Refinancing at Dynegy Inc. improves capital structure as well as interest and administrative costs 77 Dynegy Inc. (DI) Dynegy Coal HoldCo Ring-fenced entities Ring-fenced entities Dynegy Gas HoldCo LLC Dynegy Midwest Generation LLC. (CoalCo) $518 mm 1st Lien TLB due 2017 $14 mm Cash Collateralized LC Facility Dynegy Power LLC. (GasCo) $837 mm 1st Lien TLB due 2017 $150 mm Revolver $222 mm Cash Collateralized LC Facility Bankruptcy-remote entities Dynegy Gas Investments Holdings, LLC Dynegy Coal Investments Holdings, LLC Current Capital Structure Pro Forma Capital Structure Dynegy Inc. (DI) New Revolver New Notes or Term Loan Dynegy Midwest Generation LLC. (CoalCo) (All Coal-Fired Generation Facilities) Dynegy Power LLC. (GasCo) (All Gas-Fired Generation Facilities) Dynegy Gas Investments Holdings, LLC Dynegy Coal Investments Holdings, LLC Refinance existing term loans at DI level with secured term loans and/or unsecured notes Establish new revolver at DI level – targeting minimum $400MM Reduces interest rate from L+775bps Every 50 bps improvement equals $6-7MM/year in interest savings Frees up $300 M in restricted cash Available for capital allocation Combines two marketing entities Provides ~$5-10MM in collateral netting benefits Eliminates ring-fenced entities Administrative savings of ~$0.5-1MM/year Today 2013 Target Refinancing Benefits 2 |
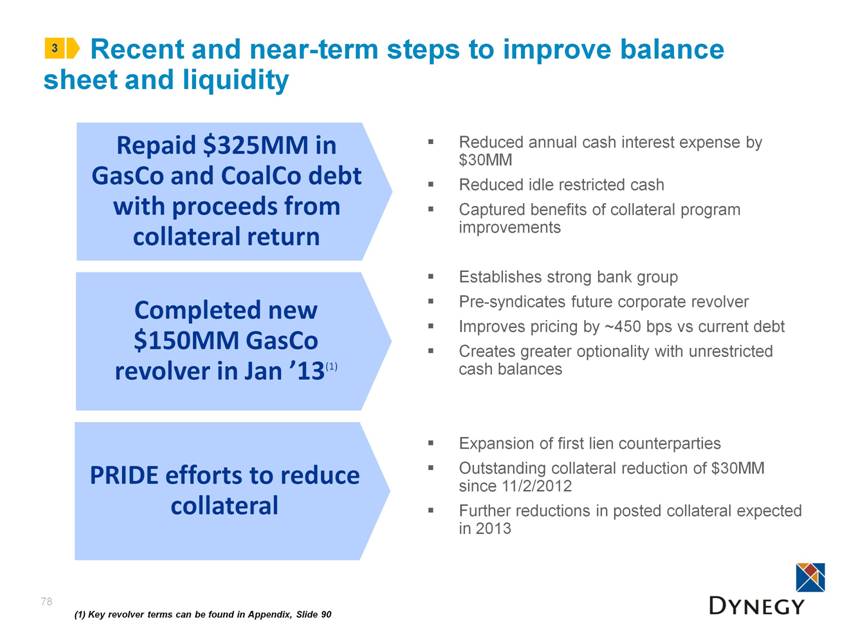
| Recent and near-term steps to improve balance sheet and liquidity Reduced annual cash interest expense by $30MM Reduced idle restricted cash Captured benefits of collateral program improvements Establishes strong bank group Pre-syndicates future corporate revolver Improves pricing by ~450 bps vs current debt Creates greater optionality with unrestricted cash balances Expansion of first lien counterparties Outstanding collateral reduction of $30MM since 11/2/2012 Further reductions in posted collateral expected in 2013 Completed new $150MM GasCo revolver in Jan ’13(1) PRIDE efforts to reduce collateral 3 (1) Key revolver terms can be found in Appendix, Slide 90 Repaid $325MM in GasCo and CoalCo debt with proceeds from collateral return 78 |
| 79 (1) PRIDE forecast for 2015 primarily based on projects either underway or identified and planned to be initiated Refinancing the capital structure is key to increasing capital allocation capacity in 2013 2013 Liquidity Program ($ MM) 3 Capital Allocation Assumed Debt Reduction of $150MM (per guidance) Balance Sheet / Liquidity Needs of ~$500MM ~$912 $458 ~$500 (1) |
| Financial Summary Focused on meeting or exceeding financial targets for the year and driving positive cash generation from both the Coal and Gas segments Continue to streamline the balance sheet and drive greater efficiency through various means including a refinancing of the existing term loans Create greater capital allocation capacity to pursue highest risk-adjusted return opportunities available to the company. 80 |
| VIII. Closing Remarks and Q&A |
| Dynegy’s Path to $500 million 82 Natural Gas Recovery(1) Capacity Pricing Uplift $65 - $130 ~$140 - $230 Power Pricing with Retirements(2) ~$90 Increasing Variable Costs (3) $(75)-(85) CA plant settlements (through 2016) PJM Capacity Pricing $25 TBD Net Impact of Expiring Contracts (5) $(90)-$(120) PRIDE(6) Interest Savings ~$80 $30 - $50 CoalCo GasCo Consolidated Potential EBITDA Drivers vs. 2013 Guidance ($ mm) (1) See Slide 15 for discussion; Net of ~ $(10)MM impact from GasCo; (2) See Slide 47 for discussion; (3) Includes impact of new rail transportation agreement and increases in fuel costs and O&M related to environmental controls; (4) See Slide 56 for discussion; (5) Assumes Independence capacity sold into NYISO capacity auction, full year Independence fuel and transportation savings, Moss Landing 6&7 recontracted at lower rates; (6) PRIDE forecast primarily based on projects underway or to be initiated 2013 Segment Adj. EBITDA $60 - $85 2013 Segment Adj. EBITDA $255 - $280 2013 Consolidated Adj. EBITDA $250 - $275 Power Pricing with Retirements(4) ~$10 Basis Management(4) $10 + Capital Allocation Impact TBD |
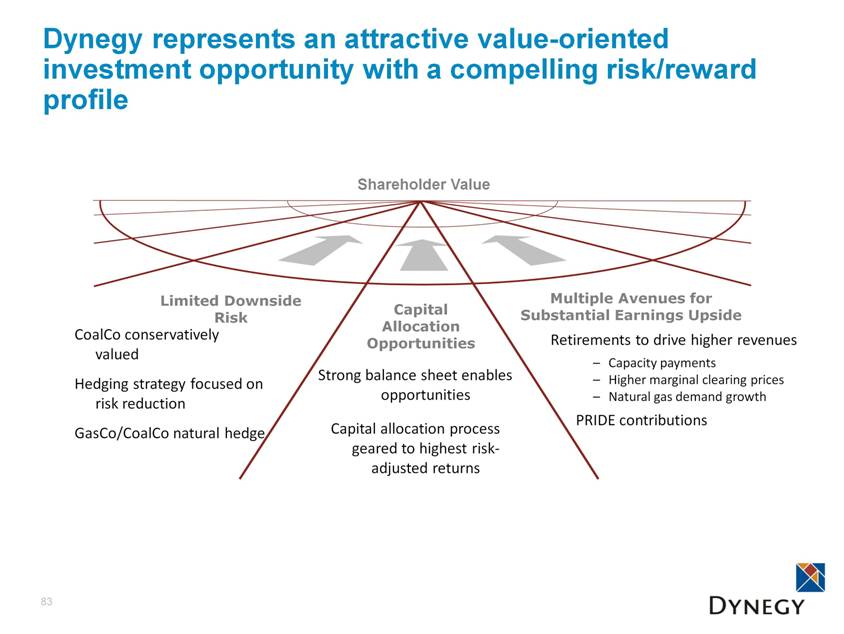
| Dynegy represents an attractive value-oriented investment opportunity with a compelling risk/reward profile 83 Shareholder Value Limited Downside Risk Capital Allocation Opportunities CoalCo conservatively valued Hedging strategy focused on risk reduction GasCo/CoalCo natural hedge Retirements to drive higher revenues Capacity payments Higher marginal clearing prices Natural gas demand growth PRIDE contributions Strong balance sheet enables opportunities Capital allocation process geared to highest risk-adjusted returns Multiple Avenues for Substantial Earnings Upside |
| Appendix |
| Segment Adjusted EBITDA Definition Segment Adjusted EBITDA is a non-GAAP measure which is utilized to more clearly demonstrate the financial results of each business segment. The measure reflects segment gross margin less operating expenses. Corporate allocations such as general and administrative expenses and the financial structure are not included in order to demonstrate the cash amount each business segment contributes towards the corporate cost and capital structures. 85 |
| 86 Dynegy Generation Facilities Portfolio/Facility(1) Location Net Capacity(2) Primary Fuel Dispatch Type Market Region Coal Baldwin Baldwin, IL 1,800 Coal Baseload MISO Havana Havana, IL 441 Coal Baseload MISO Hennepin Hennepin, IL 293 Coal Baseload MISO Wood River Units 4-5 Alton, IL 446 Coal Baseload MISO CoalCo TOTAL 2,980 Gas Casco Bay Veazie, ME 540 Gas - CCGT Intermediate ISO-NE Independence Scriba, NY 1,064 Gas - CCGT Intermediate NYISO Kendall Minooka, IL 1,200 Gas - CCGT Intermediate PJM Ontelaunee Ontelaunee Township, PA 580 Gas - CCGT Intermediate PJM Moss Landing Monterey County, CA Units 1-2 1,020 Gas - CCGT Intermediate CAISO Units 6-7 1,509 Gas Peaking CAISO Morro Bay (3) Morro Bay, CA 650 Gas Peaking CAISO Oakland Oakland, CA 165 Oil Peaking CAISO Black Mountain Las Vegas, NV 43 Gas Baseload WECC GasCo TOTAL 6,771 TOTAL GENERATION 9,751 NOTES: Dynegy owns 100% of each unit listed, except that it owns a 50% interest in the Black Mountain facility and the Danskammer Units 3 & 4 and Roseton facilities are leased and not owned. Total Net Capacity set forth in this table for Black Mountain includes only Dynegy’s proportionate share of such unit’s gross generating capacity. Unit capabilities are based on winter capacity. Represents Units 3 and 4 generating capacity. Units 1 and 2, with a combined net generating capacity of 352 MW, are currently in mothball status and out of operation. |
| 87 Appendix Financial |
| Enterprise Valuation Enterprise Valuation as of 1/2/2013 ($ MM) Total Debt $1,355 Equity Value: Stock (1) 1,939 Less: Cash and Restricted Cash(2) (718) Firm Value $2,576 Total Capacity (mws) (3) 9,751 $/kw $264 88 (1) Based on 1/2/13 price of $19.39 * 100MM shares (2) Liquidity as of 1/2/2013. No adjustment required for advisor fees as fees have been paid (3) Excludes Stallings/Oglesby and DNE |
| Anticipated Capital Expenditures (2013 – 2015) ($MM) 2013 2014 2015 Maintenance – Coal facilities $35 $48 $50 Maintenance – Gas facilities $59 $51 $61 Environmental $9 $9 $11 Corporate $4 $1 $1 Capitalized Interest $1 $1 $1 Discretionary $2 - - TOTAL CapEx $110 $110 $124 89 “Environmental” primarily consists of regular maintenance and FGD waste landfill Coal facility maintenance is relatively stable over time Maintenance - Gas facilities is largely a function of run-time and starts Future outages could be rescheduled |
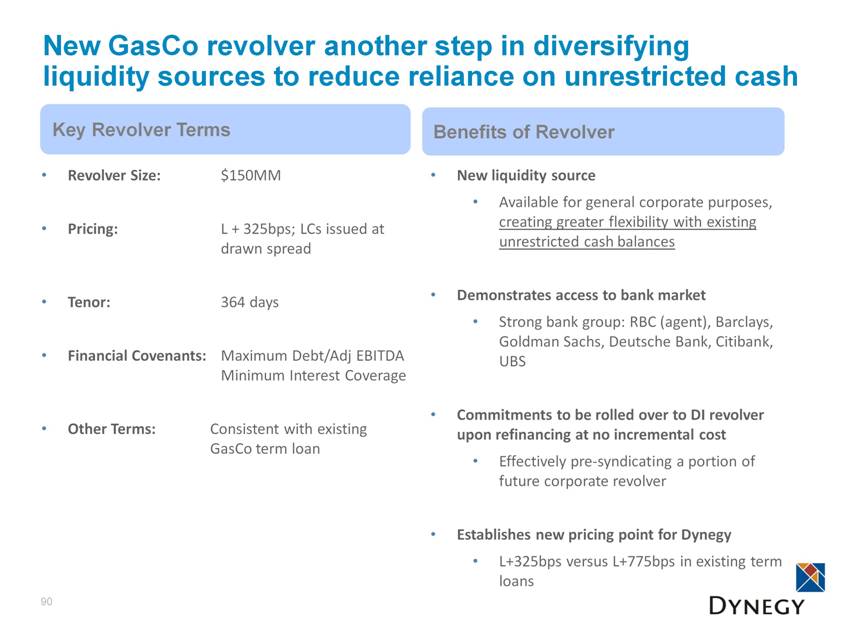
| New GasCo revolver another step in diversifying liquidity sources to reduce reliance on unrestricted cash 90 New liquidity source Available for general corporate purposes, creating greater flexibility with existing unrestricted cash balances Demonstrates access to bank market Strong bank group: RBC (agent), Barclays, Goldman Sachs, Deutsche Bank, Citibank, UBS Commitments to be rolled over to DI revolver upon refinancing at no incremental cost Effectively pre-syndicating a portion of future corporate revolver Establishes new pricing point for Dynegy L+325bps versus L+775bps in existing term loans Benefits of Revolver Key Revolver Terms Revolver Size: $150MM Pricing: L + 325bps; LCs issued at drawn spread Tenor: 364 days Financial Covenants: Maximum Debt/Adj EBITDA Minimum Interest Coverage Other Terms: Consistent with existing GasCo term loan 90 90 |
| Ratings Agency Feedback 91 Source: Moody’s and S&P ratings reports. Rating ‘B2’ Corporate Family B Outlook Stable Stable Commentary The ratings consider headwinds facing Dynegy, including the current low power price environment, the near-term maturity of two in-the-money power contracts and an indication that consolidated cash flows will decline over the near-term. Voluntary debt reduction completed late last year and anticipated future revenues from capacity revenues provides support for B2 rating. Concurrently, Moody’s affirmed GasCo’s senior secured term loan rating at B2 and revised its rating to stable from positive. GasCo rating reflects challenged business and highly leveraged profile over the forecast period, although repayment of $325 of the term loan in Q4 has improved leverage profile materially. Increased corporate family rating of GasCo to ‘B’ from CCC+ with stable outlook. Raised issue rating on GasCo Term Loan to BB- from B an affirmed ‘1’ recovery on it. Highlighted management team and board of directors with favorable industry standard and experience. 1 S&P did not rate Dynegy Inc on a proforma basis. Rating reflects updated GasCo rating |
| Appendix CoalCo |
| CoalCo Generation 93 Key Contracts Fuel 90% of PRB coal supply is contracted and priced through 2013 100% of rail transportation contracted and priced through a long-term agreement beginning July 2012 Forecasted Fundamentals 2013 Volumes (MM MWh) 21.9 Fleet Heat Rate(2) (Nameplate, Btu/kWh) Baseload 9,900 – 11,700 Power Prices – INDY Hub ($/MWh) On-Peak $35.13 Off-Peak $25.21 Natural Gas – Henry Hub ($/MMBtu) $3.46 Annual Average Capacity Factors Baseload 80% - 90% Average Capacity Price (kW-Mo) MISO $0.21 Average Gen to INDY Hub Basis ($/MWh) On-Peak $(5.27) Off-Peak $(3.36) NOTE: Pricing as of 1/2/13. (1) Other comprised of ancillary services, emission credit sales and amortization of intangibles and trading. (2) Nameplate Heat Rate is after adjustment for generating starts & stops, weather, fuel types, efficiencies and other operational components. Regional Performance Drivers Price: Weather Natural Gas price Basis Capacity prices Cost: Plant forced outages PRB coal prices (10% open to spot as of 1/1/2013) Watch: Weather Transmission congestion MISO capacity auction |
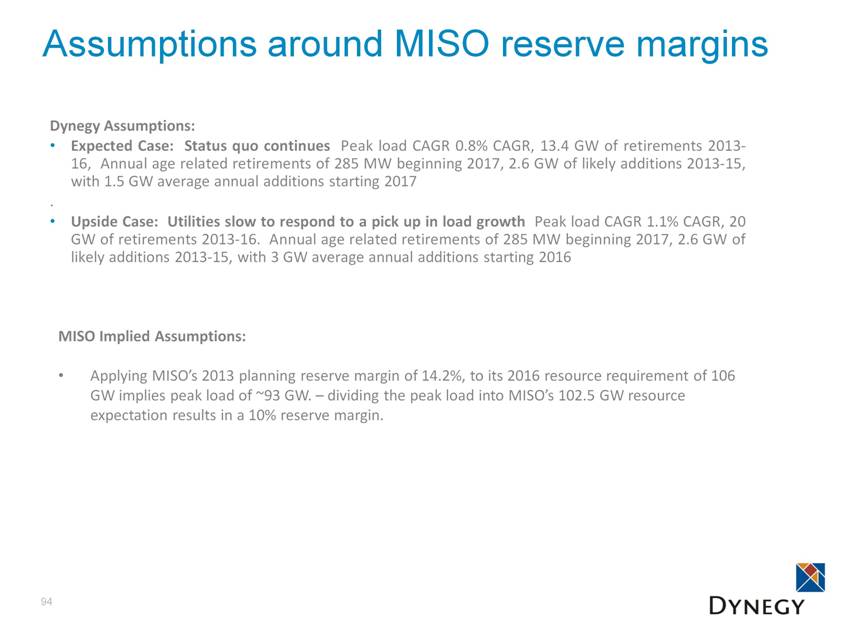
| Assumptions around MISO reserve margins 94 Dynegy Assumptions: Expected Case: Status quo continues Peak load CAGR 0.8% CAGR, 13.4 GW of retirements 2013-16, Annual age related retirements of 285 MW beginning 2017, 2.6 GW of likely additions 2013-15, with 1.5 GW average annual additions starting 2017 . Upside Case: Utilities slow to respond to a pick up in load growth Peak load CAGR 1.1% CAGR, 20 GW of retirements 2013-16. Annual age related retirements of 285 MW beginning 2017, 2.6 GW of likely additions 2013-15, with 3 GW average annual additions starting 2016 MISO Implied Assumptions: Applying MISO’s 2013 planning reserve margin of 14.2%, to its 2016 resource requirement of 106 GW implies peak load of ~93 GW. – dividing the peak load into MISO’s 102.5 GW resource expectation results in a 10% reserve margin. |
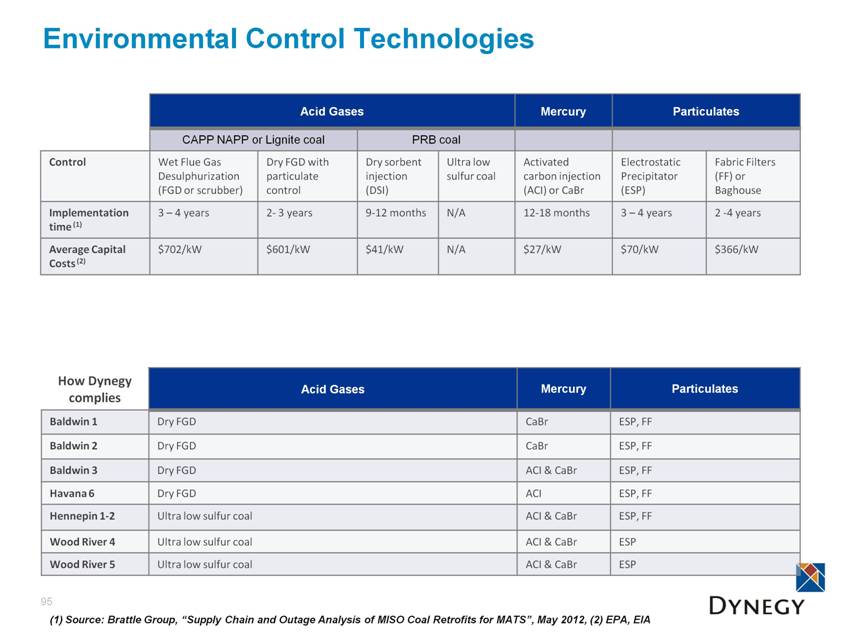
| Environmental Control Technologies Acid Gases Mercury Particulates CAPP NAPP or Lignite coal PRB coal Control Wet Flue Gas Desulphurization (FGD or scrubber) Dry FGD with particulate control Dry sorbent injection (DSI) Ultra low sulfur coal Activated carbon injection (ACI) or CaBr Electrostatic Precipitator (ESP) Fabric Filters (FF) or Baghouse Implementation time (1) 3 – 4 years 2- 3 years 9-12 months N/A 12-18 months 3 – 4 years 2 -4 years Average Capital Costs (2) $702/kW $601/kW $41/kW N/A $27/kW $70/kW $366/kW 95 How Dynegy complies Acid Gases Mercury Particulates Baldwin 1 Dry FGD CaBr ESP, FF Baldwin 2 Dry FGD CaBr ESP, FF Baldwin 3 Dry FGD ACI & CaBr ESP, FF Havana 6 Dry FGD ACI ESP, FF Hennepin 1-2 Ultra low sulfur coal ACI & CaBr ESP, FF Wood River 4 Ultra low sulfur coal ACI & CaBr ESP Wood River 5 Ultra low sulfur coal ACI & CaBr ESP (1) Source: Brattle Group, “Supply Chain and Outage Analysis of MISO Coal Retrofits for MATS”, May 2012, (2) EPA, EIA |
| Appendix GasCo |
| GasCo - Northeast Generation 97 Key Contracts: Revenue Independence under capacity agreement for 740 MWs with ConEd expiring 10/2014 Fuel Contracts Multiple firm transportation agreements for Independence Forecasted Fundamentals 2013 Volumes (MM MWh) 4.9 Fleet Heat Rate(2) (Nameplate, Btu/kWh) CC 7,000 – 7,500 Power Prices – Zone A ($/MWh) On-Peak $37.85 Power Prices – NEPOOL ($/MWh) On-Peak $49.90 Delivered Natural Gas (Dawn + $0.25 or Dominion - $0.06) $3.98/MMBtu; $3.28/MMBtu Delivered Natural Gas (Algonquin + $1.15) $6.41/MMBtu Avg. Spark Spread (On-Peak) Gas (NY Zone A vs Dawn @ 7.5HR) $11.75 Gas (Mass Hub vs Algonquin@ 7.2HR) $13.08 Annual Average Capacity Factors CC 30% - 45% Average Capacity Price (kW-Mo) NYISO $2.82 New England $2.59 Average Casco to Mass Hub Basis ($/MWh) On-Peak $(2.25) Off-Peak $(1.50) Average Independence to Zone A Basis ($/MWh) On-Peak $(1.00) Off-Peak $(0.00) NOTE: Pricing as of 1/2/13. (1) Other comprised of ancillary services, emission credit sales and amortization of intangibles and trading. (2) Nameplate Heat Rate is after adjustment for generating starts & stops, weather, fuel types, efficiencies and other operational components. Regional Performance Drivers Price: Weather Gas price Market heat rates Capacity price Cost: Natural gas Watch: ISO-NE capacity auction NYISO seasonal auction and monthly auctions Retirement announcements (coal, RFO, and nuclear plants particularly vulnerable) Announcement of new transmission projects New England gas supply – Deep Panuke project status |
| GasCo - West Generation 98 Forecasted Fundamentals 2013 Volumes (MM MWh) 4.9 Fleet Heat Rate(2) (Nameplate, Btu/kWh) CC 7,000 – 7,200 Power Prices (Average on peak prices $/MWh) NP-15 $41.08 Delivered Natural Gas (PG&E - $0.40) $3.32/MMBtu Avg. Spark Spread (NP15 vs PG&E@ 7HR) $15.03 Annual Average Capacity Factors CC 30% - 40% Peaking 5-10% Average Capacity Price (kW-Mo) System RA $0.72 Average Moss Landing to NP-15 Basis ($/MWh) On and Off-Peak $(0) Average Morro Bay to NP-15 Basis ($/MWh) On and Off-Peak $(0) NOTE: Pricing as of 1/2/13. (1) Other comprised of ancillary services, emission credit sales and amortization of intangibles and trading. (2) Nameplate Heat Rate is after adjustment for generating starts & stops, weather, fuel types, efficiencies and other operational components. Regional Performance Drivers Key Contracts: Revenue Tolling Agreement on Moss Landing 6&7 through 2013 Fuel Contracts Gas is transported to Moss Landing via interruptible transportation agreements; pass-through costs on units 6&7 to tolling counterparty Tolling counterparty assumes fuel delivery risk associated with gas requirements during tolled periods for tolled capacity Price: Weather Gas price Market heat rates Carbon Cost: Natural Gas Carbon Watch: Weather Northwest Hydro supply SONGS outage situation California capacity market reform |
| GasCo – PJM-W Generation 99 Forecasted Fundamentals 2013 Volumes (MM MWh) 6.4 Fleet Heat Rate(2) (Nameplate, Btu/kWh) CC 7,000 – 7,500 Power Prices (Average on peak prices $/MWh) NiHub $36.04 PJM-W $42.57 Delivered Natural Gas (Chicago CG + $0.15) $3.69/MMBtu Delivered Natural Gas (Tetco M3 ) $3.63/MMBtu Avg. Spark Spread Kendall (NiHub vs Chicago CG @ 7HR) $11.25 Ontelaunee (PJM-W vs Tetco M3 @ 7HR) $17.14 Annual Average Capacity Factors CC 40% - 60% Average Kendall to NiHub Basis($/MWh) On-Peak $(0) Off-Peak $(0) Average Ontelaunee to PJM-W Basis ($/MWh) On-Peak $(0.50) Off-Peak $(1.00) NOTE: Pricing as of 1/2/13. (1) Other comprised of ancillary services, emission credit sales and amortization of intangibles and trading. (2) Nameplate Heat Rate is after adjustment for generating starts & stops, weather, fuel types, efficiencies and other operational components. Regional Performance Drivers Key Contracts: No significant contracts Price: Weather Gas price Market heat rates Capacity price Cost: Gas procured on a as needed basis Watch: 2016/17 RPM auction (May 2013) Coal to gas switching Additional coal retirement announcements New build announcements |
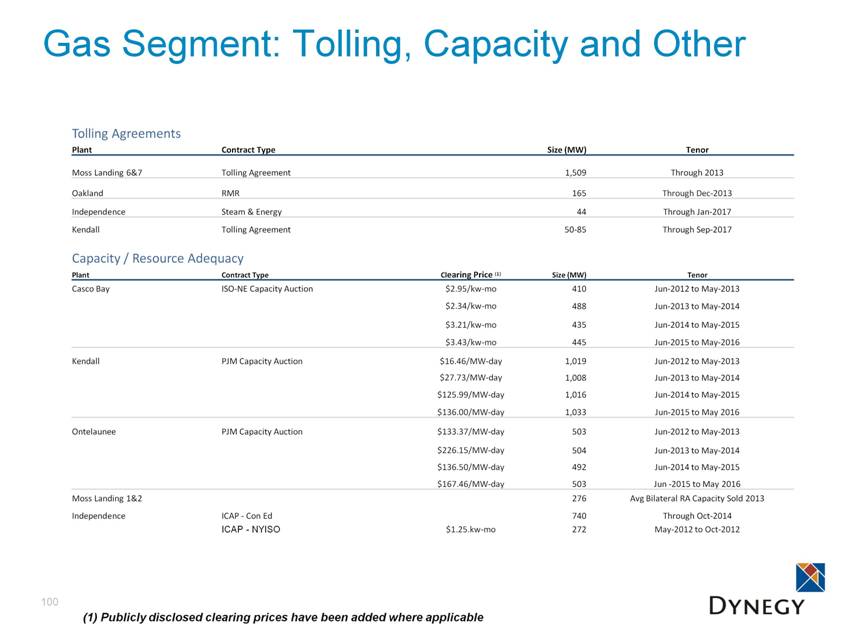
| Gas Segment: Tolling, Capacity and Other 100 Tolling Agreements Plant Contract Type Size (MW) Tenor Moss Landing 6&7 Tolling Agreement 1,509 Through 2013 Oakland RMR 165 Through Dec-2013 Independence Steam & Energy 44 Through Jan-2017 Kendall Tolling Agreement 50-85 Through Sep-2017 Capacity / Resource Adequacy Plant Contract Type Clearing Price (1) Size (MW) Tenor Casco Bay ISO-NE Capacity Auction $2.95/kw-mo 410 Jun-2012 to May-2013 $2.34/kw-mo 488 Jun-2013 to May-2014 $3.21/kw-mo 435 Jun-2014 to May-2015 $3.43/kw-mo 445 Jun-2015 to May-2016 Kendall PJM Capacity Auction $16.46/MW-day 1,019 Jun-2012 to May-2013 $27.73/MW-day 1,008 Jun-2013 to May-2014 $125.99/MW-day 1,016 Jun-2014 to May-2015 $136.00/MW-day 1,033 Jun-2015 to May 2016 Ontelaunee PJM Capacity Auction $133.37/MW-day 503 Jun-2012 to May-2013 $226.15/MW-day 504 Jun-2013 to May-2014 $136.50/MW-day 492 Jun-2014 to May-2015 $167.46/MW-day 503 Jun -2015 to May 2016 Moss Landing 1&2 276 Avg Bilateral RA Capacity Sold 2013 Independence ICAP - Con Ed 740 Through Oct-2014 ICAP - NYISO $1.25.kw-mo 272 May-2012 to Oct-2012 (1) Publicly disclosed clearing prices have been added where applicable |
| Reg G Reconciliation – 2012 Guidance 101 Low High Net income (1) 131 $ 158 $ Plus / (Less): Discontinued operations, net of taxes 370 390 Income tax benefit (8) (10) Interest expense 128 153 Depreciation and amortization expense 140 168 EBITDA 761 $ 859 $ Plus / (Less): Impairment of Undertaking receivable, affiliate 832 832 Bankruptcy reorganization charges (1,518) (1,616) Interest income on Undertaking receivable (24) (24) Restructuring costs and other expense 10 20 Mark-to-market income (loss), net (128) (153) Amortization of intangible assets 129 154 SCE termination (21) (21) Adjusted EBITDA 41 51 Adjusted EBITDA from Legacy Dynegy (2) 9 9 Enterprise-wide Adjusted EBITDA 50 $ 60 $ (1) (2) Operating loss (1,032) $ Depreciation and amortization expense 78 Bankruptcy reorganization charges (8) Loss from unconsolidated investment (1) EBITDA (963) Loss (gain) on Coal Holdco Transfer 941 Bankruptcy reorganization charges 8 Restructuring costs and other expense 30 Mark-to-market income, net (8) Loss from unconsolidated investment 1 Adjusted EBITDA from Legacy Dynegy 9 $ As a result of applying fresh-start accounting on October 1, 2012, our 2012 consolidated income statement will present our results of operations for the period from January 1, 2012 through October 1, 2012 (the "Predecessor Period") separate from the results of operations for the period from October 2, 2012 through December 31, 2012 (the "Successor Period"). The estimated net income presented herein represents the net income of the Predecessor Period and the Successor Period on a combined basis. In addition, due to the application of fresh-start accounting, the results of the Successor Period will not be comparable to the Predecessor Period. Our 2012 consolidated results reflect the results of our accounting predecessor, which was a wholly-owned subsidiary, until the Merger on September 30, 2012. Therefore, certain results related to Legacy Dynegy are not included in our consolidated results for the twelve months ended December 31, 2012. Additionally, effective June 5, 2012, we completed the DMG Acquisition. As a result, the results of our Coal segment, as well as certain items in the Other segment, are not included in our consolidated results for the period from January 1, 2012 through June 5, 2012. However, we have included the Adjusted EBITDA related to Legacy Dynegy for the period prior to the Merger and the Coal segment for the period from January 1, 2012 through June 5, 2012 in this adjustment because management uses Enterprise-wide Adjusted EBITDA to evaluate the operating performance of our entire power generation fleet. The following table presents a reconciliation of Legacy Dynegy Adjusted EBITDA to Operating loss: DYNEGY INC. ESTIMATED RESULTS OF OPERATIONS TWELVE MONTHS ENDED DECEMBER 31, 2012 (UNAUDITED) (IN MILLIONS) The following table provides preliminary summary financial information regarding our enterprise-wide Adjusted EBITDA for the twelve months ended December 31, 2012. These amounts are estimates and will be finalized in connection with the filing of our Form 10-K for the year ended December 31, 2012, which is expected to occur in March 2013. TWELVE MONTHS ENDED DECEMBER 31, 2012 |
| Reg G Reconciliation – 2013 Guidance 102 Low High Low High Low High Low High Gross Margin 92 $ 131 $ 252 $ 277 $ - $ - $ 369 $ 408 $ Plus: Amortization of Intangibles 120 130 120 132 - - 240 262 Adjusted Gross Margin 212 261 372 409 - - 609 670 Operating Expenses (152) (176) (118) (129) - - (270) (305) Adjusted EBITDA excluding General and Administrative Expenses 60 85 255 280 - - 340 365 General and Administrative Expenses - - - - (90) (90) (90) (90) Adjusted EBITDA 60 $ 85 $ 255 $ 280 $ (90) $ (90) $ 250 $ 275 $ Low High Low High Low High Low High Adjusted Gross Margin 212 $ 261 $ 372 $ 409 $ - $ - $ 609 $ 670 $ Amortization of Intangibles (120) (130) (120) (132) - - (240) (262) Operating Expenses (152) (176) (118) (129) - - (270) (305) Depreciation Expense (33) (47) (137) (151) (2) (2) (172) (200) General and Administrative Expenses - - - - (90) (90) (90) (90) Operating Income (Loss) (93) $ (92) $ (2) $ (3) $ (92) $ (92) $ (162) $ (187) $ Low High Low High Low High Low High Net Income (Loss) (306) $ (332) $ Add Back: Income Tax Expense (Benefit) (1.0) - Interest Expense 145 145 Operating Income (Loss) (93) $ (92) $ (2) $ (3) $ (92) $ (92) $ (162) $ (187) $ Depreciation Expense 33 47 137 151 2 2 172 200 EBITDA (1) (60) (45) 135 148 (90) (90) 10 13 Plus: Amortization of Intangibles 120 130 120 132 - - 240 262 Adjusted EBITDA (1) 60 $ 85 $ 255 $ 280 $ (90) $ (90) $ 250 $ 275 $ (1) Low High Adjusted EBITDA 250 $ 275 $ Cash Interest Payments (120) (120) Cash Tax Payments - - Collateral 20 20 Other Changes 20 20 Cash Flow from Operations 170 195 Maintenance Capital Expenditures (100) (100) Environmental Capital Expenditures (10) (10) Costs to refinance debt (45) (45) Return of restricted cash posted as collateral, net (2) 125 125 Free Cash Flow 140 $ 165 $ (2) Regulation G Reconciliation DYNEGY INC. 2013 Guidance (IN MILLIONS) CoalCo GasCo Corporate and Other Dynegy Consolidated CoalCo GasCo Corporate Dynegy Consolidated CoalCo GasCo Corporate Dynegy Consolidated Amount represents the return of restricted cash released by refinancing, net of $150 million used to repay existing debt. EBITDA and Adjusted EBITDA are non-GAAP Measures. Management does not allocate interest expenses and income taxes on a segment level and therefore uses Operating Income (Loss) as the most directly comparable GAAP measure. Free Cash Flow Guidance - Regulation G Reconciliation (IN MILLIONS) Dynegy Consolidated |

