2008 Cash Flow Estimates: GAAP Basis
Note: 2008 estimates are presented on a GAAP basis and are based on quoted forward commodity price curves as of 10/30/07. Actual results may vary materially from these estimates based on
changes in commodity prices, among other things, including operational activities, legal settlements, financing or investing activities and other uncertain or unplanned items. Core business
represents continuing operating results, excluding significant items. Proceeds from the expected sale of Calcasieu are assumed to be received in first half of 2008.
45
Add Back: Discretionary Investment
(20)
(20)
-
Investment in Development Portfolio
(30)
-
(30)
CapEx – Other Environmental
(80)
(20)
(60)
CapEx – General Maintenance
(150)
-
(150)
CapEx – Consent Decree
$ 200 – 300
Free Cash Flow – Core Operating Business
(200)
Less: Proceeds from Asset Sales
(125)
Less: Change in Restricted Cash
10
Add Back: Illinois Rate Relief
220
Add Back: Plum Point Development CapEx
$ 250 – 350
Free Cash Flow
125
95
30
Change in Restricted Cash
200
200
Proceeds from Asset Sales
(220)
-
(220)
CapEx – Development (Plum Point)
(45)
-
(45)
CapEx – Discretionary Investment
(115)
-
(115)
CapEx – Outage Work
GAAP ICF:
$ 585 – 685
$ (550) – (540)
$ 1,135 – 1,225
GAAP OCF estimates as of Dec 12, 2007
2008 TOTAL
Other / CRM
Generation
Based on price curves as of October 30, 2007 ($MM)
Development CapEx related to Plum Point is 100% debt financed; therefore, $220 MM CapEx is offset in
financing cash flow
Discretionary Investments are added back as they relate to optional spending
Net proceeds from asset sales include anticipated proceeds from pending sale of Calcasieu of $57MM
Remaining proceeds expected to come from other non-core asset sales or monetization of equity interests
Change in restricted cash primarily related to return of cash collateral posted to support equity
commitments associated with development projects
24
2008 Earnings Estimates: GAAP Basis
$ 140 – 200
Net Income – GAAP
(380)
(10)
(370)
(55)
(105)
(210)
Depreciation and Amortization
$ 830 - 880
Midwest
$ 180 - 200
West
$ 175 - 195
Northeast
$0.17 – 0.24
Basic EPS
(90) – (130)
Tax Expense
(440)
Interest
$ 1,050 – 1,150
$ (135) – (125)
$ 1,185 - 1,275
EBITDA estimates as of Dec 12, 2007
2008 TOTAL
Other/CRM
Total Gen
Based on price curves as of October 30, 2007 ($MM)
Note: 2008 estimates are presented on a GAAP basis and are based on quoted forward commodity price curves as of 10/30/07. Actual results may vary materially from these estimates based
on changes in commodity prices, among other things, including operational activities, legal settlements, financing or investing activities and other uncertain or unplanned items. Reduced
2008 and forward EBITDA or free cash flow could result from potential divestitures of (a) non-core assets where the earnings potential is limited, or (b) assets where the value that can be
captured through a divestiture is believed to outweigh the benefits of continuing to own or operate such assets. Divestitures could also result in impairment charges.
Northeast region EBITDA includes:
~$50 million lease expense related to Central Hudson lease obligation
~$50 million non-cash amortization of ConEd contract
Other includes general & administrative costs of ~ $175 million, primarily offset by interest income
Earnings may be volatile as many forward sales commitments are marked to market, which may create
differences between EBITDA and timing of cash received
Assumed 39% tax rate
25

EBITDA Reconciliation: 2007 to 2008
Core Business EBITDA(1) ($MM)
$965
$1,100
$45
$15
$40
$(10)
$(15)
2007 EBITDA –
Core Business (2)
$975 – 1,035
2008 EBITDA
$1,050 – 1,150
$35
$(40)
$25
$1,005
2007 EBITDA –
Core Business
excluding MTM
$935 – 995
(1) 2007 Core Business EBITDA is adjusted for significant items. See Appendix for reconciliation. No adjustments to 2008 EBITDA have been made. (2) Core Business EBITDA as
estimated November 8, 2007.
$1,100
$965
~15%
Increase
26

EBITDA Sensitivity to Natural Gas
Sensitivities based on full-year estimates and assume natural gas price change occurs for the
entire year and entire portfolio
On-peak power prices are adjusted by holding the spark spread constant to a 7,000 Btu/KWh heat rate
Off-peak prices are adjusted holding the market implied heat rate constant
MTM accounting treatment will cause differences between EBITDA and timing of cash received
Estimates exclude potential changes in portfolio value associated with contracts beyond 2008
Note: Uncontracted portfolio assumed for illustrative purposes only.
Natural gas sensitivity primarily impacts baseload coal-fired generation
$(280)
- $2.00
$(60)
- $2.00
$(145)
- $1.00
$(30)
- $1.00
$165
+ $1.00
$50
+ $1.00
$320
+ $2.00
$100
+ $2.00
Generation EBITDA
Sensitivity ($MM)
Change in Cost of Natural Gas
($/MMBtu)
Generation EBITDA
Sensitivity ($MM)
Change in Cost of Natural Gas
($/MMBtu)
Long-Term: Uncontracted
2008: Includes contracts as of 10/30/07
27

$(50)
$60
$120
TOTAL
$(30)
$40
$80
Natural Gas
Coal/Fuel Oil
$(20)
- 500
$20
+ 500
$40
+ 1,000
Generation EBITDA Sensitivity ($MM)
Market Implied
Heat Rate
Movement
(Btu/KWh)
2008: Includes contracts as of 10/30/07
$(135)
$175
$350
TOTAL
$(90)
$110
$225
Natural Gas
Coal/Fuel Oil
$(45)
- 500
$65
+ 500
$125
+ 1,000
Generation EBITDA Sensitivity ($MM)
Market Implied
Heat Rate
Movement
(Btu/KWh)
Long-Term: Uncontracted
Sensitivities based on “on-peak” power price changes and full-year estimates
Assumes constant natural gas price of $8.25/MMBtu(1) and heat rate changes are for
a full year
Increased run-time will result in increased maintenance costs, which are expected to
be largely offset by improved earnings
EBITDA Sensitivity to Market Implied Heat Rates
Market implied heat rates sensitivities impact entire operating fleet
Note: Spark spread value changes depend on natural gas price assumptions. Uncontracted portfolio assumed for illustrative purposes only. (1) Represents average natural
gas prices as of 10/30/07.
28

Market Implied Heat Rate Analysis
Note: Reserve margins derived from NERC 2007 Summer Assessment and regional NERC and ISO documents. Reserve margins reflect Dynegy’s projections based on assumptions as
to demand growth, new assets under construction and plant retirements, although actual reserve margins may vary materially from these projections. Market implied heat rates were
calculated using the following actual and forward price points for power and natural gas: NY/NE – NY & NE/ TETCO M3; West – NP15/PGECG; PJM – PJM West / TETCO M3; MISO –
CIN / Con App. Actual prices were used for all periods.
As reserve margins decline, market implied heat rates rise…
especially as markets reach 15-20% reserve levels
Market Implied Heat Rate (Btu/KWh)
Overbuilt
Underbuilt
Target range
for reliability
Regional Reserve Margin Projections (%)
MISO
PJM
West
Northeast
MISO
PJM
California
Northeast
29
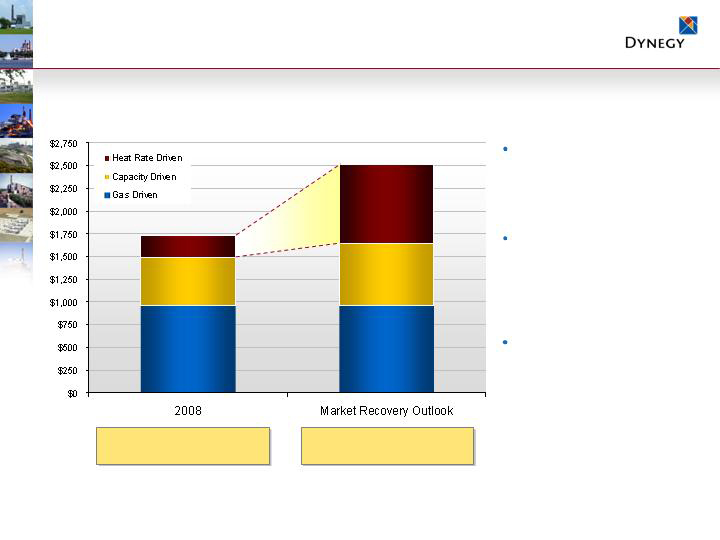
Market Recovery Outlook
Assuming Market Recovery
Outlook is applicable in 5
years, although volatile,
annual average increase in
EBITDA would be ~15%
With current operations,
Dynegy has the potential to
generate ~40% of its current
equity market cap in
cumulative annual cash flow
over ~5 years
Value of existing generation
assets & advanced
development projects should
continue to rise as barriers-
to-entry limit new supply
Total Portfolio Gross Margin ($MM)
Note: Dynegy’s Market Recovery Outlook and related estimates are provided solely as a reference point and are intended to represent a range of potential performance that could be achieved in
each of the company’s key regions at a point in time when supply and demand are in balance. The company does not intend to update this Market Recovery Outlook or the potential range of
performance provided except as otherwise required by applicable SEC rules and regulations.
EBITDA $1,050 – 1,150 MM
Core FCF $200 – 300 MM
EBITDA +/- $1,800 MM
Core FCF +/- $600 MM
30

Creating & Capitalizing on Options
Bruce Williamson
Chairman & Chief Executive Officer
47%
49%
Net Debt to Capitalization
4.1x – 3.7x
$4,281
$45
$200 – $300
$1,050 – $1,150
2008
4.6x – 4.3x
$4,441
$40
$215 – $265
$975 – $1,035
2007
Net Debt / EBITDA – Core Business (3)(4)
Net Debt (4)
Debt Maturities
Free Cash Flow – Core Business (3)
EBITDA – Core Business (2)(3)
Dynegy Projections(1) ($MM)
(1) See reconciliations in Appendix. (2) 2007 includes $40MM of unrealized mark-to-market earnings. (3) EBITDA and free cash flow are adjusted for significant items. See Appendix for reconciliations. No adjustments were made for 2008 EBITDA, such that EBITDA and EBITDA – Core Business are the same. (4) Net debt includes $360MM and $580MM of non-recourse project debt related to an asset under construction for 2007 and 2008, respectively.
How is Dynegy Competitively Advantaged?
Well-positioned, well-operated assets
No significant debt maturity until 2011
Credible, focused management team
Flexible capital structure
Ample liquidity
Positive free cash flow from core
operating business
Solid balance sheet
Creating & Maintaining
a Solid Foundation
32

How will it be
implemented?
When will
it begin?
Things to Consider when Looking at the Future
Unknowns will impact the company’s results, both positively and negatively, and
the outcome and/or timing is extremely difficult to predict or control, including:
What will
happen?
Industry
Issue
Focus on
core
business
Continuously
evaluate
Respond to
change with
the right
option
Maintain
discipline
throughout
cycles
Recognize
the cycles
Keep
options
open
Who will be
impacted?
Chain of Uncertainty is also a Link to Opportunity
Where will
it occur?
Global & national economics
Weather
Market design changes – change in laws
Sector consolidation
Environmental regulation &
the potential for carbon legislation
Supply/demand balance
Awareness, continuous evaluation, cultivating options and maintaining a
diverse portfolio are tools for managing the uncertainties
33

Positioned for the Future
Operate
Transact
Build
Focused on Delivering
Value to Investors
Dynegy’s bottom line:
Focus
on core
business
Keep
options
open
Continuous
evaluation
Maintain
discipline
through
cycles
Recognize
the cycles
Solid
Foundation
Respond
to change
Management team with
proven ability to operate,
execute & respond to change
As market demand increases,
our operational excellence
and reliability track record will
be key to capturing value
Anticipate average annual
EBITDA growth of ~15% as
markets reach recovery
Expect to generate
~$200 to $600MM cash flow
annually before discretionary uses
or ~$2.5B over the next 5 years
Notes: Annual cash before discretionary uses represents operating cash flows and proceeds from asset sales, less maintenance and consent decree capital expenditures. Actual cash flow may vary materially from this
estimate and is dependent on a variety of factors including weather, market conditions and future environmental regulations and refinancing of certain term debt starting in 2011.
34

Q & A

Appendix

2008 Commodity Pricing Assumptions (as of 10/30/07)
* Represents annual average
Moss Landing, Morro Bay, Oakland
$78.25
NP-15 – California
Independence
$73.78
NY – Zone A
Roseton
$11.38
Fuel Oil #6 delivered to Northeast ($/MMBtu)
Danskammer
$3.20
Colombian delivered to Northeast
Baldwin
$1.39
Powder River Basin (PRB) delivered
Coal ($/MMBtu)
Arlington Valley, Griffith
$72.75
West – Palo Verde
South Bay
$78.75
SP-15 – California
Bridgeport, Casco Bay
$86.62
NE – Mass Hub
Roseton, Danskammer
$95.60
NY – Zone G
Midwest Peakers
$67.65
Cinergy
Ontelaunee
$81.25
PJM West
Midwest Coal, Kendall
$65.40
NI Hub / ComEd
On-Peak Power ($/MWh)
$ 8.25
Natural Gas – Henry Hub ($/MMBtu)
Facilities
2008E*
37

Key Assumptions
2008 Assumptions
Commodity pricing as of October 30, 2007
$200 MM in asset sales
Proceeds can come from sale of operating or
development assets
Expect to close $57 MM sale of Calcasieu in first half of 2008
Assume assets sold at book value (i.e., no EBITDA impact)
Interest expense of $440 million and Cash interest
payments of $445 million
Sandy Creek debt is not consolidated
Current Sandy Creek equity commitment of
approximately $325 MM is cash collateralized until
offtake contracts are executed during 2008 (as
indicated by restricted cash shown in Appendix)
Taxes accrue at 39%
Minimal AMT cash taxes
Future Outlook Assumptions
Credit Facility, Term Letter of Credit Facility and
Senior Unsecured notes are refinanced at stated
maturities
Plum Point debt, which is non-recourse, is
assumed to be consolidated; balance will increase
from $419 MM at the end of 2007 to $800 MM in
2010 upon construction completion
~$50 million annual amortization included in
Northeast EBITDA through 2014 related to ConEd
contract; annual capacity payments received of
~$100 million through 2014
Shares outstanding ~840 MM
Minimal AMT cash taxes paid until 2010; full cash
tax payer beginning in 2011
~$40
NOL Asset beginning 2008
$400-500/yr.
NOL Limit
~$10-$20/yr.
AMT Cash Taxes
~$250
AMT credit carry forward, dollar for dollar
(Estimated as of Year End 2007, $MM)
38

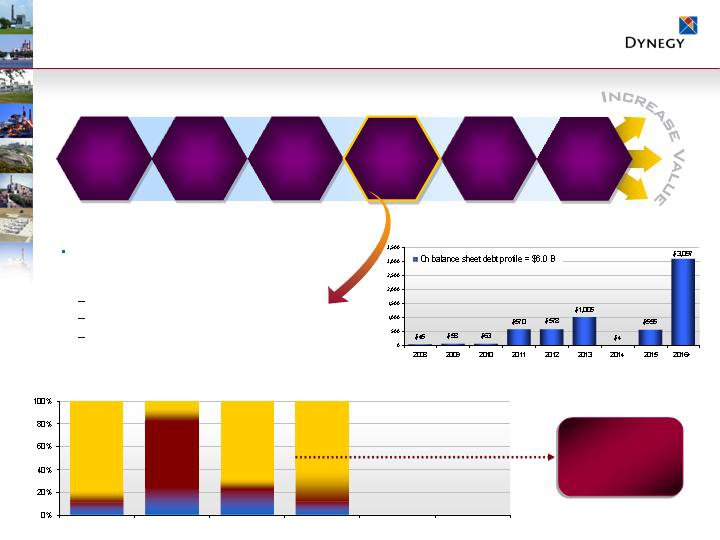
Debt Maturity Profile ($ MM)
Note: Annual maturities reflect par value debt obligations outstanding pro forma 12/31/07. Debt as of 12/31/07 excludes $1,150 MM of revolving credit facility due 2012 as it is expected to be
undrawn. Central Hudson lease obligations are not included as debt. (1) 2013 includes an $850 million Letter of Credit Facility that is offset by restricted cash.
(1)
Pro Forma 12/31/07
39
Debt & Other Obligations Capital Structure –
Pro Forma 12/31/07
Dynegy Power Corp.
Central Hudson(2) $770
Dynegy Holdings Inc.
$1,150 Million Revolver(1) $0
Term L/C Facility $850
Tranche B Term $70
Sr. Unsec. Notes/Debentures $4,047
Sub.Cap.Inc.Sec (“SKIS”) $200
Secured = $920
Key:
Secured Non-Recourse = $808
Unsecured = $5,017
Dynegy Inc..
Senior Debentures $389
Plum Point Energy Assoc.
PP 1st Lien $319
Tax Exempt 100
Gross Debt $419
Restricted Cash 59
Total, Net Debt $360
(1) Represents drawn amounts under the revolver. (2) Represents PV (10%) of future lease payments. Central Hudson lease payments are unsecured obligations of Dynegy Inc., but are a
secured obligation of an unrelated third party (“lessor”) under the lease. DHI has guaranteed the lease payments on a senior unsecured basis. (3) Restricted cash includes $850MM related
to the Synthetic Letter of Credit facility, $325MM for Sandy Creek Letter of Credit which is used in lieu of cash on hand and $59MM related to Plum Point.
($ MM)
Sithe Energies
360
Less: Net Non-recourse Project Debt, under construction
$4,441
Net Debt
$5,211
Net Debt and Other Obligations
770
Less: Central Hudson Lease Obligation
1,234
Less: Restricted cash (3)
$4,081
Net Debt associated with Operating Assets
300
Less: Cash on hand
$6,745
Total Obligations
12/31/07
($ Million)
40

Debt & Other Obligations Capital Structure –
Pro Forma 12/31/08
Dynegy Power Corp.
Central Hudson(2) $700
Dynegy Holdings Inc.
$1,150 Million Revolver(1) $0
Term L/C Facility $850
Tranche B Term $69
Sr. Unsec. Notes/Debentures $4,047
Sub.Cap.Inc.Sec (“SKIS”) $200
Dynegy Inc..
Senior Debentures $345
Plum Point Energy Assoc.
PP 1st Lien $509
Tax Exempt 100
Gross Debt $609
Restricted Cash 29
Total, Net Debt $580
(1) Represents drawn amounts under the revolver. (2) Represents PV (10%) of future lease payments. Central Hudson lease payments are unsecured obligations of Dynegy Inc., but are a
secured obligation of an unrelated third party (“lessor”) under the lease. DHI has guaranteed the lease payments on a senior unsecured basis. (3) Restricted Cash includes $850 million
related to the Synthetic Letter of Credit Facility, $225 million for Sandy Creek Letter of Credit which is used in lieu of cash on hand and $29 million related to Plum Point.
($ MM)
Sithe Energies
580
Less: Net Non-recourse Project Debt, under construction
$4,281
Net Debt
$ 4,981
Net Debt and Other Obligations
700
Less: Central Hudson Lease Obligation
1,104
Less: Restricted cash (3)
$3,701
Net Debt associated with Operating Assets
735
Less: Cash on hand
$6,820
Total Obligations
12/31/08
($ Million)
Secured = $919
Key:
Secured Non-Recourse = $954
Unsecured = $4,947
41

Market Recovery Outlook (1)
$3.00
N/A
N/A
Avg Colombian Coal ($/MMBtu)
Peaking
CC
Baseload
Fuel Oil ($/MMBtu)
Natural Gas ($/MMBtu) Henry Hub
PRB Coal ($/MMBtu)
0%-10%
20%-30%
0%-10%
40%-50%
60%-70%
20%-30%
80%-90%
N/A
80%-90%
Average
Capacity Factors
$10.40
N/A
N/A
~$8.25
~$8.25
~$8.25
N/A
N/A
$1.39
Fuel
9.90
10.40
9.70
Average Market-Implied Heat Rate (MMBtu/MWh)
12.3
17.1
29.1
Volumes (MM MWh)
Northeast
West
Midwest
(1) Dynegy’s Market Recovery Outlook and related estimates are provided solely as a reference point and are intended to represent a range of potential performance that could be achieved in
each of the company’s key regions at a point in time when supply and demand are in balance. The company does not intend to update this Market Recovery Outlook or the potential range
of performance provided except as otherwise required by applicable SEC rules and regulations.
(2) Represents uncontracted volumes.
(3) Excludes ConEd capacity contracted on Independence. Approximately 75% of the facility’s capacity is obligated under a capacity sales agreement, which is effective through 2014.
Revenues from this agreement are largely fixed at approximately $100MM/year, or approximately $11.20/KW-Mo.
NE
MISO
RTO
MAAC+APS
$3-$4
580
$3-$4
3,165
PJM
Midwest
$2-$3
4,619
$4-$5
1,067
Northeast
West
Capacity Revenues
$4-$5
1,958
NYISO (3)
165
Locational RA
14,083
TOTAL
$2-$3
2,529
System RA
Price ($/kW-mo)
Dynegy MWs Available (2)
EBITDA +/- $1,800 MM
Core FCF +/- $600 MM
42

Equity Value Calculations
(5.2)
(5.2)
(5.2)
(5.2)
Net Debt and Other
Obligations(2)
$ 10.12
$ 15.36
Average Implied
Value per Share ($)
$ 12.14
$ 8.10
$ 18.10
$ 12.62
Implied Value per Share ($)
840
840
840
840
Million Shares Outstanding
$ 10.2
$ 6.8
$ 15.2
$ 10.6
Equity Value
0.4
0.4
0.4
0.4
Net Non-recourse Project
Debt (under construction)
$ 15.0
$ 11.6
$ 20.0
$ 15.4
Enterprise Value Estimate (1)
High
Low
High
Low
($B)
60% Replacement
80% Replacement
(1) Market value estimate derived from 19,165MW of operating assets, which excludes 140MW for Plum Point and 337MW for Sandy Creek, multiplied by indicated percentages of
applicable replacement cost ranges shown on slide 14. Estimates exclude any value associated with development opportunities. (2) Pro forma 12/31/07.
43

Reconciliations –
Gross Margin, EBITDA and Core EBITDA ($MM)
GEN-WE
GEN-MW
GEN-NE
Total GEN
Other/CRM
Total
Revenue
470
$
1,310
$
1,075
$
2,855
$
40
$
2,895
$
Cost of sales
(185)
(440)
(680)
(1,305)
(10)
(1,315)
Gross margin
285
870
395
1,550
30
1,580
Operating expense
(95)
(200)
(190)
(485)
(5)
(490)
General and administrative expense
-
-
-
-
(205)
(205)
Gain on sale
-
80
-
80
-
80
Depreciation expense
(65)
(190)
(45)
(300)
(15)
(315)
Operating income
125
560
160
845
(195)
650
Other income and expense, net
10
-
-
10
40
50
EBITDA from discontinued operations
215
-
-
215
20
235
Plus: Depreciation expense
65
190
45
300
15
315
EBITDA
415
750
205
1,370
(120)
1,250
Less: Depreciation expense
(315)
Less: Interest expense
(385)
Less: Income tax expense
(240)
Net income
310
$
GEN-WE
GEN-MW
GEN-NE
Total GEN
Other/CRM
Total
Revenue
850
$
1,535
$
1,000
$
3,385
$
-
$
3,385
$
Cost of sales
(525)
(490)
(635)
(1,650)
(5)
(1,655)
Gross margin
325
1,045
365
1,735
(5)
1,730
Operating expense
(135)
(190)
(180)
(505)
-
(505)
General and administrative expense
-
-
-
-
(175)
(175)
Depreciation expense
(105)
(210)
(55)
(370)
(10)
(380)
Operating income
85
645
130
860
(190)
670
Other income and expense, net
-
-
-
-
50
50
Plus: Depreciation expense
105
210
55
370
10
380
EBITDA
190
855
185
1,230
(130)
1,100
Less: Depreciation expense
(380)
Less: Interest expense
(440)
Less: Income tax expense
(110)
Net income
170
$
Reconciliation of Gross Margin and EBITDA
Year Ending 12/31/08
Year Ending 12/31/07
EBITDA
$ 1,250
Legal and settlement, net
30
Illinois rate relief
25
Purchasing accounting adjustments
(30)
Gain on sale - CoGen Lyondell
(210)
Gain on sale - Percent ownership of Plum
Point & Sandy Creek
(80)
Change in fair value of interest rate swaps
and minority interest
20
Core Business EBITDA
$ 1,005
Reconciliation of 2007 Core Business EBITDA
Total
Revenue
5,000
$
Cost of sales
(2,500)
Gross margin
2,500
Operating expense
(650)
General and administrative expense
(225)
Depreciation expense
(530)
Operating income
1,095
Other income and expense, net
175
Plus: Depreciation expense
530
EBITDA
1,800
Less: Depreciation expense
(530)
Less: Interest expense
(470)
Less: Income tax expense
(265)
Net income
535
$
Market Recovery Outlook
44

Reconciliations –
Free Cash Flow & Net Debt and Other Obligations ($MM)
Market Recovery
Outlook
GEN
Other
Total
GEN
Other
Total
Operating Cash Flows
1,030
$
(635)
$
395
$
1,180
$
(545)
$
635
$
880
$
General maintenance
(125)
(15)
(140)
(60)
(20)
(80)
-
Outage work
-
-
-
(115)
-
(115)
-
Consent decree
(70)
-
(70)
(150)
-
(150)
-
Other environmental
-
-
-
(30)
-
(30)
-
Organic development
-
-
-
(45)
-
(45)
-
Plum Point development
(160)
-
(160)
(220)
-
(220)
-
Total Capital Expenditures
(355)
(15)
(370)
(620)
(20)
(640)
(280)
Investment in development portfolio
-
(10)
(10)
(20)
(20)
-
Proceeds from asset sales
560
(130)
430
200
-
200
-
Change in restricted cash
25
(975)
(950)
30
95
125
70
Investing Cash Flows
230
(1,130)
(900)
(390)
55
(335)
(210)
Free Cash Flow
(505)
300
670
Plus: Illinois rate relief / Legal settlements
50
10
-
Plus: Cash taxes on asset sales
10
-
-
Plus: Organic development
-
45
-
Plus: Plum Point development
165
220
-
Less: Proceeds from asset sales
(430)
(200)
-
Plus/(Less): Change in restricted cash
950
(125)
(70)
Free Cash Flow - Core Operating Business
240
$
250
$
600
$
12/31/07
12/31/08
Debt per pro-forma balance sheet
5,975
$
6,120
$
Less:
Cash and cash equivalents
(300)
(735)
Restricted cash - LC/Sandy Creek
(1,175)
(1,075)
Restricted cash - Plum Point
(59)
(29)
Net Debt
4,441
$
4,281
$
Plus:
Central Hudson Imputed Principal
770
700
Net Debt & Other Obligations
5,211
$
4,981
$
12/31/07
12/31/08
Net Debt
4,441
$
4,281
$
Equity
4,558
4,733
Total Capitalization
8,999
$
9,014
$
Net Debt / Capitalization
49%
47%
Reconciliation of Free Cash Flow and Free Cash Flow - Core Operating Business
Capitalization
Reconciliation of Net Debt and Net Debt & Other Obligations
Year Ending 12/31/07
Year Ending 12/31/08
45
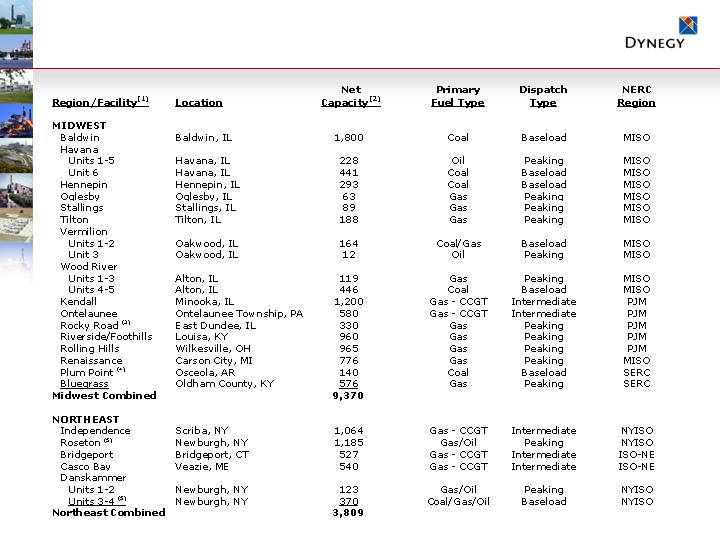
Generation Assets – Midwest & Northeast
46
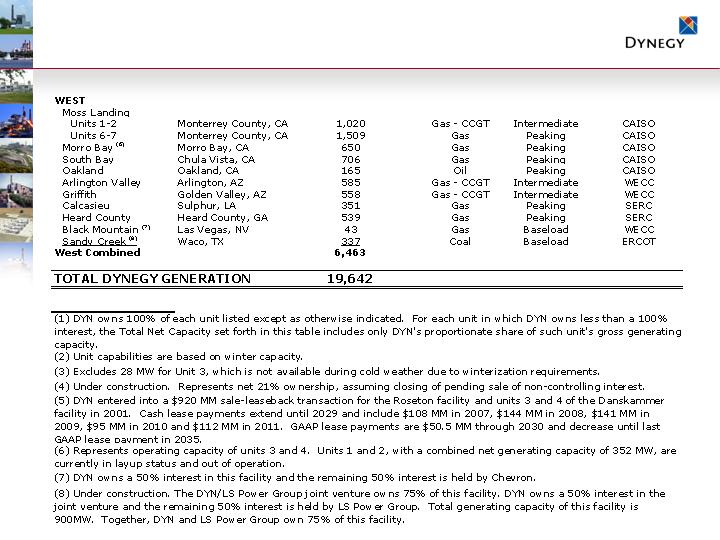
Generation Assets – West & Notes
47