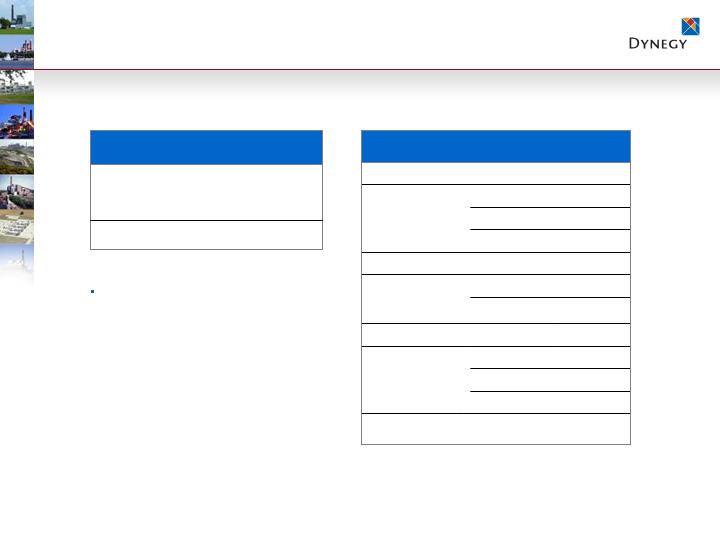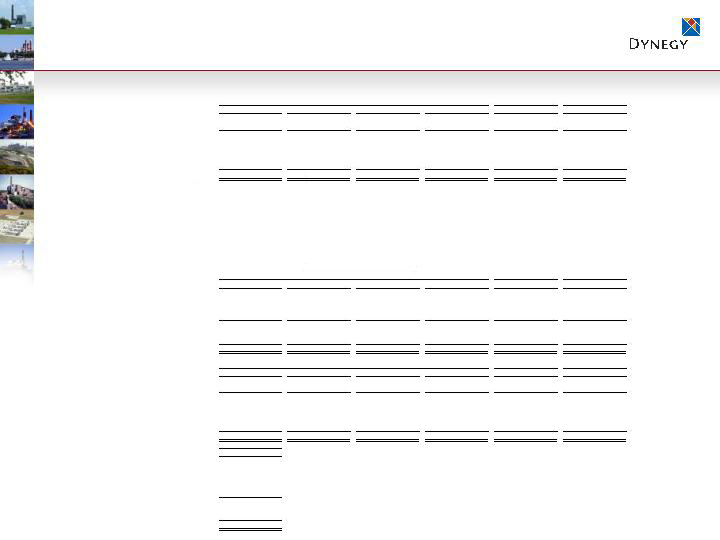
Reg G Reconciliation – 2008 Guidance
GEN - MW
GEN - WE
GEN - NE
Total GEN
OTHER
Total
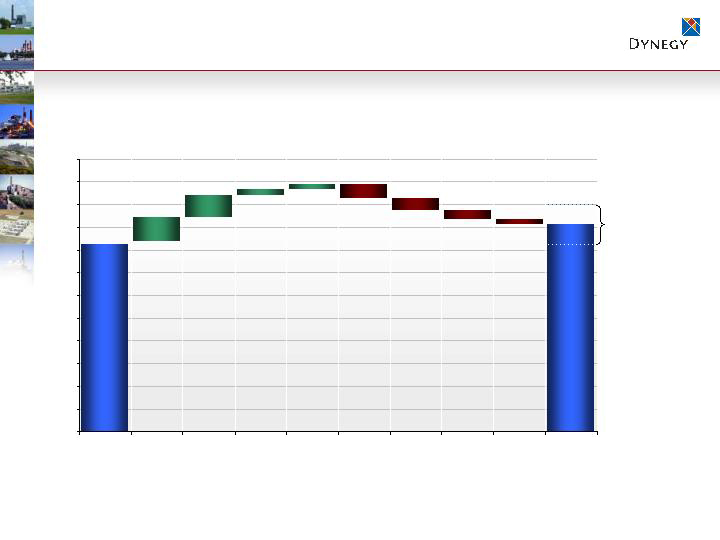
Net Income
195
$
add back:
Income tax expenses
120
Interest expense
430
Deppreciation and amortization expense
380
EBITDA (2)
832
$
229
$
137
$
1,198
$
(73)
$
1,125
$
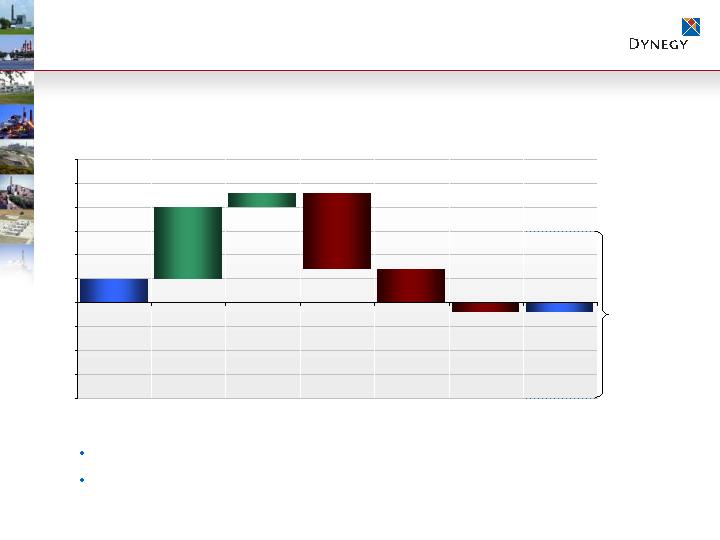
Plus/(less):
Release of state franchise tax and sales tax liabilities
-
-
-
-
(16)
(16)
Gain on liquidation of foreign entity
-
-
-
-
(26)
(26)
Gain on sale of NYMEX shares
-
-
-
-
(15)
(15)
Gain on sale of Sandy Creek ownership interest
-
(13)
-
(13)
-
(13)
Gain on sale of Oyster Creek ownership interest
-
(11)
-
(11)
-
(11)
Gain on sale of Rolling Hills
(57)
-
-
(57)
-
(57)
Mark-to-market
(105)
(45)
3
(147)
-
(147)
Adjusted EBITDA (2)
670
$
160
$
140
$
970
$
(130)
$
840
$
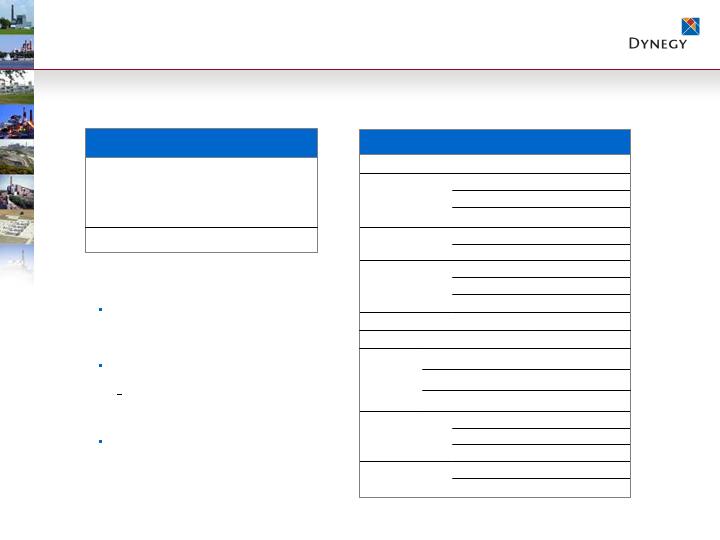
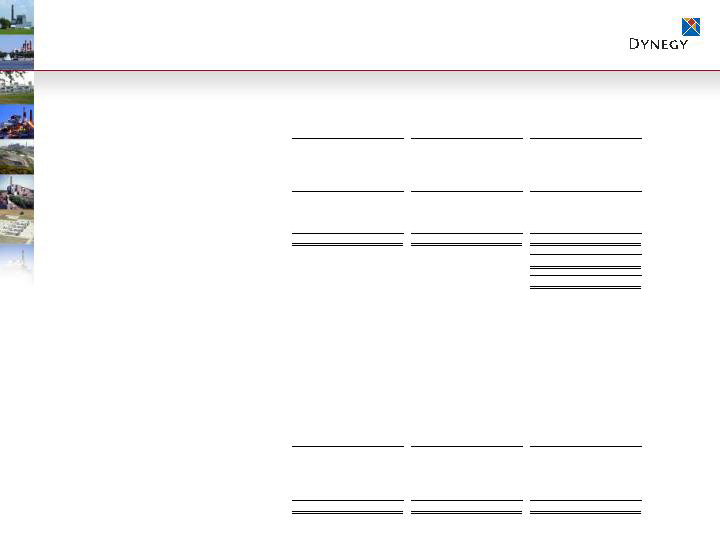
GEN
OTHER
TOTAL
Adjusted EBITDA (2)
970
$
(130)
$
840
$
Cash Interest Payments
-
(430)
(430)
Cash Tax Payments
-
(15)
(15)
Collateral
(15)
-
(15)
Working Capital/Other Changes
(25)
40
15
Adjusted Cash Flow from Operations (4)
930
(535)
395
Maintenance Capital Expenditures
(155)
(15)
(170)
Environmental Capital Expenditures
(200)
-
(200)
Adjusted Free Cash Flow (4)
575
$
(550)
$
25
$
Net cash used in investing Activities
(170)
$
Net cash provided by Financing Activities
150
$
(1)
(2)
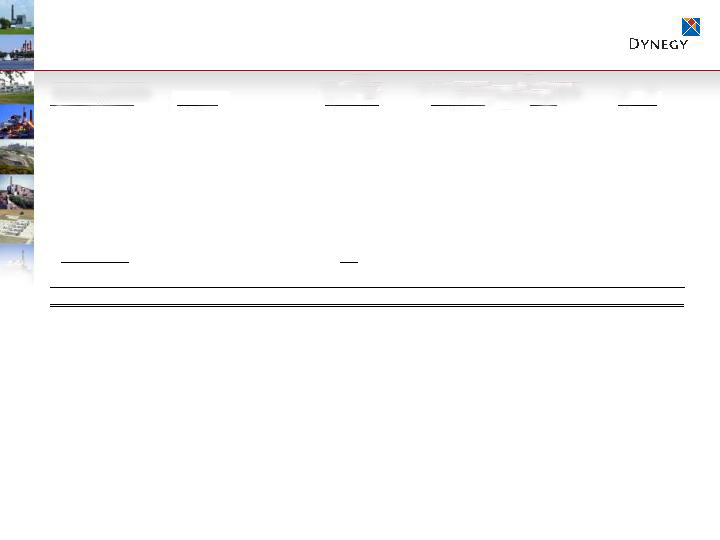
GEN - MW
GEN - WE
GEN - NE
Total GEN
OTHER
Total
Operating income (loss)
617
$
132
$
77
$
826
$
(146)
$
680
$
Losses from unconsolidated investments
-
(8)
-
(8)
(11)
(19)
Other items, net
-
5
5
10
74
84
Add: Depreciation and amortization expense
215
100
55
370
10
380
EBITDA
832
$
229
$
137
$
1,198
$
(73)
$
1,125
$
(3)
(4)
GEN
OTHER
TOTAL
Cash Flow from Operations
920
$
(550)
$
370
$
Legal and regulatory payments
10
15
25
Adjusted Cash Flow from Operations
930
(535)
395
Maintenance capital expenditures
(155)
(15)
(170)
Environmental capital expenditures
(200)
-
(200)
Adjusted Free Cash Flow
575
$
(550)
$
25
$
Adjusted Cash Flow from Operations and Adjusted Free Cash Flow are non-GAAP financial measures. Please refer to Item 2.02 of our Form 8-K filed on November 6, 2008 for definitions, utility and
uses of such non-GAAP financial measures. A reconciliation of Adjusted Cash Flow from Operations and Adjusted Free Cash Flow to Cash from Operations is presented below.
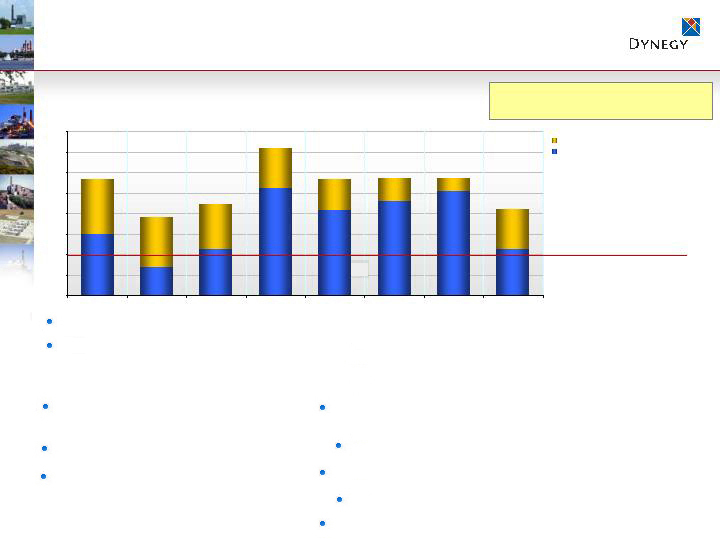
2008 CASH FLOW ESTIMATES (1) (3)
(IN MILLION)
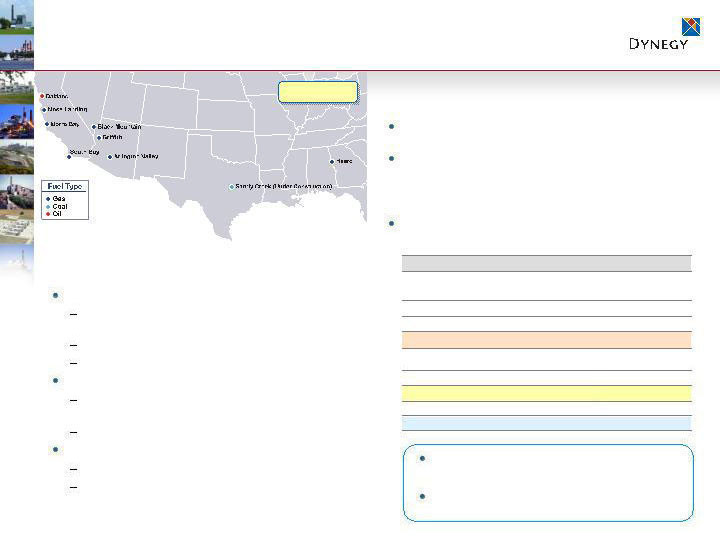
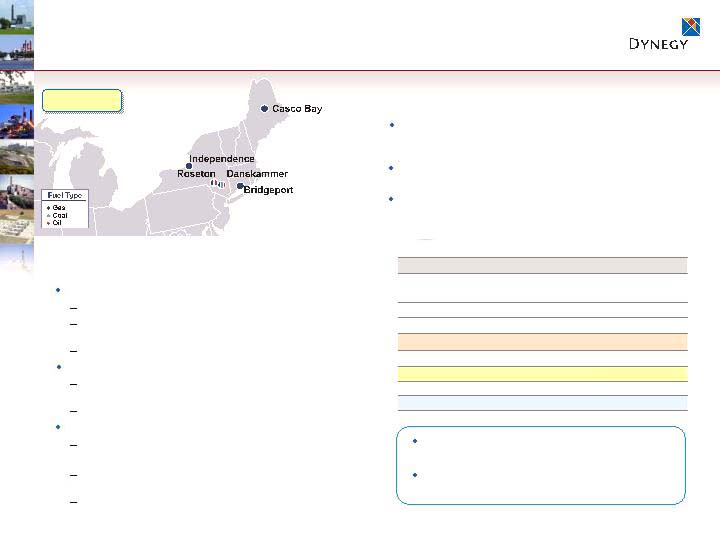
Power Generation
2008 estimates are based on quoted forward commodity price curves as of October 7, 2008. Actual results may vary materially from these estimates based on changes in commodity prices, among
other things, including operational activities, legal settlements, financing or investing activities and other uncertain or unplanned items. Reduced 2008 and forward EBITDA or free cash flow could result
from potential divestitures of (a) non-core assets where the earnings potential is limited, or (b) assets where the value that can be captured through a divestiture is believed to outweigh the benefits of
continuing to won or operate such assets. Divestitutures could also result in impairment charges.
EBITDA and Adjusted EBITDA are non-GAAP financial measures. Please refer to Item 2.02 of our Form 8-K filed on November 6, 2008 for definitions, utilities and uses of such non-GAAP financial
measures. A reconciliation of EBITDA to Operating income (loss) is presented below. Management does not allocate interest expenses and income taxes on segment level and therefore uses
Operating income (loss) as the most directly comparable GAAP measure.
This presentation is not intended to be a reconciliation of non-GAAP measures pursuant to Regulation G.
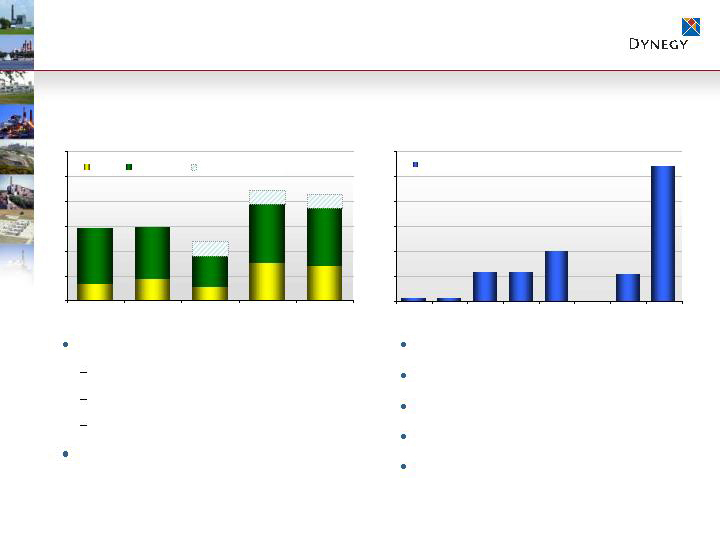
2008 EARNINGS ESTIMATES (1)
(IN MILLIONS)
Power Generation
As presented November 6, 2008
44