J. Kevin Blodgett Dynegy Inc. 1000 Louisiana, Suite 5800 Houston, Texas 77002 Kevin.Blodgett@dynegy.com (713) 507-6847 (phone) (713) 356-2185 (fax) |
| |

November 4, 2010
BY EDGAR
United States Securities and Exchange Commission
Office of Mergers & Acquisitions
100 F Street, N.E., Mail Stop 3628
Washington, D.C. 20549-3628
| Attention: | Ms. Peggy Kim, Esq. | |
RE: | Dynegy Inc. Definitive Additional Soliciting Materials Filed October 26, 2010 File 1-33443 | |
Dear Ms. Kim:
This letter sets forth the responses of Dynegy Inc. (“Dynegy”) to the comments of the staff of the Division of Corporation Finance, Office of Mergers & Acquisitions (the “Staff”) of the United States Securities and Exchange Commission (the “Commission”) set forth in your letter dated October 29, 2010 with respect to the above-referenced Definitive Additional Soliciting Materials (the “Definitive Additional Materials”).
This letter is being filed with the Commission electronically today via EDGAR.
For the convenience of the Staff, each of the Staff’s comments is reproduced and is followed by the corresponding response of Dynegy.
Definitive Additional Materials
| 1. | Please revise or provide us with supplemental support for the following statements: |
| • | “The Blackstone offer of $4.50 per share compares favorably when measured under traditional financial analysis techniques, such as comparable market transactions and discounted cash flow analyses.” |
Response:
| • | Please see the section of the Definitive Proxy Statement on Schedule 14A filed by Dynegy with the Commission on October 4, 2010 (the “Proxy Statement”) entitled “The Merger—Opinions of Financial Co-Advisors” for a discussion of the material financial analyses performed by Greenhill & Co., LLC and Goldman Sachs & Co., financial co-advisors to Dynegy (together, the “Financial Co-Advisors”), in connection with the opinions the Financial Co-Advisors delivered to the Dynegy board of directors (the “Board”) in connection with the Board’s consideration of the Agreement and Plan of Merger, dated as of August 13, 2010 (the “Merger Agreement”), among Dynegy, Denali Parent Inc., and Denali Merger Sub Inc. A copy of the section entitled “The Merger—Opinions of Financial Co-Advisors” from the Proxy Statement is attached asAnnex A hereto. |
In particular, as more fully described in the Proxy Statement and subject to the various factors, assumptions and qualifications described therein, the financial analyses performed by the Financial Co-Advisors included:
| • | Illustrative Discounted Cash Flow Analysis. Please see the “Illustrative Discounted Cash Flow Analysis” subsection inAnnex A. Based on this analysis, the Financial Co-Advisors calculated an illustrative range of per share value indications of Dynegy ranging from negative $5.69 to positive $5.86. |
| • | Illustrative Sum-of-the-Parts Analysis. Please see the “Illustrative Sum-of-the-Parts Analysis” subsection inAnnex A. Based on this analysis, the Financial Co-Advisors calculated an illustrative range of per share value indications of Dynegy ranging from negative $15.22 to negative $0.18. |
| • | Selected Companies Analysis. Please see the “Selected Companies Analysis” subsection inAnnex A. Based on this analysis, the Financial Co-Advisors calculated an illustrative range of per share value indications of Dynegy ranging from negative $3.82 to positive $5.49. |
-2-
| • | Selected Transactions Multiples Analysis. Please see the “Selected Transactions Multiples Analysis” subsection inAnnex A. Based on this analysis, the Financial Co-Advisors calculated an illustrative range of per share value indications of Dynegy ranging from negative $5.52 to negative $1.29. |
| • | Selected Transactions Premiums Analysis. Please see the “Selected Transactions Premiums Analysis” subsection inAnnex A. Based on this analysis, the Financial Co-Advisors calculated an illustrative range of per share value indications of Dynegy ranging from $4.10 to $4.44. |
Dynegy believes the foregoing analyses and ranges support the Dynegy statement referenced above.
| • | “Forward natural gas prices have declined steadily over the past two years and have continued to fall since the Blackstone transaction was announced. Currently, there is no near-term recovery in sight for natural gas prices, and the abundance of gas appears to be the long-term driver of prices.” |
Response:
Please see page 12 of the Presentation to Proxy Advisory Firms filed by Dynegy with the Commission on Form 8-K and as Definitive Additional Materials on Schedule 14A, each on October 27, 2010 (the “Proxy Advisory Firms Presentation”), for supporting detail regarding the decline of forward natural gas prices since the announcement of the Merger Agreement on August 13, 2010. Dynegy believes that no clear recovery is in sight for natural gas prices based on the steadily declining forward natural gas curves illustrated on page 12 of the Proxy Advisory Firms Presentation. A copy of page 12 of the Proxy Advisory Firms Presentation is attached asAnnex B hereto.
The growth in shale gas production has increased the U.S. natural gas supply and is the cause of the “abundance of gas” referred to in the Dynegy statement referenced above. Dynegy has compiled recent third-party reports on natural gas production outlooks with a focus on shale gas production, and this compilation is attached asAnnex C hereto.
-3-
| • | “Dynegy’s stock price is highly correlated with natural gas prices, which have fallen dramatically over that period…” |
Response:
A chart comparing Dynegy’s stock price with the Henry Hub natural gas spot price is attached asAnnex D hereto and illustrates the correlation between these two metrics.
It is acknowledged within Dynegy’s industry that natural gas prices generally drive electricity prices. For example, in relation to Dynegy’s business:
| • | In the West and Northeast regions, natural gas prices set power prices 100% of the time; and |
| • | In the Midwest, coal prices set power prices 80-85% of the time, but natural gas prices set the price during peak demand months, which impacts a significant portion of Dynegy’s margin. |
Below are two examples of recent third-party analyst reports that refer to the connection between natural gas prices and electricity prices (emphasis added):
| • | “Dynegy’s fundamentals have been deteriorating since the deal was struck.Nat Gas prices, which set the price for power, have fallen 9% at the 2011 end of the pricing curve. Dynegy’s operating cash flow is decreasing – their cash needs are increasing. Dynegy will have $1.6B in excess liquidity on completing the transaction (including Blackstone’s equity contribution). However, after adjusting for the NRG sale, significantly more than $1.1B will be needed to support Dynegy’s cash needs for the next five years. Blackstone’s $543M equity cushion is declining.” Stephen Grahling, Jefferies & Co, October 5, 2010 |
| • | “If natural gas prices fall (rise), wholesale power prices will likely fall (rise), limiting (raising) dark spreads. DYN is inherently a long natural gas position since natural gas generation sets the price of power in its key coal generation markets. If forward natural gas prices fall significantly from current prices, DYN might have to recontract at incrementally lower margins.” Brian Chin, Citi, August 6, 2010 |
| • | “…Dynegy’s substantially higher leverage than its peer companies magnifies the sensitivity of Dynegy’s stock price to declining natural gas prices as compared to its peer companies.” |
-4-
Response:
Dynegy’s leverage ratio of total debt/2010 estimated Rent-Adjusted EBITDA is 9.6x, while the leverage ratio range for RRI Energy, Inc., Mirant Corporation, Calpine Corporation and NRG Energy, Inc. (collectively, the “Peer Group”) is 3.5x to 6.4x, as reflected on the table attached asAnnex E hereto (for the sole purpose of the calculation of this leverage ratio range, Mirant Corporation and RRI Energy, Inc. have been consolidated to demonstrate the effect of their contemplated merger in which the successor entity shall be known as GenOn Energy, Inc.). Dynegy’s equity value of approximately $540 million (based on the $4.50 share offer) is also small relative to the fixed net book value of Dynegy’s debt of approximately $4.1 billion; the calculation of equity value and fixed net book debt value was provided on page 4 of the Proxy Advisory Firms Presentation, which is attached asAnnex F hereto.
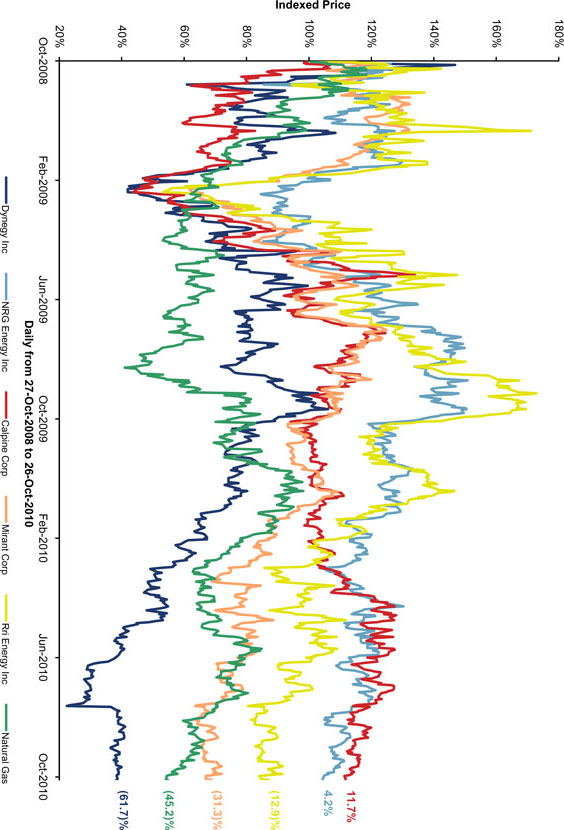
As a result of Dynegy’s higher leverage, changes in natural gas prices, which, as described above, drive electricity prices, are magnified in Dynegy’s stock price as compared to the Peer Group. An example of how an equivalent percentage change in enterprise value has a larger impact on Dynegy’s equity value as compared to NRG Energy, Inc. is attached asAnnex G hereto. A chart illustrating the sensitivity of Dynegy’s stock price and the Peer Group’s stock prices as compared to the natural gas spot price during the two years ending October 26, 2010 is attached asAnnex H hereto; the data source for this chart was Bloomberg L.P.
| • | “…Dynegy’s total enterprise value fell only 1.7% versus the average of Dynegy’s peer group, which fell 2.6%; Dynegy did not ‘underperform’ its peers during this timeframe.” |
Response:
An analysis comparing the change in total enterprise value of Dynegy from March 12, 2010 to October 20, 2010 to the change in the average total enterprise value of the Peer Group over the same time period is attached asAnnex I hereto.
| • | “…such an asset sale would result in the loss of Dynegy’s existing $1.9 billion credit facility…” |
Response:
Dynegy’s Fifth Amended and Restated Credit Agreement dated as of April 2, 2007, as amended (the “Credit Agreement”), prohibits asset sales that would result in a breach of the covenant requiring Dynegy to maintain a certain pro forma leverage ratio. See
-5-
§7.05(c) of the Credit Agreement, which was filed by Dynegy with the Commission on August 10, 2009 as Exhibit 10.2 to the Quarterly Report on Form 10-Q for the Quarter Period ended June 30, 2009 of Dynegy. Each capitalized term in this response not otherwise defined herein has the meaning ascribed to it in the Credit Agreement.
The Required Ratio is currently 6.5 to 1.0. An asset sale will only be permitted under the Credit Agreement if Dynegy’s Leverage Ratio, which is calculated as the ratio of Total Indebtedness to Consolidated EBITDA for the most recently ended Measurement Period, does not exceed the Required Ratio. The Leverage Ratio provides guidance around pro forma calculations, and specifies that, in the case of a pro forma calculation under § 7.05(c) of the Credit Agreement of Dynegy’s Leverage Ratio, the Consolidated EBITDA of the assets being sold must be excluded as if they had been sold on the first day of the measurement period.
The Leverage Ratio calculated for the period ended September 30, 2010 (the most recently ended Measurement Period) is approximately 6.39 to 1.0, based upon Consolidated EBITDA of $622 million and Total Indebtedness of $3,975 million. Dynegy’s pro forma Consolidated EBITDA would need to be at least $611 million to meet the 6.5 to 1.0 ratio requirement, and since the assets being sold to NRG contributed substantially more than $11 million to Consolidated EBITDA, such a sale would not be allowed under § 7.05(c) of the Credit Agreement because the pro forma Leverage Ratio would exceed the Required Ratio.
Therefore, if such a sale were to occur, it would constitute an Event of Default under § 8.01(b) of the Credit Agreement. The Credit Agreement consists of a term loan facility, a revolving credit facility and a letter of credit facility, and Dynegy currently has outstanding borrowings under the term loan and letter of credit facilities. If an Event of Default occurs, the lenders can call for all of the outstanding indebtedness under the Credit Agreement to be immediately repaid and terminate their lending commitments, preventing any future reborrowing. As a consequence, such an asset sale would result in the loss of the Credit Agreement.
-6-
| • | “If Dynegy executed the NRG asset sale itself, Dynegy’s projected negative cash flow would increase by approximately $400 million so that the total projected negative cash flow would be $1.5 billion over the next five years.” |
Response:
The projected negative operating cash flow less total capital expenditures and debt amortization amounts (“Cash Flow”) of approximately $1.1 billion, based upon June 7, 2010 commodity price curves, is calculated on page 16 of the Proxy Advisory Firms Presentation, which is attached asAnnex J hereto. The foregone cash flow from the assets to be sold to NRG Energy, Inc. totals approximately $830 million, and is offset in part by an approximate $465 million reduction in certain expenses (primarily interest expenses as a result of the application of the proceeds from the sale towards indebtedness), resulting in a net reduction in Cash Flow over the next five years of approximately $364 million. This projected incremental negative cash flow change of $364 million is identified on page 22 of the Proxy Advisory Firms Presentation, and support for the $830 million foregone cash flow calculation is provided on page 36 of the Proxy Advisory Firms Presentation; these two pages are attached asAnnex K hereto.
| • | “Commodity prices have deteriorated further…increasing our forecasted negative cash flows through 2015 by nearly 50%.” |
Response:
As described in the previous bullet and reflected inAnnex J, Dynegy is projected to have negative Cash Flow through 2015 of approximately $1.1 billion, based upon June 7, 2010 commodity price curves. Holding all other variables constant but updating commodity prices to be based upon September 7, 2010 commodity price curves, Dynegy forecasts reflect approximately $1.6 billion in negative Cash Flow through 2015. This reflects approximately $500 million in additional negative Cash Flow, which is equal to an increase in negative Cash Flow of approximately 45%.
| • | “Based on an enterprise value that takes into account Dynegy’s outstanding debt… the $50 million post-’go-shop’ termination fee translates to 1.1% of total enterprise value…” |
Response:
As described above, Dynegy’s enterprise value is approximately $4.65 billion, and this calculation was provided on page 4 of the Proxy Advisory Firms Presentation, which is attached asAnnex F hereto. The $50 million post-’go-shop’ termination fee represents approximately 1.1% of $4.65 billion.
| • | “Using September commodity pricing, Dynegy’s total projected negative cash flow has increased from the $1.1 billion using June commodity prices to $1.6 billion over the next five years.” |
-7-
Response:
Please see the response two bullets above.
| • | “Natural gas prices have fallen approximately 7% and the stock prices of Dynegy’s peers have fallen on average approximately 2% since August 12, 2010… which could imply a 65% loss in value when compared to Blackstone’s binding cash offer of $4.50 per share.” |
Response:
A chart reflecting the approximate 2% decline in the market-capitalization weighted stock prices of the Peer Group between August 12, 2010 and October 19, 2010 is attached asAnnex L hereto; the data source for this chart was Bloomberg L.P. Blackstone’s binding cash offer of $4.50 per share represents a premium of approximately 62% to the closing price of Dynegy common stock on August 12, 2010, the day before the announcement of the Merger Agreement. The sum of the decline in the stock prices of the Peer Group and the premium implies a potential 65% loss in value.
The 7% decline in natural gas prices described above represents the decline in the five year average natural gas forward curve from the August 12, 2010 natural gas curve average price of $5.36 to the October 20, 2010 natural gas curve average price of $4.98; these averages are provided on page 12 of the Proxy Advisory Firms Presentation, which is attached asAnnex B hereto.
**************
Dynegy acknowledges that:
| • | Dynegy is responsible for the adequacy and accuracy of the disclosure in the Definitive Additional Materials; |
| • | Staff comments or changes to disclosure in response to Staff comments do not foreclose the Commission from taking any action with respect to the Definitive Additional Materials; and |
-8-
| • | Dynegy may not assert Staff comments as a defense in any proceeding initiated by the Commission or any person under the federal securities laws of the United States. |
**************
Please contact the undersigned at (713) 507-6847 should you require further information or have any questions.
Sincerely,
/s/ J. Kevin Blodgett |
J. Kevin Blodgett General Counsel and Executive Vice President – Administration |
| cc: | Joseph B. Frumkin, Sullivan & Cromwell LLP |
-9-
Annex A
Opinions of Financial Co-Advisors
Opinion of Greenhill & Co., LLC
On August 12, 2010, at a meeting of the board of directors held to consider the proposed merger, Greenhill rendered to the board of directors an oral opinion, which was confirmed by delivery of a written opinion, dated August 13, 2010, to the effect that, as of the date of the opinion, and based upon and subject to the limitations and assumptions set forth therein, the per share merger consideration to be received by the holders of the common stock (excluding Parent, Merger Sub and any of their affiliates) pursuant to the merger agreement was fair, from a financial point of view, to such holders.
The full text of Greenhill’s written opinion dated August 13, 2010, which contains the assumptions made, procedures followed, matters considered and limitations on the review undertaken in connection with the opinion, is attached asAnnex B to this proxy statement and is incorporated herein by reference. The summary of Greenhill’s opinion in this proxy statement is qualified in its entirety by reference to the full text of the opinion.
In arriving at its opinion, Greenhill, among other things:
| • | reviewed the merger agreement, the NRG PSA and certain related documents; |
| • | reviewed certain publicly available financial statements of the Company; |
| • | reviewed certain other publicly available business and financial information relating to the Company that Greenhill deemed relevant; |
| • | reviewed certain information, including financial forecasts and other financial and operating data concerning the Company, prepared by the management of the Company, including the financial forecasts prepared by the management of the Company described under “The Merger—Certain Company Forecasts” beginning on page 53, which we refer to as the financial forecasts; |
| • | discussed the past and present operations and financial condition and the prospects of the Company with senior executives of the Company; |
| • | reviewed the historical market prices and trading activity for the common stock and analyzed its implied valuation multiples; |
| • | compared the value of the per share merger consideration to a range of implied valuations for the common stock derived based on valuation multiples implied by the trading values of certain publicly traded companies that Greenhill deemed relevant; |
| • | compared the value of the per share merger consideration to a range of implied valuations for the common stock derived by discounting future cash flows and a terminal value of the Company at discount rates Greenhill deemed appropriate; |
| • | compared the value of the per share merger consideration to a range of implied valuations for the common stock derived based on multiples implied by certain publicly available transactions that Greenhill deemed relevant involving merchant generation companies; |
| • | compared the value of the per share merger consideration to a range of implied valuations for the common stock derived based on premiums paid in certain publicly available transactions that Greenhill deemed relevant; |
| • | participated in discussions and negotiations among representatives of the Company and its legal advisors and representatives of Parent and its legal advisors; and |
| • | performed such other analyses and considered such other factors as Greenhill deemed appropriate. |
Greenhill’s written opinion was addressed to the board of directors. It was not a recommendation to the board of directors as to whether it should approve the merger or the merger agreement, nor does it constitute a recommendation as to whether the stockholders of the Company should approve or take any other action with respect to the merger at any meeting of the stockholders convened in connection with the merger. Greenhill was not requested to opine as to, and its opinion did not in any manner address, the Company’s underlying business decision to proceed with or effect the merger. Greenhill did not express any opinion as to any aspect of the transactions contemplated by the merger agreement other than the fairness, from a financial point of view, of the per share merger consideration to the holders of common stock (excluding Parent, Merger Sub and any of their affiliates). Greenhill did not express any opinion as to any aspect of the NRG sale. Greenhill did not express any opinion on the amount or nature of any compensation to any officers, directors or employees of the Company, or any class of such persons, relative to the per share merger consideration to be received by the holders of the common stock in the merger or with respect to the fairness of any such compensation. Greenhill expressed no opinion as to the impact of the merger or the NRG sale on the solvency or viability of the Company or Parent or the ability of the Company or Parent to pay its obligations when they come due. Greenhill’s opinion was approved by its fairness committee.
In conducting its review and analysis and rendering its opinion, Greenhill assumed and relied upon, without independent verification, the accuracy and completeness of the information publicly available, supplied or otherwise made available to it by representatives and management of the Company for the purposes of its opinion and further relied upon the assurances of the representatives and management of the Company that they were not aware of any facts or circumstances that would make such information inaccurate or misleading. With respect to the financial forecasts and projections and other data that was furnished or otherwise provided to it, Greenhill assumed that such projections and data were reasonably prepared on a basis reflecting the best currently available estimates and good faith judgments of the management of the Company as to those matters, and Greenhill relied upon such financial forecasts and data in arriving at its opinion. Greenhill expressed no opinion with respect to such financial forecasts, projections and other data or the assumptions upon which they were based.
Greenhill did not make any independent valuation or appraisal of the assets or liabilities of the Company, nor was it furnished with any such appraisals. Greenhill assumed for purposes of its opinion that the merger will be consummated in accordance with the terms set forth in the merger agreement, without waiver of any material terms or conditions set forth in the merger agreement. Greenhill further assumed that all material governmental, regulatory and other consents and approvals necessary for the consummation of the merger will be obtained without any effect on the merger meaningful to its analysis.
Greenhill’s opinion was necessarily based on financial, economic, market and other conditions as in effect on, and the information made available to it, as of August 13, 2010. Subsequent developments may affect its opinion, and Greenhill does not have any obligation to update, revise, or reaffirm its opinion.
The board of directors retained Greenhill based on its qualifications and expertise in providing financial advice and on its reputation as an internationally recognized investment banking firm. Greenhill acted as financial advisor to the independent director committee of the board of directors in connection with the purchase by LS Power of (i) the Company’s interests in eight power generating project companies and Dynegy Sandy Creek Holdings, LLC and (ii) $235 million aggregate principal amount of 7.5% Senior Unsecured Notes due 2015 of Dynegy Holdings Inc., a wholly-owned subsidiary of the Company, in exchange for approximately $1.0135 billion in cash and the relinquishment of 245 million shares of Class B common stock of the Company by LS Power, announced in August 2009. The Company understands that Greenhill has not had a material relationship with Blackstone or any of its affiliates during the past two years.
Under the terms of Greenhill’s engagement with the Company, the Company has agreed to pay Greenhill a fee of $10 million in the aggregate, of which $5 million was paid following delivery of Greenhill’s written opinion and $5 million is payable upon the consummation of the merger. The Company has also agreed to reimburse Greenhill for certain out-of-pocket expenses incurred by it in connection with its engagement and will indemnify Greenhill against certain liabilities that may arise out of its engagement.
Greenhill’s opinion was one of the many factors considered by the board of directors in evaluating the merger and should not be viewed as determinative of the views of the board of directors with respect to the merger.
Opinion of Goldman, Sachs & Co.
On August 12, 2010, at a meeting of the board of directors held to consider the proposed merger, Goldman Sachs rendered to the board of directors an oral opinion, which was confirmed by delivery of a written opinion, dated August 13, 2010, to the effect that, as of the date of the opinion, and based upon and subject to the factors, assumptions and limitations set forth therein, the $4.50 per share in cash to be paid to the holders of common stock pursuant to the merger agreement was fair from a financial point of view to such holders.
The full text of the written opinion of Goldman Sachs, dated August 13, 2010, which sets forth assumptions made, procedures followed, matters considered and limitations on the review undertaken in connection with the opinion, is attached asAnnex C to this proxy statement. Goldman Sachs provided its opinion for the information and assistance of the board of directors in connection with its consideration of the proposed merger. The Goldman Sachs opinion is not a recommendation as to how any holder of common stock should vote with respect to the merger or any other matter.
In connection with rendering the opinion described above and performing its related financial analyses, Goldman Sachs reviewed, among other things:
| • | the merger agreement; |
| • | the NRG PSA; |
| • | annual reports to stockholders and Annual Reports on Form 10-K of the Company for the five fiscal years ended December 31, 2009; |
| • | certain interim reports to stockholders and Quarterly Reports on Form 10-Q of the Company; |
| • | certain other communications from the Company to its stockholders; |
| • | certain publicly available research analyst reports for the Company; and |
| • | certain internal financial analyses and forecasts for the Company prepared by its management, including the financial forecasts disclosed under “The Merger—Certain Company Forecasts” beginning on page 53, as approved for Goldman Sachs’ use by the Company. |
Goldman Sachs also held discussions with members of the senior management of the Company regarding their assessment of the past and current business operations, financial condition and future prospects of the Company; reviewed the reported price and trading activity for the shares of the common stock and the publicly traded debt securities of the Company and its subsidiaries; compared certain financial and stock market information for the Company with similar information for certain other companies the securities of which are publicly traded; reviewed the financial terms of certain recent business combinations in the power generation industry and in other industries; and performed such other studies and analyses, and considered such other factors, as Goldman Sachs deemed appropriate.
For purposes of rendering the opinion described above, Goldman Sachs relied upon and assumed, without assuming any responsibility for independent verification, the accuracy and completeness of all of the financial, legal, regulatory, tax, accounting and other information provided to, discussed with or reviewed by it and Goldman Sachs did not assume any responsibility for any such information. In that regard, Goldman Sachs assumed with the consent of the board of directors that the internal financial analyses and financial forecasts for the Company prepared by its management were reasonably prepared on a basis reflecting the best currently available estimates and judgments of the management of the Company. Goldman Sachs did not make an independent evaluation or appraisal of the assets and liabilities (including any contingent, derivative or other off-balance-sheet assets and liabilities) of the Company or any of its subsidiaries, nor was any evaluation or appraisal of the assets or liabilities of the Company or any of its subsidiaries furnished to Goldman Sachs. Goldman Sachs assumed that all governmental, regulatory or other consents and approvals necessary for the consummation of the merger will be obtained without any adverse effect on the Company or on the expected benefits of the merger in any way meaningful to its analysis. Goldman Sachs also assumed that the merger will be consummated on the terms set forth in the merger agreement, without the waiver or modification of any term or condition of the merger agreement or the NRG PSA the effect of which would be in any way meaningful to its analysis.
Goldman Sachs’ opinion did not address the underlying business decision of the Company to engage in the merger, or the relative merits of the merger as compared to any strategic alternatives that may be available to the Company; nor did it address any legal, regulatory, tax or accounting matters. Goldman Sachs’ opinion addresses only the fairness from a financial point of view, as of August 13, 2010, of the per share merger consideration to be paid to the holders of the common stock pursuant to the merger agreement. Goldman Sachs’ opinion did not express any view on, and did not address, any other term or aspect of the merger agreement or the merger or any term or aspect of any other agreement or instrument contemplated by the merger agreement or entered into or amended in connection with the merger, including, without limitation, the NRG PSA or the impact thereof, the fairness of the merger to, or any consideration received in connection therewith by, the holders of any other class of securities, creditors, or other constituencies of the Company; nor as to the fairness of the amount or nature of any compensation to be paid or payable to any of the officers, directors or employees of the Company, or class of such persons, in connection with the merger, whether relative to the per share merger consideration to be paid to the holders of shares of common stock pursuant to the merger agreement or otherwise. Goldman Sachs did not express any opinion as to the impact of the merger or any transaction entered into in connection therewith on the solvency or viability of the Company or Parent or the ability of the Company or Parent to pay its obligations when they come due. Goldman Sachs’ opinion was necessarily based on economic, monetary market and other conditions, as in effect on, and the information made available to it as of, August 13, 2010 and Goldman Sachs assumed no responsibility for updating, revising or reaffirming its opinion based on circumstances, developments or events occurring after August 13, 2010. Goldman Sachs’ opinion was approved by a fairness committee of Goldman Sachs.
Goldman Sachs’ opinion to the board of directors was one of many factors taken into consideration by the board of directors in making its determination to approve the merger agreement.
Goldman Sachs and its affiliates are engaged in investment banking and financial advisory services, commercial banking, securities trading, investment management, principal investment, financial planning, benefits counseling, risk management, hedging, financing, brokerage activities and other financial and non-financial activities and services for various persons and entities. In the ordinary course of these activities and services, Goldman Sachs and its affiliates may at any time make or hold long or short positions and investments, as well as actively trade or effect transactions, in the equity, debt and other securities (or related derivative securities) and financial instruments (including bank loans and other obligations) of third parties, the Company, NRG or any of their respective affiliates, Blackstone or any of the affiliates and portfolio companies of Blackstone or any currency or commodity that may be involved in the merger for their own account and for the accounts of their customers. Goldman Sachs has acted as financial advisor to the Company in connection with, and have participated in certain of the negotiations leading to, the merger.
Goldman Sachs has provided certain investment banking services to the Company and its affiliates from time to time for which its investment banking division has received, and may receive, compensation, including having acted as financial advisor to the independent director committee of the board of directors in connection with the dissolution of the Company’s power development joint venture with LS Power in December 2008 and as financial advisor to the Company in connection with the exchange of the Company’s interests in eight power generation facilities and Dynegy Sandy Creek Holdings, LLC and $235 million aggregate principal amount of 7.5% Senior Unsecured Notes due 2015 of a subsidiary of the Company, for cash and shares of Class B common stock of the Company relinquished by LS Power, announced in August 2009. Goldman Sachs also has provided certain investment banking services to Blackstone and its affiliates and portfolio companies from time to time for which its investment banking division has received, and may receive, compensation, including having acted as joint bookrunner in connection with the private placement by subsidiaries of The Nielsen Company B.V., a portfolio company of Blackstone, of 11.625% Senior Notes due 2014 ($330 million aggregate principal amount) in January 2009 and 11.5% Senior Notes due 2016 ($500 million aggregate principal amount) in April 2009; as co-manager in connection with the private placement by a subsidiary of Blackstone of 6.625% Senior Notes due 2019 ($600 million aggregate principal amount) in August 2009; as financial advisor to funds affiliated with Blackstone in connection with its purchase of Busch Entertainment Corporation in December 2009; as joint bookrunner in connection with the private placement by subsidiaries of Vanguard Health Systems, Inc., a portfolio company of Blackstone, of 8% Senior Notes due 2018 ($950 million aggregate principal amount) in January 2010 and 8% Senior Notes due 2018 ($225 million aggregate principal amount) in June 2010; as co-manager in connection with the private placement by Republic Services, Inc., a portfolio company of Blackstone, of 5% Senior Notes due 2020 ($850 million aggregate principal amount) and 6.2% Senior Notes due 2040 ($650 million aggregate principal amount) in March 2010; and as financial advisor to funds affiliated with Blackstone in connection with the sale by the funds of equity interests in Merlin Entertainments Group, a portfolio company of Blackstone, in July 2010. Goldman Sachs also has provided certain investment banking services to NRG and its affiliates from time to time. Goldman Sachs may also in the future provide investment banking services to the Company, NRG and their respective affiliates and Blackstone and its affiliates and portfolio companies for which its investment banking division may receive compensation. Affiliates of Goldman Sachs also may have co-invested with Blackstone and its affiliates from time to time and may have invested in limited partnership units of affiliates of Blackstone from time to time and may do so in the future.
The board of directors selected Goldman Sachs as one of its financial co-advisors because it is an internationally recognized investment banking firm that has substantial experience in transactions similar to the merger. Under the terms of Goldman Sachs’ engagement with the Company, the Company has agreed to pay Goldman Sachs a fee of $10 million in the aggregate, of which $5 million was paid following delivery of Goldman Sachs’ written opinion and $5 million is payable upon the consummation of the merger. In addition, the Company has agreed to reimburse Goldman Sachs for its expenses, including attorneys’ fees and disbursements, and to indemnify Goldman Sachs and related persons against various liabilities, including certain liabilities under the federal securities laws.
Financial Analyses by Financial Co-Advisors
The following is a summary of the material financial analyses presented by Greenhill and Goldman Sachs, which we refer to collectively as the financial co-advisors, to the board of directors in connection with rendering the respective opinions described above. The following summary, however, does not purport to be a complete description of the financial analyses performed by the financial co-advisors, nor does the order of analyses described represent the relative importance or weight given to those analyses by the financial co-advisors. Some of the summaries of the financial analyses include information presented in tabular format. In order to fully understand the financial analyses performed by the financial co-advisors, the tables must be read together with the full text of each summary and are alone not a complete description of the financial co-advisors’ financial analyses. Considering the data set forth in the tables below without considering the narrative description of the financial analyses, including the methodologies and assumptions underlying the analyses, could create a misleading or incomplete view of the financial co-advisors’ financial analyses. Except as otherwise noted, the following quantitative information, to the extent that it is based on market data, is based on market data as it existed on or before August 11, 2010 and is not necessarily indicative of current market conditions.
Selected Companies Analysis
The financial co-advisors reviewed and compared certain financial information for the Company to corresponding financial information and public market multiples for the following publicly traded companies in the merchant power generation industry, which are collectively referred to below as the selected companies:
| • | Calpine Corporation; |
| • | RRI Energy, Inc. / “GenOn” (adjusted for the announced merger of RRI Energy, Inc. and Mirant Corporation at the agreed-upon exchange ratio and the forecasted synergies for the combined company as publicly disclosed by the parties to that merger); and |
| • | NRG Energy, Inc. |
Although none of the selected companies is directly comparable to the Company, these companies were chosen because they are publicly traded companies with operations that for the purposes of this analysis may be considered similar to certain operations of the Company. With respect to the Company and the selected companies, the financial co-advisors calculated:
| • | The rent-adjusted enterprise value, referred to as Rent-Adjusted EV, which is defined as the market value of common equity plus the book value of debt and preferred stock, plus an estimate of the present value of anticipated rent expense, plus minority interest, less cash, as a multiple of estimated earnings plus rent expense, before interest, taxes, depreciation and amortization, referred to as Rent-Adjusted EBITDA, for calendar year 2010; |
| • | The Rent-Adjusted EV as a multiple of estimated Rent-Adjusted EBITDA for calendar year 2011; and |
| • | The Rent-Adjusted EV as a multiple of estimated Rent-Adjusted EBITDA for calendar year 2012. |
For purposes of this analysis, the multiples for the Company and each of the selected companies were calculated using (i) Rent-Adjusted EV amounts derived using the closing price of the Company’s and the selected companies’ common stock on August 11, 2010, and book value of debt, preferred stock, minority interest and cash amount reflected in, and an estimate of the present value of anticipated rent expense under operating leases based on, publicly available information regarding the Company and the selected companies and (ii) Rent-Adjusted EBITDA estimates for the Company and the selected companies based on the median estimates of the Company’s and the selected companies’ earnings before interest, taxes, depreciation and amortization, referred to as EBITDA, most recently published by Institutional Broker’s Estimate System, or IBES, as of August 11, 2010 and publicly available information regarding the Company’s and the selected companies’ anticipated rent expense.
The results of these analyses are summarized as follows:
Rent-Adjusted EV as a Multiple of: | Selected Companies | Company | ||||
| Range | Median | |||||
2010E Rent-Adjusted EBITDA | 4.8x – 9.0x | 5.7x | 8.1x | |||
2011E Rent-Adjusted EBITDA | 6.1x – 8.5x | 6.6x | 7.9x | |||
2012E Rent-Adjusted EBITDA | 6.1x – 8.5x | 6.6x | 7.8x | |||
Based on this analysis and utilizing their professional judgment and experience, the financial co-advisors applied selected multiples ranging from 6.5x to 8.5x to estimated 2011 Rent-Adjusted EBITDA for the Company derived from the consensus estimates of the Company’s 2011 EBITDA most recently published by IBES and the Company’s estimated 2011 rent expense under its Central Hudson lease to derive a range of implied Rent-Adjusted EVs for the Company. The financial co-advisors then calculated an indicative range of implied equity values for the Company by reducing the range of implied Rent-Adjusted EVs by the book value of the Company’s net debt as of June 30, 2010 and by the present value of the Company management’s estimated future rent expenses under its Central Hudson lease, calculated using a 10% discount rate, based on public presentations made by Company management. By dividing this range of implied equity values by the number of fully-diluted shares of the common stock outstanding, the financial co-advisors calculated a range of illustrative value indications per share for the common stock, summarized as follows:
| Illustrative Per Share Value Indications | ||
Company 2011E IBES Rent-Adjusted EBITDA | $(3.82) – $5.49 |
Selected Transactions Multiples Analysis
The financial co-advisors analyzed, to the extent publicly available, certain information relating to the following selected pending or previously proposed merchant power corporate transactions:
Date Announced | Acquiror | Target | Status | |||
| 04/11/2010 | RRI Energy, Inc. (merger of equals) | Mirant Corporation | Pending | |||
07/02/2009 (Second Bid) | Exelon Corporation | NRG Energy, Inc. | Failed | |||
10/19/2008 (First Bid) | Exelon Corporation | NRG Energy, Inc. | Failed | |||
| 05/21/2008 | NRG Energy, Inc. | Calpine Corporation | Failed |
For each of the selected transactions, the financial co-advisors calculated and reviewed the enterprise value of the target company as a multiple of estimated EBITDA for the first full fiscal year period beginning after the applicable transaction announcement date, or FY1 EBITDA, based on IBES estimates most recently published prior to the date of the announcement of the applicable transaction. For purposes of this analysis, the target companies’ enterprise values were generally calculated by multiplying the announced per-share transaction price by the number of that target company’s fully diluted outstanding shares as disclosed in the target company’s most recent filings with the SEC prior to the announcement of the applicable transaction and adding to that result the target company’s net debt as disclosed in the target company’s most recent public filings with the SEC prior to the announcement of the applicable transaction. While none of the companies that participated in the selected transactions are directly comparable to the Company, the companies that participated in the selected transactions are publicly traded companies with operations that, for the purposes of analysis, may be considered similar to certain of the Company’s operations. The results of this analysis are summarized as follows:
Enterprise Value as a Multiple of: | Selected Transactions(1) | Transaction | ||||
| Range | Median | |||||
FY1 EBITDA | 5.5x – 11.4x | 6.4x | 7.9x | |||
| (1) | Excluding NRG’s attempted acquisition of Calpine Corporation from the analysis results in a range from 5.5x to 6.4x and a median of 6.2x. |
Based on this analysis, and utilizing their professional judgment and experience, the financial co-advisors applied selected multiples ranging from 5.5x to 6.5x to the unadjusted IBES consensus EBITDA estimate for the Company for calendar year 2011 to determine an indicative range of implied enterprise values of the Company. The financial co-advisors then calculated an indicative range of implied equity values for the Company by reducing the range of implied enterprise values by the amount of the Company’s net debt as of June 30, 2010. By dividing this range of implied equity values by the number of fully-diluted shares of the common stock outstanding, the financial co-advisors calculated a range of illustrative value indications per share for the common stock, summarized as follows:
| Illustrative Per Share Value Indications | ||
Company 2011E IBES EBITDA | $(5.52) – $(1.29) |
Selected Transactions Premiums Analysis
Based on publicly-available information, the financial co-advisors analyzed the premiums paid in publicly announced change of control transactions (excluding self-tender offers, stock repurchases and exchange offers) within the United States during the five-year period ending August 11, 2010 having transaction values between $1 billion and $10 billion, and separately analyzed such change of control transactions only involving companies in the energy and power industries. None of the companies that participated in the transactions used in this analysis is directly comparable to the Company or the transaction.
The financial co-advisors reviewed the premiums paid in these transactions represented by the per share acquisition price in each of the selected transactions as compared to the average closing share price of the target company over the periods one day, one week and one month prior to the announcement of such selected transaction. The financial co-advisors also analyzed the premiums paid in these selected transactions based on the type of consideration (e.g., all cash, mixed consideration, all stock) offered in the transaction. The results of this analysis are summarized as follows:
Section / Consideration Type | One Day | One Week | One Month | |||||||||
General M&A – All Cash | 26 | % | 28 | % | 28 | % | ||||||
General M&A – Mixed Consideration | 21 | % | 23 | % | 24 | % | ||||||
General M&A – All Stock | 17 | % | 18 | % | 19 | % | ||||||
Energy / Power M&A – All Cash | 25 | % | 24 | % | 27 | % | ||||||
Energy / Power M&A – Mixed Consideration | 20 | % | 18 | % | 23 | % | ||||||
Energy / Power M&A – All Stock | 11 | % | 15 | % | 17 | % | ||||||
Based on this review and their professional judgment and experience, the financial co-advisors applied a range of premiums from 20% to 30% to the average closing share price of the common stock over the periods one day, one week and one month prior to August 11, 2010, and derived a range of illustrative value indications for the common stock, summarized as follows:
| Average Company Share Price Over Period | Premium Range | Illustrative Per Share Value Indications | ||||||||||||
| One Day | One Week | One Month | ||||||||||||
| $ | 2.92 | $ | 3.53 | $ | 3.79 | 20% – 30% | $4.10 – $4.44 | |||||||
Illustrative Discounted Cash Flow Analysis
The financial co-advisors performed an illustrative discounted cash flow analysis of the Company using the financial forecasts, which are described under “The Merger—Certain Company Forecasts” beginning on page 53. The financial co-advisors calculated an illustrative range of implied present values per share of common stock by discounting to present value as of December 31, 2010 (a) estimates of the Company’s unlevered free cash flow for the calendar years 2011 through 2015 calculated using the financial forecasts and (b) illustrative terminal values for the Company as of December 31, 2015 derived by multiplying the Company management’s estimates of the Company’s 2015 Rent-Adjusted EBITDA by multiples ranging from 6.5x to 8.5x. These illustrative unlevered free cash flows and terminal values were then discounted to calculate implied indications of present values using illustrative discount rates ranging from 8% to 12%, reflecting estimates of the Company’s weighted average cost of capital. The following table presents the results of this analysis:
| Illustrative Per Share Value Indications | ||
Company management financial forecasts | $(5.69) – $5.86 |
Illustrative Sum-of-the-Parts Analysis
The financial co-advisors performed an illustrative sum-of-the-parts analysis to determine a range of implied equity values of the common stock, based on hypothetical standalone valuations of each of the Company’s scrubbed coal generation assets, unscrubbed coal generation assets, simple cycle gas generation assets and combined cycle gas generation assets. In conducting this analysis, the financial co-advisors reviewed and analyzed, to the extent publicly available, certain information relating to three selected pending or closed coal asset transactions and 22 selected pending or closed natural gas asset transactions, including five natural gas asset transactions announced in 2010.
For each selected coal or natural gas asset transaction reviewed, the financial co-advisors calculated the standalone enterprise value of the applicable coal or natural gas assets (derived from the purchase price paid in the transaction) as a multiple, referred to as EV/kW, of the generating capacity of the coal assets (expressed in kilowatts). The following summarizes the review of the three pending or closed coal asset transactions performed by the financial co-advisors:
Date Announced | Acquiror | Seller | Assets | EV/kW | ||||||
02/11/2010 | First Energy Corporation | Allegheny Energy, Inc. | Allegheny Energy, Inc.’s Coal Fleet(1) | $ | 620 | |||||
04/12/2007 | Cascade Investment LLC | PNM Resources, Inc. | Twin Oaks facility | $ | 1,586 | |||||
04/20/2006 | International Power plc | Sempra Energy /Riverstone Holdings LLC | Coleto Creek facility | $ | 1,903 | |||||
| (1) | Of the total $9.0 billion enterprise value of Allegheny Energy, Inc. implied by the transaction based on publicly available information, $5,637 million was attributed to Allegheny Energy’s regulated utility and $116 million was attributed to Allegheny Energy’s peaking and hydro facilities (total of 1,046 megawatts) based on an analyst research report published by an internationally recognized investment banking firm, as of February 1, 2010. The remaining value of $3,247 million was attributed to Allegheny Energy’s 5,236MW merchant baseload coal fleet. |
The following are the 22 natural gas asset transactions, including five transactions announced in 2010, reviewed by the financial co-advisors:
Date Announced | Acquiror | Seller | Assets | |||
08/09/2010 | Constellation Energy | Boston Generating | Five Boston facilities | |||
05/06/2010 | ArcLight Energy Partners Fund III, L.P. | KGen Power Corporation | Sandersville facility | |||
04/21/2010 | Calpine Corporation | Pepco Holdings, Inc. | Conectiv Energy fleet | |||
04/16/2010 | Constellation Energy | Navasota Holdings | Colorado Bend Energy and Quail Run Energy facilities | |||
04/05/2010 | Xcel Energy Inc. | Calpine Corporation | Rocky Mountain and Blue Spruce facilities | |||
03/23/2010 | Energy Capital Partners | BG Group plc. | Lake Road, Masspower and Dighton facilities | |||
08/03/2009 | Oglethorpe Power Corporation | Hartwell Energy Limited Partnership | Hartwell facility | |||
08/10/2009 | L.S. Power Associates, L.P. | Dynegy, Inc. | Eight gas facilities and stake in Sandy Creek | |||
02/26/2009 | Cleco Power LLC | Acadia Power Partners, LLC | Acadia Power Station | |||
10/13/2008 | Tenaska Capital Management, LLC | MACH Gen, LLC | Covert facility | |||
09/25/2008 | Puget Sound Energy, Inc. | Wayzata Opportunities Fund, LLC | Mint Farm facility | |||
09/02/2008 | SUEZ Energy North America, Inc. | FirstLight Power Enterprises, Inc. | 15 facilities | |||
06/10/2008 | Global Infrastructure Partners and Foristar LLC | GIM Channelview Cogeneration, LLC | Channelview facility | |||
05/12/2008 | International Power plc | Tenaska Power Fund, L.P. and Warburg Pincus LLC | Four facilities | |||
05/12/2008 | GSC Acquisition Company | Complete Energy Holdings, LLC | La Paloma and Batesville facilities | |||
04/22/2008 | Nevada Power Company | Reliant Energy, Inc. | Bighorn facility | |||
04/30/2008 | Hastings Funds Management Ltd. and IIF BH Investment LLC | Black Hills Corporation | Seven gas facilities | |||
04/15/2008 | Hoosier Energy Rural Electric Cooperative, Inc. and Wabash Valley Power Association, Inc. | Tenaska Power Fund, L.P. | Beecher City facility | |||
04/03/2008 | Tennessee Valley Authority | Southaven Power, LLC | Southaven facility | |||
03/31/2008 | TransCanada Corporation | National Grid plc | Ravenswood facility | |||
01/29/2008 | FirstEnergy Corp. | Calpine Corporation | Fremont facility | |||
01/21/2008 | Oklahoma Gas and Electric Company | Kelson Holdings LLC | Redbud facility |
The results of the review of these natural gas asset transactions are summarized as follows:
| Selected Transactions | ||||
| Range | Median | |||
All Natural Gas Asset Transactions (EV/kW) | $203/kW – $1,235/kW | $565/kW | ||
2010 Natural Gas Asset Transactions (EV/kW) | $203/kW – $794/kW | $367/kW | ||
Based on the foregoing analysis and other factors considered in their professional judgment and experience, including an analysis of the spot price of natural gas on the date of the announcement of each of the selected transactions, current market dynamics, the current regulatory and legislative environment and guidance from the Company’s management, the financial co-advisors selected reference ranges for the EV/kW multiples with respect to each of the Company’s scrubbed coal generation assets, unscrubbed coal generation assets, simple cycle generation assets and combined cycle generation assets. By applying these reference ranges to the respective generating capacities of each of the Company’s generation assets (excluding the Plum Point development project ownership interest), this analysis indicated an indicative range of implied generation enterprise values for the Company’s standalone generation assets, individually and in the aggregate, as summarized in the following table:
(US$ in millions) Asset Segment | Generation Capacity (MW) | Illustrative Multiple Ranges (EV/kW) | Implied Generation Enterprise Value Indications | |||||||||||||||||
| Low | High | Low | High | |||||||||||||||||
Scrubbed Coal | 2,241 | $ | 500 | $ | 700 | $ | 1,121 | $ | 1,569 | |||||||||||
Unscrubbed Coal | 1,273 | 100 | 150 | 127 | 191 | |||||||||||||||
Simple Cycle Gas Generation | 4,120 | 200 | 300 | 824 | 1,236 | |||||||||||||||
Combined Cycle Gas Generation | 4,447 | 300 | 500 | 1,334 | 2,224 | |||||||||||||||
Total Generation Enterprise Value | 12,081 | $ | 282 | (1) | $ | 432 | (1) | $ | 3,406 | $ | 5,219 | |||||||||
| (1) | Range of EV/kW for total generation based on weighted average of capacity and ranges for each asset segment. |
The financial co-advisors then calculated an indicative range of implied equity values for the Company by reducing the range of implied generation enterprise values by the amount of the Company’s projected net debt as of December 31, 2010 (including the present value (calculated using a 10% discount rate) of the Company management’s estimated future rent expenses under the Company’s Central Hudson lease and Company management’s estimated environmental capital expenditures) and by an implied value of the Company’s unallocated corporate overhead expenses, derived by applying a multiple of 7.5x to Company management’s estimated 2011 general and administrative expense. By dividing this range of implied equity values by the number of fully-diluted shares of the common stock outstanding, the financial co-advisors calculated a range of illustrative value indications per share for the common stock, summarized as follows:
| Illustrative Per Share Value Indications | ||
Power Generation Assets (EV/kW) | $(15.22) – $(0.18) |
Research Analysts Stock Price Targets
Using publicly available information, the financial co-advisors reviewed and analyzed the most recent price targets as of August 11, 2010 for the common stock published by 13 equity research analysts. These targets reflect each analyst’s estimate of the future public market trading price of the common stock and are not discounted to present value. The results of this review are summarized as follows:
| Range(1) | Median(2) | Mean(2) | ||||
Research Analysts Price Targets ($/share) | $2.50 – $7.50 | $4.25 | $4.51 |
| (1) | Excludes the lowest ($1.00/share) and the highest ($25.00/share) published price targets |
| (2) | Median and Mean excludes price targets ($7.00/share and $25.00/share) published by two research analysts which, according to Company management, represented long-term price targets. |
Historical Trading Share Prices
The financial co-advisors reviewed the highest and lowest daily closing trading share prices of the common stock during the 52-week and the 3-month periods ending on August 11, 2010. The results of this review are summarized as follows:
| Daily Closing Share Price | ||||||||
Period Ending August 11, 2010: | Low | High | ||||||
52-week | $ | 2.92 | $ | 13.15 | ||||
3-month | $ | 2.92 | $ | 6.65 | ||||
Additional Financial Analysis
The financial co-advisors also reviewed and analyzed, referencing certain of the foregoing value indication analyses, the approximate market value of the Company’s outstanding publicly-traded debt securities referencing trading levels as of August 11, 2010 (rather than the book value of those debt securities). The results of these analyses are summarized below.
Selected Companies Analysis. Using the same methodology as the selected companies analysis described above, the financial co-advisors calculated the Rent-Adjusted EV for the Company using the market value of the Company’s debt securities. This Rent-Adjusted EV amount is referred to below as the Company Debt-Adjusted EV. The financial co-advisors calculated the Company Debt-Adjusted EV as a multiple of the Company’s estimated Rent-Adjusted EBITDA for calendar years 2010, 2011 and 2012,
respectively. The financial co-advisors observed that the market value of the debt securities for each of the selected companies was trading approximately in line with the book value of those securities. These calculations yielded the following indicative multiples:
Rent-Adjusted EVas a Multiple of: | Selected Companies Rent-Adjusted EV (multiple) | Company Debt- Adjusted EV (multiple) | ||||
| Range | Median | |||||
2010E Rent-Adjusted EBITDA | 4.8x – 9.0x | 5.7x | 6.6x | |||
2011E Rent-Adjusted EBITDA | 6.1x – 8.5x | 6.6x | 6.5x | |||
2012E Rent-Adjusted EBITDA | 6.1x – 8.5x | 6.6x | 6.3x | |||
Illustrative Discounted Cash Flow Sensitivity to Debt Valuation Analysis. Using the same methodology as the illustrative discounted cash flow analysis described above, the financial co-advisors calculated the sensitivity of the results of the illustrative discounted cash flow analysis to variations in the assumed value of the Company’s debt, using illustrative discount rates ranging from 8% to 12% and an illustrative terminal value for the Company derived from a 2015 Rent-Adjusted EBITDA multiple of 6.5x. In performing this sensitivity analysis, the financial co-advisors varied the assumed values of the Company’s debt used in the illustrative discounted cash flow analysis by amounts ranging from book value of the debt to the observed market value of the debt, each reflecting projected debt balances as of December 31, 2010 but referencing trading levels as of August 11, 2010. The results of this sensitivity analysis are summarized as follows:
| Illustrative Per Share Value Indications | ||
Variation in the Company’s debt value (book to observed market) | $(5.69) – $5.85 |
Illustrative Sum-of-the-Parts Analysis. Using the same methodology as the illustrative sum-of-the-parts analysis described above, the financial co-advisors also calculated an indicative range of implied per share equity values of the common stock based on the Company’s projected net debt as of December 31, 2010, as adjusted to reflect a discount to book value based on the approximate market value of the Company’s debt as of August 11, 2010. The results of this sensitivity analysis are summarized as follows:
| Illustrative Per Share Value Indications | ||
Variation in the Company’s debt value (book to observed market) | $(8.40) – $6.64 |
General
The preparation of a fairness opinion is a complex process and is not necessarily susceptible to partial analysis or summary description. Selecting portions of the analyses or of the summary set forth above, without considering the analyses as a whole, could create an incomplete view of the processes underlying the respective opinions of Greenhill and Goldman Sachs. In arriving at their fairness determination, Greenhill and Goldman Sachs each considered the results of all of their analyses and did not attribute any particular weight to any factor or analysis considered by them. Rather, Greenhill and Goldman Sachs each made their determination as to fairness on the basis of their experience and professional judgment after considering the results of all of their analyses. No company or transaction used in the above analyses as a comparison is directly comparable to the Company or the merger.
Greenhill prepared these analyses for purposes of Greenhill’s providing its opinion to the board of directors that, as of August 13, 2010 and based upon and subject to the limitations and assumptions set forth therein, the per share merger consideration to be received by the holders of common stock (excluding Parent, Merger Sub and any of their affiliates) pursuant to the merger agreement is fair, from a financial point of view, to such holders. Goldman Sachs prepared these analyses for purposes of Goldman Sachs’ providing its opinion to the board of directors that, as of August 13, 2010, and based upon and subject to the factors, assumptions and limitations set forth therein, the $4.50 per share in cash to be paid to the holders of the common stock pursuant to the merger agreement is fair from a financial point of view to such holders. These analyses do not purport to be appraisals nor do they necessarily reflect the prices at which businesses or securities actually may be sold. Analyses based upon forecasts of future results are not necessarily indicative of actual future results, which may be significantly more or less favorable than suggested by these analyses. Because these analyses are inherently subject to uncertainty, being based upon numerous factors or events beyond the control of the parties or their respective advisors, none of the Company, Greenhill, Goldman Sachs or any other person assumes responsibility if future results are materially different from those forecast.
As described above, Greenhill’s and Goldman Sachs’ opinions to the board of directors were amongst many factors taken into consideration by the board of directors in making its determination to approve the merger agreement. The per share merger consideration was determined through arm’s-length negotiations between the board of directors and Parent and was approved by the board of directors. Greenhill and Goldman Sachs provided advice to the board of directors during these negotiations. Greenhill and Goldman Sachs did not, however, recommend any specific amount of consideration to the Company or the board of directors or that any specific amount of consideration constituted the only appropriate consideration for the transaction.
The foregoing summary does not purport to be a complete description of the analyses performed by Greenhill or Goldman Sachs in connection with their respective fairness opinions and is qualified in its entirety by reference to the written opinions of Greenhill and Goldman Sachs attached asAnnex B andAnnex C, respectively.
Annex B
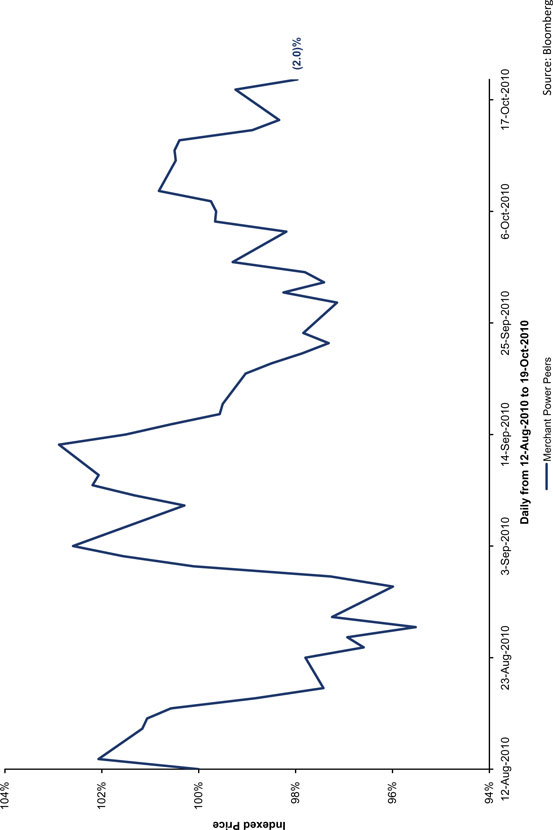
 12 12 12 12 Source: Summary Financial Forecast, Bloomberg / CSI market data as of October 20, 2010, NYMEX. Commodity price curves through 2012 based upon price curves as of the applicable date and commodity price assumptions after 2012 were based upon price curves as of the applicable date and adjusted based upon management’s fundamental outlook. 5-year Natural Gas Forward Average reflects average of monthly forwards for the calendar years 2010 – 2015 as of the applicable date. DYN share prices represent closing prices for August 12, 2010, June 7, 2010, September 25, 2009, and September 26, 2008 , as applicable. Following the transaction announcement, Dynegy’s stock price has not correlated to the price decline in natural gas. 12 • Forward natural gas prices have fallen consistently over the last two years • Decline of 42% in the 2010- 2015 average forward curve since Sep 2008 • Decline of 15% since Jun 7, 2010 • Decline of 7% since transaction announcement • Dynegy’s stock price is highly correlated with natural gas prices that continue to fall • Dynegy’s high leverage increases its risk profile, which increases its stock price sensitivity to natural gas prices Natural Gas Price (Henry Hub $/mmbtu) Conditions have continued to deteriorate since Blackstone’s offer. We believe focusing on closing the transaction is in stockholders’ best interest Commodity Prices Continue to Fall Commodity Prices Continue to Fall 24-months Ago (Sep-2008) $ 8.53 $ 19.95 12-months Ago (Sep-2009) $ 7.03 $ 11.40 Summary Financial Forecast (07-Jun-2010) $ 5.89 $ 4.67 1-Day Prior to Transaction Announcement (12-Aug-2010) $ 5.36 $ 2.78 Current (20-Oct-2010) $ 4.98 N / A 5-Yr Nat Gas Forward Ave (2010 - 2015) DYN Share Price $ 3.50 $ 4.50 $ 5.50 $ 6.50 $ 7.50 $ 8.50 $ 9.50 2010 2011 2012 2013 2014 2015 |
Annex C
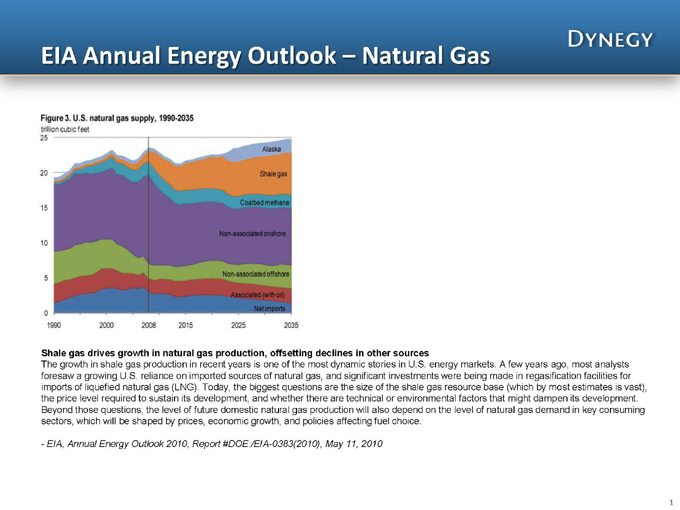
EIA Annual Energy Outlook – Natural Gas
Shale gas drives growth in natural gas production, offsetting declines in other sources
The growth in shale gas production in recent years is one of the most dynamic stories in U.S. energy markets. A few years ago, most analysts foresaw a growing U.S. reliance on imported sources of natural gas, and significant investments were being made in regasification facilities for imports of liquefied natural gas (LNG). Today, the biggest questions are the size of the shale gas resource base (which by most estimates is vast), the price level required to sustain its development, and whether there are technical or environmental factors that might dampen its development. Beyond those questions, the level of future domestic natural gas production will also depend on the level of natural gas demand in key consuming sectors, which will be shaped by prices, economic growth, and policies affecting fuel choice.
- EIA, Annual Energy Outlook 2010, Report #DOE:/EIA-0383(2010), May 11, 2010
1 |
|
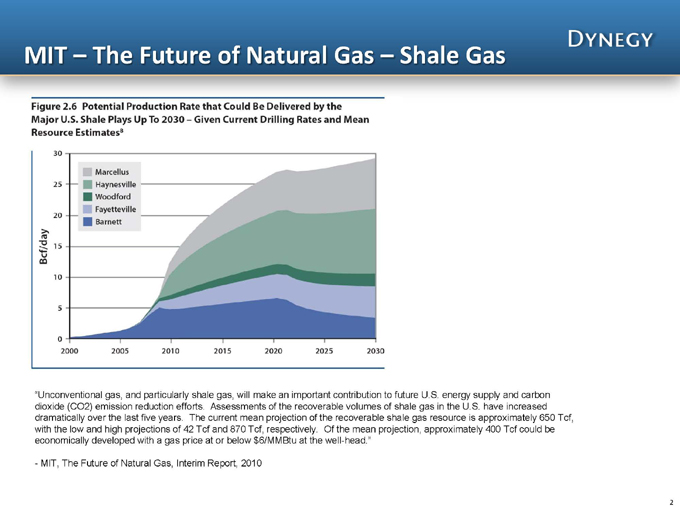
MIT – The Future of Natural Gas – Shale Gas
“Unconventional gas, and particularly shale gas, will make dioxide (CO2) emission reduction efforts. Assessments of the recoverable volumes of shale gas in the U.S. have increased dramatically over the last five years. The current mean projection of the recoverable shale gas resource is approximately 650 Tcf, with the low and high projections of 42 Tcf and 870 Tcf, respectively. Of the mean projection, approximately 400 Tcf could be economically developed with a gas price at or below $6/MMBtu at the well-head.”
- MIT, The Future of Natural Gas, Interim Report, 2010
2 |
|
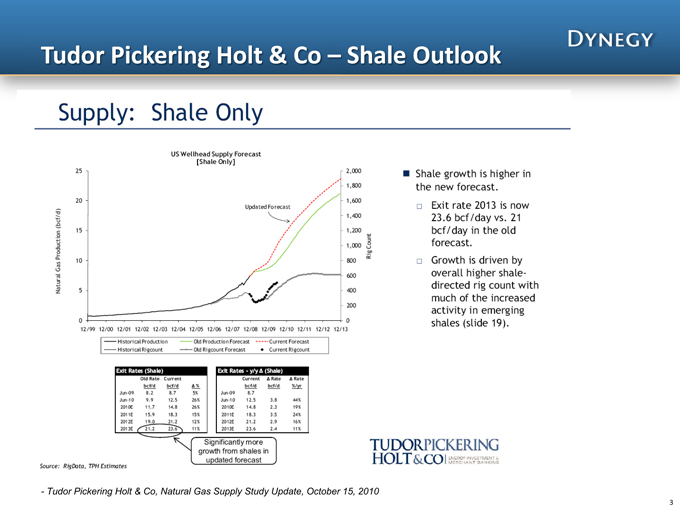
Tudor Pickering Holt & Co – Shale Outlook
- Tudor Pickering Holt & Co, Natural Gas Supply Study Update, October 15, 2010
Annex D
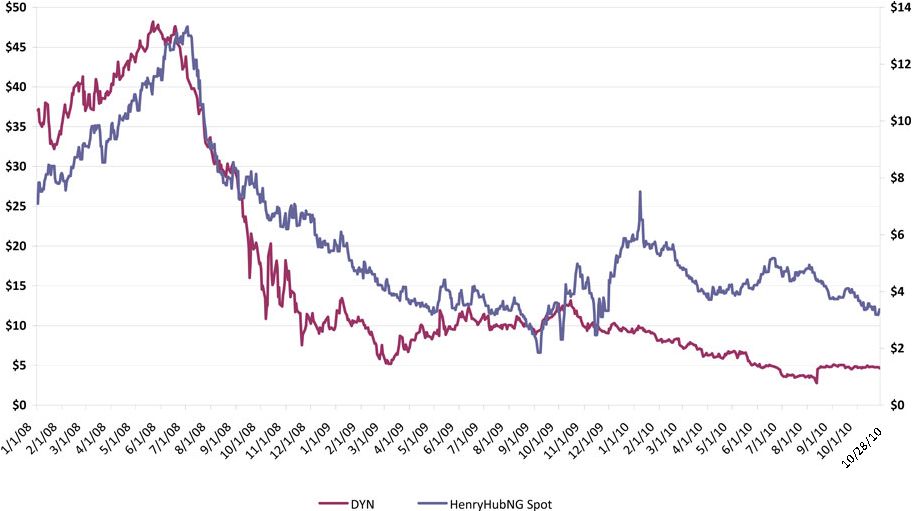 (1) Gas prices are provided by Logical Information Machines, Inc., a wholly owned subsidiary of Morningstar, Inc. Dynegy Stock Price Henry Hub NG Price (1) |
Annex E
Illustrative Leverage Comparison
Merchant Power
| Calpine | Dynegy | GenOn Energy | NRG Energy | |||||||||||||
2010E Rent-Adjusted EBITDA | 1,690 | 567 | 1,043 | 2,698 | ||||||||||||
Selected Balance Sheet Items: | ||||||||||||||||
Leases | $ | 0 | $ | 633 | $ | 1,344 | $ | 0 | ||||||||
Convertible Preferreds & Minority Interest | 0 | 0 | 0 | 265 | ||||||||||||
Total Debt (book) | 10,826 | 4,825 | 4,568 | 9,270 | ||||||||||||
Total Debt / 2010E Rent-Adjusted EBITDA | 6.4x | 9.6x | 5.7x | 3.5x | ||||||||||||
| • | All debt balances shown as of June 30, 2010 as per company quarterly reports filed on Form 10-Q, unless further adjusted as described below. |
| • | 2010E EBITDA reflects IBES median estimates as of October 13, 2010 for Calpine, GenOn (RRI Energy Inc. and Mirant Corp.; no assumed merger synergies) and NRG. Dynegy reflects summary financial forecast. NRG 2010E IBES median adjusted upwards by $200mm to reflect incremental EBITDA arising from acquisition of Kelson and Dynegy assets announced August 13, 2010 and per NRG management guidance. |
| • | 2010E Rent-Adjusted EBITDA includes addition of assumed $60.0mm rent expense at RRI Energy Inc., $96.0mm rent expense at Mirant Corp., and $50.5mm rent expense at Dynegy. Rent expense figures as per company investor presentations, quarterly filings on Form 10-Q or annual filings on Form 10-K. |
| • | Calpine: Total debt includes $9,526mm of debt as of June 30, 2010, as well as $1,300mm of debt at “New Development Holdings��. $1,100mm of 7.875% Senior Secured Notes raised July 20, 2010 assumed to be “leverage neutral” given that use of proceeds were to repay a portion of the term loan borrowings under Calpine’s existing credit facility. |
| • | GenOn: Total Debt per Summary Unaudited Pro Forma Condensed Combined Consolidated Financial Data in Definitive Proxy Statement filed 15-Sep-2010. Total debt does not include the $650mm project financing for Marsh Landing announced 11-Oct-2010. Lease balances assume $423mm REMA Lease and $921mm MIRMA Lease. |
| • | NRG Energy: Total debt includes $1,100mm 8.25% Senior Notes due 2020 issued on August 17, 2010. |
Annex F
 • $4.50 per share cash offer, representing a substantial premium to pre-announcement stock price – Transaction was announced August 13, 2010 – ~62% premium to August 12, 2010 closing price ($2.78/share) – ~26% premium to prior 30-day average closing price • No financing conditions • Board of Directors received written fairness opinions from Goldman, Sachs & Co. and Greenhill & Co., LLC (5) • Path to completion – Requested FERC approval by October 29, 2010 – California Public Utilities Commission (notice period ends November 11, 2010) – Stockholder approval (meeting scheduled for November 17, 2010) – New York Public Service Commission (expect to receive consent order on or about November 18, 2010) – Concurrent closing of NRG/Blackstone transaction • Expect to close by end of November 2010 Key Transaction Terms Key Transaction Terms 4 Transaction Overview Indexed Stock Performance Since Transaction Announcement (1) Based on shares outstanding as of October 1, 2010. (2) As of June 30, 2010 and includes value of Central Hudson capitalized lease. (3) Based on Summary Financial Forecasts used by Dynegy’s Board of Directors in evaluating the proposed transaction and does not represent Guidance estimates. Adjusted EBITDAR is calculated using estimated 2010, 2011 and 2012 Adjusted EBITDA of $517, $405 and $348 million, respectively, and adjusted to exclude Central Hudson lease expense of ~$50 million as it is included in net debt & other obligations. See definitive proxy statement for details surrounding assumptions. (4) Merchant Power Peers reflect market-capitalization-weighted index which includes Calpine, Mirant, NRG Energy and RRI Energy performance as of October 20, 2010. (5) See definitive proxy statement for the assumptions made, procedures followed, matters considered and limitations on the review undertaken by Goldman Sachs and Greenhill & Co. in connection with their respective opinions. (6) Peer set includes CPN, NRG and RRI (GenOn). CPN basic share count includes 44mm shares held in trust for settlement of future bankruptcy creditor claims and is pro forma for the Conectiv fleet acquisition and sale of Colorado plants . RRI (GenOn) adjusted for merger of RRI Energy and Mirant at 2.835 fixed exchange ratio and includes $150mm of annual synergies per management forecast, with 0%, 50% and 100% achieved in 2010, 2011 and 2012, respectively. NRG not pro forma for any recently announced but uncompleted acquisitions. |
Annex G
Market Capitalization
($ in millions)
| Dynegy | NRG | |||||||
Enterprise Value* | $ | 4,890 | $ | 12,770 | ||||
Equity Market Capitalization | 585 | 5,203 | ||||||
Equity as % of Enterprise Value | 12 | % | 41 | % | ||||
Updated Market Capitalization (Assuming 5% downward enterprise movement)
($ in millions)
Enterprise Value* | $ | 4,645 | $ | 12,131 | ||||
Implied Equity Market Capitalization | 340 | 4,564 | ||||||
Equity as % of Enterprise Value | 7 | % | 38 | % | ||||
5% Enterprise Movement as % Change in Equity | (42 | )% | (12 | )% |
Source: CIQ. As of 10/20/2010.
* -Enterprise Value equals market capitalization plus net indebtedness.
Annex H
Annex I
TEV Analysis March to October
$ mm’s except per share prices
3/12/2010
| TEV* | ||||
CPN | $ | 13,991 | ||
NRG | 12,188 | |||
MIR | 2,526 | |||
RRI | 3,004 | |||
Total | $ | 31,710 | ||
DYN | $ | 4,972 | ||
10/20/2010
| TEV* | ||||
CPN | $ | 14,515 | ||
NRG | 12,770 | |||
MIR | 2,268 | |||
RRI | 2,740 | |||
Total | $ | 32,294 | ||
DYN | $ | 4,890 | ||
* - TEV equals market capitalization plus net indebtedness. Source: CIQ
DYN % Change TEV | ||||
DYN % Change | -1.7 | % | ||
Peers % Change TEV | ||||
CPN % Change | 3.7 | % | ||
NRG % Change | 4.8 | % | ||
MIR % Change | -10.2 | % | ||
RRI % Change | -8.8 | % | ||
Average | -2.6 | % | ||
Annex J
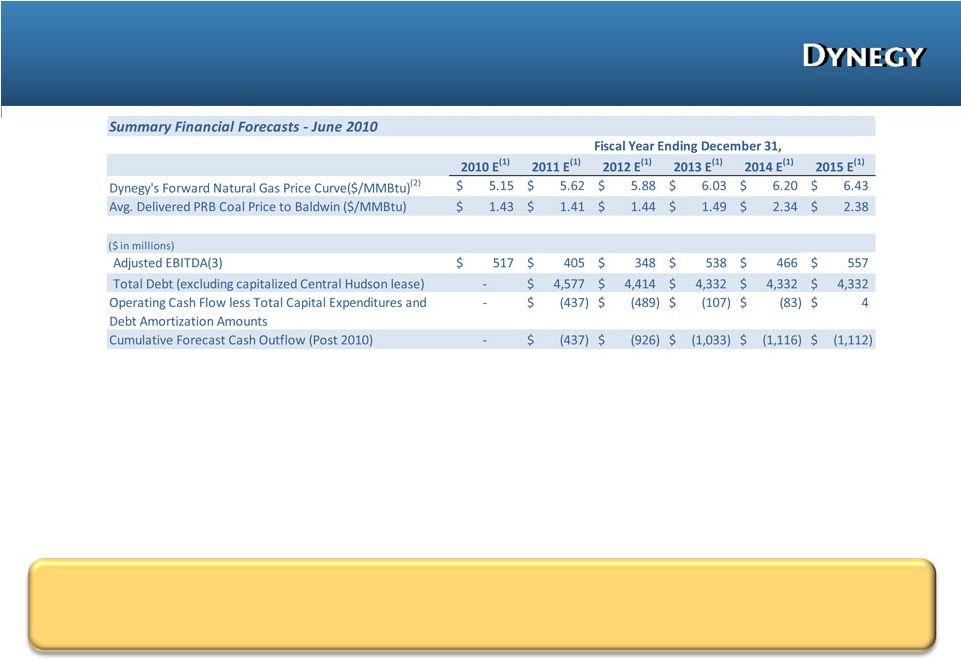 Negative Cash Flow as a Stand-Alone Company Negative Cash Flow as a Stand-Alone Company 16 Based on updated commodity curves as of September 7, 2010, forecasted cumulative cash outflows would be $1.6 billion, reflecting further deterioration Note: The above is a summary of the financial forecasts prepared by management of Dynegy in connection with Board’s consideration of the Blackstone transaction and is not intended as a GAAP reconciliation; reconciliation located in the Appendix. For additional information about these summary financial forecasts, including the assumptions Dynegy management made in preparing them, see the “Summary Financial Forecasts” section of the definitive proxy statement. (1) Forecasted values. (2) Commodity pricing assumptions through 2012 were based upon June 7, 2010 price curves and commodity pricing assumptions after 2012 were based upon June 7, 2010 price curves and adjusted based upon management’s fundamental outlook, which included the assumption of asset retirements by which Dynegy would benefit. (3) Adjusted EBITDA means EBITDA plus other adjustments related to mark-to-market changes. • Dynegy forecasts $1.1 billion of cumulative cash outflows in future years due to: • Low commodity prices • Assumed environmental investments, excluding any contingencies for future legislation/regulation, that may occur • Assumed impact of replacing below market coal transportation contracts that expire at the end of 2013 • Assumed negative impact to Adjusted EBITDA from 2013 to 2014 is ~$140 mm, which also reflects the assumed retirement of Hennepin and Vermillion • $1.1 billion of cumulative cash outflows significantly impairs liquidity, increasing refinancing risk and decreasing ability to react to and to manage unplanned items • High fixed costs, including items such as maintenance capital expenditures and interest expense, which will likely increase |
Annex K
 22 Asset Sales Would Not Create Stockholder Value Asset Sales Would Not Create Stockholder Value & Would Result in a Loss of $1.9 B in Credit Facilities & Would Result in a Loss of $1.9 B in Credit Facilities Under current market conditions, any assets sold today would add significant risk and worsen Dynegy’s financial condition ($ in millions) Assumed cash on hand at year-end 2010 500 Asset sale proceeds 1,363 Liquidity sources 1,863 Assumed collateral (450) Cash outflow (2011 - 2015)* (1,112) Liquidity cushion (300) Lost cash flow on assets sold (2011 - 2015), Net of interest expense savings* (365) Liquidity uses (2,227) Net uses greater than sources (364) *Based on June 7, 2010, pricing Recovery in commodity prices needs to be higher and sooner than forecasted if a meaningful amount of assets are to be sold in today’s market Note: Liquidity cushion needed for working capital, collateral spikes, etc. “Lost cash flow on assets sold (2011-2015), net of interest expense savings” includes ~$830 million of cash flow associated with the four assets that are being sold by Blackstone to NRG Energy and ~$465 million consisting primarily of interest expense savings due to no credit facility in place and less debt. Cash outflow of $1.1 billion is based on the financial forecasts prepared by management of Dynegy in connection with the Board’s consideration of the Blackstone transaction and is based on June 7, 2010, pricing. See appendix for additional information. Calculation of liquidity sources assumes asset sale proceeds from the sale of the same asset package, including sales price, that is being sold by Blackstone to NRG Energy. • Dynegy’s Board previously considered various asset sale packages and concluded that the Blackstone transaction is the best alternative for stockholders – An asset sale similar to Blackstone’s agreed sale of assets to NRG Energy is not permitted, and would result in a loss of Dynegy’s existing $1.9 billion credit facility – Proceeds of the asset sale would be needed to support existing collateral needs AND help fund ~$1.5 billion of currently projected negative cash flows over the next five years Lost cash flow from assets sold, net of interest expense savings, would result in additional negative cash flow of ~$365 million above the $1.1 billion, for a total negative cash flow of $1.5 billion over the next five years Assuming September pricing (instead of June pricing), the $1.5 billion of negative cash flow would be $1.8 billion over the next five years – Any asset sales would increase Dynegy’s leverage and further limit future access to capital markets – Sale of assets would also increase Dynegy’s exposure to Midwest coal market, especially in terms of regulatory and environmental uncertainties and sensitivity to delivered coal costs |
 Reg Reg G Reconciliation G Reconciliation 36 The above is a summary of the financial forecasts prepared by management of Dynegy in connection with Board’s consideration of the Blackstone transaction. For additional information about these summary financial forecasts, including the assumptions Dynegy management made in preparing them, see the “Summary Financial Forecasts” section of the definitive proxy statement. (1) Forecasted values. (2) Commodity pricing assumptions through 2012 were based upon June 7, 2010 price curves and commodity pricing assumptions after 2012 were based upon June 7, 2010 price curves and adjusted based upon management’s fundamental outlook, which included the assumption of asset retirements by which Dynegy would benefit. (3) Adjusted EBITDA means EBITDA plus other adjustments related to mark-to-market changes. Note: |
Annex L