Pioneer Flexible
Opportunities Fund
Semiannual Report | April 30, 2020
| Ticker Symbols: |
Class A | PMARX |
Class C | PRRCX |
Class K | FLEKX |
Class R | MUARX |
Class Y | PMYRX |
Beginning in April 2021, as permitted by regulations adopted by the Securities and Exchange Commission, paper copies of the Fund’s shareholder reports like this one will no longer be sent by mail, unless you specifically request paper copies of the reports from the Fund or from your financial intermediary, such as a broker-dealer, bank or insurance company. Instead, the reports will be made available on the Fund’s website, and you will be notified by mail each time a report is posted and provided with a website link to access the report.
If you already elected to receive shareholder reports electronically, you will not be affected by this change and you need not take any action. You may elect to receive shareholder reports and other communications electronically by contacting your financial intermediary or, if you invest directly with the Fund, by calling 1-800-225-6292.
You may elect to receive all future reports in paper free of charge. If you invest directly with the Fund, you can inform the Fund that you wish to continue receiving paper copies of your shareholder reports by calling 1-800-225-6292. If you invest through a financial intermediary, you can contact your financial intermediary to request that you continue to receive paper copies of your shareholder reports. Your election to receive reports in paper will apply to all funds held in your account if you invest through your financial intermediary or all funds held within the Pioneer Fund complex if you invest directly.
visit us: www.amundipioneer.com/us
| |
|
| 2 |
| 4 |
| 10 |
| 11 |
| 12 |
| 17 |
| 19 |
| 32 |
| 41 |
| 58 |
Pioneer Flexible Opportunities Fund | Semiannual Report | 4/30/20 1
Dear Shareholders,
The new decade has arrived delivering a first quarter that will go down in the history books. The beginning of the year seemed to extend the positive market environment of 2019. Then, March roared in like a lion and the COVID-19 pandemic became a global crisis impacting lives and life as we know it. The impact on the global economy from the COVID-19 virus pandemic, while currently unknown, is likely to be considerable. It is clear that several industries have already felt greater effects than others. And the markets, which do not thrive on uncertainty, have been volatile. Our business continuity plan was implemented given the new COVID-19 guidelines, and most of our employees are working remotely. To date, our operating environment has faced no interruption. I am proud of the careful planning that has taken place and confident we can maintain this environment for as long as is prudent. History in the making for a company that first opened its doors way back in 1928.
Since 1928, Amundi Pioneer’s investment process has been built on a foundation of fundamental research and active management, principles which have guided our investment decisions for more than 90 years. We believe active management – that is, making active investment decisions – can help mitigate the potential risks during periods of market volatility. As the first several months of 2020 have reminded us, investment risk can arise from a number of factors in today’s global economy, including slower or stagnating growth, changing U.S. Federal Reserve policy, oil price shocks, political and geopolitical factors and, unfortunately, major public health concerns such as a viral pandemic.
At Amundi Pioneer, active management begins with our own fundamental, bottom-up research process. Our team of dedicated research analysts and portfolio managers analyze each security under consideration, communicating directly with the management teams of the companies issuing the securities and working together to identify those securities that best meet our investment criteria for our family of funds. Our risk management approach begins with each and every security, as we strive to carefully understand the potential opportunity, while considering any and all risk factors.
2 Pioneer Flexible Opportunities Fund | Semiannual Report | 4/30/20
Today, as investors, we have many options. It is our view that active management can serve shareholders well, not only when markets are thriving, but also during periods of market stress. As you consider your long-term investment goals, we encourage you to work with your financial advisor to develop an investment plan that paves the way for you to pursue both your short-term and long-term goals.
We remain confident that the current crisis, like others in human history, will pass, and we greatly appreciate the trust you have placed in us and look forward to continuing to serve you in the future.
Sincerely,
Lisa M. Jones
Head of the Americas, President and CEO of U.S.
Amundi Pioneer Asset Management USA, Inc.
April 30, 2020
Any information in this shareowner report regarding market or economic trends or the factors influencing the Fund’s historical or future performance are statements of opinion as of the date of this report. Past performance is no guarantee of future results.
Pioneer Flexible Opportunities Fund | Semiannual Report | 4/30/20 3
Portfolio Management Discussion |
4/30/20 In the following discussion, Michele Garau and Howard Weiss review recent market events and describe the factors that affected the performance of Pioneer Flexible Opportunities Fund during the six-month period ended April 30, 2020. Mr. Garau, a senior vice president and a portfolio manager at Amundi Pioneer Asset Management, Inc. (Amundi Pioneer), is responsible for the management of the Fund, along with Mr. Weiss, CFA, a vice president and a portfolio manager at Amundi Pioneer, and Kenneth J. Taubes, Executive Vice President, Chief Investment Officer, U.S., and a portfolio manager at Amundi Pioneer.
Q How did the Fund perform during the six-month period ended April 30, 2020?
A Pioneer Flexible Opportunities Fund’s Class A shares returned -12.56% at net asset value during the six-month period ended April 30, 2020, while the Fund’s benchmark, the Bloomberg Barclays U.S. Treasury TIPS 1-10 Year Index (the Bloomberg Barclays Index), returned 3.08%. During the same period, the average return of the 251 mutual funds in Morningstar’s Tactical Allocation Funds category was -6.36%.
Q How did the financial markets perform during the six-month period ended April 30, 2020?
A Although higher-risk assets posted negative returns over the past six months, the period in fact began on a favorable note in November 2019. Markets generally marched steadily higher from the beginning of November through mid-February, thanks to the combination of steady global economic growth, accommodative central-bank policies, and progress on the U.S.-China trade dispute. The supportive environment abruptly changed in mid-February 2020 once it became clear that the spread of the COVID-19 virus was becoming a global issue and not one limited to specific regions of China. In response, officials around the world enacted virus-containment measures that shut down large swaths of the economies in the United States and other developed markets.
In response, investors quickly recalibrated their expectations to reflect a steep decline in economic growth and corporate earnings in the coming year. The sudden, adverse change in the investment backdrop led to significant market downturns across the full spectrum of riskier assets, including global equities, the credit-sensitive sectors of the bond market, and commodities. On the other hand, categories viewed as “safe havens,”
4 Pioneer Flexible Opportunities Fund | Semiannual Report | 4/30/20
including U.S. Treasuries, gold, and the U.S. dollar (USD) performed well in the flight-to-quality market environment that took hold in February and March.
While stocks and other higher-risk asset classes recovered somewhat in April following extraordinary stimulus efforts from world governments and central banks, they nonetheless closed the full six-month period in negative territory.
Q Could you discuss some of the investment decisions that factored into the Fund’s benchmark-relative performance during the six-month period ended April 30, 2020?
A Although the Fund was positioned in a defensive manner throughout the six-month period, it underperformed the benchmark due to the broader sell-off in the financial markets. In contrast, the Bloomberg Barclays Index gained ground over the period thanks to the strong rally in government bonds. The Fund’s large weighting in equities, the returns of which lagged the benchmark by a wide margin, was the primary reason for the relative underperformance. The Fund’s fixed-income positioning was also a small detractor from benchmark-relative returns during the six-month period given that the portfolio’s holdings were tilted toward credit-sensitive issues rather than developed-market government bonds. A modest allocation to commodities further detracted from the Fund’s benchmark-relative performance.
Q Did the Fund have any exposure to derivatives during the six-month period ended April 30, 2020? If so, how did the use of derivatives affect the Fund’s performance?
A During the six-month period, we used derivatives across a broad spectrum of asset classes to establish specific market or issuer exposure in the portfolio, and to attempt to manage downside risk. The derivative instruments we used included equity, fixed-income, and commodity futures; credit-linked securities; long or short positions in exchange-traded funds (ETFs); forward foreign currency contracts; Treasury futures contracts; and options on both indices and individual securities.
The use of derivatives, after weighing on the Fund’s benchmark-relative returns when the markets were rising, subsequently contributed positively to relative performance once asset prices turned lower in February and March. Overall, however, the use of derivatives was a small minor net detractor from the Fund’s benchmark-relative performance for the six-month period.
Pioneer Flexible Opportunities Fund | Semiannual Report | 4/30/20 5
Despite the underperformance, we believe derivatives continue to offer an efficient way to manage the Fund’s allocations without our having to make material changes to the portfolio’s holdings. Since we use derivatives in an effort to achieve the Fund’s risk/return objectives, we feel they should be evaluated within the context of the entire portfolio, rather than as a stand-alone strategy.
Q Could you discuss the Fund’s positioning as of April 30, 2020?
A We have maintained a defensive portfolio posture while awaiting more clarity regarding both the virus situation and the path for economic recovery. Still, we have continued to favor equities over bonds given the unfavorable valuations in the latter category, and we sought to capitalize on the recent market sell-off by modestly increasing the Fund’s equity weighting. While the current positioning may lead to higher volatility for the Fund in the short term, we believe it is appropriate from a longer-term standpoint. A significant portion of the increase in the portfolio’s equity weighting stemmed from additional exposure to the “bond proxy” sectors – such as real estate investment trusts and utility stocks in Italy and Spain – which we believe offer more compelling yield potential and capital appreciation opportunities than what is currently available within the fixed-income markets.
The Fund’s portfolio has remained globally diversified* through investments in both the U.S. and foreign markets. As of April 30, 2020, the portfolio’s equity holdings represented approximately 80% of invested assets (excluding hedges). At the regional level, the Fund’s equity weightings stood at 36% in North America, 25% in other developed economies (ex-U.S.), and 19% in the emerging markets.
The portfolio’s equity holdings featured a continued underweight position in Europe and an overweight in China. We are certainly aware that China is likely to experience negative economic growth in the near term, but we also think the country may be among the first to recover once the threat from COVID-19 has abated enough to allow for normal or near-normal economic activity. Accordingly, we have maintained Fund allocations to domestic-oriented companies in China, Japan, Hong Kong, and Singapore. In China, the Fund’s investments have been focused on real estate
* | Diversification does not assure a profit nor protect against loss. |
6 Pioneer Flexible Opportunities Fund | Semiannual Report | 4/30/20
developers, online teaching firms, banks, car distributors, and internet companies. The Fund’s portfolio of domestic equities has remained tilted toward defense and health care stocks. We also have continued to emphasize shares of companies with long histories of increasing their dividends**, and those that have effectively reduced their number of net shares outstanding through buybacks. We believe companies in both categories generally have offered compelling fundamental characteristics and valuations.
Fixed-income securities represented roughly 8% of the Fund’s invested assets at the end of April, with the majority of the allocation invested in the United States. Cash and cash equivalents made up the remainder of the portfolio’s investments.
The Fund’s positioning reflects our understanding of the current economic climate. That said, uncertainty persists with respect to how the economic effects of the COVID-19 pandemic will ultimately play out. We therefore have remained focused on determining whether those external considerations may have an effect on our core outlook, which would in turn affect the Fund’s investment orientation.
Please refer to the Schedule of Investments on pages 19–31 for a full listing of Fund securities.
All investments are subject to risk, including the possible loss of principal. In the past several years, financial markets have experienced increased volatility and heightened uncertainty. The market prices of securities may go up or down, sometimes rapidly or unpredictably, due to general market conditions, such as real or perceived adverse economic, political, or regulatory conditions, recessions, inflation, changes in interest or currency rates, lack of liquidity in the bond markets, the spread of infectious illness or other public health issues or adverse investor sentiment. These conditions may continue, recur, worsen or spread.
The Fund has the ability to invest in a wide variety of securities and asset classes.
** Dividends are not guaranteed.
Pioneer Flexible Opportunities Fund | Semiannual Report | 4/30/20 7
The Fund may invest in underlying funds (including ETFs). In addition to the Fund’s operating expenses, you will indirectly bear the operating expenses of investments in any underlying funds.
The Fund and some of the underlying funds employ leverage through the use of derivatives, which increases the volatility of investment returns and subjects the Fund to magnified losses if the Fund or an underlying fund’s investments decline in value.
The Fund and some of the underlying funds may use derivatives, such as options and futures, which can be illiquid, may disproportionately increase losses, and have a potentially large impact on Fund performance.
The Fund and some of the underlying funds may employ short selling, a speculative strategy. Unlike the possible loss on a security that is purchased, there is no limit to the amount of loss on an appreciating security that is sold short.
The Fund may invest in inflation-linked securities. As inflationary expectations increase, inflation-linked securities may become more attractive, because they protect future interest payments against inflation. Conversely, as inflationary concerns decrease, inflation-linked securities will become less attractive and less valuable.
The Fund may invest in credit default swaps, which may in some cases be illiquid, and they increase credit risk since the fund has exposure to both the issuer of the referenced obligation and the counterparty to the credit default swap.
The Fund may invest in subordinated securities, which may be disproportionately adversely affected by a default or even a perceived decline in creditworthiness of the issuer.
The Fund may invest in floating rate loans. The value of collateral, if any, securing a floating rate loan can decline or may be insufficient to meet the issuer’s obligations or may be difficult to liquidate.
The Fund may invest in insurance-linked securities. The return of principal and the payment of interest on insurance-linked bonds are contingent on the non-occurrence of a pre-defined “trigger” event, such as a hurricane or an earthquake of a specific magnitude.
The Fund may invest in commodity-linked derivatives. The value of commodity-linked derivatives may be affected by changes in overall market movements, commodity index volatility, changes in interest rates, factors affecting a particular industry or commodity, international economic, political and regulatory developments, supply and demand, and governmental regulatory policies.
Investments in equity securities are subject to price fluctuation.
Small- and mid-cap stocks involve greater risks and volatility than large-cap stocks.
8 Pioneer Flexible Opportunities Fund | Semiannual Report | 4/30/20
International investments are subject to special risks, including currency fluctuations, and social, economic and political uncertainties, which could increase volatility. These risks are magnified in emerging markets.
Investments in fixed-income securities involve interest rate, credit, inflation, and reinvestment risks. As interest rates rise, the value of fixed-income securities will generally fall.
Prepayment risk is the chance that an issuer may exercise its right to repay its security, if falling interest rates prompt the issuer to do so. Forced to reinvest the unanticipated proceeds at lower interest rates, the Fund would experience a decline in income and lose the opportunity for additional price appreciation.
The Fund may invest in mortgage-backed securities, which during times of fluctuating interest rates may increase or decrease more than other fixed-income securities. Mortgage-backed securities are also subject to prepayments.
High-yield bonds possess greater price volatility, illiquidity, and possibility of default.
These risks may increase share price volatility.
There is no assurance that these and other strategies used by the Fund or underlying funds will be successful.
Please see the prospectus for a more complete discussion of the Fund’s risks.
Before investing, consider the product’s investment objectives, risks, charges and expenses. Contact your advisor or Amundi Pioneer Asset Management, Inc., for a prospectus or summary prospectus containing this information. Read it carefully.
Any information in this shareholder report regarding market or economic trends or the factors influencing the Fund’s historical or future performance are statements of opinion as of the date of this report. Past performance is no guarantee of future results.
Pioneer Flexible Opportunities Fund | Semiannual Report | 4/30/20 9
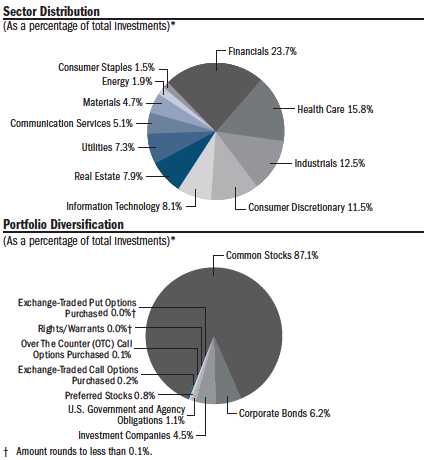
Portfolio Summary |
4/30/20 | | | |
| 10 Largest Holdings | |
(As a percentage of total investments)* | |
| 1. | ETFMG Prime Cyber Security ETF | 4.21% |
| 2. | L3Harris Technologies, Inc. | 2.28 |
| 3. | Booz Allen Hamilton Holding Corp. | 1.86 |
| 4. | Microsoft Corp. | 1.76 |
| 5. | Alibaba Group Holding, Ltd. (A.D.R.) | 1.64 |
| 6. | Abbott Laboratories | 1.58 |
| 7. | Leidos Holdings, Inc. | 1.47 |
| 8. | Iberdrola SA | 1.42 |
| 9. | AbbVie, Inc. | 1.38 |
| 10. | Snam S.p.A. | 1.37 |
* | Excludes temporary cash investments and all derivative contracts except for options purchased. The Fund is actively managed, and current holdings may be different. The holdings listed should not be considered recommendations to buy or sell any securities. |
10 Pioneer Flexible Opportunities Fund | Semiannual Report | 4/30/20
Prices and Distributions | 4/30/20 | |
|
| Net Asset Value per Share | | |
|
| Class | 4/30/20 | 10/31/19 |
| A | $10.34 | $12.04 |
| C | $10.09 | $11.75 |
| K | $10.33 | $12.03 |
| R | $10.24 | $11.75 |
| Y | $10.38 | $12.09 |
| Distributions per Share: 11/1/19 – 4/30/20 | | |
| | Short-Term | Long-Term |
| Class | Dividends | Capital Gains | Capital Gains |
| A | $0.2159 | $ — | $ — |
| C | $0.1710 | $ — | $ — |
| K | $0.2345 | $ — | $ — |
| R | $0.0080 | $ — | $ — |
| Y | $0.2341 | $ — | $ — |
The Bloomberg Barclays U.S. Treasury TIPS 1-10 Year Index is an unmanaged index comprised of U.S. Treasury Inflation Protected Securities (TIPS) having a maturity of at least 1 year and less than 10 years. Index returns are calculated monthly, assume reinvestment of dividends and, unlike Fund returns, do not reflect any fees, expenses or sales charges. It is not possible to invest directly in an index.
The index defined here pertains to the “Value of $10,000 Investment” and “Value of $5 Million Investment” charts on pages 12–16.
Pioneer Flexible Opportunities Fund | Semiannual Report | 4/30/20 11
| | |
Performance Update | 4/30/20 | Class A Shares |
Investment Returns
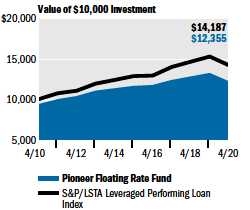
The mountain chart on the right shows the change in value of a $10,000 investment made in Class A shares of Pioneer Flexible Opportunities Fund at public offering price during the periods shown, compared to that of the Bloomberg Barclays U.S. Treasury TIPS 1–10 Year Index.
| Average Annual Total Returns | |
(As of April 30, 2020) | | |
|
| | | BBG |
| | | Barclays |
| Net | Public | U.S. Treasury |
| Asset | Offering | TIPS |
| Value | Price | 1-10 Year |
| Period | (NAV) | (POP) | Index |
Life of Class | | | |
(5/3/2010) | 4.77% | 4.29% | 2.60% |
5 years | 0.15 | -0.77 | 2.41 |
1 year | -11.99 | -15.95 | 6.16 |
| Expense Ratio | | |
(Per prospectus dated March 1, 2020) |
| Gross | Net | | |
1.26% | 1.23% | |
Call 1-800-225-6292 or visit www.amundipioneer.com/us for the most recent month-end performance results. Current performance may be lower or higher than the performance data quoted.
The performance data quoted represents past performance, which is no guarantee of future results. Investment return and principal value will fluctuate, and shares, when redeemed, may be worth more or less than their original cost.
NAV results represent the percent change in net asset value per share. POP returns reflect deduction of maximum 4.50% sales charge. NAV returns would have been lower had sales charges been reflected. All results are historical and assume the reinvestment of dividends and capital gains. Other share classes are available for which performance and expenses will differ.
Performance results reflect any applicable expense waivers in effect during the periods shown. Without such waivers Fund performance would be lower. Waivers may not be in effect for all funds. Certain fee waivers are contractual through a specified period. Otherwise, fee waivers can be rescinded at any time. See the prospectus and financial statements for more information.
The net expense ratio reflects the contractual expense limitation currently in effect through March 1, 2021, for Class A shares. There can be no assurance that Amundi Pioneer will extend the expense limitation beyond such time. Please see the prospectus for more information.
The performance table and graph do not reflect the deduction of fees and taxes that a shareowner would pay on Fund distributions or the redemption of Fund shares.
Please refer to the financial highlights for more current expense ratios.
12 Pioneer Flexible Opportunities Fund | Semiannual Report | 4/30/20
| | |
Performance Update | 4/30/20 | Class C Shares |
Investment Returns
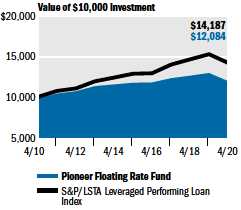
The mountain chart on the right shows the change in value of a $10,000 investment made in Class C shares of Pioneer Flexible Opportunities Fund during the periods shown, compared to that of the Bloomberg Barclays U.S. Treasury TIPS 1–10 Year Index.
| Average Annual Total Returns | |
(As of April 30, 2020) | | |
| | | BBG |
| | | Barclays |
| | | U.S. Treasury |
| | | TIPS |
| If | If | 1-10 Year |
| Period | Held | Redeemed | Index
|
Life of Class | | | |
(5/3/2010) | 3.97% | 3.97% | 2.60% |
5 years | -0.63 | -0.63 | 2.41 |
1 year | -12.72 | -12.72 | 6.16 |
| Expense Ratio | | |
(Per prospectus dated March 1, 2020) |
| Gross | | | |
2.00% | | | |
Call 1-800-225-6292 or visit www.amundipioneer.com/us for the most recent month-end performance results. Current performance may be lower or higher than the performance data quoted.
The performance data quoted represents past performance, which is no guarantee of future results. Investment return and principal value will fluctuate, and shares, when redeemed, may be worth more or less than their original cost.
Class C shares held for less than one year are subject to a 1% contingent deferred sales charge (CDSC). “If Held” results represent the percent change in net asset value per share. NAV returns would have been lower had sales charges been reflected. All results are historical and assume the reinvestment of dividends and capital gains. Other share classes are available for which performance and expenses will differ.
Performance results reflect any applicable expense waivers in effect during the periods shown. Without such waivers Fund performance would be lower. Waivers may not be in effect for all funds. Certain fee waivers are contractual through a specified period. Otherwise, fee waivers can be rescinded at any time. See the prospectus and financial statements for more information.
The performance table and graph do not reflect the deduction of fees and taxes that a shareowner would pay on Fund distributions or the redemption of Fund shares.
Please refer to the financial highlights for more current expense ratios.
Pioneer Flexible Opportunities Fund | Semiannual Report | 4/30/20 13
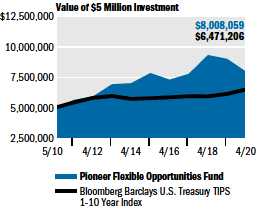
Performance Update | 4/30/20 | Class K Shares |
Investment Returns
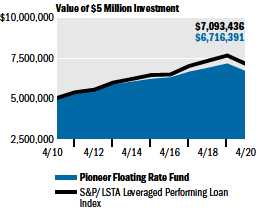
The mountain chart on the right shows the change in value of a $5 million investment made in Class K shares of Pioneer Flexible Opportunities Fund during the periods shown, compared to that of the Bloomberg Barclays U.S. Treasury TIPS 1–10 Year Index.
| Average Annual Total Returns | |
(As of April 30, 2020) | |
| | BBG |
| | Barclays |
| Net | U.S. Treasury |
| Asset | TIPS |
| Value | 1-10 Year |
| Period | (NAV) | Index |
Life of Fund | | |
(5/3/2010) | 4.83% | 2.60% |
5 years | 0.25 | 2.41 |
1 year | -11.75 | 6.16 |
| Expense Ratio | | |
(Per prospectus dated March 1, 2020) |
| Gross | | |
0.91% | | |
Call 1-800-225-6292 or visit www.amundipioneer.com/us for the most recent month-end performance results. Current performance may be lower or higher than the performance data quoted.
The performance data quoted represents past performance, which is no guarantee of future results. Investment return and principal value will fluctuate, and shares, when redeemed, may be worth more or less than their original cost.
The performance shown for Class K shares for the period prior to the commencement of operations of Class K shares on June 22, 2018, is the net asset value performance of the Fund’s Class A shares, which has not been restated to reflect any differences in expenses, including Rule 12b-1 fees applicable to Class A shares. Since fees for Class A shares generally are higher than those of Class K shares, the performance of Class K shares prior to their inception on June 22, 2018, would have been higher than the performance shown. For the period beginning June 22, 2018, the actual performance of Class K shares is reflected. Class K shares are not subject to sales charges and are available for limited groups of eligible investors, including institutional investors. All results are historical and assume the reinvestment of dividends and capital gains.
Performance results reflect any applicable expense waivers in effect during the periods shown. Without such waivers Fund performance would be lower. Waivers may not be in effect for all funds. Certain fee waivers are contractual through a specified period. Otherwise, fee waivers can be rescinded at any time. See the prospectus and financial statements for more information.
The performance table and graph do not reflect the deduction of fees and taxes that a shareowner would pay on Fund distributions or the redemption of Fund shares.
Please refer to the financial highlights for more current expense ratios.
14 Pioneer Flexible Opportunities Fund | Semiannual Report | 4/30/20
Performance Update | 4/30/20 | Class R Shares |
Investment Returns
The mountain chart on the right shows the change in value of a $10,000 investment made in Class R shares of Pioneer Flexible Opportunities Fund during the periods shown, compared to that of the Bloomberg Barclays U.S. Treasury TIPS 1–10 Year Index.
| Average Annual Total Returns | |
(As of April 30, 2020) | |
| | BBG |
| | Barclays |
| Net | U.S. Treasury |
| Asset | TIPS |
| Value | 1-10 Year |
| Period | (NAV) | Index |
Life of Fund | | |
(5/3/2010) | 4.23% | 2.60% |
5 years | -0.74 | 2.41 |
1 year | -13.74 | 6.16 |
| Expense Ratio | | |
(Per prospectus dated March 1, 2020) |
| Gross | | |
2.94% | | |
Call 1-800-225-6292 or visit www.amundipioneer.com/us for the most recent month-end performance results. Current performance may be lower or higher than the performance data quoted.
The performance data quoted represents past performance, which is no guarantee of future results. Investment return and principal value will fluctuate, and shares, when redeemed, may be worth more or less than their original cost.
The performance shown for Class R shares for the period prior to the commencement of operations of Class R shares on September 13, 2013, is based on the performance of Class A shares, reduced to reflect the higher distribution and service fees of Class R shares. For the period beginning September 13, 2013, the actual performance of Class R shares is reflected. Class R shares are not subject to sales charges and are available for limited groups of eligible investors, including institutional investors. All results are historical and assume the reinvestment of dividends and capital gains. Other share classes are available for which performance and expenses will differ.
Performance results reflect any applicable expense waivers in effect during the periods shown. Without such waivers Fund performance would be lower. Waivers may not be in effect for all funds. Certain fee waivers are contractual through a specified period. Otherwise, fee waivers can be rescinded at any time. See the prospectus and financial statements for more information.
The performance table and graph do not reflect the deduction of fees and taxes that a shareowner would pay on Fund distributions or the redemption of Fund shares.
Please refer to the financial highlights for more current expense ratios.
Pioneer Flexible Opportunities Fund | Semiannual Report | 4/30/20 15
Performance Update | 4/30/20 | Class Y Shares |
Investment Returns
The mountain chart on the right shows the change in value of a $5 million investment made in Class Y shares of Pioneer Flexible Opportunities Fund during the periods shown, compared to that of the Bloomberg Barclays U.S. Treasury TIPS 1–10 Year Index.
| Average Annual Total Returns | |
(As of April 30, 2020) | |
| | BBG |
| | Barclays |
| Net | U.S. Treasury |
| Asset | TIPS |
| Value | 1-10 Year |
| Period | (NAV) | Index |
Life of Class | | |
(5/3/2010) | 5.07% | 2.60% |
5 years | 0.42 | 2.41 |
1 year | -11.79 | 6.16 |
| Expense Ratio | | |
(Per prospectus dated March 1, 2020) |
| Gross | Net | |
1.00% | 0.93% | |
Call 1-800-225-6292 or visit www.amundipioneer.com/us for the most recent month-end performance results. Current performance may be lower or higher than the performance data quoted.
The performance data quoted represents past performance, which is no guarantee of future results. Investment return and principal value will fluctuate, and shares, when redeemed, may be worth more or less than their original cost.
Class Y shares are not subject to sales charges and are available for limited groups of eligible investors, including institutional investors. All results are historical and assume the reinvestment of dividends and capital gains. Other share classes are available for which performance and expenses will differ.
Performance results reflect any applicable expense waivers in effect during the periods shown. Without such waivers Fund performance would be lower. Waivers may not be in effect for all funds. Certain fee waivers are contractual through a specified period. Otherwise, fee waivers can be rescinded at any time. See the prospectus and financial statements for more information.
The net expense ratio reflects the contractual expense limitation currently in effect through March 1, 2021, for Class Y shares. There can be no assurance that Amundi Pioneer will extend the expense limitation beyond such time. Please see the prospectus for more information.
The performance table and graph do not reflect the deduction of fees and taxes that a shareowner would pay on Fund distributions or the redemption of Fund shares.
Please refer to the financial highlights for more current expense ratios.
16 Pioneer Flexible Opportunities Fund | Semiannual Report | 4/30/20
Comparing Ongoing Fund Expenses
As a shareowner in the Fund, you incur two types of costs:
(1) | ongoing costs, including management fees, distribution and/or service (12b-1) fees, and other Fund expenses; and |
(2) | transaction costs, including sales charges (loads) on purchase payments. |
This example is intended to help you understand your ongoing expenses (in dollars) of investing in the Fund and to compare these costs with the ongoing costs of investing in other mutual funds. The example is based on an investment of $1,000 at the beginning of the Fund’s latest six-month period and held throughout the six months.
Using the Tables
Actual Expenses
The first table below provides information about actual account values and actual expenses. You may use the information in this table, together with the amount you invested, to estimate the expenses that you paid over the period as follows:
(1) | Divide your account value by $1,000 |
| Example: an $8,600 account value ÷ $1,000 = 8.6 |
(2) | Multiply the result in (1) above by the corresponding share class’s number in the third row under the heading entitled “Expenses Paid During Period” to estimate the expenses you paid on your account during this period. |
Expenses Paid on a $1,000 Investment in Pioneer Flexible Opportunities Fund
Based on actual returns from November 1, 2019 through April 30, 2020.
| Share Class | A | C | K | R | Y |
Beginning Account | $1,000.00 | $1,000.00 | $1,000.00 | $1,000.00 | $1,000.00 |
Value on 11/1/19 | | | | | |
Ending Account | $874.40 | $870.90 | $875.80 | $872.30 | $875.50 |
Value (after expenses) | | | | | |
on 4/30/20 | | | | | |
Expenses Paid | $5.59 | $9.21 | $4.20 | $8.10 | $4.20 |
During Period* | | | | | |
* | Expenses are equal to the Fund’s annualized expense ratio of 1.20%, 1.98%, 0.90%, 1.74% and 0.90% for Class A, Class C, Class K, Class R and Class Y shares, respectively, multiplied by the average account value over the period, multiplied by 182/366 (to reflect the partial year period). |
Pioneer Flexible Opportunities Fund | Semiannual Report | 4/30/20 17
Hypothetical Example for Comparison Purposes
The table below provides information about hypothetical account values and hypothetical expenses based on the Fund’s actual expense ratio and an assumed rate of return of 5% per year before expenses, which is not the Fund’s actual return. The hypothetical account values and expenses may not be used to estimate the actual ending account balance or expenses you paid for the period.
You may use this information to compare the ongoing costs of investing in the Fund and other funds. To do so, compare this 5% hypothetical example with the 5% hypothetical examples that appear in the shareholder reports of the other funds.
Please note that the expenses shown in the tables are meant to highlight your ongoing costs only and do not reflect any transaction costs, such as sales charges (loads) that are charged at the time of the transaction. Therefore, the table below is useful in comparing ongoing costs only and will not help you determine the relative total costs of owning different funds. In addition, if these transaction costs were included, your costs would have been higher.
Expenses Paid on a $1,000 Investment in Pioneer Flexible Opportunities Fund
Based on a hypothetical 5% return per year before expenses, reflecting the period from November 1, 2019 through April 30, 2020.
| Share Class | A | C | K | R | Y |
Beginning Account | $1,000.00 | $1,000.00 | $1,000.00 | $1,000.00 | $1,000.00 |
Value on 11/1/19 | | | | | |
Ending Account | $1,018.90 | $1,015.02 | $1,020.39 | $1,016.21 | $1,020.39 |
Value (after expenses) | | | | | |
on 4/30/20 | | | | | |
Expenses Paid | $6.02 | $9.92 | $4.52 | $8.72 | $4.52 |
During Period* | | | | | |
* | Expenses are equal to the Fund’s annualized expense ratio of 1.20%, 1.98%, 0.90%, 1.74% and 0.90% for Class A, Class C, Class K, Class R and Class Y shares, respectively, multiplied by the average account value over the period, multiplied by 182/366 (to reflect the partial year period). |
18 Pioneer Flexible Opportunities Fund | Semiannual Report | 4/30/20
Schedule of Investments |
4/30/20 (Consolidated) (unaudited) Shares
| | | Value |
|
| | | UNAFFILIATED ISSUERS — 95.0% | |
| | | COMMON STOCKS — 82.7% of Net Assets | |
| | | Aerospace & Defense — 3.2% | |
| 9,722 | | Curtiss-Wright Corp. | $ 1,007,685 |
| 41,165 | | L3Harris Technologies, Inc. | 7,973,660 |
| 8,118(a) | | Teledyne Technologies, Inc. | 2,643,789 |
| | | Total Aerospace & Defense | $ 11,625,134 |
| | | Air Freight & Logistics — 0.8% | |
| 77,802 | | Cia de Distribucion Integral Logista Holdings SA | $ 1,385,621 |
| 59,000 | | ZTO Express Cayman, Inc. (A.D.R.) | 1,755,840 |
| | | Total Air Freight & Logistics | $ 3,141,461 |
| | | Automobiles — 0.7% | |
| 741,000 | | Geely Automobile Holdings, Ltd. | $ 1,158,582 |
| 30,222 | | Porsche Automobil Holding SE | 1,523,692 |
| | | Total Automobiles | $ 2,682,274 |
| | | Banks — 4.4% | |
| 243,830 | | Bank for Foreign Trade of Vietnam JSC | $ 707,689 |
| 69,272 | | BAWAG Group AG (144A) | 2,353,600 |
| 12,232 | | BNP Paribas SA | 384,179 |
| 457,000 | | China Construction Bank Corp., Class H | 372,597 |
| 196,331(a) | | FinecoBank Banca Fineco S.p.A. | 2,180,519 |
| 5,950 | | First Republic Bank | 620,525 |
| 29,176 | | JPMorgan Chase & Co. | 2,793,893 |
| 19,145 | | KBC Group NV | 1,033,378 |
| 3,072,000 | | Postal Savings Bank of China Co., Ltd., | |
| | | Class H (144A) | 1,842,808 |
| 241,600 | | Public Bank Bhd | 920,756 |
| 295,427 | | Sberbank of Russia PJSC (A.D.R.) | 3,104,938 |
| | | Total Banks | $ 16,314,882 |
| | | Biotechnology — 3.6% | |
| 58,899 | | AbbVie, Inc. | $ 4,841,498 |
| 14,100 | | Amgen, Inc. | 3,373,002 |
| 7,797(a) | | Biogen, Inc. | 2,314,384 |
| 3,133(a) | | Regeneron Pharmaceuticals, Inc. | 1,647,582 |
| 5,013(a) | | Vertex Pharmaceuticals, Inc. | 1,259,266 |
| | | Total Biotechnology | $ 13,435,732 |
| | | Building Products — 0.5% | |
| 1,315,000 | | China Lesso Group Holdings, Ltd. | $ 1,869,447 |
| | | Total Building Products | $ 1,869,447 |
| | | Capital Markets — 1.3% | |
| 68,283 | | AllianceBernstein Holding LP | $ 1,599,188 |
| 49,326 | | Banca Generali S.p.A. | 1,224,247 |
The accompanying notes are an integral part of these financial statements.
Pioneer Flexible Opportunities Fund | Semiannual Report | 4/30/20 19
Schedule of Investments | 4/30/20 (Consolidated) (unaudited) (continued)
Shares
| | | Value |
|
| | | Capital Markets — (continued) | |
| 6,472 | | DWS Group GmbH & Co. KGaA (144A) | $ 204,866 |
| 6,041 | | S&P Global, Inc. | 1,769,288 |
| | | Total Capital Markets | $ 4,797,589 |
| | | Chemicals — 0.2% | |
| 2,715 | | Ecolab, Inc. | $ 525,352 |
| 1,402,000 | | Sinopec Shanghai Petrochemical Co., Ltd., Class H | 385,242 |
| | | Total Chemicals | $ 910,594 |
| | | Commercial Services & Supplies — 3.9% | |
| 732,000 | | A-Living Services Co., Ltd., Class H (144A) | $ 4,032,225 |
| 448,000 | | Country Garden Services Holdings Co., Ltd. | 2,080,589 |
| 19,236 | | Republic Services, Inc. | 1,506,948 |
| 42,500 | | Secom Co., Ltd. | 3,570,579 |
| 34,534 | | Waste Management, Inc. | 3,454,091 |
| | | Total Commercial Services & Supplies | $ 14,644,432 |
| | | Construction Materials — 0.7% | |
| 137,316 | | Buzzi Unicem S.p.A. | $ 2,689,944 |
| | | Total Construction Materials | $ 2,689,944 |
| | | Consumer Discretionary — 1.1% | |
| 2,390,000 | | China New Higher Education Group, Ltd. (144A) | $ 1,254,868 |
| 175,118(a) | | Vipshop Holdings, Ltd. (A.D.R.) | 2,789,629 |
| | | Total Consumer Discretionary | $ 4,044,497 |
| | | | Diversified Consumer Services — 1.2% | |
| 555,000 | | China Education Group Holdings, Ltd. | $ 935,065 |
| 2,974,000 | | China Yuhua Education Corp., Ltd. (144A) | 2,992,550 |
| 1,036,000 | | Wisdom Education International Holdings Co., Ltd. | 438,369 |
| | | Total Diversified Consumer Services | $ 4,365,984 |
| | | | Diversified Financial Services — 0.2% | |
| 8,618 | | Wendel SE | $ 736,265 |
| | | Total Diversified Financial Services | $ 736,265 |
| | | Diversified Telecommunication Services — 0.1% | |
| 1,634,000 | | China Tower Corp., Ltd., Class H (144A) | $ 366,781 |
| | | Total Diversified Telecommunication Services | $ 366,781 |
| | | Electric Utilities — 4.0% | |
| 10,599 | | Duke Energy Corp. | $ 897,311 |
| 178,844 | | Endesa SA | 3,966,728 |
| 637,103 | | Enel S.p.A. | 4,351,599 |
| 495,952 | | Iberdrola SA | 4,964,996 |
| 206,137(a) | | Public Power Corp., SA | 598,322 |
| | | Total Electric Utilities | $ 14,778,956 |
The accompanying notes are an integral part of these financial statements.
20 Pioneer Flexible Opportunities Fund | Semiannual Report | 4/30/20
| Shares | | | | Value |
|
| | | Electrical Equipment — 0.4% | |
| 9,134 | | Rockwell Automation, Inc. | $ 1,730,710 |
| | | Total Electrical Equipment | $ 1,730,710 |
| | | Equity Real Estate Investment | |
| | | Trusts (REITs) — 4.4% | |
| 957,100 | | Ascendas Real Estate Investment Trust | $ 2,016,377 |
SGD | 913,200 | | Ascott Residence Trust | 579,758 |
| 1,204,682 | | Frasers Logistics & Industrial Trust | 905,808 |
| 1,308 | | GLP J-Reit | 1,692,584 |
| 20,756 | | Healthpeak Properties, Inc. | 542,562 |
| 4,624 | | ICADE | 355,286 |
| 1,988 | | Ichigo Office REIT Investment Corp. | 1,268,640 |
| 1,335 | | Industrial & Infrastructure Fund Investment Corp. | 1,868,265 |
| 177 | | Kenedix Office Investment Corp. | 890,078 |
| 182 | | Kenedix Residential Next Investment Corp. | 289,339 |
| 488,600 | | Mapletree Industrial Trust | 883,795 |
| 385,800 | | Mapletree Logistics Trust | 492,598 |
| 82,340 | | Medical Properties Trust, Inc. | 1,411,308 |
| 600 | | Nippon Prologis REIT, Inc. | 1,654,709 |
| 147 | | NIPPON REIT Investment Corp. | 443,667 |
| 293 | | Nomura Real Estate Master Fund, Inc. | 337,872 |
| 222,000 | | Parkway Life Real Estate Investment Trust | 519,667 |
| | | Total Equity Real Estate Investment Trusts (REITs) | $ 16,152,313 |
| | | Financials — 0.2% | |
| 992,581(a) | | Alpha Bank AE | $ 725,145 |
| | | Total Financials | $ 725,145 |
| | | Food Products — 1.4% | |
| 35,497 | | Archer-Daniels-Midland Co. | $ 1,318,359 |
| 911,000 | | China Feihe, Ltd. (144A) | 1,899,178 |
| 18,282 | | Nestle SA | 1,929,304 |
| | | Total Food Products | $ 5,146,841 |
| | | Gas Utilities — 2.8% | |
| 151,228 | | Enagas SA | $ 3,526,476 |
| 181,900 | | ENN Energy Holdings, Ltd. | 2,055,619 |
| 1,068,587 | | Snam S.p.A. | 4,784,690 |
| | | Total Gas Utilities | $ 10,366,785 |
| | | Health Care Equipment & Supplies — 3.7% | |
| 60,206 | | Abbott Laboratories | $ 5,544,370 |
| 18,858 | | Danaher Corp. | 3,082,529 |
| 6,394(a) | | IDEXX Laboratories, Inc. | 1,774,974 |
| 84,800 | | Olympus Corp. | 1,365,139 |
The accompanying notes are an integral part of these financial statements.
Pioneer Flexible Opportunities Fund | Semiannual Report | 4/30/20 21
Schedule of Investments | 4/30/20 (Consolidated) (unaudited) (continued)
| | | | | |
Shares
| | | Value |
|
| | | Health Care Equipment & Supplies — (continued) | |
| 1,400,000(a) | | PW Medtech Group, Ltd. | $ 213,116 |
| 7,985 | | Stryker Corp. | 1,488,644 |
| | | Total Health Care Equipment & Supplies | $ 13,468,772 |
| | | Health Care Providers & Services — 1.6% | |
| 6,122 | | Anthem, Inc. | $ 1,718,629 |
| 4,445 | | Cigna Corp. | 870,242 |
| 8,906 | | Humana, Inc. | 3,400,489 |
| | | Total Health Care Providers & Services | $ 5,989,360 |
| | | | Hotels, Restaurants & Leisure — 0.5% | |
| 113,000 | | Galaxy Entertainment Group, Ltd. | $ 735,437 |
| 19,880 | | Las Vegas Sands Corp. | 954,638 |
| | | Total Hotels, Restaurants & Leisure | $ 1,690,075 |
| | | Household Durables — 1.0% | |
| 18,497 | | Berkeley Group Holdings Plc | $ 974,822 |
| 95,775 | | Persimmon Plc | 2,660,706 |
| | | Total Household Durables | $ 3,635,528 |
| | | Industrial Conglomerates — 0.3% | |
| 16,200 | | Rheinmetall AG | $ 1,096,926 |
| | | Total Industrial Conglomerates | $ 1,096,926 |
| | | Industrials — 0.5% | |
| 7,994 | | Teleperformance | $ 1,790,567 |
| | | Total Industrials | $ 1,790,567 |
| | | Information Technology — 0.6% | |
| 37,375(a) | | Micron Technology, Inc. | $ 1,789,889 |
| 13,255 | | Samsung Electronics Co., Ltd. | 545,500 |
| | | Total Information Technology | $ 2,335,389 |
| | | Insurance — 4.8% | |
| 25,755 | | Allianz SE | $ 4,764,012 |
| 56,966 | | NN Group NV | 1,647,848 |
| 494,203 | | Poste Italiane S.p.A. (144A) | 4,196,162 |
| 26,918 | | Swiss Re AG | 1,941,909 |
| 87,000 | | Tokio Marine Holdings, Inc. | 4,128,208 |
| 3,076 | | Zurich Insurance Group AG | 978,930 |
| | | Total Insurance | $ 17,657,069 |
| | | | Interactive Media & Services — 2.2% | |
| 2,186(a) | | Alphabet, Inc. | $ 2,943,886 |
| 10,600 | | Dip Corp. | 232,402 |
| 11,100(a) | | LINE Corp. | 545,757 |
The accompanying notes are an integral part of these financial statements.
22 Pioneer Flexible Opportunities Fund | Semiannual Report | 4/30/20
Shares
| | | Value |
|
| | | Interactive Media & Services — (continued) | |
| 66,000 | | Tencent Holdings, Ltd. | $ 3,550,470 |
| 192,500 | | Z Holdings Corp. | 752,507 |
| | | Total Interactive Media & Services | $ 8,025,022 |
| | | Internet & Direct Marketing Retail — 3.8% | |
| 28,325(a) | | Alibaba Group Holding, Ltd. (A.D.R.) | $ 5,740,628 |
| 1,244(a) | | Amazon.com, Inc. | 3,077,656 |
| 11,300 | | ASKUL Corp. | 322,601 |
| 96,968(a) | | JD.com, Inc. (A.D.R.) | 4,179,321 |
| 43,000(a) | | Meituan Dianping, Class B | 575,800 |
| | | Total Internet & Direct Marketing Retail | $ 13,896,006 |
| | | IT Services — 3.9% | |
| 88,705 | | Booz Allen Hamilton Holding Corp. | $ 6,514,495 |
| 17,900 | | GMO internet, Inc. | 393,955 |
| 52,117 | | Leidos Holdings, Inc. | 5,149,681 |
| 2,896 | | Mastercard, Inc. | 796,313 |
| 10,541 | | Science Applications International Corp. | 860,778 |
| 5,117 | | Wirecard AG | 506,660 |
| | | Total IT Services | $ 14,221,882 |
| | | | Life Sciences Tools & Services — 2.2% | |
| 33,872 | | Agilent Technologies, Inc. | $ 2,596,627 |
| 7,686(a) | | Charles River Laboratories International, Inc. | 1,111,934 |
| 12,830 | | Thermo Fisher Scientific, Inc. | 4,293,944 |
| | | Total Life Sciences Tools & Services | $ 8,002,505 |
| | | Machinery — 1.1% | |
| 31,625(a) | | Ingersoll Rand, Inc. | $ 919,655 |
| 1,528,000 | | Sany Heavy Equipment International Holdings | |
| | | Co., Ltd. | 812,132 |
| 73,800 | | Volvo AB, Class B | 954,056 |
| 1,731,000 | | Zoomlion Heavy Industry Science & Technology | |
| | | Co., Ltd., Class H | 1,393,438 |
| | | Total Machinery | $ 4,079,281 |
| | | Media — 0.3% | |
| 13,600 | | CyberAgent, Inc. | $ 576,051 |
| 93,300 | | Macromill, Inc. | 603,227 |
| | | Total Media | $ 1,179,278 |
| | | Metals & Mining — 1.5% | |
| 23,352 | | Anglo American Platinum, Ltd. | $ 1,230,549 |
| 159,855 | | MMC Norilsk Nickel PJSC (A.D.R.) | 4,370,436 |
| | | Total Metals & Mining | $ 5,600,985 |
The accompanying notes are an integral part of these financial statements.
Pioneer Flexible Opportunities Fund | Semiannual Report | 4/30/20 23
Schedule of Investments | 4/30/20 (Consolidated) (unaudited) (continued)
Shares
| | | Value |
|
| | | Mortgage Real Estate Investment | |
| | | Trusts (REITs) — 3.3% | |
| 320,638 | | AGNC Investment Corp. | $ 3,982,324 |
| 431,725 | | Annaly Capital Management, Inc. | 2,698,281 |
| 554,348 | | Redwood Trust, Inc. | 2,272,827 |
| 70,014 | | Starwood Property Trust, Inc. | 905,981 |
| 532,222 | | Two Harbors Investment Corp. | 2,432,254 |
| | | | Total Mortgage Real Estate Investment | |
| | | Trusts (REITs) | $ 12,291,667 |
| | | Multi-Utilities — 0.1% | |
| 101,992 | | Hera S.p.A. | $ 377,363 |
| | | Total Multi-Utilities | $ 377,363 |
| | | | Oil, Gas & Consumable Fuels — 1.9% | |
| 56,870 | | ConocoPhillips | $ 2,394,227 |
| 68,647 | | LUKOIL PJSC (A.D.R.) | 4,432,537 |
| | | Total Oil, Gas & Consumable Fuels | $ 6,826,764 |
| | | Pharmaceuticals — 3.9% | |
| 28,098 | | Johnson & Johnson | $ 4,215,824 |
| 36,200 | | Ono Pharmaceutical Co., Ltd. | 875,068 |
| 7,194 | | Roche Holding AG | 2,499,200 |
| 37,998 | | Sanofi | 3,712,017 |
| 22,446 | | Zoetis, Inc. | 2,902,492 |
| | | Total Pharmaceuticals | $ 14,204,601 |
| | | Professional Services — 0.2% | |
| 111,219 | | Applus Services SA | $ 730,909 |
| | | Total Professional Services | $ 730,909 |
| | | Real Estate — 0.2% | |
| 744,000 | | CIFI Holdings Group Co., Ltd. | $ 565,320 |
| | | Total Real Estate | $ 565,320 |
| | | Real Estate Management & Development — 3.0% | |
| 1,333,200 | | Ascendas India Trust | $ 1,201,039 |
| 314,000 | | China Resources Land, Ltd. | 1,288,139 |
| 187,800 | | City Developments, Ltd. | 1,060,392 |
| 1,566,500(a) | | KWG Group Holdings, Ltd. | 2,307,822 |
| 858,000 | | Longfor Group Holdings, Ltd. (144A) | 4,344,430 |
| 145,000 | | Shimao Property Holdings, Ltd. | 585,488 |
| 7 | | Vinhomes JSC (144A) | 19 |
| 26,000 | | Wheelock & Co., Ltd. | 190,347 |
| | | Total Real Estate Management & Development | $ 10,977,676 |
The accompanying notes are an integral part of these financial statements.
24 Pioneer Flexible Opportunities Fund | Semiannual Report | 4/30/20
| Shares | | | Value |
|
| | | Software — 3.2% | |
| 11,391(a) | | Adobe, Inc. | $ 4,028,313 |
| 27,500 | | Infomart Corp. | 192,424 |
| 34,459 | | Microsoft Corp. | 6,175,398 |
| 14,000(a) | | Money Forward, Inc. | 656,995 |
| 7,483(a) | | Zendesk, Inc. | 575,293 |
| | | Total Software | $ 11,628,423 |
| | | Specialty Retail — 2.1% | |
| 1,594,000 | | China Meidong Auto Holdings, Ltd. | $ 2,866,533 |
| 2,398,000 | | China Yongda Automobiles Services Holdings, Ltd. | 2,431,518 |
| 620,500 | | Zhongsheng Group Holdings, Ltd. | 2,505,486 |
| | | Total Specialty Retail | $ 7,803,537 |
| | | Textiles, Apparel & Luxury Goods — 0.6% | |
| 5,723 | | LVMH Moet Hennessy Louis Vuitton SE | $ 2,209,298 |
| | | Total Textiles, Apparel & Luxury Goods | $ 2,209,298 |
| | | Wireless Telecommunication Services — 1.1% | |
| 116,500 | | China Mobile, Ltd. | $ 938,565 |
| 76,400 | | KDDI Corp. | 2,216,053 |
| 29,800 | | NTT DOCOMO, Inc. | 875,219 |
| | | Total Wireless Telecommunication Services | $ 4,029,837 |
| | | TOTAL COMMON STOCKS | |
| | | (Cost $293,923,505) | $ 304,839,806 |
| | | PREFERRED STOCKS — 0.8% of Net Assets | |
| | | | Equity Real Estate Investment Trusts | |
| | | (REITs) — 0.0%† | |
| 204^(a) | | Wheeler Real Estate Investment Trust, Inc. | $ 63,363 |
| | | Total Equity Real Estate Investment Trusts (REITs) | $ 63,363 |
| | | | Mortgage Real Estate Investment Trusts | |
| | | (REITs) — 0.8% | |
| 74,936(c)(d) | | AGNC Investment Corp., 6.125% (3 Month | |
| | | USD LIBOR + 470 bps) | $ 1,630,607 |
| 54,705(c)(d) | | AGNC Investment Corp., 7.0% (3 Month USD | |
| | | LIBOR + 511 bps) | 1,258,215 |
| | | | Total Mortgage Real Estate Investment | |
| | | Trusts (REITs) | $ 2,888,822 |
| | | TOTAL PREFERRED STOCKS | |
| | | (Cost $2,192,947) | $ 2,952,185 |
| Principal | | | |
| Amount USD ($) | | | |
|
| | CORPORATE BONDS — 5.9% of Net Assets | |
| | Banks — 1.9% | |
| 2,238,000(c)(d) | | Bank of America Corp., 4.3% (3 Month USD | |
| | LIBOR + 266 bps) | $ 2,011,402 |
The accompanying notes are an integral part of these financial statements.
Pioneer Flexible Opportunities Fund | Semiannual Report | 4/30/20 25
Schedule of Investments | 4/30/20 (Consolidated) (unaudited) (continued)
| | | | |
| Principal | | | |
| Amount USD ($) | | | Value |
|
| | Banks — (continued) | |
| 3,216,000(c)(d) | | Intesa Sanpaolo S.p.A., 7.7% (5 Year USD Swap | |
| | | Rate + 546 bps) (144A) | $ 2,990,880 |
| 2,163,000(c)(d) | | JPMorgan Chase & Co., 4.6% (SOFRRATE + 313 bps) | 1,940,211 |
| | | Total Banks | $ 6,942,493 |
| | | Chemicals — 0.5% | |
| 1,800,000(b) | | Braskem Finance, Ltd., 6.45%, 2/3/24 | $ 1,768,518 |
| | | Total Chemicals | $ 1,768,518 |
| | | Mining — 1.5% | |
| 1,142,000 | | Gold Fields Orogen Holdings BVI, Ltd., 5.125%, | |
| | | 5/15/24 (144A) | $ 1,166,325 |
| 3,170,000 | | Gold Fields Orogen Holdings BVI, Ltd., | |
| | | 6.125%, 5/15/29 (144A) | 3,345,143 |
| 1,039,000 | | Teck Resources, Ltd., 6.125%, 10/1/35 | 1,039,422 |
| | | Total Mining | $ 5,550,890 |
| | | Packaging & Containers — 0.8% | |
| 3,000,000 | | Sealed Air Corp., 5.125%, 12/1/24 (144A) | $ 3,135,000 |
| | | Total Packaging & Containers | $ 3,135,000 |
| | | Telecommunications — 1.2% | |
| 4,400,000 | | CenturyLink, Inc., 7.65%, 3/15/42 | $ 4,400,000 |
| | | Total Telecommunications | $ 4,400,000 |
| | | TOTAL CORPORATE BONDS | |
| | | (Cost $21,636,681) | $ 21,796,901 |
| | | U.S. GOVERNMENT AND AGENCY OBLIGATION — | |
| | | 1.1% of Net Assets | |
| 4,000,000(e) | | U.S. Treasury Bills, 5/5/20 | $ 3,999,979 |
| | | TOTAL U.S. GOVERNMENT AND AGENCY OBLIGATION | |
| | (Cost $3,999,970) | $ 3,999,979 |
| Shares | | | |
| | | INVESTMENT COMPANIES — 4.3% | |
| | of Net Assets | |
| 368,722 | | ETFMG Prime Cyber Security ETF | $ 14,752,567 |
| 78,957 | | VanEck Vectors Vietnam ETF | 983,015 |
| | TOTAL INVESTMENT COMPANIES | |
| | (Cost $15,620,816) | $ 15,735,582 |
| | RIGHT/WARRANT — 0.0%† of Net Assets | |
| | Pharmaceuticals — 0.0%† | |
| 19,289(a) | | Bristol-Myers Squibb Co., 3/31/21 | $ 86,993 |
| | Total Pharmaceuticals | $ 86,993 |
| | TOTAL RIGHT/WARRANT | |
| | (Cost $2) | $ 86,993 |
The accompanying notes are an integral part of these financial statements.
|
26 Pioneer Flexible Opportunities Fund | Semiannual Report | 4/30/20
| Number of | | | | | Strike | | Expiration | | |
| Contracts | Description | Counterparty | Notional
| | Price | | Date | Value
|
| | | EXCHANGE-TRADED CALL OPTIONS | | | | | |
| | PURCHASED — 0.2% | | | | | |
1,470
| Booz Allen | Citibank NA | USD | 410,105 | USD | 75 | 6/19/20 | $ 543,900 |
| Hamilton | | | | | | | | |
| Holding Co. | | | | | | | | |
500
| L3Harris | Citibank NA | USD | 370,960 | USD | 220 | 5/15/20 | | 33,750 |
| Technologies, Inc. | | | | | | | | |
| | | | | | | | $ 577,650 |
| | TOTAL EXCHANGE-TRADED CALL | | | | |
| | OPTIONS PURCHASED | | | | | |
| | (Premiums paid $781,065) | | | | $ 577,650 |
| | | EXCHANGE-TRADED PUT OPTION | | | | | |
| | PURCHASED — 0.0%† | | | | | |
1,800
| 10-Year T-Note | Citibank NA | USD | 635,894 | USD | 130 | 5/22/20 | $ 28,125 |
| Futures | | | | | | | | |
| | TOTAL EXCHANGE-TRADED PUT | | | | |
| | OPTION PURCHASED | | | | | | |
| | (Premiums paid $635,894) | | | | $ 28,125 |
| | OVER THE COUNTER (OTC) CALL OPTIONS | | |
| | PURCHASED — 0.0%† | | | | | |
971,750
| Galaxy | Citibank NA | HKD | 489,901 | HKD | 57.5 | 7/30/20 | $ 165,391 |
| Entertainment | | | | | | | | |
| Group, Ltd. | | | | | | | | |
13,315
| S&P 500 | Citibank NA | USD1,507,518 | USD | 3090 | 5/15/20 | | 71,207 |
| Index | | | | | | | | |
| | | | | | | | $ 236,598 |
| | TOTAL OVER THE COUNTER (OTC) CALL | |
| | OPTIONS PURCHASED | |
| | (Premiums paid $1,997,419) | $ 236,598 |
| | TOTAL OPTIONS PURCHASED | |
| | (Premiums paid $3,414,378) | $ 842,373 |
| | TOTAL INVESTMENTS IN UNAFFILIATED | |
| | ISSUERS — 95.0% | |
| | (Cost $340,788,299) | $ 350,253,819 |
| | OTHER ASSETS AND LIABILITIES — 5.0% | $ 18,514,298 |
| | NET ASSETS — 100.0% | $ 368,768,117 |
bps | Basis Points. |
LIBOR | London Interbank Offered Rate. |
REIT | Real Estate Investment Trust. |
SOFRRATE | Secured Overnight Financing Rate. |
(144A) | Security is exempt from registration under Rule 144A of the Securities Act of 1933. Such securities may be resold normally to qualified institutional buyers in a transaction exempt from registration. At April 30, 2020, the value of these securities amounted to $34,124,835, or 9.3% of net assets.
|
The accompanying notes are an integral part of these financial statements.
Pioneer Flexible Opportunities Fund | Semiannual Report | 4/30/20 27
Schedule of Investments | 4/30/20 (Consolidated) (unaudited) (continued)
(A.D.R.) American Depositary Receipts.
| † | Amount rounds to less than 0.1%. |
| ^ | Security is valued using fair value methods (other than supplied by independent pricing services). |
| (a) | Non-income producing security. |
(b)
| All or a portion of this security is held by Flexible Opportunities Commodity Fund Ltd. (formerly, Pioneer Cayman Commodity Fund Ltd.). |
(c)
| The interest rate is subject to change periodically. The interest rate and/or reference index and spread shown at April 30, 2020. |
(d)
| Security is perpetual in nature and has no stated maturity date. |
(e)
| Security issued with a zero coupon. Income is recognized through accretion of discount. |
| FUTURES CONTRACTS | | | | |
| CURRENCY FUTURES CONTRACT | | | |
| Number of | | | | | | | | | | | | |
| Contracts | | | Expiration | | Notional | | | Market | | | Unrealized | |
| Short | | Description | Date | | Amount | | | Value | | | Appreciation | |
| | 139 | | Euro | 6/15/20 | | $ | 19,370,062 | | | $ | 19,046,475 | | | $ | 323,587 | |
| Number of | | | | | | | | | | | Unrealized | |
| Contracts | | | Expiration | | Notional | | | Market | | | Appreciation | |
| Short | | Description | Date | | Amount | | | Value | | | (Depreciation) | |
| | 831 | | Euro Stoxx 50 | 6/19/20 | | $ | 23,723,891 | | | $ | 26,277,309 | | | $ | (2,553,418 | ) |
| | 113 | | FTSE/JSE Top 40 | 6/18/20 | | | 2,144,749 | | | | 2,846,906 | | | | (702,157 | ) |
| | 176 | | FTSE/MIB | 6/19/20 | | | 16,587,496 | | | | 16,926,415 | | | | (338,919 | ) |
| | 125 | | IBEX 35 | 5/15/20 | | | 9,504,750 | | | | 9,470,237 | | | | 34,513 | |
| | 40 | | Nikkei 225 | 6/11/20 | | | 7,111,256 | | | | 7,486,122 | | | | (374,866 | ) |
| | 131 | | S&P 500 E-MINI | 6/19/20 | | | 15,485,615 | | | | 19,011,375 | | | | (3,525,760 | ) |
| | | | | | | $ | 74,557,757 | | | $ | 82,018,364 | | | $ | (7,460,607 | ) |
| TOTAL FUTURES CONTRACTS | | | $ | 93,927,819 | | | $ | 101,064,839 | | | $ | (7,137,020 | ) |
| SWAPS CONTRACTS | | | | | | |
| OVER THE COUNTER (OTC) TOTAL RETURN SWAPS CONTRACTS — SELL PROTECTION | |
| | | | | | | | | Unrealized | | | | |
| Notional | | | Reference | Pay/ | | Expiration | | Appreciation | | | Market | |
Amount(1) | | Counterparty | Obligation/Index | Receive(2) | Coupon | Date | | (Depreciation) | | | Value | |
| | 3,169,973 | | Goldman Sachs | Goldman Sachs | Pay | 3M LIBOR | 6/29/20 | | $ | 346,917 | | | $ | 346,917 | |
| | | | International | Total Cash | | + 39bps | | | | | | | | | |
| | | | | Return Index* | | | | | | | | | | | |
| | 4,592,565 | | Goldman Sachs | Goldman Sachs | Pay | 3M LIBOR | 9/10/20 | | | (366,969 | ) | | | (366,969 | ) |
| | | | International | Total Cash | | + 39bps | | | | | | | | | |
| | | | | Return Index* | | | | | | | | | | | |
| | 5,335,891 | | Goldman Sachs | Goldman Sachs | Pay | 3M LIBOR | 11/26/20 | | | (934,584 | ) | | | (934,584 | ) |
| | | | International | Total Cash | | + 39bps | | | | | | | | | |
| | | | | Return Index* | | | | | | | | | | | |
| TOTAL SWAPS CONTRACTS | | | | | | $ | (954,636 | ) | | $ | (954,636 | ) |
The accompanying notes are an integral part of these financial statements.
28 Pioneer Flexible Opportunities Fund | Semiannual Report | 4/30/20
(1) | The notional amount is the maximum amount that a seller of credit protection would be obligated to pay upon occurrence of a credit event. |
(2) | Pays quarterly. |
Principal amounts are denominated in U.S. dollars (“USD”) unless otherwise noted.
HKD — Hong Kong Dollar
SGD — Singapore Dollar
* | The following table shows the individual positions and related values of the securities underlying each total return swap contract with Goldman Sachs International, as of April 30, 2020. |
| | Share | | | SECURITY | | | | |
| Name | | Allocation | | | VALUE | | | % of basket | |
AbbVie Inc | | | 1,180 | | | $ | (97,029 | ) | | | 2.56 | % |
AES Corp/The | | | 6,882 | | | | (91,185 | ) | | | 2.41 | % |
American Airlines Group Inc | | | 1,826 | | | | (21,933 | ) | | | 0.58 | % |
American International Group Inc | | | 1,278 | | | | (32,496 | ) | | | 0.86 | % |
Ameriprise Financial Inc | | | 609 | | | | (69,973 | ) | | | 1.85 | % |
AmerisourceBergen Corp | | | 949 | | | | (85,052 | ) | | | 2.25 | % |
Apple Inc | | | 542 | | | | (159,194 | ) | | | 4.21 | % |
Applied Materials Inc | | | 1,917 | | | | (95,218 | ) | | | 2.52 | % |
Archer-Daniels-Midland Co | | | 1,701 | | | | (63,186 | ) | | | 1.67 | % |
Assurant Inc | | | 809 | | | | (85,920 | ) | | | 2.27 | % |
Boeing Co/The | | | 421 | | | | (59,387 | ) | | | 1.57 | % |
Capital One Financial Corp | | | 968 | | | | (62,710 | ) | | | 1.66 | % |
Capri Holdings Ltd | | | 2,085 | | | | (31,797 | ) | | | 0.84 | % |
CenturyLink Inc | | | 3,032 | | | | (32,201 | ) | | | 0.85 | % |
Cigna Corp | | | 309 | | | | (60,466 | ) | | | 1.60 | % |
Corning Inc | | | 2,698 | | | | (59,381 | ) | | | 1.57 | % |
DENTSPLY SIRONA Inc | | | 1,231 | | | | (52,235 | ) | | | 1.38 | % |
Discover Financial Services | | | 1,244 | | | | (53,436 | ) | | | 1.41 | % |
eBay Inc | | | 2,330 | | | | (92,790 | ) | | | 2.45 | % |
Equity Residential | | | 1,205 | | | | (78,412 | ) | | | 2.07 | % |
F5 Networks Inc | | | 603 | | | | (83,939 | ) | | | 2.22 | % |
General Electric Co | | | 2,685 | | | | (18,257 | ) | | | 0.48 | % |
Gilead Sciences Inc | | | 1,135 | | | | (95,378 | ) | | | 2.52 | % |
HCA Healthcare Inc | | | 924 | | | | (101,560 | ) | | | 2.68 | % |
HP Inc | | | 4,136 | | | | (64,145 | ) | | | 1.70 | % |
LyondellBasell Industries NV | | | 918 | | | | (53,215 | ) | | | 1.41 | % |
McDonald’s Corp | | | 556 | | | | (104,329 | ) | | | 2.76 | % |
Monster Beverage Corp | | | 1,715 | | | | (106,014 | ) | | | 2.80 | % |
Motorola Solutions Inc | | | 905 | | | | (130,201 | ) | | | 3.44 | % |
Navient Corp | | | 5,121 | | | | (39,020 | ) | | | 1.03 | % |
NetApp Inc | | | 1,953 | | | | (85,491 | ) | | | 2.26 | % |
NRG Energy Inc | | | 4,606 | | | | (154,425 | ) | | | 4.08 | % |
ONEOK Inc | | | 1,479 | | | | (44,281 | ) | | | 1.17 | % |
Procter & Gamble Co/The | | | 891 | | | | (105,055 | ) | | | 2.78 | % |
PulteGroup Inc | | | 3,433 | | | | (97,061 | ) | | | 2.56 | % |
Qorvo Inc | | | 1,144 | | | | (112,159 | ) | | | 2.96 | % |
The accompanying notes are an integral part of these financial statements.
Pioneer Flexible Opportunities Fund | Semiannual Report | 4/30/20 29
Schedule of Investments | 4/30/20 (Consolidated) (unaudited) (continued)
| | Share | | | SECURITY | | | | |
| Name | | Allocation | | | VALUE | | | % of basket | |
Quest Diagnostics Inc | | | 738 | | | $ | (81,230 | ) | | | 2.15 | % |
Seagate Technology PLC | | | 1,847 | | | | (92,282 | ) | | | 2.44 | % |
Sysco Corp | | | 1,472 | | | | (82,841 | ) | | | 2.19 | % |
Target Corp | | | 1,394 | | | | (152,936 | ) | | | 4.04 | % |
TransDigm Group Inc | | | 315 | | | | (114,538 | ) | | | 3.03 | % |
Tyson Foods Inc | | | 1,211 | | | | (75,328 | ) | | | 1.99 | % |
United Airlines Holdings Inc | | | 1,109 | | | | (32,792 | ) | | | 0.87 | % |
Valero Energy Corp | | | 1,205 | | | | (76,317 | ) | | | 2.02 | % |
ViacomCBS Inc | | | 1,169 | | | | (20,184 | ) | | | 0.53 | % |
Western Union Co/The | | | 3,919 | | | | (74,738 | ) | | | 1.97 | % |
Westinghouse Air Brake Technologies Corp | | | 14 | | | | (812 | ) | | | 0.02 | % |
Weyerhaeuser Co | | | 2,298 | | | | (50,258 | ) | | | 1.33 | % |
Williams Cos Inc/The | | | 2,541 | | | | (49,221 | ) | | | 1.30 | % |
Yum! Brands Inc | | | 1,184 | | | | (102,314 | ) | | | 2.70 | % |
| Total | | | 85,836 | | | $ | (3,784,322 | ) | | | 100.00 | % |
Purchases and sales of securities (excluding temporary cash investments) for the six months ended April 30, 2020, aggregated $521,990,970 and $566,936,746, respectively.
The Fund is permitted to engage in purchase and sale transactions (“cross trades”) with certain funds and accounts for which Amundi Pioneer Asset Management, Inc. (the “Adviser”) serves as the Fund’s investment adviser, as set forth in Rule 17a-7 under the Investment Company Act of 1940, pursuant to procedures adopted by the Board of Trustees. Under these procedures, cross trades are effected at current market prices. During the six months ended April 30, 2020, the Fund did not engage in any cross trade activity.
At April 30, 2020, the net unrealized appreciation on investments based on cost for federal tax purposes of $346,398,885 was as follows:
| Aggregate gross unrealized appreciation for all investments in which | |
| there is an excess of value over tax cost | $ 36,522,874 |
| Aggregate gross unrealized depreciation for all investments in which | |
| there is an excess of tax cost over value | (40,759,596) |
| Net unrealized depreciation | $ (4,236,722) |
Various inputs are used in determining the value of the Fund’s investments. These inputs are summarized in the three broad levels below.
Level 1 – quoted prices in active markets for identical securities.
Level 2 – other significant observable inputs (including quoted prices for similar securities, interest rates, prepayment speeds, credit risks, etc.). See Notes to Financial Statements — Note 1A.
Level 3 – significant unobservable inputs (including the Fund’s own assumptions in determining fair value of investments). See Notes to Financial Statements — Note 1A.
The accompanying notes are an integral part of these financial statements.
30 Pioneer Flexible Opportunities Fund | Semiannual Report | 4/30/20
The following is a summary of the inputs used as of April 30, 2020, in valuing the Fund’s investments:
| | Level 1 | | | Level 2 | | | Level 3 | | | Total | |
Common Stocks | | $ | 304,839,806 | | | $ | — | | | $ | — | | | $ | 304,839,806 | |
Preferred Stocks | | | | | | | | | | | | | | | | |
| Equity Real Estate | | | | | | | | | | | | | | | | |
| Investment Trusts (REITs) | | | — | | | | — | | | | 63,363 | | | | 63,363 | |
| Mortgage Real Estate | | | | | | | | | | | | | | | | |
| Investment Trusts (REITs) | | | 2,888,822 | | | | — | | | | — | | | | 2,888,822 | |
Corporate Bonds | | | — | | | | 21,796,901 | | | | — | | | | 21,796,901 | |
U.S. Government and | | | | | | | | | | | | | | | | |
| Agency Obligation | | | — | | | | 3,999,979 | | | | — | | | | 3,999,979 | |
Investment Companies | | | 15,735,582 | | | | — | | | | — | | | | 15,735,582 | |
Right/Warrant | | | 86,993 | | | | — | | | | — | | | | 86,993 | |
Exchange-Traded Call | | | | | | | | | | | | | | | | |
| Option Purchased | | | 577,650 | | | | — | | | | — | | | | 577,650 | |
Exchange-Traded Put | | | | | | | | | | | | | | | | |
| Option Purchased | | | 28,125 | | | | — | | | | — | | | | 28,125 | |
Over The Counter (OTC) | | | | | | | | | | | | | | | | |
Call Option Purchased | | | — | | | | 236,598 | | | | — | | | | 236,598 | |
| Total Investments | | | | | | | | | | | | | | | | |
| in Securities | | $ | 324,156,978 | | | $ | 26,033,478 | | | $ | 63,363 | | | $ | 350,253,819 | |
| Other Financial Instruments | | | | | | | | | | | | | | | | |
| Net unrealized depreciation | | | | | | | | | | | | | | | | |
| on futures contracts | | $ | (7,137,020 | ) | | $ | — | | | $ | — | | | $ | (7,137,020 | ) |
Swap contracts, at value | | | — | | | | (954,636 | ) | | | — | | | | (954,636 | ) |
| Total Other | | | | | | | | | | | | | | | | |
| Financial Instruments | | $ | (7,137,020 | ) | | $ | (954,636 | ) | | $ | — | | | $ | (8,091,656 | ) |
The following is a reconciliation of assets valued using significant unobservable inputs (Level 3):
| | Preferred | |
| | Stock | |
Balance as of 10/31/19 | | $ | 95,372 | |
Realized gain (loss)(1) | | | — | |
Changed in unrealized appreciation (depreciation)(2) | | | (32,009 | ) |
Accrued discounts/premiums | | | — | |
Purchases | | | — | |
Sales | | | — | |
Transfers in to Level 3* | | | — | |
Transfers out of Level 3* | | | — | |
| Balance as of 4/30/20 | | $ | 63,363 | |
(1) | Realized gain (loss) on these securities is included in the realized gain (loss) from investments on the Statement of Operations (Consolidated). |
(2) | Unrealized appreciation (depreciation) on these securities is included in the change in unrealized appreciation (depreciation) from investments on the Statement of Operations (Consolidated). |
* | Transfers are calculated on the beginning of period values. During the six months ended April 30, 2020, there were no transfers between Levels 1, 2 and 3. |
| | | |
| Net change in unrealized appreciation (depreciation) of Level 3 investments still held and | |
| considered Level 3 at April 30, 2020: |
| $(32,009)
|
The accompanying notes are an integral part of these financial statements.
Pioneer Flexible Opportunities Fund | Semiannual Report | 4/30/20 31
Statement of Assets and Liabilities |
4/30/20 (Consolidated) (unaudited) | ASSETS: | | | |
| Investments in unaffiliated issuers, at value (cost $340,788,299) | | $ | 350,253,819 | |
| Cash | | | 1,554,554 | |
| Foreign currencies, at value (cost $2,781,111) | | | 2,425,126 | |
| Futures collateral | | | 1,424,801 | |
| Swaps collateral | | | 5,650,000 | |
| Due from broker for futures | | | 16,902,322 | |
| Due from broker for options | | | 333,437 | |
| Variation margin for futures contracts | | | 1,297,048 | |
| Receivables — | | | | |
| Investment securities sold | | | 12,930,608 | |
| Fund shares sold | | | 199,012 | |
| Dividends | | | 1,036,129 | |
| Interest | | | 340,139 | |
| Other assets | | | 184,119 | |
| Total assets | | $ | 394,531,114 | |
| LIABILITIES: | | | | |
| Payables — | | | | |
| Investment securities purchased | | $ | 16,642,097 | |
| Fund shares repurchased | | | 749,500 | |
| Trustees’ fees | | | 900 | |
| Net unrealized depreciation on futures contracts | | | 7,137,020 | |
| Swap contracts, at value | | | 954,636 | |
| Due to affiliates | | | 59,863 | |
| Accrued expenses | | | 218,981 | |
| Total liabilities | | $ | 25,762,997 | |
| NET ASSETS: | | | | |
| Paid-in capital | | $ | 445,883,655 | |
| Distributable earnings (loss) | | | (77,115,538 | ) |
| Net assets | | $ | 368,768,117 | |
| NET ASSET VALUE PER SHARE: | | | | |
No par value (unlimited number of shares authorized) | | | | |
| Class A (based on $76,507,093/7,401,519 shares) | | $ | 10.34 | |
| Class C (based on $61,613,359/6,104,906 shares) | | $ | 10.09 | |
| Class K (based on $100,266,318/9,704,416 shares) | | $ | 10.33 | |
| Class R (based on $154,699/15,115 shares) | | $ | 10.24 | |
| Class Y (based on $130,226,648/12,541,046 shares) | | $ | 10.38 | |
| MAXIMUM OFFERING PRICE PER SHARE: | | | | |
| Class A (based on $10.34 net asset value per share/100%-4.50% | | | | |
| maximum sales charge) | | $ | 10.82 | |
The accompanying notes are an integral part of these financial statements.
32 Pioneer Flexible Opportunities Fund | Semiannual Report | 4/30/20
Statement of Operations (Consolidated) (unaudited) | |
| FOR THE SIX MONTHS ENDED 4/30/20 | | |
| INVESTMENT INCOME: | | | | | | |
| Dividends from unaffiliated issuers (net of foreign | | | | | | |
| taxes withheld $269,012) | | $ | 4,134,941 | | | | |
| Interest from unaffiliated issuers (net of foreign | | | | | | | |
| taxes withheld $5,179) | | | 746,956 | | | | |
| Total investment income | | | | | | $ | 4,881,897 | |
| EXPENSES: | | | | | | | | |
| Management fees | | $ | 1,603,094 | | | | | |
| Administrative expense | | | 81,764 | | | | | |
| Transfer agent fees | | | | | | | | |
| Class A | | | 24,970 | | | | | |
| Class C | | | 31,581 | | | | | |
| Class K | | | 53 | | | | | |
| Class R | | | 237 | | | | | |
| Class Y | | | 83,765 | | | | | |
| Distribution fees | | | | | | | | |
| Class A | | | 115,239 | | | | | |
| Class C | | | 383,736 | | | | | |
| Class R | | | 358 | | | | | |
| Shareowner communications expense | | | 17,641 | | | | | |
| Custodian fees | | | 108,934 | | | | | |
| Registration fees | | | 24,754 | | | | | |
| Professional fees | | | 55,836 | | | | | |
| Printing expense | | | 67,274 | | | | | |
| Pricing fees | | | 2,133 | | | | | |
| Trustees’ fees | | | 10,580 | | | | | |
| Insurance expense | | | 2,992 | | | | | |
| Miscellaneous | | | 84,584 | | | | | |
| Total expenses | | | | | | $ | 2,699,525 | |
| Less fees waived and expenses reimbursed by the Adviser | | | | | | | (84,306 | ) |
| Net expenses | | | | | | $ | 2,615,219 | |
| Net investment income | | | | | | $ | 2,266,678 | |
| REALIZED AND UNREALIZED GAIN (LOSS) ON INVESTMENTS: | | | | | | | | |
| Net realized gain (loss) on: | | | | | | | | |
| Investments in unaffiliated issuers | | $ | (25,022,453 | ) | | | | |
| Forward foreign currency exchange contracts | | | 2,241 | | | | | |
| Futures contracts | | | 15,526,349 | | | | | |
| Swap contracts | | | (4,404,889 | ) | | | | |
| Other assets and liabilities denominated | | | | | | | | |
| in foreign currencies | | | (637,496 | ) | | $ | (14,536,248 | ) |
| Change in net unrealized appreciation (depreciation) on: | | | | | | | | |
| Investments in unaffiliated issuers (net of foreign | | | | | | | | |
| capital gain tax $32,028) | | $ | (39,596,271 | ) | | | | |
| Futures contracts | | | (6,210,282 | ) | | | | |
| Swap contracts | | | (1,179,749 | ) | | | | |
| Other assets and liabilities denominated in foreign currencies | | | (356,497 | ) | | $ | (47,342,799 | ) |
| Net realized and unrealized gain (loss) on investments | | | | | | $ | (61,879,047 | ) |
| Net decrease in net assets resulting from operations | | | | | | $ | (59,612,369 | ) |
The accompanying notes are an integral part of these financial statements.
Pioneer Flexible Opportunities Fund | Semiannual Report | 4/30/20 33
Statements of Changes in Net Assets (Consolidated)
| | Six Months | | | | |
| | Ended | | | | |
| | 4/30/20 | | | Year Ended | |
| | (unaudited) | | | 10/31/19 | |
| FROM OPERATIONS: | | | | | | |
Net investment income (loss) | | $ | 2,266,678 | | | $ | 6,374,863 | |
Net realized gain (loss) on investments | | | (14,536,248 | ) | | | (46,458,012 | ) |
Change in net unrealized appreciation (depreciation) | | | | | | | | |
| on investments | | | (47,342,799 | ) | | | 64,639,665 | |
| Net increase (decrease) in net assets resulting | | | | | | | | |
| from operations | | $ | (59,612,369 | ) | | $ | 24,556,516 | |
| DISTRIBUTIONS TO SHAREOWNERS: | | | | | | | | |
Class A ($0.22 and $1.32 per share, respectively) | | $ | (1,727,626 | ) | | $ | (14,443,481 | ) |
Class C ($0.17 and $1.27 per share, respectively) | | | (1,179,717 | ) | | | (12,161,299 | ) |
Class K ($0.23 and $1.36 per share, respectively) | | | (1,854,292 | ) | | | (7,775,304 | ) |
Class R ($0.01 and $1.28 per share, respectively) | | | (100 | ) | | | (19,779 | ) |
Class Y ($0.23 and $1.36 per share, respectively) | | | (3,947,864 | ) | | | (32,308,714 | ) |
| Total distributions to shareowners | | $ | (8,709,599 | ) | | $ | (66,708,577 | ) |
| FROM FUND SHARE TRANSACTIONS: | | | | | | | | |
Net proceeds from sales of shares | | $ | 64,564,014 | | | $ | 105,338,234 | |
Reinvestment of distributions | | | 7,661,905 | | | | 47,783,717 | |
Cost of shares repurchased | | | (122,531,587 | ) | | | (281,802,642 | ) |
| Net decrease in net assets resulting from | | | | | | | | |
| Fund share transactions | | $ | (50,305,668 | ) | | $ | (128,680,691 | ) |
| Net decrease in net assets | | $ | (118,627,636 | ) | | $ | (170,832,752 | ) |
| NET ASSETS: | | | | | | | | |
Beginning of period | | $ | 487,395,753 | | | $ | 658,228,505 | |
End of period | | $ | 368,768,117 | | | $ | 487,395,753 | |
The accompanying notes are an integral part of these financial statements.
34 Pioneer Flexible Opportunities Fund | Semiannual Report | 4/30/20
| | Six Months | | | Six Months | | | | | | | |
| | Ended | | | Ended | | | | | | | |
| | 4/30/20 | | | 4/30/20 | | | Year Ended | | | Year Ended | |
| | Shares | | | Amount | | | 10/31/19 | | | 10/31/19 | |
| | (unaudited) | | | (unaudited) | | | Shares | | | Amount | |
| Class A | | | | | | | | | | | | |
Shares sold | | | 498,482 | | | $ | 5,818,225 | | | | 1,717,793 | | | $ | 20,017,433 | |
Reinvestment of | | | | | | | | | | | | | | | | |
| distributions | | | 131,841 | | | | 1,573,484 | | | | 958,489 | | | | 11,038,004 | |
Less shares repurchased | | | (1,564,740 | ) | | | (17,820,884 | ) | | | (5,594,605 | ) | | | (62,874,085 | ) |
| Net decrease | | | (934,417 | ) | | $ | (10,429,175 | ) | | | (2,918,323 | ) | | $ | (31,818,648 | ) |
| Class C | | | | | | | | | | | | | | | | |
Shares sold | | | 243,094 | | | $ | 2,828,249 | | | | 774,383 | | | $ | 8,783,453 | |
Reinvestment of | | | | | | | | | | | | | | | | |
| distributions | | | 81,506 | | | | 979,702 | | | | 901,792 | | | | 10,176,151 | |
Less shares repurchased | | | (1,485,889 | ) | | | (16,615,465 | ) | | | (4,233,292 | ) | | | (47,975,358 | ) |
| Net decrease | | | (1,161,289 | ) | | $ | (12,807,514 | ) | | | (2,557,117 | ) | | $ | (29,015,754 | ) |
| Class K | | | | | | | | | | | | | | | | |
Shares sold | | | 2,659,298 | | | $ | 32,581,181 | | | | 1,952,848 | | | $ | 22,677,430 | |
Reinvestment of | | | | | | | | | | | | | | | | |
| distributions | | | 158,719 | | | | 1,854,059 | | | | 81,419 | | | | 939,652 | |
Less shares repurchased | | | (516,504 | ) | | | (5,790,118 | ) | | | (106,210 | ) | | | (1,242,749 | ) |
| Net increase | | | 2,301,513 | | | $ | 28,645,122 | | | | 1,928,057 | | | $ | 22,374,333 | |
| Class R | | | | | | | | | | | | | | | | |
Shares sold | | | 4,999 | | | $ | 53,141 | | | | 8,291 | | | $ | 96,661 | |
Reinvestment of | | | | | | | | | | | | | | | | |
| distributions | | | 11 | | | | 100 | | | | 1,128 | | | | 12,930 | |
Less shares repurchased | | | (1,898 | ) | | | (20,766 | ) | | | (21,423 | ) | | | (259,951 | ) |
| Net increase (decrease) | | | 3,112 | | | $ | 32,475 | | | | (12,004 | ) | | $ | (150,360 | ) |
| Class Y | | | | | | | | | | | | | | | | |
Shares sold | | | 1,926,635 | | | $ | 23,283,218 | | | | 4,599,056 | | | $ | 53,763,257 | |
Reinvestment of | | | | | | | | | | | | | | | | |
| distributions | | | 272,816 | | | | 3,254,560 | | | | 2,213,037 | | | | 25,616,980 | |
Less shares repurchased | | | (7,223,772 | ) | | | (82,284,354 | ) | | | (14,631,845 | ) | | | (169,450,499 | ) |
| Net decrease | | | (5,024,321 | ) | | $ | (55,746,576 | ) | | | (7,819,752 | ) | | $ | (90,070,262 | ) |
The accompanying notes are an integral part of these financial statements.
Pioneer Flexible Opportunities Fund | Semiannual Report | 4/30/20 35
Financial Highlights (Consolidated) | | | | | | | | | | |
|
| | | Six Months | | | | | | | | | | | | | | | | |
| | Ended | | | Year | | | Year | | | Year | | | Year | | | Year | |
| | 4/30/20 | | | Ended | | | Ended | | | Ended | | | Ended | | | Ended | |
| | (unaudited) | | | 10/31/19 | | | 10/31/18 | | | 10/31/17 | | | 10/31/16* | | | 10/31/15* | |
| Class A | | | | | | | | | | | | | | | | | | |
Net asset value, beginning of period | | $ | 12.04 | | | $ | 12.69 | | | $ | 14.17 | | | $ | 12.03 | | | $ | 12.68 | | | $ | 12.94 | |
Increase (decrease) from investment operations: | | | | | | | | | | | | | | | | | | | | | | | | |
| Net investment income (loss) (a) | | $ | 0.05 | | | $ | 0.13 | | | $ | 0.19 | | | $ | 0.14 | | | $ | 0.16 | | | $ | 0.17 | |
| Net realized and unrealized gain (loss) on investments | | | (1.53 | ) | | | 0.54 | | | | (0.44 | ) | | | 2.12 | | | | (0.07 | ) | | | 0.20 | |
| Net increase (decrease) from investment operations | | $ | (1.48 | ) | | $ | 0.67 | | | $ | (0.25 | ) | | $ | 2.26 | | | $ | 0.09 | | | $ | 0.37 | |
Distributions to shareowners: | | | | | | | | | | | | | | | | | | | | | | | | |
| Net investment income | | $ | (0.22 | ) | | $ | (0.11 | ) | | $ | (0.35 | ) | | $ | (0.12 | ) | | $ | (0.18 | ) | | $ | (0.30 | ) |
| Net realized gain | | | — | | | | (1.21 | ) | | | (0.88 | ) | | | — | | | | (0.56 | ) | | | (0.33 | ) |
| Total distributions | | $ | (0.22 | ) | | $ | (1.32 | ) | | $ | (1.23 | ) | | $ | (0.12 | ) | | $ | (0.74 | ) | | $ | (0.63 | ) |
| Net increase (decrease) in net asset value | | $ | (1.70 | ) | | $ | (0.65 | ) | | $ | (1.48 | ) | | $ | 2.14 | | | $ | (0.65 | ) | | $ | (0.26 | ) |
Net asset value, end of period | | $ | 10.34 | | | $ | 12.04 | | | $ | 12.69 | | | $ | 14.17 | | | $ | 12.03 | | | $ | 12.68 | |
| Total return (b) | | | (12.56 | )%(c) | | | 5.85 | % | | | (2.08 | )% | | | 18.96 | % | | | 0.88 | % | | | 2.85 | % |
Ratio of net expenses to average net assets | | | 1.20 | %(d) | | | 1.20 | % | | | 1.14 | % | | | 1.18 | % | | | 1.19 | % | | | 1.20 | % |
Ratio of net investment income (loss) to average net assets | | | 0.93 | %(d) | | | 1.12 | % | | | 1.35 | % | | | 1.08 | % | | | 1.38 | % | | | 1.33 | % |
Portfolio turnover rate | | | 122 | %(c) | | | 168 | % | | | 255 | % | | | 292 | % | | | 230 | % | | | 295 | % |
Net assets, end of period (in thousands) | | $ | 76,507 | | | $ | 100,339 | | | $ | 142,760 | | | $ | 140,278 | | | $ | 164,898 | | | $ | 209,001 | |
Ratios with no waiver of fees and assumption of expenses by | | | | | | | | | | | | | | | | | | | | | | | | |
| the Adviser and no reduction for fees paid indirectly: | | | | | | | | | | | | | | | | | | | | | | | | |
| Total expenses to average net assets | | | 1.21 | %(d) | | | 1.23 | % | | | 1.14 | % | | | 1.18 | % | | | 1.19 | % | | | 1.26 | % |
| Net investment income (loss) to average net assets | | | 0.92 | %(d) | | | 1.09 | % | | | 1.35 | % | | | 1.08 | % | | | 1.38 | % | | | 1.27 | % |
* | The Fund was audited by an independent registered public accounting firm other than Ernst & Young LLP. |
(a) | The per-share data presented above is based on the average shares outstanding for the period presented. |
(b) | Assumes initial investment at net asset value at the beginning of each period, reinvestment of all distributions, the complete redemption of the investment at net asset value at the end of each period and no sales charges. Total return would be reduced if sales charges were taken into account. |
(c) | Not annualized. |
(d) | Annualized. |
The accompanying notes are an integral part of these financial statements.
36 Pioneer Flexible Opportunities Fund | Semiannual Report | 4/30/20
| | Six Months | | | | | | | | | | | | | | | | |
| | Ended | | | Year | | | Year | | | Year | | | Year | | | Year | |
| | 4/30/20 | | | Ended | | | Ended | | | Ended | | | Ended | | | Ended | |
| | (unaudited) | | | 10/31/19 | | | 10/31/18 | | | 10/31/17 | | | 10/31/16* | | | 10/31/15* | |
| Class C | | | | | | | | | | | | | | | | | | |
Net asset value, beginning of period | | $ | 11.75 | | | $ | 12.45 | | | $ | 13.95 | | | $ | 11.88 | | | $ | 12.56 | | | $ | 12.78 | |
Increase (decrease) from investment operations: | | | | | | | | | | | | | | | | | | | | | | | | |
| Net investment income (loss) (a) | | $ | 0.01 | | | $ | 0.04 | | | $ | 0.07 | | | $ | 0.04 | | | $ | 0.07 | | | $ | 0.07 | |
| Net realized and unrealized gain (loss) on investments | | | (1.50 | ) | | | 0.53 | | | | (0.42 | ) | | | 2.09 | | | | (0.07 | ) | | | 0.20 | |
| Net increase (decrease) from investment operations | | $ | (1.49 | ) | | $ | 0.57 | | | $ | (0.35 | ) | | $ | 2.13 | | | $ | — | | | $ | 0.27 | |
Distributions to shareowners: | | | | | | | | | | | | | | | | | | | | | | | | |
| Net investment income | | $ | (0.17 | ) | | $ | (0.06 | ) | | $ | (0.27 | ) | | $ | (0.06 | ) | | $ | (0.12 | ) | | $ | (0.16 | ) |
| Net realized gain | | | — | | | | (1.21 | ) | | | (0.88 | ) | | | — | | | | (0.56 | ) | | | (0.33 | ) |
| Total distributions | | $ | (0.17 | ) | | $ | (1.27 | ) | | $ | (1.15 | ) | | $ | (0.06 | ) | | $ | (0.68 | ) | | $ | (0.49 | ) |
| Net increase (decrease) in net asset value | | $ | (1.66 | ) | | $ | (0.70 | ) | | $ | (1.50 | ) | | $ | 2.07 | | | $ | (0.68 | ) | | $ | (0.22 | ) |
Net asset value, end of period | | $ | 10.09 | | | $ | 11.75 | | | $ | 12.45 | | | $ | 13.95 | | | $ | 11.88 | | | $ | 12.56 | |
| Total return (b) | | | (12.91 | )%(c) | | | 5.03 | % | | | (2.83 | )% | | | 18.01 | % | | | 0.09 | % | | | 2.12 | % |
Ratio of net expenses to average net assets | | | 1.98 | %(d) | | | 1.97 | % | | | 1.91 | % | | | 1.93 | % | | | 1.94 | % | | | 2.01 | % |
Ratio of net investment income (loss) to average net assets | | | 0.15 | %(d) | | | 0.37 | % | | | 0.55 | % | | | 0.34 | % | | | 0.63 | % | | | 0.52 | % |
Portfolio turnover rate | | | 122 | %(c) | | | 168 | % | | | 255 | % | | | 292 | % | | | 230 | % | | | 295 | % |
Net assets, end of period (in thousands) | | $ | 61,613 | | | $ | 85,398 | | | $ | 122,305 | | | $ | 148,591 | | | $ | 178,457 | | | $ | 218,597 | |
* | The Fund was audited by an independent registered public accounting firm other than Ernst & Young LLP. |
(a) | The per-share data presented above is based on the average shares outstanding for the period presented. |
(b) | Assumes initial investment at net asset value at the beginning of each period, reinvestment of all distributions, the complete redemption of the investment at net asset value at the end of each period and no sales charges. Total return would be reduced if sales charges were taken into account. |
(c) | Not annualized. |
(d) | Annualized. |
The accompanying notes are an integral part of these financial statements.
Pioneer Flexible Opportunities Fund | Semiannual Report | 4/30/20 37
Financial Highlights (Consolidated) (continued) | | |
| | Six Months | | | | | | | |
| | Ended | | | Year | | | | |
| | 4/30/20 | | | Ended | | | 6/22/18* to | |
| | (unaudited) | | | 10/31/19 | | | 10/31/18 | |
| Class K | | | | | | | | | |
Net asset value, beginning of period | | $ | 12.03 | | | $ | 12.69 | | | $ | 12.67 | |
Increase (decrease) from investment operations: | | | | | | | | | | | | |
| Net investment income (loss) (a) | | $ | 0.07 | | | $ | 0.17 | | | $ | 0.06 | |
| Net realized and unrealized gain (loss) | | | | | | | | | | | | |
| on investments | | | (1.54 | ) | | | 0.53 | | | | (1.00 | ) |
| Net increase (decrease) from | | | | | | | | | | | | |
| investment operations | | $ | (1.47 | ) | | $ | 0.70 | | | $ | (0.94 | ) |
Distributions to shareowners: | | | | | | | | | | | | |
| Net investment income | | $ | (0.23 | ) | | $ | (0.15 | ) | | $ | (0.04 | ) |
| Net realized gain | | | — | | | | (1.21 | ) | | | — | |
| Total distributions | | $ | (0.23 | ) | | $ | (1.36 | ) | | $ | (0.04 | ) |
| Net increase (decrease) in net asset value | | $ | (1.70 | ) | | $ | (0.66 | ) | | $ | (0.98 | ) |
Net asset value, end of period | | $ | 10.33 | | | $ | 12.03 | | | $ | 12.69 | |
| Total return (b) | | | (12.42 | )%(c) | | | 6.14 | % | | | (2.00 | )%(c) |
Ratio of net expenses to average net assets | | | 0.90 | %(d) | | | 0.88 | % | | | 0.88 | %(d) |
Ratio of net investment income (loss) to average | | | | | | | | | | | | |
| net assets | | | 1.27 | %(d) | | | 1.48 | % | | | 1.28 | %(d) |
Portfolio turnover rate | | | 122 | %(c) | | | 168 | % | | | 255 | %(c) |
Net assets, end of period (in thousands) | | $ | 100,266 | | | $ | 89,092 | | | $ | 69,449 | |
* | Class K commenced operations on June 22, 2018. |
(a) | The per-share data presented above is based on the average shares outstanding for the period presented. |
(b) | Assumes initial investment at net asset value at the beginning of each period, reinvestment of all distributions and the complete redemption of the investment at net asset value at the end of each period. |
(c) | Not annualized. |
(d) | Annualized. |
The accompanying notes are an integral part of these financial statements.
38 Pioneer Flexible Opportunities Fund | Semiannual Report | 4/30/20
| | | Six Months | | | | | | | | | | | | | | | | |
| | Ended | | | Year | | | Year | | | Year | | | Year | | | Year | |
| | 4/30/20 | | | Ended | | | Ended | | | Ended | | | Ended | | | Ended | |
| | (unaudited) | | | 10/31/19 | | | 10/31/18 | | | 10/31/17 | | | 10/31/16* | | | 10/31/15* | |
| Class R | | | | | | | | | | | | | | | | | | |
Net asset value, beginning of period | | $ | 11.75 | | | $ | 12.60 | | | $ | 14.11 | | | $ | 12.00 | | | $ | 12.69 | | | $ | 12.92 | |
Increase (decrease) from investment operations: | | | | | | | | | | | | | | | | | | | | | | | | |
| Net investment income (loss) (a) | | $ | 0.02 | | | $ | (0.05 | )(b) | | $ | 0.10 | | | $ | 0.08 | | | $ | 0.10 | | | $ | 0.06 | |
| Net realized and unrealized gain (loss) on investments | | | (1.52 | ) | | | 0.48 | | | | (0.43 | ) | | | 2.11 | | | | (0.08 | ) | | | 0.19 | |
| Net increase (decrease) from investment operations | | $ | (1.50 | ) | | $ | 0.43 | | | $ | (0.33 | ) | | $ | 2.19 | | | $ | 0.02 | | | $ | 0.25 | |
Distributions to shareowners: | | | | | | | | | | | | | | | | | | | | | | | | |
| Net investment income | | $ | (0.01 | ) | | $ | (0.07 | ) | | $ | (0.30 | ) | | $ | (0.08 | ) | | $ | (0.15 | ) | | $ | (0.15 | ) |
| Net realized gain | | | — | | | | (1.21 | ) | | | (0.88 | ) | | | — | | | | (0.56 | ) | | | (0.33 | ) |
| Total distributions | | $ | (0.01 | ) | | $ | (1.28 | ) | | $ | (1.18 | ) | | $ | (0.08 | ) | | $ | (0.71 | ) | | $ | (0.48 | ) |
| Net increase (decrease) in net asset value | | $ | (1.51 | ) | | $ | (0.85 | ) | | $ | (1.51 | ) | | $ | 2.11 | | | $ | (0.69 | ) | | $ | (0.23 | ) |
Net asset value, end of period | | $ | 10.24 | | | $ | 11.75 | | | $ | 12.60 | | | $ | 14.11 | | | $ | 12.00 | | | $ | 12.69 | |
| Total return (c) | | | (12.77 | )%(d) | | | 3.73 | % | | | (2.71 | )% | | | 18.35 | % | | | 0.34 | % | | | 1.90 | % |
Ratio of net expenses to average net assets | | | 1.74 | %(e) | | | 2.91 | % | | | 1.82 | % | | | 1.62 | % | | | 1.71 | % | | | 2.01 | % |
Ratio of net investment income (loss) to average net assets | | | 0.41 | %(e) | | | (0.45 | )% | | | 0.75 | % | | | 0.64 | % | | | 0.86 | % | | | 0.47 | % |
Portfolio turnover rate | | | 122 | %(d) | | | 168 | % | | | 255 | % | | | 292 | % | | | 230 | % | | | 295 | % |
Net assets, end of period (in thousands) | | $ | 155 | | | $ | 141 | | | $ | 303 | | | $ | 279 | | | $ | 282 | | | $ | 120 | |
* | The Fund was audited by an independent registered public accounting firm other than Ernst & Young LLP. |
(a) | The per-share data presented above is based on the average shares outstanding for the period presented. |
(b) | The amount shown for a share outstanding does not correspond with net investment gain (loss) in the Statement of Operations for the period due to timing of the sales and repurchase of shares. |
(c) | Assumes initial investment at net asset value at the beginning of each period, reinvestment of all distributions, the complete redemption of the investment at net asset value at the end of each period and no sales charges. Total return would be reduced if sales charges were taken into account. |
(d) | Annualized. |
(e) | Not annualized. |
The accompanying notes are an integral part of these financial statements.
Pioneer Flexible Opportunities Fund | Semiannual Report | 4/30/20 39
| | | | | | | | | | | | | | | | | | | |
Financial Highlights (Consolidated) (continued) | | | | | | | | | | | | | | | | | | |
| | |
| | |
| | | Six Months | | | | | | | | | | | | | | | | |
| | Ended | | | Year | | | Year | | | Year | | | Year | | | Year | |
| | 4/30/20 | | | Ended | | | Ended | | | Ended | | | Ended | | | Ended | |
| | (unaudited) | | | 10/31/19 | | | 10/31/18 | | | 10/31/17 | | | 10/31/16* | | | 10/31/15* | |
| Class Y | | | | | | | | | | | | | | | | | | |
Net asset value, beginning of period | | $ | 12.09 | | | $ | 12.74 | | | $ | 14.22 | | | $ | 12.08 | | | $ | 12.72 | | | $ | 12.97 | |
Increase (decrease) from investment operations: | | | | | | | | | | | | | | | | | | | | | | | | |
| Net investment income (loss) (a) | | $ | 0.07 | | | $ | 0.17 | | | $ | 0.24 | | | $ | 0.18 | | | $ | 0.20 | | | $ | 0.21 | |
| Net realized and unrealized gain (loss) on investments | | | (1.55 | ) | | | 0.54 | | | | (0.46 | ) | | | 2.12 | | | | (0.08 | ) | | | 0.20 | |
| Net increase (decrease) from investment operations | | $ | (1.48 | ) | | $ | 0.71 | | | $ | (0.22 | ) | | $ | 2.30 | | | $ | 0.12 | | | $ | 0.41 | |
Distributions to shareowners: | | | | | | | | | | | | | | | | | | | | | | | | |
| Net investment income | | $ | (0.23 | ) | | $ | (0.15 | ) | | $ | (0.38 | ) | | $ | (0.16 | ) | | $ | (0.20 | ) | | $ | (0.33 | ) |
| Net realized gain | | | — | | | | (1.21 | ) | | | (0.88 | ) | | | — | | | | (0.56 | ) | | | (0.33 | ) |
| Total distributions | | $ | (0.23 | ) | | $ | (1.36 | ) | | $ | 1.26 | | | $ | (0.16 | ) | | $ | (0.76 | ) | | $ | (0.66 | ) |
| Net increase (decrease) in net asset value | | $ | (1.71 | ) | | $ | (0.65 | ) | | $ | (1.48 | ) | | $ | 2.14 | | | $ | (0.64 | ) | | $ | (0.25 | ) |
Net asset value, end of period | | $ | 10.38 | | | $ | 12.09 | | | $ | 12.74 | | | $ | 14.22 | | | $ | 12.08 | | | $ | 12.72 | |
| Total return (b) | | | (12.45 | )%(c) | | | 6.16 | % | | | (1.86 | )% | | | 19.24 | % | | | 1.17 | % | | | 3.20 | % |
Ratio of net expenses to average net assets | | | 0.90 | %(d) | | | 0.90 | % | | | 0.90 | % | | | 0.90 | % | | | 0.90 | % | | | 0.90 | % |
Ratio of net investment income (loss) to average net assets | | | 1.21 | %(d) | | | 1.45 | % | | | 1.71 | % | | | 1.37 | % | | | 1.65 | % | | | 1.63 | % |
Portfolio turnover rate | | | 122 | %(c) | | | 168 | % | | | 255 | % | | | 292 | % | | | 230 | % | | | 295 | % |
Net assets, end of period (in thousands) | | $ | 130,227 | | | $ | 212,426 | | | $ | 323,412 | | | $ | 369,546 | | | $ | 347,586 | | | $ | 378,895 | |
Ratios with no waiver of fees and assumption of expenses by | | | | | | | | | | | | | | | | | | | | | | | | |
| the Adviser and no reduction for fees paid indirectly: | | | | | | | | | | | | | | | | | | | | | | | | |
| Total expenses to average net assets | | | 0.98 | %(d) | | | 0.90 | % | | | 0.92 | % | | | 0.95 | % | | | 0.96 | % | | | 1.02 | % |
| Net investment income (loss) to average net assets | | | 1.13 | %(d) | | | 1.45 | % | | | 1.69 | % | | | 1.32 | % | | | 1.59 | % | | | 1.52 | % |
* | The Fund was audited by an independent registered public accounting firm other than Ernst & Young LLP. |
(a) | The per-share data presented above is based on the average shares outstanding for the period presented. |
(b) | Assumes initial investment at net asset value at the beginning of each period, reinvestment of all distributions, the complete redemption of the investment at net asset value at the end of each period and no sales charges. Total return would be reduced if sales charges were taken into account. |
(c) | Not annualized. |
(d) | Annualized. |
The accompanying notes are an integral part of these financial statements.
40 Pioneer Flexible Opportunities Fund | Semiannual Report | 4/30/20
Notes to Financial Statements |
4/30/20 (Consolidated) (unaudited) 1. Organization and Significant Accounting Policies
Pioneer Flexible Opportunities Fund (the “Fund”) is one of two portfolios comprising Pioneer Series Trust VI (the “Trust”), a Delaware statutory trust. The Fund is registered under the Investment Company Act of 1940 as a diversified, open-end management investment company. The Fund’s investment objective is to seek total return.
The Fund offers five classes of shares designated as Class A, Class C, Class K, Class R and Class Y shares. Each class of shares represents an interest in the same portfolio of investments of the Fund and has identical rights (based on relative net asset values) to assets and liquidation proceeds. Share classes can bear different rates of class-specific fees and expenses such as transfer agent and distribution fees. Differences in class-specific fees and expenses will result in differences in net investment income and, therefore, the payment of different dividends from net investment income earned by each class. The Amended and Restated Declaration of Trust of the Fund gives the Board of Trustees the flexibility to specify either per-share voting or dollar-weighted voting when submitting matters for shareholder approval. Under per-share voting, each share of a class of the Fund is entitled to one vote. Under dollar-weighted voting, a shareholder’s voting power is determined not by the number of shares owned, but by the dollar value of the shares on the record date. Each share class has exclusive voting rights with respect to matters affecting only that class, including with respect to the distribution plan for that class. There is no distribution plan for Class K and Class Y shares.
Amundi Pioneer Asset Management, Inc., an indirect, wholly owned subsidiary of Amundi and Amundi’s wholly owned subsidiary, Amundi USA, Inc., serves as the Fund’s investment adviser (the “Adviser”). Amundi Pioneer Distributor, Inc., an affiliate of Amundi Pioneer Asset Management, Inc., serves as the Fund’s distributor (the “Distributor”).
In August 2018, the Securities and Exchange Commission (“SEC”) released a Disclosure Update and Simplification Final Rule. The Final Rule amends Regulation S-X disclosures requirements to conform them to U.S. Generally Accepted Accounting Principles (“U.S. GAAP”) for investment companies. The Fund’s financial statements were prepared in compliance with the new amendments to Regulation S-X.
The consolidated financial statements of the Fund include the accounts of Flexible Opportunities Commodity Fund Ltd. (formerly, Pioneer Cayman Commodity Fund Ltd.) (the “Subsidiary”). All intercompany accounts and transactions have been eliminated. The Subsidiary, a Cayman Islands exempted
Pioneer Flexible Opportunities Fund | Semiannual Report | 4/30/20 41
company, was incorporated on February 10, 2010, and is wholly owned and controlled by the Fund. The Fund is the sole shareholder of the Subsidiary. It is intended that the Fund will remain the sole shareholder and will continue to control the Subsidiary. The Fund and the Subsidiary are both managed by the Adviser. The Subsidiary acts as an investment vehicle for the Fund in order to effect certain investments on behalf of the Fund. As of April 30, 2020, the Subsidiary represented $1,768,518, or approximately 0.48%, of the net assets of the Fund.
The Fund is an investment company and follows investment company accounting and reporting guidance under U.S. GAAP. U.S. GAAP requires the management of the Fund to make estimates and assumptions that affect the reported amounts of assets and liabilities, the disclosure of contingent assets and liabilities at the date of the financial statements, and the reported amounts of income, expenses and gain or loss on investments during the reporting period. Actual results could differ from those estimates.
The following is a summary of significant accounting policies followed by the Fund in the preparation of its financial statements:
A. Security Valuation
The net asset value of the Fund is computed once daily, on each day the New York Stock Exchange (“NYSE”) is open, as of the close of regular trading on the NYSE.
Equity securities that have traded on an exchange are valued by using the last sale price on the principal exchange where they are traded. Equity securities that have not traded on the date of valuation, or securities for which sale prices are not available, generally are valued using the mean between the last bid and asked prices or, if both last bid and asked prices are not available, at the last quoted bid price. Last sale and bid and asked prices are provided by independent third party pricing services. In the case of equity securities not traded on an exchange, prices are typically determined by independent third party pricing services using a variety of techniques and methods.
The value of foreign securities is translated into U.S. dollars based on foreign currency exchange rate quotations supplied by a third party pricing source. Trading in non-U.S. equity securities is substantially completed each day at various times prior to the close of the NYSE. The values of such securities used in computing the net asset value of the Fund’s shares are determined as of such times. The Fund may use a fair value model developed by an independent pricing service to value non-U.S. equity securities.
Fixed-income securities are valued by using prices supplied by independent pricing services, which consider such factors as market prices, market events, quotations from one or more brokers, Treasury spreads, yields, maturities and
42 Pioneer Flexible Opportunities Fund | Semiannual Report | 4/30/20
ratings, or may use a pricing matrix or other fair value methods or techniques to provide an estimated value of the security or instrument. A pricing matrix is a means of valuing a debt security on the basis of current market prices for other debt securities, historical trading patterns in the market for fixed-income securities and/or other factors. Non-U.S. debt securities that are listed on an exchange will be valued at the bid price obtained from an independent third party pricing service. When independent third party pricing services are unable to supply prices, or when prices or market quotations are considered to be unreliable, the value of that security may be determined using quotations from one or more broker-dealers.
Options contracts are generally valued at the mean between the last bid and ask prices on the principal exchange where they are traded. Over-the-counter (“OTC”) options and options on swaps (“swaptions”) are valued using prices supplied by independent pricing services, which consider such factors as market prices, market events, quotations from one or more brokers, Treasury spreads, yields, maturities and ratings, or may use a pricing matrix or other fair value methods or techniques to provide an estimated value of the security or instrument.
Futures contracts are generally valued at the closing settlement price established by the exchange on which they are traded.
Swap contracts, including interest rate swaps, caps and floors (other than centrally cleared swap contracts), are valued at the dealer quotations obtained from reputable International Swap Dealers Association members. Centrally cleared swaps are valued at the daily settlement price provided by the central clearing counterparty.
Shares of open-end registered investment companies (including money market mutual funds) are valued at such funds’ net asset value. Shares of exchange-listed closed-end funds are valued by using the last sale price on the principal exchange where they are traded.
Securities for which independent pricing services or broker-dealers are unable to supply prices or for which market prices and/or quotations are not readily available or are considered to be unreliable are valued by a fair valuation team comprised of certain personnel of the Adviser pursuant to procedures adopted by the Fund’s Board of Trustees. The Adviser’s fair valuation team uses fair value methods approved by the Valuation Committee of the Board of Trustees. The Adviser’s fair valuation team is responsible for monitoring developments that may impact fair valued securities and for discussing and assessing fair values on an ongoing basis, and at least quarterly, with the Valuation Committee of the Board of Trustees.
Pioneer Flexible Opportunities Fund | Semiannual Report | 4/30/20 43
Inputs used when applying fair value methods to value a security may include credit ratings, the financial condition of the company, current market conditions and comparable securities. The Fund may use fair value methods if it is determined that a significant event has occurred after the close of the exchange or market on which the security trades and prior to the determination of the Fund’s net asset value. Examples of a significant event might include political or economic news, corporate restructurings, natural disasters, terrorist activity or trading halts. Thus, the valuation of the Fund’s securities may differ significantly from exchange prices, and such differences could be material.
At April 30, 2020, one security was valued using fair value methods (in addition to securities valued using prices supplied by independent pricing services, broker-dealers or using a third party insurance pricing model) representing 0.02% of net assets. The value of this fair valued security was $63,363.
B. Investment Income and Transactions
Dividend income is recorded on the ex-dividend date, except that certain dividends from foreign securities where the ex-dividend date may have passed are recorded as soon as the Fund becomes aware of the ex-dividend data in the exercise of reasonable diligence.
Interest income, including interest on income-bearing cash accounts, is recorded on the accrual basis. Dividend and interest income are reported net of unrecoverable foreign taxes withheld at the applicable country rates and net of income accrued on defaulted securities.
Interest and dividend income payable by delivery of additional shares is reclassified as PIK (payment-in-kind) income upon receipt and is included in interest and dividend income, respectively.
Security transactions are recorded as of trade date. Gains and losses on sales of investments are calculated on the identified cost method for both financial reporting and federal income tax purposes.
C. Foreign Currency Translation
The books and records of the Fund are maintained in U.S. dollars. Amounts denominated in foreign currencies are translated into U.S. dollars using current exchange rates.
Net realized gains and losses on foreign currency transactions, if any, represent, among other things, the net realized gains and losses on foreign currency exchange contracts, disposition of foreign currencies and the difference between the amount of income accrued and the U.S. dollars actually received. Further, the effects of changes in foreign currency exchange
44 Pioneer Flexible Opportunities Fund | Semiannual Report | 4/30/20
rates on investments are not segregated on the Statement of Operations from the effects of changes in the market prices of those securities, but are included with the net realized and unrealized gain or loss on investments.
D. Federal Income Taxes
It is the Fund’s policy to comply with the requirements of the Internal Revenue Code applicable to regulated investment companies and to distribute all of its net taxable income and net realized capital gains, if any, to its shareowners. Therefore, no provision for federal income taxes is required. As of October 31, 2019, the Fund did not accrue any interest or penalties with respect to uncertain tax positions, which, if applicable, would be recorded as an income tax expense on the Statement of Operations. Tax returns filed within the prior three years remain subject to examination by federal and state tax authorities.
The amount and character of income and capital gain distributions to shareowners are determined in accordance with federal income tax rules, which may differ from U.S. GAAP. Distributions in excess of net investment income or net realized gains are temporary over distributions for financial statement purposes resulting from differences in the recognition or classification of income or distributions for financial statement and tax purposes. Capital accounts within the financial statements are adjusted for permanent book/tax differences to reflect tax character, but are not adjusted for temporary differences. The tax character of current year distributions payable will be determined at the end of the current taxable year.
The tax character of distributions paid during the year ended October 31, 2019 was as follows:
| | 2019 | |
| Distributions paid from: | | | |
| Ordinary income | | $ | 23,178,807 | |
| Long term capital gain | | | 43,529,770 | |
| Total | | $ | 66,708,577 | |
The following shows the components of distributable earnings (losses) on a federal income tax basis at October 31, 2019:
| | 2019 | |
| Distributable earnings: | | | |
| Undistributed ordinary income | | $ | 5,596,459 | |
| Undistributed long term capital gain | | | (57,096,995 | ) |
| Unrealized depreciation | | | 42,706,966 | |
| Total | | $ | (8,793,570 | ) |
Pioneer Flexible Opportunities Fund | Semiannual Report | 4/30/20 45
The difference between book-basis and tax-basis net unrealized depreciation is attributable to the tax deferral of losses on wash sales, adjustments related to the mark-to-market of futures contracts, tax basis adjustments on Real Estate Investment Trusts (“REITs”), partnerships and swaps contracts.
E. Fund Shares
The Fund records sales and repurchases of its shares as of trade date. The Distributor earned $2,780 in underwriting commissions on the sale of Class A shares during the six months ended April 30, 2020.
F. Class Allocations
Income, common expenses and realized and unrealized gains and losses are calculated at the Fund level and allocated daily to each class of shares based on its respective percentage of adjusted net assets at the beginning of the day.
Distribution fees are calculated based on the average daily net asset value attributable to Class A, Class C and Class R shares of the Fund, respectively (see Note 4). Class K and Class Y shares do not pay distribution fees. All expenses and fees paid to the Fund’s transfer agent for its services are allocated among the classes of shares based on the number of accounts in each class and the ratable allocation of related out-of-pocket expenses (see Note 3).
Distributions to shareowners are recorded as of the ex-dividend date. Distributions paid by the Fund with respect to each class of shares are calculated in the same manner and at the same time, except that net investment income dividends to Class A, Class C, Class K, Class R and Class Y shares can reflect different transfer agent and distribution expense rates.
G. Risks
The value of securities held by the Fund may go up or down, sometimes rapidly or unpredictably, due to general market conditions, such as real or perceived adverse economic, political or regulatory conditions, recessions, the spread of infectious illness or other public health issues, inflation, changes in interest rates, lack of liquidity in the bond markets or adverse investor sentiment. In the past several years, financial markets have experienced increased volatility, depressed valuations, decreased liquidity and heightened uncertainty. These conditions may continue, recur, worsen or spread. A general rise in interest rates could adversely affect the price and liquidity of fixed-income securities and could also result in increased redemptions from the Fund.
46 Pioneer Flexible Opportunities Fund | Semiannual Report | 4/30/20
At times, the Fund’s investments may represent industries or industry sectors that are interrelated or have common risks, making the Fund more susceptible to any economic, political, or regulatory developments or other risks affecting those industries and sectors. The Fund’s investments in foreign markets and countries with limited developing markets may subject the Fund to a greater degree of risk than investments in a developed market. These risks include disruptive political or economic conditions and the imposition of adverse governmental laws or currency exchange restrictions.
The Fund may gain exposure to commodities (such as oil and precious metals) through investment in commodity-related investments, including commodity-linked derivatives, ETFs and other pooled investment vehicles and leveraged or unleveraged commodity-linked notes (derivative debt instruments with principal and/or coupon payments linked to the performance of commodity indices). The Fund also may invest in equity securities of issuers in commodity-related industries. The Fund’s investments in commodity-related investments may subject the Fund to greater market price volatility than investments in traditional securities. The value of commodity-related investments may be affected by changes in overall market movements, commodity index volatility, changes in interest rates, or factors affecting particular industries or commodities, such as weather, disease, embargoes, acts of war or terrorism, or political and regulatory developments. Commodity-related investments may be more volatile than the underlying commodities. In addition, commodity-linked investments are subject to counterparty risk due to there being a relatively small number of issuers. The Fund gains exposure to commodity-related investments by investing in the Subsidiary, a foreign entity that is treated as a controlled foreign corporation for U.S. federal income tax purposes. The Fund may invest up to 25% of its total assets in the Subsidiary. The Fund’s ability to invest in commodity-related investments, and the means through which any such investments may be made, is limited by tax considerations.
The Fund may invest in REIT securities, the value of which can fall for a variety of reasons, such as declines in rental income, fluctuating interest rates, poor property management, environmental liabilities, uninsured damage, increased competition, or changes in real estate tax laws.
The Fund may invest in below investment grade (high-yield) debt securities and preferred stocks. Some of these high-yield securities may be convertible into equity securities of the issuer. Debt securities rated below investment grade are commonly referred to as “junk bonds” and are considered
Pioneer Flexible Opportunities Fund | Semiannual Report | 4/30/20 47
speculative. These securities involve greater risk of loss, are subject to greater price volatility, and are less liquid, especially during periods of economic uncertainty or change, than higher rated debt securities.
With the increased use of technologies such as the Internet to conduct business, the Fund is susceptible to operational, information security and related risks. While the Fund’s Adviser has established business continuity plans in the event of, and risk management systems to prevent, limit or mitigate, such cyber-attacks, there are inherent limitations in such plans and systems, including the possibility that certain risks have not been identified. Furthermore, the Fund cannot control the cybersecurity plans and systems put in place by service providers to the Fund such as Brown Brothers Harriman & Co., the Fund’s custodian and accounting agent, and DST Asset Manager Solutions, Inc., the Fund’s transfer agent. In addition, many beneficial owners of Fund shares hold them through accounts at broker-dealers, retirement platforms and other financial market participants over which neither the Fund nor Amundi Pioneer exercises control. Each of these may in turn rely on service providers to them, which are also subject to the risk of cyber-attacks. Cybersecurity failures or breaches at Amundi Pioneer or the Fund’s service providers or intermediaries have the ability to cause disruptions and impact business operations, potentially resulting in financial losses, interference with the Fund’s ability to calculate its net asset value, impediments to trading, the inability of Fund shareowners to effect share purchases, redemptions or exchanges or receive distributions, loss of or unauthorized access to private shareowner information and violations of applicable privacy and other laws, regulatory fines, penalties, reputational damage, or additional compliance costs. Such costs and losses may not be covered under any insurance. In addition, maintaining vigilance against cyber-attacks may involve substantial costs over time, and system enhancements may themselves be subject to cyber-attacks.
COVID-19
The respiratory illness COVID-19 caused by a novel coronavirus has resulted in a global pandemic and major disruption to economies and markets around the world, including the United States. Global financial markets have experienced extreme volatility and severe losses, and trading in many instruments has been disrupted. Liquidity for many instruments has been greatly reduced for periods of time. Some interest rates are very low and in some cases yields are negative. Some sectors of the economy and individual issuers have experienced particularly large losses. These circumstances may continue for an extended period of time, and may continue to affect adversely the value and liquidity of the Fund’s investments. The ultimate economic fallout from the pandemic, and the long-term impact on economies, markets,
48 Pioneer Flexible Opportunities Fund | Semiannual Report | 4/30/20
industries and individual issuers, are not known. Governments and central banks, including the Federal Reserve in the U.S., have taken extraordinary and unprecedented actions to support local and global economies and the financial markets. These actions have resulted in significant expansion of public debt, including in the U.S. The impact of these measures, and whether they will be effective to mitigate the economic and market disruption, will not be known for some time. The consequences of high public debt, including its future impact on the economy and securities markets, likewise may not be known for some time.
The Fund’s prospectus contains unaudited information regarding the Fund’s principal risks. Please refer to that document when considering the Fund’s principal risks.
H. Purchased Options
The Fund may purchase put and call options to seek to increase total return. Purchased call and put options entitle the Fund to buy and sell a specified number of shares or units of a particular security, currency or index at a specified price at a specific date or within a specific period of time. Upon the purchase of a call or put option, the premium paid by the Fund is included on the Statement of Assets and Liabilities as an investment. All premiums are marked-to-market daily, and any unrealized appreciation or depreciation is recorded on the Fund’s Statement of Operations. As the purchaser of an index option, the Fund has the right to receive a cash payment equal to any depreciation in the value of the index below the strike price of the option (in the case of a put) or equal to any appreciation in the value of the index over the strike price of the option (in the case of a call) as of the valuation date of the option. Premiums paid for purchased call and put options which have expired are treated as realized losses on investments on the Statement of Operations. Upon the exercise or closing of a purchased put option, the premium is offset against the proceeds on the sale of the underlying security or financial instrument in order to determine the realized gain or loss on investments. Upon the exercise or closing of a purchased call option, the premium is added to the cost of the security or financial instrument. The risk associated with purchasing options is limited to the premium originally paid.
The average market value of purchased options contracts open during the six months ended April 30, 2020, was $1,790,514. Open purchased options at April 30, 2020, are listed in the Schedule of Investments.
I. Forward Foreign Currency Exchange Contracts
The Fund may enter into forward foreign currency exchange contracts (“contracts”) for the purchase or sale of a specific foreign currency at a fixed price on a future date. All contracts are marked-to-market daily at the
Pioneer Flexible Opportunities Fund | Semiannual Report | 4/30/20 49
applicable exchange rates, and any resulting unrealized appreciation or depreciation is recorded in the Fund’s financial statements. The Fund records realized gains and losses at the time a contract is offset by entry into a closing transaction or extinguished by delivery of the currency. Risks may arise upon entering into these contracts from the potential inability of counterparties to meet the terms of the contract and from unanticipated movements in the value of foreign currencies relative to the U.S. dollar (see Note 7).
During the six months ended April 30, 2020, the Fund had entered into various forward foreign currency exchange contracts that obligated the Fund to deliver or take delivery of currencies at specified future maturity dates. Alternatively, prior to the settlement date of a forward foreign currency exchange contract, the Fund may close out such contract by entering into an offsetting contract.
The average market value of forward foreign currency exchange contracts open during the six months ended April 30, 2020, was $68,488. There were no open forward foreign currency exchange contracts at April 30, 2020.
J. Futures Contracts
The Fund may enter into futures transactions in order to attempt to hedge against changes in interest rates, securities prices and currency exchange rates or to seek to increase total return. Futures contracts are types of derivatives. All futures contracts entered into by the Fund are traded on a futures exchange. Upon entering into a futures contract, the Fund is required to deposit with a broker an amount of cash or securities equal to the minimum “initial margin” requirements of the associated futures exchange. The amount of cash deposited with the broker as collateral at April 30, 2020, is recorded as “Futures collateral” on the Statement of Assets and Liabilities.
Subsequent payments for futures contracts (“variation margin”) are paid or received by the Fund, depending on the daily fluctuation in the value of the contracts, and are recorded by the Fund as unrealized appreciation or depreciation. Cash received from or paid to the broker related to previous margin movement is held in a segregated account at the broker and is recorded as either “Due from broker for futures” or “Due to broker for futures” on the Statement of Assets and Liabilities. When the contract is closed, the Fund realizes a gain or loss equal to the difference between the opening and closing value of the contract as well as any fluctuation in foreign currency exchange rates where applicable. Futures contracts are subject to market risk, interest rate risk and currency exchange rate risk. Changes in value of the contracts may not directly correlate to the changes in value of the
50 Pioneer Flexible Opportunities Fund | Semiannual Report | 4/30/20
underlying securities. With futures, there is reduced counterparty credit risk to the Fund since futures are exchange-traded and the exchange’s clearinghouse, as counterparty to all exchange-traded futures, guarantees the futures against default.
The average market value of futures contracts open during the six months ended April 30, 2020, was $(115,849,336). Open futures contracts outstanding at April 30, 2020, are listed in the Schedule of Investments.
K. Total Return Swap Contracts
The Fund may enter into futures transactions in order to attempt to hedge against changes in interest rates, securities prices and currency exchange rates or to seek to increase total return. Futures contracts are types of derivatives. All futures contracts entered into by the Fund are traded on a futures exchange. Upon entering into a futures contract, the Fund is required to deposit with a broker an amount of cash or securities equal to the minimum “initial margin” requirements of the associated futures exchange. The amount of cash deposited with the broker as collateral at April 30, 2020, is recorded as “Futures collateral” on the Statement of Assets and Liabilities. The Fund may enter into a total return swap contracts to attempt to manage and/or gain exposure to a security or market. Pursuant to a total return swap contracts, the Fund negotiates with a counterparty to exchange a periodic stream of payments. One party makes payments based on the total return of a reference asset (such as a security or a basket of securities or securities index), and in return receives fixed or floating rate interest payments. The total return of the reference asset typically includes appreciation or depreciation on the reference asset, plus any interest or dividend payments. To the extent that the total return of the reference asset exceeds or falls short of the offsetting interest rate obligation, the Fund will receive a payment from or make a payment to the counterparty.
Total return swap contracts are marked-to-market daily using valuations supplied by independent sources, and the change in value, if any, is recorded within “Swap contracts, at value” on the Statement of Assets and Liabilities. Payments received or made are recorded as realized gains or losses on the Statement of Operations. Total return swap contracts are subject to counterparty risk and unanticipated movements in value of exchange interest rates, securities or the index.
The average market value of total return swap contracts open during the six months ended April 30, 2020, was $(1,587,765). Open total return swap contracts at April 30, 2020, are listed in the Schedule of Investments.
Pioneer Flexible Opportunities Fund | Semiannual Report | 4/30/20 51
2. Management Agreement
The Adviser manages the Fund’s portfolio. Management fees are paid monthly and calculated daily at an annual rate of 0.70% of the Fund’s average daily net assets up to $1 billion, 0.675% of the next $1 billion and 0.65% on average daily net assets over $2 billion.
The Subsidiary has entered into a separate management contract with the Adviser, pursuant to which the Adviser manages the assets of the Subsidiary. As compensation for its management services to the Subsidiary and expenses incurred with respect to the Subsidiary, the Subsidiary pays the Adviser a fee at the annual rate of 0.70% of the Subsidiary’s average daily net assets up to $1 billion, 0.675% of the next $1 billion of the Subsidiary’s average daily net assets and 0.65% of the Subsidiary’s average daily net assets over $2 billion.
For the six months ended April 30, 2020, the effective management fee (excluding waivers and/or assumption of expenses) was equivalent to 0.70% (annualized) of the Fund’s average daily net assets.
The Adviser has contractually agreed to limit ordinary operating expenses (ordinary operating expenses means all fund expenses other than taxes, brokerage commissions, acquired fund fees and expenses and extraordinary expenses, such as litigation) to the extent required to reduce Fund expenses to 1.20%, 0.90% and 0.90% of the average daily net assets attributable to Class A, Class K and Class Y shares, respectively. These expense limitations are in effect through March 1, 2021. Fees and expenses of other investment companies in which the Fund may invest are not included in the expense limitations noted above. There can be no assurance that the Adviser will extend the expense limitation agreement beyond the date referred to above. Fees waived and expenses reimbursed during the six months ended April 30, 2020 are reflected in the Statement of Operations.
In addition, under the management and administration agreements, certain other services and costs, including accounting, regulatory reporting and insurance premiums, are paid by the Fund as administrative reimbursements. Included in “Due to affiliates” reflected on the Statement of Assets and Liabilities is $20,951 in management fees, administrative costs and certain other reimbursements payable to the Adviser at April 30, 2020.
3. Transfer Agent
DST Asset Manager Solutions, Inc. serves as the transfer agent to the Fund at negotiated rates. Transfer agent fees and payables shown on the Statement of Operations and the Statement of Assets and Liabilities, respectively, include sub-transfer agent expenses incurred through the Fund’s omnibus relationship contracts.
52 Pioneer Flexible Opportunities Fund | Semiannual Report | 4/30/20
In addition, the Fund reimbursed the transfer agent for out-of-pocket expenses incurred by the transfer agent related to shareowner communications activities such as proxy and statement mailings, and outgoing phone calls. For the six months ended April 30, 2020, such out-of-pocket expenses by class of shares were as follows:
| Shareowner Communications: | | | |
Class A | | $ | 6,934 | |
Class C | | | 3,906 | |
Class K | | | 28 | |
Class R | | | 7 | |
Class Y | | | 6,766 | |
| Total | | $ | 17,641 | |
4. Distribution and Service Plans
The Fund has adopted a distribution plan (the “Plan”) pursuant to Rule 12b-1 of the Investment Company Act of 1940 with respect to its Class A, Class C and Class R shares. Pursuant to the Plan, the Fund pays the Distributor 0.25% of the average daily net assets attributable to Class A shares as compensation for personal services and/or account maintenance services or distribution services with regard to Class A shares. Pursuant to the Plan, the Fund also pays the Distributor 1.00% of the average daily net assets attributable to Class C shares. The fee for Class C shares consists of a 0.25% service fee and a 0.75% distribution fee paid as compensation for personal services and/or account maintenance services or distribution services with regard to Class C shares. Included in “Due to affiliates” reflected on the Statement of Assets and Liabilities is $6,634 in distribution fees payable to the Distributor at April 30, 2020.
The Fund also has adopted a separate service plan for Class R shares (the “Service Plan”). The Service Plan authorizes the Fund to pay securities dealers, plan administrators or other service organizations that agree to provide certain services to retirement plans or plan participants holding shares of the Fund a service fee of up to 0.50% of the Fund’s average daily net assets attributable to Class R shares held by such plans.
In addition, redemptions of Class A and Class C shares may be subject to a contingent deferred sales charge (“CDSC”). A CDSC of 1.00% may be imposed on redemptions of certain net asset value purchases of Class A shares within 12 months of purchase. Redemptions of Class C shares within 12 months of purchase are subject to a CDSC of 1.00%, based on the lower of cost or market value of shares being redeemed. Shares purchased as part of an exchange remain subject to any CDSC that applied to the original purchase of those shares. There is no CDSC for Class K, Class R and Class Y shares. Proceeds from the CDSCs are paid to the Distributor. For the six months ended April 30, 2020, CDSCs in the amount of $15,747 were paid to the Distributor.
Pioneer Flexible Opportunities Fund | Semiannual Report | 4/30/20 53
5. Line of Credit Facility
The Fund, along with certain other funds in the Pioneer Family of Funds (the “Funds”), participates in a committed, unsecured revolving line of credit facility. Borrowings are used solely for temporary or emergency purposes. The Fund may borrow up to the lesser of the amount available under the credit facility or the limits set for borrowing by the Fund’s prospectus and the 1940 Act. Effective March 11, 2020, the Fund participates in a facility that is in the amount of $300 million. Prior to March 11, 2020, the Fund participated in a facility in the amount of $250 million. Under such facility, depending on the type of loan, interest on borrowings is payable at the London Interbank Offered Rate (“LIBOR”) plus a credit spread. The Fund also pays an annual commitment fee to participate in a credit facility. The commitment fee is allocated among participating Funds based on an allocation schedule set forth in the credit agreement. For the six months ended April 30, 2020, the Fund had no borrowings under the credit facility.
6. Master Netting Agreements
The Fund has entered into an International Swaps and Derivatives Association, Inc. Master Agreement (“ISDA Master Agreement”) or similar agreement with substantially all its derivative counterparties. An ISDA Master Agreement is a bilateral agreement between the Fund and a counterparty that governs the trading of certain Over the Counter (“OTC”) derivatives and typically contains, among other things, close-out and set-off provisions which apply upon the occurrence of an event of default and/or a termination event as defined under the relevant ISDA Master Agreement. The ISDA Master Agreement may also give a party the right to terminate all transactions traded under such agreement if, among other things, there is deterioration in the credit quality of the other party.
Upon an event of default or a termination of the ISDA Master Agreement, the non-defaulting party has the right to close out all transactions under such agreement and to net amounts owed under each transaction to determine one net amount payable by one party to the other. The right to close out and net payments across all transactions under the ISDA Master Agreement could result in a reduction of the Fund’s credit risk to its counterparty equal to any amounts payable by the Fund under the applicable transactions, if any. However, the Fund’s right to set off may be restricted or prohibited by the bankruptcy or insolvency laws of the particular jurisdiction to which each specific ISDA Master Agreement of each counterparty is subject.
The collateral requirements for derivatives transactions under an ISDA Master Agreement are governed by a credit support annex to the ISDA Master Agreement. Collateral requirements are generally determined at the close of business each day and are typically based on changes in market values for each
54 Pioneer Flexible Opportunities Fund | Semiannual Report | 4/30/20
transaction under an ISDA Master Agreement and netted into one amount for such agreement. Generally, the amount of collateral due from or to a counterparty is subject to threshold (a “minimum transfer amount”) before a transfer is required, which may vary by counterparty. Collateral pledged for the benefit of the Fund and/or counterparty is held in segregated accounts by the Fund’s custodian and cannot be sold, re-pledged, assigned or otherwise used while pledged. Cash that has been segregated to cover the Fund’s collateral obligations, if any, will be reported separately on the Statement of Assets and Liabilities as “Swaps collateral.” Securities pledged by the Fund as collateral, if any, are identified as such in the Schedule of Investments.
Financial instruments subject to an enforceable master netting agreement, such as an ISDA Master Agreement, have been offset on the Statement of Assets and Liabilities. The following charts show gross assets and liabilities of the Fund as of April 30, 2020:
| Derivative Assets | Derivatives | Non-Cash | Cash | Net Amount |
| Subject to Master | Available for | Collateral | Collateral | of Derivative |
| Counterparty | Netting Agreement | Offset | Received (a) | Received (a) | Assets (b) |
Citibank NA | $ 842,373 | $ — | $ — | $ — | $842,373 |
Goldman Sachs | | | | | |
| International | 346,917
| (346,917) | —
| — | — |
| Total | $1,189,290 | $(346,917) | $ — | $ — | $842,373 |
| Derivative Liabilities | Derivatives | Non-Cash | Cash | Net Amount |
| Subject to Master | Available for | Collateral | Collateral | of Derivative |
| Counterparty | Netting Agreement | Offset | Pledged (a) | Pledged (a) | Liabilities (c) |
Citibank NA | $ — | $ — | $ — | $ — | $ — |
Goldman Sachs | | | | | |
| International | 1,301,553 | (346,917) | — | — | 954,636 |
| Total | $1,301,553 | $(346,917) | $ — | $ — | $954,636 |
(a) | The amount presented here may be less than the total amount of collateral received/pledged as the net amount of derivative assets and liabilities cannot be less than $0. |
(b) | Represents the net amount due from the counterparty in the event of default. |
(c) | Represents the net amount payable to the counterparty in the event of default. |
7. Additional Disclosures about Derivative Instruments and Hedging Activities
The Fund’s use of derivatives may enhance or mitigate the Fund’s exposure to the following risks:
Interest rate risk relates to the fluctuations in the value of interest-bearing securities due to changes in the prevailing levels of market interest rates.
Credit risk relates to the ability of the issuer of a financial instrument to make further principal or interest payments on an obligation or commitment that it has to the Fund.
Pioneer Flexible Opportunities Fund | Semiannual Report | 4/30/20 55
Foreign exchange rate risk relates to fluctuations in the value of an asset or liability due to changes in currency exchange rates.
Equity risk relates to the fluctuations in the value of financial instruments as a result of changes in market prices (other than those arising from interest rate risk or foreign exchange rate risk), whether caused by factors specific to an individual investment, its issuer, or all factors affecting all instruments traded in a market or market segment.
Commodity risk relates to the risk that the value of a commodity or commodity index will fluctuate based on increases or decreases in the commodities market and factors specific to a particular industry or commodity.
The fair value of open derivative instruments (not considered to be hedging instruments for accounting disclosure purposes) by risk exposure at April 30, 2020, was as follows:
| Statement of Assets and Liabilities | | | | | |
| | | Foreign | | | |
| Interest | Credit | Exchange | Equity | Commodity |
| Rate Risk | Risk | Rate Risk | Risk | Risk |
| Assets | | | | | | |
| Options | | | | | | |
| purchased* | $ — | $ — | $ — | $ 842,373 | $ — |
| Total Value | $ — | $ — | $ — | $ 842,373 | $ — |
| Liabilities | | | | | | |
Net unrealized | | | | | | |
| depreciation on | | | | | | |
| futures contracts | $ — | $ — | $(323,587) | $ (7,460,607) | $ — |
Swap contracts, | | | | | | |
| at value | — | — | — | | (954,636) | — |
| Total Value | $ — | $ — | $(323,587) | $(8,415,243) | $ — |
* | Reflects the market value of purchased option contracts (see Note 1I.). These amounts are included in investments in unaffiliated issuers, at value, on the statement of assets and liabilities. |
56 Pioneer Flexible Opportunities Fund | Semiannual Report | 4/30/20
The effect of derivative instruments (not considered to be hedging instruments for accounting disclosure purposes) on the Statement of Operations by risk exposure at April 30, 2020, was as follows:
| Statement of Operations | | | | | | |
| | | | Foreign | | | |
| Interest | | Credit | Exchange | Equity | Commodity |
| Rate Risk | Risk | Rate Risk | Risk | Risk | |
| Net realized gain | | | | | | | |
| (loss) on: | | | | | | | |
| Options | | | | | | | |
| purchased* | $ — | $ — | $ — | $ (6,056,825) | $ — |
| Futures contracts | (225,237) | — | 406,697 | 18,575,681 | (3,230,792) |
Swap contracts | —
|
| — | — | (4,404,889) | |
|
| Total Value | $ (225,237) | $ — | $ 406,697 | $ 8,113,967 | $ 3,230,792 |
|
| Change in net | | | | | | | |
| unrealized | | | | | | | |
| appreciation | | | | | | | |
| (depreciation) on: | | | | | | | |
| Options | | | | | | | |
| purchased** | $ — | $ — | $ — | $ 2,635,899 | $ — |
| Futures contracts | —
|
| — | 422,281 | (6,632,563) | —
|
|
Swap contracts | —
|
| — | — | (1,179,749) | |
|
| Total Value | $ — | $ — | $ 422,281 | $ (5,176,413) | $ — |
* | Reflects the net realized gain (loss) on purchased option contracts (see Note 1l.). These amounts are included in net realized gain (loss) on investments in unaffiliated issuers, on the statements of operations. |
** | Reflects the change in net unrealized appreciation (depreciation) on purchased option contracts (see Note 1I.). These amounts are included in change in net unrealized appreciation (depreciation) on Investments in unaffiliated issuers, on the statements of operations. |
Pioneer Flexible Opportunities Fund | Semiannual Report | 4/30/20 57
Trustees, Officers and Service Providers
| Trustees | Officers |
Thomas J. Perna, Chairman | Lisa M. Jones, President and |
John E. Baumgardner, Jr. | Chief Executive Officer |
Diane Durnin | Mark E. Bradley, Treasurer and |
Benjamin M. Friedman | Chief Financial and |
Lisa M. Jones | Accounting Officer |
Lorraine H. Monchak | Christopher J. Kelley, Secretary and |
Marguerite A. Piret | Chief Legal Officer |
Fred J. Ricciardi | |
Kenneth J. Taubes | |
Investment Adviser and Administrator
Amundi Pioneer Asset Management, Inc.
Custodian and Sub-Administrator
Brown Brothers Harriman & Co.
Principal Underwriter
Amundi Pioneer Distributor, Inc.
Legal Counsel
Morgan, Lewis & Bockius LLP
Transfer Agent
DST Asset Manager Solutions, Inc.
Proxy Voting Policies and Procedures of the Fund are available without charge, upon request, by calling our toll free number (1-800-225-6292). Information regarding how the Fund voted proxies relating to portfolio securities during the most recent 12-month period ended June 30 is publicly available to shareowners at www.amundipioneer.com/us. This information is also available on the Securities and Exchange Commission’s web site at www.sec.gov.
58 Pioneer Flexible Opportunities Fund | Semiannual Report | 4/30/20
This page was intentionally left blank.
Pioneer Flexible Opportunities Fund | Semiannual Report | 4/30/20 59
This page was intentionally left blank.
60 Pioneer Flexible Opportunities Fund | Semiannual Report | 4/30/20
How to Contact Amundi Pioneer
We are pleased to offer a variety of convenient ways for you to contact us for assistance or information.
| | | |
| Call us for: | | |
Account Information, including existing accounts, | |
new accounts, prospectuses, applications | |
and service forms | | 1-800-225-6292 |
| |
FactFoneSM for automated fund yields, prices,
| |
account information and transactions | 1-800-225-4321 |
| | |
| Retirement plans information | 1-800-622-0176 |
|
| Write to us: | | |
Amundi Pioneer | | |
P.O. Box 219427 | | |
Kansas City, MO 64121-9427 | | |
| | | |
| Our toll-free fax | | 1-800-225-4240 |
| | |
| Our internet e-mail address | us.askamundipioneer@amundipioneer.com |
(for general questions about Amundi Pioneer only) | |
|
| Visit our web site: www.amundipioneer.com/us | |
This report must be preceded or accompanied by a prospectus.
The Fund files a complete schedule of portfolio holdings with the Securities and Exchange Commission for the first and third quarters of each fiscal year as an exhibit to its reports on Form N-PORT. Shareholders may view the filed Form N-PORT by visiting the Commission’s web site at https://www.sec.gov.
Amundi Pioneer Asset Management, Inc.
60 State Street
Boston, MA 02109
www.amundipioneer. com/us
Securities offered through Amundi Pioneer Distributor, Inc.
60 State Street, Boston, MA 02109
Underwriter of Pioneer Mutual Funds, Member SIPC
© 2020 Amundi Pioneer Asset Management 24879-09-0620
ITEM 2. CODE OF ETHICS.
(a) Disclose whether, as of the end of the period covered by the report, the registrant has adopted a code of ethics that applies to the registrant’s principal executive officer, principal financial officer, principal accounting officer or controller, or persons performing similar functions, regardless of whether these individuals are employed by the registrant or a third party. If the registrant has not adopted such a code of ethics, explain why it has not done so.
The registrant has adopted, as of the end of the period covered by this report, a code of ethics that applies to the registrant’s principal executive officer, principal financial officer, principal accounting officer and controller.
(b) For purposes of this Item, the term “code of ethics” means written standards that are reasonably designed to deter wrongdoing and to promote:
(1) Honest and ethical conduct, including the ethical handling of actual or apparent conflicts of interest between personal and professional relationships;
(2) Full, fair, accurate, timely, and understandable disclosure in reports and documents that a registrant files with, or submits to, the Commission and in other public communications made by the registrant;
(3) Compliance with applicable governmental laws, rules, and regulations;
(4) The prompt internal reporting of violations of the code to an appropriate person or persons identified in the code; and
(5) Accountability for adherence to the code.
(c) The registrant must briefly describe the nature of any amendment, during the period covered by the report, to a provision of its code of ethics that applies to the registrant’s principal executive officer, principal financial officer, principal accounting officer or controller, or persons performing similar functions, regardless of whether these individuals are employed by the registrant or a third party, and that relates to any element of the code of ethics definition enumerated in paragraph (b) of this Item. The registrant must file a copy of any such amendment as an exhibit pursuant to Item 10(a), unless the registrant has elected to satisfy paragraph (f) of this Item by posting its code of ethics on its website pursuant to paragraph (f)(2) of this Item, or by undertaking to provide its code of ethics to any person without charge, upon request, pursuant to paragraph (f)(3) of this Item.
The registrant has made no amendments to the code of ethics during the period covered by this report.
(d) If the registrant has, during the period covered by the report, granted a waiver, including an implicit waiver, from a provision of the code of ethics to the registrant’s principal executive officer, principal financial officer, principal accounting officer or controller, or persons performing similar functions, regardless of whether these individuals are employed by the registrant or a third party, that relates to one or more of the items set forth in paragraph (b) of this Item, the registrant must briefly describe the nature of the waiver, the name of the person to whom the waiver was granted, and the date of the waiver.
Not applicable.
(e) If the registrant intends to satisfy the disclosure requirement under paragraph (c) or (d) of this Item regarding an amendment to, or a waiver from, a provision of its code of ethics that applies to the registrant’s principal executive officer, principal financial officer, principal accounting officer or controller, or persons performing similar functions and that relates to any element of the code of ethics definition
enumerated in paragraph (b) of this Item by posting such information on its Internet website, disclose the registrant’s Internet address and such intention.
Not applicable.
(f) The registrant must:
(1) File with the Commission, pursuant to Item 12(a)(1), a copy of its code of ethics that applies to the registrant’s principal executive officer, principal financial officer, principal accounting officer or controller, or persons performing similar functions, as an exhibit to its annual report on this Form N-CSR (see attachment);
(2) Post the text of such code of ethics on its Internet website and disclose, in its most recent report on this Form N-CSR, its Internet address and the fact that it has posted such code of ethics on its Internet website; or
(3) Undertake in its most recent report on this Form N-CSR to provide to any person without charge, upon request, a copy of such code of ethics and explain the manner in which such request may be made. See Item 10(2)
ITEM 3. AUDIT COMMITTEE FINANCIAL EXPERT.
(a) (1) Disclose that the registrant’s board of trustees has determined that the registrant either:
(i) Has at least one audit committee financial expert serving on its audit committee; or
(ii) Does not have an audit committee financial expert serving on its audit committee.
The registrant’s Board of Trustees has determined that the registrant has at least one audit committee financial expert.
(2) If the registrant provides the disclosure required by paragraph (a)(1)(i) of this Item, it must disclose the name of the audit committee financial expert and whether that person is “independent.” In order to be considered “independent” for purposes of this Item, a member of an audit committee may not, other than in his or her capacity as a member of the audit committee, the board of trustees, or any other board committee:
(i) Accept directly or indirectly any consulting, advisory, or other compensatory fee from the issuer; or
(ii) Be an “interested person” of the investment company as defined in Section 2(a)(19) of the Act (15 U.S.C. 80a-2(a)(19)).
Mr. Fred J. Ricciardi, an independent trustee, is such an audit committee financial expert.
(3) If the registrant provides the disclosure required by paragraph (a)(1) (ii) of this Item, it must explain why it does not have an audit committee financial expert.
Not applicable.
ITEM 4. PRINCIPAL ACCOUNTANT FEES AND SERVICES.
(a) Disclose, under the caption AUDIT FEES, the aggregate fees billed for each of the last two fiscal years for professional services rendered by the principal accountant for the audit of the registrant’s annual financial statements or services that are normally provided by the accountant in connection with statutory and regulatory filings or engagements for those fiscal years.
N/A
(b) Disclose, under the caption AUDIT-RELATED FEES, the aggregate fees billed in each of the last two fiscal years for assurance and related services by the principal accountant that are reasonably related to the performance of the audit of the registrant’s financial statements and are not reported under paragraph (a) of this Item. Registrants shall describe the nature of the services comprising the fees disclosed under this category.
N/A
(c) Disclose, under the caption TAX FEES, the aggregate fees billed in each of the last two fiscal years for professional services rendered by the principal accountant for tax compliance, tax advice, and tax planning. Registrants shall describe the nature of the services comprising the fees disclosed under this category.
N/A
(d) Disclose, under the caption ALL OTHER FEES, the aggregate fees billed in each of the last two fiscal years for products and services provided by the principal accountant, other than the services reported in paragraphs (a) through (c) of this Item. Registrants shall describe the nature of the services comprising the fees disclosed under this category.
N/A
(e) (1) Disclose the audit committee’s pre-approval policies and procedures described in paragraph (c)(7) of Rule 2-01 of Regulation S-X.
PIONEER FUNDS
APPROVAL OF AUDIT, AUDIT-RELATED, TAX AND OTHER SERVICES
PROVIDED BY THE INDEPENDENT AUDITOR
SECTION I - POLICY PURPOSE AND APPLICABILITY
The Pioneer Funds recognize the importance of maintaining the independence of their outside auditors. Maintaining independence is a shared responsibility involving Amundi Pioneer Asset Management, Inc, the audit committee and the independent auditors.
The Funds recognize that a Fund’s independent auditors: 1) possess knowledge of the Funds, 2) are able to incorporate certain services into the scope of the audit, thereby avoiding redundant work, cost and disruption of Fund personnel and processes, and 3) have expertise that has value to the Funds. As a result, there are situations where it is desirable to use the Fund’s independent auditors for services in addition to the annual audit and where the potential for conflicts of interests are minimal. Consequently, this policy, which is intended to comply with Rule 210.2-01(C)(7), sets forth guidelines and procedures to be followed by the Funds when retaining the independent audit firm to perform audit, audit-related tax and other services under those circumstances, while also maintaining independence.
Approval of a service in accordance with this policy for a Fund shall also constitute approval for any other Fund whose pre-approval is required pursuant to Rule 210.2-01(c)(7)(ii).
In addition to the procedures set forth in this policy, any non-audit services that may be provided consistently with Rule 210.2-01 may be approved by the Audit Committee itself and any pre-approval that may be waived in accordance with Rule 210.2-01(c)(7)(i)(C) is hereby waived.
Selection of a Fund’s independent auditors and their compensation shall be determined by the Audit Committee and shall not be subject to this policy.
| | | |
| SECTION II - POLICY |
| |
SERVICE CATEGORY | SERVICE CATEGORY DESCRIPTION | SPECIFIC PRE-APPROVED SERVICE SUBCATEGORIES |
| | | |
I. AUDIT SERVICES | Services that are directly | o Accounting research assistance |
| | related to performing the | o SEC consultation, registration |
| | independent audit of the Funds | statements, and reporting |
| | | o Tax accrual related matters |
| | | o Implementation of new accounting standards |
| | | o Compliance letters (e.g. rating agency letters) |
| | | o Regulatory reviews and assistance |
| | | regarding financial matters |
| | | o Semi-annual reviews (if requested) |
| | | o Comfort letters for closed end offerings |
II. AUDIT-RELATED | Services which are not | o AICPA attest and agreed-upon procedures |
SERVICES | prohibited under Rule | o Technology control assessments |
| | 210.2-01(C)(4) (the “Rule”) | o Financial reporting control assessments |
| | and are related extensions of | o Enterprise security architecture |
| | the audit services support the | assessment |
| | audit, or use the knowledge/expertise | |
| | gained from the audit procedures as a | |
| | foundation to complete the project. | |
| | In most cases, if the Audit-Related | |
| | Services are not performed by the | |
| | Audit firm, the scope of the Audit | |
| | Services would likely increase. | |
| | The Services are typically well-defined | |
| | and governed by accounting | |
| | professional standards (AICPA, | |
| | SEC, etc.) | |
| | |
AUDIT COMMITTEE APPROVAL POLICY | AUDIT COMMITTEE REPORTING POLICY |
| o “One-time” pre-approval | o A summary of all such |
| for the audit period for all | services and related fees |
| pre-approved specific service | reported at each regularly |
| subcategories. Approval of the | scheduled Audit Committee |
| independent auditors as | meeting. |
| auditors for a Fund shall | |
| constitute pre approval for | |
| these services. | |
| |
| o “One-time” pre-approval | o A summary of all such |
| for the fund fiscal year within | services and related fees |
| a specified dollar limit | (including comparison to |
| for all pre-approved | specified dollar limits) |
| specific service subcategories | reported quarterly. |
| |
| o Specific approval is | |
| needed to exceed the | |
| pre-approved dollar limit for | |
| these services (see general | |
| Audit Committee approval policy | |
| below for details on obtaining | |
| specific approvals) | |
| |
| o Specific approval is | |
| needed to use the Fund’s | |
| auditors for Audit-Related | |
| Services not denoted as | |
| “pre-approved”, or | |
| to add a specific service | |
| subcategory as “pre-approved” | |
SECTION III - POLICY DETAIL, CONTINUED
| | |
SERVICE CATEGORY | SERVICE CATEGORY DESCRIPTION | SPECIFIC PRE-APPROVED SERVICE |
| | | SUBCATEGORIES |
III. TAX SERVICES | Services which are not | o Tax planning and support |
| | prohibited by the Rule, | o Tax controversy assistance |
| | if an officer of the Fund | o Tax compliance, tax returns, excise |
| | determines that using the | tax returns and support |
| | Fund’s auditor to provide | o Tax opinions |
| | these services creates | |
| | significant synergy in | |
| | the form of efficiency, | |
| | minimized disruption, or | |
| | the ability to maintain a | |
| | desired level of | |
| | confidentiality. | |
| | |
| AUDIT COMMITTEE APPROVAL POLICY | AUDIT COMMITTEE REPORTING POLICY |
o “One-time” pre-approval | o A summary of |
for the fund fiscal year | all such services and |
within a specified dollar limit | related fees |
| | (including comparison |
| | to specified dollar |
| | limits) reported |
| | quarterly. |
| |
o Specific approval is | |
| needed to exceed the | |
| pre-approved dollar limits for | |
| these services (see general | |
| Audit Committee approval policy | |
| below for details on obtaining | |
| specific approvals) | |
| |
o Specific approval is | |
| needed to use the Fund’s | |
| auditors for tax services not | |
| denoted as pre-approved, or to | |
add a specific service subcategory as | |
| “pre-approved” | |
SECTION III - POLICY DETAIL, CONTINUED
| |
SERVICE CATEGORY | SERVICE CATEGORY DESCRIPTION | SPECIFIC PRE-APPROVED SERVICE |
| | | SUBCATEGORIES |
IV. OTHER SERVICES | Services which are not | o Business Risk Management support |
| | prohibited by the Rule, | o Other control and regulatory |
A. SYNERGISTIC, | if an officer of the Fund | compliance projects |
UNIQUE QUALIFICATIONS | determines that using the | |
| | Fund’s auditor to provide | |
| | these services creates | |
| | significant synergy in | |
| | the form of efficiency, | |
| | minimized disruption, | |
| | the ability to maintain a | |
| | desired level of | |
| | confidentiality, or where | |
| | the Fund’s auditors | |
| | posses unique or superior | |
| | qualifications to provide | |
| | these services, resulting | |
| | in superior value and | |
| | results for the Fund. | |
| | |
AUDIT COMMITTEE APPROVAL POLICY | AUDIT COMMITTEE REPORTING POLICY |
o “One-time” pre-approval | o A summary of |
| for the fund fiscal year within | all such services and |
| a specified dollar limit | related fees |
| | (including comparison |
| | to specified dollar |
| | limits) reported |
| | quarterly. |
o Specific approval is | |
| needed to exceed the | |
| pre-approved dollar limits for | |
| these services (see general | |
| Audit Committee approval policy | |
| below for details on obtaining | |
| specific approvals) | |
| |
o Specific approval is | |
| needed to use the Fund’s | |
| auditors for “Synergistic” or | |
| “Unique Qualifications” Other | |
| Services not denoted as | |
| pre-approved to the left, or to | |
| add a specific service | |
| subcategory as “pre-approved” | |
SECTION III - POLICY DETAIL, CONTINUED
| |
SERVICE CATEGORY | SERVICE CATEGORY DESCRIPTION | SPECIFIC PROHIBITED SERVICE |
| | | SUBCATEGORIES |
PROHIBITED SERVICES | Services which result | 1. Bookkeeping or other services |
| | in the auditors losing | related to the accounting records or |
| | independence status | financial statements of the audit |
| | under the Rule. | client* |
| | | 2. Financial information systems design |
| | | and implementation* |
| | | 3. Appraisal or valuation services, |
| | | fairness* opinions, or |
| | | contribution-in-kind reports |
| | | 4. Actuarial services (i.e., setting |
| | | actuarial reserves versus actuarial |
| | | audit work)* |
| | | 5. Internal audit outsourcing services* |
| | | 6. Management functions or human |
| | | resources |
| | | 7. Broker or dealer, investment |
| | | advisor, or investment banking services |
| | | 8. Legal services and expert services |
| | | unrelated to the audit |
| | | 9. Any other service that the Public |
| | | Company Accounting Oversight Board |
| | | determines, by regulation, is |
| | | impermissible |
| | |
AUDIT COMMITTEE APPROVAL POLICY | AUDIT COMMITTEE REPORTING POLICY |
o These services are not to be | o A summary of all |
| performed with the exception of the(*) | services and related |
| services that may be permitted | fees reported at each |
| if they would not be subject to audit | regularly scheduled |
| procedures at the audit client (as | Audit Committee meeting |
| defined in rule 2-01(f)(4)) level | will serve as continual |
| the firm providing the service. | confirmation that has |
| | not provided any |
| | restricted services. |
GENERAL AUDIT COMMITTEE APPROVAL POLICY:
o For all projects, the officers of the Funds and the Fund’s auditors will each make an assessment to determine that any proposed projects will not impair independence.
o Potential services will be classified into the four non-restricted service categories and the “Approval of Audit, Audit-Related, Tax and Other Services” Policy above will be applied. Any services outside the specific pre-approved service subcategories set forth above must be specifically approved by the Audit Committee.
o At least quarterly, the Audit Committee shall review a report summarizing the services by service category, including fees, provided by the Audit firm as set forth in the above policy.
(2) Disclose the percentage of services described in each of paragraphs (b) through (d) of this Item that were approved by the audit committee pursuant to paragraph (c)(7)(i)(C) of Rule 2-01 of Regulation S-X.
N/A
(f) If greater than 50 percent, disclose the percentage of hours expended on the principal accountants engagement to audit the registrant’s financial statements for the most recent fiscal year that were attributed to work performed by persons other than the principal accountant’s full-time, permanent employees.
N/A
(g) Disclose the aggregate non-audit fees billed by the registrants accountant for services rendered to the registrant, and rendered to the registrants investment adviser (not including any sub-adviser whose role is primarily portfolio management and is subcontracted with or overseen by another investment adviser), and any entity controlling, controlled by, or under common control with the adviser that provides ongoing services to the registrant for each of the last two fiscal years of the registrant.
N/A
(h) Disclose whether the registrants audit committee of the board of trustees has considered whether the provision of non-audit services that were rendered to the registrants investment adviser (not including any subadviser whose role is primarily portfolio management and is subcontracted with or overseen by another investment adviser), and any entity controlling, controlled by, or under common control with the investment adviser that provides ongoing services to the registrant that were not pre-approved pursuant to paragraph (c)(7)(ii) of Rule 2-01 of Regulation S-X is compatible with maintaining the principal accountant’s independence.
The Fund’s audit committee of the Board of Trustees has considered whether the provision of non-audit services that were rendered to the Affiliates (as defined) that were not pre- approved pursuant to paragraph (c)(7)(ii) of Rule 2-01 of Regulation S-X is compatible with maintaining the principal accountant’s independence.
ITEM 5. AUDIT COMMITTEE OF LISTED REGISTRANTS
(a) If the registrant is a listed issuer as defined in Rule 10A-3 under the Exchange Act (17 CFR 240.10A-3), state whether or not the registrant has a separately-designated standing audit committee established in accordance with Section 3(a)(58)(A) of the Exchange Act (15 U.S.C. 78c(a)(58)(A)). If the registrant has such a committee, however designated, identify each committee member. If the entire board of directors is acting as the registrant’s audit committee as specified in Section 3(a)(58)(B) of the Exchange Act (15 U.S.C. 78c(a)(58)(B)), so state.
N/A
(b) If applicable, provide the disclosure required by Rule 10A-3(d) under the Exchange Act (17 CFR 240.10A-3(d)) regarding an exemption from the listing standards for audit committees.
N/A
ITEM 6. SCHEDULE OF INVESTMENTS.
File Schedule of Investments in securities of unaffiliated issuers as of the close of the reporting period as set forth in 210.1212 of Regulation S-X [17 CFR 210.12-12], unless the schedule is included as part of the report to shareholders filed under Item 1 of this Form.
Included in Item 1
ITEM 7. DISCLOSURE OF PROXY VOTING POLICIES AND PROCEDURES FOR CLOSED-END MANAGEMENT INVESTMENT COMPANIES.
A closed-end management investment company that is filing an annual report on this Form N-CSR must, unless it invests exclusively in non-voting securities, describe the policies and procedures that it uses to determine how to vote proxies relating to portfolio securities, including the procedures that the company uses when a vote presents a conflict between the interests of its shareholders, on the one hand, and those of the company’s investment adviser; principal underwriter; or any affiliated person (as defined in Section 2(a)(3) of the Investment Company Act of 1940 (15 U.S.C. 80a-2(a)(3)) and the rules thereunder) of the company, its investment adviser, or its principal underwriter, on the other. Include any policies and procedures of the company’s investment adviser, or any other third party, that the company uses, or that are used on the company’s behalf, to determine how to vote proxies relating to portfolio securities.
Not applicable to open-end management investment companies.
ITEM 8. PORTFOLIO MANAGERS OF CLOSED-END MANAGEMENT INVESTMENT COMPANIES.
(a) If the registrant is a closed-end management investment company that is filing an annual report on this Form N-CSR, provide the following information:
(1) State the name, title, and length of service of the person or persons employed by or associated with the registrant or an investment adviser of the registrant who are primarily responsible for the day-to-day management of the registrant’s portfolio (“Portfolio Manager”). Also state each Portfolio Manager’s business experience during the past 5 years.
Not applicable to open-end management investment companies.
ITEM 9. PURCHASES OF EQUITY SECURITIES BY CLOSED-END MANAGEMENT INVESTMENT COMPANY AND AFFILIATED PURCHASERS.
(a) If the registrant is a closed-end management investment company, in the following tabular format, provide the information specified in paragraph (b) of this Item with respect to any purchase made by or on behalf of the registrant or any affiliated purchaser, as defined in Rule 10b-18(a)(3) under the Exchange Act (17 CFR 240.10b-18(a)(3)), of shares or other units of any class of the registrant’s equity securities that is registered by the registrant pursuant to Section 12 of the Exchange Act (15 U.S.C. 781).
Not applicable to open-end management investment companies.
ITEM 10. SUBMISSION OF MATTERS TO A VOTE OF SECURITY HOLDERS.
Describe any material changes to the procedures by which shareholders may recommend nominees to the registrant’s board of directors, where those changes were implemented after the registrant last provided disclosure in response to the requirements of Item 407(c)(2)(iv) of Regulation S-R(17 CFR 229.407)(as required by Item 22(b)(15)) of Schedule 14A (17 CFR 240.14a-101), or this Item.
There have been no material changes to the procedures by which the shareholders may recommend nominees to the registrant’s board of directors since the registrant last provided disclosure in response to the requirements of Item 407(c)(2)(iv) of Regulation S-R of Schedule 14(A) in its definitive proxy statement, or this item.
ITEM 11. CONTROLS AND PROCEDURES.
(a) Disclose the conclusions of the registrant’s principal executive and principal financials officers, or persons performing similar functions, regarding the effectiveness of the registrant’s disclosure controls and procedures (as defined in Rule 30a-3(c) under the Act (17 CFR 270.30a-3(c))) as of a date within 90 days of the filing date of the report that includes the disclosure required by this paragraph, based on the evaluation of these controls and procedures required by Rule 30a-3(b) under the Act (17 CFR 270.30(a)-3(b) and Rules 13a-15(b) or 15d-15(b) under the Exchange Act (17 CFR 240.13a-15(b) or 240.15d-15(b)).
The registrant’s principal executive officer and principal financial officer have concluded that the registrant’s disclosure controls and procedures are effective based on the evaluation of these controls and procedures as of a date within 90 days of the filing date of this report.
(b) Disclose any change in the registrant’s internal control over financial reporting (as defined in Rule 30a-3(d) under the Act (17CFR 270.30a-3(d)) that occured during the second fiscal quarter of the period covered by this report that has materially affected, or is reasonably likely to materially affect, the registrant’s internal control over financial reporting.
There were no significant changes in the registrant’s internal control over financial reporting that occurred during the second fiscal quarter of the period covered by this report that have materially affected, or are reasonably likely to materially affect, the registrant’s internal control over financial reporting.
Item 12. Disclosure of Securities Lending Activities for Closed-End Management Investment Companies.
(a) If the registrant is a closed-end management investment company, provide the following dollar amounts of income and compensation related to the securities lending activities of the registrant during its most recent fiscal year:
N/A
(1) Gross income from securities lending activities;
N/A
(2) All fees and/or compensation for each of the following securities lending activities and related services: any share of revenue generated by the securities lending program paid to the securities lending agent(s) (revenue split); fees paid for cash collateral management services (including fees deducted from a pooled cash collateral reinvestment vehicle) that are not included in the revenue split; administrative fees that are not included in the revenue split; fees for indemnification that are not included in the revenue split; rebates paid to borrowers; and any other fees relating to the securities lending program that are not included in the revenue split, including a description of those other fees;
N/A
(3) The aggregate fees/compensation disclosed pursuant to paragraph (2); and
N/A
(4) Net income from securities lending activities (i.e., the dollar amount in paragraph (1) minus the dollar amount in paragraph (3)).
If a fee for a service is included in the revenue split, state that the fee is included in the revenue split.
N/A
(b) If the registrant is a closed-end management investment company, describe the services provided to the registrant by the securities lending agent in the registrants most recent fiscal year.
N/A
ITEM 13. EXHIBITS.
(a) File the exhibits listed below as part of this Form. Letter or number the exhibits in the sequence indicated.
SIGNATURES
[See General Instruction F]
Pursuant to the requirements of the Securities Exchange Act of 1934 and the Investment Company Act of 1940, the registrant has duly caused this report to be signed on its behalf by the undersigned, thereunto duly authorized.
(Registrant) Pioneer Series Trust VI
By (Signature and Title)* /s/ Lisa M. Jones
Lisa M. Jones, President & Chief Executive Officer
Date July 6, 2020
Pursuant to the requirements of the Securities Exchange Act of 1934 and the Investment Company Act of 1940, this report has been signed below by the following persons on behalf of the registrant and in the capacities and on the dates indicated.
By (Signature and Title)* /s/ Lisa M. Jones
Lisa M. Jones, President & Chief Executive Officer
Date July 6, 2020
By (Signature and Title)* /s/ Mark E. Bradley
Mark E. Bradley, Treasurer & Chief Accounting & Financial Officer
Date July 6, 2020
* Print the name and title of each signing officer under his or her signature.