UNITED STATES
SECURITIES AND EXCHANGE COMMISSION
Washington, D.C. 20549
FORM N-CSR
CERTIFIED SHAREHOLDER REPORT OF REGISTERED
MANAGEMENT INVESTMENT COMPANIES
Investment Company Act file number 811-21978
Pioneer Series Trust VI
(Exact name of registrant as specified in charter)
60 State Street, Boston, MA 02109
(Address of principal executive offices) (ZIP code)
Terrence J. Cullen, Amundi Pioneer Asset Management, Inc.,
60 State Street, Boston, MA 02109
(Name and address of agent for service)
Registrant’s telephone number, including area code: (617) 742-7825
Date of fiscal year end: October 31, 2020
Date of reporting period: November 1, 2019 through October 31, 2020
Form N-CSR is to be used by management investment companies to file reports with the Commission not later than 10 days after the transmission to stockholders of any report that is required to be transmitted to stockholders under Rule 30e-1 under the Investment Company Act of 1940 (17 CFR 270.30e-1). The Commission may use the information provided on Form N-CSR in its regulatory, disclosure review, inspection, and policymaking roles.
A registrant is required to disclose the information specified by Form N-CSR, and the Commission will make this information public. A registrant is not required to respond to the collection of information contained in Form N-CSR unless the Form displays a currently valid Office of Management and Budget (“OMB”) control number. Please direct comments concerning the accuracy of the information collection burden estimate and any suggestions for reducing the burden to Secretary, Securities and Exchange Commission, 450 Fifth Street, NW, Washington, DC 20549-0609. The OMB has reviewed this collection of information under the clearance requirements of 44 U.S.C. ss. 3507.
Pioneer Floating Rate Fund
Annual Report | October 31, 2020
| A: FLARX | C: FLRCX | Y: FLYRX |
Beginning in or after April 2021, as permitted by regulations adopted by the Securities and Exchange Commission, paper copies of the Fund’s shareholder reports like this one will no longer be sent by mail, unless you specifically request paper copies of the reports from the Fund or from your financial intermediary, such as a broker-dealer, bank or insurance company. Instead, the reports will be made available on the Fund’s website, and you will be notified by mail each time a report is posted and provided with a website link to access the report.
If you already elected to receive shareholder reports electronically, you will not be affected by this change and you need not take any action. You may elect to receive shareholder reports and other communications electronically by contacting your financial intermediary or, if you invest directly with the Fund, by calling 1-800-225-6292.
You may elect to receive all future reports in paper free of charge. If you invest directly with the Fund, you can inform the Fund that you wish to continue receiving paper copies of your shareholder reports by calling 1-800-225-6292. If you invest through a financial intermediary, you can contact your financial intermediary to request that you continue to receive paper copies of your shareholder reports. Your election to receive reports in paper will apply to all funds held in your account if you invest through your financial intermediary or all funds held within the Pioneer Fund complex if you invest directly.
visit us: www.amundipioneer.com/us
| 2 | |
| 4 | |
| 11 | |
| 12 | |
| 13 | |
| 16 | |
| 18 | |
| 37 | |
| 44 | |
| 61 | |
| 63 | |
| 64 | |
| 66 | |
| 71 |
Pioneer Floating Rate Fund | Annual Report | 10/31/20 1
The new decade has arrived delivering a calendar year that will go down in the history books. The beginning of 2020 seemed to extend the positive market environment of 2019. Then, March roared in like a lion and the COVID-19 pandemic became a global crisis impacting lives and life as we know it. As the fourth quarter of 2020 got underway, it appeared that the long-anticipated “second wave” of COVID-19 cases was occurring, both in some U.S. states and in Europe. In response, some governments began retightening restrictions on both business and personal activities.
However, as the fourth quarter continued, we began to read some encouraging news on the vaccine front, as multiple pharmaceutical companies announced successful clinical trials for their COVID-19 vaccinations and applied for emergency-use approval for the drugs with the Food and Drug Administration. Government officials followed up on the positive news by announcing that deployment of at least one of the vaccines to frontline workers could begin even before the end of this calendar year, with the potential for widespread distribution by mid-2021.
While there may finally be a light visible at the end of the pandemic tunnel as 2020 comes to a close, the long-term impact on the global economy from COVID-19, while currently unknown, is likely to be considerable. It is clear that several industries have already felt greater effects than others, and the markets, which do not thrive on uncertainty, have been volatile, delivering significantly negative performance in the first quarter, and then recovering most of those losses throughout the following quarters. Despite the rebound, volatility has remained elevated, with momentum rising and falling on seemingly every bit of positive or negative news about the virus, from vaccines to spikes in the number of cases as well as rising hospitalization rates in some areas. In addition, the U.S. Presidential Election was in high gear as we entered the fourth quarter. This election contributed to the market volatility as investors pondered the possible outcomes and their potential effects on the economic outlook.
With the advent of COVID-19 last winter, we implemented our business continuity plan according to the new COVID-19 guidelines, and most of our employees have been working remotely since March. To date, our operating environment has faced no interruption. I am proud of the careful planning that has taken place and confident we can maintain this environment for as long as is prudent. History in the making for a company that first opened its doors way back in 1928.
2 Pioneer Floating Rate Fund | Annual Report | 10/31/20
Since 1928, Amundi’s investment process has been built on a foundation of fundamental research and active management, principles which have guided our investment decisions for more than 90 years. We believe active management – that is, making active investment decisions – can help mitigate the risks during periods of market volatility. As 2020 has reminded us, investment risk can arise from a number of factors in today’s global economy, including slower or stagnating growth, changing U.S. Federal Reserve policy, oil price shocks, political and geopolitical factors and, unfortunately, major public health concerns such as a viral pandemic.
At Amundi, active management begins with our own fundamental, bottom-up research process. Our team of dedicated research analysts and portfolio managers analyzes each security under consideration, communicating directly with the management teams of the companies issuing the securities and working together to identify those securities that best meet our investment criteria for our family of funds. Our risk management approach begins with each and every security, as we strive to carefully understand the potential opportunity, while considering any and all risk factors.
Today, as investors, we have many options. It is our view that active management can serve shareholders well, not only when markets are thriving, but also during periods of market stress.
As you consider your long-term investment goals, we encourage you to work with your financial professional to develop an investment plan that paves the way for you to pursue both your short-term and long-term goals.
We remain confident that the current crisis, like others in human history, will pass, and we greatly appreciate the trust you have placed in us and look forward to continuing to serve you in the future.
Sincerely,

Lisa M. Jones
Head of the Americas, President and CEO of U.S.
Amundi Pioneer Asset Management USA, Inc.
December 18, 2020
Any information in this shareowner report regarding market or economic trends or the factors influencing the Fund’s historical or future performance are statements of opinion as of the date of this report. Past performance is no guarantee of future results.
Pioneer Floating Rate Fund | Annual Report | 10/31/20 3
In the following interview, Jonathan Sharkey discusses the factors that influenced the bank-loan market and the performance of Pioneer Floating Rate Fund during the 12-month period ended October 31, 2020. Mr. Sharkey, a senior vice president and a portfolio manager at Amundi Pioneer Asset Management, Inc. (Amundi)*, is responsible for the day-to-day management of the Fund.
Q How did the Fund perform during the 12-month period ended October 31, 2020?
A Pioneer Floating Rate Fund’s Class A shares returned -0.71% at net asset value during the 12-month period ended October 31, 2020, while the Fund’s benchmark, the Standard & Poor’s/Loan Syndications & Trading Association Leveraged Performing Loan Index (the S&P/LSTA Index), returned 2.09%. During the same period, the average return of the 246 mutual funds in Morningstar’s Bank Loan Funds category was -0.26%.
Q How would you describe the environment for investing in bank loans during the 12-month period ended October 31, 2020?
A At the beginning of the period in November 2019, demand for loans had been muted amidst an environment of heightened risk-aversion among investors, driven by ongoing geopolitical uncertainties, trade war tensions, and concerns about global economic growth. Loan mutual funds continued to experience significant outflows at that time, as retail investors responded to the limited near-term prospects for a rise in short-term interest rates, given an accommodative Federal Reserve (Fed), which had reduced the federal funds rate’s target range three times during 2019. Lower-quality loans, in particular, experienced headwinds from a demand perspective. Specifically, managers of collateralized loan obligations (CLOs), which have often absorbed the bulk of new issuance, had become increasingly wary of deals in the “B-” rating category, due to the risk of downgrades; CLOs are subject to risk guidelines and typically have had quite limited ability to accommodate loans in the “CCC” rating category. In the early part of the 12-month period, we did see significant refinancing to lower yields among higher-quality loans, given their ratings attractiveness for CLOs.
Beginning in mid-February of 2020, the COVID-19 virus, which first surfaced in China, but quickly became a worldwide pandemic, began having a dramatic effect on the financial markets. Global economies
* See Notes to Financial Statements Note 8.
4 Pioneer Floating Rate Fund | Annual Report | 10/31/20
ground to a near halt during March as concerns about public health led to the rapid implementation by governments and businesses of extreme measures focused on virus containment. Oil prices plummeted as well, in response to slumping global demand resulting from the spread of COVID-19, and from a supply shock spurred by a price war launched on March 8 between Saudi Arabia and Russia.
In financial markets, uncertainty over the scope and duration of the pandemic crisis as well as the need for cash led to wholesale liquidations across most asset classes and a “flight-to-safety” trade that drove U.S. Treasury yields to historic lows. Bank loans and high-yield corporate bonds declined sharply in value as the outlook shifted from growth to recession, and investors anticipated a spike in defaults. The S&P/LSTA Index declined by 12.37% in March, the second-steepest monthly loss in the history of the Index. Volatility in the secondary loan market spiked to all-time highs, with March seeing both the worst and best single-day returns in the history of the loan market. March also saw a record volume of loan ratings downgrades, largely concentrated within lower-quality loans.
The unprecedented shutting down of much of the economy due to COVID-19 spurred extraordinary monetary and fiscal policy responses. First, the Fed jumped into action by dusting off its 2008/2009 policy “playbook” and rapidly rolling out a raft of programs aimed at restoring market liquidity, facilitating credit availability, and boosting investors’ confidence. The measures included reducing the benchmark federal funds rate’s target range to near zero and committing to making purchases of a broad range of fixed-income assets. On the fiscal side, as March drew to a close, the U.S. government passed a $2.2 trillion stimulus bill, followed weeks later by another aid package worth nearly $500 billion, highlighted by support for small businesses. After volatility in the markets subsided, the three-month London Interbank Offered Rate (LIBOR), which is used to re-set loan rates, eventually fell more in line with the federal funds rate, declining from 190 basis points (bps) in November 2019 to 22 bps at the end of the 12-month period, thus putting pressure on the dividend yields of loan funds. (A basis point is equal to 1/100th of a percentage point.)
The unprecedented scope and rapidity of the response from policymakers allowed the markets for riskier assets to regain the ground lost in the immediate aftermath of the COVID-19 shutdowns. The leveraged loan secondary market rebounded in April, with the S&P/LSTA Index gaining
Pioneer Floating Rate Fund | Annual Report | 10/31/20 5
4.50%, its best one-month return in more than 10 years. Loans continued to post positive returns through October, although the pace of gains eased as the 12-month period progressed.
Bank loans finished the 12-month period with a modest positive return. Within the loan market, the oil & gas, metals & mining, cosmetics, and retail segments lagged, while food products, utilities, and pharmaceuticals held up relatively well, as those sectors felt fewer effects from the economic turmoil caused by COVID-19.
Q What factors had the biggest effects on the Fund’s performance relative to the S&P/LSTA Index during the 12-month period ended October 31, 2020?
A One key factor in the Fund’s underperformance versus the benchmark during the 12-month period was the fact that the Fund had to maintain sufficient cash levels in order to accommodate the rapid and sizeable outflows that occurred as the COVID-19 crisis emerged in March, and which continued, albeit at a slower pace, throughout the remainder of the reporting period, whereas the benchmark had no such obligations.
While the Fund’s allocations across the various loan-market sectors contributed positively overall to relative performance over the 12-month period, the negative effects of security selection results more than offset the benefits of asset allocation. In that vein, as conditions deteriorated in the first quarter of 2020, we further emphasized quality in selecting the Fund’s loan positions. That positioning acted as a constraint on benchmark-relative performance as investors’ appetite for risk recovered in the second quarter of 2020.
In industry terms, the Fund’s selections within telecommunication services detracted from benchmark-relative returns, with a position in wireline company Windstream a notable underperformer, as Windstream filed for bankruptcy protection. Selections within health care also weighed negatively on benchmark-relative performance. Specifically, the Fund’s exposure to Alliance Healthcare Services detracted from relative returns, as the operator of imaging and outpatient centers sought to renegotiate its credit agreement in the wake of a COVID-19-driven deterioration in results. A portfolio position in PTI Holdings also lagged within health care, as the pandemic had a negative effect on physical therapy providers. An overweight allocation to aerospace/air transport,
6 Pioneer Floating Rate Fund | Annual Report | 10/31/20
historically a fundamentally sound industry, also constrained the Fund’s benchmark-relative results, as the outlook turned recessionary. Within that segment, portfolio positions in Wencor (replacement commercial airline parts manufacturer), Consolidated Precision Products (parts provider to Boeing component manufacturers), and American Airlines were the biggest individual performance detractors. An underweight to technology/electronics was another negative for the Fund’s relative returns, as market sentiment with respect to technology-oriented companies held up relatively well during the 12-month period, supported in part by the work-from-home trend. Elsewhere, individual names that detracted from the Fund’s benchmark-relative performance included gym chain 24-Hour Fitness Worldwide and retailer Men’s Wearhouse, both of which filed for bankruptcy protection.
The Fund’s modest out-of-benchmark allocation to high-yield corporate bonds constituted a meaningful drag on benchmark-relative performance. Positioning in energy was the biggest detractor within high-yield bonds, most notably the Fund’s exposure to shale-based exploration and production company Oasis Petroleum. Within finance companies, a position in aircraft lessor Aviation Capital had a negative impact on the Fund’s relative returns for the 12-month period, as the pandemic weighed on investors’ sentiment with respect to the company’s bonds.
On the positive side, selection results within business equipment and services contributed positively to the Fund’s benchmark-relative returns, as the portfolio’s holdings were generally able to navigate the pandemic successfully. Selection within mining and metals also aided relative results, while positioning in oil-and-gas loans contributed positively to the Fund’s relative performance; in particular, a focus on the loans of midstream companies such as Traverse Midstream, which provide storage, pipeline, and transportation services, and that are generally less sensitive to the price of oil, fared well during the 12-month period. Other individual names that made notable positive contributions to the Fund’s benchmark-relative results during the 12-month period included West Corp., an operator of call centers; cloud-computing company Rackspace; truck-and-engine manufacturer Navistar International; and Bass Pro Shops, a retailer of outdoor sporting goods.
The Fund’s tactical positioning with respect to index-based credit-default-swap contracts, which we have utilized in an attempt to maintain the portfolio’s credit exposure, while also seeking to maintain liquidity to
Pioneer Floating Rate Fund | Annual Report | 10/31/20 7
meet redemptions, aided relative performance as credit markets generally fared well during the period. The Fund’s level of cash holdings was somewhat elevated during the 12-month period, as we sought to mitigate the impact of market volatility and to maintain the ability to meet redemptions, given the difficult market environment which prevailed during February and March, in particular. The cash positions detracted from the Fund’s benchmark-relative performance as the market rebounded strongly in the second quarter of 2020.
Q Did the Fund have any exposure to any derivative securities during the 12-month period ended October 31, 2020? If so, did the derivatives have any material effect on the Fund’s results?
A As noted earlier, the Fund had exposure to index-based high-yield bond and investment-grade bond credit-default swaps during the 12-month period. The use of the derivatives aided performance by allowing the Fund to gain tactical credit exposure, while maintaining liquidity to meet shareholder redemptions.
Q Did the Fund’s distributions** to shareholders change during the 12-month period ended October 31, 2020?
A The Fund’s distributions decreased during the 12-month period, as LIBOR declined in conjunction with the Fed’s rate cuts, which led to a reduction in the Fund’s dividend** rate.
Q What is your investment outlook?
| A | The default rate in the loan market for the 12-month period ended October 31, 2020, increased to 4.11% by loan volume, above the historical average of slightly over 3%. The default rate by number of issuers in the market was 4.48%, also above the long-term average, but representing a decline versus more recent averages. The default rate on loans held in the Fund has remained below that of the market, given our bias toward higher-quality holdings. |
Expectations for loan defaults going forward have become less extreme compared with estimates during the pandemic-induced sell-off period. Many companies within the industries that have experienced the biggest negative effects of the pandemic, such as movie theaters, fitness centers,
** Distributions/dividends are not guaranteed.
8 Pioneer Floating Rate Fund | Annual Report | 10/31/20
and cruise lines, have been able to maintain liquidity by issuing bonds. The gaming sector has rebounded strongly, while the airline industry has benefited from a $25 billion Congressional rescue package.
Our base scenario is that continued support from policymakers in conjunction with the approval and distribution of one or more COVID-19 vaccines could promote a continued, gradual economic recovery in 2021, which in turn may lead to a decline in loan-default rates back to their long-term averages. Despite the rebound in loan valuations that we saw over the second quarter of 2020, our view is that loan spreads, at current levels, more than account for default risk, and that loan prices have the potential to support capital appreciation going forward. (Loan spreads are the interest rates over and above the LIBOR rate charged to borrowers by banks.)
The Fed’s policy of keeping the federal funds rate’s target range at near zero has put downward pressure on the LIBOR reference rate as well as on the Fund’s income-generation. While LIBOR appeared to hit a trough during the 12-month period, we have seen the new-issue loan calendar come with LIBOR floors aimed at helping to offset the low reference rates.
In this challenging environment, we have continued to maintain a focus on quality, and on the careful evaluation of the individual loans held in the Fund’s portfolio.
Pioneer Floating Rate Fund | Annual Report | 10/31/20 9
Please refer to the Schedule of Investments on pages 18–36 for a full listing of Fund securities.
All investments are subject to risk, including the possible loss of principal. In the past several years, financial markets have experienced increased volatility and heightened uncertainty. The market prices of securities may go up or down, sometimes rapidly or unpredictably, due to general market conditions, such as real or perceived adverse economic, political, or regulatory conditions, recessions, inflation, changes in interest or currency rates, lack of liquidity in the bond markets, the spread of infectious illness or other public health issues or adverse investor sentiment. These conditions may continue, recur, worsen or spread.
Debt securities rated below investment grade are commonly referred to as “junk bonds” and are considered speculative. Below-investment-grade debt securities involve greater risk of loss, are subject to greater price volatility and are less liquid, especially during periods of economic uncertainty or change, than higher-rated debt securities. The Fund may invest in high-yield securities of any rating, including securities that are in default at the time of purchase.
Securities with floating interest rates generally are less sensitive to interest rate changes but may decline in value if their interest rates do not rise as much, or as quickly, as prevailing interest rates. Unlike fixed-rate securities, floating-rate securities generally will not increase in value if interest rates decline. Changes in interest rates also will affect the amount of interest income the Fund earns on its floating-rate investments.
Investing in foreign and/or emerging markets securities involves risks relating to interest rates, currency exchange rates, economic, and political conditions.
These risks may increase share price volatility.
Before investing, consider the product’s investment objectives, risks, charges and expenses. Contact your advisor or Amundi for a prospectus or summary prospectus containing this information. Read it carefully.
Any information in this shareholder report regarding market or economic trends or the factors influencing the Fund’s historical or future performance are statements of opinion as of the date of this report. Past performance is no guarantee of future results.
10 Pioneer Floating Rate Fund | Annual Report | 10/31/20
Portfolio Diversification
(As a percentage of total investments)*
(As a percentage of total investments)*
| 10 Largest Holdings | ||
(As a percentage of total investments)* | ||
| 1. | U.S. Treasury Bills, 11/17/20 | 1.72% |
| 2. | Traverse Midstream Partners LLC, Advance Term Loan, 6.5% | |
(LIBOR + 550 bps), 9/27/24 | 1.19 | |
| 3. | Rackspace Technology Global, Inc., First Lien Term B Loan, 4.0% | |
(LIBOR + 300 bps), 11/3/23 | 1.15 | |
| 4. | Trader Corp., First Lien 2017 Refinancing Term Loan, 4.0% | |
(LIBOR + 300 bps), 9/28/23 | 1.07 | |
| 5. | U.S. Treasury Bills, 11/12/20 | 1.03 |
| 6. | Altice France SA, USD TLB-13 Incremental Term Loan, 4.237% | |
(LIBOR + 400 bps), 8/14/26 | 1.00 | |
| 7. | Garda World Security Corp., Initial Term Loan, 4.9% (LIBOR + 475 bps), 10/30/26 | 1.00 |
| 8. | Prime Security Services Borrower LLC (aka Protection 1 Security Solutions), | |
First Lien 2019 Refinancing Term B-1 Loan, 4.25% (LIBOR + 325 bps), 9/23/26 | 0.99 | |
| 9. | Parfums Holding Co., Inc., First Lien Initial Term Loan, 4.256% | |
(LIBOR + 400 bps), 6/30/24 | 0.94 | |
| 10. | Option Care Health, Inc., Term B Loan, 4.648% (LIBOR + 450 bps), 8/6/26 | 0.92 |
* | Excludes temporary cash investments and all derivative contracts except for options purchased. The Fund is actively managed, and current holdings may be different. The holdings listed should not be considered recommendations to buy or sell any securities. |
Pioneer Floating Rate Fund | Annual Report | 10/31/20 11
Net Asset Value per Share
| Class | 10/31/20 | 10/31/19 |
A | $6.28 | $6.57 |
C | $6.34 | $6.57 |
Y | $6.34 | $6.59 |
Distributions per Share: 11/1/19–10/31/20
| Net Investment | Short-Term | Long-Term | |
| Class | Income | Capital Gains | Capital Gains |
A | $0.2398 | $ — | $ — |
C | $0.1916 | $ — | $ — |
Y | $0.2652 | $ — | $ — |
Index Definitions
The S&P/LSTA Leveraged Performing Loan Index provides broad and comprehensive total return metrics of the U.S. universe of syndicated term loans. Index returns are calculated monthly, assume reinvestment of dividends and, unlike Fund returns, do not reflect any fees, expenses or sales charges. It is not possible to invest directly in an index.
The index defined here pertains to the “Value of $10,000 Investment” and “Value of $5 Million Investment” charts on pages 13–15.
12 Pioneer Floating Rate Fund | Annual Report | 10/31/20
| Class A Shares |
Investment Returns
The mountain chart on the right shows the change in value of a $10,000 investment made in Class A shares of Pioneer Floating Rate Fund at public offering price during the periods shown, compared to that of the S&P/LSTA Leveraged Performing Loan Index.
The mountain chart on the right shows the change in value of a $10,000 investment made in Class A shares of Pioneer Floating Rate Fund at public offering price during the periods shown, compared to that of the S&P/LSTA Leveraged Performing Loan Index.
| Average Annual Total Returns | |
(As of October 31, 2020) |
| Net | Public | S&P/LSTA | |
| Asset | Offering | Leveraged | |
| Value | Price | Performing | |
| Period | (NAV) | (POP) | Loan Index |
10 years | 3.10% | 2.63% | 4.33% |
5 years | 2.56 | 1.62 | 4.23 |
1 year | -0.71 | -5.18 | 2.09 |
| Expense Ratio | |||
(Per prospectus dated March 1, 2020, | |||
as revised March 10, 2020, and amended | |||
October 1, 2020) | |||
| Gross | Net | ||
1.13% | 1.05% | ||
Call 1-800-225-6292 or visit www.amundipioneer.com/us for the most recent month-end performance results. Current performance may be lower or higher than the performance data quoted.
The performance data quoted represents past performance, which is no guarantee of future results. Investment return and principal value will fluctuate, and shares, when redeemed, may be worth more or less than their original cost.
NAV results represent the percent change in net asset value per share. POP returns reflect deduction of maximum 4.50% sales charge. NAV returns would have been lower had sales charges been reflected. All results are historical and assume the reinvestment of dividends and capital gains. Other share classes are available for which performance and expenses will differ.
Performance results reflect any applicable expense waivers in effect during the periods shown. Without such waivers Fund performance would be lower. Waivers may not be in effect for all funds. Certain fee waivers are contractual through a specified period. Otherwise, fee waivers can be rescinded at any time. See the prospectus and financial statements for more information.
The net expense ratio reflects the contractual expense limitation currently in effect through March 1, 2022, for Class A shares. There can be no assurance that Amundi will extend the expense limitation beyond such time. Please see the prospectus and financial statements for more information.
The performance table and graph do not reflect the deduction of fees and taxes that a shareowner would pay on Fund distributions or the redemption of Fund shares.
Please refer to the financial highlights for more current expense ratios.
Pioneer Floating Rate Fund | Annual Report | 10/31/20 13
Performance Update | 10/31/20 | Class C Shares |
Investment Returns
The mountain chart on the right shows the change in value of a $10,000 investment made in Class C shares of Pioneer Floating Rate Fund during the periods shown, compared to that of the S&P/LSTA Leveraged Performing Loan Index.
| Average Annual Total Returns | |||
(As of October 31, 2020) | |||
| S&P/LSTA | |||
| Leveraged | |||
| If | If | Performing | |
| Period | Held | Redeemed | Loan Index |
10 years | 2.44% | 2.44% | 4.33% |
5 years | 1.96 | 1.96 | 4.23 |
1 year | -0.54 | -0.54 | 2.09 |
| Expense Ratio | |||
(Per prospectus dated March 1, 2020, | |||
as revised March 10, 2020, and amended | |||
October 1, 2020) | |||
| Gross | |||
1.83% | |||
Call 1-800-225-6292 or visit www.amundipioneer.com/us for the most recent month-end performance results. Current performance may be lower or higher than the performance data quoted.
The performance data quoted represents past performance, which is no guarantee of future results. Investment return and principal value will fluctuate, and shares, when redeemed, may be worth more or less than their original cost.
Class C shares held for less than one year are also subject to a 1% contingent deferred sales charge (CDSC). “If Held” results represent the percent change in net asset value per share. NAV returns would have been lower had sales charges been reflected. All results are historical and assume the reinvestment of dividends and capital gains. Other share classes are available for which performance and expenses will differ.
Performance results reflect any applicable expense waivers in effect during the periods shown. Without such waivers Fund performance would be lower. Waivers may not be in effect for all funds. Certain fee waivers are contractual through a specified period. Otherwise, fee waivers can be rescinded at any time. See the prospectus and financial statements for more information.
The performance table and graph do not reflect the deduction of fees and taxes that a shareowner would pay on Fund distributions or the redemption of Fund shares.
Please refer to the financial highlights for more current expense ratios.
14 Pioneer Floating Rate Fund | Annual Report | 10/31/20
Performance Update | 10/31/20 | Class Y Shares |
Investment Returns
The mountain chart on the right shows the change in value of a $5 million investment made in Class Y shares of Pioneer Floating Rate Fund during the periods shown, compared to that of the S&P/LSTA Leveraged Performing Loan Index.
| Average Annual Total Returns | ||
(As of October 31, 2020) | ||
| Net | S&P/LSTA | |
| Asset | Leveraged | |
| Value | Performing | |
| Period | (NAV) | Loan Index |
10 years | 3.51% | 4.33% |
5 years | 3.03 | 4.23 |
1 year | 0.31 | 2.09 |
| Expense Ratio | ||
(Per prospectus dated March 1, 2020, | ||
as revised March 10, 2020, and amended | ||
October 1, 2020) | ||
| Gross | Net | |
0.87% | 0.77% | |
Call 1-800-225-6292 or visit www.amundipioneer.com/us for the most recent month-end performance results. Current performance may be lower or higher than the performance data quoted.
The performance data quoted represents past performance, which is no guarantee of future results. Investment return and principal value will fluctuate, and shares, when redeemed, may be worth more or less than their original cost.
Class Y shares are not subject to sales charges and are available for limited groups of eligible investors, including institutional investors. All results are historical and assume the reinvestment of dividends and capital gains. Other share classes are available for which performance and expenses will differ.
Performance results reflect any applicable expense waivers in effect during the periods shown. Without such waivers Fund performance would be lower. Waivers may not be in effect for all funds. Certain fee waivers are contractual through a specified period. Otherwise, fee waivers can be rescinded at any time. See the prospectus and financial statements for more information.
The net expense ratio reflects the contractual expense limitation currently in effect through March 1, 2022, for Class Y shares. There can be no assurance that Amundi will extend the expense limitation beyond such time. Please see the prospectus and financial statements for more information.
The performance table and graph do not reflect the deduction of fees and taxes that a shareowner would pay on Fund distributions or the redemption of Fund shares.
Please refer to the financial highlights for more current expense ratios.
Pioneer Floating Rate Fund | Annual Report | 10/31/20 15
As a shareowner in the Fund, you incur two types of costs:
(1) | ongoing costs, including management fees, distribution and/or service (12b-1) fees, and other Fund expenses; and |
(2) | transaction costs, including sales charges (loads) on purchase payments. |
This example is intended to help you understand your ongoing expenses (in dollars) of investing in the Fund and to compare these costs with the ongoing costs of investing in other mutual funds. The example is based on an investment of $1,000 at the beginning of the Fund’s latest six-month period and held throughout the six months.
Using the Tables
Actual Expenses
The first table below provides information about actual account values and actual expenses. You may use the information in this table, together with the amount you invested, to estimate the expenses that you paid over the period as follows:
(1) | Divide your account value by $1,000 |
Example: an $8,600 account value ÷ $1,000 = 8.6 | |
(2) | Multiply the result in (1) above by the corresponding share class’s number in the third row under the heading entitled “Expenses Paid During Period” to estimate the expenses you paid on your account during this period. |
Expenses Paid on a $1,000 Investment in Pioneer Floating Rate Fund
Based on actual returns from May 1, 2020 through October 31, 2020.
| Share Class | A | C | Y |
Beginning Account | $1,000.00 | $1,000.00 | $1,000.00 |
Value on 5/1/20 | |||
Ending Account | $1,078.89 | $1,076.17 | $1,082.09 |
Value (after expenses) | |||
on 10/31/20 | |||
Expenses Paid | $5.85 | $9.39 | $3.72 |
During Period* |
* | Expenses are equal to the Fund’s annualized expense ratio of 1.12%, 1.80% and 0.71% for Class A, Class C and Class Y shares, respectively, multiplied by the average account value over the period, multiplied by 184/366 (to reflect the partial year period). |
16 Pioneer Floating Rate Fund | Annual Report | 10/31/20
Hypothetical Example for Comparison Purposes
The table below provides information about hypothetical account values and hypothetical expenses based on the Fund’s actual expense ratio and an assumed rate of return of 5% per year before expenses, which is not the Fund’s actual return. The hypothetical account values and expenses may not be used to estimate the actual ending account balance or expenses you paid for the period.
You may use this information to compare the ongoing costs of investing in the Fund and other funds. To do so, compare this 5% hypothetical example with the 5% hypothetical examples that appear in the shareholder reports of the other funds.
Please note that the expenses shown in the tables are meant to highlight your ongoing costs only and do not reflect any transaction costs, such as sales charges (loads) that are charged at the time of the transaction. Therefore, the table below is useful in comparing ongoing costs only and will not help you determine the relative total costs of owning different funds. In addition, if these transaction costs were included, your costs would have been higher.
Expenses Paid on a $1,000 Investment in Pioneer Floating Rate Fund
Based on a hypothetical 5% return per year before expenses, reflecting the period from May 1, 2020 through October 31, 2020.
| Share Class | A | C | Y |
Beginning Account | $1,000.00 | $1,000.00 | $1,000.00 |
Value on 5/1/20 | |||
Ending Account | $1,019.51 | $1,016.09 | $1,021.57 |
Value (after expenses) | |||
on 10/31/20 | |||
Expenses Paid | $5.69 | $9.12 | $3.61 |
During Period* |
* | Expenses are equal to the Fund’s annualized expense ratio of 1.12%, 1.80% and 0.71% for Class A, Class C and Class Y shares, respectively, multiplied by the average account value over the period, multiplied by 184/366 (to reflect the partial year period). |
Pioneer Floating Rate Fund | Annual Report | 10/31/20 17
| Principal | |||
| Amount USD ($) | Value | ||
| UNAFFILIATED ISSUERS — 98.0% | |||
| SENIOR SECURED FLOATING RATE LOAN | |||
| INTERESTS — 88.6% of Net Assets*(a) | |||
| Aerospace & Defense — 4.1% | |||
| 631,996 | Air Canada, Replacement Term Loan, 1.897% (LIBOR + | ||
| 175 bps), 10/6/23 | $ 599,343 | ||
| 854,371 | American Airlines, Inc., 2017 Class B Term Loan, 2.148% | ||
| (LIBOR + 200 bps), 12/15/23 | 710,997 | ||
| 2,822,619 | American Airlines, Inc., 2018 Replacement Term Loan, 1.906% | ||
| (LIBOR + 175 bps), 6/27/25 | 1,793,775 | ||
| 997,500 | Delta Air Lines, Inc., Term Loan, 5.75% (LIBOR + | ||
| 475 bps), 4/29/23 | 996,084 | ||
| 976,285 | Jazz Acquisition, Inc., First Lien Initial Term Loan, 4.4% | ||
| (LIBOR + 425 bps), 6/19/26 | 858,723 | ||
| 395,000 | JetBlue Airways Corp., Term Loan, 6.25% (LIBOR + | ||
| 525 bps), 6/17/24 | 394,048 | ||
| 1,300,000 | MAG DS Corp., Initial Term Loan, 6.5% (LIBOR + | ||
| 550 bps), 4/1/27 | 1,241,500 | ||
| 500,000 | Mileage Plus Holdings LLC (Mileage Plus Intellectual | ||
| Property Assets, Ltd.), Initial Term Loan, 6.25% | |||
| (LIBOR + 525 bps), 6/21/27 | 509,649 | ||
| 1,693,125 | Peraton Corp. (fka MHVC Acquisition Corp.), First Lien | ||
| Initial Term Loan, 6.25% (LIBOR + | |||
| 525 bps), 4/29/24 | 1,684,659 | ||
| 260,000 | SkyMiles IP, Ltd. (Delta Air Lines, Inc.), Initial Term | ||
| Loan, 4.75% (LIBOR + 375 bps), 10/20/27 | 259,594 | ||
| 600,000 | Spirit Aerosystems, Inc. (fka Mid-Western Aircraft Systems, | ||
| Inc. and Onex Wind Finance LP.), Initial Term | |||
| Loan, 6.0% (LIBOR + 525 bps), 1/15/25 | 600,750 | ||
| 599,836 | United AirLines, Inc., Refinanced Term Loan, 1.902% (LIBOR + | ||
| 175 bps), 4/1/24 | 562,774 | ||
| 2,304,026 | WP CPP Holdings LLC, First Lien Initial Term Loan, 4.75% | ||
| (LIBOR + 375 bps), 4/30/25 | 2,045,542 | ||
| Total Aerospace & Defense | $ 12,257,438 | ||
| Automobile — 4.6% | |||
| 1,115,101 | American Axle & Manufacturing, Inc., Tranche B Term Loan, | ||
| 3.0% (LIBOR + 225 bps), 4/6/24 | $ 1,079,092 | ||
| 877,539 | Commercial Vehicle Group, Inc. (CVG), Initial Term Loan, | ||
| 11.5% (LIBOR + 1,050 bps), 4/12/23 | 809,530 | ||
| 562,754 | Dana, Inc., 2018 New Term Loan B Advance, 2.398% (LIBOR + | ||
| 225 bps), 2/27/26 | 554,078 | ||
| 188,176 | Goodyear Tire & Rubber Co., Second Lien Term Loan, 2.15% | ||
| (LIBOR + 200 bps), 3/3/25 | 182,139 | ||
| 392,857(b) | Highline Aftermarket Acquisition LLC, First Lien Term Loan, | ||
| 10/30/27 | 384,509 | ||
| 1,343,080 | IXS Holdings, Inc., Initial Term Loan, 6.0% (LIBOR + | ||
| 500 bps), 3/5/27 | 1,331,328 | ||
| 2,347,563 | Navistar, Inc., Tranche B Term Loan, 3.65% (LIBOR + | ||
| 350 bps), 11/6/24 | 2,332,010 | ||
| 1,436,913 | Superior Industries International, Inc., Replacement Term | ||
| Loan, 4.148% (LIBOR + 400 bps), 5/22/24 | 1,368,659 |
The accompanying notes are an integral part of these financial statements.
18 Pioneer Floating Rate Fund | Annual Report | 10/31/20
| Principal | |||
| Amount USD ($) | Value | ||
| Automobile — (continued) | |||
| 1,970,640 | Thor Industries, Inc., Initial USD Term Loan, 3.938% (LIBOR | ||
+ 375 bps), 2/1/26 | $ 1,960,172 | ||
| 2,109,161 | TI Group Automotive Systems LLC, Initial US Term Loan, 4.5% | ||
(LIBOR + 375 bps), 12/16/24 | 2,103,888 | ||
| 1,207,917 | Visteon Corp., New Term Loan, 1.913% (LIBOR + | ||
175 bps), 3/25/24 | 1,185,017 | ||
| 185,669 | Wabash National Corp., Initial Loan, 4.0% (LIBOR + | ||
325 bps), 9/28/27 | 184,740 | ||
| Total Automobile | $ 13,475,162 | ||
| Banking — 1.3% | |||
| 990,000 | Azalea TopCo, Inc., First Lien Initial Term Loan, 3.714% | ||
(LIBOR + 350 bps), 7/24/26 | $ 956,279 | ||
| 1,629,112 | EWT Holdings III Corp. (fka WTG Holdings III Corp.), | ||
Refinancing 2020 First Lien Term Loan, 2.898% | |||
(LIBOR + 275 bps), 12/20/24 | 1,599,924 | ||
| 1,289,919 | Nouryon Finance B.V. (aka AkzoNobel), Initial Dollar Term | ||
Loan, 3.145% (LIBOR + 300 bps), 10/1/25 | 1,253,640 | ||
| Total Banking | $ 3,809,843 | ||
| Beverage, Food & Tobacco — 0.6% | |||
| 761,048 | Froneri International, Ltd., First Lien Facility B2, 2.398% | ||
(LIBOR + 225 bps), 1/29/27 | $ 735,634 | ||
| 1,033,982 | JBS USA Lux SA (fka JBS USA LLC), New Term Loan, 2.148% | ||
(LIBOR + 200 bps), 5/1/26 | 1,012,548 | ||
| Total Beverage, Food & Tobacco | $ 1,748,182 | ||
| Broadcasting & Entertainment — 2.6% | |||
| 1,340,735 | Charter Communications Operating LLC (aka CCO Safari LLC), | ||
Term B-2 Loan, 1.9% (LIBOR + 175 bps), 2/1/27 | $ 1,308,534 | ||
| 1,488,750 | Creative Artists Agency LLC, Closing Date Term Loan, 3.898% | ||
(LIBOR + 375 bps), 11/27/26 | 1,434,318 | ||
| 1,581,456 | Gray Television, Inc., Term B-2 Loan, 2.399% (LIBOR + | ||
225 bps), 2/7/24 | 1,548,641 | ||
| 528,021 | Gray Television, Inc., Term C Loan, 2.649% (LIBOR + | ||
250 bps), 1/2/26 | 517,724 | ||
| 2,105,065 | Sinclair Television Group, Inc., Tranche B Term Loan, 2.4% | ||
(LIBOR + 225 bps), 1/3/24 | 2,050,684 | ||
| 816,750 | Sinclair Television Group, Inc., Tranche B-2b Term Loan, | ||
2.65% (LIBOR + 250 bps), 9/30/26 | 793,609 | ||
| Total Broadcasting & Entertainment | $ 7,653,510 | ||
| Building Materials — 1.5% | |||
| 1,616,578 | Circor International, Inc., New Term Loan, 4.25% (LIBOR + | ||
325 bps), 12/11/24 | $ 1,589,804 | ||
| 580,699 | CPG International LLC (fka CPG International, Inc.), New | ||
Term Loan, 4.75% (LIBOR + 375 bps), 5/5/24 | 580,881 | ||
| 2,225,250 | WKI Holding Co., Inc. (aka World Kitchen), Initial Loan, | ||
5.0% (LIBOR + 400 bps), 5/1/24 | 2,183,527 | ||
| Total Building Materials | $ 4,354,212 |
The accompanying notes are an integral part of these financial statements.
Pioneer Floating Rate Fund | Annual Report | 10/31/20 19
Schedule of Investments | 10/31/20 (continued)
| Principal | |||
| Amount USD ($) | Value | ||
| Buildings & Real Estate — 2.7% | |||
| 994,898 | American Bath Group LLC, First Lien Replacement Term | ||
Loan, 5.0% (LIBOR + 400 bps), 9/30/23 | $ 993,965 | ||
| 366,591 | Builders FirstSource, Inc., Refinancing Term Loan, 4.0% | ||
(LIBOR + 300 bps), 2/29/24 | 365,216 | ||
| 994,779 | C.H.I. Overhead Doors, Inc., First Lien Third Amendment | ||
Initial Term Loan, 4.5% (LIBOR + 350 bps), 7/31/25 | 991,048 | ||
| 900,000(b) | PAE, Inc., Initial Term Loan, 10/19/27 | 891,000 | |
| 994,911 | Ply Gem Midco, Inc., Initial Term Loan, 3.895% (LIBOR + | ||
375 bps), 4/12/25 | 979,054 | ||
| 1,331,818 | VICI Properties 1 LLC, Term B Loan, 1.896% (LIBOR + | ||
175 bps), 12/20/24 | 1,283,540 | ||
| 2,928,100 | WireCo WorldGroup, Inc. (WireCo WorldGroup Finance LP), | ||
First Lien Initial Term Loan, 6.0% (LIBOR + | |||
500 bps), 9/29/23 | 2,573,068 | ||
| Total Buildings & Real Estate | $ 8,076,891 | ||
| Chemicals, Plastics & Rubber — 2.2% | |||
| 556,329 | Axalta Coating Systems Dutch Holding B BV (Axalta Coating | ||
Systems US Holdings, Inc.), Term B-3 Dollar Loan, | |||
1.97% (LIBOR + 175 bps), 6/1/24 | $ 541,145 | ||
| 1,399,031 | Core & Main LP, Initial Term Loan, 3.75% (LIBOR + | ||
275 bps), 8/1/24 | 1,364,055 | ||
| 220,000 | Emerald Performance Materials LLC, Initial Term Loan, 5.0% | ||
(LIBOR + 400 bps), 8/12/25 | 218,900 | ||
| 997,475 | Hexion, Inc., USD Term Loan, 3.73% (LIBOR + | ||
350 bps), 7/1/26 | 983,759 | ||
| 358,200 | Innophos Holdings, Inc., Initial Term Loan, 3.648% (LIBOR + | ||
350 bps), 2/5/27 | 352,827 | ||
| 247,028 | Tank Holding Corp., First Lien 2020 Refinancing Term Loan, | ||
3.648% (LIBOR + 350 bps/PRIME + | |||
250 bps), 3/26/26 | 239,926 | ||
| 2,108,040 | Tronox Finance LLC, First Lien Initial Dollar Term Loan, | ||
3.178% (LIBOR + 300 bps), 9/23/24 | 2,068,514 | ||
| 808,391 | Twist Beauty International Holdings SA, Facility B2, 4.0% | ||
(LIBOR + 300 bps), 4/22/24 | 777,065 | ||
| Total Chemicals, Plastics & Rubber | $ 6,546,191 | ||
| Computers & Electronics — 2.9% | |||
| 995,000 | AI Convoy (Luxembourg) S.a.r.l., Facility B, 4.5% (LIBOR + | ||
350 bps), 1/18/27 | $ 979,765 | ||
| 694,619 | Cornerstone OnDemand, Inc., Term Loan, 4.396% (LIBOR + | ||
425 bps), 4/22/27 | 689,236 | ||
| 275,000(b) | ECi Macola/MAX Holding LLC (ECI Software Solution, Inc.), | ||
Term Loan, 9/17/27 | 269,958 | ||
| 1,133,744 | Energy Acquisition LP (aka Electrical Components | ||
International), First Lien Initial Term Loan, | |||
4.398% (LIBOR + 425 bps), 6/26/25 | 1,043,989 | ||
| 1,000,000 | LogMeIn, Inc., First Lien Initial Term Loan, 4.89% (LIBOR + | ||
475 bps), 8/31/27 | 971,250 | ||
| 893,774 | Microchip Technology, Inc., Initial Term Loan, 2.15% (LIBOR | ||
+ 200 bps), 5/29/25 | 887,816 |
The accompanying notes are an integral part of these financial statements.
20 Pioneer Floating Rate Fund | Annual Report | 10/31/20
| Principal | |||
| Amount USD ($) | Value | ||
| Computers & Electronics — (continued) | |||
| 900,000 | Netsmart, Inc., First Lien Initial Term Loan, 4.75% (LIBOR + | ||
400 bps), 10/1/27 | $ 889,594 | ||
| 1,267,500 | Pitney Bowes, Inc., Incremental Tranche B Term Loan, 5.65% | ||
(LIBOR + 550 bps), 1/7/25 | 1,252,185 | ||
| 1,570,938 | Ultra Clean Holdings, Inc., Term B Loan, 4.648% (LIBOR + | ||
450 bps), 8/27/25 | 1,563,083 | ||
| Total Computers & Electronics | $ 8,546,876 | ||
| Consumer Nondurables — 0.5% | |||
| 1,488,750 | Sunshine Luxembourg VII S.a.r.l., Facility B1, 5.25% (LIBOR | ||
+ 425 bps), 10/1/26 | $ 1,475,723 | ||
| Total Consumer Nondurables | $ 1,475,723 | ||
| Consumer Services — 1.0% | |||
| 2,894,556 | Prime Security Services Borrower LLC (aka Protection 1 | ||
Security Solutions), First Lien 2019 Refinancing | |||
Term B-1 Loan, 4.25% (LIBOR + | |||
325 bps), 9/23/26 | $ 2,859,984 | ||
| Total Consumer Services | $ 2,859,984 | ||
| Containers, Packaging & Glass — 1.6% | |||
| 615,000 | Graham Packaging Co., Inc., Initial Term Loan, 4.5% (LIBOR + | ||
375 bps), 8/4/27 | $ 610,168 | ||
| 405,089 | Pactiv Evergreen, Inc., Tranche B-1 US Term Loan, 2.898% | ||
(LIBOR + 275 bps/PRIME + 175 bps), 2/5/23 | 398,289 | ||
| 825,000 | Pactiv Evergreen, Inc., Tranche B-2 US Term Loan, 3.398% | ||
(LIBOR + 325 bps), 2/5/26 | 806,438 | ||
| 991,179 | Plastipak Holdings, Inc., Tranche B Term Loan, 2.65% (LIBOR | ||
+ 250 bps), 10/14/24 | 969,291 | ||
| 1,000,000 | Plaze, Inc., 2020-1 Additional Term Loan, 5.25% (LIBOR + | ||
425 bps), 8/3/26 | 980,625 | ||
| 997,487 | Pregis TopCo LLC, First Lien Initial Term Loan, 3.898% | ||
(LIBOR + 375 bps), 7/31/26 | 974,733 | ||
| Total Containers, Packaging & Glass | $ 4,739,544 | ||
| Diversified & Conglomerate Manufacturing — 1.6% | |||
| 2,895,713 | Garda World Security Corp., Initial Term Loan, 4.9% (LIBOR + | ||
475 bps), 10/30/26 | $ 2,892,455 | ||
| 1,873,212 | Pelican Products, Inc., First Lien Term Loan, 4.5% (LIBOR + | ||
350 bps), 5/1/25 | 1,798,283 | ||
| Total Diversified & Conglomerate Manufacturing | $ 4,690,738 | ||
| Diversified & Conglomerate Service — 8.0% | |||
| 1,941,334 | Albany Molecular Research, Inc., First Lien Initial Term | ||
Loan, 4.25% (LIBOR + 325 bps), 8/30/24 | $ 1,918,038 | ||
| 1,496,231 | Allied Universal Holdco LLC (f/k/a USAGM Holdco LLC), | ||
Initial Term Loan, 4.398% (LIBOR + | |||
425 bps), 7/10/26 | 1,467,553 | ||
| 1,000,000 | Camelot US Acquisition 1 Co. (aka Thomson Reuters | ||
| Intellectual Property & Science), Amendment No. 2 | |||
Incremental Term Loan, 4.0% (LIBOR + | |||
300 bps), 10/30/26 | 986,875 |
The accompanying notes are an integral part of these financial statements.
Pioneer Floating Rate Fund | Annual Report | 10/31/20 21
Schedule of Investments | 10/31/20 (continued)
| Principal | |||
| Amount USD ($) | Value | ||
| Diversified & Conglomerate Service — (continued) | |||
| 2,138,142 | CB Poly Investments LLC, First Lien Closing Date Term Loan, | ||
5.5% (LIBOR + 450 bps), 8/16/23 | $ 1,833,457 | ||
| 479,102 | Change Healthcare Holdings LLC, Closing Date Term Loan, | ||
3.5% (LIBOR + 250 bps), 3/1/24 | 468,707 | ||
| 1,512,902 | DG Investment Intermediate Holdings 2, Inc. (aka Convergint | ||
Technologies Holdings LLC), First Lien Initial | |||
Term Loan, 3.75% (LIBOR + 300 bps), 2/3/25 | 1,461,842 | ||
| 2,272,086 | DTI Holdco, Inc., Replacement B-1 Term Loan, 5.75% | ||
(LIBOR + 475 bps), 9/29/23 | 2,019,316 | ||
| 1,135,556 | DynCorp International, Inc., Term Loan, 7.0% (LIBOR + | ||
600 bps), 8/18/25 | 1,129,878 | ||
| 934,807 | Filtration Group Corp., Initial Dollar Term Loan, 3.148% | ||
(LIBOR + 300 bps), 3/31/25 | 911,103 | ||
| 1,311,085 | First Brands Group LLC, First Lien Tranche B-3 Term Loan, | ||
8.5% (LIBOR + 750 bps), 2/2/24 | 1,293,058 | ||
| 568,006 | Gates Global LLC, Initial B-2 Dollar Term Loan, 3.75% | ||
(LIBOR + 275 bps), 4/1/24 | 558,333 | ||
| 959,670 | GHX Ultimate Parent Corp., First Lien Initial Term Loan, | ||
4.25% (LIBOR + 325 bps), 6/28/24 | 933,279 | ||
| 711,131 | Intrado Corp., Incremental Term B-1 Loan, 4.5% (LIBOR + | ||
350 bps), 10/10/24 | 659,278 | ||
| 2,566,431 | Intrado Corp., Initial Term B Loan, 5.0% (LIBOR + | ||
400 bps), 10/10/24 | 2,393,656 | ||
| 979,900 | Mitchell International, Inc., First Lien Initial Term Loan, | ||
3.398% (LIBOR + 325 bps), 11/29/24 | 936,110 | ||
| 1,955,000 | Sound Inpatient Physicians, Inc., First Lien Initial Term | ||
Loan, 2.898% (LIBOR + 275 bps), 6/27/25 | 1,915,085 | ||
| 500,000 | Sound Inpatient Physicians, Inc., Second Lien Initial Term | ||
Loan, 6.898% (LIBOR + 675 bps), 6/26/26 | 489,167 | ||
| 2,895,000 | Team Health Holdings, Inc., Initial Term Loan, 3.75% (LIBOR | ||
+ 275 bps), 2/6/24 | 2,366,662 | ||
| Total Diversified & Conglomerate Service | $ 23,741,397 | ||
| Electric & Electrical — 1.1% | |||
| 3,408,549 | Rackspace Technology Global, Inc., First Lien Term B Loan, | ||
4.0% (LIBOR + 300 bps), 11/3/23 | $ 3,339,430 | ||
| Total Electric & Electrical | $ 3,339,430 | ||
| Electronics — 1.0% | |||
| 698,250 | BY Crown Parent LLC, Initial B-1 Term Loan, 4.0% (LIBOR + | ||
300 bps), 2/2/26 | $ 683,412 | ||
| 2,574,148 | Scientific Games International, Inc., Initial Term B-5 Loan, | ||
2.898% (LIBOR + 275 bps), 8/14/24 | 2,400,995 | ||
| Total Electronics | $ 3,084,407 | ||
| Entertainment & Leisure — 0.3% | |||
| 748,125 | Carnival Corp., Initial Advance, 8.5% (LIBOR + | ||
750 bps), 6/30/25 | $ 753,736 | ||
| Total Entertainment & Leisure | $ 753,736 |
The accompanying notes are an integral part of these financial statements.
22 Pioneer Floating Rate Fund | Annual Report | 10/31/20
| Principal | |||
| Amount USD ($) | Value | ||
| Environmental Services — 0.6% | |||
| 1,838,804 | GFL Environmental, Inc., Effective Date Incremental Term | ||
Loan, 4.0% (LIBOR + 300 bps), 5/30/25 | $ 1,824,849 | ||
| Total Environmental Services | $ 1,824,849 | ||
| Financial Services — 2.5% | |||
| 1,857,250 | Blackhawk Network Holdings, Inc., First Lien Term Loan, | ||
3.148% (LIBOR + 300 bps), 6/15/25 | $ 1,746,744 | ||
| 798,000 | Cardtronics USA, Inc., Initial Term Loan, 5.0% (LIBOR + | ||
400 bps), 6/29/27 | 798,998 | ||
| 600,000(b) | EFS Cogen Holdings I LLC, Term Loan B Advance, 10/1/27 | 596,250 | |
| 1,830,441 | Everi Payments, Inc., Term B Loan, 3.75% (LIBOR + | ||
275 bps), 5/9/24 | 1,769,234 | ||
| 2,481,856 | Vistra Group Holdings (BVI) II, Ltd., First Lien 2020 Dollar | ||
Term Loan, 4.75% (LIBOR + 375 bps), 10/27/25 | 2,441,525 | ||
| Total Financial Services | $ 7,352,751 | ||
| Forest Products – 0.9% | |||
| 1,050,000(b) | Chobani LLC, Term Loan B, 10/20/27 | $ 1,043,963 | |
| 1,697,365 | ProAmpac PG Borrower LLC, First Lien Initial Term | ||
Loan, 5.442% (LIBOR + 350 bps/PRIME + | |||
250 bps), 11/20/23 | 1,683,574 | ||
| Total Forest Products | $ 2,727,537 | ||
| Healthcare & Pharmaceuticals — 4.7% | |||
| 1,083,314 | Alkermes, Inc., 2023 Term Loan, 2.4% (LIBOR + | ||
225 bps), 3/27/23 | $ 1,077,897 | ||
| 2,449,250 | Alphabet Holding Co., Inc. (aka Nature’s Bounty), First Lien | ||
Initial Term Loan, 3.648% (LIBOR + | |||
350 bps), 9/26/24 | 2,377,303 | ||
| 990,000 | Curium BidCo S.a.r.l., Facility B, 3.97% (LIBOR + | ||
375 bps), 7/9/26 | 965,250 | ||
| 1,749,855 | Endo Luxembourg Finance Co. I S.a.r.l., Initial Term Loan, | ||
5.0% (LIBOR + 425 bps), 4/29/24 | 1,674,611 | ||
| 2,342,509 | Kindred Healthcare LLC, Closing Date Term Loan, 5.188% | ||
(LIBOR + 500 bps), 7/2/25 | 2,333,725 | ||
| 997,500 | Loire UK Midco 3, Ltd., Facility B, 3.648% (LIBOR + | ||
350 bps), 4/21/27 | 963,834 | ||
| 1,420,644 | NMN Holdings III Corp., First Lien Closing Date Term Loan, | ||
3.648% (LIBOR + 350 bps), 11/13/25 | 1,370,922 | ||
| 304,471 | NMN Holdings III Corp., First Lien Delayed Draw Term Loan, | ||
3.648% (LIBOR + 350 bps), 11/13/25 | 293,814 | ||
| 1,427,825 | Sotera Health Holdings LLC, First Lien Initial Term Loan, | ||
5.5% (LIBOR + 450 bps), 12/11/26 | 1,426,486 | ||
| 1,492,500 | Upstream Newco, Inc., First Lien Initial Term Loan, 4.648% | ||
(LIBOR + 450 bps), 11/20/26 | 1,455,188 | ||
| Total Healthcare & Pharmaceuticals | $ 13,939,030 | ||
| Healthcare, Education & Childcare — 5.4% | |||
| 649,215 | Alliance HealthCare Services, Inc., First Lien Initial Term | ||
Loan, 5.5% (LIBOR + 450 bps), 10/24/23 | $ 594,032 | ||
| 500,000 | Alliance HealthCare Services, Inc., Second Lien Initial Term | ||
Loan, 12.0% (LIBOR + 1,100 bps), 4/24/24 | 228,750 |
The accompanying notes are an integral part of these financial statements.
Pioneer Floating Rate Fund | Annual Report | 10/31/20 23
Schedule of Investments | 10/31/20 (continued)
| Principal | |||
| Amount USD ($) | Value | ||
| Healthcare, Education & Childcare — (continued) | |||
| 756,687 | ATI Holdings Acquisition, Inc., First Lien Initial Term | ||
Loan, 4.5% (LIBOR + 350 bps), 5/10/23 | $ 714,312 | ||
| 800,000 | Bausch Health Cos., Inc. (fka Valeant Pharmaceuticals | ||
International, Inc.), First Incremental Term | |||
Loan, 2.899% (LIBOR + 275 bps), 11/27/25 | 781,666 | ||
| 1,259,037 | Bausch Health Cos., Inc. (fka Valeant Pharmaceuticals | ||
International, Inc.), Initial Term Loan, 3.149% | |||
(LIBOR + 300 bps), 6/2/25 | 1,231,692 | ||
| 750,000 | Brightspring Health Services, Term Loan, 3.893% (LIBOR + | ||
375 bps), 3/5/26 | 738,125 | ||
| 450,000(b) | CNT Holdings I Corp., First Lien Term Loan Facility, | ||
10/16/27 | 445,500 | ||
| 744,375 | FC Compassus LLC, Initial Term Loan, 6.0% (LIBOR + | ||
500 bps), 12/31/26 | 736,001 | ||
| 1,818,280 | Gentiva Health Services, Inc., First Lien Term B Loan, | ||
3.438% (LIBOR + 325 bps), 7/2/25 | 1,784,188 | ||
| 2,472,191 | KUEHG Corp. (fka KC MergerSub, Inc.) (aka KinderCare), | ||
Term B-3 Loan, 4.75% (LIBOR + 375 bps), 2/21/25 | 2,270,089 | ||
| 979,852 | Life Time Fitness, Inc., 2017 Refinancing Term Loan, 3.75% | ||
(LIBOR + 275 bps), 6/10/22 | 907,063 | ||
| 708,793 | LifePoint Health, Inc. (fka Regionalcare Hospital Partners | ||
Holdings, Inc.), First Lien Term B Loan, 3.898% | |||
(LIBOR + 375 bps), 11/16/25 | 689,302 | ||
| 1,000,000 | Milano Acquisition Corp., First Lien Term B Loan, 4.75% | ||
(LIBOR + 400 bps), 10/1/27 | 984,375 | ||
| 911,952 | Quorum Health Corp., Term Loan, 9.25% (LIBOR + | ||
825 bps), 4/29/25 | 849,825 | ||
| 1,599,323 | Select Medical Corp., Tranche B Term Loan, 2.78% (LIBOR + | ||
250 bps), 3/6/25 | 1,564,338 | ||
| 1,485,000 | U.S. Renal Care, Inc., Initial Term Loan, 5.188% (LIBOR + | ||
500 bps), 6/26/26 | 1,428,941 | ||
| Total Healthcare, Education & Childcare | $ 15,948,199 | ||
| Home Furnishings — 0.2% | |||
| 500,000(b) | Weber-Stephen Products LLC, Initial Term B Loan, 10/30/27 | $ 495,365 | |
| Total Home Furnishings | $ 495,365 | ||
| Hotel, Gaming & Leisure — 3.4% | |||
| 825,177 | 1011778 B.C. Unlimited Liability Co. (New Red Finance, Inc.) | ||
(aka Burger King/Tim Hortons), Term B-4 Loan, | |||
1.898% (LIBOR + 175 bps), 11/19/26 | $ 794,404 | ||
| 687,782 | Boyd Gaming Corp., Refinancing Term B Loan, 2.344% (LIBOR + | ||
225 bps), 9/15/23 | 670,265 | ||
| 1,492,327 | Caesars Resort Collection LLC, Term B Loan, 2.898% (LIBOR + | ||
275 bps), 12/23/24 | 1,403,410 | ||
| 1,000,000 | Caesars Resort Collection LLC, Term B-1 Loan, 4.649% (LIBOR | ||
+ 450 bps), 7/21/25 | 969,792 | ||
| 572,395 | Flutter Entertainment plc, USD Term Loan, 3.72% (LIBOR + | ||
350 bps), 7/10/25 | 573,014 | ||
| 1,988,809 | Golden Nugget, Inc. (aka Landry’s, Inc.), Initial B Term | ||
Loan, 3.25% (LIBOR + 250 bps), 10/4/23 | 1,763,686 |
The accompanying notes are an integral part of these financial statements.
24 Pioneer Floating Rate Fund | Annual Report | 10/31/20
| Principal | |||
| Amount USD ($) | Value | ||
| Hotel, Gaming & Leisure — (continued) | |||
| 1,182,068 | Marriott Ownership Resorts, Inc., 2019 Refinancing Term | ||
Loan, 1.898% (LIBOR + 175 bps), 8/29/25 | $ 1,128,874 | ||
| 1,463,826 | Penn National Gaming, Inc., Term B-1 Facility Loan, 3.0% | ||
(LIBOR + 225 bps), 10/15/25 | 1,416,023 | ||
| 1,398,649 | Spectacle Gary Holdings LLC, Closing Date Term Loan, 11.0% | ||
(LIBOR + 900 bps), 12/23/25 | 1,326,094 | ||
| Total Hotel, Gaming & Leisure | $ 10,045,562 | ||
| Insurance — 2.8% | |||
| 448,875 | AqGen Ascensus, Inc., First Lien Seventh Amendment | ||
Replacement Term Loan, 5.0% (LIBOR + | |||
400 bps), 12/3/26 | $ 443,264 | ||
| 1,831,366 | Asurion LLC (fka Asurion Corp.), New B-7 Term Loan, 3.148% | ||
(LIBOR + 300 bps), 11/3/24 | 1,799,317 | ||
| 1,540,265 | Confie Seguros Holding II Co., Term B Loan, 5.75% (LIBOR + | ||
475 bps), 4/19/22 | 1,486,356 | ||
| 1,384,753 | Integro Parent, Inc., First Lien Initial Term Loan, 6.75% | ||
(LIBOR + 575 bps), 10/31/22 | 1,363,982 | ||
| 727,019 | MPH Acquisition Holdings LLC, Initial Term Loan, 3.75% | ||
(LIBOR + 275 bps), 6/7/23 | 718,840 | ||
| 750,000 | Navicure, Inc., First Lien 2020 Incremental Term Loan, 4.75% | ||
(LIBOR + 400 bps), 10/22/26 | 739,688 | ||
| 987,500 | Sedgwick Claims Management Services, Inc. (Lightning | ||
Cayman Merger Sub, Ltd.), 2019 Term Loan, 4.148% (LIBOR | |||
+ 400 bps), 9/3/26 | 962,283 | ||
| 850,673 | USI, Inc. (fka Compass Investors, Inc.), 2017 New Term Loan, | ||
3.22% (LIBOR + 300 bps), 5/16/24 | 821,431 | ||
| Total Insurance | $ 8,335,161 | ||
| Leasing — 1.3% | |||
| 1,257,760 | Avolon TLB Borrower 1 (US) LLC, Term B-4 Loan, 2.25% | ||
(LIBOR + 150 bps), 2/12/27 | $ 1,205,485 | ||
| 825,227 | Fly Funding II S.a.r.l., Replacement Loan, 1.99% (LIBOR + | ||
175 bps), 8/11/25 | 720,011 | ||
| 600,000 | Fly Funding II S.a.r.l., Term Loan B, 6.237% (LIBOR + | ||
600 bps), 10/8/25 | 579,000 | ||
| 1,516,125 | IBC Capital I, Ltd. (aka Goodpack, Ltd.), First Lien Tranche | ||
B-1 Term Loan, 3.983% (LIBOR + | |||
375 bps), 9/11/23 | 1,458,638 | ||
| Total Leasing | $ 3,963,134 | ||
| Leisure & Entertainment — 0.7% | |||
| 1,275,301(b)(c) | 24 Hour Fitness Worldwide, Inc., Term Loan (LIBOR + | ||
350 bps), 5/30/25 | $ 48,143 | ||
| 920,345 | CityCenter Holdings LLC, Term B Loan, 3.0% (LIBOR + | ||
225 bps), 4/18/24 | 867,655 | ||
| 1,487,659 | Fitness International LLC, Term B Loan, 4.25% (LIBOR + | ||
325 bps), 4/18/25 | 1,097,148 | ||
| Total Leisure & Entertainment | $ 2,012,946 |
The accompanying notes are an integral part of these financial statements.
Pioneer Floating Rate Fund | Annual Report | 10/31/20 25
Schedule of Investments | 10/31/20 (continued)
| Principal | |||
| Amount USD ($) | Value | ||
| Machinery — 3.1% | |||
| 733,461 | Blount International, Inc., New Refinancing Term Loan, 4.75% | ||
(LIBOR + 375 bps), 4/12/23 | $ 731,513 | ||
| 1,702,857 | CTC AcquiCo GmbH, Facility B2, 3.256% (LIBOR + | ||
300 bps), 3/7/25 | 1,617,714 | ||
| 1,206,385 | Gardner Denver, Inc., 2020 GDI Tranche B-2 Dollar Term Loan, | ||
1.898% (LIBOR + 175 bps), 3/1/27 | 1,168,685 | ||
| 497,500 | Ingersoll-Rand Services Co., 2020 Spinco Tranche B-1 Dollar | ||
Term Loan, 1.898% (LIBOR + 175 bps), 3/1/27 | 481,953 | ||
| 2,233,125 | MHI Holdings LLC, Initial Term Loan, 5.148% (LIBOR + | ||
500 bps), 9/21/26 | 2,214,981 | ||
| 62,609 | NN, Inc., Tranche B Term Loan, 6.5% (LIBOR + | ||
575 bps), 10/19/22 | 62,100 | ||
| 1,092,515 | Shape Technologies Group, Inc., Initial Term Loan, 3.149% | ||
(LIBOR + 300 bps), 4/21/25 | 836,684 | ||
| 348,739 | Terex Corp., Incremental US Term Loan, 2.75% (LIBOR + | ||
200 bps), 1/31/24 | 339,149 | ||
| 1,946,741 | Welbilt, Inc. (fka Manitowoc Foodservice, Inc.), Term B | ||
Loan, 2.648% (LIBOR + 250 bps), 10/23/25 | 1,791,002 | ||
| Total Machinery | $ 9,243,781 | ||
| Media — 2.6% | |||
| 2,982,253 | Altice France SA, USD TLB-13 Incremental Term Loan, 4.237% | ||
(LIBOR + 400 bps), 8/14/26 | $ 2,902,478 | ||
| 714,567 | CSC Holdings LLC (fka CSC Holdings, Inc. (Cablevision)), | ||
March 2017 Refinancing Term Loan, 2.398% (LIBOR + | |||
225 bps), 7/17/25 | 691,522 | ||
| 2,582,899 | CSC Holdings LLC (fka CSC Holdings, Inc. (Cablevision)), | ||
October 2018 Incremental Term Loan, 2.398% (LIBOR + | |||
225 bps), 1/15/26 | 2,497,111 | ||
| 343,033 | CSC Holdings LLC (fka CSC Holdings, Inc. (Cablevision)), | ||
| September 2019 Initial Term Loan, 2.648% (LIBOR + | |||
250 bps), 4/15/27 | 332,813 | ||
| 460,029 | Diamond Sports Group LLC, Term Loan, 3.4% (LIBOR + | ||
325 bps), 8/24/26 | 287,949 | ||
| 1,015,000 | Ziggo Financing Partnership, Term Loan I Facility, 2.648% | ||
(LIBOR + 250 bps), 4/30/28 | 975,951 | ||
| Total Media | $ 7,687,824 | ||
| Metals & Mining — 1.9% | |||
| 1,046,357 | Atkore International, Inc., First Lien Initial Incremental | ||
Term Loan, 3.75% (LIBOR + 275 bps), 12/22/23 | $ 1,043,480 | ||
| 1,751,537 | BWay Holding Co., Initial Term Loan, 3.48% (LIBOR + | ||
325 bps), 4/3/24 | 1,643,161 | ||
| 2,209,278 | Phoenix Services International LLC, Term B Loan, 4.75% | ||
(LIBOR + 375 bps), 3/1/25 | 2,120,906 | ||
| 745,699 | TMS International Corp. (aka Tube City IMS Corp.), Term B-2 | ||
Loan, 3.75% (LIBOR + 275 bps), 8/14/24 | 719,599 | ||
| Total Metals & Mining | $ 5,527,146 |
The accompanying notes are an integral part of these financial statements.
26 Pioneer Floating Rate Fund | Annual Report | 10/31/20
| Principal | |||
| Amount USD ($) | Value | ||
| Oil & Gas — 2.3% | |||
| 1,965,000 | Centurion Pipeline Co. LLC (fka Lotus Midstream LLC), | ||
Initial Term Loan, 3.398% (LIBOR + | |||
325 bps), 9/29/25 | $ 1,933,069 | ||
| 2,521 | Delek US Holdings, Inc., Initial Term Loan, 2.398% (LIBOR + | ||
225 bps), 3/31/25 | 2,380 | ||
| 1,347,500 | NorthRiver Midstream Finance LP, Initial Term B Loan, 3.475% | ||
(LIBOR + 325 bps), 10/1/25 | 1,269,457 | ||
| 423,349 | Summit Midstream Partners Holdings LLC, Term Loan Credit | ||
Facility, 7.0% (LIBOR + 600 bps), 5/13/22 | 93,136 | ||
| 3,723,692 | Traverse Midstream Partners LLC, Advance Term Loan, 6.5% | ||
(LIBOR + 550 bps), 9/27/24 | 3,455,277 | ||
| Total Oil & Gas | $ 6,753,319 | ||
| Personal, Food & Miscellaneous Services — 2.1% | |||
| 970,051 | IRB Holding Corp. (aka Arby’s/Buffalo Wild Wings), 2020 | ||
Replacement Term B Loan, 3.75% (LIBOR + | |||
275 bps), 2/5/25 | $ 925,532 | ||
| 2,729,375 | Option Care Health, Inc., Term B Loan, 4.648% (LIBOR + | ||
450 bps), 8/6/26 | 2,673,082 | ||
| 2,800,479 | Parfums Holding Co., Inc., First Lien Initial Term Loan, | ||
4.256% (LIBOR + 400 bps), 6/30/24 | 2,719,965 | ||
| Total Personal, Food & Miscellaneous Services | $ 6,318,579 | ||
| Printing & Publishing — 1.7% | |||
| 1,243,750 | Nielsen Finance LLC, Dollar Term B-5 Loan, 4.75% (LIBOR + | ||
375 bps), 6/4/25 | $ 1,243,750 | ||
| 607,376 | Red Ventures LLC (New Imagitas, Inc.), First Lien Term B-2 | ||
Loan, 2.648% (LIBOR + 250 bps), 11/8/24 | 586,009 | ||
| 3,149,888 | Trader Corp., First Lien 2017 Refinancing Term Loan, 4.0% | ||
(LIBOR + 300 bps), 9/28/23 | 3,102,640 | ||
| Total Printing & Publishing | $ 4,932,399 | ||
| Professional & Business Services — 4.3% | |||
| 543,351 | Alion Science & Technology Corp., First Lien Replacement | ||
Term Loan, 4.75% (LIBOR + 375 bps), 7/23/24 | $ 542,672 | ||
| 1,400,000(b) | Amentum Government Services Holdings LLC, Incremental | ||
Term Loan, 1/29/27 | 1,373,750 | ||
| 992,500 | APi Group DE, Inc., Initial Term Loan, 2.648% (LIBOR + | ||
250 bps), 10/1/26 | 973,581 | ||
| 994,950 | athenahealth, Inc., First Lien Term B Loan, 4.75% (LIBOR + | ||
450 bps), 2/11/26 | 976,294 | ||
| 1,000,000(b) | Avantor, Inc., Term Loan B, 10/29/27 | 993,750 | |
| 1,984,975 | Clear Channel Outdoor Holdings, Inc., Term B Loan, 3.714% | ||
(LIBOR + 350 bps), 8/21/26 | 1,817,906 | ||
| 976,608 | Elanco Animal Health, Inc., Term Loan, 1.899% (LIBOR + | ||
175 bps), 8/1/27 | 956,901 | ||
| 1,259,716 | Pre-Paid Legal Services, Inc. (aka LegalShield), First Lien | ||
Initial Term Loan, 3.398% (LIBOR + | |||
325 bps), 5/1/25 | 1,219,957 | ||
| 250,000(b) | Pre-Paid Legal Services, Inc. (aka LegalShield), Incremental | ||
Term Loan, 5/1/25 | 246,250 |
The accompanying notes are an integral part of these financial statements.
Pioneer Floating Rate Fund | Annual Report | 10/31/20 27
Schedule of Investments | 10/31/20 (continued)
| Principal | |||
| Amount USD ($) | Value | ||
| Professional & Business Services — (continued) | |||
| 964,193 | SIWF Holdings, Inc. (aka Spring Window Fashions), First Lien | ||
Initial Term Loan, 4.398% (LIBOR + | |||
425 bps), 6/15/25 | $ 925,625 | ||
| 374,063 | STG-Fairway Holdings LLC, First Lien Term Facility, 3.398% | ||
(LIBOR + 325 bps), 1/31/27 | 364,150 | ||
| 615,000 | Tosca Services LLC, First Lien Term Loan, 5.25% (LIBOR + | ||
425 bps), 8/18/27 | 613,847 | ||
| 1,799,179 | Verscend Holding Corp., Term B Loan, 4.648% (LIBOR + | ||
450 bps), 8/27/25 | 1,769,192 | ||
| Total Professional & Business Services | $ 12,773,875 | ||
| Retail — 3.0% | |||
| 2,193,664 | Bass Pro Group LLC, Initial Term Loan, 5.75% (LIBOR + | ||
500 bps), 9/25/24 | $ 2,188,789 | ||
| 1,860,938 | Dealer Tire LLC, Term B-1 Loan, 4.398% (LIBOR + | ||
425 bps), 12/12/25 | 1,816,740 | ||
| 800,000 | Harbor Freight Tools USA, Inc., Initial Loan, 4.0% (LIBOR + | ||
325 bps), 10/19/27 | 789,687 | ||
| 1,634,787 | Michaels Stores, Inc., 2020 Refinancing Term B Loan, 4.25% | ||
(LIBOR + 350 bps), 10/1/27 | 1,610,266 | ||
| 848,348 | PetSmart, Inc., Amended Loan, 4.5% (LIBOR + | ||
350 bps), 3/11/22 | 841,341 | ||
| 582,090(b) | Service Logic Acquisition, Inc., Closing Date Initial Term | ||
Loan, 10/29/27 | 579,907 | ||
| 691,250 | Staples, Inc., 2019 Refinancing New Term B-2 Loan, 4.751% | ||
(LIBOR + 450 bps), 9/12/24 | 641,134 | ||
| 500,000(b) | Trugreen, Ltd. Partnership, Term Loan, 10/29/27 | 497,500 | |
| Total Retail | $ 8,965,364 | ||
| Securities & Trusts — 0.1% | |||
| 193,282 | Stonepeak Lonestar Holdings LLC, Initial Term Loan, 4.718% | ||
(LIBOR + 450 bps), 10/19/26 | $ 191,953 | ||
| Total Securities & Trusts | $ 191,953 | ||
| Telecommunications — 3.7% | |||
| 2,279,009 | CenturyLink, Inc., Term B Loan, 2.398% (LIBOR + | ||
225 bps), 3/15/27 | $ 2,198,207 | ||
| 1,736,842 | Commscope, Inc., Initial Term Loan, 3.398% (LIBOR + | ||
325 bps), 4/6/26 | 1,679,092 | ||
| 700,000 | Consolidated Communications, Inc., Initial Term Loan, 5.75% | ||
(LIBOR + 475 bps), 10/2/27 | 694,750 | ||
| 535,000 | Frontier Communications Corp., Initial Term Loan, 5.75% | ||
(LIBOR + 475 bps), 10/8/21 | 529,650 | ||
| 1,973,981 | Level 3 Financing, Inc., Tranche B 2027 Term Loan, 1.898% | ||
(LIBOR + 175 bps), 3/1/27 | 1,905,596 | ||
| 1,045,876 | Virgin Media Bristol LLC, N Facility, 2.648% (LIBOR + | ||
250 bps), 1/31/28 | 1,011,957 | ||
| 350,000(b) | Virgin Media Bristol LLC, Term Loan Q, 1/31/29 | 344,125 | |
| 698,250 | Windstream Services II LLC, Initial Term Loan, 7.25% (LIBOR | ||
+ 625 bps), 9/21/27 | 661,592 |
The accompanying notes are an integral part of these financial statements.
28 Pioneer Floating Rate Fund | Annual Report | 10/31/20
| Principal | |||
| Amount USD ($) | Value | ||
| Telecommunications — (continued) | |||
| 2,324,550 | Xplornet Communications, Inc., Initial Term Loan, 4.898% | ||
| (LIBOR + 475 bps), 6/10/27 | $ 2,282,901 | ||
| Total Telecommunications | $ 11,307,870 | ||
| Textile & Apparel — 0.9% | |||
| 1,469,542 | Adient US LLC, Initial Term Loan, 4.422% (LIBOR + | ||
| 425 bps), 5/6/24 | $ 1,414,434 | ||
| 900,000 | Ahead Data Blue LLC, Term Loan B, 6.0% (LIBOR + | ||
| 500 bps), 10/18/27 | 865,125 | ||
| 300,000 | Canada Goose, Inc., 2020 Refinancing Term Loan, 5.0% | ||
| (LIBOR + 425 bps), 10/7/27 | 298,406 | ||
| Total Textile & Apparel | $ 2,577,965 | ||
| Transportation — 0.7% | |||
| 1,473,750 | Envision Healthcare Corp., Initial Term Loan, 3.898% (LIBOR | ||
| + 375 bps), 10/10/25 | $ 1,060,732 | ||
| 497,500 | Genesee & Wyoming, Inc., Initial Term Loan, 2.22% (LIBOR + | ||
| 200 bps), 12/30/26 | 487,705 | ||
| 547,234 | Syncreon Group BV, Second Out Term Loan, 7.0% (LIBOR + | ||
| 600 bps), 4/1/25 | 517,136 | ||
| Total Transportation | $ 2,065,573 | ||
| Utilities — 2.1% | |||
| 704,439 | Calpine Construction Finance Co., LP, Term B Loan, 2.148% | ||
| (LIBOR + 200 bps), 1/15/25 | $ 685,067 | ||
| 798,877 | Compass Power Generation LLC, Tranche B-1 Term Loan, | ||
| 4.5% (LIBOR + 350 bps), 12/20/24 | 784,896 | ||
| 1,519,890 | Eastern Power LLC (Eastern Covert Midco LLC) (aka TPF II LC | ||
| LLC), Term Loan, 4.75% (LIBOR + | |||
| 375 bps), 10/2/25 | 1,512,693 | ||
| 490,766 | Edgewater Generation LLC, Term Loan, 3.898% (LIBOR + | ||
| 375 bps), 12/13/25 | 475,552 | ||
| 798,000 | Hamilton Projects Acquiror LLC, Term Loan, 5.75% (LIBOR + | ||
| 475 bps), 6/17/27 | 797,003 | ||
| 997,500 | PG&E Corp., Term Loan, 5.5% (LIBOR + 450 bps), 6/23/25 | 991,889 | |
| 932,346 | Vistra Operations Co. LLC (fka Tex Operations Co. LLC), | ||
| 2018 Incremental Term Loan, 1.898% (LIBOR + | |||
| 175 bps), 12/31/25 | 912,534 | ||
| Total Utilities | $ 6,159,634 | ||
| TOTAL SENIOR SECURED FLOATING RATE LOAN INTERESTS | |||
(Cost $272,237,956) | $262,303,080 |
| Shares | |||
| COMMON STOCK — 0.0% of Net Assets† | |||
| Specialty Retail — 0.0%† | |||
| 54,675+^(d) | Targus Cayman SubCo., Ltd. | $ 72,171 | |
| Total Specialty Retail | $ 72,171 | ||
| TOTAL COMMON STOCK | |||
(Cost $138,985) | $ 72,171 |
The accompanying notes are an integral part of these financial statements.
Pioneer Floating Rate Fund | Annual Report | 10/31/20 29
Schedule of Investments | 10/31/20 (continued)
| Principal | |||
| Amount USD ($) | Value | ||
| ASSET BACKED SECURITY — 0.3% of Net | |||
| Assets(a) | |||
| 875,000(a) | Palmer Square Loan Funding, Ltd., Series 2018-1A, | ||
| Class D, 4.187% (3 Month USD LIBOR + | |||
395 bps), 4/15/26 (144A) | $ 802,207 | ||
| TOTAL ASSET BACKED SECURITY | |||
(Cost $875,000) | $ 802,207 | ||
| COMMERCIAL MORTGAGE-BACKED SECURITIES — | |||
| 0.5% of Net Assets | |||
| 499,803(a) | FREMF Mortgage Trust, Series 2020-KF74, Class C, 6.378% | ||
| (1 Month USD LIBOR + 623 bps), 1/25/27 (144A) | $ 481,379 | ||
| 500,000(a) | FREMF Mortgage Trust, Series 2020-KF83, Class C, 9.148% | ||
| (1 Month USD LIBOR + 900 bps), 7/25/30 (144A) | 509,317 | ||
| 625,000(a) | Morgan Stanley Capital I Trust, Series 2019-BPR, | ||
| Class D, 4.148% (1 Month USD LIBOR + | |||
400 bps), 5/15/36 (144A) | 494,415 | ||
| TOTAL COMMERCIAL MORTGAGE-BACKED SECURITIES | |||
(Cost $1,652,661) | $ 1,485,111 | ||
| CORPORATE BONDS — 4.8% of Net Assets | |||
| Banks — 0.3% | |||
| 1,000,000(e)(f) | Citigroup, Inc., 4.7% (SOFRRATE + 323 bps) | $ 978,125 | |
| Total Banks | $ 978,125 | ||
| Beverages — 0.1% | |||
| 359,000 | Pernod Ricard SA, 4.45%, 1/15/22 (144A) | $ 375,779 | |
| Total Beverages | $ 375,779 | ||
| Chemicals — 0.3% | |||
| 500,000 | Olin Corp., 5.625%, 8/1/29 | $ 516,870 | |
| 376,000 | Rain CII Carbon LLC/CII Carbon Corp., 7.25%, 4/1/25 (144A) | 370,833 | |
| Total Chemicals | $ 887,703 | ||
| Commercial Services — 0.6% | |||
| 500,000 | Allied Universal Holdco LLC/Allied Universal Finance Corp., | ||
| 9.75%, 7/15/27 (144A) | $ 533,260 | ||
| 1,000,000 | APX Group, Inc., 6.75%, 2/15/27 (144A) | 1,042,500 | |
| Total Commercial Services | $ 1,575,760 | ||
| Diversified Financial Services — 0.5% | |||
| 1,000,000 | Avation Capital SA, 6.5%, 5/15/21 (144A) | $ 630,000 | |
| 440,000 | Nationstar Mortgage Holdings, Inc., 5.5%, 8/15/28 (144A) | 438,900 | |
| 385,000 | Nationstar Mortgage Holdings, Inc., 9.125%, 7/15/26 (144A) | 411,707 | |
| Total Diversified Financial Services | $ 1,480,607 | ||
| Environmental Control — 0.3% | |||
| 925,000 | Covanta Holding Corp., 5.0%, 9/1/30 | $ 941,188 | |
| Total Environmental Control | $ 941,188 |
The accompanying notes are an integral part of these financial statements.
30 Pioneer Floating Rate Fund | Annual Report | 10/31/20
| Principal | |||
| Amount USD ($) | Value | ||
| Healthcare-Services — 0.1% | |||
| 145,000 | Molina Healthcare, Inc., 4.375%, 6/15/28 (144A) | $ 148,625 | |
| Total Healthcare-Services | $ 148,625 | ||
| Housewares — 0.0%† | |||
| 70,000 | CD&R Smokey Buyer, Inc., 6.75%, 7/15/25 (144A) | $ 73,850 | |
| Total Housewares | $ 73,850 | ||
| Iron/Steel — 0.2% | |||
| 625,000 | Carpenter Technology Corp., 6.375%, 7/15/28 | $ 655,603 | |
| Total Iron/Steel | $ 655,603 | ||
| Lodging — 0.3% | |||
| 1,000,000 | Station Casinos LLC, 4.5%, 2/15/28 (144A) | $ 947,500 | |
| Total Lodging | $ 947,500 | ||
| Mining — 0.1% | |||
| 390,000 | Hudbay Minerals, Inc., 6.125%, 4/1/29 (144A) | $ 398,775 | |
| Total Mining | $ 398,775 | ||
| Oil & Gas — 0.3% | |||
| 1,000,000 | Indigo Natural Resources LLC, 6.875%, 2/15/26 (144A) | $ 982,500 | |
| Total Oil & Gas | $ 982,500 | ||
| Oil & Gas Services — 0.1% | |||
| 1,000,000 | FTS International, Inc., 6.25%, 5/1/22 | $ 280,000 | |
| Total Oil & Gas Services | $ 280,000 | ||
| Pharmaceuticals — 0.3% | |||
| 1,000,000 | Teva Pharmaceutical Finance Netherlands III BV, | ||
6.0%, 4/15/24 | $ 1,005,675 | ||
| Total Pharmaceuticals | $ 1,005,675 | ||
| Pipelines — 0.3% | |||
| 760,000 | Cheniere Energy, Inc., 4.625%, 10/15/28 (144A) | $ 784,700 | |
| Total Pipelines | $ 784,700 | ||
| REITs — 0.3% | |||
| 750,000 | Uniti Group LP/Uniti Fiber Holdings, Inc./CSL Capital | ||
LLC, 7.875%, 2/15/25 (144A) | $ 795,725 | ||
| Total REITs | $ 795,725 | ||
| Retail — 0.2% | |||
| 205,000 | Asbury Automotive Group, Inc., 4.5%, 3/1/28 (144A) | $ 208,587 | |
| 221,000 | Asbury Automotive Group, Inc., 4.75%, 3/1/30 (144A) | 228,183 | |
| 95,000 | L Brands, Inc., 6.625%, 10/1/30 (144A) | 99,750 | |
| Total Retail | $ 536,520 | ||
| Software — 0.1% | |||
| 160,000 | Black Knight InfoServ LLC, 3.625%, 9/1/28 (144A) | $ 162,000 | |
| Total Software | $ 162,000 |
The accompanying notes are an integral part of these financial statements.
Pioneer Floating Rate Fund | Annual Report | 10/31/20 31
Schedule of Investments | 10/31/20 (continued)
| Principal | |||
| Amount USD ($) | Value | ||
| Transportation — 0.4% | |||
| 1,371,933(a) | Golar LNG Partners LP, 8.38% (3 Month USD LIBOR + | ||
| 810 bps), 11/15/22 (144A) | $ 1,124,990 | ||
| Total Transportation | $ 1,124,990 | ||
| TOTAL CORPORATE BONDS | |||
(Cost $15,278,475) | $ 14,135,625 | ||
| INSURANCE-LINKED SECURITIES — 1.1% of | |||
| Net Assets# | |||
| Event Linked Bond — 0.1% | |||
| Windstorm — U.S. Regional — 0.1% | |||
| 250,000(a) | Matterhorn Re, 7.086% (3 Month U.S. Treasury Bill + | ||
| 700 bps), 12/7/21 (144A) | $ 254,925 | ||
| Total Event Linked Bond | $ 254,925 |
| Face | |||
| Amount USD ($) | |||
| Collateralized Reinsurance — 0.0%† | |||
| Multiperil – Worldwide — 0.0%† | |||
| 12,000+(g) | Limestone Re 2016-1, 8/31/21 | $ 196 | |
| 300,000+(d)(g) | Resilience Re, 4/6/21 | 30 | |
| $ 226 | |||
| Windstorm – Florida — 0.0%† | |||
| 300,000+(d)(g) | Formby Re 2018, 2/28/21 | $ 53,075 | |
| Total Collateralized Reinsurance | $ 53,301 | ||
| Reinsurance Sidecars — 1.0% | |||
| Multiperil – U.S. — 0.0%† | |||
| 600,000+(d)(g) | Carnoustie Re 2017, 11/30/21 | $ 79,080 | |
| 400,000+(d)(i) | Harambee Re 2018, 12/31/21 | 3,280 | |
| 400,000+(i) | Harambee Re 2019, 12/31/22 | 4,600 | |
| $ 86,960 | |||
| Multiperil – Worldwide — 1.0% | |||
| 4,860+(i) | Alturas Re 2019-2, 3/10/22 | $ 25,934 | |
| 395,000+(d)(i) | Alturas Re 2020-2, 3/10/23 | 436,357 | |
| 250,000+(d)(g) | Bantry Re, 2016, 3/31/21 | 20,150 | |
| 1,635,886+(d)(g) | Berwick Re 2018-1, 12/31/21 | 199,087 | |
| 739,764+(d)(g) | Berwick Re 2019-1, 12/31/22 | 88,402 | |
| 30,000+(g) | Eden Re II, 3/22/22 (144A) | 20,655 | |
| 5,700+(d)(g) | Eden Re II, 3/22/23 (144A) | 48,929 | |
| 500,000+(d)(g) | Eden Re II, 3/22/24 (144A) | 562,000 | |
| 350,000+(d)(g) | Gleneagles Re 2016, 11/30/20 | 10,920 | |
| 700,000+(d)(i) | Lorenz Re 2018, 7/1/21 | 19,180 | |
| 400,000+(d)(g) | Merion Re 2018-2, 12/31/21 | 444,247 | |
| 600,000+(d)(g) | Pangaea Re 2018-1, 12/31/21 | 12,633 |
The accompanying notes are an integral part of these financial statements.
32 Pioneer Floating Rate Fund | Annual Report | 10/31/20
| Face | |||
| Amount USD ($) | |||
| Multiperil – Worldwide — (continued) | |||
| 600,000+(d)(g) | Pangaea Re 2018-3, 7/1/22 | $ 12,446 | |
| 491,548+(d)(g) | Pangaea Re 2019-1, 2/1/23 | 10,243 | |
| 441,188+(d)(g) | Pangaea Re 2019-3, 7/1/23 | 15,870 | |
| 486,388+(d)(g) | Pangaea Re 2020-1, 2/1/24 | 529,202 | |
| 150,000+(d)(g) | Sector Re V, 12/1/23 (144A) | 50,079 | |
| 100,000+(d)(g) | Sector Re V, 12/1/24 (144A) | 111,139 | |
| 600,000+(d)(g) | St. Andrews Re 2017-1, 2/1/21 | 40,680 | |
| 695,194+(d)(g) | St. Andrews Re 2017-4, 6/1/21 | 68,407 | |
| 253,645+(d)(g) | Woburn Re 2018, 12/31/21 | 23,370 | |
| 74,914+(d)(g) | Woburn Re 2019, 12/31/22 | 25,526 | |
| $ 2,775,456 | |||
| Total Reinsurance Sidecars | $ 2,862,416 | ||
| TOTAL INSURANCE-LINKED SECURITIES | |||
(Cost $3,460,799) | $ 3,170,642 | ||
| U.S. GOVERNMENT AND AGENCY OBLIGATIONS — | |||
| 2.7% of Net Assets | |||
| 3,000,000(h) | U.S. Treasury Bills, 11/12/20 | $ 2,999,940 | |
| 5,000,000(h) | U.S. Treasury Bills, 11/17/20 | 4,999,850 | |
| TOTAL U.S. GOVERNMENT AND AGENCY OBLIGATIONS | |||
(Cost $7,999,768) | $ 7,999,790 | ||
| TOTAL INVESTMENTS IN UNAFFILIATED ISSUERS — 98.0% | |||
(Cost $301,643,644) | $289,968,626 | ||
| OTHER ASSETS AND LIABILITIES — 2.0% | $ 5,955,180 | ||
| NET ASSETS — 100.0% | $295,923,806 |
bps Basis Points.
FREMF Freddie Mac Multifamily Fixed-Rate Mortgage Loans.
LIBOR London Interbank Offered Rate.
PRIME U.S. Federal Funds Rate.
REIT Real Estate Investment Trust.
SOFRRATE Secured Overnight Financing Rate.
FREMF Freddie Mac Multifamily Fixed-Rate Mortgage Loans.
LIBOR London Interbank Offered Rate.
PRIME U.S. Federal Funds Rate.
REIT Real Estate Investment Trust.
SOFRRATE Secured Overnight Financing Rate.
(144A) Security is exempt from registration under Rule 144A of the Securities Act of 1933. Such securities may be resold normally to qualified institutional buyers in a transaction exempt from registration. At October 31, 2020, the value of these securities amounted to $13,093,204, or 4.4% of net assets.
† Amount rounds to less than 0.1%.
* Senior secured floating rate loan interests in which the Fund invests generally pay interest at rates that are periodically redetermined by reference to a base lending rate plus a premium. These base lending rates are generally (i) the lending rate offered by one or more major European banks, such as LIBOR, (ii) the prime rate offered by one or more major United States banks, (iii) the rate of a certificate of deposit or (iv) other base lending rates used by commercial lenders. The interest rate shown is the rate accruing at October 31, 2020.
The accompanying notes are an integral part of these financial statements.
Pioneer Floating Rate Fund | Annual Report | 10/31/20 33
Schedule of Investments | 10/31/20 (continued)
+ | Security that used significant unobservable inputs to determine its value. |
| ^ | Security is valued using fair value methods (other than supplied by independent pricing services). |
(a) | Floating rate note. Coupon rate, reference index and spread shown at October 31, 2020. |
| (b) | This term loan will settle after October 31, 2020, at which time the interest rate will be determined. |
| (c) | Security is in default. |
| (d) | Non-income producing security. |
(e) | The interest rate is subject to change periodically. The interest rate and/or reference index and spread shown at October 31, 2020. |
| (f) | Security is perpetual in nature and has no stated maturity date. |
| (g) | Issued as participation notes. |
| (h) | Security issued with a zero coupon. Income is recognized through accretion of discount. |
| (i) | Issued as preference shares. |
| # | Securities are restricted as to resale. |
| Restricted Securities | Acquisition date | Cost | Value |
Alturas Re 2019-2 | 12/19/2018 | $ 4,860 | $ 25,934 |
Alturas Re 2020-2 | 1/1/2020 | 395,000 | 436,357 |
Bantry Re 2016 | 2/6/2019 | 20,150 | 20,150 |
Berwick Re 2018-1 | 1/10/2018 | 311,660 | 199,087 |
Berwick Re 2019-1 | 12/31/2018 | 88,396 | 88,402 |
Carnoustie Re 2017 | 1/5/2017 | 142,655 | 79,080 |
Eden Re II | 1/22/2019 | 5,700 | 48,929 |
Eden Re II | 12/23/2019 | 500,000 | 562,000 |
Eden Re II | 12/15/2017 | 1,793 | 20,655 |
Formby Re 2018 | 7/9/2018 | 44,415 | 53,075 |
Gleneagles Re 2016 | 1/14/2016 | — | 10,920 |
Harambee Re 2018 | 12/19/2017 | 31,219 | 3,280 |
Harambee Re 2019 | 12/20/2018 | — | 4,600 |
Limestone Re 2016-1 | 12/15/2016 | 990 | 196 |
Lorenz Re 2018 | 6/26/2018 | 187,798 | 19,180 |
Matterhorn Re | 4/30/2020 | 250,000 | 254,925 |
Merion Re 2018-2 | 12/28/2017 | 400,000 | 444,247 |
Pangaea Re 2018-1 | 12/26/2017 | 85,805 | 12,633 |
Pangaea Re 2018-3 | 5/31/2018 | 144,517 | 12,446 |
Pangaea Re 2019-1 | 1/9/2019 | 5,160 | 10,243 |
Pangaea Re 2019-3 | 7/25/2019 | 13,236 | 15,870 |
Pangaea Re 2020-1 | 1/21/2020 | 486,388 | 529,202 |
Resilience Re | 4/13/2017 | 980 | 30 |
Sector Re V | 1/1/2020 | 100,000 | 111,139 |
Sector Re V | 12/4/2018 | 81,971 | 50,079 |
St. Andrews Re 2017-1 | 1/5/2017 | 40,649 | 40,680 |
St. Andrews Re 2017-4 | 3/31/2017 | — | 68,407 |
Woburn Re 2018 | 3/20/2018 | 94,515 | 23,370 |
Woburn Re 2019 | 2/14/2019 | 22,942 | 25,526 |
| Total Restricted Securities | $3,170,642 | ||
| % of Net assets | 1.1% |
The accompanying notes are an integral part of these financial statements.
34 Pioneer Floating Rate Fund | Annual Report | 10/31/20
SWAP CONTRACT
CENTRALLY CLEARED CREDIT DEFAULT SWAP CONTRACT — SELL PROTECTION
| Reference | Annual | ||||||
| Notional | Obligation / | Pay/ | Fixed | Expiration | Premiums | Unrealized | Market |
Amount ($)(1) | Index | Receive(2) | Rate | Date | (Paid) | Appreciation | Value |
| 4,600,000 | Markit CDX North | Receive | 5.00% | 6/20/25 | $(8,306) | $227,259 | $218,953 |
America High | |||||||
Yield Series 34 | |||||||
| TOTAL CENTRALLY CLEARED CREDIT DEFAULT SWAP | |||||||
| CONTRACT – SELL PROTECTION | $(8,306) | $227,259 | $218,953 | ||||
| TOTAL SWAP CONTRACT | $(8,306) | $227,259 | $218,953 | ||||
(1) | The notional amount is the maximum amount that a seller of credit protection would be obligated to pay upon occurrence of a credit event. |
(2) | Receives quarterly. |
Principal amounts are denominated in U.S. dollars (“USD”) unless otherwise noted.
Purchases and sales of securities (excluding temporary cash investments) for the year ended October 31, 2020 were as follows:
| Purchases | Sales | |
Long-Term U.S. Government Securities | $ 5,005,331 | $ 4,988,079 |
Other Long-Term Securities | $151,571,299 | $305,985,320 |
The Fund is permitted to engage in purchase and sale transactions (“cross trades”) with certain funds and accounts which for Amundi Pioneer Asset Management, Inc. (the “Adviser”) serves as the Fund’s investment adviser, as set forth in Rule 17a-7 under the Investment Company Act of 1940, pursuant to procedures adopted by the Board of Trustees. Under these procedures, cross trades are effected at current market prices. During the year ended October 31, 2020, the Fund did not engage in any cross trade activity.
At October 31, 2020, the net unrealized depreciation on investments based on cost for federal tax purposes of $302,471,303 was as follows:
| Aggregate gross unrealized appreciation for all investments in which | |
| there is an excess of value over tax cost | $ 1,980,222 |
| Aggregate gross unrealized depreciation for all investments in which | |
| there is an excess of tax cost over value | (14,263,946) |
| Net unrealized depreciation | $(12,283,724) |
Various inputs are used in determining the value of the Fund’s investments. These inputs are summarized in the three broad levels below.
Level 1 – quoted prices in active markets for identical securities.
Level 2 – other significant observable inputs (including quoted prices for similar securities, interest rates, prepayment speeds, credit risks, etc.). See Notes to Financial Statements —Note 1A.
Level 3 – significant unobservable inputs (including the Fund’s own assumptions in determining fair value of investments). See Notes to Financial Statements — Note 1A.
The accompanying notes are an integral part of these financial statements.
Pioneer Floating Rate Fund | Annual Report | 10/31/20 35
Schedule of Investments | 10/31/20 (continued)
The following is a summary of the inputs used as of October 31, 2020, in valuing the Fund’s investments:
| Level 1 | Level 2 | Level 3 | Total | |
Senior Secured Floating | ||||
| Rate Loan Interests | $ — | $262,303,080 | $ — | $262,303,080 |
Common Stock | — | — | 72,171 | 72,171 |
Asset Backed Security | — | 802,207 | — | 802,207 |
Commercial Mortgage-Backed | ||||
| Securities | — | 1,485,111 | — | 1,485,111 |
Corporate Bonds | — | 14,135,625 | — | 14,135,625 |
Insurance-Linked Securities | ||||
| Collateralized Reinsurance | ||||
| Multiperil - Worldwide | — | — | 226 | 226 |
| Windstorm - Florida | — | — | 53,075 | 53,075 |
| Reinsurance Sidecars | ||||
| Multiperil - U.S. | — | — | 86,960 | 86,960 |
| Multiperil - Worldwide | — | — | 2,775,456 | 2,775,456 |
| All Other Insurance-Linked | ||||
| Security | — | 254,925 | — | 254,925 |
U.S. Government and | ||||
| Agency Obligations | — | 7,999,790 | — | 7,999,790 |
| Total Investments | ||||
| in Securities | $ — | $286,980,738 | $2,987,888 | $289,968,626 |
| Other Financial Instruments | ||||
| Swap contracts, at value | $ — | $ 218,953 | $ — | $ 218,953 |
| Total Other | ||||
| Financial Instruments | $ — | $ 218,953 | $ — | $ 218,953 |
The following is a reconciliation of assets valued using significant unobservable inputs (Level 3):
| Insurance- | |||
| Common | Linked | ||
| Stock | Securities | Total | |
Balance as of 10/31/19 | $65,063 | $ 5,478,587 | $ 5,543,650 |
Realized gain (loss)(1) | — | (144,886) | (144,886) |
Changed in unrealized appreciation | |||
(depreciation)(2) | 14,265 | 293,573 | 307,838 |
Accrued discounts/premiums | — | — | — |
Purchases | — | 1,481,388 | 1,481,388 |
Sales | (7,157) | (4,192,945) | (4,200,102) |
Transfers in to Level 3* | — | — | — |
Transfers out of Level 3* | — | — | — |
| Balance as of 10/31/20 | $72,171 | $ 2,915,717 | $ 2,987,888 |
(1) | Realized gain (loss) on these securities is included in the realized gain (loss) from investments on the Statement of Operations. |
(2) | Unrealized appreciation (depreciation) on these securities is included in the change in unrealized appreciation (depreciation) from investments on the Statement of Operations. |
* | Transfers are calculated on the beginning of period value. During the year ended October 31, 2020, there were no transfers between Levels 1, 2 and 3. |
| Net change in unrealized appreciation (depreciation) of Level 3 investments still held and considered Level 3 at October 31, 2020: | |
| $210,914 |
The accompanying notes are an integral part of these financial statements.
36 Pioneer Floating Rate Fund | Annual Report | 10/31/20
| ASSETS: | ||||
| Investments in unaffiliated issuers, at value (cost $301,643,644) | $ | 289,968,626 | ||
| Cash | 10,667,825 | |||
| Swaps collateral | 513,857 | |||
| Swap contracts, at value (net premiums paid $(8,306)) | 218,953 | |||
| Unrealized appreciation on unfunded loan commitments | 3,223 | |||
| Receivables — | ||||
| Investment securities sold | 7,016,501 | |||
| Fund shares sold | 807,390 | |||
| Interest | 652,245 | |||
| Other assets | 23,354 | |||
| Total assets | $ | 309,871,974 | ||
| LIABILITIES: | ||||
| Payables — | ||||
| Investment securities purchased | 10,575,515 | |||
| Fund shares repurchased | 2,580,762 | |||
| Distributions | 156,125 | |||
| Trustees’ fees | 3,156 | |||
| Due to broker for swaps | 225,016 | |||
| Variation margin for centrally cleared swap contracts | 4,841 | |||
| Due to affiliates | 29,482 | |||
| Accrued expenses | 373,271 | |||
| Total liabilities | $ | 13,948,168 | ||
| NET ASSETS: | ||||
| Paid-in capital | $ | 364,155,703 | ||
| Distributable earnings (loss) | (68,231,897 | ) | ||
| Net assets | $ | 295,923,806 | ||
| NET ASSET VALUE PER SHARE: | ||||
No par value (unlimited number of shares authorized) | ||||
| Class A (based on $69,247,892/11,024,019 shares) | $ | 6.28 | ||
| Class C (based on $21,351,755/3,370,136 shares) | $ | 6.34 | ||
| Class Y (based on $205,324,159/32,371,207 shares) | $ | 6.34 | ||
| MAXIMUM OFFERING PRICE PER SHARE: | ||||
| Class A (based on $6.28 net asset value per share/100%-4.50% | ||||
| maximum sales charge) | $ | 6.58 | ||
The accompanying notes are an integral part of these financial statements.
Pioneer Floating Rate Fund | Annual Report | 10/31/20 37
| Statement of Operations | ||
| FOR THE YEAR ENDED 10/31/20 |
| INVESTMENT INCOME: | ||||||||
| Interest from unaffiliated issuers | $ | 16,201,799 | ||||||
| Dividends from unaffiliated issuers | 232,312 | |||||||
| Total investment income | $ | 16,434,111 | ||||||
| EXPENSES: | ||||||||
| Management fees | $ | 2,228,828 | ||||||
| Administrative expense | 132,629 | |||||||
| Transfer agent fees | ||||||||
| Class A | 136,460 | |||||||
| Class C | 19,534 | |||||||
| Class Y | 247,250 | |||||||
| Distribution fees | ||||||||
| Class A | 219,747 | |||||||
| Class C | 283,804 | |||||||
| Shareowner communications expense | 41,192 | |||||||
| Custodian fees | 70,283 | |||||||
| Registration fees | 70,998 | |||||||
| Professional fees | 71,372 | |||||||
| Printing expense | 32,931 | |||||||
| Pricing fees | 36,843 | |||||||
| Trustees’ fees | 15,985 | |||||||
| Insurance expense | 7,207 | |||||||
| Interest expense | 1,892 | |||||||
| Miscellaneous | 119,734 | |||||||
| Total expenses | $ | 3,736,689 | ||||||
| Less fees waived and expenses reimbursed by the Adviser | (420,987 | ) | ||||||
| Net expenses | $ | 3,315,702 | ||||||
| Net investment income | $ | 13,118,409 | ||||||
| REALIZED AND UNREALIZED GAIN (LOSS) | ||||||||
| ON INVESTMENTS: | ||||||||
| Net realized gain (loss) on: | ||||||||
| Investments in unaffiliated issuers | $ | (20,307,139 | ) | |||||
| Swap contracts | (2,481,707 | ) | $ | (22,788,846 | ) | |||
| Change in net unrealized appreciation (depreciation) on: | ||||||||
| Investments in unaffiliated issuers | $ | (1,805,704 | ) | |||||
| Swap contracts | (41,613 | ) | ||||||
| Unfunded loan commitments | 11,804 | $ | (1,835,513 | ) | ||||
| Net realized and unrealized gain (loss) on investments | $ | (24,624,359 | ) | |||||
| Net decrease in net assets resulting from operations | $ | (11,505,950 | ) | |||||
The accompanying notes are an integral part of these financial statements.
38 Pioneer Floating Rate Fund | Annual Report | 10/31/20
| Statements of Changes in Net Assets | ||||||
| Year | Year | |||||||
| Ended | Ended | |||||||
| 10/31/20 | 10/31/19 | |||||||
| FROM OPERATIONS: | ||||||||
Net investment income (loss) | $ | 13,118,409 | $ | 32,610,208 | ||||
Net realized gain (loss) on investments | (22,788,846 | ) | (11,811,251 | ) | ||||
Change in net unrealized appreciation | ||||||||
| (depreciation) on investments | (1,835,513 | ) | (7,290,318 | ) | ||||
| Net increase (decrease) in net assets resulting | ||||||||
| from operations | $ | (11,505,950 | ) | $ | 13,508,639 | |||
| DISTRIBUTIONS TO SHAREOWNERS: | ||||||||
| Class A ($0.24 and $0.32 per share, respectively) | $ | (3,496,835 | ) | $ | (6,547,561 | ) | ||
| Class C ($0.19 and $0.27 per share, respectively) | (902,478 | ) | (2,223,349 | ) | ||||
| Class Y ($0.27 and $0.34 per share, respectively) | (11,028,765 | ) | (24,842,616 | ) | ||||
| Total distributions to shareowners | $ | (15,428,078 | ) | $ | (33,613,526 | ) | ||
| FROM FUND SHARE TRANSACTIONS: | ||||||||
Net proceeds from sales of shares | $ | 88,387,945 | $ | 168,055,803 | ||||
Reinvestment of distributions | 12,913,616 | 28,938,127 | ||||||
Cost of shares repurchased | (274,579,504 | ) | (623,353,648 | ) | ||||
| Net decrease in net assets resulting from | ||||||||
| Fund share transactions | $ | (173,277,943 | ) | $ | (426,359,718 | ) | ||
| Net decrease in net assets | $ | (200,211,971 | ) | $ | (446,464,605 | ) | ||
| NET ASSETS: | ||||||||
Beginning of year | $ | 496,135,777 | $ | 942,600,382 | ||||
End of year | $ | 295,923,806 | $ | 496,135,777 | ||||
The accompanying notes are an integral part of these financial statements.
Pioneer Floating Rate Fund | Annual Report | 10/31/20 39
Statements of Changes in Net Assets (continued)
| Year Ended | Year Ended | Year Ended | Year Ended | |||||||||||||
| 10/31/20 | 10/31/20 | 10/31/19 | 10/31/19 | |||||||||||||
| Shares | Amount | Shares | Amount | |||||||||||||
| Class A | ||||||||||||||||
Shares sold | 3,397,449 | $ | 21,584,622 | 3,390,761 | $ | 22,477,360 | ||||||||||
Reinvestment of | ||||||||||||||||
| distributions | 521,527 | 3,301,675 | 939,559 | 6,214,408 | ||||||||||||
Less shares repurchased | (11,254,927 | ) | (69,574,416 | ) | (9,880,687 | ) | (65,579,309 | ) | ||||||||
| Net decrease | (7,335,951 | ) | $ | (44,688,119 | ) | (5,550,367 | ) | $ | (36,887,541 | ) | ||||||
| Class C | ||||||||||||||||
Shares sold | 409,166 | $ | 2,633,324 | 1,084,913 | $ | 7,194,599 | ||||||||||
Reinvestment of | ||||||||||||||||
| distributions | 128,934 | 819,494 | 306,250 | 2,026,655 | ||||||||||||
Less shares repurchased | (3,116,988 | ) | (19,375,279 | ) | (5,587,402 | ) | (37,054,505 | ) | ||||||||
| Net decrease | (2,578,888 | ) | $ | (15,922,461 | ) | (4,196,239 | ) | $ | (27,833,251 | ) | ||||||
| Class Y | ||||||||||||||||
Shares sold | 10,023,366 | $ | 64,169,999 | 20,786,285 | $ | 138,383,844 | ||||||||||
Reinvestment of | ||||||||||||||||
| distributions | 1,383,095 | 8,792,447 | 3,121,496 | 20,697,064 | ||||||||||||
Less shares repurchased | (30,121,043 | ) | (185,629,809 | ) | (78,459,853 | ) | (520,719,834 | ) | ||||||||
| Net decrease | (18,714,582 | ) | $ | (112,667,363 | ) | (54,552,072 | ) | $ | (361,638,926 | ) | ||||||
The accompanying notes are an integral part of these financial statements.
40 Pioneer Floating Rate Fund | Annual Report | 10/31/20
| Financial Highlights |
| Year | Year | Year | Year | Year | ||||||||||||||||
| Ended | Ended | Ended | Ended | Ended | ||||||||||||||||
| 10/31/20 | 10/31/19 | 10/31/18 | 10/31/17 | 10/31/16* | ||||||||||||||||
| Class A | ||||||||||||||||||||
Net asset value, beginning of period | $ | 6.57 | $ | 6.73 | $ | 6.80 | $ | 6.79 | $ | 6.73 | ||||||||||
Increase (decrease) from investment operations: | ||||||||||||||||||||
| Net investment income (loss) (a) | $ | 0.21 | $ | 0.31 | $ | 0.26 | $ | 0.24 | $ | 0.24 | ||||||||||
| Net realized and unrealized gain (loss) on investments | (0.26 | ) | (0.15 | ) | (0.06 | ) | 0.01 | 0.05 | ||||||||||||
| Net increase (decrease) from investment operations | $ | (0.05 | ) | $ | 0.16 | $ | 0.20 | $ | 0.25 | $ | 0.29 | |||||||||
Distributions to shareowners: | ||||||||||||||||||||
| Net investment income | $ | (0.24 | ) | $ | (0.32 | ) | $ | (0.27 | ) | $ | (0.24 | ) | $ | (0.23 | ) | |||||
| Net increase (decrease) in net asset value | $ | (0.29 | ) | $ | (0.16 | ) | $ | (0.07 | ) | $ | 0.01 | $ | 0.06 | |||||||
Net asset value, end of period | $ | 6.28 | $ | 6.57 | $ | 6.73 | $ | 6.80 | $ | 6.79 | ||||||||||
| Total return (b) | (0.71 | )% | 2.42 | % | 2.96 | % | 3.71 | % | 4.49 | % | ||||||||||
Ratio of net expenses to average net assets | 1.12 | % | 1.07 | % | 1.01 | % | 1.02 | % | 1.01 | % | ||||||||||
Ratio of net investment income (loss) to average net assets | 3.31 | % | 4.64 | % | 3.89 | % | 3.54 | % | 3.66 | % | ||||||||||
Portfolio turnover rate | 45 | % | 13 | % | 42 | % | 69 | % | 51 | % | ||||||||||
Net assets, end of period (in thousands) | $ | 69,248 | $ | 120,559 | $ | 161,020 | $ | 193,193 | $ | 194,408 | ||||||||||
Ratios with no waiver of fees and assumption of expenses by | ||||||||||||||||||||
| the Adviser and no reduction for fees paid indirectly: | ||||||||||||||||||||
| Total expenses to average net assets | 1.17 | % | 1.11 | % | 1.01 | % | 1.02 | % | 1.04 | % | ||||||||||
| Net investment income (loss) to average net assets | 3.26 | % | 4.60 | % | 3.89 | % | 3.54 | % | 3.63 | % | ||||||||||
* | The Fund was audited by an independent registered public accounting firm other than Ernst & Young LLP. |
(a) | The per-share data presented above is based on the average shares outstanding for the period presented. |
(b) | Assumes initial investment at net asset value at the beginning of each period, reinvestment of all distributions, the complete redemption of the investment at net asset value at the end of each period and no sales charges. Total return would be reduced if sales charges were taken into account. |
The accompanying notes are an integral part of these financial statements.
Pioneer Floating Rate Fund | Annual Report | 10/31/20 41
Financial Highlights (continued) |
| Year | Year | Year | Year | Year | ||||||||||||||||
| Ended | Ended | Ended | Ended | Ended | ||||||||||||||||
| 10/31/20 | 10/31/19 | 10/31/18 | 10/31/17 | 10/31/16* | ||||||||||||||||
| Class C | ||||||||||||||||||||
Net asset value, beginning of period | $ | 6.57 | $ | 6.74 | $ | 6.80 | $ | 6.79 | $ | 6.74 | ||||||||||
Increase (decrease) from investment operations: | ||||||||||||||||||||
| Net investment income (loss) (a) | $ | 0.17 | $ | 0.26 | $ | 0.21 | $ | 0.19 | $ | 0.19 | ||||||||||
| Net realized and unrealized gain (loss) on investments | (0.21 | ) | (0.16 | ) | (0.05 | ) | 0.01 | 0.05 | ||||||||||||
| Net increase (decrease) from investment operations | $ | (0.04 | ) | $ | 0.10 | $ | 0.16 | $ | 0.20 | $ | 0.24 | |||||||||
Distributions to shareowners: | ||||||||||||||||||||
| Net investment income | $ | (0.19 | ) | $ | (0.27 | ) | $ | (0.22 | ) | $ | (0.19 | ) | $ | (0.19 | ) | |||||
| Net increase (decrease) in net asset value | $ | (0.23 | ) | $ | (0.17 | ) | $ | (0.06 | ) | $ | 0.01 | $ | 0.05 | |||||||
Net asset value, end of period | $ | 6.34 | $ | 6.57 | $ | 6.74 | $ | 6.80 | $ | 6.79 | ||||||||||
| Total return (b) | (0.54 | )% | 1.52 | % | 2.35 | % | 2.93 | % | 3.58 | % | ||||||||||
Ratio of net expenses to average net assets | 1.80 | % | 1.77 | % | 1.76 | % | 1.77 | % | 1.79 | % | ||||||||||
Ratio of net investment income (loss) to average net assets | 2.63 | % | 3.94 | % | 3.15 | % | 2.78 | % | 2.89 | % | ||||||||||
Portfolio turnover rate | 45 | % | 13 | % | 42 | % | 69 | % | 51 | % | ||||||||||
Net assets, end of period (in thousands) | $ | 21,352 | $ | 39,105 | $ | 68,364 | $ | 79,057 | $ | 85,563 | ||||||||||
Ratios with no waiver of fees and assumption of expenses by | ||||||||||||||||||||
| the Adviser and no reduction for fees paid indirectly: | ||||||||||||||||||||
| Total expenses to average net assets | 1.84 | % | 1.81 | % | 1.76 | % | 1.77 | % | 1.81 | % | ||||||||||
| Net investment income (loss) to average net assets | 2.59 | % | 3.90 | % | 3.15 | % | 2.78 | % | 2.87 | % | ||||||||||
* | The Fund was audited by an independent registered public accounting firm other than Ernst & Young LLP. |
(a) | The per-share data presented above is based on the average shares outstanding for the period presented. |
(b) | Assumes initial investment at net asset value at the beginning of each period, reinvestment of all distributions, the complete redemption of the investment at net asset value at the end of each period and no sales charges. Total return would be reduced if sales charges were taken into account. |
The accompanying notes are an integral part of these financial statements.
42 Pioneer Floating Rate Fund | Annual Report | 10/31/20
Year | Year | Year | Year | Year | ||||||||||||||||
| Ended | Ended | Ended | Ended | Ended | ||||||||||||||||
| 10/31/20 | 10/31/19 | 10/31/18 | 10/31/17 | 10/31/16* | ||||||||||||||||
| Class Y | ||||||||||||||||||||
Net asset value, beginning of period | $ | 6.59 | $ | 6.75 | $ | 6.82 | $ | 6.81 | $ | 6.75 | ||||||||||
Increase (decrease) from investment operations: | ||||||||||||||||||||
| Net investment income (loss) (a) | $ | 0.24 | $ | 0.33 | $ | 0.29 | $ | 0.26 | $ | 0.27 | ||||||||||
| Net realized and unrealized gain (loss) on investments | (0.22 | ) | (0.15 | ) | (0.07 | ) | 0.01 | 0.05 | ||||||||||||
| Net increase (decrease) from investment operations | $ | 0.02 | $ | 0.18 | $ | 0.22 | $ | 0.27 | $ | 0.32 | ||||||||||
Distributions to shareowners: | ||||||||||||||||||||
| Net investment income | $ | (0.27 | ) | $ | (0.34 | ) | $ | (0.29 | ) | $ | (0.26 | ) | $ | (0.26 | ) | |||||
| Net increase (decrease) in net asset value | $ | (0.25 | ) | $ | (0.16 | ) | $ | (0.07 | ) | $ | 0.01 | $ | 0.06 | |||||||
Net asset value, end of period | $ | 6.34 | $ | 6.59 | $ | 6.75 | $ | 6.82 | $ | 6.81 | ||||||||||
| Total return (b) | 0.31 | % | 2.74 | % | 3.27 | % | 4.05 | % | 4.85 | % | ||||||||||
Ratio of net expenses to average net assets | 0.71 | % | 0.70 | % | 0.70 | % | 0.70 | % | 0.70 | % | ||||||||||
Ratio of net investment income (loss) to average net assets | 3.71 | % | 5.00 | % | 4.22 | % | 3.86 | % | 3.97 | % | ||||||||||
Portfolio turnover rate | 45 | % | 13 | % | 42 | % | 69 | % | 51 | % | ||||||||||
Net assets, end of period (in thousands) | $ | 205,324 | $ | 336,472 | $ | 713,216 | $ | 593,640 | $ | 453,152 | ||||||||||
Ratios with no waiver of fees and assumption of expenses by | ||||||||||||||||||||
| the Adviser and no reduction for fees paid indirectly: | ||||||||||||||||||||
| Total expenses to average net assets | 0.86 | % | 0.85 | % | 0.77 | % | 0.79 | % | 0.82 | % | ||||||||||
| Net investment income (loss) to average net assets | 3.56 | % | 4.85 | % | 4.15 | % | 3.77 | % | 3.85 | % | ||||||||||
* | The Fund was audited by an independent registered public accounting firm other than Ernst & Young LLP. |
(a) | The per-share data presented above is based on the average shares outstanding for the period presented. |
(b) | Assumes initial investment at net asset value at the beginning of each period, reinvestment of all distributions, the complete redemption of the investment at net asset value at the end of each period and no sales charges. Total return would be reduced if sales charges were taken into account. |
The accompanying notes are an integral part of these financial statements.
Pioneer Floating Rate Fund | Annual Report | 10/31/20 43
1. Organization and Significant Accounting Policies
Pioneer Floating Rate Fund (the “Fund”) is one of two portfolios comprising Pioneer Series Trust VI, a Delaware statutory trust. The Fund is registered under the Investment Company Act of 1940 as a diversified, open-end management investment company. The investment objective of the Fund is to produce a high level of current income.
The Fund offers three classes of shares designated as Class A, Class C and Class Y shares. Class K shares did not have assets or shareholders as of October 31, 2020. Each class of shares represents an interest in the same portfolio of investments of the Fund and has identical rights (based on relative net asset values) to assets and liquidation proceeds. Share classes can bear different rates of class-specific fees and expenses, such as transfer agent and distribution fees. Differences in class-specific fees and expenses will result in differences in net investment income and, therefore, the payment of different dividends from net investment income earned by each class. The Amended and Restated Declaration of Trust of the Fund gives the Board of Trustees the flexibility to specify either per-share voting or dollar-weighted voting when submitting matters for shareowner approval. Under per-share voting, each share of a class of the Fund is entitled to one vote. Under dollar-weighted voting, a shareowner’s voting power is determined not by the number of shares owned, but by the dollar value of the shares on the record date. Each share class has exclusive voting rights with respect to matters affecting only that class, including with respect to the distribution plan for that class. There is no distribution plan for Class Y shares.
Amundi Pioneer Asset Management, Inc., an indirect, wholly owned subsidiary of Amundi and Amundi’s wholly owned subsidiary, Amundi USA, Inc., serves as the Fund’s investment adviser (the “Adviser”). Amundi Pioneer Distributor, Inc., an affiliate of Amundi Pioneer Asset Management, Inc., serves as the Fund’s distributor (the “Distributor”).
During March 2017, the Financial Accounting Standards Board (FASB) issued an Accounting Standard Update, ASU 2017-08, Receivables-Nonrefundable Fees and Other Costs (Subtopic 310-20), Premium Amortization on Purchased Callable Debt Securities (“ASU 2017-08”), which shortens the amortization period for purchased non-contingently callable debt securities held at a premium. ASU 2017-08 specifies that the premium amortization period ends at the earliest call date, for certain purchased non-contingently callable debt securities. ASU 2017-08 is effective for fiscal years, and interim periods within those fiscal years, beginning after December 15, 2018. The
44 Pioneer Floating Rate Fund | Annual Report | 10/31/20
Fund has adopted ASU 2017-08 as of January 1, 2019. The implementation of ASU 2017-08 did not have a material impact on the Fund’s financial statements.
In March 2020, FASB issued an Accounting Standard Update, ASU 2020-04, Reference Rate Reform (Topic 848) -- Facilitation of the Effects of Reference Rate Reform on Financial Reporting (“ASU 2020-04”), which provides optional, temporary relief with respect to the financial reporting of contracts subject to certain types of modifications due to the planned discontinuation of the London Interbank Offered Rate (“LIBOR”) and other LIBOR-based reference rates at the end of 2021. The temporary relief provided by ASU 2020-04 is effective for certain reference rate-related contract modifications that occur during the period from March 12, 2020 through December 31, 2022. Management is evaluating the impact of ASU 2020-04 on the Fund’s investments, derivatives, debt and other contracts that will undergo reference rate-related modifications as a result of the reference rate reform.
The Fund is an investment company and follows investment company accounting and reporting guidance under U.S. GAAP. U.S. GAAP requires the management of the Fund to make estimates and assumptions that affect the reported amounts of assets and liabilities, the disclosure of contingent assets and liabilities at the date of the financial statements, and the reported amounts of income, expenses and gain or loss on investments during the reporting period. Actual results could differ from those estimates.
The following is a summary of significant accounting policies followed by the Fund in the preparation of its financial statements:
A. Security Valuation
The net asset value of the Fund is computed once daily, on each day the New York Stock Exchange (“NYSE”) is open, as of the close of regular trading on the NYSE.
Loan interests are valued in accordance with guidelines established by the Board of Trustees at the mean between the last available bid and asked prices from one or more brokers or dealers as obtained from Loan Pricing Corporation, an independent third party pricing service. If price information is not available from Loan Pricing Corporation, or if the price information is deemed to be unreliable, price information will be obtained from an alternative loan interest pricing service. If no reliable price quotes are available from either the primary or alternative pricing service, broker quotes will be solicited.
Pioneer Floating Rate Fund | Annual Report | 10/31/20 45
Fixed-income securities are valued by using prices supplied by independent pricing services, which consider such factors as market prices, market events, quotations from one or more brokers, Treasury spreads, yields, maturities and ratings, or may use a pricing matrix or other fair value methods or techniques to provide an estimated value of the security or instrument. A pricing matrix is a means of valuing a debt security on the basis of current market prices for other debt securities, historical trading patterns in the market for fixed-income securities and/or other factors. Non-U.S. debt securities that are listed on an exchange will be valued at the bid price obtained from an independent third party pricing service. When independent third party pricing services are unable to supply prices, or when prices or market quotations are considered to be unreliable, the value of that security may be determined using quotations from one or more broker-dealers.
Event-linked bonds or catastrophe bonds are valued at the bid price obtained from an independent third party pricing service. Other insurance-linked securities (including sidecars, collateralized reinsurance and industry loss warranties) may be valued at the bid price obtained from an independent pricing service, or through a third party using a pricing matrix, insurance industry valuation models, or other fair value methods or techniques to provide an estimated value of the instrument.
Equity securities that have traded on an exchange are valued by using the last sale price on the principal exchange where they are traded. Equity securities that have not traded on the date of valuation, or securities for which sale prices are not available, generally are valued using the mean between the last bid and asked prices or, if both last bid and asked prices are not available, at the last quoted bid price. Last sale and bid and asked prices are provided by independent third party pricing services. In the case of equity securities not traded on an exchange, prices are typically determined by independent third party pricing services using a variety of techniques and methods.
The value of foreign securities is translated into U.S. dollars based on foreign currency exchange rate quotations supplied by a third party pricing source. Trading in non-U.S. equity securities is substantially completed each day at various times prior to the close of the NYSE. The values of such securities used in computing the net asset value of the Fund’s shares are determined as of such times. The Fund may use a fair value model developed by an independent pricing service to value non-U.S. equity securities.
46 Pioneer Floating Rate Fund | Annual Report | 10/31/20
Forward foreign currency exchange contracts are valued daily using the foreign exchange rate or, for longer term forward contract positions, the spot currency rate and the forward points on a daily basis, in each case provided by a third party pricing service. Contracts whose forward settlement date falls between two quoted days are valued by interpolation.
Swap contracts, including interest rate swaps, caps and floors (other than centrally cleared swap contracts), are valued at the dealer quotations obtained from reputable International Swap Dealers Association members. Centrally cleared swaps are valued at the daily settlement price provided by the central clearing counterparty.
Shares of open-end registered investment companies (including money market mutual funds) are valued at such funds’ net asset value. Shares of exchange-listed closed-end funds are valued by using the last sale price on the principal exchange where they are traded.
Repurchase agreements are valued at par. Cash may include overnight time deposits at approved financial institutions.
Securities or loan interests for which independent pricing services or broker-dealers are unable to supply prices or for which market prices and/or quotations are not readily available or are considered to be unreliable are valued by a fair valuation team comprised of certain personnel of the Adviser pursuant to procedures adopted by the Fund’s Board of Trustees. The Adviser’s fair valuation team uses fair value methods approved by the Valuation Committee of the Board of Trustees. The Adviser’s fair valuation team is responsible for monitoring developments that may impact fair valued securities and for discussing and assessing fair values on an ongoing basis, and at least quarterly, with the Valuation Committee of the Board of Trustees.
Inputs used when applying fair value methods to value a security may include credit ratings, the financial condition of the company, current market conditions and comparable securities. The Fund may use fair value methods if it is determined that a significant event has occurred after the close of the exchange or market on which the security trades and prior to the determination of the Fund’s net asset value. Examples of a significant event might include political or economic news, corporate restructurings, natural disasters, terrorist activity or trading halts. Thus, the valuation of the Fund’s securities may differ significantly from exchange prices, and such differences could be material.
Pioneer Floating Rate Fund | Annual Report | 10/31/20 47
At October 31, 2020, one security was valued using fair value methods (in addition to securities valued using prices supplied by independent pricing services, broker-dealers or using a third party insurance pricing model) representing 0.02% of net assets. The value of this fair valued security was $72,171.
B. Investment Income and Transactions
Dividend income is recorded on the ex-dividend date, except that certain dividends from foreign securities where the ex-dividend date may have passed are recorded as soon as the Fund becomes aware of the ex-dividend data in the exercise of reasonable diligence.
Interest income, including interest on income-bearing cash accounts, is recorded on the accrual basis. Dividend and interest income are reported net of unrecoverable foreign taxes withheld at the applicable country rates and net of income accrued on defaulted securities.
Interest and dividend income payable by delivery of additional shares is reclassified as PIK (payment-in-kind) income upon receipt and is included in interest and dividend income, respectively.
Principal amounts of mortgage-backed securities are adjusted for monthly paydowns. Premiums and discounts related to certain mortgage-backed securities are amortized or accreted in proportion to the monthly paydowns. All discounts/premiums on purchase prices of debt securities are accreted/amortized for financial reporting purposes over the life of the respective securities, and such accretion/amortization is included in interest income.
Security transactions are recorded as of trade date. Gains and losses on sales of investments are calculated on the identified cost method for both financial reporting and federal income tax purposes.
C. Foreign Currency Translation
The books and records of the Fund are maintained in U.S. dollars. Amounts denominated in foreign currencies are translated into U.S. dollars using current exchange rates.
Net realized gains and losses on foreign currency transactions, if any, represent, among other things, the net realized gains and losses on foreign currency contracts, disposition of foreign currencies and the difference between the amount of income accrued and the U.S. dollars actually received. Further, the effects of changes in foreign currency exchange rates on investments are not segregated on the Statement of Operations from the effects of changes in the market prices of those securities, but are included with the net realized and unrealized gain or loss on investments.
48 Pioneer Floating Rate Fund | Annual Report | 10/31/20
D. Federal Income Taxes
It is the Fund’s policy to comply with the requirements of the Internal Revenue Code applicable to regulated investment companies and to distribute all of its net taxable income and net realized capital gains, if any, to its shareowners. Therefore, no provision for federal income taxes is required. As of October 31, 2020, the Fund did not accrue any interest or penalties with respect to uncertain tax positions, which, if applicable, would be recorded as an income tax expense on the Statement of Operations. Tax returns filed within the prior three years remain subject to examination by federal and state tax authorities.
The amount and character of income and capital gain distributions to shareowners are determined in accordance with federal income tax rules, which may differ from U.S. GAAP. Distributions in excess of net investment income or net realized gains are temporary over distributions for financial statement purposes resulting from differences in the recognition or classification of income or distributions for financial statement and tax purposes. Capital accounts within the financial statements are adjusted for permanent book/tax differences to reflect tax character, but are not adjusted for temporary differences.
At October 31, 2020, the Fund was permitted to carry forward indefinitely $9,721,307 of short-term and $46,981,218 of long-term losses.
The tax character of distributions paid during the years ended October 31, 2020 and October 31, 2019, were as follows:
| 2020 | 2019 | |
| Distributions paid from: | ||
Ordinary income | $15,428,078 | $33,613,526 |
| Total | $15,428,078 | $33,613,526 |
The following shows the components of distributable earnings (losses) on a federal income tax basis at October 31, 2020:
| 2020 | |
| Distributable earnings/(losses): | |
Undistributed ordinary income | $ 908,283 |
Capital loss carryforward | (56,702,525) |
Dividend payable | (156,125) |
Net unrealized depreciation | (12,281,530) |
| Total | $(68,231,897) |
Pioneer Floating Rate Fund | Annual Report | 10/31/20 49
The difference between book basis and tax basis unrealized depreciation is attributable to the tax deferral of losses on wash sales, the mark to market of swap contracts, the tax treatment of premium and amortization, adjustments relating to Insurance-Linked Securities, the tax adjustments relating to credit default swaps, preferred stocks and other holdings.
E. Fund Shares
The Fund records sales and repurchases of its shares as of trade date. The Distributor earned $4,660 in underwriting commissions on the sale of Class A shares during the year ended October 31, 2020.
F. Class Allocations
Income, common expenses and realized and unrealized gains and losses are calculated at the Fund level and allocated daily to each class of shares based on its respective percentage of adjusted net assets at the beginning of the day.
Distribution fees are calculated based on the average daily net asset value attributable to Class A and Class C shares of the Fund, respectively (see Note 4). Class Y shares do not pay distribution fees. All expenses and fees paid to the Fund’s transfer agent for its services are allocated among the classes of shares based on the number of accounts in each class and the ratable allocation of related out-of-pocket expenses (see Note 3).
The Fund declares as daily dividends substantially all of its net investment income. All dividends are paid on a monthly basis. Short-term capital gain distributions, if any, may be declared with the daily dividends. Distributions to shareowners are recorded as of the ex-dividend date. Distributions paid by the Fund with respect to each class of shares are calculated in the same manner and at the same time, except that net investment income dividends to Class A, Class C and Class Y shares can reflect different transfer agent and distribution expense rates.
G. Risks
The value of securities held by the Fund may go up or down, sometimes rapidly or unpredictably, due to general market conditions, such as real or perceived adverse economic, political or regulatory conditions, recessions, the spread of infectious illness or other public health issues, inflation, changes in interest rates, lack of liquidity in the bond markets or adverse investor sentiment. In the past several years, financial markets have experienced increased volatility, depressed valuations, decreased liquidity and heightened uncertainty. These conditions may continue, recur, worsen or spread. A general rise in interest rates could adversely affect the price and liquidity of fixed-income securities and could also result in increased redemptions from the Fund.
50 Pioneer Floating Rate Fund | Annual Report | 10/31/20
At times, the Fund’s investments may represent industries or industry sectors that are interrelated or have common risks, making the Fund more susceptible to any economic, political, or regulatory developments or other risks affecting those industries and sectors. The Fund’s investments in foreign markets and countries with limited developing markets may subject the Fund to a greater degree of risk than investments in a developed market. These risks include disruptive political or economic conditions and the imposition of adverse governmental laws or currency exchange restrictions.
The Fund invests in below-investment-grade (high-yield) debt securities and preferred stocks. Some of these high-yield securities may be convertible into equity securities of the issuer. Debt securities rated below-investment-grade are commonly referred to as “junk bonds” and are considered speculative. These securities involve greater risk of loss, are subject to greater price volatility, and are less liquid, especially during periods of economic uncertainty or change, than higher rated debt securities.
Certain instruments held by the Fund pay an interest rate based on the London Interbank Offered Rate (“LIBOR”), which is the average offered rate for various maturities of short-term loans between certain major international banks. LIBOR is expected to be phased out by the end of 2021. While the effect of the phaseout cannot yet be determined, it may result in, among other things, increased volatility or illiquidity in markets for instruments based on LIBOR and changes in the value of such instruments.
With the increased use of technologies such as the Internet to conduct business, the Fund is susceptible to operational, information security and related risks. While the Fund’s Adviser has established business continuity plans in the event of, and risk management systems to prevent, limit or mitigate, such cyber-attacks, there are inherent limitations in such plans and systems, including the possibility that certain risks have not been identified. Furthermore, the Fund cannot control the cybersecurity plans and systems put in place by service providers to the Fund such as Brown Brothers Harriman & Co., the Fund’s custodian and accounting agent, and DST Asset Manager Solutions, Inc., the Fund’s transfer agent. In addition, many beneficial owners of Fund shares hold them through accounts at broker-dealers, retirement platforms and other financial market participants over which neither the Fund nor Amundi exercises control. Each of these may in turn rely on service providers to them, which are also subject to the risk of cyber-attacks. Cybersecurity failures or breaches at Amundi or the Fund’s service providers or intermediaries have the ability to cause disruptions and impact business operations, potentially resulting in financial losses, interference with the Fund’s ability to calculate its net
Pioneer Floating Rate Fund | Annual Report | 10/31/20 51
asset value, impediments to trading, the inability of Fund shareowners to effect share purchases, redemptions or exchanges or receive distributions, loss of or unauthorized access to private shareowner information and violations of applicable privacy and other laws, regulatory fines, penalties, reputational damage, or additional compliance costs. Such costs and losses may not be covered under any insurance. In addition, maintaining vigilance against cyber-attacks may involve substantial costs over time, and system enhancements may themselves be subject to cyber-attacks.
COVID-19
The respiratory illness COVID-19 caused by a novel coronavirus has resulted in a global pandemic and major disruption to economies and markets around the world, including the United States. Global financial markets have experienced extreme volatility and severe losses, and trading in many instruments has been disrupted. Liquidity for many instruments has been greatly reduced for periods of time. Some interest rates are very low and in some cases yields are negative. Some sectors of the economy and individual issuers have experienced particularly large losses. These circumstances may continue for an extended period of time, and may continue to affect adversely the value and liquidity of the Fund’s investments. The ultimate economic fallout from the pandemic, and the long-term impact on economies, markets, industries and individual issuers, are not known. Governments and central banks, including the Federal Reserve in the U.S., have taken extraordinary and unprecedented actions to support local and global economies and the financial markets. These actions have resulted in significant expansion of public debt, including in the U.S. The impact of these measures, and whether they will be effective to mitigate the economic and market disruption, will not be known for some time. The consequences of high public debt, including its future impact on the economy and securities markets, likewise may not be known for some time.
The Fund’s prospectus contains unaudited information regarding the Fund’s principal risks. Please refer to that document when considering the Fund’s principal risks.
H. Repurchase Agreements
Repurchase agreements are arrangements under which the Fund purchases securities from a broker-dealer or a bank, called the counterparty, upon the agreement of the counterparty to repurchase the securities from the Fund at a later date, and at a specific price, which is typically higher than the purchase price paid by the Fund. The securities purchased serve as the Fund’s collateral for the obligation of the counterparty to repurchase the securities. The value of the collateral, including accrued interest, is required
52 Pioneer Floating Rate Fund | Annual Report | 10/31/20
to be equal to or in excess of the repurchase price. The collateral for all repurchase agreements is held in safekeeping in the customer-only account of the Fund’s custodian or a sub-custodian of the Fund. The Adviser is responsible for determining that the value of the collateral remains at least equal to the repurchase price. In the event of a default by the counterparty, the Fund is entitled to sell the securities, but the Fund may not be able to sell them for the price at which they were purchased, thus causing a loss to the Fund. Additionally, if the counterparty becomes insolvent, there is some risk that the Fund will not have a right to the securities, or the immediate right to sell the securities.
As of and for the year ended October 31, 2020, the Fund had no open repurchase agreements.
I. Restricted Securities
Restricted Securities are subject to legal or contractual restrictions on resale. Restricted securities generally are resold in transactions exempt from registration under the Securities Act of 1933. Private placement securities are generally considered to be restricted except for those securities traded between qualified institutional investors under the provisions of Rule 144A of the Securities Act of 1933.
Disposal of restricted investments may involve negotiations and expenses, and prompt sale at an acceptable price may be difficult to achieve. Restricted investments held by the Funds at October 31, 2020 are listed in the Schedule of Investments.
J. Insurance-Linked Securities (“ILS”)
The Fund invests in ILS. The Fund could lose a portion or all of the principal it has invested in an ILS, and the right to additional interest or dividend payments with respect to the security, upon the occurrence of one or more trigger events, as defined within the terms of an insurance-linked security. Trigger events, generally, are hurricanes, earthquakes, or other natural events of a specific size or magnitude that occur in a designated geographic region during a specified time period, and/or that involve losses or other metrics that exceed a specific amount. There is no way to accurately predict whether a trigger event will occur, and accordingly, ILS carry significant risk. The Fund is entitled to receive principal, and interest and/or dividend payments so long as no trigger event occurs of the description and magnitude specified by the instrument. In addition to the specified trigger events, ILS may expose the Fund to other risks, including but not limited to issuer (credit) default, adverse regulatory or jurisdictional interpretations and adverse tax consequences.
Pioneer Floating Rate Fund | Annual Report | 10/31/20 53
The Fund’s investments in ILS may include event-linked bonds. ILS also may include special purpose vehicles (“SPVs”) or similar instruments structured to comprise a portion of a reinsurer’s catastrophe-oriented business, known as quota share instruments (sometimes referred to as reinsurance sidecars), or to provide reinsurance relating to specific risks to insurance or reinsurance companies through a collateralized instrument, known as collateralized reinsurance. Structured reinsurance investments also may include industry loss warranties (“ILWs”). A traditional ILW takes the form of a bilateral reinsurance contract, but there are also products that take the form of derivatives, collateralized structures, or exchange-traded instruments.
Where the ILS are based on the performance of underlying reinsurance contracts, the Fund has limited transparency into the individual underlying contracts, and therefore must rely upon the risk assessment and sound underwriting practices of the issuer. Accordingly, it may be more difficult for the Adviser to fully evaluate the underlying risk profile of the Fund’s structured reinsurance investments, and therefore the Fund’s assets are placed at greater risk of loss than if the Adviser had more complete information. Structured reinsurance instruments generally will be considered illiquid securities by the Fund. These securities may be difficult to purchase, sell or unwind. Illiquid securities also may be difficult to value. If the Fund is forced to sell an illiquid asset, the Fund may be forced to sell at a loss.
K. Credit Default Swap Contracts
A credit default swap is a contract between a buyer of protection and a seller of protection against a pre-defined credit event or an underlying reference obligation, which may be a single security or a basket or index of securities. The Fund may buy or sell credit default swap contracts to seek to increase the Fund’s income, or to attempt to hedge the risk of default on portfolio securities. A credit default swap index is used to hedge risk or take a position on a basket of credit entities or indices.
As a seller of protection, the Fund would be required to pay the notional (or other agreed-upon) value of the referenced debt obligation to the counterparty in the event of a default by a U.S. or foreign corporate issuer of a debt obligation, which would likely result in a loss to the Fund. In return, the Fund would receive from the counterparty a periodic stream of payments during the term of the contract, provided that no event of default occurred. The maximum exposure of loss to the seller would be the notional value of the credit default swaps outstanding. If no default occurs, the Fund would keep the stream of payments and would have no payment obligation. The Fund may also buy credit default swap contracts in order to hedge against the risk of default of debt securities, in which case the Fund would function as the counterparty referenced above.
54 Pioneer Floating Rate Fund | Annual Report | 10/31/20
As a buyer of protection, the Fund makes an upfront or periodic payment to the protection seller in exchange for the right to receive a contingent payment. An upfront payment made by the Fund, as the protection buyer, is recorded within the “Swap contracts, at value” line item on the Statement of Assets and Liabilities. Periodic payments received or paid by the Fund are recorded as realized gains or losses on the Statement of Operations.
Credit default swap contracts are marked-to-market daily using valuations supplied by independent sources, and the change in value, if any, is recorded within the “Swap contracts, at value” line item on the Statement of Assets and Liabilities. Payments received or made as a result of a credit event or upon termination of the contract are recognized, net of the appropriate amount of the upfront payment, as realized gains or losses on the Statement of Operations.
Credit default swap contracts involving the sale of protection may involve greater risks than if the Fund had invested in the referenced debt instrument directly. Credit default swap contracts are subject to general market risk, liquidity risk, counterparty risk and credit risk. If the Fund is a protection buyer and no credit event occurs, it will lose its investment. If the Fund is a protection seller and a credit event occurs, the value of the referenced debt instrument received by the Fund, together with the periodic payments received, may be less than the amount the Fund pays to the protection buyer, resulting in a loss to the Fund. In addition, obligations under sell protection credit default swaps may be partially offset by net amounts received from settlement of buy protection credit default swaps entered into by the Fund for the same reference obligation with the same counterparty.
Certain swap contracts that are cleared through a central clearinghouse are referred to as centrally cleared swaps. All payments made or received by the Fund are pursuant to a centrally cleared swap contract with the central clearing party rather than the original counterparty. Upon entering into a centrally cleared swap contract, the Fund is required to make an initial margin deposit, either in cash or in securities. The daily change in value on open centrally cleared contracts is recorded as “Variation margin for centrally cleared swap contracts” on the Statement of Assets and Liabilities. Cash received from or paid to the broker related to previous margin movement is held in a segregated account at the broker and is recorded as either “Due from broker for swaps” or “Due to broker for swaps” on the Statement of Assets and Liabilities. The amount of cash deposited with a broker as collateral at October 31, 2020, is recorded as “Swaps collateral” on the Statement of Assets and Liabilities.
Pioneer Floating Rate Fund | Annual Report | 10/31/20 55
The average market value of credit default swap contracts open during the year ended October 31, 2020, was $493,577. Open credit default swap contracts at October 31, 2020, are listed in the Schedule of Investments.
2. Management Agreement
The Adviser manages the Fund’s portfolio. Effective October 1, 2018, management fees are calculated daily and paid monthly at the annual rate of 0.60% of the Fund’s average daily net assets up to $500 million, 0.55% of the next $1.5 billion of the Fund’s average daily net assets, and 0.50% of the Fund’s average daily net assets over $2 billion. For the year ended October 31, 2020, the effective management fee (excluding waivers and/or assumption of expenses) was equivalent to 0.60% of the Fund’s average daily net assets.
Prior to March 10, 2020, the Adviser has contractually agreed to limit ordinary operating expenses (ordinary operating expenses means all Fund expenses other than taxes, brokerage commissions, acquired Fund fees and expenses and extraordinary expenses, such as litigation) to the extent required to reduce Fund expenses to 0.70% of the average daily net assets attributable to Class Y shares. Effective March 10, 2020, the Adviser has contractually agreed to limit ordinary operating expenses to the extent required to reduce fund expenses to 0.75% of the average daily net assets attributable to Class Y shares. Effective October 1, 2020, the Adviser has contractually agreed to limit ordinary operating expenses to the extent required to reduce fund expenses to 1.05% of the average daily net assets attributable to Class A shares. These expense limitations are in effect through March 1, 2022. There can be no assurance that the Adviser will extend the expense limitation agreement beyond the date referred to above.
Fees waived and expenses reimbursed during the year ended October 31, 2020, are reflected on the Statement of Operations. In addition, under the management and administration agreements, certain other services and costs, including accounting, regulatory reporting and insurance premiums, are paid by the Fund as administrative reimbursements. Included in “Due to affiliates” reflected on the Statement of Assets and Liabilities is $25,259 in management fees, administrative costs and certain other reimbursements payable to the Adviser at October 31, 2020.
3. Transfer Agent
DST Asset Manager Solutions, Inc. serves as the transfer agent to the Fund at negotiated rates. Transfer agent fees and payables shown on the Statement of Operations and the Statement of Assets and Liabilities, respectively, include sub-transfer agent expenses incurred through the Fund’s omnibus relationship contracts.
56 Pioneer Floating Rate Fund | Annual Report | 10/31/20
In addition, the Fund reimbursed the transfer agent for out-of-pocket expenses incurred by the transfer agent related to shareowner communications activities such as proxy and statement mailings, and outgoing phone calls. For the year ended October 31, 2020, such out-of-pocket expenses by class of shares were as follows:
| Shareowner Communications | |
Class A | $ 7,958 |
Class C | 4,479 |
Class Y | 28,755 |
| Total | $41,192 |
4. Distribution and Service Plan
The Fund has adopted a distribution plan (the “Plan”) pursuant to Rule 12b-1 of the Investment Company Act of 1940 with respect to its Class A and Class C shares. Pursuant to the Plan, the Fund pays the Distributor 0.25% of the average daily net assets attributable to Class A shares as compensation for personal services and/or account maintenance services or distribution services with regard to Class A shares. Pursuant to the Plan, the Fund also pays the Distributor 1.00% of the average daily net assets attributable to Class C shares. The fee for Class C shares consists of a 0.25% service fee and a 0.75% distribution fee paid as compensation for personal services and/or account maintenance services or distribution services with regard to Class C shares. Included in “Due to affiliates” reflected on the Statement of Assets and Liabilities is $4,223 in distribution fees payable to the Distributor at October 31, 2020.
In addition, redemptions of Class A and Class C shares may be subject to a contingent deferred sales charge (“CDSC”). A CDSC of 1.00% may be imposed on redemptions of certain net asset value purchases of Class A shares within 12 months of purchase. Redemptions of Class C shares within 12 months of purchase are subject to a CDSC of 1.00%, based on the lower of cost or market value of shares being redeemed. Shares purchased as part of an exchange remain subject to any CDSC that applied to the original purchase of those shares. There is no CDSC for Class Y shares. Proceeds from the CDSCs are paid to the Distributor. For the year ended October 31, 2020, CDSCs in the amount of $5,517 were paid to the Distributor.
5. Line of Credit Facility
The Fund, along with certain other funds in the Pioneer Family of Funds (the “Funds”), participates in a committed, unsecured revolving line of credit facility. Borrowings are used solely for temporary or emergency purposes. The Fund may borrow up to the lesser of the amount available under the facility or the limits set for borrowing by the Fund’s prospectus
Pioneer Floating Rate Fund | Annual Report | 10/31/20 57
and the 1940 Act. Effective March 11, 2020, the Fund participates in a facility in the amount of $300 million. Prior to March 11, 2020, the Fund participated in a facility in the amount of $250 million. Under such facility, depending on the type of loan, interest on borrowings is payable at the London Interbank Offered Rate (“LIBOR”) plus a credit spread. The Funds also pay an annual commitment fee in the amount of 0.30% of the daily unused portion of each lender’s commitment to participate in the credit facility. The commitment fee is allocated among participating funds based on an allocation schedule set forth in the credit agreement.
For the year ended October 31, 2020, the average daily amount of borrowings outstanding during the period was as follows:
| Weighted average | Total interest | ||
| Average daily amount | annualized interest | Number of days | expense on |
| of borrowings | rate for the period | outstanding | borrowings* |
$7,411,111 | 1.00% | 9 | $1,892 |
* Interest expense is located on the Statement of Operations.
6. Additional Disclosures about Derivative Instruments and Hedging Activities
The Fund’s use of derivatives may enhance or mitigate the Fund’s exposure to the following risks:
Interest rate risk relates to the fluctuations in the value of interest-bearing securities due to changes in the prevailing levels of market interest rates.
Credit risk relates to the ability of the issuer of a financial instrument to make further principal or interest payments on an obligation or commitment that it has to the Fund.
Foreign exchange rate risk relates to fluctuations in the value of an asset or liability due to changes in currency exchange rates.
Equity risk relates to the fluctuations in the value of financial instruments as a result of changes in market prices (other than those arising from interest rate risk or foreign exchange rate risk), whether caused by factors specific to an individual investment, its issuer, or all factors affecting all instruments traded in a market or market segment.
Commodity risk relates to the risk that the value of a commodity or commodity index will fluctuate based on increases or decreases in the commodities market and factors specific to a particular industry or commodity.
58 Pioneer Floating Rate Fund | Annual Report | 10/31/20
The fair value of open derivative instruments (not considered to be hedging instruments for accounting disclosure purposes) by risk exposure at October 31, 2020, was as follows:
The effect of derivative instruments (not considered to be hedging instruments for accounting disclosure purposes) on the Statement of Operations by risk exposure at October 31, 2020, was as follows:
| Statement of Assets and Liabilities | |||||
| Foreign | |||||
| Interest | Credit | Exchange | Equity | Commodity | |
| Rate Risk | Risk | Rate Risk | Risk | Risk | |
| Assets | |||||
| Swap contracts, | |||||
| at value | $ — | $218,953 | $ — | $ — | $ — |
| Total Value | $ — | $218,953 | $ — | $ — | $ — |
The effect of derivative instruments (not considered to be hedging instruments for accounting disclosure purposes) on the Statement of Operations by risk exposure at October 31, 2020, was as follows:
| Statement of Operations | |||||
| Foreign | |||||
| Interest | Credit | Exchange | Equity | Commodity | |
| Rate Risk | Risk | Rate Risk | Risk | Risk | |
| Net realized gain | |||||
| (loss) on: | |||||
| Swap contracts | $ — | $(2,481,707) | $ — | $ — | $ — |
| Total Value | $ — | $(2,481,707) | $ — | $ — | $ — |
| Change in net | |||||
| unrealized | |||||
| appreciation | |||||
| (depreciation) on: | |||||
| Swap contracts | $ — | $ (41,613) | $ — | $ — | $ — |
| Total Value | $ — | $ (41,613) | $ — | $ — | $ — |
7. Unfunded Loan Commitments
The Fund may enter into unfunded loan commitments. Unfunded loan commitments may be partially or wholly unfunded. During the contractual period, the Fund is obliged to provide funding to the borrower upon demand. A fee is earned by the Fund on the unfunded loan commitment and is recorded as interest income on the Statement of Operations. Unfunded loan commitments are fair valued in accordance with the valuation policy described in Footnote 1A and unrealized appreciation or depreciation, if any, is recorded on the Statement of Assets and Liabilities.
Pioneer Floating Rate Fund | Annual Report | 10/31/20 59
As of October 31, 2020, the Fund had the following unfunded loan commitments outstanding:
| Unrealized | ||||
| Appreciation/ | ||||
| Loan | Principal | Cost | Value | (Depreciation) |
Grupo Aeromexico, Sociedad | ||||
| Anonima Bursatil De Capital | ||||
| Variable, Senior Secured | ||||
| Tranche 1 | $ 487,500 | $ 482,938 | $ 482,625 | $ (313) |
Highline Aftermarket | ||||
| Acquisition LLC | 357,143 | 347,322 | 349,554 | 2,232 |
Service Logic Acquisition, Inc. | 167,910 | 166,231 | 167,280 | 1,049 |
Spectacle Gary Holdings LLC | 101,351 | 95,838 | 96,093 | 255 |
| Total Value | $1,113,904 | $1,092,329 | $1,095,552 | $3,223 |
8. Subsequent Event
On November 19, 2020, Amundi Pioneer Asset Management announced it will be rebranding the US business of Amundi as Amundi US effective January 1, 2021. The new brand identity will replace Amundi Pioneer, which was first adopted in July 2017 following the acquisition of Pioneer Investments by Amundi. In connection with these changes, Amundi Pioneer Asset Management. Inc., the investment adviser to the Pioneer funds, will change its name to Amundi Asset Management US, Inc. In addition, Amundi Pioneer Distributor, Inc., the Pioneer funds’ distributor, will change its name to Amundi Distributor US, Inc. The names of the Pioneer funds will not change in connection with this rebranding.
60 Pioneer Floating Rate Fund | Annual Report | 10/31/20
To the Board of Trustees of Pioneer Series Trust VI and the Shareowners of Pioneer Floating Rate Fund:
Opinion on the Financial Statements
We have audited the accompanying statement of assets and liabilities of Pioneer Floating Rate Fund (the “Fund”) (one of the funds constituting Pioneer Series Trust VI (the “Trust”)), including the schedule of investments, as of October 31, 2020, and the related statement of operations for the year then ended, the statements of changes in net assets for each of the two years in the period then ended, the financial highlights for each of the four years in the period then ended and the related notes (collectively referred to as the “financial statements”). The financial highlights for the period ended October 31, 2016 were audited by another independent registered public accounting firm whose report, dated December 23, 2016, expressed an unqualified opinion on those financial highlights. In our opinion, the financial statements present fairly, in all material respects, the financial position of the Fund (one of the funds constituting Pioneer Series Trust VI) at October 31, 2020, the results of its operations for the year then ended, the changes in its net assets for each of the two years in the period then ended, and its financial highlights for each of the four years in the period then ended, in conformity with U.S. generally accepted accounting principles.
Basis for Opinion
These financial statements are the responsibility of the Trust’s management. Our responsibility is to express an opinion on the Fund’s financial statements based on our audits. We are a public accounting firm registered with the Public Company Accounting Oversight Board (United States) (“PCAOB”) and are required to be independent with respect to the Trust in accordance with the U.S. federal securities laws and the applicable rules and regulations of the Securities and Exchange Commission and the PCAOB.
We conducted our audits in accordance with the standards of the PCAOB. Those standards require that we plan and perform the audit to obtain reasonable assurance about whether the financial statements are free of material misstatement, whether due to error or fraud. The Trust is not required to have, nor were we engaged to perform, an audit of the Trust’s internal control over financial reporting. As part of our audits, we are required to obtain an understanding of internal control over financial reporting, but not for the purpose of expressing an opinion on the effectiveness of the Trust’s internal control over financial reporting. Accordingly, we express no such opinion.
Pioneer Floating Rate Fund | Annual Report | 10/31/20 61
Our audits included performing procedures to assess the risks of material misstatement of the financial statements, whether due to error or fraud, and performing procedures that respond to those risks. Such procedures included examining, on a test basis, evidence regarding the amounts and disclosures in the financial statements. Our procedures included confirmation of securities owned as of October 31, 2020, by correspondence with the custodian and brokers or by other appropriate auditing procedures where replies from brokers were not received. Our audits also included evaluating the accounting principles used and significant estimates made by management, as well as evaluating the overall presentation of the financial statements. We believe that our audits provide a reasonable basis for our opinion.

We have served as the auditor of one or more Amundi Pioneer investment companies since 2017.
Boston, Massachusetts
December 18, 2020
December 18, 2020
62 Pioneer Floating Rate Fund | Annual Report | 10/31/20
Qualified interest income is exempt from nonresident alien (NRA) tax withholding. The percentage of the Fund’s ordinary income distributions derived from qualified interest income was 95.58%.
Pioneer Floating Rate Fund | Annual Report | 10/31/20 63
As required by law, the Fund has adopted and implemented a liquidity risk management program (the “Program”) that is designed to assess and manage liquidity risk. Liquidity risk is the risk that the Fund could not meet requests to redeem its shares without significant dilution of remaining investors’ interests in the Fund. The Fund’s Board of Trustees designated a liquidity risk management committee (the “Committee”) consisting of employees of Amundi Pioneer Asset Management, Inc. (the “Adviser”) to administer the Program.
The Committee provided the Board of Trustees with a report that addressed the operation of the Program and assessed its adequacy and effectiveness of implementation (the “Report”). The Report covered the period from December 1, 2018 through March 31, 2020 (the “Reporting Period”).
The Report confirmed that, throughout the Reporting Period, the Committee had monitored the Fund’s portfolio liquidity and liquidity risk on an ongoing basis, as described in the Program and in Board reporting throughout the Reporting Period.
The Report discussed the Committee’s annual review of the Program, which addressed, among other things, the following elements of the Program:
The Committee reviewed the Fund’s investment strategy and liquidity of portfolio investments during both normal and reasonably foreseeable stressed conditions. The Committee noted that the Fund’s investment strategy continues to be appropriate for an open-end fund, taking into account, among other things, whether and to what extent the Fund held less liquid and illiquid assets and the extent to which any such investments affected the Fund’s ability to meet redemption requests. In managing and reviewing the Fund’s liquidity risk, the Committee also considered the extent to which the Fund’s investment strategy involves a relatively concentrated portfolio or large positions in particular issuers, the extent to which the Fund uses borrowing for investment purposes, and the extent to which the Fund uses derivatives (including for hedging purposes). The Committee also reviewed the Fund’s short-term and long-term cash flow projections during both normal and reasonably foreseeable stressed conditions. In assessing the Fund’s cash flow projections, the Committee considered, among other factors, historical net redemption activity, redemption policies, ownership concentration, distribution channels, and the degree of certainty associated with the Fund’s short-term and long-term cash flow projections. The Committee also considered the Fund’s
64 Pioneer Floating Rate Fund | Annual Report | 10/31/20
holdings of cash and cash equivalents, as well as borrowing arrangements and other funding sources, including, if applicable, the Fund’s participation in a credit facility, as components of the Fund’s ability to meet redemption requests. The Fund has adopted an in-kind redemption policy which may be utilized to meet larger redemption requests.
The Committee reviewed the Program’s liquidity classification methodology for categorizing the Fund’s investments into one of four liquidity buckets. In reviewing the Fund’s investments, the Committee considered, among other factors, whether trading varying portions of a position in a particular portfolio investment or asset class in sizes the Fund would reasonably anticipate trading, would be reasonably expected to significantly affect liquidity.
The Committee performed an analysis to determine whether the Fund is required to maintain a Highly Liquid Investment Minimum, and determined that no such minimum is required because the Fund primarily holds highly liquid investments.
The Report stated that the Committee concluded the Program operates adequately and effectively, in all material respects, to assess and manage the Fund’s liquidity risk throughout the Reporting Period.
Pioneer Floating Rate Fund | Annual Report | 10/31/20 65
Amundi Pioneer Asset Management, Inc. (“APAM”) serves as the investment adviser to Pioneer Floating Rate Fund (the “Fund”) pursuant to an investment management agreement between APAM and the Fund. In order for APAM to remain the investment adviser of the Fund, the Trustees of the Fund must determine annually whether to renew the investment management agreement for the Fund.
The contract review process began in January 2020 as the Trustees of the Fund agreed on, among other things, an overall approach and timeline for the process. Contract review materials were provided to the Trustees in March 2020, July 2020 and September 2020. In addition, the Trustees reviewed and discussed the Fund’s performance at regularly scheduled meetings throughout the year, and took into account other information related to the Fund provided to the Trustees at regularly scheduled meetings, in connection with the review of the Fund’s investment management agreement.
In March 2020, the Trustees, among other things, discussed the memorandum provided by Fund counsel that summarized the legal standards and other considerations that are relevant to the Trustees in their deliberations regarding the renewal of the investment management agreement, and reviewed and discussed the qualifications of the investment management teams for the Fund, as well as the level of investment by the Fund’s portfolio managers in the Fund. In July 2020, the Trustees, among other things, reviewed the Fund’s management fees and total expense ratios, the financial statements of APAM and its parent companies, profitability analyses provided by APAM, and analyses from APAM as to possible economies of scale. The Trustees also reviewed the profitability of the institutional business of APAM and APAM’s affiliate, Amundi Pioneer Institutional Asset Management, Inc. (“APIAM” and, together with APAM, “Amundi Pioneer”), as compared to that of APAM’s fund management business, and considered the differences between the fees and expenses of the Fund and the fees and expenses of APAM’s and APIAM’s institutional accounts, as well as the different services provided by APAM to the Fund and by APAM and APIAM to the institutional accounts. The Trustees further considered contract review materials, including additional materials received in response to the Trustees’ request, in September 2020.
66 Pioneer Floating Rate Fund | Annual Report | 10/31/20
At a meeting held on September 15, 2020, based on their evaluation of the information provided by APAM and third parties, the Trustees of the Fund, including the Independent Trustees voting separately, unanimously approved the renewal of the investment management agreement for another year. In approving the renewal of the investment management agreement, the Trustees considered various factors that they determined were relevant, including the factors described below. The Trustees did not identify any single factor as the controlling factor in determining to approve the renewal of the agreement.
Nature, Extent and Quality of Services
The Trustees considered the nature, extent and quality of the services that had been provided by APAM to the Fund, taking into account the investment objective and strategy of the Fund. The Trustees also reviewed APAM’s investment approach for the Fund and its research process. The Trustees considered the resources of APAM and the personnel of APAM who provide investment management services to the Fund. They also reviewed the amount of non-Fund assets managed by the portfolio managers of the Fund. They considered the non-investment resources and personnel of APAM that are involved in APAM’s services to the Fund, including APAM’s compliance, risk management, and legal resources and personnel. The Trustees noted the substantial attention and high priority given by APAM’s senior management to the Pioneer Fund complex. The Trustees considered the implementation and effectiveness of APAM’s business continuity plan in response to the COVID-19 pandemic.
The Trustees considered that APAM supervises and monitors the performance of the Fund’s service providers and provides the Fund with personnel (including Fund officers) and other resources that are necessary for the Fund’s business management and operations. The Trustees also considered that, as administrator, APAM is responsible for the administration of the Fund’s business and other affairs. The Trustees considered the fees paid to APAM for the provision of administration services.
Based on these considerations, the Trustees concluded that the nature, extent and quality of services that had been provided by APAM to the Fund were satisfactory and consistent with the terms of the investment management agreement.
Performance of the Fund
In considering the Fund’s performance, the Trustees regularly review and discuss throughout the year data prepared by APAM and information comparing the Fund’s performance with the performance of its peer group
Pioneer Floating Rate Fund | Annual Report | 10/31/20 67
of funds, as classified by Morningstar, Inc. (Morningstar), and with the performance of the Fund’s benchmark index. They also discuss the Fund’s performance with APAM on a regular basis. The Trustees’ regular reviews and discussions were factored into the Trustees’ deliberations concerning the renewal of the investment management agreement.
Management Fee and Expenses
The Trustees considered information showing the fees and expenses of the Fund in comparison to the management fees of its peer group of funds as classified by Morningstar and also to the expense ratios of a peer group of funds selected on the basis of criteria determined by the Independent Trustees for this purpose using data provided by Strategic Insight Mutual Fund Research and Consulting, LLC (Strategic Insight), an independent third party. The peer group comparisons referred to below are organized in quintiles. Each quintile represents one-fifth of the peer group. In all peer group comparisons referred to below, first quintile is most favorable to the Fund’s shareowners. The Trustees noted that they separately review and consider the impact of the Fund’s transfer agency and Fund- and APAM-paid expenses for sub-transfer agency and intermediary arrangements, and that the results of the most recent such review were considered in the consideration of the Fund’s expense ratio.
The Trustees considered that the Fund’s management fee for the most recent fiscal year was in the second quintile relative to the management fees paid by other funds in its Morningstar category for the comparable period. The Trustees considered that the expense ratio of the Fund’s Class A shares for the most recent fiscal year was in the fifth quintile relative to its Strategic Insight peer group for the comparable period. The Trustees considered that the expense ratio of the Fund’s Class Y shares for the most recent fiscal year was in the first quintile relative to its Strategic Insight peer group for the comparable period. The Trustees noted that APAM had agreed to waive fees and/or reimburse expenses in order to limit the ordinary operating expenses of the Fund.
The Trustees reviewed management fees charged by APAM and APIAM to institutional and other clients, including publicly offered European funds sponsored by APAM’s affiliates, unaffiliated U.S. registered investment companies (in a sub-advisory capacity), and unaffiliated foreign and domestic separate accounts. The Trustees also considered APAM’s costs in providing services to the Fund and APAM’s and APIAM’s costs in providing services to the other clients and considered the differences in management fees and profit margins for fund and non-fund services. In evaluating the fees associated with APAM’s and APIAM’s client accounts, the Trustees took into account the respective demands, resources and complexity
68 Pioneer Floating Rate Fund | Annual Report | 10/31/20
associated with the Fund and other client accounts. The Trustees noted that, in some instances, the fee rates for those clients were lower than the management fee for the Fund and considered that, under the investment management agreement with the Fund, APAM performs additional services for the Fund that it does not provide to those other clients or services that are broader in scope, including oversight of the Fund’s other service providers and activities related to compliance and the extensive regulatory and tax regimes to which the Fund is subject. The Trustees also considered the entrepreneurial risks associated with APAM’s management of the Fund.
The Trustees concluded that the management fee payable by the Fund to APAM was reasonable in relation to the nature and quality of the services provided by APAM.
Profitability
The Trustees considered information provided by APAM regarding the profitability of APAM with respect to the advisory services provided by APAM to the Fund, including the methodology used by APAM in allocating certain of its costs to the management of the Fund. The Trustees also considered APAM’s profit margin in connection with the overall operation of the Fund. They further reviewed the financial results, including the profit margins, realized by APAM and APIAM from non-fund businesses. The Trustees considered APAM’s profit margins in comparison to the limited industry data available and noted that the profitability of any adviser was affected by numerous factors, including its organizational structure and method for allocating expenses. The Trustees concluded that APAM’s profitability with respect to the management of the Fund was not unreasonable.
Economies of Scale
The Trustees considered APAM’s views relating to economies of scale in connection with the Pioneer Funds as fund assets grow and the extent to which any such economies of scale are shared with the Fund and Fund shareholders. The Trustees recognize that economies of scale are difficult to identify and quantify, and that, among other factors that may be relevant, are the following: fee levels, expense subsidization, investment by APAM in research and analytical capabilities and APAM’s commitment and resource allocation to the Fund. The Trustees noted that profitability also may be an indicator of the availability of any economies of scale, although profitability may vary for other reasons including due to reductions in expenses. The Trustees concluded that economies of scale, if any, were being appropriately shared with the Fund.
Pioneer Floating Rate Fund | Annual Report | 10/31/20 69
Other Benefits
The Trustees considered the other benefits that APAM enjoys from its relationship with the Fund. The Trustees considered the character and amount of fees paid or to be paid by the Fund, other than under the investment management agreement, for services provided by APAM and its affiliates. The Trustees further considered the revenues and profitability of APAM’s businesses other than the Fund business. To the extent applicable, the Trustees also considered the benefits to the Fund and to APAM and its affiliates from the use of “soft” commission dollars generated by the Fund to pay for research and brokerage services.
The Trustees considered that Amundi Pioneer is the principal U.S. asset management business of Amundi, which is one of the largest asset managers globally. Amundi’s worldwide asset management business manages over $1.7 trillion in assets (including the Pioneer Funds). The Trustees considered that APAM’s relationship with Amundi creates potential opportunities for APAM, APIAM and Amundi that derive from APAM’s relationships with the Fund, including Amundi’s ability to market the services of APAM globally. The Trustees noted that APAM has access to additional research and portfolio management capabilities as a result of its relationship with Amundi and Amundi’s enhanced global presence that may contribute to an increase in the resources available to APAM. The Trustees considered that APAM and the Fund receive reciprocal intangible benefits from the relationship, including mutual brand recognition and, for the Fund, direct and indirect access to the resources of a large global asset manager. The Trustees concluded that any such benefits received by APAM as a result of its relationship with the Fund were reasonable.
Conclusion
After consideration of the factors described above as well as other factors, the Trustees, including the Independent Trustees, concluded that the investment management agreement for the Fund, including the fees payable thereunder, was fair and reasonable and voted to approve the proposed renewal of the investment management agreement.
70 Pioneer Floating Rate Fund | Annual Report | 10/31/20
Investment Adviser and Administrator
Amundi Pioneer Asset Management, Inc.
Custodian and Sub-Administrator
Brown Brothers Harriman & Co.
Independent Registered Public Accounting Firm
Ernst & Young LLP
Principal Underwriter
Amundi Pioneer Distributor, Inc.
Legal Counsel
Morgan, Lewis & Bockius LLP
Transfer Agent
DST Asset Manager Solutions, Inc.
Proxy Voting Policies and Procedures of the Fund are available without charge, upon request, by calling our toll free number (1-800-225-6292). Information regarding how the Fund voted proxies relating to portfolio securities during the most recent 12-month period ended June 30 is publicly available to shareowners at www.amundipioneer.com/us. This information is also available on the Securities and Exchange Commission’s web site at www.sec.gov.
Trustees and Officers
The Fund’s Trustees and officers are listed below, together with their principal occupations and other directorships they have held during at least the past five years. Trustees who are interested persons of the Fund within the meaning of the 1940 Act are referred to as Interested Trustees. Trustees who are not interested persons of the Fund are referred to as Independent Trustees. Each of the Trustees serves as a Trustee of each of the 45 U.S. registered investment portfolios for which Amundi serves as investment adviser (the “Pioneer Funds”). The address for all Trustees and all officers of the Fund is 60 State Street, Boston, Massachusetts 02109.
The Statement of Additional Information of the Fund includes additional information about the Trustees and is available, without charge, upon request, by calling 1-800-225-6292.
Pioneer Floating Rate Fund | Annual Report | 10/31/20 71
Independent Trustees
| Name, Age and Position | Term of Office and | Other Directorships | |
| Held With the Fund | Length of Service | Principal Occupation | Held by Trustee |
| Thomas J. Perna (70) | Trustee since 2007. | Private investor (2004 – 2008 and 2013 – present); Chairman (2008 – 2013) | Director, Broadridge Financial |
Chairman of the Board | Serves until a successor | and Chief Executive Officer (2008 – 2012), Quadriserv, Inc. (technology | Solutions, Inc. (investor |
and Trustee | trustee is elected or | products for securities lending industry); and Senior Executive Vice | communications and securities |
earlier retirement | President, The Bank of New York (financial and securities services) | processing provider for financial | |
or removal. | (1986 – 2004) | services industry) (2009 – present); | |
Director, Quadriserv, Inc. (2005 – | |||
2013); and Commissioner, New | |||
Jersey State Civil Service | |||
Commission (2011 – 2015) | |||
| John E. | Trustee since 2019. | Of Counsel (2019 – present), Partner (1983-2018), Sullivan & | Chairman, The Lakeville Journal |
| Baumgardner, Jr. (69) | Serves until a successor | Cromwell LLP (law firm). | Company, LLC, (privately-held |
Trustee | trustee is elected or | community newspaper group) | |
earlier retirement | (2015-present) | ||
or removal. | |||
| Diane Durnin (63) | Trustee since 2019. | Managing Director - Head of Product Strategy and Development, BNY | None |
Trustee | Serves until a successor | Mellon Investment Management (investment management firm) (2012-2018); | |
trustee is elected or | Vice Chairman – The Dreyfus Corporation (2005 – 2018): Executive Vice | ||
earlier retirement | President Head of Product, BNY Mellon Investment Management | ||
or removal. | (2007-2012); Executive Director- Product Strategy, Mellon Asset Management | ||
(2005-2007); Executive Vice President Head of Products, Marketing and | |||
Client Service, Dreyfus Corporation (investment management firm) | |||
(2000-2005); and Senior Vice President Strategic Product and Business | |||
Development, Dreyfus Corporation (1994-2000) |
72 Pioneer Floating Rate Fund | Annual Report | 10/31/20
| Name, Age and Position | Term of Office and | Other Directorships | |
| Held With the Fund | Length of Service | Principal Occupation | Held by Trustee |
| Benjamin M. Friedman (76) | Trustee since 2008. | William Joseph Maier Professor of Political Economy, Harvard University | Trustee, Mellon Institutional Funds |
Trustee | Serves until a successor | (1972 – present) | Investment Trust and Mellon |
trustee is elected or | Institutional Funds Master Portfolio | ||
earlier retirement | (oversaw 17 portfolios in fund | ||
or removal. | complex) (1989 - 2008) | ||
| Lorraine H. Monchak (64) | Trustee since 2017. | Chief Investment Officer, 1199 SEIU Funds (healthcare workers union | None |
Trustee | (Advisory Trustee from | pension funds) (2001 – present); Vice President – International Investments | |
2014 - 2017). Serves | Group, American International Group, Inc. (insurance company) | ||
until a successor trustee | (1993 – 2001); Vice President – Corporate Finance and Treasury Group, | ||
is elected or earlier | Citibank, N.A. (1980 – 1986 and 1990 – 1993); Vice President – Asset/Liability | ||
retirement or removal. | Management Group, Federal Farm Funding Corporation | ||
(government-sponsored issuer of debt securities) (1988 – 1990); Mortgage | |||
Strategies Group, Shearson Lehman Hutton, Inc. (investment bank) | |||
(1987 – 1988); and Mortgage Strategies Group, Drexel Burnham Lambert, | |||
Ltd. (investment bank) (1986 – 1987) | |||
| Marguerite A. Piret (72) | Trustee since 2007. | Chief Financial Officer, American Ag Energy, Inc. (controlled environment | Director of New America High |
Trustee | Serves until a successor | and agriculture company) (2016 – present); and President and Chief | Income Fund, Inc. (closed-end |
trustee is elected or | Executive Officer, Metric Financial Inc. (formerly known as Newbury Piret | investment company) | |
earlier retirement | Company) (investment banking firm) (1981 – 2019) | (2004 – present); and Member, | |
or removal. | Board of Governors, Investment | ||
Company Institute (2000 – 2006) |
Pioneer Floating Rate Fund | Annual Report | 10/31/20 73
Independent Trustees (continued)
| Name, Age and Position | Term of Office and | Other Directorships | |
| Held With the Fund | Length of Service | Principal Occupation | Held by Trustee |
| Fred J. Ricciardi (73) | Trustee since 2014. | Private investor (2020 – present); Consultant (investment company services) | None |
Trustee | Serves until a successor | (2012 – 2020); Executive Vice President, BNY Mellon (financial and | |
trustee is elected or | investment company services) (1969 – 2012); Director, BNY International | ||
earlier retirement | Financing Corp. (financial services) (2002 – 2012); Director, Mellon | ||
or removal. | Overseas Investment Corp. (financial services) (2009 – 2012); Director, | ||
Financial Models (technology) (2005-2007); Director, BNY Hamilton Funds, | |||
Ireland (offshore investment companies) (2004-2007); Chairman/Director, | |||
AIB/BNY Securities Services, Ltd., Ireland (financial services) (1999-2006); | |||
and Chairman, BNY Alternative Investment Services, Inc. (financial services) | |||
(2005-2007) |
74 Pioneer Floating Rate Fund | Annual Report | 10/31/20
| Interested Trustees | |||
| Name, Age and Position | Term of Office and | Other Directorships | |
| Held With the Fund | Length of Service | Principal Occupation | Held by Trustee |
| Lisa M. Jones (58)* | Trustee since 2017. | Director, CEO and President of Amundi Pioneer Asset Management USA, | None |
Trustee, President and | Serves until a successor | Inc. (investment management firm) (since September 2014); Director, CEO | |
Chief Executive Officer | trustee is elected or | and President of Amundi Pioneer Asset Management, Inc. (since | |
earlier retirement | September 2014); Director, CEO and President of Amundi Pioneer | ||
or removal | Distributor, Inc. (since September 2014); Director, CEO and President of | ||
Amundi Pioneer Institutional Asset Management, Inc. (since September 2014); | |||
Chair, Amundi Pioneer Asset Management USA, Inc., Amundi Pioneer | |||
Distributor, Inc. and Amundi Pioneer Institutional Asset Management, Inc. | |||
(September 2014 – 2018); Managing Director, Morgan Stanley Investment | |||
Management (investment management firm) (2010 – 2013); Director of | |||
Institutional Business, CEO of International, Eaton Vance Management | |||
(investment management firm) (2005 – 2010); and Director of | |||
Amundi USA, Inc. (since 2017) | |||
| Kenneth J. Taubes (62)* | Trustee since 2014. | Director and Executive Vice President (since 2008) and Chief Investment | None |
Trustee | Serves until a successor | Officer, U.S. (since 2010) of Amundi Pioneer Asset Management USA, Inc. | |
trustee is elected or | (investment management firm); Director and Executive Vice President and | ||
earlier retirement | Chief Investment Officer, U.S. of Amundi (since 2008); Executive Vice | ||
or removal | President and Chief Investment Officer, U.S. of Amundi Pioneer Institutional | ||
Asset Management, Inc. (since 2009); Portfolio Manager of Amundi (since | |||
1999); and Director of Amundi USA, Inc. (since 2017) | |||
| * Ms. Jones and Mr. Taubes are Interested Trustees because they are officers or directors of the Fund’s investment adviser and certain of its affiliates. | |||
Pioneer Floating Rate Fund | Annual Report | 10/31/20 75
| Fund Officers | |||
| Name, Age and Position | Term of Office and | Other Directorships | |
| Held With the Fund | Length of Service | Principal Occupation | Held by Officer |
| Christopher J. Kelley (55) | Since 2007. Serves at | Vice President and Associate General Counsel of Amundi since January | None |
Secretary and Chief | the discretion of | 2008; Secretary and Chief Legal Officer of all of the Pioneer Funds since | |
Legal Officer | the Board | June 2010; Assistant Secretary of all of the Pioneer Funds from September | |
2003 to May 2010; and Vice President and Senior Counsel of Amundi from | |||
July 2002 to December 2007 | |||
| Carol B. Hannigan (59) | Since 2010. Serves at | Fund Governance Director of Amundi since December 2006 and Assistant | None |
Assistant Secretary | the discretion of | Secretary of all the Pioneer Funds since June 2010; Manager – Fund | |
the Board | Governance of Amundi from December 2003 to November 2006; and | ||
Senior Paralegal of Amundi from January 2000 to November 2003 | |||
| Thomas Reyes (57) | Since 2010. Serves at | Assistant General Counsel of Amundi since May 2013 and Assistant | None |
Assistant Secretary | the discretion of | Secretary of all the Pioneer Funds since June 2010; and Counsel of Amundi | |
the Board | from June 2007 to May 2013 | ||
| Mark E. Bradley (60) | Since 2008. Serves at | Vice President – Fund Treasury of Amundi; Treasurer of all of the Pioneer | None |
Treasurer and | the discretion of | Funds since March 2008; Deputy Treasurer of Amundi from March 2004 to | |
Chief Financial and | the Board | February 2008; and Assistant Treasurer of all of the Pioneer Funds from | |
Accounting Officer | March 2004 to February 2008 | ||
| Luis I. Presutti (55) | Since 2007. Serves at | Director – Fund Treasury of Amundi; and Assistant Treasurer of all of the | None |
Assistant Treasurer | the discretion of | Pioneer Funds | |
the Board | |||
| Gary Sullivan (62) | Since 2007. Serves at | Senior Manager – Fund Treasury of Amundi; and Assistant Treasurer of all | None |
Assistant Treasurer | the discretion of | of the Pioneer Funds | |
the Board | |||
76 Pioneer Floating Rate Fund | Annual Report | 10/31/20
| Name, Age and Position | Term of Office and | Other Directorships | |
| Held With the Fund | Length of Service | Principal Occupation | Held by Officer |
| Antonio Furtado (38) | Since 2020. Serves at | Fund Oversight Manager – Fund Treasury of Amundi; and Assistant | None |
Assistant Treasurer | the discretion of | Treasurer of all of the Pioneer Funds | |
the Board | |||
| John Malone (48) | Since 2018. Serves at | Managing Director, Chief Compliance Officer of Amundi Pioneer Asset | None |
Chief Compliance Officer | the discretion of | Management; Amundi Pioneer Institutional Asset Management, Inc.; and | |
the Board | the Pioneer Funds since September 2018; and Chief Compliance Officer of | ||
Amundi Pioneer Distributor, Inc. since January 2014. | |||
| Kelly O’Donnell (49) | Since 2007. Serves at | Vice President – Amundi Pioneer Asset Management ; and Anti-Money | None |
Anti-Money | the discretion of | Laundering Officer of all the Pioneer Funds since 2006 | |
Laundering Officer | the Board |
Pioneer Floating Rate Fund | Annual Report | 10/31/20 77
This page was intentionally left blank.
78 Pioneer Floating Rate Fund | Annual Report | 10/31/20
This page was intentionally left blank.
Pioneer Floating Rate Fund | Annual Report | 10/31/20 79
This page was intentionally left blank.
80 Pioneer Floating Rate Fund | Annual Report | 10/31/20
This page was intentionally left blank.
Pioneer Floating Rate Fund | Annual Report | 10/31/20 81
This page was intentionally left blank.
82 Pioneer Floating Rate Fund | Annual Report | 10/31/20
This page was intentionally left blank.
Pioneer Floating Rate Fund | Annual Report | 10/31/20 83
This page was intentionally left blank.
84 Pioneer Floating Rate Fund | Annual Report | 10/31/20
How to Contact Amundi
We are pleased to offer a variety of convenient ways for you to contact us for assistance or information.
| Call us for: | ||
Account Information, including existing accounts, | ||
new accounts, prospectuses, applications | ||
and service forms | 1-800-225-6292 | |
FactFoneSM for automated fund yields, prices, | ||
account information and transactions | 1-800-225-4321 | |
| Retirement plans information | 1-800-622-0176 | |
| Write to us: | ||
Amundi | ||
P.O. Box 219427 | ||
Kansas City, MO 64121-9427 | ||
| Our toll-free fax | 1-800-225-4240 | |
| Our internet e-mail address | us.askamundipioneer@amundipioneer.com | |
(for general questions about Amundi only) | ||
| Visit our web site: www.amundipioneer.com/us | ||
This report must be preceded or accompanied by a prospectus.
The Fund files a complete schedule of portfolio holdings with the Securities and Exchange Commission for the first and third quarters of each fiscal year as an exhibit to its reports on Form N-PORT. Shareholders may view the filed Form N-PORT by visiting the Commission’s web site at https://www.sec.gov.

Amundi Pioneer Asset Management, Inc.
60 State Street
Boston, MA 02109
www. amundipioneer. com/us
60 State Street
Boston, MA 02109
www. amundipioneer. com/us
Securities offered through Amundi Pioneer Distributor, Inc.
60 State Street, Boston, MA 02109
Underwriter of Pioneer Mutual Funds, Member SIPC
© 2020 Amundi Pioneer Asset Management 21401-13-1220
60 State Street, Boston, MA 02109
Underwriter of Pioneer Mutual Funds, Member SIPC
© 2020 Amundi Pioneer Asset Management 21401-13-1220
Pioneer Flexible Opportunities Fund
Annual Report | October 31, 2020
| A: PMARX | C: PRRCX | K: FLEKX | R: MUARX | Y: PMYRX |
Beginning in or after April 2021, as permitted by regulations adopted by the Securities and Exchange Commission, paper copies of the Fund’s shareholder reports like this one will no longer be sent by mail, unless you specifically request paper copies of the reports from the Fund or from your financial intermediary, such as a broker-dealer, bank or insurance company. Instead, the reports will be made available on the Fund’s website, and you will be notified by mail each time a report is posted and provided with a website link to access the report.
If you already elected to receive shareholder reports electronically, you will not be affected by this change and you need not take any action. You may elect to receive shareholder reports and other communications electronically by contacting your financial intermediary or, if you invest directly with the Fund, by calling 1-800-225-6292.
You may elect to receive all future reports in paper free of charge. If you invest directly with the Fund, you can inform the Fund that you wish to continue receiving paper copies of your shareholder reports by calling 1-800-225-6292. If you invest through a financial intermediary, you can contact your financial intermediary to request that you continue to receive paper copies of your shareholder reports. Your election to receive reports in paper will apply to all funds held in your account if you invest through your financial intermediary or all funds held within the Pioneer Fund complex if you invest directly.
visit us: www.amundipioneer.com/us
Pioneer Flexible Opportunities Fund | Annual Report | 10/31/20 1
The new decade has arrived delivering a calendar year that will go down in the history books. The beginning of 2020 seemed to extend the positive market environment of 2019. Then, March roared in like a lion and the COVID-19 pandemic became a global crisis impacting lives and life as we know it. As the fourth quarter of 2020 got underway, it appeared that the long-anticipated “second wave” of COVID-19 cases was occurring, both in some U.S. states and in Europe. In response, some governments began retightening restrictions on both business and personal activities.
However, as the fourth quarter continued, we began to read some encouraging news on the vaccine front, as multiple pharmaceutical companies announced successful clinical trials for their COVID-19 vaccinations and applied for emergency-use approval for the drugs with the Food and Drug Administration. Government officials followed up on the positive news by announcing that deployment of at least one of the vaccines to frontline workers could begin even before the end of this calendar year, with the potential for widespread distribution by mid-2021.
While there may finally be a light visible at the end of the pandemic tunnel as 2020 comes to a close, the long-term impact on the global economy from COVID-19, while currently unknown, is likely to be considerable. It is clear that several industries have already felt greater effects than others, and the markets, which do not thrive on uncertainty, have been volatile, delivering significantly negative performance in the first quarter, and then recovering most of those losses throughout the following quarters. Despite the rebound, volatility has remained elevated, with momentum rising and falling on seemingly every bit of positive or negative news about the virus, from vaccines to spikes in the number of cases as well as rising hospitalization rates in some areas. In addition, the U.S. Presidential Election was in high gear as we entered the fourth quarter. This election contributed to the market volatility as investors pondered the possible outcomes and their potential effects on the economic outlook.
With the advent of COVID-19 last winter, we implemented our business continuity plan according to the new COVID-19 guidelines, and most of our employees have been working remotely since March. To date, our operating environment has faced no interruption. I am proud of the careful planning that has taken place and confident we can maintain this environment for as long as is prudent. History in the making for a company that first opened its doors way back in 1928.
2 Pioneer Flexible Opportunities Fund | Annual Report | 10/31/20
Since 1928, Amundi’s investment process has been built on a foundation of fundamental research and active management, principles which have guided our investment decisions for more than 90 years. We believe active management – that is, making active investment decisions – can help mitigate the risks during periods of market volatility. As 2020 has reminded us, investment risk can arise from a number of factors in today’s global economy, including slower or stagnating growth, changing U.S. Federal Reserve policy, oil price shocks, political and geopolitical factors and, unfortunately, major public health concerns such as a viral pandemic.
At Amundi, active management begins with our own fundamental, bottom-up research process. Our team of dedicated research analysts and portfolio managers analyzes each security under consideration, communicating directly with the management teams of the companies issuing the securities and working together to identify those securities that best meet our investment criteria for our family of funds. Our risk management approach begins with each and every security, as we strive to carefully understand the potential opportunity, while considering any and all risk factors.
Today, as investors, we have many options. It is our view that active management can serve shareholders well, not only when markets are thriving, but also during periods of market stress.
As you consider your long-term investment goals, we encourage you to work with your financial professional to develop an investment plan that paves the way for you to pursue both your short-term and long-term goals.
We remain confident that the current crisis, like others in human history, will pass, and we greatly appreciate the trust you have placed in us and look forward to continuing to serve you in the future.
Sincerely,
Lisa M. Jones
Head of the Americas, President and CEO of U.S.
Amundi Pioneer Asset Management USA, Inc.
December 18, 2020
Head of the Americas, President and CEO of U.S.
Amundi Pioneer Asset Management USA, Inc.
December 18, 2020
Any information in this shareowner report regarding market or economic trends or the factors influencing the Fund’s historical or future performance are statements of opinion as of the date of this report. Past performance is no guarantee of future results.
Pioneer Flexible Opportunities Fund | Annual Report | 10/31/20 3
In the following discussion, Michele Garau and Howard Weiss review recent market events and describe the factors that affected the performance of Pioneer Flexible Opportunities Fund during the 12-month period ended October 31, 2020. Mr. Garau, a senior vice president and a portfolio manager at Amundi Pioneer Asset Management, Inc. (Amundi)*, is responsible for the management of the Fund, along with Mr. Weiss, CFA, a vice president and a portfolio manager at Amundi, and Kenneth J. Taubes, Executive Vice President, Chief Investment Officer, U.S., and a portfolio manager at Amundi.
Q How did the Fund perform during the 12-month period ended October 31, 2020?
A Pioneer Flexible Opportunities Fund’s Class A shares returned -5.28% at net asset value during the 12-month period ended October 31, 2020, while the Fund’s benchmark, the Bloomberg Barclays U.S. Treasury TIPS 1-10 Year Index (the Bloomberg Barclays Index), returned 7.00%. During the same period, the average return of the 240 mutual funds in Morningstar’s Tactical Allocation Funds category was 1.54%.
Q How did the financial markets perform during the 12-month period ended October 31, 2020?
A Despite a COVID-19-induced sell-off of higher-risk assets in the first calendar quarter of 2020, most segments of the financial markets delivered positive returns over the 12-month period.
The period began on an upbeat note towards the end of 2019, with positive momentum driven by solid investor sentiment from November through mid-February of 2020. During that timeframe, market participants drew encouragement from a combination of steady economic growth data, supportive central-bank policies in several countries, and progress in the long-running trade dispute between the United States and China. The favorable backdrop evaporated in mid-February, however, as it became apparent that the COVID-19 virus had become a worldwide pandemic that was likely to have a substantial negative effect on the global economy. Equities, higher-risk segments of the bond market, and commodities all plunged in value during the resulting sell-off from the last weeks of February into the final week of March, while relative “safe havens,” such as U.S. government bonds, produced impressive gains.
* See Notes to Financial Statements Note 8.
4 Pioneer Flexible Opportunities Fund | Annual Report | 10/31/20
The environment shifted again in late March, when the aggressive stimulus programs enacted by governments and central banks in many countries, including the U.S. Federal Reserve (Fed), touched off a significant recovery in the markets for riskier assets that lasted through the end of August. The positive momentum slowed somewhat in the final two months of the period, due to a resurgence in COVID-19 cases and uncertainties surrounding the lead-up to the U.S. elections. Despite the slight pullback, higher-risk asset categories still finished October, the final month of the Fund’s fiscal year, well above their prior lows.
Performance trends among the various asset classes were quite divergent under the surface during the 12-month period. For example, the strong showing by global equity markets derived in large part from the significant outperformance of mega-cap, technology-related growth stocks in the United States. The robust gains in that segment obscured the negative returns for most other areas of the equity market, including value stocks, shares of smaller companies, and developed-market international equities.
Bonds also posted positive headline returns for the 12-month period, with the largest gains generated among government debt issues and U.S. investment-grade corporate bonds.
Q Could you discuss some of the investment decisions that factored into the Fund’s benchmark-relative performance during the 12-month period ended October 31, 2020?
A Since the Fund’s benchmark, the Bloomberg Barclays Index, is comprised of entirely short- to intermediate-term government debt, it was well positioned to capture the upside of the first quarter “flight to quality” in the markets, and the benefits of the Fed’s commitment to keeping the federal funds target rate at near zero for an indefinite length of time. Conversely, we had allocated the majority of the Fund’s portfolio to equities, based on our longer-term view that the asset category has offered a better risk/return profile than bonds or commodities. Even though stocks performed well for the 12-month period, the equities held in the portfolio finished in negative territory, due to our diversified** investment approach and the Fund’s relatively light exposure to shares of the tech giants that outperformed so strongly. The result was that the Fund’s equity holdings in the United States posted a slightly negative aggregate return, well behind the gains for the major large-cap stock indices. Holdings in Europe also detracted from the Fund’s benchmark-relative performance, as European equities lagged global stocks overall.
** Diversification does not assure a profit nor protect against loss.
Pioneer Flexible Opportunities Fund | Annual Report | 10/31/20 5
Real estate investment trusts (REITs) were another underperformer for the Fund versus the benchmark over the 12-month period, as the sector failed to keep pace with a market rally driven by higher-growth stocks.
On the positive side, the Fund’s relative returns benefited significantly through positions in Chinese stocks (including those listed in Hong Kong). The Fund’s fixed-income holdings also generated strong returns during the 12-month period, as security selection in the high-yield segment fueled a performance advantage versus the benchmark. Unfortunately, that positive had a limited effect on relative returns overall, due to the portfolio’s smaller average weighting.
Q Did the Fund have any exposure to derivatives during the 12-month period ended October 31, 2020? If so, how did the use of derivatives affect the Fund’s performance?
A During the 12-month period, we used derivatives across a broad spectrum of asset classes to establish specific market or issuer exposures in the portfolio, and to attempt to manage downside risk. The derivative instruments we used included equity, fixed-income, and commodity futures; credit-linked securities; long or short positions in exchange-traded funds (ETFs); forward foreign currency contracts; Treasury futures contracts; and options on both indices and individual securities.
The use of derivatives – while helping to cushion the effect of the market downturn on the portfolio in February and March – nonetheless detracted from performance over the full 12-month period, primarily due to the hedges employed, which kept the Fund from fully capitalizing on the rally in the equity markets over the second half of the period. We believe derivatives have continued to offer an efficient way for us to manage the Fund’s allocations, without having to make material changes to the portfolio’s core holdings. Since we use derivatives in an effort to achieve the Fund’s risk/return objectives, we feel that evaluating them within the context of the entire portfolio, rather than as a standalone investment strategy, is the proper view.
Q Could you discuss the Fund’s positioning as of October 31, 2020?
A While COVID-19 has continued to linger across the globe, economic data has improved relative to the lows seen during the height of the initial lockdowns. Trends in Purchasing Managers Index (PMI) numbers, a key leading indicator, have been especially positive of late. Finally, encouraging news about progress toward COVID-19 vaccines has helped improve investors’ outlook regarding the potential for an economic rebound and subsequent expansion.
6 Pioneer Flexible Opportunities Fund | Annual Report | 10/31/20
Given the state of the economy and the persistent gap between bond yields and the earnings yield on equities (earnings divided by stock price; the inverse of the price-to-earnings ratio), we still have found it difficult to embrace bonds as an investment option. We have therefore retained a low fixed-income weighting in the portfolio overall, with a roughly 9% allocation at the close of the 12-month period. With that said, we have maintained our belief that bond-like stocks (“bond proxies”) have continued to represent a far better risk/reward proposition than bonds themselves. Accordingly, the Fund had an approximate 15% allocation to REITs as of October 31, 2020. The strategy reflects our view that the companies’ market prices do not fully reflect the value of their underlying assets.
The equity portfolio, which made up nearly 68% of the Fund’s invested assets at the close of the 12-month period (including derivatives exposure and REITs), has remained globally diversified. We have continued to like U.S. equities, as the United States is the only country where the corporate sector has been a large-scale buyer of stocks. Within equities, we have maintained a preference for shares of companies in the defense, health care, and information technology sectors. The portfolio also has continued to have a sizable weighting in international stocks. In China, we have remained focused on owning shares of domestic-oriented companies, in part based on our belief that the country’s economy has been well ahead of the rest of the world in terms of its recovery from the pandemic. In Europe, we have emphasized utilities and insurance companies, which we believe have offered a wide gap between their dividend*** yields and the yields available on both government and corporate bonds in the region. In Japan and Singapore, the Fund’s primary positions are in REITs.
The remainder of the portfolio as of period-end was predominantly comprised of cash and equivalents, and allocations to thematic ETFs, including those invested in cyber-security stocks, companies with long histories of increasing their dividends, and companies that have effectively reduced their number of net shares outstanding through buybacks.
Although the Fund underperformed over the past 12 months, we believe our flexible, go-anywhere approach to investing is well suited to a time of elevated uncertainty and wide divergences in the economic fundamentals of countries, regions, and sectors.
*** Dividends are not guaranteed.
Pioneer Flexible Opportunities Fund | Annual Report | 10/31/20 7
Please refer to the Schedule of Investments on pages 19–32 for a full listing of Fund securities.
All investments are subject to risk, including the possible loss of principal. In the past several years, financial markets have experienced increased volatility and heightened uncertainty. The market prices of securities may go up or down, sometimes rapidly or unpredictably, due to general market conditions, such as real or perceived adverse economic, political, or regulatory conditions, recessions, inflation, changes in interest or currency rates, lack of liquidity in the bond markets, the spread of infectious illness or other public health issues or adverse investor sentiment. These conditions may continue, recur, worsen or spread.
The Fund has the ability to invest in a wide variety of securities and asset classes.
The Fund may invest in underlying funds (including ETFs). In addition to the Fund’s operating expenses, you will indirectly bear the operating expenses of investments in any underlying funds.
The Fund and some of the underlying funds employ leverage through the use of derivatives, which increases the volatility of investment returns and subjects the Fund to magnified losses if the Fund or an underlying fund’s investments decline in value.
The Fund and some of the underlying funds may use derivatives, such as options and futures, which can be illiquid, may disproportionately increase losses, and have a potentially large impact on Fund performance.
The Fund and some of the underlying funds may employ short selling, a speculative strategy. Unlike the possible loss on a security that is purchased, there is no limit to the amount of loss on an appreciating security that is sold short.
The Fund may invest in credit default swaps, which may in some cases be illiquid, and they increase credit risk since the fund has exposure to both the issuer of the referenced obligation and the counterparty to the credit default swap.
The Fund may invest in insurance-linked securities. The return of principal and the payment of interest on insurance-linked bonds are contingent on the non-occurrence of a pre-defined “trigger” event, such as a hurricane or an earthquake of a specific magnitude.
The Fund may invest in commodity-linked derivatives. The value of commodity-linked derivatives may be affected by changes in overall market movements, commodity index volatility, changes in interest rates, factors affecting a particular industry or commodity, international economic, political and regulatory developments, supply and demand, and governmental regulatory policies.
8 Pioneer Flexible Opportunities Fund | Annual Report | 10/31/20
Investments in equity securities are subject to price fluctuation.
Small- and mid-cap stocks involve greater risks and volatility than large-cap stocks.
International investments are subject to special risks, including currency fluctuations, and social, economic and political uncertainties, which could increase volatility. These risks are magnified in emerging markets.
Investments in fixed-income securities involve interest rate, credit, inflation, and reinvestment risks. As interest rates rise, the value of fixed-income securities will generally fall.
Prepayment risk is the chance that an issuer may exercise its right to repay its security, if falling interest rates prompt the issuer to do so. Forced to reinvest the unanticipated proceeds at lower interest rates, the Fund would experience a decline in income and lose the opportunity for additional price appreciation.
The Fund may invest in mortgage-backed securities, which during times of fluctuating interest rates may increase or decrease more than other fixed-income securities. Mortgage-backed securities are also subject to prepayments.
High-yield bonds possess greater price volatility, illiquidity, and possibility of default.
These risks may increase share price volatility.
There is no assurance that these and other strategies used by the Fund or underlying funds will be successful.
Please see the prospectus for a more complete discussion of the Fund’s risks.
Before investing, consider the product’s investment objectives, risks, charges and expenses. Contact your advisor or Amundi for a prospectus or summary prospectus containing this information. Read it carefully.
Any information in this shareholder report regarding market or economic trends or the factors influencing the Fund’s historical or future performance are statements of opinion as of the date of this report. Past performance is no guarantee of future results.
Pioneer Flexible Opportunities Fund | Annual Report | 10/31/20 9

10 Largest Holdings
(As a percentage of total investments)*
(As a percentage of total investments)*
| 1. | ETFMG Prime Cyber Security ETF | 4.36% |
| 2. | Thermo Fisher Scientific, Inc. | 1.86 |
| 3. | U.S. Treasury Bills, 11/17/20 | 1.61 |
| 4. | CenturyLink, Inc., 7.65%, 3/15/42 | 1.58 |
| 5. | Redwood Trust, Inc. | 1.52 |
| 6. | PennyMac Mortgage Investment Trust | 1.51 |
| 7. | AGNC Investment Corp. | 1.44 |
| 8. | China Meidong Auto Holdings, Ltd. | 1.38 |
| 9. | Aberdeen Standard Physical Palladium Shares ETF | 1.25 |
| 10. | Gold Fields Orogen Holdings BVI, Ltd., 6.125%, 5/15/29 (144A) | 1.21 |
* Excludes temporary cash investments and all derivative contracts except for options purchased. The Fund is actively managed, and current holdings may be different. The holdings listed should not be considered recommendations to buy or sell any securities.
10 Pioneer Flexible Opportunities Fund | Annual Report | 10/31/20
Net Asset Value per Share
| Class | 10/31/20 | 10/31/19 |
A | $11.14 | $12.04 |
C | $10.85 | $11.75 |
K | $11.14 | $12.03 |
R | $11.02 | $11.75 |
Y | $11.20 | $12.09 |
Distributions per Share: 11/1/19–10/31/20
| Net Investment | Short-Term | Long-Term | |
| Class | Income | Capital Gains | Capital Gains |
A | $0.2769 | $ — | $ — |
C | $0.2100 | $ — | $ — |
K | $0.3095 | $ — | $ — |
R | $0.0350 | $ — | $ — |
Y | $0.3081 | $ — | $ — |
Index Definitions
The Bloomberg Barclays U.S. Treasury TIPS 1-10 Year Index is an unmanaged index comprised of U.S. Treasury Inflation Protected Securities (TIPS) having a maturity of at least 1 year and less than 10 years. Index returns are calculated monthly, assume reinvestment of dividends and, unlike Fund returns, do not reflect any fees, expenses or sales charges. It is not possible to invest directly in an index.
The index defined here pertains to the “Value of $10,000 Investment” and “Value of $5 Million Investment” charts on pages 12–16.
Pioneer Flexible Opportunities Fund | Annual Report | 10/31/20 11
| Class A Shares |
Investment Returns
The mountain chart on the right shows the change in value of a $10,000 investment made in Class A shares of Pioneer Flexible Opportunities Fund at public offering price during the periods shown, compared to that of the Bloomberg Barclays U.S. Treasury TIPS 1–10 Year Index.
| Average Annual Total Returns | |||
(As of October 31, 2020) | |||
| BBG | |||
| Barclays | |||
| Net | Public | U.S. Treasury | |
| Asset | Offering | TIPS | |
| Value | Price | 1-10 Year | |
| Period | (NAV) | (POP) | Index |
10 years | 4.97% | 4.48% | 2.51% |
5 years | 3.33 | 2.39 | 3.56 |
1 year | -5.28 | -9.54 | 7.00 |
| Expense Ratio | |||
(Per prospectus dated March 1, 2020) | |||
| Gross | Net | ||
1.26% | 1.23% | ||

Call 1-800-225-6292 or visit www.amundipioneer.com/us for the most recent month-end performance results. Current performance may be lower or higher than the performance data quoted.
The performance data quoted represents past performance, which is no guarantee of future results. Investment return and principal value will fluctuate, and shares, when redeemed, may be worth more or less than their original cost.
NAV results represent the percent change in net asset value per share. POP returns reflect deduction of maximum 4.50% sales charge. NAV returns would have been lower had sales charges been reflected. All results are historical and assume the reinvestment of dividends and capital gains. Other share classes are available for which performance and expenses will differ.
Performance results reflect any applicable expense waivers in effect during the periods shown. Without such waivers Fund performance would be lower. Waivers may not be in effect for all funds. Certain fee waivers are contractual through a specified period. Otherwise, fee waivers can be rescinded at any time. See the prospectus and financial statements for more information.
The net expense ratio reflects the contractual expense limitation currently in effect through March 1, 2021, for Class A shares. There can be no assurance that Amundi will extend the expense limitation beyond such time. Please see the prospectus for more information.
The performance table and graph do not reflect the deduction of fees and taxes that a shareowner would pay on Fund distributions or the redemption of Fund shares.
Please refer to the financial highlights for more current expense ratios.
12 Pioneer Flexible Opportunities Fund | Annual Report | 10/31/20
Performance Update | 10/31/20 | Class C Shares |
Investment Returns
The mountain chart on the right shows the change in value of a $10,000 investment made in Class C shares of Pioneer Flexible Opportunities Fund during the periods shown, compared to that of the Bloomberg Barclays U.S. Treasury TIPS 1–10 Year Index.
| Average Annual Total Returns | |||
(As of October 31, 2020) | |||
| BBG | |||
| Barclays | |||
| U.S. Treasury | |||
| TIPS | |||
| If | If | 1-10 Year | |
| Period | Held | Redeemed* | Index |
10 years | 4.15% | 4.15% | 2.51% |
5 years | 2.53 | 2.53 | 3.56 |
1 year | -6.01 | -6.01 | 7.00 |
| Expense Ratio | |||
(Per prospectus dated March 1, 2020) | |||
| Gross | |||
2.00% | |||

Call 1-800-225-6292 or visit www.amundipioneer.com/us for the most recent month-end performance results. Current performance may be lower or higher than the performance data quoted.
The performance data quoted represents past performance, which is no guarantee of future results. Investment return and principal value will fluctuate, and shares, when redeemed, may be worth more or less than their original cost.
Class C shares held for less than one year are subject to a 1% contingent deferred sales charge (CDSC). “If Held” results represent the percent change in net asset value per share. NAV returns would have been lower had sales charges been reflected. All results are historical and assume the reinvestment of dividends and capital gains. Other share classes are available for which performance and expenses will differ.
Performance results reflect any applicable expense waivers in effect during the periods shown. Without such waivers Fund performance would be lower. Waivers may not be in effect for all funds. Certain fee waivers are contractual through a specified period. Otherwise, fee waivers can be rescinded at any time. See the prospectus and financial statements for more information.
The performance table and graph do not reflect the deduction of fees and taxes that a shareowner would pay on Fund distributions or the redemption of Fund shares.
Please refer to the financial highlights for more current expense ratios.
* If Redeemed does not include CDSC.
Pioneer Flexible Opportunities Fund | Annual Report | 10/31/20 13
Performance Update | 10/31/20 | Class K Shares |
Investment Returns
The mountain chart on the right shows the change in value of a $5 million investment made in Class K shares of Pioneer Flexible Opportunities Fund during the periods shown, compared to that of the Bloomberg Barclays U.S. Treasury TIPS 1–10 Year Index.
| Average Annual Total Returns | ||
(As of October 31, 2020) | ||
| BBG | ||
| Barclays | ||
| Net | U.S. Treasury | |
| Asset | TIPS | |
| Value | 1-10 Year | |
| Period | (NAV) | Index |
10 years | 5.04% | 2.51% |
5 years | 3.49 | 3.56 |
1 year | -4.92 | 7.00 |
| Expense Ratio | ||
(Per prospectus dated March 1, 2020) | ||
| Gross | ||
0.91% | ||

Call 1-800-225-6292 or visit www.amundipioneer.com/us for the most recent month-end performance results. Current performance may be lower or higher than the performance data quoted.
The performance data quoted represents past performance, which is no guarantee of future results. Investment return and principal value will fluctuate, and shares, when redeemed, may be worth more or less than their original cost.
The performance shown for Class K shares for the period prior to the commencement of operations of Class K shares on June 22, 2018, is the net asset value performance of the Fund’s Class A shares, which has not been restated to reflect any differences in expenses, including Rule 12b-1 fees applicable to Class A shares. Since fees for Class A shares generally are higher than those of Class K shares, the performance of Class K shares prior to their inception on June 22, 2018, would have been higher than the performance shown. For the period beginning June 22, 2018, the actual performance of Class K shares is reflected. Class K shares are not subject to sales charges and are available for limited groups of eligible investors, including institutional investors. All results are historical and assume the reinvestment of dividends and capital gains.
Performance results reflect any applicable expense waivers in effect during the periods shown. Without such waivers Fund performance would be lower. Waivers may not be in effect for all funds. Certain fee waivers are contractual through a specified period. Otherwise, fee waivers can be rescinded at any time. See the prospectus and financial statements for more information.
The performance table and graph do not reflect the deduction of fees and taxes that a shareowner would pay on Fund distributions or the redemption of Fund shares.
Please refer to the financial highlights for more current expense ratios.
14 Pioneer Flexible Opportunities Fund | Annual Report | 10/31/20
Performance Update | 10/31/20 | Class R Shares |
Investment Returns
The mountain chart on the right shows the change in value of a $10,000 investment made in Class R shares of Pioneer Flexible Opportunities Fund during the periods shown, compared to that of the Bloomberg Barclays U.S. Treasury TIPS 1–10 Year Index.
| Average Annual Total Returns | ||
(As of October 31, 2020) | ||
| BBG | ||
| Barclays | ||
| Net | U.S. Treasury | |
| Asset | TIPS | |
| Value | 1-10 Year | |
| Period | (NAV) | Index |
10 years | 4.38% | 2.51% |
5 years | 2.43 | 3.56 |
1 year | -5.90 | 7.00 |
| Expense Ratio | ||
(Per prospectus dated March 1, 2020) | ||
| Gross | ||
2.94% | ||

Call 1-800-225-6292 or visit www.amundipioneer.com/us for the most recent month-end performance results. Current performance may be lower or higher than the performance data quoted.
The performance data quoted represents past performance, which is no guarantee of future results. Investment return and principal value will fluctuate, and shares, when redeemed, may be worth more or less than their original cost.
The performance shown for Class R shares for the period prior to the commencement of operations of Class R shares on September 13, 2013, is based on the performance of Class A shares, reduced to reflect the higher distribution and service fees of Class R shares. For the period beginning September 13, 2013, the actual performance of Class R shares is reflected. Class R shares are not subject to sales charges and are available for limited groups of eligible investors, including institutional investors. All results are historical and assume the reinvestment of dividends and capital gains. Other share classes are available for which performance and expenses will differ.
Performance results reflect any applicable expense waivers in effect during the periods shown. Without such waivers Fund performance would be lower. Waivers may not be in effect for all funds. Certain fee waivers are contractual through a specified period. Otherwise, fee waivers can be rescinded at any time. See the prospectus and financial statements for more information.
The performance table and graph do not reflect the deduction of fees and taxes that a shareowner would pay on Fund distributions or the redemption of Fund shares.
Please refer to the financial highlights for more current expense ratios.
Pioneer Flexible Opportunities Fund | Annual Report | 10/31/20 15
Performance Update | 10/31/20 | Class Y Shares |
Investment Returns
The mountain chart on the right shows the change in value of a $5 million investment made in Class Y shares of Pioneer Flexible Opportunities Fund during the periods shown, compared to that of the Bloomberg Barclays U.S. Treasury TIPS 1–10 Year Index.
| Average Annual Total Returns | ||
(As of October 31, 2020) | ||
| BBG | ||
| Barclays | ||
| Net | U.S. Treasury | |
| Asset | TIPS | |
| Value | 1-10 Year | |
| Period | (NAV) | Index |
10 years | 5.27% | 2.51% |
5 years | 3.63 | 3.56 |
1 year | -4.90 | 7.00 |
| Expense Ratio | ||
(Per prospectus dated March 1, 2020) | ||
| Gross | Net | |
1.00% | 0.93% | |
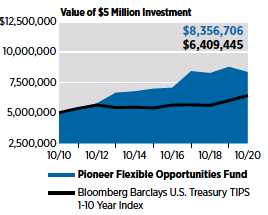
Call 1-800-225-6292 or visit www.amundipioneer.com/us for the most recent month-end performance results. Current performance may be lower or higher than the performance data quoted.
The performance data quoted represents past performance, which is no guarantee of future results. Investment return and principal value will fluctuate, and shares, when redeemed, may be worth more or less than their original cost.
Class Y shares are not subject to sales charges and are available for limited groups of eligible investors, including institutional investors. All results are historical and assume the reinvestment of dividends and capital gains. Other share classes are available for which performance and expenses will differ.
Performance results reflect any applicable expense waivers in effect during the periods shown. Without such waivers Fund performance would be lower. Waivers may not be in effect for all funds. Certain fee waivers are contractual through a specified period. Otherwise, fee waivers can be rescinded at any time. See the prospectus and financial statements for more information.
The net expense ratio reflects the contractual expense limitation currently in effect through March 1, 2021, for Class Y shares. There can be no assurance that Amundi will extend the expense limitation beyond such time. Please see the prospectus for more information.
The performance table and graph do not reflect the deduction of fees and taxes that a shareowner would pay on Fund distributions or the redemption of Fund shares.
Please refer to the financial highlights for more current expense ratios.
16 Pioneer Flexible Opportunities Fund | Annual Report | 10/31/20
As a shareowner in the Fund, you incur two types of costs:
(1) ongoing costs, including management fees, distribution and/or service (12b-1) fees, and other Fund expenses; and
(2) transaction costs, including sales charges (loads) on purchase payments.
This example is intended to help you understand your ongoing expenses (in dollars) of investing in the Fund and to compare these costs with the ongoing costs of investing in other mutual funds. The example is based on an investment of $1,000 at the beginning of the Fund’s latest six-month period and held throughout the six months.
Using the Tables
Actual Expenses
The first table below provides information about actual account values and actual expenses. You may use the information in this table, together with the amount you invested, to estimate the expenses that you paid over the period as follows:
(1) Divide your account value by $1,000
Example: an $8,600 account value ÷ $1,000 = 8.6
(2) Multiply the result in (1) above by the corresponding share class’s number in the third row under the heading entitled “Expenses Paid During Period” to estimate the expenses you paid on your account during this period.
Expenses Paid on a $1,000 Investment in Pioneer Flexible Opportunities Fund
Based on actual returns from May 1, 2020 through October 31, 2020.
| Share Class | A | C | K | R | Y |
Beginning Account | $1,000.00 | $1,000.00 | $1,000.00 | $1,000.00 | $1,000.00 |
Value on 5/1/20 | |||||
Ending Account Value | $1,083.26 | $1,079.23 | $1,085.64 | $1,078.76 | $1,086.24 |
(after expenses) on | |||||
10/31/20 | |||||
Expenses Paid | $6.28 | $10.35 | $4.72 | $9.35 | $4.72 |
During Period* |
* Expenses are equal to the Fund’s annualized expense ratio of 1.20%, 1.98%, 0.90% 1.79%, and 0.90% for Class A, Class C, Class K, Class R and Class Y shares, respectively, multiplied by the average account value over the period, multiplied by 184/366 (to reflect the partial year period).
Pioneer Flexible Opportunities Fund | Annual Report | 10/31/20 17
Hypothetical Example for Comparison Purposes
The table below provides information about hypothetical account values and hypothetical expenses based on the Fund’s actual expense ratio and an assumed rate of return of 5% per year before expenses, which is not the Fund’s actual return. The hypothetical account values and expenses may not be used to estimate the actual ending account balance or expenses you paid for the period.
You may use this information to compare the ongoing costs of investing in the Fund and other funds. To do so, compare this 5% hypothetical example with the 5% hypothetical examples that appear in the shareholder reports of the other funds.
Please note that the expenses shown in the tables are meant to highlight your ongoing costs only and do not reflect any transaction costs, such as sales charges (loads) that are charged at the time of the transaction. Therefore, the table below is useful in comparing ongoing costs only and will not help you determine the relative total costs of owning different funds. In addition, if these transaction costs were included, your costs would have been higher.
Expenses Paid on a $1,000 Investment in Pioneer Flexible Opportunities Fund
Based on a hypothetical 5% return per year before expenses, reflecting the period from May 1, 2020 through October 31, 2020.
| Share Class | A | C | K | R | Y |
Beginning Account | $1,000.00 | $1,000.00 | $1,000.00 | $1,000.00 | $1,000.00 |
Value on 5/1/20 | |||||
Ending Account Value | $1,019.10 | $1,015.18 | $1,020.61 | $1,016.14 | $1,020.61 |
(after expenses) on | |||||
10/31/20 | |||||
Expenses Paid | $6.09 | $10.03 | $4.57 | $9.07 | $4.57 |
During Period* |
* Expenses are equal to the Fund’s annualized expense ratio of 1.20%, 1.98%, 0.90% 1.79%, and 0.90% for Class A, Class C, Class K, Class R and Class Y shares, respectively, multiplied by the average account value over the period, multiplied by 184/366 (to reflect the partial year period).
18 Pioneer Flexible Opportunities Fund | Annual Report | 10/31/20
| Shares | Value | ||
| UNAFFILIATED ISSUERS — 92.5% OF NET ASSETS | |||
| COMMON STOCKS — 76.4% of Net Assets | |||
| Aerospace & Defense — 1.8% | |||
| 19,054 | Curtiss-Wright Corp. | $ 1,607,395 | |
| 13,519 | L3Harris Technologies, Inc. | 2,178,046 | |
| 6,996(a) | Teledyne Technologies, Inc. | 2,162,813 | |
| Total Aerospace & Defense | $ 5,948,254 | ||
| Air Freight & Logistics — 0.6% | |||
| 66,575 | ZTO Express Cayman, Inc. (A.D.R.) | $ 1,929,343 | |
| Total Air Freight & Logistics | $ 1,929,343 | ||
| Auto Components — 0.0%† | |||
| 13,949 | Dometic Group AB (144A) | $ 150,117 | |
| Total Auto Components | $ 150,117 | ||
| Automobiles — 1.0% | |||
| 921,000 | Geely Automobile Holdings, Ltd. | $ 1,891,095 | |
| 73,484(a) | XPeng, Inc. (A.D.R.) | 1,424,120 | |
| Total Automobiles | $ 3,315,215 | ||
| Banks — 2.2% | |||
| 125,000 | China Merchants Bank Co., Ltd., Class H | $ 649,719 | |
| 255,389 | FinecoBank Banca Fineco S.p.A. | 3,494,306 | |
| 13,541 | First Republic Bank | 1,708,062 | |
| 1,050,000 | Postal Savings Bank of China Co., Ltd., Class H (144A) | 514,616 | |
| 104,157 | Sberbank of Russia PJSC (A.D.R.) | 1,053,027 | |
| Total Banks | $ 7,419,730 | ||
| Biotechnology — 0.5% | |||
| 2,949(a) | Regeneron Pharmaceuticals, Inc. | $ 1,602,958 | |
| Total Biotechnology | $ 1,602,958 | ||
| Capital Markets — 2.4% | |||
| 41,876 | AllianceBernstein Holding LP | $ 1,216,917 | |
| 11,016 | Macquarie Group, Ltd. | 981,444 | |
| 59,233 | Morgan Stanley | 2,852,069 | |
| 4,666 | S&P Global, Inc. | 1,505,858 | |
| 116,747 | UBS Group AG | 1,355,110 | |
| Total Capital Markets | $ 7,911,398 | ||
| Chemicals — 0.4% | |||
| 65,939 | Mosaic Co. | $ 1,219,871 | |
| Total Chemicals | $ 1,219,871 | ||
| Commercial Services & Supplies — 2.3% | |||
| 469,750 | A-Living Services Co., Ltd., Class H (144A) | $ 1,969,068 | |
| 18,699 | Republic Services, Inc. | 1,648,691 | |
| 726,000(a) | S-Enjoy Service Group Co., Ltd. | 1,797,829 | |
| 487,000 | Times Neighborhood Holdings, Ltd. | 493,071 |
The accompanying notes are an integral part of these financial statements.
Pioneer Flexible Opportunities Fund | Annual Report | 10/31/20 19
Schedule of Investments | 10/31/20 (Consolidated)
(continued)
| Shares | Value | ||
| Commercial Services & Supplies — (continued) | |||
| 15,464 | Waste Management, Inc. | $ 1,668,720 | |
| Total Commercial Services & Supplies | $ 7,577,379 | ||
| Construction Materials — 0.4% | |||
| 57,987 | Buzzi Unicem S.p.A. | $ 1,254,239 | |
| Total Construction Materials | $ 1,254,239 | ||
| Consumer Discretionary — 0.9% | |||
| 3,704,000 | China New Higher Education Group, Ltd. (144A) | $ 1,925,248 | |
| 55,152(a) | Vipshop Holdings, Ltd. (A.D.R.) | 1,180,253 | |
| Total Consumer Discretionary | $ 3,105,501 | ||
| Diversified Consumer Services — 1.2% | |||
| 1,063,000 | China Education Group Holdings, Ltd. | $ 1,765,874 | |
| 2,514,000 | China Yuhua Education Corp., Ltd. (144A) | 1,987,634 | |
| 502,000(a) | JH Educational Technology, Inc. | 207,188 | |
| Total Diversified Consumer Services | $ 3,960,696 | ||
| Diversified Financial Services — 0.8% | |||
| 1,023,680 | M&G Plc | $ 1,945,365 | |
| 7,405 | Wendel SE | 641,533 | |
| Total Diversified Financial Services | $ 2,586,898 | ||
| Electric Utilities — 2.6% | |||
| 107,664 | Endesa SA | $ 2,884,749 | |
| 406,936 | Enel S.p.A. | 3,238,336 | |
| 233,469 | Iberdrola SA | 2,752,613 | |
| Total Electric Utilities | $ 8,875,698 | ||
| Electrical Equipment — 1.1% | |||
| 4,971 | Rockwell Automation, Inc. | $ 1,178,724 | |
| 113,060(a) | Siemens Energy AG | 2,475,071 | |
| Total Electrical Equipment | $ 3,653,795 | ||
| Electronic Equipment, Instruments & Components — 0.5% | |||
| 12,400 | Ibiden Co., Ltd. | $ 500,549 | |
| 8,700 | TDK Corp. | 1,014,924 | |
| Total Electronic Equipment, Instruments & Components | $ 1,515,473 | ||
| Entertainment — 0.3% | |||
| 2,100 | Nintendo Co., Ltd. | $ 1,143,247 | |
| Total Entertainment | $ 1,143,247 | ||
| Equity Real Estate Investment Trusts (REITs) — 3.3% | |||
| 602,800 | Ascendas Real Estate Investment Trust | $ 1,270,957 | |
| 1,596,882 | Frasers Logistics & Commercial Trust | 1,437,948 | |
| 1,158 | GLP J-Reit | 1,781,283 | |
| 1,145 | Industrial & Infrastructure Fund Investment Corp. | 1,942,884 | |
| 504 | Invincible Investment Corp. | 160,111 |
The accompanying notes are an integral part of these financial statements.
20 Pioneer Flexible Opportunities Fund | Annual Report | 10/31/20
| Shares | Value | ||
| Equity Real Estate Investment Trusts | |||
| (REITs) — (continued) | |||
| 689 | Kenedix Residential Next Investment Corp. | $ 1,123,702 | |
| 162,900 | Mapletree Industrial Trust | 362,543 | |
| 295,500 | Mapletree Logistics Trust | 421,849 | |
| 339 | Nippon Prologis REIT, Inc. | 1,114,183 | |
| 37,655 | Ryman Hospitality Properties, Inc. | 1,500,552 | |
| Total Equity Real Estate Investment Trusts (REITs) | $ 11,116,012 | ||
| Food & Staples Retailing — 0.6% | |||
| 8,916 | Walmart, Inc. | $ 1,237,095 | |
| 23,862 | X5 Retail Group NV (G.D.R.) | 838,511 | |
| Total Food & Staples Retailing | $ 2,075,606 | ||
| Food Products — 2.1% | |||
| 47,883 | Archer-Daniels-Midland Co. | $ 2,214,110 | |
| 1,152,000 | China Feihe, Ltd. (144A) | 2,612,053 | |
| 11,596 | Kraft Heinz Co. | 354,722 | |
| 3,006 | Nestle SA | 337,933 | |
| 752,000 | Tingyi Cayman Islands Holding Corp. | 1,373,383 | |
| Total Food Products | $ 6,892,201 | ||
| Gas Utilities — 1.8% | |||
| 530,413 | Italgas S.p.A. | $ 3,064,727 | |
| 618,395 | Snam S.p.A. | 3,017,177 | |
| Total Gas Utilities | $ 6,081,904 | ||
| Health Care — 0.8% | |||
| 13,928(a) | Laboratory Corp. of America Holdings | $ 2,782,397 | |
| Total Health Care | $ 2,782,397 | ||
| Health Care Equipment & Supplies — 2.4% | |||
| 15,075 | Danaher Corp. | $ 3,460,316 | |
| 6,394(a) | IDEXX Laboratories, Inc. | 2,716,299 | |
| 999(a) | Intuitive Surgical, Inc. | 666,413 | |
| 3,385 | Medtronic Plc | 340,429 | |
| 4,125 | Stryker Corp. | 833,291 | |
| Total Health Care Equipment & Supplies | $ 8,016,748 | ||
| Health Care Providers & Services — 1.1% | |||
| 5,854 | Humana, Inc. | $ 2,337,385 | |
| 4,915 | UnitedHealth Group, Inc. | 1,499,763 | |
| Total Health Care Providers & Services | $ 3,837,148 | ||
| Health Care Technology — 0.3% | |||
| 398,000(a) | Alibaba Health Information Technology, Ltd. | $ 1,039,486 | |
| Total Health Care Technology | $ 1,039,486 | ||
| Hotels, Restaurants & Leisure — 0.8% | |||
| 12,476 | Marriott International, Inc. | $ 1,158,771 |
The accompanying notes are an integral part of these financial statements.
Pioneer Flexible Opportunities Fund | Annual Report | 10/31/20 21
Schedule of Investments | 10/31/20 (Consolidated)
(continued)
| Shares | Value | ||
| Hotels, Restaurants & Leisure — (continued) | |||
| 6,859 | Vail Resorts, Inc. | $ 1,591,562 | |
| Total Hotels, Restaurants & Leisure | $ 2,750,333 | ||
| Household Durables — 1.4% | |||
| 52,721 | Barratt Developments PLC | $ 329,637 | |
| 76,535 | Persimmon Plc | 2,316,795 | |
| 26,200 | Sony Corp. | 2,171,297 | |
| Total Household Durables | $ 4,817,729 | ||
| Independent Power & Renewable Electricity | |||
| Producers — 0.8% | |||
| 96,344 | EDP Renovaveis SA | $ 1,830,904 | |
| 1,762,000 | Xinyi Energy Holdings, Ltd. | 906,754 | |
| Total Independent Power & Renewable | |||
| Electricity Producers | $ 2,737,658 | ||
| Industrial Conglomerates — 0.2% | |||
| 4,118 | Honeywell International, Inc. | $ 679,264 | |
| Total Industrial Conglomerates | $ 679,264 | ||
| Industrials — 0.8% | |||
| 9,112 | Teleperformance | $ 2,734,318 | |
| Total Industrials | $ 2,734,318 | ||
| Information Technology — 2.5% | |||
| 49,307 | eBay, Inc. | $ 2,348,492 | |
| 8,190 | Lam Research Corp. | 2,801,635 | |
| 65,277 | Samsung Electronics Co., Ltd. | 3,246,713 | |
| Total Information Technology | $ 8,396,840 | ||
| Insurance — 3.1% | |||
| 21,041 | Ageas SA | $ 846,516 | |
| 5,388 | Allianz SE | 947,759 | |
| 62,182 | ASR Nederland NV | 1,889,844 | |
| 99,723 | NN Group NV | 3,476,706 | |
| 276,147 | Poste Italiane S.p.A. (144A) | 2,250,916 | |
| 3,007 | Swiss Life Holding AG | 1,010,530 | |
| Total Insurance | $ 10,422,271 | ||
| Interactive Media & Services — 0.8% | |||
| 4,192 | NAVER Corp. | $ 1,068,284 | |
| 17,700 | Tencent Holdings, Ltd. | 1,349,184 | |
| 5,716(a) | Yandex NV | 329,070 | |
| Total Interactive Media & Services | $ 2,746,538 | ||
| Internet & Direct Marketing Retail — 3.6% | |||
| 64,400(a) | Alibaba Group Holding, Ltd. | $ 2,435,345 | |
| 1,104(a) | Amazon.com, Inc. | 3,351,910 | |
| 60,470(a) | Dada Nexus, Ltd. (A.D.R.) | 1,996,115 |
The accompanying notes are an integral part of these financial statements.
22 Pioneer Flexible Opportunities Fund | Annual Report | 10/31/20
| Shares | Value | ||
| Internet & Direct Marketing Retail — (continued) | |||
| 88,900(a) | JD.com, Inc. | $ 3,614,087 | |
| 410,800(a) | Tongcheng-Elong Holdings, Ltd. | 681,368 | |
| Total Internet & Direct Marketing Retail | $ 12,078,825 | ||
| IT Services — 1.8% | |||
| 32,788 | Booz Allen Hamilton Holding Corp. | $ 2,573,858 | |
| 34,521 | Science Applications International Corp. | 2,636,369 | |
| 132,000(a) | Yeahka, Ltd. | 701,426 | |
| Total IT Services | $ 5,911,653 | ||
| Leisure Products — 0.1% | |||
| 1,800 | Shimano, Inc. | $ 408,704 | |
| Total Leisure Products | $ 408,704 | ||
| Life Sciences Tools & Services — 3.4% | |||
| 33,872 | Agilent Technologies, Inc. | $ 3,457,993 | |
| 9,156(a) | Charles River Laboratories International, Inc. | 2,084,821 | |
| 12,183 | Thermo Fisher Scientific, Inc. | 5,764,021 | |
| Total Life Sciences Tools & Services | $ 11,306,835 | ||
| Machinery — 1.3% | |||
| 58,000 | Airtac International Group | $ 1,556,775 | |
| 100,945 | Volvo AB, Class B | 1,962,667 | |
| 1,136,400 | Zoomlion Heavy Industry Science & Technology Co., Ltd., | ||
Class H | 1,001,066 | ||
| Total Machinery | $ 4,520,508 | ||
| Materials — 0.6% | |||
| 1,500 | LG Chem, Ltd. | $ 805,378 | |
| 1,747 | Sherwin-Williams Co. | 1,201,901 | |
| Total Materials | $ 2,007,279 | ||
| Metals & Mining — 1.4% | |||
| 24,762 | Anglo American Platinum, Ltd. | $ 1,621,114 | |
| 55,773 | MMC Norilsk Nickel PJSC (A.D.R.) | 1,324,609 | |
| 141,692 | Teck Resources, Ltd., Class B | 1,861,833 | |
| Total Metals & Mining | $ 4,807,556 | ||
| Mortgage Real Estate Investment Trusts (REITs) — 7.2% | |||
| 320,638 | AGNC Investment Corp. | $ 4,479,313 | |
| 528,448 | Annaly Capital Management, Inc. | 3,746,696 | |
| 239,887 | New Residential Investment Corp. | 1,799,153 | |
| 313,871 | PennyMac Mortgage Investment Trust | 4,698,649 | |
| 554,348 | Redwood Trust, Inc. | 4,711,958 | |
| 70,014 | Starwood Property Trust, Inc. | 978,096 | |
| 731,607 | Two Harbors Investment Corp. | 3,701,931 | |
| Total Mortgage Real Estate Investment Trusts (REITs) | $ 24,115,796 |
The accompanying notes are an integral part of these financial statements.
Pioneer Flexible Opportunities Fund | Annual Report | 10/31/20 23
Schedule of Investments | 10/31/20 (Consolidated)
(continued)
| Shares | Value | ||
| Multi-Utilities — 1.0% | |||
| 94,693 | RWE AG | $ 3,505,333 | |
| Total Multi-Utilities | $ 3,505,333 | ||
| Pharmaceuticals — 2.4% | |||
| 22,979 | Johnson & Johnson | $ 3,150,651 | |
| 24,332 | Novartis AG | 1,896,734 | |
| 19,108 | Zoetis, Inc. | 3,029,573 | |
| Total Pharmaceuticals | $ 8,076,958 | ||
| Real Estate Management & Development — 2.9% | |||
| 185,900 | Ascendas India Trust | $ 176,925 | |
| 84,000 | China Resources Land, Ltd. | 341,814 | |
| 319,000(a) | KWG Living Group Holdings, Ltd. | 250,152 | |
| 454,000 | Logan Group Co., Ltd. | 709,691 | |
| 671,000 | Longfor Group Holdings, Ltd. (144A) | 3,665,106 | |
| 7,543 | PSP Swiss Property AG | 912,135 | |
| 204,500 | Sichuan Languang Justbon Services Group Co., Ltd., | ||
Class H | 953,481 | ||
| 180,400 | UOL Group, Ltd. | 821,471 | |
| 26,375 | Vonovia SE | 1,683,652 | |
| Total Real Estate Management & Development | $ 9,514,427 | ||
| Road & Rail — 1.0% | |||
| 2,796 | Canadian Pacific Railway, Ltd. | $ 836,367 | |
| 31,342 | CSX Corp. | 2,474,138 | |
| Total Road & Rail | $ 3,310,505 | ||
| Semiconductors & Semiconductor Equipment — 0.7% | |||
| 50,500 | Micronics Japan Co., Ltd. | $ 496,484 | |
| 112,000 | Taiwan Semiconductor Manufacturing Co., Ltd. | 1,690,980 | |
| Total Semiconductors & Semiconductor Equipment | $ 2,187,464 | ||
| Software — 2.2% | |||
| 6,850(a) | Adobe, Inc. | $ 3,062,635 | |
| 14,068 | Microsoft Corp. | 2,848,348 | |
| 14,640(a) | Zendesk, Inc. | 1,624,162 | |
| Total Software | $ 7,535,145 | ||
| Specialty Retail — 3.3% | |||
| 1,054,000 | China Meidong Auto Holdings, Ltd. | $ 4,302,540 | |
| 931,000 | China Yongda Automobiles Services Holdings, Ltd. | 1,316,045 | |
| 5,254 | Home Depot, Inc. | 1,401,294 | |
| 8,226 | Lowe’s Cos., Inc. | 1,300,531 | |
| 405,500 | Zhongsheng Group Holdings, Ltd. | 2,881,728 | |
| Total Specialty Retail | $ 11,202,138 |
The accompanying notes are an integral part of these financial statements.
24 Pioneer Flexible Opportunities Fund | Annual Report | 10/31/20
| Shares | Value | ||
| Textiles, Apparel & Luxury Goods — 0.5% | |||
| 3,593 | LVMH Moet Hennessy Louis Vuitton SE | $ 1,683,170 | |
| Total Textiles, Apparel & Luxury Goods | $ 1,683,170 | ||
| Trading Companies & Distributors — 1.1% | |||
| 83,500 | Mitsubishi Corp. | $ 1,855,245 | |
| 114,400 | Mitsui & Co., Ltd. | 1,781,608 | |
| Total Trading Companies & Distributors | $ 3,636,853 | ||
| Utilities — 0.1% | |||
| 236,000 | Guangdong Investment, Ltd. | $ 349,434 | |
| Total Utilities | $ 349,434 | ||
| TOTAL COMMON STOCKS | |||
(Cost $237,340,498) | $256,454,848 | ||
| PREFERRED STOCKS — 1.1% of Net Assets | |||
| Equity Real Estate Investment Trusts (REITs) — 0.2% | |||
| 37,496(b) | Pebblebrook Hotel Trust, 6.3% | $ 783,292 | |
| 204^(a) | Wheeler Real Estate Investment Trust, Inc. | 80,255 | |
| Total Equity Real Estate Investment Trusts (REITs) | $ 863,547 | ||
| Mortgage Real Estate Investment Trusts (REITs) — 0.9% | |||
| 74,936(b)(c) | AGNC Investment Corp., 6.125% (3 Month USD | ||
| LIBOR + 470 bps) | $ 1,622,364 | ||
| 54,705(b)(c) | AGNC Investment Corp., 7.0% (3 Month USD | ||
| LIBOR + 511 bps) | 1,250,009 | ||
| Total Mortgage Real Estate Investment Trusts (REITs) | $ 2,872,373 | ||
| TOTAL PREFERRED STOCKS | |||
(Cost $2,896,375) | $ 3,735,920 | ||
| Principal | |||
| Amount USD ($) | |||
| CORPORATE BONDS — 4.9% of Net Assets | |||
| Banks — 1.0% | |||
| 3,216,000(b)(c) | Intesa Sanpaolo S.p.A., 7.7% (5 Year USD Swap | ||
| Rate + 546 bps) (144A) | $ 3,392,880 | ||
| Total Banks | $ 3,392,880 | ||
| Chemicals — 0.6% | |||
| 1,800,000(d) | Braskem Finance, Ltd., 6.45%, 2/3/24 | $ 1,919,250 | |
| Total Chemicals | $ 1,919,250 | ||
| Mining — 1.8% | |||
| 1,142,000 | Gold Fields Orogen Holdings BVI, Ltd., 5.125%, | ||
| 5/15/24 (144A) | $ 1,246,744 | ||
| 3,170,000 | Gold Fields Orogen Holdings BVI, Ltd., 6.125%, | ||
| 5/15/29 (144A) | 3,772,300 | ||
| 1,039,000 | Teck Resources, Ltd., 6.125%, 10/1/35 | 1,204,382 | |
| Total Mining | $ 6,223,426 | ||
The accompanying notes are an integral part of these financial statements.
Pioneer Flexible Opportunities Fund | Annual Report | 10/31/20 25
Schedule of Investments | 10/31/20 (Consolidated)
(continued)
Principal | ||||
Amount USD ($) | Value | |||
| Telecommunications — 1.5% | ||||
| 4,400,000 | CenturyLink, Inc., 7.65%, 3/15/42 | $ 4,917,000 | ||
| Total Telecommunications | $ 4,917,000 | |||
| TOTAL CORPORATE BONDS | ||||
(Cost $14,658,165) | $ 16,452,556 | |||
| FOREIGN GOVERNMENT BONDS — 1.0% | ||||
| of Net Assets | ||||
| Russia — 1.0% | ||||
| RUB | 118,184,000 | Russian Federal Bond - OFZ, 7.7%, 3/16/39 | $ 1,690,776 | |
| RUB | 122,159,000 | Russian Federal Bond - OFZ, 8.15%, 2/3/27 | 1,740,273 | |
| Total Russia | $ 3,431,049 | |||
| TOTAL FOREIGN GOVERNMENT BONDS | ||||
(Cost $3,517,438) | $ 3,431,049 | |||
| U.S. GOVERNMENT AND AGENCY | ||||
| OBLIGATIONS — 2.4% of Net Assets | ||||
| 3,000,000(e) | U.S. Treasury Bills, 11/12/20 | $ 2,999,940 | ||
| 5,000,000(e) | U.S. Treasury Bills, 11/17/20 | 4,999,850 | ||
| TOTAL U.S. GOVERNMENT AND AGENCY OBLIGATIONS | ||||
(Cost $7,999,768) | $ 7,999,790 | |||
Shares | ||||
| INVESTMENT COMPANIES — 6.3% of Net Assets | ||||
| 18,731(a)(d) | Aberdeen Standard Physical Palladium Shares ETF | $ 3,892,864 | ||
| SGD | 111,760(a) | CSOP FTSE Chinese Government Bond Index ETF | 1,127,459 | |
| 300,722 | ETFMG Prime Cyber Security ETF | 13,547,526 | ||
| 15,300 | KraneShares CSI China Internet ETF | 1,098,999 | ||
| 102,757 | VanEck Vectors Vietnam ETF | 1,514,639 | ||
| TOTAL INVESTMENT COMPANIES | ||||
(Cost $19,287,637) | $ 21,181,487 | |||
| RIGHTS/WARRANTS — 0.0%† of Net Assets | ||||
| Equity Real Estate Investment Trusts (REITs) — 0.0%† | ||||
| SGD | 5,614(a) | Mapletree Logistics Trust, Class R, 11/10/20 | $ — | |
| Total Equity Real Estate Investment Trusts (REITs) | $ — | |||
| Pharmaceuticals — 0.0%† | ||||
| 19,289(a) | Bristol-Myers Squibb Co., 3/31/21 | $ 62,883 | ||
| Total Pharmaceuticals | $ 62,883 | |||
| TOTAL RIGHTS/WARRANTS | ||||
(Cost $78) | $ 62,883 | |||
The accompanying notes are an integral part of these financial statements.
26 Pioneer Flexible Opportunities Fund | Annual Report | 10/31/20
| Number of | Strike | Expiration | ||||||
| Contracts | Description | Notional | Price | Date | Value | |||
| EXCHANGE-TRADED CALL OPTIONS | ||||||||
| PURCHASED — 0.1% | ||||||||
| 162 | Japanese Yen Futures | USD 172,034 | USD 97 | 12/4/20 | $ 95,175 | |||
| 3,000 | Pfizer, Inc. | USD 437,953 | USD 39 | 1/15/21 | 328,500 | |||
| $ 423,675 | ||||||||
| TOTAL EXCHANGE-TRADED CALL | ||||||||
| OPTIONS PURCHASED | ||||||||
(Premiums paid $609,987) | $ 423,675 | |||||||
| OVER THE COUNTER (OTC) CALL OPTIONS | ||||||||
| PURCHASED — 0.3% | ||||||||
| 572,975 | MSCI | Citibank NA | HKD 327,518 | HKD 108 | 1/28/21 | $ 224,591 | ||
| China ETF | ||||||||
| 967,720 | MSCI | Citibank NA | HKD 19,990 | HKD 109 | 1/28/21 | 238,514 | ||
| China Index | ||||||||
| 82,355 | Nikkei | Citibank NA | JPY 579,124 | JPY 24,546 | 3/12/21 | 364,398 | ||
| 225 Index | ||||||||
| $ 827,503 | ||||||||
| TOTAL OVER THE COUNTER (OTC) CALL | ||||||||
| OPTIONS PURCHASED | ||||||||
(Premiums paid $1,426,632) | $ 827,503 | |||||||
| OVER THE COUNTER (OTC) PUT OPTION | ||||||||
| PURCHASED — 0.0%† | ||||||||
| 2,990 | NASDAQ | Citibank NA | USD 1,870,566 | USD 9,045 | 11/20/20 | $ 85,962 | ||
100 Index | ||||||||
| TOTAL OVER THE COUNTER (OTC) PUT | �� | |||||||
| OPTION PURCHASED | ||||||||
(Premiums paid $1,870,566) | $ 85,962 | |||||||
| TOTAL OPTIONS PURCHASED | ||||||||
(Premiums paid $3,907,185) | $ 1,337,140 | |||||||
| TOTAL INVESTMENTS IN UNAFFILIATED | ||||||||
| ISSUERS — 92.5% | ||||||||
(Cost $289,607,144) | $310,655,673 | |||||||
| OTHER ASSETS AND LIABILITIES — 7.5% | $ 25,060,312 | |||||||
| NET ASSETS — 100.0% | $335,715,985 | |||||||
bps | Basis Points. |
LIBOR | London Interbank Offered Rate. |
REIT | Real Estate Investment Trust. |
(144A) | Security is exempt from registration under Rule 144A of the Securities Act of 1933. Such |
securities may be resold normally to qualified institutional buyers in a transaction exempt | |
from registration. At October 31, 2020, the value of these securities amounted to | |
$23,486,682, or 7.0% of net assets. |
The accompanying notes are an integral part of these financial statements.
Pioneer Flexible Opportunities Fund | Annual Report | 10/31/20 27
Schedule of Investments | 10/31/20 (Consolidated)
(continued)
(A.D.R.) | American Depositary Receipts. |
(G.D.R.) | Global Depositary Receipts. |
† | Amount rounds to less than 0.1%. |
^ | Security is valued using fair value methods (other than supplied by independent pricing |
services). | |
(a) | Non-income producing security. |
(b) | Security is perpetual in nature and has no stated maturity date. |
(c) | The interest rate is subject to change periodically. The interest rate and/or reference |
index and spread shown at October 31, 2020. | |
(d) | All or a portion of this security is held by Flexible Opportunities Commodity Fund Ltd. |
(e) | Security issued with a zero coupon. Income is recognized through accretion of discount. |
FUTURES CONTRACTS
CURRENCY FUTURES CONTRACT
CURRENCY FUTURES CONTRACT
| Number of | |||||
| Contracts | Expiration | Notional | Market | Unrealized | |
| Short | Description | Date | Amount | Value | Appreciation |
66 | Euro FX | 12/14/20 | $ (9,742,031) | $ (9,615,375) | $126,656 |
| INDEX FUTURES CONTRACT |
| Number of | |||||
| Contracts | Expiration | Notional | Market | Unrealized | |
| Short | Description | Date | Amount | Value | Appreciation |
251 | Euro Stoxx 50 | 12/18/20 | $ (9,284,230) | $ (8,648,475) | $ 635,755 |
| TOTAL FUTURES CONTRACTS | $ (19,026,261) | $ (18,263,850) | $ 762,411 | ||
SWAP CONTRACTS
OVER THE COUNTER (OTC) TOTAL RETURN SWAP CONTRACTS — SELL PROTECTION
| Obligation | |||||||
| Notional | Reference/ | Pay/ | Expiration | Unrealized | Market | ||
Amount(1) | Counterparty | Index | Receive(2) | Coupon | Date | Depreciation | Value |
| 3,862,931 | Citibank NA | Citibank Total | Pay | 3M LIBOR | 8/10/21 | $(320,670) | $(320,670) |
| Return Index*- | + 3bps | ||||||
| 7,171,192 | Goldman Sachs | Goldman Sachs | Pay | 3M LIBOR | 9/15/21 | (265,762) | (265,762) |
International | Total Cash | + 39bps | |||||
Return Index* | |||||||
| TOTAL SWAP CONTRACTS | $(586,432) | $(586,432) | |||||
(1) The notional amount is the maximum amount that a seller of credit protection would be obligated to pay upon occurrence of a credit event.
(2) Pays quarterly.
The accompanying notes are an integral part of these financial statements.
28 Pioneer Flexible Opportunities Fund | Annual Report | 10/31/20
Principal amounts are denominated in U.S. dollars (“USD”) unless otherwise noted.
EUR — Euro
HKD — Hong Kong Dollar
JPY — Japanese Yen
RUB — Russian Ruble
SGD — Singapore Dollar
* The following table shows the individual positions and related values of the securities underlying each total return swap contract with Citibank, as of October 31, 2020:
| Share | Security | |||
| Name | Allocation | Value | % of basket | |
DiamondRock Hospitality Co. | 12,500 | $ (61,752) | 19.26% | |
Hersha Hospitality Trust | 9,869 | (48,357) | 15.07% | |
Marriott International, Inc. | 720 | (66,851) | 20.85% | |
Pebblebrook Hotel Trust | 5,677 | (68,009) | 21.21% | |
Ryman Hospitality Properties, Inc. | 1,900 | (75,701) | 23.61% | |
| Totals | $(320,670) | 100.00% |
* The following table shows the individual positions and related values of the securities underlying each total return swap contract with Goldman Sachs International, as of October 31, 2020:
| Share | Security | |||
| Name | Allocation | Value | % of basket | |
AbbVie, Inc. | 73 | $ (6,205) | 2.34% | |
AES Corp. | 425 | (8,290) | 3.12% | |
American Airlines Group, Inc. | 113 | (1,273) | 0.48% | |
American International Group, Inc. | 79 | (2,486) | 0.94% | |
Ameriprise Financial, Inc. | 38 | (6,049) | 2.28% | |
AmerisourceBergen Corp. | 59 | (5,630) | 2.12% | |
Apple, Inc. | 134 | (14,576) | 5.48% | |
Applied Materials, Inc. | 118 | (7,013) | 2.64% | |
Archer-Daniels-Midland Co. | 105 | (4,860) | 1.83% | |
Assurant, Inc. | 50 | (6,214) | 2.34% | |
Boeing Co. | 26 | (3,757) | 1.41% | |
Capital One Financial Corp. | 60 | (4,372) | 1.65% | |
Capri Holdings, Ltd. | 129 | (2,733) | 1.03% | |
CenturyLink, Inc. | 187 | (1,615) | 0.61% | |
Cigna Corp. | 19 | (3,186) | 1.20% | |
Corning, Inc. | 167 | (5,329) | 2.01% | |
DENTSPLY SIRONA, Inc. | 76 | (3,588) | 1.35% | |
Discover Financial Services | 77 | (4,995) | 1.88% | |
eBay, Inc. | 144 | (6,855) | 2.58% | |
Equity Residential | 74 | (3,498) | 1.32% | |
F5 Networks, Inc. | 37 | (4,950) | 1.86% | |
General Electric Co. | 166 | (1,231) | 0.46% | |
Gilead Sciences, Inc. | 70 | (4,079) | 1.53% | |
HCA Healthcare, Inc. | 57 | (7,077) | 2.66% |
The accompanying notes are an integral part of these financial statements.
Pioneer Flexible Opportunities Fund | Annual Report | 10/31/20 29
Schedule of Investments | 10/31/20 (Consolidated)
(continued)
| Share | Security | |||
| Name | Allocation | Value | % of basket | |
HP, Inc. | 256 | $ (4,589) | 1.73% | |
LyondellBasell Industries NV | 57 | (3,883) | 1.46% | |
McDonald’s Corp. | 34 | (7,320) | 2.75% | |
Monster Beverage Corp. | 106 | (8,114) | 3.05% | |
Motorola Solutions, Inc. | 56 | (8,841) | 3.33% | |
Navient Corp. | 316 | (2,534) | 0.95% | |
NetApp, Inc. | 121 | (5,296) | 1.99% | |
NRG Energy, Inc. | 285 | (8,997) | 3.39% | |
ONEOK, Inc. | 91 | (2,651) | 1.00% | |
Procter & Gamble Co. | 55 | (7,549) | 2.84% | |
PulteGroup, Inc. | 212 | (8,646) | 3.25% | |
Qorvo, Inc. | 71 | (9,002) | 3.39% | |
Quest Diagnostics, Inc. | 46 | (5,567) | 2.09% | |
Seagate Technology Plc | 114 | (5,458) | 2.05% | |
Sysco Corp. | 91 | (5,031) | 1.89% | |
Target Corp. | 86 | (13,106) | 4.93% | |
TransDigm Group, Inc. | 19 | (9,304) | 3.50% | |
Tyson Foods, Inc. | 75 | (4,283) | 1.61% | |
United Airlines Holdings, Inc. | 68 | (2,319) | 0.87% | |
Valero Energy Corp. | 74 | (2,874) | 1.08% | |
Viacom CBS, Inc. | 72 | (2,064) | 0.78% | |
Western Union Co. | 242 | (4,707) | 1.77% | |
Westinghouse Air Brake Technologies Corp. | 1 | (53) | 0.02% | |
Weyerhaeuser Co. | 142 | (3,874) | 1.46% | |
Williams Cos., Inc. | 157 | (3,013) | 1.13% | |
Yum! Brands, Inc. | 73 | (6,826) | 2.57% | |
| Totals | $(265,762) | 100.00% |
Purchases and sales of securities (excluding temporary cash investments) for the year ended October 31, 2020, aggregated $902,335,989 and $1,025,700,648, respectively.
The Fund is permitted to engage in purchase and sale transactions (“cross trades”) with certain funds and accounts for which Amundi Pioneer Asset Management, Inc. (the “Adviser”) serves as the Fund’s investment adviser, as set forth in Rule 17a-7 under the Investment Company Act of 1940, pursuant to procedures adopted by the Board of Trustees. Under these procedures, cross trades are effected at current market prices. During the year ended October 31, 2020, the Fund did not engage in any cross trade activity.
At October 31, 2020, the net unrealized appreciation on investments based on cost for federal tax purposes of $294,832,627 was as follows:
| Aggregate gross unrealized appreciation for all investments in which | ||||
| there is an excess of value over tax cost | $ | 37,014,219 | ||
| Aggregate gross unrealized depreciation for all investments in which | ||||
| there is an excess of tax cost over value | (21,015,194 | ) | ||
| Net unrealized appreciation | $ | 15,999,025 | ||
The accompanying notes are an integral part of these financial statements.
30 Pioneer Flexible Opportunities Fund | Annual Report | 10/31/20
Various inputs are used in determining the value of the Fund’s investments. These inputs are summarized in the three broad levels below.
Level 1 – quoted prices in active markets for identical securities.
Level 2 – other significant observable inputs (including quoted prices for similar securities, interest rates, prepayment speeds, credit risks, etc.). See Notes to Financial Statements — Note 1A.
Level 3 – significant unobservable inputs (including the Fund’s own assumptions in determining fair value of investments). See Notes to Financial Statements — Note 1A.
The following is a summary of the inputs used as of October 31, 2020, in valuing the Fund’s investments:
| Level 1 | Level 2 | Level 3 | Total | |||||||||||||
Common Stocks | ||||||||||||||||
| Food & Staples Retailing | $ | 2,075,606 | $ | — | $ | — | $ | 2,075,606 | ||||||||
| All Other Common Stocks | 254,379,242 | — | — | 254,379,242 | ||||||||||||
Preferred Stocks | ||||||||||||||||
| Equity Real Estate | ||||||||||||||||
| Investment Trusts (REITs) | 783,292 | — | 80,255 | 863,547 | ||||||||||||
| All Other Preferred Stocks | 2,872,373 | — | — | 2,872,373 | ||||||||||||
Corporate Bonds | — | 16,452,556 | — | 16,452,556 | ||||||||||||
Foreign Government Bonds | — | 3,431,049 | — | 3,431,049 | ||||||||||||
U.S. Government and | ||||||||||||||||
| Agency Obligations | — | 7,999,790 | — | 7,999,790 | ||||||||||||
Investment Companies | 21,181,487 | — | — | 21,181,487 | ||||||||||||
Rights/Warrants | ||||||||||||||||
| Equity Real Estate | ||||||||||||||||
| Investment Trusts (REITs) | — | — | * | — | — | * | ||||||||||
| All Other Right/Warrant | 62,883 | — | — | 62,883 | ||||||||||||
Exchange-Traded Call | ||||||||||||||||
| Option Purchased | 423,675 | — | — | 423,675 | ||||||||||||
Over The Counter (OTC) | ||||||||||||||||
| Call Option Purchased | — | 827,503 | — | 827,503 | ||||||||||||
Over The Counter (OTC) | ||||||||||||||||
| Put Option Purchased | — | 85,962 | — | 85,962 | ||||||||||||
| Total Investments | ||||||||||||||||
| in Securities | $ | 281,778,558 | $ | 28,796,860 | $ | 80,255 | $ | 310,655,673 | ||||||||
| Other Financial Instruments | ||||||||||||||||
| Net unrealized appreciation | ||||||||||||||||
| on futures contracts | $ | 762,411 | $ | — | $ | — | $ | 762,411 | ||||||||
| Swap contracts, at value | — | (586,432 | ) | — | (586,432 | ) | ||||||||||
| Total Other | ||||||||||||||||
| Financial Instruments | $ | 762,411 | $ | (586,432 | ) | $ | — | $ | 175,979 | |||||||
* Securities valued at $0.
The accompanying notes are an integral part of these financial statements.
Pioneer Flexible Opportunities Fund | Annual Report | 10/31/20 31
Schedule of Investments | 10/31/20 (Consolidated)
(continued)
The following is a reconciliation of assets valued using significant unobservable inputs (Level 3):
| Preferred | ||||
| Stock | ||||
Balance as of 10/31/19 | $ | 95,372 | ||
Realized gain (loss)(1) | — | |||
Changed in unrealized appreciation (depreciation)(2) | (15,117 | ) | ||
Accrued discounts/premiums | — | |||
Purchases | — | |||
Sales | — | |||
Transfers in to Level 3* | — | |||
Transfers out of Level 3* | — | |||
| Balance as of 10/31/20 | $ | 80,255 | ||
(1) | Realized gain (loss) on these securities is included in the realized gain (loss) from investments on |
the Statement of Operations (Consolidated). | |
(2) | Unrealized appreciation (depreciation) on these securities is included in the change in unrealized |
appreciation (depreciation) from investments on the Statement of Operations (Consolidated). | |
* | Transfers are calculated on the beginning of period values. During the year ended October 31, |
2020 there were no transfers between Levels 1, 2 and 3. |
Net change in unrealized appreciation (depreciation) of Level 3 investments still | ||||
held and considered Level 3 at October 31, 2020: | $ | (15,117 | ) | |
The accompanying notes are an integral part of these financial statements.
32 Pioneer Flexible Opportunities Fund | Annual Report | 10/31/20
(Consolidated)
| ASSETS: | ||||
| Investments in unaffiliated issuers, at value (cost $289,607,144) | $ | 310,655,673 | ||
| Cash | 27,672,796 | |||
| Foreign currencies, at value (cost $2,485,133) | 2,587,928 | |||
| Futures collateral | 1,424,800 | |||
| Net unrealized appreciation on futures contracts | 762,411 | |||
| Receivables — | ||||
| Investment securities sold | 6,516,065 | |||
| Fund shares sold | 107,755 | |||
| Dividends | 987,009 | |||
| Interest | 260,658 | |||
| Due from the Adviser | 105,141 | |||
| Other assets | 146,242 | |||
| Total assets | $ | 351,226,478 | ||
| LIABILITIES: | ||||
| Payables — | ||||
| Investment securities purchased | $ | 13,477,943 | ||
| Fund shares repurchased | 588,893 | |||
| Trustees’ fees | 2,240 | |||
| Swaps collateral | 349,999 | |||
| Due to broker for futures | 104,977 | |||
| Variation margin for futures contracts | 6,953 | |||
| Swap contracts, at value | 586,432 | |||
| Due to affiliates | 150,215 | |||
| Accrued expenses | 242,841 | |||
| Total liabilities | $ | 15,510,493 | ||
| NET ASSETS: | ||||
| Paid-in capital | $ | 381,094,080 | ||
| Distributable earnings (loss) | (45,378,095 | ) | ||
| Net assets | $ | 335,715,985 | ||
| NET ASSET VALUE PER SHARE: | ||||
No par value (unlimited number of shares authorized) | ||||
| Class A (based on $79,089,214/7,099,210 shares) | $ | 11.14 | ||
| Class C (based on $48,426,001/4,461,280 shares) | $ | 10.85 | ||
| Class K (based on $104,315,509/9,365,147 shares) | $ | 11.14 | ||
| Class R (based on $187,209/16,982 shares) | $ | 11.02 | ||
| Class Y (based on $103,698,052/9,262,271 shares) | $ | 11.20 | ||
| MAXIMUM OFFERING PRICE PER SHARE: | ||||
| Class A (based on $11.14 net asset value per share/100%-4.50% | ||||
| maximum sales charge) | $ | 11.66 | ||
The accompanying notes are an integral part of these financial statements.
Pioneer Flexible Opportunities Fund | Annual Report | 10/31/20 33
Statement of Operations (Consolidated)
FOR THE YEAR ENDED 10/31/20
| INVESTMENT INCOME: | ||||||||
| Dividends from unaffiliated issuers (net of foreign | ||||||||
| taxes withheld $631,188) | $ | 9,912,049 | ||||||
| Interest from unaffiliated issuers (net of foreign | ||||||||
| taxes withheld $5,179) | 1,382,908 | |||||||
| Total investment income | $ | 11,294,957 | ||||||
| EXPENSES: | ||||||||
| Management fees | $ | 2,900,867 | ||||||
| Administrative expense | 161,068 | |||||||
| Transfer agent fees | ||||||||
| Class A | 64,390 | |||||||
| Class C | 56,644 | |||||||
| Class K | 104 | |||||||
| Class R | 453 | |||||||
| Class Y | 129,075 | |||||||
| Distribution fees | ||||||||
| Class A | 217,583 | |||||||
| Class C | 674,552 | |||||||
| Class R | 812 | |||||||
| Shareowner communications expense | 44,231 | |||||||
| Custodian fees | 325,347 | |||||||
| Registration fees | 84,108 | |||||||
| Professional fees | 110,530 | |||||||
| Printing expense | 68,357 | |||||||
| Pricing fees | 3,212 | |||||||
| Trustees’ fees | 18,947 | |||||||
| Insurance expense | 6,636 | |||||||
| Miscellaneous | 121,775 | |||||||
| Total expenses | $ | 4,988,691 | ||||||
| Less fees waived and expenses reimbursed by the Adviser | (265,971 | ) | ||||||
| Net expenses | $ | 4,722,720 | ||||||
| Net investment income | $ | 6,572,237 | ||||||
| REALIZED AND UNREALIZED GAIN (LOSS) ON INVESTMENTS: | ||||||||
| Net realized gain (loss) on: | ||||||||
| Investments in unaffiliated issuers | $ | (4,623,375 | ) | |||||
| Forward foreign currency exchange contracts | 2,241 | |||||||
| Futures contracts | (1,081,839 | ) | ||||||
| Swap contracts | (1,658,474 | ) | ||||||
| Other assets and liabilities denominated | ||||||||
| in foreign currencies | (492,674 | ) | $ | (7,854,121 | ) | |||
| Change in net unrealized appreciation (depreciation) on: | ||||||||
| Investments in unaffiliated issuers | $ | (28,013,262 | ) | |||||
| Futures contracts | 1,689,149 | |||||||
| Swap contracts | (811,545 | ) | ||||||
| Other assets and liabilities denominated in foreign | ||||||||
| currencies | 143,720 | $ | (26,991,938 | ) | ||||
| Net realized and unrealized gain (loss) on investments | $ | (34,846,059 | ) | |||||
| Net decrease in net assets resulting from operations | $ | (28,273,822 | ) | |||||
The accompanying notes are an integral part of these financial statements.
34 Pioneer Flexible Opportunities Fund | Annual Report | 10/31/20
Statements of Changes in Net Assets
(Consolidated)
| Year | Year | |||||||
| Ended | Ended | |||||||
| 10/31/20 | 10/31/19 | |||||||
| FROM OPERATIONS: | ||||||||
Net investment income (loss) | $ | 6,572,237 | $ | 6,374,863 | ||||
Net realized gain (loss) on investments | (7,854,121 | ) | (46,458,012 | ) | ||||
Change in net unrealized appreciation (depreciation) | ||||||||
| on investments | (26,991,938 | ) | 64,639,665 | |||||
| Net increase (decrease) in net assets resulting | ||||||||
| from operations | $ | (28,273,822 | ) | $ | 24,556,516 | |||
| DISTRIBUTIONS TO SHAREOWNERS: | ||||||||
Class A ($0.28 and $1.32 per share, respectively) | $ | (2,156,969 | ) | $ | (14,443,481 | ) | ||
Class C ($0.21 and $1.27 per share, respectively) | (1,405,692 | ) | (12,161,299 | ) | ||||
Class K ($0.31 and $1.36 per share, respectively) | (2,563,194 | ) | (7,775,304 | ) | ||||
Class R ($0.04 and $1.28 per share, respectively) | (518 | ) | (19,779 | ) | ||||
Class Y ($0.31 and $1.36 per share, respectively) | (4,783,229 | ) | (32,308,714 | ) | ||||
| Total distributions to shareowners | $ | (10,909,602 | ) | $ | (66,708,577 | ) | ||
| FROM FUND SHARE TRANSACTIONS: | ||||||||
Net proceeds from sales of shares | $ | 82,574,480 | $ | 105,338,234 | ||||
Reinvestment of distributions | 9,626,299 | 47,783,717 | ||||||
Cost of shares repurchased | (204,697,123 | ) | (281,802,642 | ) | ||||
| Net decrease in net assets resulting from | ||||||||
| Fund share transactions | $ | (112,496,344 | ) | $ | (128,680,691 | ) | ||
| Net decrease in net assets | $ | (151,679,768 | ) | $ | (170,832,752 | ) | ||
| NET ASSETS: | ||||||||
Beginning of year | $ | 487,395,753 | $ | 658,228,505 | ||||
End of year | $ | 335,715,985 | $ | 487,395,753 | ||||
The accompanying notes are an integral part of these financial statements.
Pioneer Flexible Opportunities Fund | Annual Report | 10/31/20 35
Statements of Changes in Net Assets
(Consolidated) (continued)
| Year Ended | Year Ended | Year Ended | Year Ended | |||||||||||||
| 10/31/20 | 10/31/20 | 10/31/19 | 10/31/19 | |||||||||||||
| Shares | Amount | Shares | Amount | |||||||||||||
| Class A | ||||||||||||||||
Shares sold | 1,414,483 | $ | 16,308,139 | 1,717,793 | $ | 20,017,433 | ||||||||||
Reinvestment of | ||||||||||||||||
| distributions | 167,506 | 1,969,640 | 958,489 | 11,038,004 | ||||||||||||
Less shares repurchased | (2,818,715 | ) | (31,792,342 | ) | (5,594,605 | ) | (62,874,085 | ) | ||||||||
| Net decrease | (1,236,726 | ) | $ | (13,514,563 | ) | (2,918,323 | ) | $ | (31,818,648 | ) | ||||||
| Class C | ||||||||||||||||
Shares sold | 288,731 | $ | 3,334,922 | 774,383 | $ | 8,783,453 | ||||||||||
Reinvestment of | ||||||||||||||||
| distributions | 98,877 | 1,167,485 | 901,792 | 10,176,151 | ||||||||||||
Less shares repurchased | (3,192,523 | ) | (35,477,967 | ) | (4,233,292 | ) | (47,975,358 | ) | ||||||||
| Net decrease | (2,804,915 | ) | $ | (30,975,560 | ) | (2,557,117 | ) | $ | (29,015,754 | ) | ||||||
| Class K | ||||||||||||||||
Shares sold | 2,808,594 | $ | 34,236,956 | 1,952,848 | $ | 22,677,430 | ||||||||||
Reinvestment of | ||||||||||||||||
| distributions | 222,237 | 2,562,744 | 81,419 | 939,652 | ||||||||||||
Less shares repurchased | (1,068,587 | ) | (12,045,933 | ) | (106,210 | ) | (1,242,749 | ) | ||||||||
| Net increase | 1,962,244 | $ | 24,753,767 | 1,928,057 | $ | 22,374,333 | ||||||||||
| Class R | ||||||||||||||||
Shares sold | 9,022 | $ | 98,641 | 8,291 | $ | 96,661 | ||||||||||
Reinvestment of | ||||||||||||||||
| distributions | 49 | 518 | 1,128 | 12,930 | ||||||||||||
Less shares repurchased | (4,092 | ) | (45,963 | ) | (21,423 | ) | (259,951 | ) | ||||||||
| Net increase (decrease) | 4,979 | $ | 53,196 | (12,004 | ) | $ | (150,360 | ) | ||||||||
| Class Y | ||||||||||||||||
Shares sold | 2,398,191 | $ | 28,595,822 | 4,599,056 | $ | 53,763,257 | ||||||||||
Reinvestment of | ||||||||||||||||
| distributions | 332,845 | 3,925,912 | 2,213,037 | 25,616,980 | ||||||||||||
Less shares repurchased | (11,034,132 | ) | (125,334,918 | ) | (14,631,845 | ) | (169,450,499 | ) | ||||||||
| Net decrease | (8,303,096 | ) | $ | (92,813,184 | ) | (7,819,752 | ) | $ | (90,070,262 | ) | ||||||
The accompanying notes are an integral part of these financial statements.
36 Pioneer Flexible Opportunities Fund | Annual Report | 10/31/20
Financial Highlights (Consolidated)
| Year | Year | Year | Year | Year | ||||||||||||||||
| Ended | Ended | Ended | Ended | Ended | ||||||||||||||||
| 10/31/20 | 10/31/19 | 10/31/18 | 10/31/17 | 10/31/16* | ||||||||||||||||
| Class A | ||||||||||||||||||||
Net asset value, beginning of period | $ | 12.04 | $ | 12.69 | $ | 14.17 | $ | 12.03 | $ | 12.68 | ||||||||||
Increase (decrease) from investment operations: | ||||||||||||||||||||
| Net investment income (loss) (a) | $ | 0.18 | $ | 0.13 | $ | 0.19 | $ | 0.14 | $ | 0.16 | ||||||||||
| Net realized and unrealized gain (loss) on investments | (0.80 | ) | 0.54 | (0.44 | ) | 2.12 | (0.07 | ) | ||||||||||||
| Net increase (decrease) from investment operations | $ | (0.62 | ) | $ | 0.67 | $ | (0.25 | ) | $ | 2.26 | $ | 0.09 | ||||||||
Distributions to shareowners: | ||||||||||||||||||||
| Net investment income | $ | (0.28 | ) | $ | (0.11 | ) | $ | (0.35 | ) | $ | (0.12 | ) | $ | (0.18 | ) | |||||
| Net realized gain | — | (1.21 | ) | (0.88 | ) | — | (0.56 | ) | ||||||||||||
| Total distributions | $ | (0.28 | ) | $ | (1.32 | ) | $ | (1.23 | ) | $ | (0.12 | ) | $ | (0.74 | ) | |||||
| Net increase (decrease) in net asset value | $ | (0.90 | ) | $ | (0.65 | ) | $ | (1.48 | ) | $ | 2.14 | $ | (0.65 | ) | ||||||
Net asset value, end of period | $ | 11.14 | $ | 12.04 | $ | 12.69 | $ | 14.17 | $ | 12.03 | ||||||||||
| Total return (b) | (5.28 | )% | 5.85 | % | (2.08 | )% | 18.96 | % | 0.88 | % | ||||||||||
Ratio of net expenses to average net assets | 1.20 | % | 1.20 | % | 1.14 | % | 1.18 | % | 1.19 | % | ||||||||||
Ratio of net investment income (loss) to average net assets | 1.54 | % | 1.12 | % | 1.35 | % | 1.08 | % | 1.38 | % | ||||||||||
Portfolio turnover rate | 233 | % | 168 | % | 255 | % | 292 | % | 230 | % | ||||||||||
Net assets, end of period (in thousands) | $ | 79,089 | $ | 100,339 | $ | 142,760 | $ | 140,278 | $ | 164,898 | ||||||||||
Ratios with no waiver of fees and assumption of expenses by | ||||||||||||||||||||
| the Adviser and no reduction for fees paid indirectly: | ||||||||||||||||||||
| Total expenses to average net assets | 1.27 | % | 1.23 | % | 1.14 | % | 1.18 | % | 1.19 | % | ||||||||||
| Net investment income (loss) to average net assets | 1.47 | % | 1.09 | % | 1.35 | % | 1.38 | % | 1.38 | % | ||||||||||
* | The Fund was audited by an independent registered public accounting firm other than Ernst & Young LLP. |
(a) | The per-share data presented above is based on the average shares outstanding for the period presented. |
(b) | Assumes initial investment at net asset value at the beginning of each period, reinvestment of all distributions, the complete redemption of the investment at net asset value at the end of each period and no sales charges. Total return would be reduced if sales charges were taken into account. |
The accompanying notes are an integral part of these financial statements.
Pioneer Flexible Opportunities Fund | Annual Report | 10/31/20 37
Financial Highlights (Consolidated) (continued)
| Year | Year | Year | Year | Year | ||||||||||||||||
| Ended | Ended | Ended | Ended | Ended | ||||||||||||||||
| 10/31/20 | 10/31/19 | 10/31/18 | 10/31/17 | 10/31/16* | ||||||||||||||||
| Class C | ||||||||||||||||||||
Net asset value, beginning of period | $ | 11.75 | $ | 12.45 | $ | 13.95 | $ | 11.88 | $ | 12.56 | ||||||||||
Increase (decrease) from investment operations: | ||||||||||||||||||||
| Net investment income (loss) (a) | $ | 0.08 | $ | 0.04 | $ | 0.07 | $ | 0.04 | $ | 0.07 | ||||||||||
| Net realized and unrealized gain (loss) on investments | (0.77 | ) | 0.53 | (0.42 | ) | 2.09 | (0.07 | ) | ||||||||||||
| Net increase (decrease) from investment operations | $ | (0.69 | ) | $ | 0.57 | $ | (0.35 | ) | $ | 2.13 | $ | — | ||||||||
Distributions to shareowners: | ||||||||||||||||||||
| Net investment income | $ | (0.21 | ) | $ | (0.06 | ) | $ | (0.27 | ) | $ | (0.06 | ) | $ | (0.12 | ) | |||||
| Net realized gain | — | (1.21 | ) | (0.88 | ) | — | (0.56 | ) | ||||||||||||
| Total distributions | $ | (0.21 | ) | $ | (1.27 | ) | $ | (1.15 | ) | $ | (0.06 | ) | $ | (0.68 | ) | |||||
| Net increase (decrease) in net asset value | $ | (0.90 | ) | $ | (0.70 | ) | $ | (1.50 | ) | $ | 2.07 | $ | (0.68 | ) | ||||||
Net asset value, end of period | $ | 10.85 | $ | 11.75 | $ | 12.45 | $ | 13.95 | $ | 11.88 | ||||||||||
| Total return (b) | (6.01 | )% | 5.03 | % | (2.83 | )% | 18.01 | % | 0.09 | % | ||||||||||
Ratio of net expenses to average net assets | 1.98 | % | 1.97 | % | 1.91 | % | 1.93 | % | 1.94 | % | ||||||||||
Ratio of net investment income (loss) to average net assets | 0.74 | % | 0.37 | % | 0.55 | % | 0.34 | % | 0.63 | % | ||||||||||
Portfolio turnover rate | 233 | % | 168 | % | 255 | % | 292 | % | 230 | % | ||||||||||
Net assets, end of period (in thousands) | $ | 48,426 | $ | 85,398 | $ | 122,305 | $ | 148,591 | $ | 178,457 | ||||||||||
Ratios with no waiver of fees and assumption of expenses by | ||||||||||||||||||||
| the Adviser and no reduction for fees paid indirectly: | ||||||||||||||||||||
| Total expenses to average net assets | 2.01 | % | 1.97 | % | 1.91 | % | 1.93 | % | 1.94 | % | ||||||||||
| Net investment income (loss) to average net assets | 0.71 | % | 0.37 | % | 0.55 | % | 0.34 | % | 0.63 | % | ||||||||||
* | The Fund was audited by an independent registered public accounting firm other than Ernst & Young LLP. |
(a) | The per-share data presented above is based on the average shares outstanding for the period presented. |
(b) | Assumes initial investment at net asset value at the beginning of each period, reinvestment of all distributions, the complete redemption of the investment at net asset value at the end of each period and no sales charges. Total return would be reduced if sales charges were taken into account. |
The accompanying notes are an integral part of these financial statements.
38 Pioneer Flexible Opportunities Fund | Annual Report | 10/31/20
| Year | Year | |||||||||||
| Ended | Ended | 6/22/18* to | ||||||||||
| 10/31/20 | 10/31/19 | 10/31/18 | ||||||||||
| Class K | ||||||||||||
Net asset value, beginning of period | $ | 12.03 | $ | 12.69 | $ | 13.67 | ||||||
Increase (decrease) from investment operations: | ||||||||||||
| Net investment income (loss) (a) | $ | 0.22 | $ | 0.17 | $ | 0.06 | ||||||
| Net realized and unrealized gain (loss) | ||||||||||||
| on investments | (0.80 | ) | 0.53 | (1.00 | ) | |||||||
| Net increase (decrease) from | ||||||||||||
| investment operations | $ | (0.58 | ) | $ | 0.70 | $ | (0.94 | ) | ||||
Distributions to shareowners: | ||||||||||||
| Net investment income | $ | (0.31 | ) | $ | (0.15 | ) | $ | (0.04 | ) | |||
| Net realized gain | — | (1.21 | ) | — | ||||||||
| Total distributions | $ | (0.31 | ) | $ | (1.36 | ) | $ | (0.04 | ) | |||
| Net increase (decrease) in net asset value | $ | (0.89 | ) | $ | (0.66 | ) | $ | (0.98 | ) | |||
Net asset value, end of period | $ | 11.14 | $ | 12.03 | $ | 12.69 | ||||||
| Total return (b) | (4.92 | )% | 6.14 | % | (2.00 | )%(c) | ||||||
Ratio of net expenses to average net assets | 0.90 | % | 0.88 | % | 0.88 | %(d) | ||||||
Ratio of net investment income (loss) to average | ||||||||||||
| net assets | 1.93 | % | 1.48 | % | 1.28 | %(d) | ||||||
Portfolio turnover rate | 233 | % | 168 | % | 255 | %(c) | ||||||
Net assets, end of period (in thousands) | $ | 104,316 | $ | 89,092 | $ | 69,449 | ||||||
Ratios with no waiver of fees and assumption of | ||||||||||||
| expenses by the Adviser and no reduction for | ||||||||||||
| fees paid indirectly: | ||||||||||||
| Total expenses to average net assets | 0.93 | % | 0.88 | % | 0.88 | % | ||||||
| Net investment income (loss) to average net assets | 1.90 | % | 1.48 | % | 1.28 | % | ||||||
* | Class K commenced operations on June 22, 2018. |
(a) | The per-share data presented above is based on the average shares outstanding for the period presented. |
(b) | Assumes initial investment at net asset value at the beginning of each period, reinvestment of all distributions and |
the complete redemption of the investment at net asset value at the end of each period. | |
(c) | Not annualized. |
| (d) | Annualized. |
The accompanying notes are an integral part of these financial statements.
Pioneer Flexible Opportunities Fund | Annual Report | 10/31/20 39
Financial Highlights (Consolidated) (continued)
| Year | Year | Year | Year | Year | ||||||||||||||||
| Ended | Ended | Ended | Ended | Ended | ||||||||||||||||
| 10/31/20 | 10/31/19 | 10/31/18 | 10/31/17 | 10/31/16* | ||||||||||||||||
| Class R | ||||||||||||||||||||
Net asset value, beginning of period | $ | 11.75 | $ | 12.60 | $ | 14.11 | $ | 12.00 | $ | 12.69 | ||||||||||
Increase (decrease) from investment operations: | ||||||||||||||||||||
| Net investment income (loss) (a) | $ | 0.12 | $ | (0.05 | )(b) | $ | 0.10 | $ | 0.08 | $ | 0.10 | |||||||||
| Net realized and unrealized gain (loss) on investments | (0.81 | ) | 0.48 | (0.43 | ) | 2.11 | (0.08 | ) | ||||||||||||
| Net increase (decrease) from investment operations | $ | (0.69 | ) | $ | 0.43 | $ | (0.33 | ) | $ | 2.19 | $ | 0.02 | ||||||||
Distributions to shareowners: | ||||||||||||||||||||
| Net investment income | $ | (0.04 | ) | $ | (0.07 | ) | $ | (0.30 | ) | $ | (0.08 | ) | $ | (0.15 | ) | |||||
| Net realized gain | — | (1.21 | ) | (0.88 | ) | — | (0.56 | ) | ||||||||||||
| Total distributions | $ | (0.04 | ) | $ | (1.28 | ) | $ | (1.18 | ) | $ | (0.08 | ) | $ | (0.71 | ) | |||||
| Net increase (decrease) in net asset value | $ | (0.73 | ) | $ | (0.85 | ) | $ | (1.51 | ) | $ | 2.11 | $ | (0.69 | ) | ||||||
Net asset value, end of period | $ | 11.02 | $ | 11.75 | $ | 12.60 | $ | 14.11 | $ | 12.00 | ||||||||||
| Total return (c) | (5.90 | )% | 3.73 | % | (2.71 | )% | 18.35 | % | 0.34 | % | ||||||||||
Ratio of net expenses to average net assets | 1.79 | % | 2.91 | % | 1.82 | % | 1.62 | % | 1.71 | % | ||||||||||
Ratio of net investment income (loss) to average net assets | 1.08 | % | (0.45 | )% | 0.75 | % | 0.64 | % | 0.86 | % | ||||||||||
Portfolio turnover rate | 233 | % | 168 | % | 255 | % | 292 | % | 230 | % | ||||||||||
Net assets, end of period (in thousands) | $ | 187 | $ | 141 | $ | 303 | $ | 279 | $ | 282 | ||||||||||
Ratios with no waiver of fees and assumption of expenses by | ||||||||||||||||||||
| the Adviser and no reduction for fees paid indirectly: | ||||||||||||||||||||
| Total expenses to average net assets | 1.82 | % | 2.91 | % | 1.82 | % | 1.62 | % | 1.71 | % | ||||||||||
| Net investment income (loss) to average net assets | 1.05 | % | (0.45 | )% | 0.75 | % | 0.64 | % | 0.86 | % | ||||||||||
* | The Fund was audited by an independent registered public accounting firm other than Ernst & Young LLP. |
(a) | The per-share data presented above is based on the average shares outstanding for the period presented. |
(b) | The amount shown for a share outstanding does not correspond with net investment gain (loss) in the Statement of Operations for the period due to timing of the sales and repurchase of shares. |
(c) | Assumes initial investment at net asset value at the beginning of each period, reinvestment of all distributions, the complete redemption of the investment at net asset value at the end of each period and no sales charges. Total return would be reduced if sales charges were taken into account. |
The accompanying notes are an integral part of these financial statements.
40 Pioneer Flexible Opportunities Fund | Annual Report | 10/31/20
| Year | Year | Year | Year | Year | ||||||||||||||||
| Ended | Ended | Ended | Ended | Ended | ||||||||||||||||
| 10/31/20 | 10/31/19 | 10/31/18 | 10/31/17 | 10/31/16* | ||||||||||||||||
| Class Y | ||||||||||||||||||||
Net asset value, beginning of period | $ | 12.09 | $ | 12.74 | $ | 14.22 | $ | 12.08 | $ | 12.72 | ||||||||||
Increase (decrease) from investment operations: | ||||||||||||||||||||
| Net investment income (loss) (a) | $ | 0.20 | $ | 0.17 | $ | 0.24 | $ | 0.18 | $ | 0.20 | ||||||||||
| Net realized and unrealized gain (loss) on investments | (0.78 | ) | 0.54 | (0.46 | ) | 2.12 | (0.08 | ) | ||||||||||||
| Net increase (decrease) from investment operations | $ | (0.58 | ) | $ | 0.71 | $ | (0.22 | ) | $ | 2.30 | $ | 0.12 | ||||||||
Distributions to shareowners: | ||||||||||||||||||||
| Net investment income | $ | (0.31 | ) | $ | (0.15 | ) | $ | (0.38 | ) | $ | (0.16 | ) | $ | (0.20 | ) | |||||
| Net realized gain | — | (1.21 | ) | (0.88 | ) | — | (0.56 | ) | ||||||||||||
| Total distributions | $ | (0.31 | ) | $ | (1.36 | ) | $ | 1.26 | $ | (0.16 | ) | $ | (0.76 | ) | ||||||
| Net increase (decrease) in net asset value | $ | (0.89 | ) | $ | (0.65 | ) | $ | (1.48 | ) | $ | 2.14 | $ | (0.64 | ) | ||||||
Net asset value, end of period | $ | 11.20 | $ | 12.09 | $ | 12.74 | $ | 14.22 | $ | 12.08 | ||||||||||
| Total return (b) | (4.90 | )% | 6.16 | % | (1.86 | )% | 19.24 | % | 1.17 | % | ||||||||||
Ratio of net expenses to average net assets | 0.90 | % | 0.90 | % | 0.90 | % | 0.90 | % | 0.90 | % | ||||||||||
Ratio of net investment income (loss) to average net assets | 1.75 | % | 1.45 | % | 1.71 | % | 1.37 | % | 1.65 | % | ||||||||||
Portfolio turnover rate | 233 | % | 168 | % | 255 | % | 292 | % | 230 | % | ||||||||||
Net assets, end of period (in thousands) | $ | 103,698 | $ | 212,426 | $ | 323,412 | $ | 369,546 | $ | 347,586 | ||||||||||
Ratios with no waiver of fees and assumption of expenses by | ||||||||||||||||||||
| the Adviser and no reduction for fees paid indirectly: | ||||||||||||||||||||
| Total expenses to average net assets | 1.00 | % | 0.97 | % | 0.92 | % | 0.95 | % | 0.96 | % | ||||||||||
| Net investment income (loss) to average net assets | 1.65 | % | 1.38 | % | 1.69 | % | 1.32 | % | 1.59 | % | ||||||||||
* | The Fund was audited by an independent registered public accounting firm other than Ernst & Young LLP. |
(a) | The per-share data presented above is based on the average shares outstanding for the period presented. |
(b) | Assumes initial investment at net asset value at the beginning of each period, reinvestment of all distributions, the complete redemption of the investment at net asset value at the end of each period and no sales charges. Total return would be reduced if sales charges were taken into account. |
The accompanying notes are an integral part of these financial statements.
Pioneer Flexible Opportunities Fund | Annual Report | 10/31/20 41
(Consolidated)
1. Organization and Significant Accounting Policies
Pioneer Flexible Opportunities Fund (the “Fund”) is one of two portfolios comprising Pioneer Series Trust VI (the “Trust”), a Delaware statutory trust. The Fund is registered under the Investment Company Act of 1940 as a diversified, open-end management investment company. The Fund’s investment objective is to seek total return.
The Fund offers five classes of shares designated as Class A, Class C, Class K, Class R and Class Y shares. Each class of shares represents an interest in the same portfolio of investments of the Fund and has identical rights (based on relative net asset values) to assets and liquidation proceeds. Share classes can bear different rates of class-specific fees and expenses such as transfer agent and distribution fees. Differences in class-specific fees and expenses will result in differences in net investment income and, therefore, the payment of different dividends from net investment income earned by each class. The Amended and Restated Declaration of Trust of the Fund gives the Board of Trustees the flexibility to specify either per-share voting or dollar-weighted voting when submitting matters for shareholder approval. Under per-share voting, each share of a class of the Fund is entitled to one vote. Under dollar-weighted voting, a shareholder’s voting power is determined not by the number of shares owned, but by the dollar value of the shares on the record date. Each share class has exclusive voting rights with respect to matters affecting only that class, including with respect to the distribution plan for that class. There is no distribution plan for Class K and Class Y shares.
Amundi Pioneer Asset Management, Inc., an indirect, wholly owned subsidiary of Amundi and Amundi’s wholly owned subsidiary, Amundi USA, Inc., serves as the Fund’s investment adviser (the “Adviser”). Amundi Pioneer Distributor, Inc., an affiliate of Amundi Pioneer Asset Management, Inc., serves as the Fund’s distributor (the “Distributor”).
During March 2017, the Financial Accounting Standards Board (FASB) issued an Accounting Standard Update, ASU 2017-08, Receivables-Nonrefundable Fees and Other Costs (Subtopic 310-20), Premium Amortization on Purchased Callable Debt Securities (“ASU 2017-08”), which shortens the amortization period for purchased non-contingently callable debt securities held at a premium. ASU 2017-08 specifies that the premium amortization period ends at the earliest call date, for certain purchased non-contingently callable debt securities. ASU 2017-08 is effective for fiscal years, and interim periods within those fiscal years, beginning after December 15, 2018. The
42 Pioneer Flexible Opportunities Fund | Annual Report | 10/31/20
Fund has adopted ASU 2017-08 as of January 1, 2019. The implementation of ASU 2017-08 did not have a material impact on the Fund’s consolidated financial statements.
The consolidated financial statements of the Fund include the accounts of Flexible Opportunities Commodity Fund Ltd. (formerly, Pioneer Cayman Commodity Fund Ltd.) (the “Subsidiary”). All intercompany accounts and transactions have been eliminated. The Subsidiary, a Cayman Islands exempted company, was incorporated on February 10, 2010, and is wholly owned and controlled by the Fund. The Fund is the sole shareholder of the Subsidiary. It is intended that the Fund will remain the sole shareholder and will continue to control the Subsidiary. The Fund and the Subsidiary are both managed by the Adviser. The Subsidiary acts as an investment vehicle for the Fund in order to effect certain investments on behalf of the Fund. As of October 31, 2020, the Subsidiary represented $5,812,114, or approximately 1.73%, of the net assets of the Fund.
In March 2020, FASB issued an Accounting Standard Update, ASU 2020-04, Reference Rate Reform (Topic 848) — Facilitation of the Effects of Reference Rate Reform on Financial Reporting (“ASU 2020-04”), which provides optional, temporary relief with respect to the financial reporting of contracts subject to certain types of modifications due to the planned discontinuation of the London Interbank Offered Rate (“LIBOR”) and other LIBOR-based reference rates at the end of 2021. The temporary relief provided by ASU 2020-04 is effective for certain reference rate-related contract modifications that occur during the period from March 12, 2020 through December 31, 2022. Management is evaluating the impact of ASU 2020-04 on the Fund’s investments, derivatives, debt and other contracts that will undergo reference rate-related modifications as a result of the reference rate reform.
The Fund is an investment company and follows investment company accounting and reporting guidance under U.S. Generally Accepted Accounting Principles (“U.S. GAAP”). U.S. GAAP requires the management of the Fund to make estimates and assumptions that affect the reported amounts of assets and liabilities, the disclosure of contingent assets and liabilities at the date of the financial statements, and the reported amounts of income, expenses and gain or loss on investments during the reporting period. Actual results could differ from those estimates.
The following is a summary of significant accounting policies followed by the Fund in the preparation of its financial statements:
Pioneer Flexible Opportunities Fund | Annual Report | 10/31/20 43
A. Security Valuation
The net asset value of the Fund is computed once daily, on each day the New York Stock Exchange (“NYSE”) is open, as of the close of regular trading on the NYSE.
Equity securities that have traded on an exchange are valued by using the last sale price on the principal exchange where they are traded. Equity securities that have not traded on the date of valuation, or securities for which sale prices are not available, generally are valued using the mean between the last bid and asked prices or, if both last bid and asked prices are not available, at the last quoted bid price. Last sale and bid and asked prices are provided by independent third-party pricing services. In the case of equity securities not traded on an exchange, prices are typically determined by independent third-party pricing services using a variety of techniques and methods.
The value of foreign securities is translated into U.S. dollars based on foreign currency exchange rate quotations supplied by a third-party pricing source. Trading in non-U.S. equity securities is substantially completed each day at various times prior to the close of the NYSE. The values of such securities used in computing the net asset value of the Fund’s shares are determined as of such times. The Fund may use a fair value model developed by an independent pricing service to value non-U.S. equity securities.
Fixed-income securities are valued by using prices supplied by independent pricing services, which consider such factors as market prices, market events, quotations from one or more brokers, Treasury spreads, yields, maturities and ratings, or may use a pricing matrix or other fair value methods or techniques to provide an estimated value of the security or instrument. A pricing matrix is a means of valuing a debt security on the basis of current market prices for other debt securities, historical trading patterns in the market for fixed-income securities and/or other factors. Non-U.S. debt securities that are listed on an exchange will be valued at the bid price obtained from an independent third-party pricing service. When independent third-party pricing services are unable to supply prices, or when prices or market quotations are considered to be unreliable, the value of that security may be determined using quotations from one or more broker-dealers.
Options contracts are generally valued at the mean between the last bid and ask prices on the principal exchange where they are traded. Over-the-counter (“OTC”) options and options on swaps (“swaptions”) are valued using prices supplied by independent pricing services, which consider such factors as market prices, market events, quotations from one or more
44 Pioneer Flexible Opportunities Fund | Annual Report | 10/31/20
brokers, Treasury spreads, yields, maturities and ratings, or may use a pricing matrix or other fair value methods or techniques to provide an estimated value of the security or instrument.
Futures contracts are generally valued at the closing settlement price established by the exchange on which they are traded.
Swap contracts, including interest rate swaps, caps and floors (other than centrally cleared swap contracts), are valued at the dealer quotations obtained from reputable International Swap Dealers Association members. Centrally cleared swaps are valued at the daily settlement price provided by the central clearing counterparty.
Shares of open-end registered investment companies (including money market mutual funds) are valued at such funds’ net asset value. Shares of exchange-listed closed-end funds are valued by using the last sale price on the principal exchange where they are traded.
Securities for which independent pricing services or broker-dealers are unable to supply prices or for which market prices and/or quotations are not readily available or are considered to be unreliable are valued by a fair valuation team comprised of certain personnel of the Adviser pursuant to procedures adopted by the Fund’s Board of Trustees. The Adviser’s fair valuation team uses fair value methods approved by the Valuation Committee of the Board of Trustees. The Adviser’s fair valuation team is responsible for monitoring developments that may impact fair valued securities and for discussing and assessing fair values on an ongoing basis, and at least quarterly, with the Valuation Committee of the Board of Trustees.
Inputs used when applying fair value methods to value a security may include credit ratings, the financial condition of the company, current market conditions and comparable securities. The Fund may use fair value methods if it is determined that a significant event has occurred after the close of the exchange or market on which the security trades and prior to the determination of the Fund’s net asset value. Examples of a significant event might include political or economic news, corporate restructurings, natural disasters, terrorist activity or trading halts. Thus, the valuation of the Fund’s securities may differ significantly from exchange prices, and such differences could be material.
At October 31, 2020, one security was valued using fair value methods (in addition to securities valued using prices supplied by independent pricing services, broker-dealers or using a third party insurance pricing model) representing 0.02% of net assets. The value of this fair valued security was $80,255.
Pioneer Flexible Opportunities Fund | Annual Report | 10/31/20 45
B. Investment Income and Transactions
Dividend income is recorded on the ex-dividend date, except that certain dividends from foreign securities where the ex-dividend date may have passed are recorded as soon as the Fund becomes aware of the ex-dividend data in the exercise of reasonable diligence.
Interest income, including interest on income-bearing cash accounts, is recorded on the accrual basis. Dividend and interest income are reported net of unrecoverable foreign taxes withheld at the applicable country rates and net of income accrued on defaulted securities.
Interest and dividend income payable by delivery of additional shares is reclassified as PIK (payment-in-kind) income upon receipt and is included in interest and dividend income, respectively.
Security transactions are recorded as of trade date. Gains and losses on sales of investments are calculated on the identified cost method for both financial reporting and federal income tax purposes.
C. Foreign Currency Translation
The books and records of the Fund are maintained in U.S. dollars. Amounts denominated in foreign currencies are translated into U.S. dollars using current exchange rates.
Net realized gains and losses on foreign currency transactions, if any, represent, among other things, the net realized gains and losses on foreign currency exchange contracts, disposition of foreign currencies and the difference between the amount of income accrued and the U.S. dollars actually received. Further, the effects of changes in foreign currency exchange rates on investments are not segregated on the Statement of Operations from the effects of changes in the market prices of those securities, but are included with the net realized and unrealized gain or loss on investments.
D. Federal Income Taxes
It is the Fund’s policy to comply with the requirements of the Internal Revenue Code applicable to regulated investment companies and to distribute all of its net taxable income and net realized capital gains, if any, to its shareowners. Therefore, no provision for federal income taxes is required. As of October 31, 2020, the Fund did not accrue any interest or penalties with respect to uncertain tax positions, which, if applicable, would be recorded as an income tax expense on the Statement of Operations. Tax returns filed within the prior three years remain subject to examination by federal and state tax authorities.
46 Pioneer Flexible Opportunities Fund | Annual Report | 10/31/20
The amount and character of income and capital gain distributions to shareowners are determined in accordance with federal income tax rules, which may differ from U.S. GAAP. Distributions in excess of net investment income or net realized gains are temporary over distributions for financial statement purposes resulting from differences in the recognition or classification of income or distributions for financial statement and tax purposes. Capital accounts within the financial statements are adjusted for permanent book/tax differences to reflect tax character, but are not adjusted for temporary differences.
A portion of the dividend income recorded by the Fund is from distributions by publicly traded Real Estate Investment Trusts (“REITs”), and such distributions for tax purposes may also consist of capital gains and return of capital. The actual return of capital and capital gains portions of such distributions will be determined by formal notifications from the REITs subsequent to the calendar year-end. Distributions received from the REITs that are determined to be a return of capital are recorded by the Fund as a reduction of the cost basis of the securities held and those determined to be capital gain are reflected as such on the Statement of Operations.
At October 31, 2020, the Fund reclassified $2,598,899 to increase distributable earnings and $2,598,899 to decrease paid-in capital to reflect permanent book/tax differences. These adjustments have no impact on net assets or the results of operations.
At October 31, 2020, the Fund was permitted to carry forward indefinitely $61,752,639 of short-term losses.
The tax character of distributions paid during the years ended October 31, 2020 and October 31, 2019, were as follows:
| 2020 | 2019 | |||||||
| Distributions paid from: | ||||||||
| Ordinary income | $ | 10,909,602 | $ | 23,178,807 | ||||
| Long term capital gain | — | 43,529,770 | ||||||
| Total | $ | 10,909,602 | $ | 66,708,577 | ||||
The following shows the components of distributable earnings (losses) on a federal income tax basis at October 31, 2020:
| 2020 | ||||
| Distributable earnings: | ||||
| Undistributed ordinary income | $ | 274,412 | ||
| Capital loss carryforward | (61,752,639 | ) | ||
| Unrealized appreciation | 16,100,132 | |||
| Total | $ | (45,378,095 | ) | |
Pioneer Flexible Opportunities Fund | Annual Report | 10/31/20 47
The difference between book-basis and tax-basis net unrealized depreciation is attributable to the tax deferral of losses on wash sales, adjustments related to the mark-to-market of futures contracts, tax basis adjustments on Real Estate Investment Trust (“REIT”), partnerships and swaps contracts.
E. Fund Shares
The Fund records sales and repurchases of its shares as of trade date. The Distributor earned $4,051 in underwriting commissions on the sale of Class A shares during the year ended October 31, 2020.
F. Class Allocations
Income, common expenses and realized and unrealized gains and losses are calculated at the Fund level and allocated daily to each class of shares based on its respective percentage of adjusted net assets at the beginning of the day.
Distribution fees are calculated based on the average daily net asset value attributable to Class A, Class C and Class R shares of the Fund, respectively (see Note 4). Class K and Class Y shares do not pay distribution fees. All expenses and fees paid to the Fund’s transfer agent for its services are allocated among the classes of shares based on the number of accounts in each class and the ratable allocation of related out-of-pocket expenses (see Note 3).
Distributions to shareowners are recorded as of the ex-dividend date. Distributions paid by the Fund with respect to each class of shares are calculated in the same manner and at the same time, except that net investment income dividends to Class A, Class C, Class K, Class R and Class Y shares can reflect different transfer agent and distribution expense rates.
G. Risks
The value of securities held by the Fund may go up or down, sometimes rapidly or unpredictably, due to general market conditions, such as real or perceived adverse economic, political or regulatory conditions, recessions, the spread of infectious illness or other public health issues, inflation, changes in interest rates, lack of liquidity in the bond markets or adverse investor sentiment. In the past several years, financial markets have experienced increased volatility, depressed valuations, decreased liquidity and heightened uncertainty. These conditions may continue, recur, worsen or spread. A general rise in interest rates could adversely affect the price and liquidity of fixed-income securities and could also result in increased redemptions from the Fund.
48 Pioneer Flexible Opportunities Fund | Annual Report | 10/31/20
At times, the Fund’s investments may represent industries or industry sectors that are interrelated or have common risks, making the Fund more susceptible to any economic, political, or regulatory developments or other risks affecting those industries and sectors. The Fund’s investments in foreign markets and countries with limited developing markets may subject the Fund to a greater degree of risk than investments in a developed market. These risks include disruptive political or economic conditions and the imposition of adverse governmental laws or currency exchange restrictions.
The Fund may gain exposure to commodities (such as oil and precious metals) through investment in commodity-related investments, including commodity-linked derivatives, ETFs and other pooled investment vehicles and leveraged or unleveraged commodity-linked notes (derivative debt instruments with principal and/or coupon payments linked to the performance of commodity indices). The Fund also may invest in equity securities of issuers in commodity-related industries. The Fund’s investments in commodity-related investments may subject the Fund to greater market price volatility than investments in traditional securities. The value of commodity-related investments may be affected by changes in overall market movements, commodity index volatility, changes in interest rates, or factors affecting particular industries or commodities, such as weather, disease, embargoes, acts of war or terrorism, or political and regulatory developments. Commodity-related investments may be more volatile than the underlying commodities. In addition, commodity-linked investments are subject to counterparty risk due to there being a relatively small number of issuers. The Fund gains exposure to commodity-related investments by investing in the Subsidiary, a foreign entity that is treated as a controlled foreign corporation for U.S. federal income tax purposes. The Fund may invest up to 25% of its total assets in the Subsidiary. The Fund’s ability to invest in commodity-related investments, and the means through which any such investments may be made, is limited by tax considerations.
The Fund may invest in REIT securities, the value of which can fall for a variety of reasons, such as declines in rental income, fluctuating interest rates, poor property management, environmental liabilities, uninsured damage, increased competition, or changes in real estate tax laws.
The Fund may invest in below investment grade (high-yield) debt securities and preferred stocks. Some of these high-yield securities may be convertible into equity securities of the issuer. Debt securities rated below investment grade are commonly referred to as “junk bonds” and are considered speculative. These securities involve greater risk of loss, are
Pioneer Flexible Opportunities Fund | Annual Report | 10/31/20 49
subject to greater price volatility, and are less liquid, especially during periods of economic uncertainty or change, than higher rated debt securities.
The fund’s investments, payment obligations and financing terms may be based on floating rates, such as LIBOR (London Interbank Offered Rate). Plans are underway to phase out the use of LIBOR by the end of 2021. There remains uncertainty regarding the nature of any replacement rate and the impact of the transition from LIBOR on the fund, issuers of instruments in which the fund invests, and financial markets generally.
With the increased use of technologies such as the Internet to conduct business, the Fund is susceptible to operational, information security and related risks. While the Fund’s Adviser has established business continuity plans in the event of, and risk management systems to prevent, limit or mitigate, such cyber-attacks, there are inherent limitations in such plans and systems, including the possibility that certain risks have not been identified. Furthermore, the Fund cannot control the cybersecurity plans and systems put in place by service providers to the Fund such as Brown Brothers Harriman & Co., the Fund’s custodian and accounting agent, and DST Asset Manager Solutions, Inc., the Fund’s transfer agent. In addition, many beneficial owners of Fund shares hold them through accounts at broker-dealers, retirement platforms and other financial market participants over which neither the Fund nor Amundi exercises control. Each of these may in turn rely on service providers to them, which are also subject to the risk of cyber-attacks. Cybersecurity failures or breaches at Amundi or the Fund’s service providers or intermediaries have the ability to cause disruptions and impact business operations, potentially resulting in financial losses, interference with the Fund’s ability to calculate its net asset value, impediments to trading, the inability of Fund shareowners to effect share purchases, redemptions or exchanges or receive distributions, loss of or unauthorized access to private shareowner information and violations of applicable privacy and other laws, regulatory fines, penalties, reputational damage, or additional compliance costs. Such costs and losses may not be covered under any insurance. In addition, maintaining vigilance against cyber-attacks may involve substantial costs over time, and system enhancements may themselves be subject to cyber-attacks.
COVID-19
The respiratory illness COVID-19 caused by a novel coronavirus has resulted in a global pandemic and major disruption to economies and markets around the world, including the United States. Global financial markets have experienced extreme volatility and severe losses, and trading in many instruments has been disrupted. Liquidity for many instruments has been
50 Pioneer Flexible Opportunities Fund | Annual Report | 10/31/20
greatly reduced for periods of time. Some interest rates are very low and in some cases yields are negative. Some sectors of the economy and individual issuers have experienced particularly large losses. These circumstances may continue for an extended period of time, and may continue to affect adversely the value and liquidity of the Fund’s investments. The ultimate economic fallout from the pandemic, and the long-term impact on economies, markets, industries and individual issuers, are not known. Governments and central banks, including the Federal Reserve in the U.S., have taken extraordinary and unprecedented actions to support local and global economies and the financial markets. These actions have resulted in significant expansion of public debt, including in the U.S. The impact of these measures, and whether they will be effective to mitigate the economic and market disruption, will not be known for some time. The consequences of high public debt, including its future impact on the economy and securities markets, likewise may not be known for some time.
The Fund’s prospectus contains unaudited information regarding the Fund’s principal risks. Please refer to that document when considering the Fund’s principal risks.
H. Purchased Options
The Fund may purchase put and call options to seek to increase total return. Purchased call and put options entitle the Fund to buy and sell a specified number of shares or units of a particular security, currency or index at a specified price at a specific date or within a specific period of time. Upon the purchase of a call or put option, the premium paid by the Fund is included on the Statement of Assets and Liabilities as an investment. All premiums are marked-to-market daily, and any unrealized appreciation or depreciation is recorded on the Fund’s Statement of Operations. As the purchaser of an index option, the Fund has the right to receive a cash payment equal to any depreciation in the value of the index below the strike price of the option (in the case of a put) or equal to any appreciation in the value of the index over the strike price of the option (in the case of a call) as of the valuation date of the option. Premiums paid for purchased call and put options which have expired are treated as realized losses on investments on the Statement of Operations. Upon the exercise or closing of a purchased put option, the premium is offset against the proceeds on the sale of the underlying security or financial instrument in order to determine the realized gain or loss on investments. Upon the exercise or closing of a purchased call option, the premium is added to the cost of the security or financial instrument. The risk associated with purchasing options is limited to the premium originally paid.
Pioneer Flexible Opportunities Fund | Annual Report | 10/31/20 51
The average market value of purchased options contracts open during the year ended October 31, 2020, was $1,532,870. Open purchased options at October 31, 2020, are listed in the Schedule of Investments.
I. Forward Foreign Currency Exchange Contracts
The Fund may enter into forward foreign currency exchange contracts (“contracts”) for the purchase or sale of a specific foreign currency at a fixed price on a future date. All contracts are marked-to-market daily at the applicable exchange rates, and any resulting unrealized appreciation or depreciation is recorded in the Fund’s financial statements. The Fund records realized gains and losses at the time a contract is offset by entry into a closing transaction or extinguished by delivery of the currency. Risks may arise upon entering into these contracts from the potential inability of counterparties to meet the terms of the contract and from unanticipated movements in the value of foreign currencies relative to the U.S. dollar (see Note 7).
During the year ended October 31, 2020, the Fund had entered into various forward foreign currency exchange contracts that obligated the Fund to deliver or take delivery of currencies at specified future maturity dates. Alternatively, prior to the settlement date of a forward foreign currency exchange contract, the Fund may close out such contract by entering into an offsetting contract.
The average market value of forward foreign currency exchange contracts open during the year ended October 31, 2020, was $36,878. There were no open forward foreign currency exchange contracts at October 31, 2020.
J. Futures Contracts
The Fund may enter into futures transactions in order to attempt to hedge against changes in interest rates, securities prices and currency exchange rates or to seek to increase total return. Futures contracts are types of derivatives. All futures contracts entered into by the Fund are traded on a futures exchange. Upon entering into a futures contract, the Fund is required to deposit with a broker an amount of cash or securities equal to the minimum “initial margin” requirements of the associated futures exchange. The amount of cash deposited with the broker as collateral at October 31, 2020, is recorded as “Futures collateral” on the Statement of Assets and Liabilities.
Subsequent payments for futures contracts (“variation margin”) are paid or received by the Fund, depending on the daily fluctuation in the value of the contracts, and are recorded by the Fund as unrealized appreciation or depreciation. Cash received from or paid to the broker related to previous margin movement is held in a segregated account at the broker and is recorded as either “Due from broker for futures” or “Due to broker for
52 Pioneer Flexible Opportunities Fund | Annual Report | 10/31/20
futures” on the Statement of Assets and Liabilities. When the contract is closed, the Fund realizes a gain or loss equal to the difference between the opening and closing value of the contract as well as any fluctuation in foreign currency exchange rates where applicable. Futures contracts are subject to market risk, interest rate risk and currency exchange rate risk. Changes in value of the contracts may not directly correlate to the changes in value of the underlying securities. With futures, there is reduced counterparty credit risk to the Fund since futures are exchange-traded and the exchange’s clearinghouse, as counterparty to all exchange-traded futures, guarantees the futures against default.
The average market value of futures contracts open during the year ended October 31, 2020, was $(81,104,902). Open futures contracts outstanding at October 31, 2020, are listed in the Schedule of Investments.
K. Total Return Swap Contracts
The Fund may enter into a total return swap contracts to attempt to manage and/or gain exposure to a security or market. Pursuant to a total return swap contracts, the Fund negotiates with a counterparty to exchange a periodic stream of payments. One party makes payments based on the total return of a reference asset (such as a security or a basket of securities or securities index), and in return receives fixed or floating rate interest payments. The total return of the reference asset typically includes appreciation or depreciation on the reference asset, plus any interest or dividend payments. To the extent that the total return of the reference asset exceeds or falls short of the offsetting interest rate obligation, the Fund will receive a payment from or make a payment to the counterparty.
Total return swap contracts are marked-to-market daily using valuations supplied by independent sources, and the change in value, if any, is recorded within “Swap contracts, at value” on the Statement of Assets and Liabilities. Payments received or made are recorded as realized gains or losses on Statement of Operations. Total return swap contracts are subject to counterparty risk and unanticipated movements in value of exchange interest rates, securities or the index.
The average market value of total return swap contracts open during the year ended October 31, 2020, was $(437,511). Open total return swap contracts at October 31, 2020, are listed in the Schedule of Investments.
2. Management Agreement
The Adviser manages the Fund’s portfolio. Management fees are calculated daily and paid monthly at an annual rate of 0.70% of the Fund’s average daily net assets up to $1 billion, 0.675% of the next $1 billion of the Fund’s average daily net assets and 0.65% of the Fund’s average daily net assets over $2 billion.
Pioneer Flexible Opportunities Fund | Annual Report | 10/31/20 53
The Subsidiary has entered into a separate management contract with the Adviser, pursuant to which the Adviser manages the assets of the Subsidiary. As compensation for its management services to the Subsidiary and expenses incurred with respect to the Subsidiary, the Subsidiary pays the Adviser a fee at the annual rate of 0.70% of the Subsidiary’s average daily net assets up to $1 billion, 0.675% of the next $1 billion of the Subsidiary’s average daily net assets and 0.65% of the Subsidiary’s average daily net assets over $2 billion. This fee is accrued daily and paid monthly.
For the year ended October 31, 2020, the effective management fee (excluding waivers and/or assumption of expenses) was equivalent to 0.70% of the Fund’s average daily net assets.
The Adviser has contractually agreed to limit ordinary operating expenses (ordinary operating expenses means all fund expenses other than taxes, brokerage commissions, acquired fund fees and expenses and extraordinary expenses, such as litigation) to the extent required to reduce Fund expenses to 1.20%, 0.90% and 0.90% of the average daily net assets attributable to Class A, Class K and Class Y shares, respectively. This expense limitation is in effect through March 1, 2021. Fees and expenses of other investment companies in which the Fund may invest are not included in the expense limitations noted above. There can be no assurance that the Adviser will extend the expense limitation agreement beyond the date referred to above. Fees waived and expenses reimbursed during the year ended October 31, 2020 are reflected in the Statement of Operations.
In addition, under the management and administration agreements, certain other services and costs, including accounting, regulatory reporting and insurance premiums, are paid by the Fund as administrative reimbursements. Included in “Due to affiliates” reflected on the Statement of Assets and Liabilities is $142,619 in management fees, administrative costs and certain other reimbursements payable to the Adviser at October 31, 2020.
3. Transfer Agent
DST Asset Manager Solutions, Inc. serves as the transfer agent to the Fund at negotiated rates. Transfer agent fees and payables shown on the Statement of Operations and the Statement of Assets and Liabilities, respectively, include sub-transfer agent expenses incurred through the Fund’s omnibus relationship contracts.
54 Pioneer Flexible Opportunities Fund | Annual Report | 10/31/20
In addition, the Fund reimbursed the transfer agent for out-of-pocket expenses incurred by the transfer agent related to shareowner communications activities such as proxy and statement mailings, and outgoing phone calls. For the year ended October 31, 2020, such out-of-pocket expenses by class of shares were as follows:
| Shareowner Communications: | ||||
Class A | $ | 23,768 | ||
Class C | 8,803 | |||
Class K | 28 | |||
Class R | 176 | |||
Class Y | 11,456 | |||
| Total | $ | 44,231 | ||
4. Distribution and Service Plans
The Fund has adopted a distribution plan (the “Plan”) pursuant to Rule 12b-1 of the Investment Company Act of 1940 with respect to its Class A, Class C and Class R shares. Pursuant to the Plan, the Fund pays the Distributor 0.25% of the average daily net assets attributable to Class A shares as compensation for personal services and/or account maintenance services or distribution services with regard to Class A shares. Pursuant to the Plan, the Fund also pays the Distributor 1.00% of the average daily net assets attributable to Class C shares. The fee for Class C shares consists of a 0.25% service fee and a 0.75% distribution fee paid as compensation for personal services and/or account maintenance services or distribution services with regard to Class C shares. Included in “Due to affiliates” reflected on the Statement of Assets and Liabilities is $7,596 in distribution fees payable to the Distributor at October 31, 2020.
The Fund also has adopted a separate service plan for Class R shares (the “Service Plan”). The Service Plan authorizes the Fund to pay securities dealers, plan administrators or other service organizations that agree to provide certain services to retirement plans or plan participants holding shares of the Fund a service fee of up to 0.50% of the Fund’s average daily net assets attributable to Class R shares held by such plans.
In addition, redemptions of Class A and Class C shares may be subject to a contingent deferred sales charge (“CDSC”). A CDSC of 1.00% may be imposed on redemptions of certain net asset value purchases of Class A shares within 12 months of purchase. Redemptions of Class C shares within 12 months of purchase are subject to a CDSC of 1.00%, based on the lower of cost or market value of shares being redeemed. Shares purchased as part of an exchange remain subject to any CDSC that applied to the original purchase of those shares. There is no CDSC for Class K, Class R and Class Y shares. Proceeds from the CDSCs are paid to the Distributor. For the year ended October 31, 2020, CDSCs in the amount of $4,517 were paid to the Distributor.
Pioneer Flexible Opportunities Fund | Annual Report | 10/31/20 55
5. Line of Credit Facility
The Fund, along with certain other funds in the Pioneer Family of Funds (the “Funds”), participates in a committed, unsecured revolving line of credit (“credit facility”). Borrowings are used solely for temporary or emergency purposes. The Fund may borrow up to the lesser of the amount available under the credit facility or the limits set for borrowing by the Fund’s prospectus and the 1940 Act. Effective March 11, 2020, the Fund participates in a facility in the amount of $300 million. Prior to March 11, 2020, the Fund participated in a facility in the amount of $250 million. Under such facility, depending on the type of loan, interest on borrowings is payable at the London Interbank Offered Rate (“LIBOR”) plus a credit spread. The Fund also pays an annual commitment fee in the amount of 0.30% of the daily unused portion of each lender’s commitment to participate in the credit facility. The commitment fee is allocated among participating Funds based on an allocation schedule set forth in the credit agreement. For the year ended October 31, 2020, the Fund had no borrowings under the credit facility.
6. Master Netting Agreements
The Fund has entered into an International Swaps and Derivatives Association, Inc. Master Agreement (“ISDA Master Agreement”) or similar agreement with substantially all of its derivative counterparties. An ISDA Master Agreement is a bilateral agreement between the Fund and a counterparty that governs the trading of certain Over the Counter (“OTC”) derivatives and typically contains, among other things, close-out and set-off provisions which apply upon the occurrence of an event of default and/or a termination event as defined under the relevant ISDA Master Agreement. The ISDA Master Agreement may also give a party the right to terminate all transactions traded under such agreement if, among other things, there is deterioration in the credit quality of the other party.
Upon an event of default or a termination of the ISDA Master Agreement, the non-defaulting party has the right to close-out all transactions under such agreement and to net amounts owed under each transaction to determine one net amount payable by one party to the other. The right to close out and net payments across all transactions under the ISDA Master Agreement could result in a reduction of the Fund’s credit risk to its counterparty equal to any amounts payable by the Fund under the applicable transactions, if any. However, the Fund’s right to set-off may be restricted or prohibited by the bankruptcy or insolvency laws of the particular jurisdiction to which each specific ISDA Master Agreement of each counterparty is subject.
The collateral requirements for derivatives transactions under an ISDA Master Agreement are governed by a credit support annex to the ISDA Master Agreement. Collateral requirements are generally determined at the close of
56 Pioneer Flexible Opportunities Fund | Annual Report | 10/31/20
business each day and are typically based on changes in market values for each transaction under an ISDA Master Agreement and netted into one amount for such agreement. Generally, the amount of collateral due from or to a counterparty is subject to threshold (a “minimum transfer amount”) before a transfer is required, which may vary by counterparty. Collateral pledged for the benefit of the Fund and/or counterparty is held in segregated accounts by the Fund’s custodian and cannot be sold, re-pledged, assigned or otherwise used while pledged. Cash that has been segregated to cover the Fund’s collateral obligations, if any, will be reported separately on the Statement of Assets and Liabilities as “Swaps collateral”. Securities pledged by the Fund as collateral, if any, are identified as such in the Schedule of Investments.
Financial instruments subject to an enforceable master netting agreement, such as an ISDA Master Agreement, have been offset on the Statement of Assets and Liabilities. The following charts show gross assets and liabilities of the Fund as of October 31, 2020.
| Derivative Assets | Derivatives | Non-Cash | Cash | Net Amount | ||||||||||||||||
| Subject to Master | Available for | Collateral | Collateral | of Derivative | ||||||||||||||||
| Counterparty | Netting Agreement | Offset | Received (a) | Received (a) | Assets (b) | |||||||||||||||
Citibank NA | $ | 913,465 | $ | (320,670 | ) | $ | — | $ | (349,999 | ) | $ | 242,796 | ||||||||
Goldman Sachs | ||||||||||||||||||||
| International | — | — | — | — | — | |||||||||||||||
| Total | $ | 913,465 | $ | (320,670 | ) | $ | — | $ | (349,999 | ) | $ | 242,796 | ||||||||
| Derivative Liabilities | Derivatives | Non-Cash | Cash | Net Amount | ||||||||||||||||
| Subject to Master | Available for | Collateral | Collateral | of Derivative | ||||||||||||||||
| Counterparty | Netting Agreement | Offset | Pledged (a) | Pledged (a) | Liabilities (c) | |||||||||||||||
Citibank NA | $ | 320,670 | $ | (320,670 | ) | $ | — | $ | — | $ | — | |||||||||
Goldman Sachs | ||||||||||||||||||||
| International | 265,762 | — | — | — | 265,762 | |||||||||||||||
| Total | $ | 586,432 | $ | (320,670 | ) | $ | — | $ | — | $ | 265,762 | |||||||||
(a) The amount presented here may be less than the total amount of collateral received/pledged as the net amount of derivative assets and liabilities cannot be less than $0.
(b) Represents the net amount due from the counterparty in the event of default.
(c) Represents the net amount payable to the counterparty in the event of default.
7. Additional Disclosures about Derivative Instruments and Hedging Activities
The Fund’s use of derivatives may enhance or mitigate the Fund’s exposure to the following risks:
Interest rate risk relates to the fluctuations in the value of interest-bearing securities due to changes in the prevailing levels of market interest rates.
Credit risk relates to the ability of the issuer of a financial instrument to make further principal or interest payments on an obligation or commitment that it has to the Fund.
Pioneer Flexible Opportunities Fund | Annual Report | 10/31/20 57
Foreign exchange rate risk relates to fluctuations in the value of an asset or liability due to changes in currency exchange rates.
Equity risk relates to the fluctuations in the value of financial instruments as a result of changes in market prices (other than those arising from interest rate risk or foreign exchange rate risk), whether caused by factors specific to an individual investment, its issuer, or all factors affecting all instruments traded in a market or market segment.
Commodity risk relates to the risk that the value of a commodity or commodity index will fluctuate based on increases or decreases in the commodities market and factors specific to a particular industry or commodity.
The fair value of open derivative instruments (not considered to be hedging instruments for accounting disclosure purposes) by risk exposure at October 31, 2020, was as follows:
The effect of derivative instruments (not considered to be hedging instruments for accounting disclosure purposes) on the Statement of Assets and Liabilities by risk exposure at October 31, 2020, was as follows:
| Consolidated Statement of Assets and Liabilities | ||||||||||||||||||||
| Foreign | ||||||||||||||||||||
| Interest | Credit | Exchange | Equity | Commodity | ||||||||||||||||
| Rate Risk | Risk | Rate Risk | Risk | Risk | ||||||||||||||||
| Assets | ||||||||||||||||||||
| Options | ||||||||||||||||||||
| purchased* | $ | — | $ | — | $ | 95,175 | $ | 1,241,965 | $ | — | ||||||||||
| Net unrealized | ||||||||||||||||||||
| appreciation on | ||||||||||||||||||||
| futures contracts | — | — | 126,656 | 635,755 | — | |||||||||||||||
| Total Value | $ | — | $ | — | $ | 221,831 | $ | 1,877,720 | $ | — | ||||||||||
| Liabilities | ||||||||||||||||||||
| Swap contracts, | ||||||||||||||||||||
| at value | $ | — | $ | — | $ | — | $ | (586,432 | ) | $ | — | |||||||||
| Total Value | $ | — | $ | — | $ | — | $ | (586,432 | ) | $ | — | |||||||||
* Reflects the market value of purchased option contracts (see Note 1I.). These amounts are included in investments in unaffiliated issuers, at value, on the consolidated statement of assets and liabilities.
58 Pioneer Flexible Opportunities Fund | Annual Report | 10/31/20
The effect of derivative instruments (not considered to be hedging instruments for accounting disclosure purposes) on the Statement of Operations by risk exposure at October 31, 2020, was as follows:
| Consolidated Statement of Operations | ||||||||||||||||||||
| Foreign | ||||||||||||||||||||
| Interest | Credit | Exchange | Equity | Commodity | ||||||||||||||||
| Rate Risk | Risk | Rate Risk | Risk | Risk | ||||||||||||||||
| Net realized gain | ||||||||||||||||||||
| (loss) on: | ||||||||||||||||||||
| Options | ||||||||||||||||||||
| purchased* | $ | — | $ | — | $ | 246,795 | $ | (7,804,227 | ) | $ | — | |||||||||
| Futures contracts | (225,237 | ) | — | (330,286 | ) | 2,704,476 | (3,230,792 | ) | ||||||||||||
| Swap contracts | — | — | — | (1,658,474 | ) | — | ||||||||||||||
| Total Value | $ | (225,237 | ) | $ | — | $ | (83,491 | ) | $ | (6,758,225 | ) | $ | (3,230,792 | ) | ||||||
| Change in net | ||||||||||||||||||||
| unrealized | ||||||||||||||||||||
| appreciation | ||||||||||||||||||||
| (depreciation) on: | ||||||||||||||||||||
| Options | ||||||||||||||||||||
| purchased** | $ | — | $ | — | $ | (76,859 | ) | $ | 2,106,950 | $ | — | |||||||||
| Futures contracts | — | — | 225,350 | 1,463,799 | — | |||||||||||||||
| Swap contracts | — | — | — | (811,545 | ) | — | ||||||||||||||
| Total Value | $ | — | $ | — | $ | 148,491 | $ | 2,759,204 | $ | — | ||||||||||
* Reflects the net realized gain (loss) on purchased option contracts (see Note 1l.). These amounts are included in net realized gain (loss) on investments in unaffiliated issuers, on the consolidated statement of operations.
** Reflects the change in net unrealized appreciation (depreciation) on purchased option contracts (see Note 1I.). These amounts are included in change in net unrealized appreciation (depreciation) on Investments in unaffiliated issuers, on the consolidated statement of operations.
8. Subsequent Event
On November 19, 2020, Amundi Pioneer Asset Management announced it will be rebranding the US business of Amundi as Amundi US effective January 1, 2021. The new brand identity will replace Amundi Pioneer, which was first adopted in July 2017 following the acquisition of Pioneer Investments by Amundi. In connection with these changes, Amundi Pioneer Asset Management. Inc., the investment adviser to the Pioneer funds, will change its name to Amundi Asset Management US, Inc. In addition, Amundi Pioneer Distributor, Inc., the Pioneer funds’ distributor, will change its name to Amundi Distributor US, Inc. The names of the Pioneer funds will not change in connection with this rebranding.
Pioneer Flexible Opportunities Fund | Annual Report | 10/31/20 59
Report of Independent Registered Public
Accounting Firm
To the Board of Trustees of Pioneer Series Trust VI and the Shareowners of
Pioneer Flexible Opportunities Fund:
Accounting Firm
To the Board of Trustees of Pioneer Series Trust VI and the Shareowners of
Pioneer Flexible Opportunities Fund:
Opinion on the Financial Statements
We have audited the accompanying consolidated statement of assets and liabilities of Pioneer Flexible Opportunities Fund (the “Fund”) (one of the funds constituting Pioneer Series Trust VI (the “Trust”)), including the consolidated schedule of investments, as of October 31, 2020, and the related consolidated statement of operations for the year then ended, the consolidated statements of changes in net assets for each of the two years in the period then ended, the consolidated financial highlights for each of the four years in the period then ended and the related notes (collectively referred to as the “financial statements”). The consolidated financial highlights for the period ended October 31, 2016 were audited by another independent registered public accounting firm whose report, dated December 23, 2016, expressed an unqualified opinion on those consolidated financial highlights. In our opinion, the financial statements present fairly, in all material respects, the consolidated financial position of the Fund (one of the funds constituting Pioneer Series Trust VI) at October 31, 2020, the consolidated results of its operations for the year then ended, the consolidated changes in its net assets for each of the two years in the period then ended and its consolidated financial highlights for each of the four years in the period then ended, in conformity with U.S. generally accepted accounting principles.
Basis for Opinion
These financial statements are the responsibility of the Trust’s management. Our responsibility is to express an opinion on the Fund’s financial statements based on our audits. We are a public accounting firm registered with the Public Company Accounting Oversight Board (United States) (“PCAOB”) and are required to be independent with respect to the Trust in accordance with the U.S. federal securities laws and the applicable rules and regulations of the Securities and Exchange Commission and the PCAOB.
We conducted our audits in accordance with the standards of the PCAOB. Those standards require that we plan and perform the audit to obtain reasonable assurance about whether the financial statements are free of material misstatement, whether due to error or fraud. The Trust is not required to have, nor were we engaged to perform, an audit of the Trust’s internal control over financial reporting. As part of our audits, we are required to obtain an understanding of internal control over financial
60 Pioneer Flexible Opportunities Fund | Annual Report | 10/31/20
reporting, but not for the purpose of expressing an opinion on the effectiveness of the Trust’s internal control over financial reporting. Accordingly, we express no such opinion.
Our audits included performing procedures to assess the risks of material misstatement of the financial statements, whether due to error or fraud, and performing procedures that respond to those risks. Such procedures included examining, on a test basis, evidence regarding the amounts and disclosures in the financial statements. Our procedures included confirmation of securities owned as of October 31, 2020, by correspondence with the custodian and brokers or by other appropriate auditing procedures where replies from brokers were not received. Our audits also included evaluating the accounting principles used and significant estimates made by management, as well as evaluating the overall presentation of the financial statements. We believe that our audits provide a reasonable basis for our opinion.

We have served as the auditor of one or more Amundi Pioneer investment companies since 2017.
Boston, Massachusetts
December 18, 2020
December 18, 2020
Pioneer Flexible Opportunities Fund | Annual Report | 10/31/20 61
For the year ended October 31, 2020, certain dividends paid by the Fund may be subject to a maximum tax rate of 20%, as provided for by the Jobs and Growth Tax Relief Reconciliation Act (the Act) of 2003. The Fund intends to designate up to the maximum amount of such dividends allowable under the Act, as taxed at a maximum rate of 20%. Complete information will be computed and reported in conjunction with your 2020 Form 1099-DIV. The qualifying percentage of the Fund’s ordinary income dividends for the purpose of the corporate dividends received deduction was 33.48%.
62 Pioneer Flexible Opportunities Fund | Annual Report | 10/31/20
As required by law, the Fund has adopted and implemented a liquidity risk management program (the “Program”) that is designed to assess and manage liquidity risk. Liquidity risk is the risk that the Fund could not meet requests to redeem its shares without significant dilution of remaining investors’ interests in the Fund. The Fund’s Board of Trustees designated a liquidity risk management committee (the “Committee”) consisting of employees of Amundi Pioneer Asset Management, Inc. (the “Adviser”) to administer the Program.
The Committee provided the Board of Trustees with a report that addressed the operation of the Program and assessed its adequacy and effectiveness of implementation (the “Report”). The Report covered the period from December 1, 2018 through March 31, 2020 (the “Reporting Period”).
The Report confirmed that, throughout the Reporting Period, the Committee had monitored the Fund’s portfolio liquidity and liquidity risk on an ongoing basis, as described in the Program and in Board reporting throughout the Reporting Period.
The Report discussed the Committee’s annual review of the Program, which addressed, among other things, the following elements of the Program:
The Committee reviewed the Fund’s investment strategy and liquidity of portfolio investments during both normal and reasonably foreseeable stressed conditions. The Committee noted that the Fund’s investment strategy continues to be appropriate for an open-end fund, taking into account, among other things, whether and to what extent the Fund held less liquid and illiquid assets and the extent to which any such investments affected the Fund’s ability to meet redemption requests. In managing and reviewing the Fund’s liquidity risk, the Committee also considered the extent to which the Fund’s investment strategy involves a relatively concentrated portfolio or large positions in particular issuers, the extent to which the Fund uses borrowing for investment purposes, and the extent to which the Fund uses derivatives (including for hedging purposes). The Committee also reviewed the Fund’s short-term and long-term cash flow projections during both normal and reasonably foreseeable stressed conditions. In assessing the Fund’s cash flow projections, the Committee considered, among other factors, historical net redemption activity, redemption policies, ownership concentration, distribution channels, and the degree of certainty associated with the Fund’s short-term and long-term cash flow projections. The Committee also considered the Fund’s
Pioneer Flexible Opportunities Fund | Annual Report | 10/31/20 63
holdings of cash and cash equivalents, as well as borrowing arrangements and other funding sources, including, if applicable, the Fund’s participation in a credit facility, as components of the Fund’s ability to meet redemption requests. The Fund has adopted an in-kind redemption policy which may be utilized to meet larger redemption requests.
The Committee reviewed the Program’s liquidity classification methodology for categorizing the Fund’s investments into one of four liquidity buckets. In reviewing the Fund’s investments, the Committee considered, among other factors, whether trading varying portions of a position in a particular portfolio investment or asset class in sizes the Fund would reasonably anticipate trading, would be reasonably expected to significantly affect liquidity.
The Committee performed an analysis to determine whether the Fund is required to maintain a Highly Liquid Investment Minimum, and determined that no such minimum is required because the Fund primarily holds highly liquid investments.
The Report stated that the Committee concluded the Program operates adequately and effectively, in all material respects, to assess and manage the Fund’s liquidity risk throughout the Reporting Period.
64 Pioneer Flexible Opportunities Fund | Annual Report | 10/31/20
Amundi Pioneer Asset Management, Inc. (“APAM”) serves as the investment adviser to Pioneer Floating Rate Fund (the “Fund”) pursuant to an investment management agreement between APAM and the Fund. In order for APAM to remain the investment adviser of the Fund, the Trustees of the Fund must determine annually whether to renew the investment management agreement for the Fund.
The contract review process began in January 2020 as the Trustees of the Fund agreed on, among other things, an overall approach and timeline for the process. Contract review materials were provided to the Trustees in March 2020, July 2020 and September 2020. In addition, the Trustees reviewed and discussed the Fund’s performance at regularly scheduled meetings throughout the year, and took into account other information related to the Fund provided to the Trustees at regularly scheduled meetings, in connection with the review of the Fund’s investment management agreement.
In March 2020, the Trustees, among other things, discussed the memorandum provided by Fund counsel that summarized the legal standards and other considerations that are relevant to the Trustees in their deliberations regarding the renewal of the investment management agreement, and reviewed and discussed the qualifications of the investment management teams for the Fund, as well as the level of investment by the Fund’s portfolio managers in the Fund. In July 2020, the Trustees, among other things, reviewed the Fund’s management fees and total expense ratios, the financial statements of APAM and its parent companies, profitability analyses provided by APAM, and analyses from APAM as to possible economies of scale. The Trustees also reviewed the profitability of the institutional business of APAM and APAM’s affiliate, Amundi Pioneer Institutional Asset Management, Inc. (“APIAM” and, together with APAM, “Amundi Pioneer”), as compared to that of APAM’s fund management business, and considered the differences between the fees and expenses of the Fund and the fees and expenses of APAM’s and APIAM’s institutional accounts, as well as the different services provided by APAM to the Fund and by APAM and APIAM to the institutional accounts. The Trustees further considered contract review materials, including additional materials received in response to the Trustees’ request, in September 2020.
Pioneer Flexible Opportunities Fund | Annual Report | 10/31/20 65
At a meeting held on September 15, 2020, based on their evaluation of the information provided by APAM and third parties, the Trustees of the Fund, including the Independent Trustees voting separately, unanimously approved the renewal of the investment management agreement for another year. In approving the renewal of the investment management agreement, the Trustees considered various factors that they determined were relevant, including the factors described below. The Trustees did not identify any single factor as the controlling factor in determining to approve the renewal of the agreement.
Nature, Extent and Quality of Services
The Trustees considered the nature, extent and quality of the services that had been provided by APAM to the Fund, taking into account the investment objective and strategy of the Fund. The Trustees also reviewed APAM’s investment approach for the Fund and its research process. The Trustees considered the resources of APAM and the personnel of APAM who provide investment management services to the Fund. They also reviewed the amount of non-Fund assets managed by the portfolio managers of the Fund. They considered the non-investment resources and personnel of APAM that are involved in APAM’s services to the Fund, including APAM’s compliance, risk management, and legal resources and personnel. The Trustees noted the substantial attention and high priority given by APAM’s senior management to the Pioneer Fund complex. The Trustees considered the implementation and effectiveness of APAM’s business continuity plan in response to the COVID-19 pandemic.
The Trustees considered that APAM supervises and monitors the performance of the Fund’s service providers and provides the Fund with personnel (including Fund officers) and other resources that are necessary for the Fund’s business management and operations. The Trustees also considered that, as administrator, APAM is responsible for the administration of the Fund’s business and other affairs. The Trustees considered the fees paid to APAM for the provision of administration services.
Based on these considerations, the Trustees concluded that the nature, extent and quality of services that had been provided by APAM to the Fund were satisfactory and consistent with the terms of the investment management agreement.
Performance of the Fund
In considering the Fund’s performance, the Trustees regularly review and discuss throughout the year data prepared by APAM and information comparing the Fund’s performance with the performance of its peer group of funds, as classified by Morningstar, Inc. (Morningstar), and with the
66 Pioneer Flexible Opportunities Fund | Annual Report | 10/31/20
performance of the Fund’s benchmark index. They also discuss the Fund’s performance with APAM on a regular basis. The Trustees’ regular reviews and discussions were factored into the Trustees’ deliberations concerning the renewal of the investment management agreement.
Management Fee and Expenses
The Trustees considered information showing the fees and expenses of the Fund in comparison to the management fees of its peer group of funds as classified by Morningstar and also to the expense ratios of a peer group of funds selected on the basis of criteria determined by the Independent Trustees for this purpose using data provided by Strategic Insight Mutual Fund Research and Consulting, LLC (Strategic Insight), an independent third party. The peer group comparisons referred to below are organized in quintiles. Each quintile represents one-fifth of the peer group. In all peer group comparisons referred to below, first quintile is most favorable to the Fund’s shareowners. The Trustees noted that they separately review and consider the impact of the Fund’s transfer agency and Fund- and APAM-paid expenses for sub-transfer agency and intermediary arrangements, and that the results of the most recent such review were considered in the consideration of the Fund’s expense ratio.
The Trustees considered that the Fund’s management fee for the most recent fiscal year was in the second quintile relative to the management fees paid by other funds in its Morningstar category for the comparable period. The Trustees considered that the expense ratio of the Fund’s Class A shares for the most recent fiscal year was in the fifth quintile relative to its Strategic Insight peer group for the comparable period. The Trustees considered that the expense ratio of the Fund’s Class Y shares for the most recent fiscal year was in the first quintile relative to its Strategic Insight peer group for the comparable period. The Trustees noted that APAM had agreed to waive fees and/or reimburse expenses in order to limit the ordinary operating expenses of the Fund.
The Trustees reviewed management fees charged by APAM and APIAM to institutional and other clients, including publicly offered European funds sponsored by APAM’s affiliates, unaffiliated U.S. registered investment companies (in a sub-advisory capacity), and unaffiliated foreign and domestic separate accounts. The Trustees also considered APAM’s costs in providing services to the Fund and APAM’s and APIAM’s costs in providing services to the other clients and considered the differences in management fees and profit margins for fund and non-fund services. In evaluating the fees associated with APAM’s and APIAM’s client accounts, the Trustees took into account the respective demands, resources and complexity
Pioneer Flexible Opportunities Fund | Annual Report | 10/31/20 67
associated with the Fund and other client accounts. The Trustees noted that, in some instances, the fee rates for those clients were lower than the management fee for the Fund and considered that, under the investment management agreement with the Fund, APAM performs additional services for the Fund that it does not provide to those other clients or services that are broader in scope, including oversight of the Fund’s other service providers and activities related to compliance and the extensive regulatory and tax regimes to which the Fund is subject. The Trustees also considered the entrepreneurial risks associated with APAM’s management of the Fund.
The Trustees concluded that the management fee payable by the Fund to APAM was reasonable in relation to the nature and quality of the services provided by APAM.
Profitability
The Trustees considered information provided by APAM regarding the profitability of APAM with respect to the advisory services provided by APAM to the Fund, including the methodology used by APAM in allocating certain of its costs to the management of the Fund. The Trustees also considered APAM’s profit margin in connection with the overall operation of the Fund. They further reviewed the financial results, including the profit margins, realized by APAM and APIAM from non-fund businesses. The Trustees considered APAM’s profit margins in comparison to the limited industry data available and noted that the profitability of any adviser was affected by numerous factors, including its organizational structure and method for allocating expenses. The Trustees concluded that APAM’s profitability with respect to the management of the Fund was not unreasonable.
Economies of Scale
The Trustees considered APAM’s views relating to economies of scale in connection with the Pioneer Funds as fund assets grow and the extent to which any such economies of scale are shared with the Fund and Fund shareholders. The Trustees recognize that economies of scale are difficult to identify and quantify, and that, among other factors that may be relevant, are the following: fee levels, expense subsidization, investment by APAM in research and analytical capabilities and APAM’s commitment and resource allocation to the Fund. The Trustees noted that profitability also may be an indicator of the availability of any economies of scale, although profitability may vary for other reasons including due to reductions in expenses. The Trustees concluded that economies of scale, if any, were being appropriately shared with the Fund.
68 Pioneer Flexible Opportunities Fund | Annual Report | 10/31/20
Other Benefits
The Trustees considered the other benefits that APAM enjoys from its relationship with the Fund. The Trustees considered the character and amount of fees paid or to be paid by the Fund, other than under the investment management agreement, for services provided by APAM and its affiliates. The Trustees further considered the revenues and profitability of APAM’s businesses other than the Fund business. To the extent applicable, the Trustees also considered the benefits to the Fund and to APAM and its affiliates from the use of “soft” commission dollars generated by the Fund to pay for research and brokerage services.
The Trustees considered that Amundi Pioneer is the principal U.S. asset management business of Amundi, which is one of the largest asset managers globally. Amundi’s worldwide asset management business manages over $1.7 trillion in assets (including the Pioneer Funds). The Trustees considered that APAM’s relationship with Amundi creates potential opportunities for APAM, APIAM and Amundi that derive from APAM’s relationships with the Fund, including Amundi’s ability to market the services of APAM globally. The Trustees noted that APAM has access to additional research and portfolio management capabilities as a result of its relationship with Amundi and Amundi’s enhanced global presence that may contribute to an increase in the resources available to APAM. The Trustees considered that APAM and the Fund receive reciprocal intangible benefits from the relationship, including mutual brand recognition and, for the Fund, direct and indirect access to the resources of a large global asset manager. The Trustees concluded that any such benefits received by APAM as a result of its relationship with the Fund were reasonable.
Conclusion
After consideration of the factors described above as well as other factors, the Trustees, including the Independent Trustees, concluded that the investment management agreement for the Fund, including the fees payable thereunder, was fair and reasonable and voted to approve the proposed renewal of the investment management agreement.
Pioneer Flexible Opportunities Fund | Annual Report | 10/31/20 69
Investment Adviser and Administrator
Amundi Pioneer Asset Management, Inc.
Custodian and Sub-Administrator
Brown Brothers Harriman & Co.
Independent Registered Public Accounting Firm
Ernst & Young LLP
Principal Underwriter
Amundi Pioneer Distributor, Inc.
Legal Counsel
Morgan, Lewis & Bockius LLP
Transfer Agent
DST Asset Manager Solutions, Inc.
Proxy Voting Policies and Procedures of the Fund are available without charge, upon request, by calling our toll free number (1-800-225-6292). Information regarding how the Fund voted proxies relating to portfolio securities during the most recent 12-month period ended June 30 is publicly available to shareowners at www.amundipioneer.com/us. This information is also available on the Securities and Exchange Commission’s web site at www.sec.gov.
Trustees and Officers
The Fund’s Trustees and officers are listed below, together with their principal occupations and other directorships they have held during at least the past five years. Trustees who are interested persons of the Fund within the meaning of the 1940 Act are referred to as Interested Trustees. Trustees who are not interested persons of the Fund are referred to as Independent Trustees. Each of the Trustees serves as a Trustee of each of the 45 U.S. registered investment portfolios for which Amundi serves as investment adviser (the “Pioneer Funds”). The address for all Trustees and all officers of the Fund is 60 State Street, Boston, Massachusetts 02109.
The Statement of Additional Information of the Fund includes additional information about the Trustees and is available, without charge, upon request, by calling 1-800-225-6292.
70 Pioneer Flexible Opportunities Fund | Annual Report | 10/31/20
Independent Trustees
| Name, Age and Position | Term of Office and | Other Directorships | |
| Held With the Fund | Length of Service | Principal Occupation | Held by Trustee |
| Thomas J. Perna (70) | Trustee since 2010. | Private investor (2004 – 2008 and 2013 – present); Chairman (2008 – 2013) | Director, Broadridge Financial |
Chairman of the Board | Serves until a successor | and Chief Executive Officer (2008 – 2012), Quadriserv, Inc. (technology | Solutions, Inc. (investor |
and Trustee | trustee is elected or | products for securities lending industry); and Senior Executive Vice | communications and securities |
earlier retirement | President, The Bank of New York (financial and securities services) | processing provider for financial | |
or removal. | (1986 – 2004) | services industry) (2009 – present); | |
Director, Quadriserv, Inc. (2005 – | |||
2013); and Commissioner, New | |||
Jersey State Civil Service | |||
Commission (2011 – 2015) | |||
| John E. | Trustee since 2019. | Of Counsel (2019 – present), Partner (1983-2018), Sullivan & | Chairman, The Lakeville Journal |
| Baumgardner, Jr. (69) | Serves until a successor | Cromwell LLP (law firm). | Company, LLC, (privately-held |
Trustee | trustee is elected or | community newspaper group) | |
earlier retirement | (2015-present) | ||
or removal. | |||
| Diane Durnin (63) | Trustee since 2019. | Managing Director - Head of Product Strategy and Development, BNY | None |
Trustee | Serves until a successor | Mellon Investment Management (investment management firm) (2012-2018); | |
trustee is elected or | Vice Chairman – The Dreyfus Corporation (2005 – 2018): Executive Vice | ||
earlier retirement | President Head of Product, BNY Mellon Investment Management | ||
or removal. | (2007-2012); Executive Director- Product Strategy, Mellon Asset Management | ||
(2005-2007); Executive Vice President Head of Products, Marketing and | |||
Client Service, Dreyfus Corporation (investment management firm) | |||
(2000-2005); and Senior Vice President Strategic Product and Business | |||
Development, Dreyfus Corporation (1994-2000) |
Pioneer Flexible Opportunities Fund | Annual Report | 10/31/20 71
Independent Trustees (continued)
| Name, Age and Position | Term of Office and | Other Directorships | |
| Held With the Fund | Length of Service | Principal Occupation | Held by Trustee |
| Benjamin M. Friedman (76) | Trustee since 2010. | William Joseph Maier Professor of Political Economy, Harvard University | Trustee, Mellon Institutional Funds |
Trustee | Serves until a successor | (1972 – present) | Investment Trust and Mellon |
trustee is elected or | Institutional Funds Master Portfolio | ||
earlier retirement | (oversaw 17 portfolios in fund | ||
or removal. | complex) (1989 - 2008) | ||
| Lorraine H. Monchak (64) | Trustee since 2017. | Chief Investment Officer, 1199 SEIU Funds (healthcare workers union | None |
Trustee | (Advisory Trustee from | pension funds) (2001 – present); Vice President – International Investments | |
2014 - 2017). Serves | Group, American International Group, Inc. (insurance company) | ||
until a successor trustee | (1993 – 2001); Vice President – Corporate Finance and Treasury Group, | ||
is elected or earlier | Citibank, N.A. (1980 – 1986 and 1990 – 1993); Vice President – Asset/Liability | ||
retirement or removal. | Management Group, Federal Farm Funding Corporation | ||
(government-sponsored issuer of debt securities) (1988 – 1990); Mortgage | |||
Strategies Group, Shearson Lehman Hutton, Inc. (investment bank) | |||
(1987 – 1988); and Mortgage Strategies Group, Drexel Burnham Lambert, | |||
Ltd. (investment bank) (1986 – 1987) | |||
| Marguerite A. Piret (72) | Trustee since 2010. | Chief Financial Officer, American Ag Energy, Inc. (controlled environment | Director of New America High |
Trustee | Serves until a successor | and agriculture company) (2016 – present); and President and Chief | Income Fund, Inc. (closed-end |
trustee is elected or | Executive Officer, Metric Financial Inc. (formerly known as Newbury Piret | investment company) | |
earlier retirement | Company) (investment banking firm) (1981 – 2019) | (2004 – present); and Member, | |
or removal. | Board of Governors, Investment | ||
Company Institute (2000 – 2006) |
72 Pioneer Flexible Opportunities Fund | Annual Report | 10/31/20
| Name, Age and Position | Term of Office and | Other Directorships | |
| Held With the Fund | Length of Service | Principal Occupation | Held by Trustee |
| Fred J. Ricciardi (73) | Trustee since 2014. | Private investor (2020 – present); Consultant (investment company services) | None |
Trustee | Serves until a successor | (2012 – 2020); Executive Vice President, BNY Mellon (financial and | |
trustee is elected or | investment company services) (1969 – 2012); Director, BNY International | ||
earlier retirement | Financing Corp. (financial services) (2002 – 2012); Director, Mellon | ||
or removal. | Overseas Investment Corp. (financial services) (2009 – 2012); Director, | ||
Financial Models (technology) (2005-2007); Director, BNY Hamilton Funds, | |||
Ireland (offshore investment companies) (2004-2007); Chairman/Director, | |||
AIB/BNY Securities Services, Ltd., Ireland (financial services) (1999-2006); | |||
and Chairman, BNY Alternative Investment Services, Inc. (financial services) | |||
(2005-2007) |
Pioneer Flexible Opportunities Fund | Annual Report | 10/31/20 73
Interested Trustees
| Name, Age and Position | Term of Office and | Other Directorships | |
| Held With the Fund | Length of Service | Principal Occupation | Held by Trustee |
| Lisa M. Jones (58)* | Trustee since 2017. | Director, CEO and President of Amundi Pioneer Asset Management USA, | None |
Trustee, President and | Serves until a successor | Inc. (investment management firm) (since September 2014); Director, CEO | |
Chief Executive Officer | trustee is elected or | and President of Amundi Pioneer Asset Management, Inc. (since | |
earlier retirement | September 2014); Director, CEO and President of Amundi Pioneer | ||
or removal | Distributor, Inc. (since September 2014); Director, CEO and President of | ||
Amundi Pioneer Institutional Asset Management, Inc. (since September 2014); | |||
Chair, Amundi Pioneer Asset Management USA, Inc., Amundi Pioneer | |||
Distributor, Inc. and Amundi Pioneer Institutional Asset Management, Inc. | |||
(September 2014 – 2018); Managing Director, Morgan Stanley Investment | |||
Management (investment management firm) (2010 – 2013); Director of | |||
Institutional Business, CEO of International, Eaton Vance Management | |||
(investment management firm) (2005 – 2010); and Director of | |||
Amundi USA, Inc. (since 2017) | |||
| Kenneth J. Taubes (62)* | Trustee since 2014. | Director and Executive Vice President (since 2008) and Chief Investment | None |
Trustee | Serves until a successor | Officer, U.S. (since 2010) of Amundi Pioneer Asset Management USA, Inc. | |
trustee is elected or | (investment management firm); Director and Executive Vice President and | ||
earlier retirement | Chief Investment Officer, U.S. of Amundi (since 2008); Executive Vice | ||
or removal | President and Chief Investment Officer, U.S. of Amundi Institutional Asset | ||
Management, Inc. (since 2009); Portfolio Manager of Amundi (since 1999); | |||
and Director of Amundi USA, Inc. (since 2017) |
* Ms. Jones and Mr. Taubes are Interested Trustees because they are officers or directors of the Fund’s investment adviser and certain of its affiliates.
74 Pioneer Flexible Opportunities Fund | Annual Report | 10/31/20
Fund Officers
| Name, Age and Position | Term of Office and | Other Directorships | |
| Held With the Fund | Length of Service | Principal Occupation | Held by Officer |
| Christopher J. Kelley (55) | Since 2010. Serves at | Vice President and Associate General Counsel of Amundi since January | None |
Secretary and Chief | the discretion of | 2008; Secretary and Chief Legal Officer of all of the Pioneer Funds since | |
Legal Officer | the Board | June 2010; Assistant Secretary of all of the Pioneer Funds from September | |
2003 to May 2010; and Vice President and Senior Counsel of Amundi from | |||
July 2002 to December 2007 | |||
| Carol B. Hannigan (59) | Since 2010. Serves at | Fund Governance Director of Amundi since December 2006 and Assistant | None |
Assistant Secretary | the discretion of | Secretary of all the Pioneer Funds since June 2010; Manager – Fund | |
the Board | Governance of Amundi from December 2003 to November 2006; and | ||
Senior Paralegal of Amundi from January 2000 to November 2003 | |||
| Thomas Reyes (57) | Since 2010. Serves at | Assistant General Counsel of Amundi since May 2013 and Assistant | None |
Assistant Secretary | the discretion of | Secretary of all the Pioneer Funds since June 2010; and Counsel of Amundi | |
the Board | from June 2007 to May 2013 | ||
| Mark E. Bradley (60) | Since 2010. Serves at | Vice President – Fund Treasury of Amundi; Treasurer of all of the Pioneer | None |
Treasurer and | the discretion of | Funds since March 2008; Deputy Treasurer of Amundi from March 2004 to | |
Chief Financial and | the Board | February 2008; and Assistant Treasurer of all of the Pioneer Funds from | |
Accounting Officer | March 2004 to February 2008 | ||
| Luis I. Presutti (55) | Since 2010. Serves at | Director – Fund Treasury of Amundi; and Assistant Treasurer of all of the | None |
Assistant Treasurer | the discretion of | Pioneer Funds | |
the Board | |||
| Gary Sullivan (62) | Since 2010. Serves at | Senior Manager – Fund Treasury of Amundi; and Assistant Treasurer of all | None |
Assistant Treasurer | the discretion of | of the Pioneer Funds | |
the Board |
Pioneer Flexible Opportunities Fund | Annual Report | 10/31/20 75
Fund Officers (continued)
| Name, Age and Position | Term of Office and | Other Directorships | |
| Held With the Fund | Length of Service | Principal Occupation | Held by Officer |
| Antonio Furtado (38) | Since 2020. Serves at | Fund Oversight Manager – Fund Treasury of Amundi; and Assistant | None |
Assistant Treasurer | the discretion of | Treasurer of all of the Pioneer Funds | |
the Board | |||
| John Malone (48) | Since 2018. Serves at | Managing Director, Chief Compliance Officer of Amundi Pioneer Asset | None |
Chief Compliance Officer | the discretion of | Management; Amundi Pioneer Institutional Asset Management, Inc.; and | |
the Board | the Pioneer Funds since September 2018; and Chief Compliance Officer of | ||
Amundi Pioneer Distributor, Inc. since January 2014. | |||
| Kelly O’Donnell (49) | Since 2010. Serves at | Vice President – Amundi Pioneer Asset Management; and Anti-Money | None |
Anti-Money | the discretion of | Laundering Officer of all the Pioneer Funds since 2006 | |
Laundering Officer | the Board |
76 Pioneer Flexible Opportunities Fund | Annual Report | 10/31/20
How to Contact Amundi
We are pleased to offer a variety of convenient ways for you to contact us for assistance or information.
| Call us for: | ||
Account Information, including existing accounts, | ||
new accounts, prospectuses, applications | ||
and service forms | 1-800-225-6292 | |
FactFoneSM for automated fund yields, prices, | ||
account information and transactions | 1-800-225-4321 | |
| Retirement plans information | 1-800-622-0176 | |
| Write to us: | ||
Amundi | ||
P.O. Box 219427 | ||
Kansas City, MO 64121-9427 | ||
| Our toll-free fax | 1-800-225-4240 | |
| Our internet e-mail address | us.askamundipioneer@amundipioneer.com | |
(for general questions about Amundi only) | ||
| Visit our web site: www.amundipioneer.com/us | ||
This report must be preceded or accompanied by a prospectus.
The Fund files a complete schedule of portfolio holdings with the Securities and Exchange Commission for the first and third quarters of each fiscal year as an exhibit to its reports on Form N-PORT. Shareholders may view the filed Form N-PORT by visiting the Commission’s web site at https://www.sec.gov.
Amundi Pioneer Asset Management, Inc.
60 State Street
Boston, MA 02109
www.amundipioneer.com/us
Securities offered through Amundi Pioneer Distributor, Inc.
60 State Street, Boston, MA 02109
Underwriter of Pioneer Mutual Funds, Member SIPC
© 2020 Amundi Pioneer Asset Management 24440-10-1220
60 State Street
Boston, MA 02109
www.amundipioneer.com/us
Securities offered through Amundi Pioneer Distributor, Inc.
60 State Street, Boston, MA 02109
Underwriter of Pioneer Mutual Funds, Member SIPC
© 2020 Amundi Pioneer Asset Management 24440-10-1220
ITEM 2. CODE OF ETHICS.
(a) Disclose whether, as of the end of the period covered by the report, the registrant has adopted a code of ethics that applies to the registrant’s principal executive officer, principal financial officer, principal accounting officer or controller, or persons performing similar functions, regardless of whether these individuals are employed by the registrant or a third party. If the registrant has not adopted such a code of ethics, explain why it has not done so.
The registrant has adopted, as of the end of the period covered by this report, a code of ethics that applies to the registrant’s principal executive officer, principal financial officer, principal accounting officer and controller.
(b) For purposes of this Item, the term “code of ethics” means written standards that are reasonably designed to deter wrongdoing and to promote:
(1) Honest and ethical conduct, including the ethical handling of actual or apparent conflicts of interest between personal and professional relationships;
(2) Full, fair, accurate, timely, and understandable disclosure in reports and documents that a registrant files with, or submits to, the Commission and in other public communications made by the registrant;
(3) Compliance with applicable governmental laws, rules, and regulations;
(4) The prompt internal reporting of violations of the code to an appropriate person or persons identified in the code; and
(5) Accountability for adherence to the code.
(c) The registrant must briefly describe the nature of any amendment, during the period covered by the report, to a provision of its code of ethics that applies to the registrant’s principal executive officer, principal financial officer, principal accounting officer or controller, or persons performing similar functions, regardless of whether these individuals are employed by the registrant or a third party, and that relates to any element of the code of ethics definition enumerated in paragraph (b) of this Item. The registrant must file a copy of any such amendment as an exhibit pursuant to Item 10(a), unless the registrant has elected to satisfy paragraph (f) of this Item by posting its code of ethics on its website pursuant to paragraph (f)(2) of this Item, or by undertaking to provide its code of ethics to any person without charge, upon request, pursuant to paragraph (f)(3) of this Item.
The registrant has made no amendments to the code of ethics during the period covered by this report.
(d) If the registrant has, during the period covered by the report, granted a waiver, including an implicit waiver, from a provision of the code of ethics to the registrant’s principal executive officer, principal financial officer, principal accounting officer or controller, or persons performing similar functions, regardless of whether these individuals are employed by the registrant or a third party, that relates to one or more of the items set forth in paragraph (b) of this Item, the registrant must briefly describe the nature of the waiver, the name of the person to whom the waiver was granted, and the date of the waiver.
Not applicable.
(e) If the registrant intends to satisfy the disclosure requirement under paragraph (c) or (d) of this Item regarding an amendment to, or a waiver from, a provision of its code of ethics that applies to the registrant’s principal executive officer, principal financial officer, principal accounting officer or controller, or persons performing similar functions and that relates to any element of the code of ethics definition
enumerated in paragraph (b) of this Item by posting such information on its Internet website, disclose the registrant’s Internet address and such intention.
Not applicable.
(f) The registrant must:
(1) File with the Commission, pursuant to Item 12(a)(1), a copy of its code of ethics that applies to the registrant’s principal executive officer, principal financial officer, principal accounting officer or controller, or persons performing similar functions, as an exhibit to its annual report on this Form N-CSR (see attachment);
(2) Post the text of such code of ethics on its Internet website and disclose, in its most recent report on this Form N-CSR, its Internet address and the fact that it has posted such code of ethics on its Internet website; or
(3) Undertake in its most recent report on this Form N-CSR to provide to any person without charge, upon request, a copy of such code of ethics and explain the manner in which such request may be made. See Item 10(2)
ITEM 3. AUDIT COMMITTEE FINANCIAL EXPERT.
(a) (1) Disclose that the registrant’s board of trustees has determined that the registrant either:
(i) Has at least one audit committee financial expert serving on its audit committee; or
(ii) Does not have an audit committee financial expert serving on its audit committee.
The registrant’s Board of Trustees has determined that the registrant has at least one audit committee financial expert.
(2) If the registrant provides the disclosure required by paragraph (a)(1)(i) of this Item, it must disclose the name of the audit committee financial expert and whether that person is “independent.” In order to be considered “independent” for purposes of this Item, a member of an audit committee may not, other than in his or her capacity as a member of the audit committee, the board of trustees, or any other board committee:
(i) Accept directly or indirectly any consulting, advisory, or other compensatory fee from the issuer; or
(ii) Be an “interested person” of the investment company as defined in Section 2(a)(19) of the Act (15 U.S.C. 80a-2(a)(19)).
Mr. Fred J. Ricciardi, an independent trustee, is such an audit committee financial expert.
(3) If the registrant provides the disclosure required by paragraph (a)(1) (ii) of this Item, it must explain why it does not have an audit committee financial expert.
Not applicable.
ITEM 4. PRINCIPAL ACCOUNTANT FEES AND SERVICES.
(a) Disclose, under the caption AUDIT FEES, the aggregate fees billed for each of the last two fiscal years for professional services rendered by the principal accountant for the audit of the registrant’s annual financial statements or services that are normally provided by the accountant in connection with statutory and regulatory filings or engagements for those fiscal years.
The audit fees for the Trust were $96,900 payable to Ernst & Young LLP for the year ended October 31, 2020 and $95,000 for the year ended October 31, 2019.
(b) Disclose, under the caption AUDIT-RELATED FEES, the aggregate fees billed in each of the last two fiscal years for assurance and related services by the principal accountant that are reasonably related to the performance of the audit of the registrant’s financial statements and are not reported under paragraph (a) of this Item. Registrants shall describe the nature of the services comprising the fees disclosed under this category.
There were no audit-related services in 2020 or 2019.
(c) Disclose, under the caption TAX FEES, the aggregate fees billed in each of the last two fiscal years for professional services rendered by the principal accountant for tax compliance, tax advice, and tax planning. Registrants shall describe the nature of the services comprising the fees disclosed under this category.
The Trust paid aggregate non-audit fees to Ernst & Young LLP for tax services of $34,020 and $25,189 during the fiscal years ended October 31, 2020 and 2019, respectively.
(d) Disclose, under the caption ALL OTHER FEES, the aggregate fees billed in each of the last two fiscal years for products and services provided by the principal accountant, other than the services reported in paragraphs (a) through (c) of this Item. Registrants shall describe the nature of the services comprising the fees disclosed under this category.
There were no other fees in 2020 or 2019.
(e) (1) Disclose the audit committee’s pre-approval policies and procedures described in paragraph (c)(7) of Rule 2-01 of Regulation S-X.
PIONEER FUNDS
APPROVAL OF AUDIT, AUDIT-RELATED, TAX AND OTHER SERVICES
PROVIDED BY THE INDEPENDENT AUDITOR
SECTION I - POLICY PURPOSE AND APPLICABILITY
The Pioneer Funds recognize the importance of maintaining the independence of their outside auditors. Maintaining independence is a shared responsibility involving Amundi Pioneer Asset Management, Inc, the audit committee and the independent auditors.
The Funds recognize that a Fund’s independent auditors: 1) possess knowledge of the Funds, 2) are able to incorporate certain services into the scope of the audit, thereby avoiding redundant work, cost and disruption of Fund personnel and processes, and 3) have expertise that has value to the Funds. As a result, there are situations where it is desirable to use the Fund’s independent auditors for services in addition to the annual audit and where the potential for conflicts of interests are minimal. Consequently, this policy, which is intended to comply with Rule 210.2-01(C)(7), sets forth guidelines and procedures to
be followed by the Funds when retaining the independent audit firm to perform audit, audit-related tax and other services under those circumstances, while also maintaining independence.
Approval of a service in accordance with this policy for a Fund shall also constitute approval for any other Fund whose pre-approval is required pursuant to Rule 210.2-01(c)(7)(ii).
In addition to the procedures set forth in this policy, any non-audit services that may be provided consistently with Rule 210.2-01 may be approved by the Audit Committee itself and any pre-approval that may be waived in accordance with Rule 210.2-01(c)(7)(i)(C) is hereby waived.
Selection of a Fund’s independent auditors and their compensation shall be determined by the Audit Committee and shall not be subject to this policy.
| SECTION II - POLICY | ||
| SERVICE CATEGORY | SERVICE CATEGORY DESCRIPTION | SPECIFIC PRE-APPROVED SERVICE SUBCATEGORIES |
| I. AUDIT SERVICES | Services that are directly | o Accounting research assistance |
| related to performing the | o SEC consultation, registration | |
| independent audit of the Funds | statements, and reporting | |
| o Tax accrual related matters | ||
| o Implementation of new accounting standards | ||
| o Compliance letters (e.g. rating agency letters) | ||
| o Regulatory reviews and assistance | ||
| regarding financial matters | ||
| o Semi-annual reviews (if requested) | ||
| o Comfort letters for closed end offerings | ||
| II. AUDIT-RELATED | Services which are not | o AICPA attest and agreed-upon procedures |
| SERVICES | prohibited under Rule | o Technology control assessments |
| 210.2-01(C)(4) (the “Rule”) | o Financial reporting control assessments | |
| and are related extensions of | o Enterprise security architecture | |
| the audit services support the | assessment | |
| audit, or use the knowledge/expertise | ||
| gained from the audit procedures as a | ||
| foundation to complete the project. | ||
| In most cases, if the Audit-Related | ||
| Services are not performed by the | ||
| Audit firm, the scope of the Audit | ||
| Services would likely increase. | ||
| The Services are typically well-defined | ||
| and governed by accounting | ||
| professional standards (AICPA, | ||
| SEC, etc.) | ||
| AUDIT COMMITTEE APPROVAL POLICY | AUDIT COMMITTEE REPORTING POLICY | |
| o “One-time” pre-approval | o A summary of all such | |
| for the audit period for all | services and related fees | |
| pre-approved specific service | reported at each regularly | |
| subcategories. Approval of the | scheduled Audit Committee | |
| independent auditors as | meeting. | |
| auditors for a Fund shall | ||
| constitute pre approval for | ||
| these services. | ||
| o “One-time” pre-approval | o A summary of all such | |
| for the fund fiscal year within | services and related fees | |
| a specified dollar limit | (including comparison to | |
| for all pre-approved | specified dollar limits) | |
| specific service subcategories | reported quarterly. | |
| o Specific approval is | |
| needed to exceed the | |
| pre-approved dollar limit for | |
| these services (see general | |
| Audit Committee approval policy | |
| below for details on obtaining | |
| specific approvals) | |
| o Specific approval is | |
| needed to use the Fund’s | |
| auditors for Audit-Related | |
| Services not denoted as | |
| “pre-approved”, or | |
| to add a specific service | |
| subcategory as “pre-approved” | |
SECTION III - POLICY DETAIL, CONTINUED
| SERVICE CATEGORY | SERVICE CATEGORY DESCRIPTION | SPECIFIC PRE-APPROVED SERVICE |
| SUBCATEGORIES | ||
| III. TAX SERVICES | Services which are not | o Tax planning and support |
| prohibited by the Rule, | o Tax controversy assistance | |
| if an officer of the Fund | o Tax compliance, tax returns, excise | |
| determines that using the | tax returns and support | |
| Fund’s auditor to provide | o Tax opinions | |
| these services creates | ||
| significant synergy in | ||
| the form of efficiency, | ||
| minimized disruption, or | ||
| the ability to maintain a | ||
| desired level of | ||
| confidentiality. | ||
| AUDIT COMMITTEE APPROVAL POLICY | AUDIT COMMITTEE REPORTING POLICY |
| o “One-time” pre-approval | o A summary of |
| for the fund fiscal year | all such services and |
| within a specified dollar limit | related fees |
| (including comparison | |
| to specified dollar | |
| limits) reported | |
| quarterly. | |
| o Specific approval is | |
| needed to exceed the | |
| pre-approved dollar limits for | |
| these services (see general | |
| Audit Committee approval policy | |
| below for details on obtaining | |
| specific approvals) | |
| o Specific approval is | |
| needed to use the Fund’s | |
| auditors for tax services not | |
| denoted as pre-approved, or to | |
| add a specific service subcategory as | |
| “pre-approved” | |
SECTION III - POLICY DETAIL, CONTINUED
| SERVICE CATEGORY | SERVICE CATEGORY DESCRIPTION | SPECIFIC PRE-APPROVED SERVICE |
| SUBCATEGORIES | ||
| IV. OTHER SERVICES | Services which are not | o Business Risk Management support |
| prohibited by the Rule, | o Other control and regulatory | |
| A. SYNERGISTIC, | if an officer of the Fund | compliance projects |
| UNIQUE QUALIFICATIONS | determines that using the | |
| Fund’s auditor to provide | ||
| these services creates | ||
| significant synergy in | ||
| the form of efficiency, | ||
| minimized disruption, | ||
| the ability to maintain a | ||
| desired level of | ||
| confidentiality, or where | ||
| the Fund’s auditors | ||
| posses unique or superior | ||
| qualifications to provide | ||
| these services, resulting | ||
| in superior value and | ||
| results for the Fund. | ||
| AUDIT COMMITTEE APPROVAL POLICY | AUDIT COMMITTEE REPORTING POLICY |
| o “One-time” pre-approval | o A summary of |
| for the fund fiscal year within | all such services and |
| a specified dollar limit | related fees |
| (including comparison | |
| to specified dollar | |
| limits) reported | |
| quarterly. | |
| o Specific approval is | |
| needed to exceed the | |
| pre-approved dollar limits for | |
| these services (see general | |
| Audit Committee approval policy | |
| below for details on obtaining | |
| specific approvals) | |
| o Specific approval is | |
| needed to use the Fund’s | |
| auditors for “Synergistic” or | |
| “Unique Qualifications” Other | |
| Services not denoted as | |
| pre-approved to the left, or to | |
| add a specific service | |
| subcategory as “pre-approved” | |
SECTION III - POLICY DETAIL, CONTINUED
| SERVICE CATEGORY | SERVICE CATEGORY DESCRIPTION | SPECIFIC PROHIBITED SERVICE |
| SUBCATEGORIES | ||
| PROHIBITED SERVICES | Services which result | 1. Bookkeeping or other services |
| in the auditors losing | related to the accounting records or | |
| independence status | financial statements of the audit | |
| under the Rule. | client* | |
| 2. Financial information systems design | ||
| and implementation* | ||
| 3. Appraisal or valuation services, | ||
| fairness* opinions, or | ||
| contribution-in-kind reports | ||
| 4. Actuarial services (i.e., setting | ||
| actuarial reserves versus actuarial | ||
| audit work)* | ||
| 5. Internal audit outsourcing services* | ||
| 6. Management functions or human | ||
| resources | ||
| 7. Broker or dealer, investment | ||
| advisor, or investment banking services | ||
| 8. Legal services and expert services | ||
| unrelated to the audit | ||
| 9. Any other service that the Public | ||
| Company Accounting Oversight Board | ||
| determines, by regulation, is | ||
| impermissible | ||
| AUDIT COMMITTEE APPROVAL POLICY | AUDIT COMMITTEE REPORTING POLICY |
| o These services are not to be | o A summary of all |
| performed with the exception of the(*) | services and related |
| services that may be permitted | fees reported at each |
| if they would not be subject to audit | regularly scheduled |
| procedures at the audit client (as | Audit Committee meeting |
| defined in rule 2-01(f)(4)) level | will serve as continual |
| the firm providing the service. | confirmation that has |
| not provided any | |
| restricted services. |
GENERAL AUDIT COMMITTEE APPROVAL POLICY:
o For all projects, the officers of the Funds and the Fund’s auditors will each make an assessment to determine that any proposed projects will not impair independence.
o Potential services will be classified into the four non-restricted service categories and the “Approval of Audit, Audit-Related, Tax and Other Services” Policy above will be applied. Any services outside the specific pre-approved service subcategories set forth above must be specifically approved by the Audit Committee.
o At least quarterly, the Audit Committee shall review a report summarizing the services by service category, including fees, provided by the Audit firm as set forth in the above policy.
(2) Disclose the percentage of services described in each of paragraphs (b) through (d) of this Item that were approved by the audit committee pursuant to paragraph (c)(7)(i)(C) of Rule 2-01 of Regulation S-X.
Non-Audit Services
Beginning with non-audit service contracts entered into on or after May 6, 2003, the effective date of the new SEC pre-approval rules, the Trust’s audit committee is required to pre-approve services to affiliates defined by SEC rules to the extent that the services are determined to have a direct impact on the
operations or financial reporting of the Trust. For the years ended October 31, 2020 and 2019, there were no services provided to an affiliate that required the Trust’s audit committee pre-approval.
(f) If greater than 50 percent, disclose the percentage of hours expended on the principal accountants engagement to audit the registrant’s financial statements for the most recent fiscal year that were attributed to work performed by persons other than the principal accountant’s full-time, permanent employees.
N/A
(g) Disclose the aggregate non-audit fees billed by the registrants accountant for services rendered to the registrant, and rendered to the registrants investment adviser (not including any sub-adviser whose role is primarily portfolio management and is subcontracted with or overseen by another investment adviser), and any entity controlling, controlled by, or under common control with the adviser that provides ongoing services to the registrant for each of the last two fiscal years of the registrant.
The Trust paid aggregate non-audit fees to Ernst & Young LLP for tax services of $34,020 and $25,189 during the fiscal years ended October 31, 2020 and 2019, respectively.
(h) Disclose whether the registrants audit committee of the board of trustees has considered whether the provision of non-audit services that were rendered to the registrants investment adviser (not including any subadviser whose role is primarily portfolio management and is subcontracted with or overseen by another investment adviser), and any entity controlling, controlled by, or under common control with the investment adviser that provides ongoing services to the registrant that were not pre-approved pursuant to paragraph (c)(7)(ii) of Rule 2-01 of Regulation S-X is compatible with maintaining the principal accountant’s independence.
The Fund’s audit committee of the Board of Trustees has considered whether the provision of non-audit services that were rendered to the Affiliates (as defined) that were not pre- approved pursuant to paragraph (c)(7)(ii) of Rule 2-01 of Regulation S-X is compatible with maintaining the principal accountant’s independence.
ITEM 5. AUDIT COMMITTEE OF LISTED REGISTRANTS
(a) If the registrant is a listed issuer as defined in Rule 10A-3 under the Exchange Act (17 CFR 240.10A-3), state whether or not the registrant has a separately-designated standing audit committee established in accordance with Section 3(a)(58)(A) of the Exchange Act (15 U.S.C. 78c(a)(58)(A)). If the registrant has such a committee, however designated, identify each committee member. If the entire board of directors is acting as the registrant’s audit committee as specified in Section 3(a)(58)(B) of the Exchange Act (15 U.S.C. 78c(a)(58)(B)), so state.
N/A
(b) If applicable, provide the disclosure required by Rule 10A-3(d) under the Exchange Act (17 CFR 240.10A-3(d)) regarding an exemption from the listing standards for audit committees.
N/A
ITEM 6. SCHEDULE OF INVESTMENTS.
File Schedule of Investments in securities of unaffiliated issuers as of the close of the reporting period as set forth in 210.1212 of Regulation S-X [17 CFR 210.12-12], unless the schedule is included as part of the report to shareholders filed under Item 1 of this Form.
Included in Item 1
ITEM 7. DISCLOSURE OF PROXY VOTING POLICIES AND PROCEDURES FOR CLOSED-END MANAGEMENT INVESTMENT COMPANIES.
A closed-end management investment company that is filing an annual report on this Form N-CSR must, unless it invests exclusively in non-voting securities, describe the policies and procedures that it uses to determine how to vote proxies relating to portfolio securities, including the procedures that the company uses when a vote presents a conflict between the interests of its shareholders, on the one hand, and those of the company’s investment adviser; principal underwriter; or any affiliated person (as defined in Section 2(a)(3) of the Investment Company Act of 1940 (15 U.S.C. 80a-2(a)(3)) and the rules thereunder) of the company, its investment adviser, or its principal underwriter, on the other. Include any policies and procedures of the company’s investment adviser, or any other third party, that the company uses, or that are used on the company’s behalf, to determine how to vote proxies relating to portfolio securities.
N/A
ITEM 8. PORTFOLIO MANAGERS OF CLOSED-END MANAGEMENT INVESTMENT COMPANIES.
(a) If the registrant is a closed-end management investment company that is filing an annual report on this Form N-CSR, provide the following information:
(1) State the name, title, and length of service of the person or persons employed by or associated with the registrant or an investment adviser of the registrant who are primarily responsible for the day-to-day management of the registrant’s portfolio (“Portfolio Manager”). Also state each Portfolio Manager’s business experience during the past 5 years.
N/A
ITEM 9. PURCHASES OF EQUITY SECURITIES BY CLOSED-END MANAGEMENT INVESTMENT COMPANY AND AFFILIATED PURCHASERS.
(a) If the registrant is a closed-end management investment company, in the following tabular format, provide the information specified in paragraph (b) of this Item with respect to any purchase made by or on behalf of the registrant or any affiliated purchaser, as defined in Rule 10b-18(a)(3) under the Exchange Act (17 CFR 240.10b-18(a)(3)), of shares or other units of any class of the registrant’s equity securities that is registered by the registrant pursuant to Section 12 of the Exchange Act (15 U.S.C. 781).
N/A
ITEM 10. SUBMISSION OF MATTERS TO A VOTE OF SECURITY HOLDERS.
Describe any material changes to the procedures by which shareholders may recommend nominees to the registrant’s board of directors, where those changes were implemented after the registrant last provided disclosure in response to the requirements of Item 407(c)(2)(iv) of Regulation S-R(17 CFR 229.407)(as required by Item 22(b)(15)) of Schedule 14A (17 CFR 240.14a-101), or this Item.
There have been no material changes to the procedures by which the shareholders may recommend nominees to the registrant’s board of directors since the registrant last provided disclosure in response to the requirements of Item 407(c)(2)(iv) of Regulation S-R of Schedule 14(A) in its definitive proxy statement, or this item.
ITEM 11. CONTROLS AND PROCEDURES.
(a) Disclose the conclusions of the registrant’s principal executive and principal financials officers, or persons performing similar functions, regarding the effectiveness of the registrant’s disclosure controls and procedures (as defined in Rule 30a-3(c) under the Act (17 CFR 270.30a-3(c))) as of a date within 90 days of the filing date of the report that includes the disclosure required by this paragraph, based on the evaluation of these controls and procedures required by Rule 30a-3(b) under the Act (17 CFR 270.30(a)-3(b) and Rules 13a-15(b) or 15d-15(b) under the Exchange Act (17 CFR 240.13a-15(b) or 240.15d-15(b)).
The registrant’s principal executive officer and principal financial officer have concluded that the registrant’s disclosure controls and procedures are effective based on the evaluation of these controls and procedures as of a date within 90 days of the filing date of this report.
(b) Disclose any change in the registrant’s internal control over financial reporting (as defined in Rule 30a-3(d) under the Act (17CFR 270.30a-3(d)) that occured during the second fiscal quarter of the period covered by this report that has materially affected, or is reasonably likely to materially affect, the registrant’s internal control over financial reporting.
There were no significant changes in the registrant’s internal control over financial reporting that occurred during the second fiscal quarter of the period covered by this report that have materially affected, or are reasonably likely to materially affect, the registrant’s internal control over financial reporting.
Item 12. Disclosure of Securities Lending Activities for Closed-End Management Investment Companies.
(a) If the registrant is a closed-end management investment company, provide the following dollar amounts of income and compensation related to the securities lending activities of the registrant during its most recent fiscal year:
N/A
(1) Gross income from securities lending activities;
N/A
(2) All fees and/or compensation for each of the following securities lending activities and related services: any share of revenue generated by the securities lending program paid to the securities lending agent(s) (revenue split); fees paid for cash collateral management services (including fees deducted from a pooled cash collateral reinvestment vehicle) that are not included in the revenue split; administrative fees that are not included in the revenue split; fees for indemnification that are not included in the revenue split; rebates paid to borrowers; and any other fees relating to the securities lending program that are not included in the revenue split, including a description of those other fees;
N/A
(3) The aggregate fees/compensation disclosed pursuant to paragraph (2); and
N/A
(4) Net income from securities lending activities (i.e., the dollar amount in paragraph (1) minus the dollar amount in paragraph (3)).
If a fee for a service is included in the revenue split, state that the fee is included in the revenue split.
N/A
(b) If the registrant is a closed-end management investment company, describe the services provided to the registrant by the securities lending agent in the registrants most recent fiscal year.
N/A
ITEM 13. EXHIBITS.
(a) File the exhibits listed below as part of this Form. Letter or number the exhibits in the sequence indicated.
SIGNATURES
[See General Instruction F]
Pursuant to the requirements of the Securities Exchange Act of 1934 and the Investment Company Act of 1940, the registrant has duly caused this report to be signed on its behalf by the undersigned, thereunto duly authorized.
(Registrant) Pioneer Series Trust VI
By (Signature and Title)* /s/ Lisa M. Jones
Lisa M. Jones, President & Chief Executive Officer
Date December 30, 2020
Pursuant to the requirements of the Securities Exchange Act of 1934 and the Investment Company Act of 1940, this report has been signed below by the following persons on behalf of the registrant and in the capacities and on the dates indicated.
By (Signature and Title)* /s/ Lisa M. Jones
Lisa M. Jones, President & Chief Executive Officer
Date December 30, 2020
By (Signature and Title)* /s/ Mark E. Bradley
Mark E. Bradley, Treasurer & Chief Accounting & Financial Officer
Date December 30, 2020
* Print the name and title of each signing officer under his or her signature.