QuickLinks -- Click here to rapidly navigate through this documentAs filed with the United States Securities and Exchange Commission on November 13, 2006.
Registration No. 333-
UNITED STATES
SECURITIES AND EXCHANGE COMMISSION
Washington, D.C. 20549
FORM S-1
REGISTRATION STATEMENT UNDER THE SECURITIES ACT OF 1933
Edgen Murray Plc
(Exact name of registrant as specified in its charter)
| England and Wales | | 5051 | | Not applicable |
| (State or other jurisdiction of incorporation or organization) | | (Primary Standard Industrial Classification Code Number) | | (I.R.S. Employer Identification Number) |
18444 Highland Road
Baton Rouge, Louisiana 70809
(225) 756-9868
(Address, including zip code, and telephone number, including
area code, of Registrant's principal executive offices)
Daniel J. O'Leary
President and Chief Executive Officer
18444 Highland Road
Baton Rouge, Louisiana 70809
(225) 756-9868
(Name, address, including zip code, and telephone number, including area code, of agent for service)
With Copies to:
Bonnie A. Barsamian, Esq.
Adam M. Fox, Esq.
Dechert LLP
30 Rockefeller Plaza
New York, New York 10112
United States of America
(212) 698-3500 | |
Wayne Rapozo, Esq.
Dechert LLP
160 Queen Victoria Street
London EC4V 4QQ
United Kingdom
+44 207 184 7000 | | T. Mark Kelly, Esq.
David H. Stone, Esq.
Vinson & Elkins LLP
2300 First City Tower
1001 Fannin Street,
Suite 2300
Houston, Texas 77002
United States of America
(713) 758-2222 |
Approximate date of commencement of proposed sale to the public: As soon as practicable after the effective date of this Registration Statement.
If any of the securities being registered on this Form are to be offered on a delayed or continuous basis pursuant to Rule 415 under the Securities Act of 1933, check the following box. o
If this Form is filed to register additional securities for an offering pursuant to Rule 462(b) under the Securities Act, check the following box and list the Securities Act registration statement number of the earlier effective registration statement for the same offering. o
If this Form is a post-effective amendment filed pursuant to Rule 462(c) under the Securities Act, check the following box and list the Securities Act registration number of the earlier effective registration statement for the same offering. o
If this Form is a post-effective amendment filed pursuant to Rule 462(d) under the Securities Act, check the following box and list the Securities Act registration number of the earlier effective registration statement for the same offering. o
If delivery of the prospectus is expected to be made pursuant to Rule 434, please check the following box. o
CALCULATION OF REGISTRATION FEE
|
Title of Each Class of Securities to be Registered(1)
| | Proposed
Maximum
Aggregate
Offering Price(2)(3)
| | Amount of
Registration
Fee
|
|---|
|
| Ordinary Shares, nominal value UK£1 per share, represented by American Depositary Shares | | $200,000,000 | | $21,400 |
|
- (1)
- A separate registration statement on Form F-6 is being filed for the registration of the American Depositary Shares ("ADSs") evidenced by American Depositary Receipts issuable on deposit of shares registered thereby. Each ADS will represent such number of ordinary shares determined by the Registrant in connection with, and at the time the Registrant establishes, the price range or in connection with the contribution transactions described herein.
- (2)
- Estimated solely for the purposes of computing the amount of the registration fee pursuant to Rule 457(o) under the Securities Act.
- (3)
- The proposed maximum offering price for each ADS representing ordinary shares being registered hereunder will be determined in connection with, and at the time of, the Registrant establishing the price range or in connection with the contribution transactions described herein.
The Registrant hereby amends this Registration Statement on such date or dates as may be necessary to delay its effective date until the Registrant shall file a further amendment which specifically states that this Registration Statement shall thereafter become effective in accordance with Section 8(a) of the Securities Act of 1933, as amended, or until the Registration Statement shall become effective on such date as the United States Securities and Exchange Commission, acting pursuant to said Section 8(a), may determine.
SUBJECT TO COMPLETION, DATED , 2006
The information in this prospectus is not complete and may be changed. We may not sell these securities until the registration statement filed with the Securities and Exchange Commission is effective. This prospectus is not an offer to sell these securities and it is not soliciting an offer to buy these securities in any state where the offer or sale is not permitted.
PROSPECTUS

EDGEN MURRAY PLC
American Depositary Shares
Representing
Ordinary Shares
This is our initial public offering. We are selling American Depositary Shares, or ADSs, representing our ordinary shares. Each ADS represents ordinary shares. ADSs will be evidenced by American Depositary Receipts, or ADRs. We currently anticipate that the estimated initial public offering price per ADS will be between $ and $ .
Prior to this offering, there has been no public market for our ADSs or our ordinary shares. We intend to apply to have the ADSs approved for quotation on the NYSE under the symbol "EMY."
We intend to use a portion of the proceeds of this offering to redeem our outstanding preference shares. Accordingly, certain of our executive officers and directors and certain affiliates of Jefferies & Company, one of the underwriters, who are holders of our outstanding preference shares will receive a portion of the proceeds of this offering.
Investing in our ADSs involves risks. See "Risk factors" beginning on page 15.
|
| | | | Per ADS | | | Total |
|
| Public offering price | | $ | | | $ | |
Underwriting discount and commissions |
|
$ |
|
|
$ |
|
Proceeds to Edgen Murray Plc (before expenses) |
|
$ |
|
|
$ |
|
|
Certain of our shareholders have granted the underwriters a 30 day option to purchase up to an additional ADSs representing ordinary shares at the public offering price, less the underwriting discount, to cover overallotments, if any. We will not receive any proceeds from the sale of shares by the selling shareholders.
Neither the Securities and Exchange Commission nor any other regulatory body commission has approved or disapproved of these securities or determined if this prospectus is truthful or complete. Any representation to the contrary is a criminal offense.
The underwriters expect to deliver the ADSs evidenced by the ADRs on or about , 2006.
| JPMORGAN | | LEHMAN BROTHERS | | JEFFERIES & COMPANY |
| MORGAN KEEGAN & COMPANY, INC. | STIFEL NICOLAUS |
, 2006
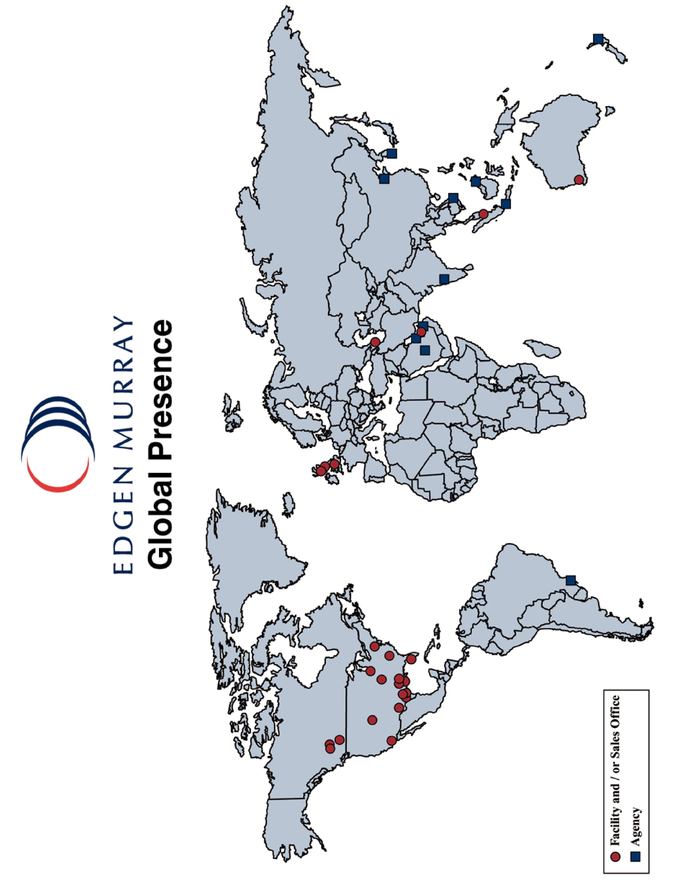
Table of contents
| |
|
|---|
| Prospectus summary | | 1 |
| Risk factors | | 15 |
| Special note regarding forward-looking statements | | 25 |
| Use of proceeds | | 26 |
| Dividend policy | | 27 |
| Capitalization | | 28 |
| Dilution | | 30 |
| Unaudited pro forma condensed combined financial statements | | 34 |
| Management's discussion and analysis of financial condition and results of operations | | 37 |
| Business | | 63 |
| Security ownership of certain beneficial owners and management | | 86 |
| Certain relationships and related party transactions | | 88 |
| Description of share capital | | 92 |
| Description of American Depositary Shares | | 97 |
| Shares eligible for future sale | | 104 |
| Income tax considerations | | 105 |
| Underwriting | | 111 |
| Legal matters | | 116 |
| Experts | | 116 |
| Enforceability of certain judgments and service of process | | 116 |
| Currency and exchange rate information | | 116 |
| Where you can find more information | | 117 |
About this prospectus
In making your investment decision, you should rely only on the information contained in this prospectus, any free writing prospectus prepared by or on behalf of us or in the business and financial information that is not included in or delivered with this prospectus to which we have referred you. See "Where you can find more information." We have not authorized anyone to provide you with information that is different. If anyone provided you with different or inconsistent information, you should not rely on it. This prospectus may only be used where it is legal to sell these securities. You should assume the information appearing in this prospectus is accurate only as of the date on the front cover of this prospectus. Our business, financial condition, results of operations and prospects may have changed since that date. Neither the delivery of this prospectus nor any sale made hereunder shall under any circumstances imply that the information in this prospectus is correct as of any date subsequent to the date on the front cover of this prospectus.
Dealer prospectus delivery obligation
Through and including , 2006 (the 25th day after the date of this prospectus), all dealers that effect transactions in these securities, whether or not participating in this offering, may be required to a deliver a prospectus. This is in addition to the dealer's obligation to deliver a prospectus when acting as an underwriter and with respect to unsold allotments or subscriptions.
Special note regarding industry and market data
Any market and other industry data contained in this prospectus are based on independent industry publications, reports by market research firms or other published independent sources. We have not independently verified market or other industry data from third-party sources. While we believe this information is reliable and market definitions are appropriate, this information has not been verified by independent sources. Accordingly, we cannot assure you that such market and other industry data are accurate in all material respects.
i
Prospectus summary
The following summary highlights information contained elsewhere in this prospectus and is qualified in its entirety by more detailed information, the consolidated financial statements and the related notes to those statements, and the condensed consolidated financial statements and related notes to those statements included elsewhere in this prospectus. Because it is a summary, it does not contain all of the information that you should consider before investing in our ADSs. You should read this prospectus carefully, including the section entitled "Risk factors," the consolidated financial statements and the related notes to those statements and the condensed consolidated financial statements and related notes to those statements included elsewhere in this prospectus.
Edgen Murray Plc is a newly formed company created to serve as a holding company for our businesses and as the issuer in this offering. In conjunction with this offering, substantially all of the assets of our parent Edgen/Murray, L.P., were contributed to us in exchange for our ordinary and preference shares. Thereafter Edgen/Murray, L.P. distributed to the holders of its common and preferred partnership interests substantially all of the ordinary and preference shares received in the exchange. We refer to these transactions as the "Contribution." As a result, the historical financial information included in this prospectus represents the consolidated financial statements of Edgen/Murray, L.P. We present certain information in this prospectus for the combined twelve months ended December 31, 2005 on a pro forma basis. See "Unaudited pro forma condensed combined financial statements" for a description of the pro forma adjustments included in such pro forma results. Unless we state otherwise, "we," "us," "our" and similar terms, refer to Edgen Murray Plc and its predecessors.
Some of the statements in this summary are forward-looking statements. For more information, see "Certain relationships and related party transactions—Formation of Edgen Murray Plc and the Contribution" and "Special note regarding forward-looking statements." Certain financial and other information has been rounded and as a result, the numerical figures and percentages shown in this offering memorandum may vary slightly from the exact arithmetic aggregation of the relevant figures.
All information in this prospectus assumes that the underwriters do not exercise their 30 day option to purchase additional ADSs from certain of our shareholders, unless otherwise indicated.
Overview
We are a leading global distributor and marketer of high performance steel products for use primarily in specialized applications in the energy infrastructure market. The products we sell are generally highly engineered prime carbon or alloy steel pipe, pipe components and high grade structural sections and plates, which are designed to withstand the effects of corrosive or abrasive materials and possess performance characteristics required in extreme operating conditions, including high pressure and high/low temperature environments.
We distribute and market products and provide comprehensive procurement and project management solutions to our customers on projects spanning the complete lifecycle of the global energy infrastructure market, including exploration and production, new rig construction, gathering and transmission, refining and processing, power generation, petrochemical and maintenance, repair and operations (MRO). Our global sales and distribution network enables us to efficiently procure and deliver these high performance products worldwide to customers who may not have the relationships, resources or logistical support or may not be willing or able to purchase in sufficient volume or on a cost-effective basis to complete procurement independently for their projects. Our customers are principally end-users that operate in or service the energy infrastructure industry and providers of MRO products. For the six months ended June 30, 2006, approximately 81% of our total revenue was attributable to customers that operate in or service the energy infrastructure market and, within that
1
market, approximately 59% of our total revenue was attributable to customers that operate in or service the oil and gas industry.
We currently manage our operations in five reporting segments: the Americas—Carbon, Americas—Alloy, UK, Singapore and the UAE. These five segments represent four geographic markets—the Americas, Europe/West Africa, Asia/Pacific and the Middle East. Our worldwide sales and distribution network enables us to promptly deliver our products and respond to our customers' needs. We currently serve customers in more than 50 countries worldwide through 23 locations internationally, including 17 in the Americas, three in Europe/West Africa, two in Asia/Pacific and one in the Middle East. For the six months ended June 30, 2006, 55% of our revenues were from the Americas, 24% from Europe/West Africa, 11% from Asia/Pacific and 10% from the Middle East. We are capable of supplying our complete product offering in all of the regions in which we operate. We stock and distribute inventory and support our customers through our global network of field locations, which are in close proximity to our customers' operations. This network allows us to service projects in remote and challenging locations, while also supporting the daily MRO requirements of installed facilities.
We are a critical link between our customers and the manufacturers from whom we purchase our products (our vendors). We use our in-depth market knowledge and our value-added vendor relationships to provide our customers with complete logistical support for their projects, including inventory management and just-in-time product delivery on a worldwide basis. We maintain a broad product offering, which includes more than 44,000 SKUs, and manage a large inventory of components and more than 100,000 tons of pipes, plates and sections. As a result, we are able to supply products that are not generally otherwise available to our customers on a quick-response basis or that cannot be purchased in the smaller quantities needed by customers for specific projects. Our global scale has allowed us to establish strong ties and preferential purchasing terms with our vendors. We also provide additional support for our vendors including sales, marketing and credit functions with respect to the products we distribute.
We employ experienced local market specialists and sales personnel in each of our geographical regions of operation, many of whom have technical backgrounds, training or relevant industry experience. Our sales personnel provide value-added customer support, including technical consultation on product selection and integration in large, complex projects. In addition to the comprehensive knowledge of our products and the industries we supply, our local market personnel understand the characteristics of the different geographies they serve. We are also well positioned to be a key vendor for our customers' greenfield projects and MRO needs because of the familiarity we have with our customers' existing infrastructure and upcoming projects.
Our total revenue, EBITDA and net loss on a pro forma basis for the twelve months ended December 31, 2005 were $600.4 million, $53.7 million and $(2.5 million), respectively. Pro forma EBITDA of $53.8 million for the twelve months ended December 31, 2005 includes $12.0 million of expenses incurred in connection with the February 1, 2005 acquisition of Edgen Corporation ("Edgen") and $5.5 million in bonus payments and applicable payroll taxes to certain employees of Murray International Metals Limited ("MIM Ltd.") prior to its acquisition. Our total revenue, EBITDA and net income for the six months ended June 30, 2006 were $340.0 million, $45.0 million and $10.1 million, respectively. EBITDA of $45.0 million for the six months ended June 30, 2006 includes the impact of a $6.1 million foreign exchange gain on outstanding debt. For our definition of EBITDA and a reconciliation of net income (loss) for the period to EBITDA, see "Summary historical consolidated and pro forma condensed combined financial data."
2
End market overview
We sell our products principally to customers who develop, service and own infrastructure that comprises much of the global energy value chain. Demand for the products we supply is generally related to overall levels of capital spending in the oil and gas exploration and production, gathering and transmission and crude oil refining markets and the energy processing and power generation industries.
We believe the following trends will drive capital investment in the end markets we serve and, in turn, demand for our highly specialized products:
- •
- Increasing global demand for crude oil and natural gas. Worldwide economic expansion, particularly in emerging economies, has resulted in growing demand for hydrocarbons. This has, in turn, resulted in an increasing investment in the development of energy infrastructure assets for the exploration for, and the production, transportation, processing and refining of, crude oil and natural gas.
- •
- Rising activity in developing international markets. Oil and gas exploration and production companies are increasingly turning to underdeveloped international markets to find new hydrocarbon reserves. In many of these markets, significant investment in production infrastructure is required to develop new discoveries. Our global network of field locations is well positioned to serve this fast growing market.
- •
- Increasing exploration and development activity in deepwater markets. Driven by technological innovations and a strong commodity price environment, deepwater oil and gas activity has increased significantly in recent years. Drilling for and producing oil and gas reserves in remote deepwater areas requires the use of technically sophisticated assets that are in scarce supply or require long lead times and significant capital to fabricate, including deepwater drilling rigs and highly engineered floating production facilities. We expect the demand for our specialized products to continue to increase as oil and gas producers continue to invest in the infrastructure needed to commercially produce these deepwater reserves.
- •
- New rig construction. Increasing global drilling activity has driven an increase in utilization levels of offshore drilling rigs, particularly higher specification rigs capable of drilling in harsher environments, prompting the industry to invest substantial capital in maintenance, upgrades and new rig construction.
- •
- Increasing investment in natural gas transmission capacity in under-supplied regional markets. As global energy infrastructure capacity has developed to match rising global energy demand, investment in the expansion of natural gas transmission capacity has increased commensurately.
- •
- Proliferation of natural gas monetization projects. Commercialization of remote natural gas resources is a leading industry initiative to satisfy increasing global natural gas demand. Liquefied natural gas (LNG) and gas-to-liquid (GTL) technologies are expected to grow in importance as a choice for transportation and use. We believe we are well positioned to capitalize on increasing investment in gas monetization projects as our products serve as components for the construction of these facilities.
- •
- Significant capital investment in oil sands production and conversion capacity. Oil sands resource development is a complex and capital-intensive process. The development of Canada's vast oil sands deposits is expected to make a significant contribution to future global crude oil production and, in turn, should increase demand for our products that are components of the infrastructure needed to produce, refine and transport this resource.
- •
- Global investment in power generation capacity. As developing countries continue to experience strong economic growth and as environmental regulations require or encourage the retirement or refurbishment of older facilities, demand for power generation capacity is expected to continue to
3
increase. The bulk of this incremental demand is expected to originate in countries outside the Organisation for Economic Co-operation and Development (OECD), where the power generation markets are less developed. We believe that our worldwide footprint should allow us to capitalize on this forecasted growth of capacity in the power generating industry.
- •
- Significant expansion of US ethanol production capacity. Ethanol production in the United States is expected to double by the end of the decade as high hydrocarbon prices, dependence on foreign sources of crude oil and more stringent clean air regulations have elevated focus within the industry on the development of alternative energy sources. We distribute specialty components that are required to build and operate ethanol plants as well as address the MRO requirement of existing ethanol plants.
Our competitive strengths
We consider the following to be our principal competitive strengths:
Our distribution model. Our global distribution model provides our customers with a comprehensive procurement and project management solution focused on high performance steel products. We distinguish ourselves from our competitors because we have built a global business that combines local knowledge and presence with a solution-driven approach to managing our customers' needs for design, purchase and delivery of specialized steel products. In addition, through our experienced sales force and global distribution network, we are able to execute customer orders and facilitate our customers' growth in markets worldwide.
We have a knowledgeable and experienced sales force. Our sales and support team is experienced and knowledgeable of both the design specifications of our customers' projects and facilities, as well as their ongoing needs and is able to provide valuable advisory support to our customers while meeting their product requirements. Many of our sales and support personnel have technical backgrounds and training and on average have more than 15 years of industry experience. Our sales specialists are skilled both in managing the intricate logistics inherent in complex projects and in accommodating the expedited MRO requirements of our customers.
We have strong vendor relationships. We are a volume purchaser of specialty steel products and serve as a critical link between our vendors and our customers. Many of the products we supply to our customers are difficult for individual customers to purchase on a cost-effective basis directly from manufacturers, who hold limited inventories and often require large orders and lengthy lead times for new production runs. We have demonstrated to our vendors that we are a consistent, high-volume purchaser of their products and a valuable, reliable sales channel. As a result, we have developed strong, longstanding relationships and negotiated preferred pricing arrangements with key vendors, which we believe would be difficult for others to replicate.
We command premium margins through the combination of a broad offering of specialized products and value-added customer support. We focus on products that are highly specialized and that are generally regarded as critical to our customers' operations and new projects. In addition to our product offerings, we provide technical advice in areas such as design efficiency and logistics which are valued by our customers. The specialized nature of our products, in combination with the technical support we offer, allows us to capture premium margins for the products we distribute versus those generally earned on non-specialized steel products.
We have a broad customer base. We market our products to a diverse base of more than 2,750 customers, whose operations are in geographic locations around the world and who participate in all sectors of the energy industry. Our customers are generally large, well-capitalized companies who are recognized as leaders in their respective industries.
4
Our management team is experienced and incentivized. Our senior management team has an average of 26 years of industry experience. Many of our senior managers have significant relevant experience in the industries we serve or with vendors who supply high performance steel products to the energy infrastructure market. The compensation of our senior managers is tied to financial performance measures, which we believe creates value for our shareholders. In addition, many of our senior executives have significant experience in the geographies in which we conduct business. Following the closing of this offering, our senior management will own approximately % of our ordinary shares.
Our business strategy
Increase market share among existing and new customers. We have developed strong customer relationships in the industries we serve. Given our significant international expansion, highlighted by our December 16, 2005 acquisition of MIM Ltd., we believe that there exists significant opportunities to cross-sell our combined products and procurement and distribution capabilities. Accordingly, we are strengthening our product offerings outside of the United States by augmenting our product portfolio, management expertise and sales force.
Leverage our knowledge of the energy infrastructure industry in high growth markets. We plan to leverage our experience in the energy infrastructure market to achieve greater penetration of emerging high growth regional infrastructure markets such as the Canadian oil sands and the Caspian Sea markets. We focus our product offering on specialized products that are used in the extreme environments commonly seen within the energy industry and continue to identify new uses for our products in higher growth infrastructure applications, such as LNG, GTL and alternative energy production.
Optimize our vendor relationships, purchasing and inventory levels. We have significantly consolidated our purchasing power among certain vendors, while keeping secondary vendors for all key products. By consolidating our purchasing power we believe that we have gained favored status with certain vendors that value both our global footprint and volume purchasing capabilities. Because of this, we are often considered the preferred or sole distribution channel for their specialty products. As we continue to strengthen our vendor relationships, we are able to devote greater resources to providing our customers with products that have fewer substitutes and are more critical to their business.
Pursue opportunistic strategic acquisitions and investments and continue global expansion. We intend to seek opportunities to strengthen our global franchise through selective acquisitions and strategic investments. In particular, we will consider investments that enhance our global presence in the energy infrastructure market and enable us to leverage our existing operations. In addition, we intend to selectively establish new regional offices, particularly in the Asia/Pacific region, to facilitate our expansion into emerging regional markets and to better serve our growing customer base in this region.
Our history and formation
Edgen Murray Plc was formed as an English public limited company in November 2006 to serve as a holding company for the assets previously held by our predecessor, Edgen/Murray, L.P., and to serve as the issuer in this offering. Substantially all the directly held assets of Edgen/Murray, L.P. were the shares of common stock of Edgen and the ordinary shares of Pipe Acquisition Limited ("PAL"), an English company organized by Jefferies Capital Partners ("JCP"), a New York-based private equity firm, and certain members of Edgen and MIM Ltd. management to effect the acquisition of MIM Ltd.
Edgen was founded in 1983 as Thomas Pipe and Steel, Inc. in Baton Rouge, Louisiana and was acquired in 1996 by an investor group. Following its acquisition in 1996, Edgen rapidly grew its business in the United States, expanding from a single location distribution business with a limited product offering, into a leading distributor with multiple distribution facilities and a broad product offering.
5
In February 2005, all of the outstanding equity interests in Edgen were acquired by certain members of Edgen management and JCP. In December 2005, Edgen's shareholders organized a new holding company, Edgen/Murray, L.P., to hold all of the outstanding equity interests of Edgen and PAL. On December 16, 2005, Edgen/Murray, L.P. through its subsidiaries acquired MIM Ltd. and its subsidiaries.
MIM Ltd. was founded in 1976 in Edinburgh, Scotland to supply the developing offshore oil and gas industry with high grade steel products, in particular oil and gas infrastructure projects located in the extreme environmental conditions of the North Sea. Following its founding in 1976, MIM Ltd. grew its business into a leading global distributor of high grade steel products supplying primarily the offshore oil and gas industry in several geographical markets worldwide, including the Caspian Sea region, West Africa, Asia/Pacific and the Middle East. MIM Ltd. achieved this growth through greenfield start-up distribution centers and by expanding its distribution capabilities worldwide through branch offices, representative offices and agencies.
The Contribution
On , Edgen/Murray, L.P. contributed the common shares of Edgen and PAL to Edgen Murray Plc and Edgen Murray Plc issued ordinary shares and preference shares to Edgen/Murray, L.P. in exchange for these shares. Following this exchange, Edgen/Murray, L.P. effected a special distribution whereby the holders of Edgen/Murray, L.P. preferred partnership interests received Edgen Murray Plc preference shares held by Edgen/Murray, L.P. and the holders of Edgen/Murray, L.P. common partnerships interests (other than the holders of restricted common partnership interests held by certain members of our management and employees under the Edgen/Murray, L.P. equity incentive plans) received Edgen Murray Plc ordinary shares held by Edgen/Murray, L.P.
As a result of the Contribution, but prior to giving effect to this offering, the equity holders of Edgen/Murray, L.P. (other than the holders of restricted common partnership interests under the Edgen/Murray, L.P. equity incentive plans) became the owners of Edgen Murray Plc. Accordingly, JCP and its affiliates beneficially own approximately % of our preference shares and % of our ordinary shares and certain members of our management and employees beneficially own approximately % of our preference shares and % of our ordinary shares. See "Security ownership of certain beneficial owners and management."
All of our preference shares will be redeemed by us with a portion of the proceeds of this offering. There will be no preference shares of Edgen Murray Plc outstanding when the redemption of the preference shares is completed. Following the consummation of this offering and the redemption of our preference shares, JCP and its affiliates will beneficially own approximately % of our ordinary shares and none of our preference shares and certain of our management and employees will beneficially own approximately % of our ordinary shares and none of our preference shares.
Company information
Edgen Murray Plc was incorporated in England on November 2, 2006 with registered number 5987010 under the UK Companies Act 1985 as a public limited company. Our registered office is located at 20-22 Bedford Row, London WC1R 4JS, our principal executive offices are located at 18444 Highland Road, Baton Rouge, Louisiana 70809 and our telephone number is (225) 756-9868. We maintain our website at www.edgenmurray.com. Information on our website does not constitute part of this prospectus.
6
The offering
The following information assumes that the underwriters will not exercise their option to purchase additional ADSs from certain of our shareholders in the offering, unless otherwise indicated. See "Underwriting."
Offering price |
|
$ per ADS. |
ADSs offered |
|
ADSs. |
Ordinary shares outstanding immediately after this offering |
|
ordinary shares. |
Ratio of ADSs to ordinary shares |
|
Each ADS represents ordinary shares. |
ADSs outstanding immediately after this offering |
|
ADSs. |
Listing |
|
We intend to apply to have our ADSs quoted on the NYSE under the symbol "EMY." The ordinary shares and the ADSs will not be listed on any other exchange or traded on any other automated quotation system. |
The ADSs |
|
The ADSs will be evidenced by ADRs. The custodian of the Depositary will hold the ordinary shares underlying the ADSs. If we declare dividends on our ordinary shares, the Depositary will pay you the cash dividends and other distributions it receives on our ordinary shares, after deducting its fees and expenses. Subject to the terms of the deposit agreement and applicable law, you may turn in your ADSs to the Depositary in exchange for ordinary shares underlying your ADSs. The Depositary will charge you fees for any such exchange. You will have rights as provided in the deposit agreement. We and the Depositary may amend or terminate the deposit agreement without your consent. If you continue to hold your ADSs, you agree to be bound by the deposit agreement as amended. To better understand the terms of the ADSs, you should carefully read the "Description of American Depositary Shares" section of this prospectus. You should also read the deposit agreement, which is filed as an exhibit to the registration statement that includes this prospectus. |
Depositary |
|
, the depositary bank (the "Depositary"). |
Custodian |
|
|
|
|
|
7
Option to purchase additional ADSs |
|
Certain of our shareholders have granted to the underwriters an option, which is exercisable within 30 days from the date of this prospectus, to purchase up to an additional ADSs. See "Underwriting" for more information. |
Timing and settlement for ADSs |
|
The ADSs are expected to be delivered against payment on , 2006. The ADRs evidencing the ADSs will be deposited with a custodian for, and registered in the name of a nominee of, The Depositary Trust Company in New York, New York. In general, beneficial interests in the ADSs will be shown on, and transfers of these beneficial interests will be effected only through, records maintained by The Depositary Trust Company and its direct and indirect participants. |
Use of proceeds |
|
We estimate that the net proceeds we will receive from this offering will be approximately $ million, after deducting underwriting discount and commissions and the estimated offering fees and expenses payable by us and assuming an initial public offering price of $ per ADS, which represents the mid-point of the range set forth on the cover page of this prospectus. We intend to use such net proceeds of this offering along with available cash to repay the PAL Floating Rate Notes and to redeem our preference shares. See "Use of proceeds" for additional information. Certain of our executive officers and directors and affiliates of an underwriter who are holders of our outstanding preference shares will receive a portion of the proceeds of this offering. See "Underwriting—Relationships." We will not receive any of the proceeds from the sale of ADSs by the selling shareholders that may be sold upon exercise of the option to purchase additional ADSs. |
Lock-up |
|
We have, subject to certain exceptions, agreed with the underwriters to a lock-up of ADSs or ordinary shares or securities convertible into or exchangeable or exercisable for any ADSs or ordinary shares for a period of 180 days after the date of this prospectus. In addition, our executive officers, directors and certain existing shareholders, who collectively hold approximately % of our outstanding ordinary shares immediately before this offering, have, subject to certain exceptions, also agreed with the underwriters to a lock-up of ADSs or ordinary shares or securities convertible into or exchangeable or exercisable for any ADSs or ordinary shares for a period of 180 days after the date this prospectus. See "Shares eligible for future sale" and "Underwriting." |
Risk factors |
|
See "Risk factors" and other information included in this prospectus for a discussion of risks you should carefully consider before investing in our ADSs. |
| | | |
8
Deposit or withdrawal of ordinary shares |
|
You may deposit ordinary shares with the custodian and obtain ADSs, and may surrender ADSs to the Depositary and receive ordinary shares, subject in each case to the satisfaction of certain conditions. |
|
|
Ordinary shares underlying the ADSs offered hereby may be withdrawn from the Depositary facility established under the deposit agreement upon the surrender of the ADSs and the receipt by the Depositary of proper instructions. |
9
Summary historical consolidated and pro
forma condensed combined financial data
Background and organizational structure
Edgen was formed on November 30, 2000. On February 1, 2005, Edgen Acquisition Corporation ("Edgen Acquisition Corp."), a corporation newly formed by JCP and certain members of Edgen management, purchased all of the outstanding capital stock of Edgen from its existing shareholders. Concurrently with the acquisition and related transactions, Edgen Acquisition Corp. was merged with and into Edgen, with Edgen surviving the merger. These transactions are collectively referred to as the "Buy-out Transaction."
In December, 2005, Edgen's shareholders organized a new holding company, Edgen/Murray, L.P., to hold all of the outstanding equity interests of Edgen and a newly created holding company in the United Kingdom, PAL. On December 16, 2005, Edgen/Murray, L.P. through its subsidiaries acquired MIM Ltd. and its subsidiaries.
MIM Ltd. and its subsidiary Murray International Metals Pte. Limited ("MIM Singapore") were acquired by PAL (the "MIM UK Acquisition") and MIM Ltd.'s wholly owned subsidiary, Murray International Metals, Inc. ("MIM US") was acquired by Edgen Carbon (the "MIM US Acquisition"). The MIM UK Acquisition and the MIM US Acquisition are collectively referred to as the "MIM Acquisition."
References to the "Successor" in respect of the periods prior to the formation of Edgen/Murray, L.P. are references to Edgen and its subsidiaries and for periods after formation are references to Edgen/Murray, L.P. and its subsidiaries. References to the "Predecessor" in respect of the periods prior to the formation of Edgen Acquisition Corp., and the acquisition of Edgen by Edgen Acquisition Corp., are references to Edgen prior to the change in control on February 1, 2005.
Edgen/Murray, L.P. is controlled by funds managed by JCP. In connection with the MIM Acquisition, Edgen/Murray, L.P. also issued additional partnership interests to the funds managed by JCP, to certain members of management of Edgen and MIM Ltd. and to the sellers of MIM Ltd.
We are a newly formed holding company created in connection with this offering. In conjunction with the Contribution, the assets of Edgen/Murray, L.P. will be contributed to us. As a result, the historical financial information included in this prospectus represents the consolidated financial statements of Edgen/Murray, L.P. and its wholly owned subsidiaries.
Basis of presentation
Effective September 30, 2006, PAL and its subsidiaries changed their fiscal year to December 31, 2006. Prior to September 30, 2006, PAL and its subsidiaries had a fiscal year ending January 31, which differed from our fiscal year end of December 31. Our consolidated balance sheet as of December 31, 2005 includes the consolidated balance sheet of PAL and its subsidiaries as of January 31, 2006. Our consolidated statement of operations for the period February 1, 2005 to December 31, 2005 includes fifteen days of operating results of PAL and its subsidiaries, reflecting the fifteen day period Edgen/Murray, L.P. owned MIM Ltd. Due to the difference in fiscal year end periods, the financial results included in our consolidated financial statements reflects the consolidated financial results of PAL for the period January 17, 2006 to January 31, 2006. As a result, the net income of PAL for the period December 17, 2005 to January 16, 2006 has been recorded as a direct charge to the consolidated statement of partners' capital and shareholders' equity (deficit).
10
Similarly our condensed consolidated balance sheet as of June 30, 2006 includes the condensed consolidated balance sheet of PAL and its subsidiaries as of July 31, 2006 and our condensed consolidated statement of operations, statement of partners' capital and statement of cash flows for the six months ended June 30, 2006 include the consolidated financial results of PAL and its subsidiaries for the six months ended July 31, 2006.
Summary historical consolidated financial data
We have derived the summary historical consolidated financial data from:
Our summary historical consolidated statement of operations, cash flow and other financial data for the period February 1, 2005 to December 31, 2005 (Successor), the period January 1, 2005 to January 31, 2005 (Predecessor) and the years ended December 31, 2004 and 2003 (Predecessor) and our summary historical consolidated balance sheet data as of December 31, 2005 (Successor) and as of December 31, 2004 and 2003 (Predecessor) are derived from our audited consolidated financial statements prepared in accordance with US GAAP included elsewhere in this prospectus.
Our summary historical condensed consolidated statement of operations, cash flow and other financial data for the six months ended June 30, 2006 (Successor), the period February 1, 2005 to June 30, 2005 (Successor), and the period January 1, 2005 to January 31, 2005 (Predecessor) and our summary historical condensed consolidated balance sheet data as of June 30, 2006 (Successor) are derived from our interim unaudited condensed consolidated financial statements included elsewhere in this prospectus and are prepared in accordance with US GAAP for interim financial information and with the rules and regulations of the Securities and Exchange Commission. Accordingly, they do not include all of the information and footnotes required by generally accepted accounting principles for complete financial statements. In the opinion of management, the financial statements reflect all adjustments necessary for a fair presentation of the financial position, results of operations and cash flows of the Company on a consolidated basis, and all such adjustments are of a normal recurring nature.
Historical results are not necessarily indicative of results of future operations, and results for any interim period are not necessarily indicative of the results that may be expected for a full year.
11
Summary pro forma condensed combined financial data
The summary unaudited pro forma condensed combined financial data for the year ended December 31, 2005 have been prepared to give pro forma effect to the following transactions as if they had occurred on January 1, 2005, the beginning of our 2005 fiscal year:
- •
- The Buy-out Transaction (including the 97/8% Senior Secured Notes due 2011 ("Edgen Senior Secured Notes") and preferred shares issued by Edgen and borrowings under the Edgen Credit Facility);
- •
- The acquisition of Western Flow Products, Inc. ("Western Flow") in July 2005; and
- •
- The MIM Acquisition and the related issuance of the Senior Secured Floating Rate Notes due 2010 ("PAL Floating Rate Notes"), additional Edgen Senior Secured Notes and the issuance of preferred partnership units by Edgen/Murray, L.P., and rental expense, interest expense and depreciation expense associated with the sale and leaseback of our Newbridge, Scotland facility.
In deriving the pro forma condensed combined financial data, we also obtained financial data from:
- •
- MIM Ltd.'s historical consolidated statement of operations data for the period February 1, 2005 to December 16, 2005, which has been audited and was prepared in accordance with UK GAAP and is not included elsewhere in this prospectus. The financial data from the historical consolidated financial statements have been converted to US GAAP with the application of US GAAP reconciling items, and amounts have been converted from UK pounds to US dollars; and
- •
- The Western Flow historical statement of operations for the period January 1, 2005 to July 15, 2005 which was derived from unaudited financial statements prepared in accordance with US GAAP not included elsewhere in this prospectus.
The summary unaudited pro forma condensed combined financial data presented below is for informational purposes only and should not be considered indicative of actual results that would have been achieved had the transactions described above actually been consummated on the dates indicated and do not purport to be indicative of balance sheet data or results of operations as of any future date or for any future period.
The summary historical consolidated and pro forma condensed combined financial data should be read in conjunction with, and are qualified in their entirety by reference to, the sections entitled, "Selected historical consolidated financial data of Edgen/Murray, L.P.," "Unaudited pro forma condensed combined financial statements" and "Management's discussion and analysis of financial condition and results of operations" and our audited consolidated financial statements and the related notes thereto, our unaudited condensed consolidated financial statements and the related notes thereto contained elsewhere in this prospectus.
The following tables set forth, for the periods and dates indicated, our summary historical consolidated and pro forma condensed combined financial data.
12
| |
| | Successor
| | Predecessor
| | Successor
| | Predecessor
| |
|---|
| |
| | Period
February 1,
2005 to
June 30,
2005
| | Period
January 1,
2005 to
January 31,
2005
| | Pro forma
year
ended
December 31,
2005
| | Period
February 1,
2005 to
December 31,
2005
| | Period
January 1,
2005 to
January 31,
2005
| | Year ended December 31,
| |
|---|
| | Six months
ended
June 30, 2006
| |
|---|
(dollars in thousands)
| | 2004
| | 2003
| |
|---|
| |
| Statement of operations: | | | | | | | | | | | | | | | | | | | | | | | | | |
| | Sales | | $ | 340,020 | | $ | 120,288 | | $ | 18,945 | | $ | 600,441 | | $ | 282,925 | | $ | 18,945 | | $ | 207,821 | | $ | 147,025 | |
Operating expenses: |
|
|
|
|
|
|
|
|
|
|
|
|
|
|
|
|
|
|
|
|
|
|
|
|
|
| | Cost of sales (exclusive of depreciation and amortization shown separately below) | | | 274,653 | | | 93,627 | | | 14,153 | | | 482,297 | | | 226,236 | | | 14,153 | | | 155,357 | | | 121,146 | |
| | Selling, general and administrative expense(1) | | | 26,322 | | | 13,035 | | | 14,364 | | | 64,181 | | | 28,960 | | | 14,364 | | | 32,009 | | | 29,595 | |
| | Depreciation and amortization expense | | | 12,412 | | | 1,087 | | | 201 | | | 22,648 | | | 6,226 | | | 201 | | | 2,400 | | | 2,001 | |
| | |
| |
| | Total operating expenses | | | 313,387 | | | 107,749 | | | 28,718 | | | 569,126 | | | 261,422 | | | 28,718 | | | 189,766 | | | 152,742 | |
| | |
| |
| Income (loss) from operations | | | 26,633 | | | 12,539 | | | (9,773 | ) | | 31,315 | | | 21,503 | | | (9,773 | ) | | 18,055 | | | (5,717 | ) |
Other income (expense)(2) |
|
|
5,906 |
|
|
75 |
|
|
(50 |
) |
|
(252 |
) |
|
(307 |
) |
|
(50 |
) |
|
106 |
|
|
174 |
|
Interest expense, net |
|
|
(17,169 |
) |
|
(4,958 |
) |
|
(333 |
) |
|
(33,778 |
) |
|
(12,139 |
) |
|
(333 |
) |
|
(5,163 |
) |
|
(3,122 |
) |
| | |
| |
| Income (loss) from continuing operations before income tax expense (benefit) | | | 15,370 | | | 7,656 | | | (10,156 | ) | | (2,715 | ) | | 9,057 | | | (10,156 | ) | | 12,998 | | | (8,665 | ) |
| Income tax expense (benefit) | | | 5,304 | | | 2,748 | | | (1,916 | ) | | (167 | ) | | 3,055 | | | (1,916 | ) | | (3,211 | ) | | (4,195 | ) |
| | |
| |
| Income (loss) from continuing operations | | | 10,066 | | | 4,908 | | | (8,240 | ) | | (2,548 | ) | | 6,002 | | | (8,240 | ) | | 16,209 | | | (4,470 | ) |
Discontinued operations: |
|
|
|
|
|
|
|
|
|
|
|
|
|
|
|
|
|
|
|
|
|
|
|
|
|
| Loss from discontinued operations before income tax (benefit) | | | — | | | — | | | — | | | — | | | — | | | — | | | — | | | (348 | ) |
| Income tax (benefit) | | | — | | | — | | | — | | | — | | | — | | | — | | | — | | | (159 | ) |
| | |
| |
| Net income (loss) | | | 10,066 | | | 4,908 | | | (8,240 | ) | | (2,548 | ) | | 6,002 | | | (8,240 | ) | | 16,209 | | | (4,659 | ) |
| Preferred interest and dividend requirement | | | (2,134 | ) | | (765 | ) | | (190 | ) | | (4,524 | ) | | (1,798 | ) | | (190 | ) | | (2,206 | ) | | (2,212 | ) |
| | |
| |
| Net income (loss) applicable to common unitholders/shareholders | | $ | 7,932 | | $ | 4,143 | | $ | (8,430 | ) | $ | (7,072 | ) | $ | 4,204 | | $ | (8,430 | ) | $ | 14,003 | | $ | (6,871 | ) |
| | |
| |
Other financial data: |
|
|
|
|
|
|
|
|
|
|
|
|
|
|
|
|
|
|
|
|
|
|
|
|
|
| | EBITDA(a)(3) | | $ | 44,951 | | $ | 13,701 | | $ | (9,622 | ) | $ | 53,711 | | $ | 27,422 | | $ | (9,622 | ) | $ | 20,561 | | $ | (3,731 | ) |
| | Total capital expenditures | | | 1,421 | | | 582 | | | 4 | | | 1,324 | | | 1,320 | | | 4 | | | 1,112 | | | 2,499 | |
| |
- (a)
- EBITDA for the six months ended June 30, 2006, includes a $6.1 million foreign exchange gain on the PAL Floating Rate Notes denominated in US dollars. EBITDA for the pro forma year ended December 31, 2005 and the period January 1, 2005 to January 31, 2005 period, includes $12.0 million in Buy-out Transaction related expenses and approximately $5.5 million (£3.1 million) in bonus payments and applicable payroll taxes to certain MIM Ltd. employees prior to the MIM Acquisition.
| |
| | Successor
| | Predecessor
| |
|---|
| |
| |
| | As of December 31,
| |
|---|
| | As of
June 30,
2006
| |
| |
|---|
| | As of December 31,
2005
| |
|---|
(dollars in thousands)
| | 2004
| | 2003
| |
|---|
| |
| Balance sheet data: | | | | | | | | | | | | | |
| | Cash and cash equivalents | | $ | 24,259 | | $ | 41,146 | | $ | 134 | | $ | 3,125 | |
| | Working capital | | | 172,548 | | | 153,187 | | | 60,868 | | | 53,633 | |
| | Net property, plant and equipment | | | 41,072 | | | 40,940 | | | 10,423 | | | 11,668 | |
| | Total assets | | | 518,136 | | | 520,221 | | | 118,862 | | | 105,560 | |
| | Long-term debt and capital leases | | | 286,752 | | | 286,688 | | | 47,883 | | | 50,973 | |
| | Mandatorily redeemable preferred stock(4) | | | — | | | — | | | 55,979 | | | 53,918 | |
| | Preferred units included in total partners' capital(5) | | | 52,852 | | | 50,718 | | | — | | | — | |
| | Total partners' capital and shareholders equity (deficit) | | | 83,982 | | | 71,812 | | | (11,755 | ) | | (25,533 | ) |
| |
13
- (1)
- Selling, general and administrative expense for the pro forma year ended December 31, 2005 and for the period January 1, 2005 to January 31, 2005 includes $12.0 million in Buy-out Transaction related expenses and the period February 1, 2005 to December 31, 2005 includes approximately $5.5 million (£3.1 million) in bonus payments and applicable payroll taxes to certain MIM Ltd. employees prior to the MIM Acquisition, respectively.
- (2)
- Other income (expense) for the six months ended June 30, 2006 includes a $6.1 million foreign exchange gain on the PAL Floating Rate Notes denominated in US dollars.
- (3)
- We define EBITDA as net income (loss) before net interest expense, income taxes and depreciation and amortization. We use EBITDA in our business operations to, among other things, evaluate the performance of our operating segments, develop budgets and measure our performance against those budgets. We find it a useful tool to assist us in evaluating performance because it eliminates items related to corporate overhead (depreciation) and capital structure, taxes and other non-cash charges. However, EBITDA, which does not represent operating income as defined by US GAAP, should not be considered by prospective investors to be an alternative to operating income. EBITDA is not a measure of profitability because it does not include costs and expenses for depreciation and amortization, interest and related expenses and income taxes. Also, because EBITDA is not calculated in the same manner by all companies, it may not be comparable to other similarly titled measures used by other companies. In addition, this definition of EBITDA differs from the definition of EBITDA in the indentures governing our notes.
Set forth below is a reconciliation of net income (loss) to EBITDA for the periods presented.
| |
| | Successor
| | Predecessor
| | Successor
| | Predecessor
| |
|---|
| |
| | Period
February 1,
2005 to
June 30,
2005
| | Period
January 1,
2005 to
January 31,
2005
| |
| | Period
February 1,
2005 to
December 31,
2005
| | Period
January 1,
2005 to
January 31,
2005
| | Year ended
December 31,
| |
|---|
| | Six months ended
June 30,
2006
| | Pro forma
year ended
December 31,
2005
| |
|---|
(dollars in thousands)
| | 2004
| | 2003
| |
|---|
| |
| | Net income (loss) | | $ | 10,066 | | $ | 4,908 | | $ | (8,240 | ) | $ | (2,548 | ) | $ | 6,002 | | $ | (8,240 | ) | $ | 16,209 | | $ | (4,659 | ) |
| | Income tax expense (benefit) | | | 5,304 | | | 2,748 | | | (1,916 | ) | | (167 | ) | | 3,055 | | | (1,916 | ) | | (3,211 | ) | | (4,195 | ) |
| | Interest expense, net | | | 17,169 | | | 4,958 | | | 333 | | | 33,778 | | | 12,139 | | | 333 | | | 5,163 | | | 3,122 | |
| | Depreciation and amortization | | | 12,412 | | | 1,087 | | | 201 | | | 22,648 | | | 6,226 | | | 201 | | | 2,400 | | | 2,001 | |
| | |
| |
| EBITDA(a) | | $ | 44,951 | | $ | 13,701 | | $ | (9,622 | ) | $ | 53,711 | | $ | 27,422 | | $ | (9,622 | ) | $ | 20,561 | | $ | (3,731 | ) |
| |
- (a)
- EBITDA for the six months ended June 30, 2006, includes a $6.1 million foreign exchange gain on the PAL Floating Rate Notes denominated in US dollars. EBITDA for the pro forma year ended December 31, 2005 and the period January 1, 2005 to January 31, 2005 period, includes $12.0 million in Buy-out Transaction related expenses, and approximately $5.5 million (£3.1 million) in bonus payments and applicable payroll taxes to certain MIM Ltd. employees prior to the MIM Acquisition.
- (4)
- Mandatorily redeemable preferred stock was replaced by redeemable preferred stock on February 1, 2005 in connection with the Buy-out Transaction.
- (5)
- In connection with the formation of Edgen/Murray, L.P. in 2005, preferred partnership units were issued to existing Edgen shareholders and certain members of management of MIM Ltd. See "Management discussion and analysis of financial condition and results of operations—Formation of holding company and acquisitions."
14
Risk factors
An investment in the ADSs involves a significant degree of risk, including the risks described below. You should carefully consider the following risk factors and the other information in this prospectus before deciding to invest in the ADSs. The risks described below are not the only ones facing us. Additional risks and uncertainties not currently known to us or that we currently deem immaterial may also materially and adversely affect our business, financial condition, results of operations or liquidity. Any of the following risks could materially adversely affect our business, financial condition or results of operations. In such case, you may lose all or part of your original investment.
Risks relating to our business
Volatility in the global energy infrastructure market, and in particular oil and gas prices and refining margins, could reduce demand for our products, which could cause our sales to decrease.
Proceeds from the sale of specialty steel pipe, pipe components and high grade structural steel sections and plates to the global energy infrastructure market constitute a significant portion of our sales. As a result, we depend upon the global energy infrastructure market, and in particular the oil and gas and refining industries, and the ability and willingness of industry participants to make capital expenditures to explore for, develop and produce, transport, process and refine oil and gas. If these expenditures decline, our business will suffer. The industry's willingness to explore, develop, produce, transport, process and refine depends largely upon the availability of attractive drilling prospects and the prevailing view of future oil and gas prices and refinery margins and general economic conditions. Many factors affect the supply and demand for oil and gas and refined products and therefore influence our product prices, including:
- •
- the level of domestic and worldwide oil and natural gas production;
- •
- the level of domestic and worldwide supplies of, and demand for, oil and natural gas and refined products;
- •
- the expected cost of delivery of new reserves;
- •
- the availability of attractive oil and gas fields for production, which may be affected by governmental action or environmental policy and which may restrict drilling prospects;
- •
- domestic and worldwide refinery overcapacity or undercapacity and utilization rates;
- •
- changes in the cost or availability of transportation infrastructure;
- •
- levels of drilling activity;
- •
- national, governmental and other political requirements, including the ability of the Organization of the Petroleum Exporting Countries ("OPEC") to set and maintain production levels and pricing;
- •
- the impact of political instability or armed hostilities involving one or more oil and gas producing nations;
- •
- pricing and other actions taken by competitors that impact the market;
- •
- failure to implement successfully planned capital projects or to realize the benefits expected for those projects;
- •
- changes in fuel specifications required by environmental and other laws, particularly with respect to oxygenates and sulfur content;
15
- •
- aggregate refinery capacity to convert heavy sour crude oil into refined products;
- •
- the cost of developing alternate energy sources;
- •
- domestic and foreign governmental regulations, especially environmental regulations, trade laws and tax policies; and
- •
- the overall global economic environment.
Oil and gas prices and processing and refining margins have been and are expected to remain volatile. This volatility causes our customers to change their strategies and expenditure levels. We have experienced in the past, and we may experience in the future, significant fluctuations in operating results based on these changes. In particular, such volatility in the oil and gas and refined products margins and markets more generally could adversely affect our business, consolidated financial condition, results of operations and liquidity.
The supply of steel and the price we pay for steel products may fluctuate due to a number of factors beyond our control, which could adversely affect our operating results.
We purchase large quantities of steel from our vendors which we sell to a variety of end-users, who are primarily involved in servicing the energy infrastructure market and providers of MRO products. The prices we pay for these products and the prices we charge for our products may change depending on many factors outside of our control, including general economic conditions, competition, production levels, import duties and other trade restrictions, currency fluctuations and surcharges imposed by our vendors. We seek to maintain our profit margins by attempting to increase the price of our products in response to increases in the prices we pay for our inventories. If, however, we are unable to pass on higher costs to our customers in a timely manner, or not at all, or if our supply of products is delayed or curtailed, this could have a material adverse effect on our business, financial condition, results of operations and liquidity. Alternatively, significant steel price decreases could have a material adverse effect on our business, financial condition, results of operation and liquidity if decreases in steel prices necessitate us to reduce product pricing, especially to the extent inventory has been purchased by us prior to the steel price decreases.
We have a limited financial history reflecting our combined operations, and our historical and pro forma financial information is not necessarily representative of our current or future results of operations.
The historical financial information included in this prospectus does not reflect the financial condition, results of operations or cash flows that we would have achieved through the combined operations of our businesses or those that may be achieved in the future. Because of the significance of the MIM Acquisition, the financial statements for periods prior to the acquisition are not comparable with those after the acquisition, and the lack of comparable data may make it difficult to evaluate our results of operations and future prospects. The pro forma financial statement included in this prospectus is not necessarily indicative of our financial position or results of operations that would have occurred had the transactions described therein been consummated as of the dates indicated, nor is it indicative of our future financial position or results of operation.
Our business is sensitive to economic downturns, which could cause our revenues to decrease.
The demand for our products is dependent on the general economy and the energy infrastructure market and other factors. Downturns in the general economy or in the energy infrastructure market may cause demand for our products to materially decrease. In 2003, the specialty steel products industry experienced softness principally due to weak economic conditions in general and reduced spending on expansion and development projects by end-users. During 2003, we experienced a significant decline in sales and profitability, primarily as a result of a severely depressed power
16
generation market and reduced spending in the processing and oil and gas industries, and an internal decision to liquidate inventory of certain low-margin products. In addition, if we are not adequately able to predict demand and if our inventories (or the inventories of manufacturers, other distributors or our customers) become excessive, there could be a material adverse effect on price levels for our products, the quantity of products sold by us and our revenues.
Loss of key vendors or reduced product availability could decrease our sales and earnings.
For the six months ended June 30, 2006, our ten largest vendors accounted for approximately 45% of our purchases and our single largest vendor accounted for approximately 11% of our total purchases. The loss of any of these vendors—or a reduction in purchases by us from these vendors that results in the loss of volume discounts—could result in a decrease in our sales, operating results and earnings by decreasing the availability, or increasing the prices, of products we distribute, which could limit our ability to satisfy our customers' product needs. Such reduced product availability could put us at a competitive disadvantage.
In addition, particular products or product lines may not be available to us, or not available in quantities sufficient to meet our customer demand. A substantial decrease in the availability of these products or product lines could result in a decrease in our sales, operating results and earnings as we might not be able to satisfy our customers' product needs. Such reduced product availability could put us at a competitive disadvantage.
Significant competition from a number of companies could reduce our market share and have an adverse effect on our selling prices and sales volume.
We operate in a highly competitive industry and compete against a number of companies, some of which have significantly greater financial, technological and marketing resources than we do. We believe that our ability to compete depends on high product performance, short lead-time and timely delivery, competitive pricing and superior customer service and support. We might be unable to compete successfully with respect to these or other factors. If we are unsuccessful, we could lose market share to our competitors. Moreover, actions by our competitors could have an adverse effect on our selling prices and sales volume.
The development of alternatives to steel product distributors in the supply chain in the industries in which we operate could cause a decrease in our sales and operating results and limit our ability to grow our business.
If our customers were to decide to purchase products directly from manufacturers, it could negatively affect our sales and earnings. Our vendors also could expand their own local sales force and inventory stocking capabilities and sell more products directly to our customers. These or other actions that remove us from, or limit our role in, the distribution chain, may harm our competitive position in the marketplace and reduce our sales and earnings.
Increases in customer, manufacturer and distributor inventory levels could reduce our sales and profit.
Customer, manufacturer and distributor inventory levels of specialty steel pipe, pipe components and high grade structural steel products can change significantly from period to period. Increases in our customers' inventory levels can have a direct adverse effect on the demand for these products when customers utilize existing inventory rather than purchase new products. Reduced demand, in turn, would likely result in reduced sales volume and overall profitability.
Increased inventory levels by manufacturers or other distributors can cause an oversupply of steel products in our markets and reduce the prices that we are able to charge for our products. Reduced prices, in turn, would likely reduce our margins and overall profitability.
17
We rely on our information technology systems to manage numerous aspects of our business and customer and vendor relationships and a disruption of these systems could adversely affect our business.
We depend on our information technology (IT) system to process orders, track credit risk, manage inventory and accounts receivable collections. Our IT system also allows us to efficiently purchase products from our vendors and ship products to our customers on a timely basis, maintain cost-effective operations and provide superior service to our customers. Our IT system is an integral part of our business and growth strategies, and a serious disruption to our IT system could significantly limit our ability to manage and operate our business efficiently, which, in turn, could cause our business and competitive position to suffer and cause our results of operations to be reduced.
Loss of third-party transportation providers upon whom we depend or conditions negatively affecting the transportation industry could increase our costs or cause a disruption in our operations.
We depend upon third-party transportation providers for delivery of products to our customers. Strikes, slowdowns, transportation disruptions or other conditions in the transportation industry, including, but not limited to, shortages of truck drivers, disruptions in rail service, increases in fuel prices and adverse weather conditions, could increase our costs and disrupt our operations and our ability to service our customers on a timely basis. We cannot predict whether or to what extent recent increases or anticipated increases in fuel prices may impact our costs or cause a disruption in our operations going forward.
Our ten largest customers account for a substantial portion of our sales and profits, and the loss of these customers could result in materially decreased sales and profits.
Our ten largest customers accounted for approximately 35% of our overall sales for the six months ended June 30, 2006. We may lose a customer for any number of reasons, including as a result of a merger or acquisition, the selection of another provider of high grade steel products, business failure or bankruptcy or our performance. We do not have contracts with all of our major customers. Moreover, to the extent we have contracts with our major customers, these contracts generally may be discontinued with 30 days' notice by either party, are not exclusive and do not require minimum levels of purchases. To the extent we do not enter into formal written contracts with our customers, we instead establish the terms and conditions of sales to our customers through purchase orders and other trade practices and informal correspondence. We may not retain long-term relationships or secure renewals of short-term relationships with our major customers in the future.
We may need additional capital in the future and it may not be available on acceptable terms.
We may require more capital in the future to:
- •
- fund our operations;
- •
- finance investments in equipment and infrastructure needed to maintain and expand our distribution capabilities;
- •
- enhance and expand the range of products we offer; and
- •
- respond to potential strategic opportunities, such as investments, acquisitions and international expansion.
We cannot assure you that additional financing will be available on terms favorable to us, or at all. The terms of available financing may place limits on our financial and operating flexibility. If adequate funds are not available on acceptable terms, we may be forced to reduce our operations or delay, limit or abandon expansion opportunities. Moreover, even if we are able to continue our operations, the failure to obtain additional financing could reduce our competitiveness.
18
We are a holding company, with no revenue generating operations of our own. We depend on the performance of our subsidiaries and their ability to make distributions to us.
We are a holding company with no business operations, sources of income, indebtedness or assets of our own other than our ownership interests in our subsidiaries. Because all our operations are conducted by our subsidiaries, our cash flow and our ability to repay debt that we may incur after this offering and our ability to pay dividends to our shareholders are dependent upon cash dividends and distributions or other transfers from our subsidiaries. Payment of dividends, distributions, loans or advances by our subsidiaries to us are subject to restrictions imposed by the current and future debt instruments of our subsidiaries. The debt instruments of each of our principal operating subsidiaries, Edgen and MIM Ltd., limit our ability to allocate cash flow or resources from one subsidiary, and its related group of subsidiaries, to another subsidiary group or to us. In addition, payments or distributions from our subsidiaries could be subject to restrictions on dividends or repatriation of earnings under applicable local law, monetary transfer restrictions and foreign currency exchange regulations in the jurisdictions in which our subsidiaries operate.
Our subsidiaries are separate and distinct legal entities. Any right that we have to receive any assets of or distributions from any of our subsidiaries upon the bankruptcy, dissolution, liquidation or reorganization of any such subsidiary, or to realize proceeds from the sale of their assets, will be junior to the claims of that subsidiary's creditors, including trade creditors and holders of debt issued by that subsidiary.
Risks generally associated with acquisitions, including identifying and integrating future acquisitions, could adversely affect our business.
An element of our growth strategy has been and is expected to continue to be the pursuit of acquisitions of other businesses that either expand or complement our existing product lines. We cannot assure you, however, that we will be able to identify additional acquisitions or that we would realize any anticipated benefits from such acquisitions. Integrating businesses involves a number of special risks, including the possibility that management may be distracted from regular business concerns by the need to integrate operations, unforeseen difficulties in integrating operations and systems, problems concerning assimilating and retaining the employees of the acquired business, accounting issues that arise in connection with the acquisition, challenges in retaining customers and potential adverse short-term effects on operating results. Acquired businesses may require a greater amount of capital, infrastructure or other spending than we anticipate. In addition, we may incur debt to finance future acquisitions, which could increase our leverage. We cannot assure you that we will be successful in consummating future acquisitions on favorable terms or at all. If we are unable to successfully complete and integrate strategic acquisitions in a timely manner, our growth strategy could be adversely impacted.
War, other armed conflicts or terrorist attacks could result in a material adverse effect on our business.
The continuing unrest in Iraq, tension with regard to North Korea and Iran, as well as terrorist attacks have significantly increased political and economic instability in some of the geographic areas in which we operate and could spread to other such areas. Our operations in the Middle East could be adversely affected by post-war conditions in Iraq if armed hostilities, acts of terrorism or other unrest persist. Acts of terrorism and threats of armed conflict elsewhere in the Middle East and in or around various other areas in which we operate, such as the Caspian Sea region, West Africa and Southeast Asia, could also limit or disrupt our markets and operations. Further hostilities or additional acts of terrorism in these regions could result in the evacuation of personnel, cancellation of contracts or the loss of personnel or assets. Armed conflicts, terrorism and their effects on us or our markets could significantly affect our business in the future.
19
Disruptions in the political and economic conditions of the countries in which we operate could adversely affect our business.
Our operations are subject to the following risks:
- •
- foreign currency fluctuations and devaluations;
- •
- local economic conditions;
- •
- restrictions on currency repatriation;
- •
- restrictions on access to markets for periods of time;
- •
- political instability;
- •
- unfavorable government policies disrupting purchasing and distribution capabilities;
- •
- war and civil disturbances; and
- •
- terrorist attacks.
We may be exposed to foreign currency fluctuations that could have a material adverse effect upon our results of operations, financial condition and liquidity. As of June 30, 2006, approximately 23.9% of our revenues and 20.4% of our long-term assets were denominated in UK pounds, our functional currency in the United Kingdom. As a result, a material decrease in the value of the UK pound relative to the US dollar may negatively impact our revenues, cash flows and net income. Each one percentage point change in the value of the UK pound for the six month period ended June 30, 2006 would have impacted our revenues by approximately $0.9 million. We do not currently use hedges or forward contracts to offset this risk.
Although we are not subject to currency controls in the countries where we currently operate, any implementation by local monetary authorities in these countries of exchange controls in the future could affect our business or financial results.
Our international operations are also subject to other risks, including foreign monetary and tax policies, expropriation, nationalization and nullification or modification of contracts. Additionally, our ability to compete in international markets may be adversely affected by foreign governmental regulations that favor or require the awarding of contracts to local contractors or by regulations requiring foreign contractors to employ citizens of, or purchase supplies from, a particular jurisdiction. Furthermore, our subsidiaries may face governmentally imposed restrictions from time to time on their ability to transfer funds to us.
Hurricanes or other adverse weather events could negatively affect our local economies or disrupt our operations, which could have an adverse effect on our business or results of operations.
Our market areas in the southeastern United States are susceptible to hurricanes. Similarly our market areas in the Asia/Pacific geographic market are susceptible to tropical storms, also known as typhoons. Such weather events can disrupt our operations, result in damage to our properties and negatively affect the local economies in which we operate. Additionally, we may experience communication disruptions with our customers, vendors and employees. In late August 2005 and September 2005, Hurricanes Katrina and Rita struck the Gulf Coast of Louisiana, Mississippi, Alabama and Texas and caused extensive and catastrophic physical damage to those market areas. As a result of Hurricanes Katrina and Rita, our Louisiana and Texas locations sustained minor physical damage and were closed for a minimal number of days to secure our employees. Additionally, our sales order backlog and shipments experienced a temporary decline immediately following the hurricanes.
20
We cannot predict whether or to what extent damage caused by future hurricanes and tropical storms will affect our operations or the economies in those market areas. Such weather events could result in disruption of our purchasing and/or distribution capabilities, interruption of our business that exceeds our insurance coverage, our inability to collect from customers and increased operating costs. Our business or results of operations may be adversely affected by these and other negative effects of hurricanes or other adverse weather events.
If we are unable to retain our key management personnel, our growth and future success may be impaired and our financial condition could suffer as a result.
Our success depends to a significant degree upon the continued contributions of senior management certain of whom would be difficult to replace. The departure of our executive officers could have a material adverse effect on our business, financial condition or results of operations. We do not maintain key-man life insurance on any of our executive officers. We cannot assure you that the services of such personnel will continue to be available to us. See "Management."
We might be unable to employ and retain a sufficient number of sales and customer service personnel.
Many of our customers require products that are complex, highly engineered and often must be able to perform in harsh conditions. We believe that our success depends upon our ability to employ and retain qualified sales and service personnel with the ability to understand our products and provide tailored product solutions to our customer base. A significant increase in the wages paid by competing employers could result in a reduction of our skilled labor force, increases in the wage rates that we must pay or both. If either of these events were to occur, our cost structure could increase and our growth potential could be impaired.
We are subject to environmental laws and regulations relating to hazardous materials, substances and waste used in or resulting from our operations. Liabilities or claims with respect to environmental matters could have a significant negative impact on our business.
Our operations are governed by laws and regulations relating to workplace safety and worker health which, among other things, regulate employee exposure to hazardous chemicals in the workplace. As with other companies engaged in like businesses, the nature of our operations expose us to the risk of liabilities or claims with respect to environmental matters, including those relating to the disposal and release of hazardous substances. Such liabilities or claims, if incurred, could be material.
We will incur increased costs as a result of being a public company.
As a public company, we will incur significant legal, accounting and other expenses that we did not incur as a private company. The Sarbanes-Oxley Act of 2002 and related rules of the Securities and Exchange Commission, or SEC, and the NYSE regulate corporate governance practices of public companies. We expect that compliance with these public company requirements will increase our costs and make some activities more time consuming. For example, we will create new board committees and adopt new internal controls and disclosure controls and procedures. In addition, we will incur additional expenses associated with our SEC reporting requirements. We also expect that it could be difficult and will be significantly more expensive to obtain directors' and officers' liability insurance, and we may be required to accept reduced policy limits and coverage or incur substantially higher costs to obtain the same or similar coverage. As a result, it may be more difficult for us to attract and retain qualified persons to serve on our board of directors or as executive officers. Advocacy efforts by shareholders and third parties may also prompt even more changes in governance and reporting requirements. We cannot predict or estimate the amount of additional costs we may incur or the timing of such costs.
21
Our internal controls over financial reporting may not be effective and our independent registered public accounting firm may not be able to opine as to their effectiveness, which could have a significant and adverse effect on our business and reputation.
We are evaluating our internal controls over financial reporting in order to allow management to report on, and our independent registered public accounting firm to attest to, the design and operational effectiveness of our internal controls over financial reporting, as required by Section 404 of the Sarbanes-Oxley Act of 2002, as amended, and rules and regulations of the SEC thereunder, which we refer to as "Section 404." We are in the process of documenting and testing our internal control procedures in order to satisfy the requirements of Section 404, which requires annual management assessments of the effectiveness of our internal controls over financial reporting and a report by our independent registered public accounting firm addressing these assessments. During the course of our testing, we may identify deficiencies which we may not be able to remediate in time to meet the deadline imposed by the Sarbanes-Oxley Act for compliance with the requirements of Section 404. We expect that we will be required to comply with the requirements of Section 404 for our 2007 fiscal year. In addition, if we fail to achieve and maintain the adequacy of our internal controls over financial reporting, as such standards are modified, supplemented or amended from time to time, we may not be able to ensure that we can conclude on an ongoing basis that we have effective internal controls over financial reporting in accordance with Section 404. We cannot be certain as to the timing of completion of our evaluation, testing and any remediation actions or the impact of the same on our operations. If we are not able to implement the requirements of Section 404 in a timely manner or with adequate compliance, our independent registered public accounting firm may not be able to opine as to the effectiveness of our internal control over financial reporting, and we may be subject to sanctions or investigation by regulatory authorities, such as the SEC. As a result, there could be a negative reaction in the financial markets due to a loss of confidence in the reliability of our financial statements. In addition, we may be required to incur costs in improving our internal control system and the hiring of additional personnel. Any such action could negatively affect our results of operations.
We may not have adequate insurance for potential liabilities.
Our products are sold primarily for use in the energy infrastructure market, which are subject to inherent risks that could result in death, personal injury, property damage, pollution or loss of production. In addition, defects in our products could result in death, personal injury, property damage, pollution or damage to equipment and facilities. Actual or claimed defects in the products we distribute may give rise to claims against us for losses and expose us to claims for damages. Our insurance may be inadequate or unavailable to protect us in the event of a claim or our insurance coverage may be canceled or otherwise terminated. We face the following additional risks under our insurance coverage:
- •
- we may not be able to continue to obtain insurance on commercially reasonable terms or not at all;
- •
- we may be faced with types of liabilities that will not be covered by our insurance, such as damages from environmental contamination or terrorist attacks;
- •
- the amount of any liabilities may exceed our policy limits; and
- •
- we may incur losses from interruption of our business that exceed our insurance coverage.
Even a partially uninsured claim, if successful and of significant size, could have a material adverse effect on our business, consolidated financial condition, results of operations or liquidity.
We are subject to litigation risks that may not be covered by insurance.
In the ordinary course of business, we may be subject to various claims, lawsuits and administrative proceedings seeking damages or other remedies concerning our commercial operations, products, employees and other matters. We maintain insurance to cover many of our potential losses, and we are
22
subject to various self-retentions and deductibles under our insurance. It is possible, however, that a judgment could be rendered against us in cases in which we could be uninsured and beyond the amounts that we currently have reserved or anticipate incurring for such matters.
Risks relating to our American Depositary Shares and this offering
No public market existed for our ordinary shares or ADSs prior to the offering and there can be no assurance that an active trading market will develop for the ADSs on the NYSE.
Our ordinary shares are not listed on any stock exchange or organized trading market. Prior to this offering, there has been no public market for our ordinary shares or ADSs and you could not buy or sell the ADSs publicly. In addition, we do not currently have any plans to list our ordinary shares on any stock exchange or organized trading market, nor do we have any obligation to do so.
We intend to apply to have the ADSs quoted on the NYSE. There can be no assurance that an active trading market will develop for the ADSs on the NYSE. The absence of an active trading market on the NYSE could adversely affect the market price of the ADSs. The underwriters will determine the offer price by negotiation, and this price may not be the price at which the ADSs will trade due to the fact that the offer price may be based on factors that may not be indicative of future performance.
We are controlled by parties whose interests may not be aligned with yours.
Funds managed by JCP currently control Edgen/Murray, L.P., our parent holding company. Following this offering, these funds will continue to own % of our outstanding ordinary shares ( % if the underwriters exercise the over-allotment option in full). Accordingly, JCP had and may continue to have, by virtue of the ownership interests of these funds, significant influence over our management, and the ability to elect our board of directors and to determine the outcome of any other matter submitted for shareholder approval, including the power to determine the outcome of all corporate transactions, such as mergers, consolidations and the sale of all or substantially all of our assets. The interests of JCP may differ from your interests as a shareholder and, as such, JCP may take actions that may not be in your interest. In addition, JCP may have an interest in pursuing acquisitions, divestitures, financings or other transactions that, in its judgment, could enhance its equity investment, even though such transactions might involve risks to you as a holder of ADSs.
Market volatility may cause the price of our ADSs and the value of your investment to decline and you may not be able to resell your ADSs at or above the initial public offering price.
Our ADS price is likely to be volatile. The initial public offering price may not be indicative of prices that will subsequently prevail in the market. Therefore, if you purchase ADSs in this offering, you may not be able to resell your ADSs at or above the initial public offering price. In addition to other risk factors described in this section, the following factors may have a significant impact on the market price of our ADSs:
- •
- actual or anticipated fluctuations in our results of operations;
- •
- changes in financial estimates or recommendations by securities analysts;
- •
- sales of large blocks of our ADSs; and
- •
- sales of our ADSs by our executive officers, directors and significant shareholders.
23
Your rights as a shareholder will be governed by English law and differ from the rights of shareholders under US law. In addition, you may have difficulty in effecting service of process in the United States or enforcing judgments obtained in the United States.
We are a public limited company incorporated under the laws of England. Therefore, many of the rights of holders of ADSs are governed by English law and by our memorandum and articles of association. These rights differ from the typical rights of shareholders in US corporations. For example, the rights of shareholders to bring proceedings against us or against our directors or officers in relation to public statements are more limited under English law than the civil liability provisions of the US securities laws.
It may not be possible to enforce court judgments obtained in the United States against us in England, or in countries other than the United States where we have assets, based on the civil liability provisions of US federal or state securities laws. In addition, there is some doubt as to whether the courts of England and other countries would recognize or enforce judgments of US courts obtained against us or our directors or officers based on the civil liabilities provisions of US federal or state securities laws or would hear actions against us or those persons based on those laws.
Investors purchasing our ADSs will suffer immediate and substantial dilution.
The initial public offering price for our ADSs will be substantially higher than the equivalent net tangible book value per share of our outstanding ordinary shares immediately after this offering. If you purchase ADSs in this offering, you will incur substantial and immediate dilution in the net tangible book value of your investment. Net tangible book value per share represents the amount of total tangible assets less total liabilities, divided by the number of ordinary shares then outstanding. See "Dilution" for a calculation of the extent to which your investment will be diluted.
ADSs eligible for public sale after this offering could adversely affect the price of our ordinary shares.
The market price for our ADSs could decline as a result of sales by our existing shareholders or management of ADSs in the public market after this offering, or the perceptions that these sales could occur. These sales could materially impair our future ability to raise capital through offerings of our ADSs. The lock-up agreements relating to our shareholders provide that they may not dispose of ordinary shares for a certain period following the date of this prospectus. For more information on our principal shareholders, their lock-up agreements and their shares eligible for future sale, see "Security ownership of certain beneficial owners and management," "Shares eligible for future sale" and "Underwriting."
Currency fluctuations may adversely affect the US dollar amount of cash dividends paid on the ADSs, if any.
In the event we pay cash dividends, we will calculate and pay any cash dividends in UK pounds and, as a result, exchange rate movements will affect the US dollar amount of dividends you will receive from the Depositary if you hold ADSs.
24
Special note regarding forward-looking statements
This prospectus contains forward looking statements within the meaning of the federal securities laws. Statements that are not historical facts, including statements about our beliefs and expectations, are forward looking statements. Forward-looking statements include statements preceded by, followed by or that include the words "may," "could," "would," "should," "believe," "expect," "anticipate," "plan," "estimate," "target," "project," "intend" and similar expressions. These statements include, among others, statements regarding our expected business outlook, anticipated financial and operating results, our business strategy and means to implement the strategy, our objectives, the amount and timing of capital expenditures, the likelihood of our success in expanding our business, financing plans, budgets, working capital needs and sources of liquidity.
Forward-looking statements are only predictions and are not guarantees of performance. These statements are based on our management's beliefs and assumptions, which, in turn, are based on currently available information. Important assumptions relating to the forward looking statements include, among others, assumptions regarding demand for our products, the expansion of product offerings geographically or through new applications, the timing and cost of planned capital expenditures, competitive conditions and general economic conditions. These assumptions could prove inaccurate. Forward-looking statements also involve known and unknown risks and uncertainties, which could cause actual results that differ materially from those contained in any forward looking statement. Many of these factors are beyond our ability to control or predict. Such factors include, but are not limited to, the following:
- •
- changes in capital expenditures in the energy infrastructure market;
- •
- steel price volatility;
- •
- general economic conditions and construction activity in the markets in which we operate;
- •
- the risks associated with the expansion of our business;
- •
- political and economic instability in some of the regions in which we operate;
- •
- competitive pressures;
- •
- fluctuations in industry-wide inventory levels;
- •
- our substantial leverage;
- •
- fluctuations in currency exchange rates;
- •
- asserted and unasserted claims against us;
- •
- compliance with laws and regulations, including those relating to environmental matters;
- •
- our ability to integrate successfully any businesses we acquire;
- •
- technological changes; and
- •
- other factors discussed under "Risk factors" or elsewhere in this prospectus.
Given these risks and uncertainties, we urge you to read this prospectus completely and with the understanding that actual future results may be materially different from what we plan or expect. In addition, these forward-looking statements present our estimates and assumptions only as of the date of this prospectus. Except for our ongoing obligation to disclose material information as required by federal securities laws, we do not intend to update you concerning any future revisions to any forward looking statements to reflect events or circumstances occurring after the date of this prospectus.
25
Use of proceeds
The expected net proceeds from the offering, after deducting the underwriters' discount and commissions and the estimated fees and expenses payable by us of approximately $ million, are approximately $ million. We intend to use the net proceeds, together with available cash on hand, to repay the PAL Floating Rate Notes and to redeem our outstanding preference shares.
Certain of our executive officers and directors and affiliates of Jefferies & Company, Inc., an underwriter, who are holders of our outstanding preference shares will receive a portion of the proceeds of this offering. See "Underwriting—Relationships."
|
(dollars in thousands)
| |
|
|---|
|
|---|
| Sources of funds | | | |
| Net proceeds from ADSs(1) | | $ | |
| Available cash on hand | | | |
| | |
|
| Total sources | | | |
|
| Uses of funds | | | |
| Repayment of the PAL Floating Rate Notes(2) | | $ | |
| Redemption of preference shares(3) | | | |
| | |
|
| Total uses | | | |
|
- (1)
- Reflects the issuance of ADSs at $ per ADS (the midpoint of the range on the cover page of this prospectus), less the underwriters' discount and commissions and fees and expenses payable by us. Fees and expenses, includes the payment by us of UK stamp duty taxes in respect of the deposit of our ordinary shares into the ADS depositary facility against delivery of the ADSs offered hereby.
- (2)
- Includes the repayment of $130.0 million in principal, a $3.9 million call premium calculated at $30 per $1,000 note in accordance with the indenture governing the PAL Floating Rate Notes and accrued interest through the date of repayment of $ million. As of June 30, 2006, we had $130.0 million in principal outstanding, bearing interest at an annual rate of approximately 11.69%. Proceeds from the PAL Floating Rate Notes were used for the MIM Acquisition. The repayment of the PAL Floating Rate Notes is expected to occur within days of the closing of this offering. Pending such use, the proceeds to be used to repay the PAL Floating Rate Notes will be invested in short-term investments until repayment occurs.
- (3)
- Includes preference shares, UK£1 nominal value, with accrued interest through the date of redemption, for $ per share or $ million in aggregate, to be received by JCP, an affiliate of one of the underwriters, Jefferies & Company, Inc. certain members of management, directors and certain other shareholders.
26
Dividend policy
To date, we have not declared or paid any cash dividends on our ordinary shares, although in the future we may do so. Any such future determination relating to our dividend policy will be made at the discretion of our board of directors and will depend on then existing conditions, including our financial condition, results of operations, contractual restrictions, capital requirements, business prospects and other factors our board of directors may deem relevant.
However, our ability to declare and pay dividends is restricted by covenants in our credit facilities and the indentures governing the Edgen Senior Secured Notes and the PAL Floating Rate Notes. Moreover, companies organized under the laws of England cannot pay dividends unless they have distributable profits as defined in the UK Companies Act 1985. As a result, you should not rely on an investment in our ordinary shares if you require dividend income. Capital appreciation, if any, of our ADSs may be your sole source of gain for the foreseeable future.
27
Capitalization
The following table sets forth our capitalization as of June 30, 2006:
- •
- on an actual basis;
- •
- on a pro forma basis, to give effect to the Contribution; and
- •
- on a pro forma as adjusted basis, to give effect to the sale by us of approximately ADSs representing ordinary shares in this offering at an assumed public offering price per ADSs of $ (the midpoint of the range on the cover page of this prospectus); and the application of the net proceeds of this offering as described under "Use of proceeds."
You should read the information in this table in conjunction with "Use of proceeds," "Certain relationships and related party transactions—Formation of Edgen Murray Plc and the Contribution," "Selected historical consolidated financial data of Edgen/Murray, L.P.," "Management's discussion and analysis of financial condition and results of operations" and our unaudited condensed consolidated financial statements and notes thereto contained elsewhere in this prospectus.
|
| | As of June 30, 2006
|
|---|
(dollars in thousands)
| | Actual
| | Pro forma
| | Pro forma as adjusted(1)
|
|---|
|
| Debt: | | | | | | | | |
| | Credit facilities(2) | | $ | 1,789 | | $ | | | $ |
| | PAL Floating Rate Notes, net of discount of $1,174 | | | 128,185 | | | | | |
| | Edgen Senior Secured Notes, net of discount of $1,282 | | | 134,718 | | | | | |
| | Capital lease | | | 21,713 | | | | | |
| | Various other notes and capital leases | | | 347 | | | | | |
| | |
|
| | | Total debt, including current portion | | | 286,752 | | | | | |
Partners' capital and shareholders' equity: |
|
|
|
|
|
|
|
|
| | Edgen/Murray, L.P. | | | | | | | | |
| | Common partnership units—Edgen/Murray, L.P. $.01 par value per unit, 5,646,734.84 units outstanding at June 30, 2006. units issued and outstanding on a pro forma and pro forma as adjusted basis(3) | | | 32,706 | | | | | |
| | Preferred partnership units—Edgen/Murray, L.P. $1,000 par value per unit, 50,542.14 units outstanding with accrued dividends of $2,310 at June 30, 2006. No units issued and outstanding on a pro forma and pro forma as adjusted basis | | | 52,852 | | | | | |
| | Unearned stock-based compensation | | | (2,414 | ) | | | | |
| | Accumulated comprehensive income | | | 838 | | | | | |
| |
Edgen Murray Plc |
|
|
|
|
|
|
|
|
| | Ordinary shares, $ nominal value per share. shares are authorized and shares are assumed to be issued and outstanding on a pro forma and pro forma as adjusted basis | | | — | | | | | |
| | Preference shares $ nominal value per share. shares are authorized and shares are assumed to be issued and outstanding on a pro forma and pro forma as adjusted basis | | | — | | | | | |
| | |
|
| | | Total partners' capital and shareholders' equity | | | 83,982 | | | | | |
| | |
|
| Total capitalization | | $ | 370,734 | | $ | | | $ |
|
28
- (1)
- A $1.00 increase (decrease) in the assumed initial public offering price of $ per ADS (the midpoint of the range on the cover page of this prospectus) would increase (decrease) each of cash and cash equivalents, paid-in capital, total shareholders' equity and total capitalization by $ million, assuming the number of ADSs offered by us, as set forth on the cover page of this prospectus, remains the same and after deducting the estimated underwriters' discount and commissions and estimated fees and expenses of this offering.
- (2)
- The Edgen Credit Facility provides for borrowings of up to $20.0 million, of which we had $1.8 million outstanding at June 30, 2006. We expect this facility to remain in place following this offering. The PAL Working Capital Facility provides for borrowings of up to UK£12.0 million (approximately $21.3 million at June 30, 2006). At June 30, 2006, we had no borrowings under the PAL Working Capital Facility. See "Management's discussion and analysis of financial condition and results of operation—Liquidity and capital resources—Debt" for a discussion of the Edgen Credit Facility and PAL Working Capital Facility. We expect to enter into a new $125.0 million revolving credit facility for our international operations to replace the PAL Working Capital Facility concurrently with the closing of this offering.
- (3)
- Retained earnings included in common partnership units on a pro forma as adjusted basis has been reduced by the loss (gain) on the repayment of the PAL Floating Rate Notes of $ , (net of tax of $ ) and the write-down of related debt issue costs of $ million (net of tax of $ ).
29
Dilution
If you invest in our ADSs, your interest will be diluted immediately to the extent of the difference between the initial public offering price per ADS and the net tangible book value per ADS immediately after this offering.
As of , 2006, giving effect to the Contribution, our net tangible book value was approximately $ per ADS based on ordinary shares outstanding. Net tangible book value per share represents the total tangible assets less total liabilities divided by the number of ordinary shares outstanding as of , 2006. After giving effect to the sale of ADSs representing ordinary shares in this offering and the receipt of gross proceeds of $ million, assuming an initial public offering price of $ , which is the midpoint of the range on the cover page of this prospectus, and after deducting the underwriters' discount and commissions and estimated fees and expenses of this offering, our as adjusted net tangible book value as of , 2006 would have been $ million, or $ per ADS. This represents an immediate increase in net tangible book value of $ per share to existing shareholders and an immediate dilution of $ per ADS to new investors purchasing our ADSs in this offering, in each case based on the assumed initial public offering price. The following table illustrates this dilution:
|
| | Per ADS
|
|---|
|
| Assumed initial public offering price | | $ | |
| | Net tangible book value as of , 2006 | | $ | |
| | Increase in net tangible book value attributable to this offering | | $ | |
| As adjusted net tangible book value after this offering | | $ | |
| | |
|
| Dilution to new investors in this offering | | $ | |
|
The following table shows, on an as adjusted basis as of , 2006, after giving effect to the adjustments referred to above, the differences in the number of ordinary shares purchased from us, the total cash consideration paid and the average price per ADS paid by our existing shareholders (which is based upon the prices paid for our ordinary shares on an ADS equivalent basis) and by new investors (assuming an initial public offering price per share of $ per ADS, which is the midpoint of the range on the cover page of this prospectus).
|
| | Ordinary shares purchased
| | Total consideration
| |
|
|---|
| | Average price per ADS
|
|---|
(dollars in millions)
| | Number
| | Percent
| | Amount
| | Percent
|
|---|
|
|---|
| Existing shareholders | | | | % | | | | % | | $ |
| New investors | | | | % | | | | % | | |
| | |
|
| Total | | | | 100% | | | | 100% | | |
|
If the underwriters exercise their over-allotment option in full, the following will occur:
- •
- the as adjusted percentage of our ordinary shares held by existing shareholders will decrease to approximately % of the total number of as adjusted ordinary shares outstanding after this offering; and
- •
- the as adjusted number of our ordinary shares (in the form of ADSs) held by new investors will increase to , or approximately % of the total as adjusted number of ordinary shares outstanding after this offering.
30
Selected historical consolidated financial data of
Edgen/Murray, L.P.
On February 1, 2005, Edgen Acquisition Corp., a corporation newly formed by Edgen's shareholders, purchased all of the outstanding capital stock of Edgen from its existing shareholders. Concurrently with the aquisition and the related financing transactions, Edgen Acquisition Corp. was merged with and into Edgen, which survived the merger.
References to the "Successor" in respect of the periods prior to the formation of Edgen/Murray, L.P. are references to Edgen and its subsidiaries and for periods after its formation are to Edgen/Murray, L.P. and its subsidiaries. References to the "Predecessor" in periods prior to the formation of Edgen Acquisition Corp., and the acquisition of Edgen by Edgen Acquisition Corp., are to Edgen prior to the change in control on February 1, 2005.
The historical financial statements of Edgen/Murray, L.P. include the assets and liabilities acquired from Western Flow Products Inc. by Edgen on July 16, 2005 (the "Western Flow Acquisition") and the MIM Acquisition on December 16, 2005, and the results of their operations and cash flows from each respective acquisition date.
We have derived (i) our selected statement of operations, cash flow and other financial data for the period February 1, 2005 to December 31, 2005 (Successor), the period January 1, 2005 to January 31, 2005 (Predecessor) and the years ended December 31, 2004 and 2003 (Predecessor) and our selected balance sheet data as of December 31, 2005 (Successor) and December 31, 2004 (Predecessor) from our audited consolidated financial statements included elsewhere in this prospectus and (ii) our selected statement of operations, cash flow and other financial data for the six months ended June 30, 2006 (Successor), the period February 1, 2005 to June 30, 2005 (Successor), and January 1, 2005 to January 31, 2005 (Predecessor) and our selected balance sheet data as of June 30, 2006 (Successor) from our unaudited condensed consolidated financial statements included elsewhere in this prospectus. We have derived our selected statement of operations, cash flow and other financial data for the years ended December 31, 2002 and 2001 (Predecessor) and our selected balance sheet data as of December 31, 2003, 2002 and 2001 (Predecessor) from our audited consolidated financial statements not included in this prospectus.
Historical results presented below are not necessarily indicative of results of future operations, and the results for any interim period are not necessarily indicative of the results that may be expected for a full year. The selected financial data presented below should be read in conjunction with, and is qualified in its entirety by reference to "Management's discussion and analysis of financial condition and results of operations" and our audited consolidated financial statements and the related notes thereto, our unaudited condensed consolidated financial statements and the related notes thereto contained elsewhere in this prospectus.
The following tables set forth, for the periods and dates indicated, our selected historical consolidated financial data.
31
| |
| |
| |
| | Predecessor(1)
| | Successor
| | Predecessor(1)
| |
|---|
| | Successor
| |
|---|
| | Period
January 1,
2005 to
January 31,
2005
| | Period
February 1,
2005 to
December 31,
2005
| | Period
January 1,
2005 to
January 31,
2005
| | Year ended December 31,
| |
|---|
| | Six months
ended
June 30,
2006
| | Period
February 1,
2005 to June 30,
2005
| |
|---|
(dollars in thousands)
| | 2004
| | 2003
| | 2002
| | 2001
| |
|---|
| |
| Statement of operations: | | | | | | | | | | | | | | | | | | | | | | | | | | | | |
| Sales | | $ | 340,020 | | $ | 120,288 | | $ | 18,945 | | $ | 282,925 | | $ | 18,945 | | $ | 207,821 | | $ | 147,025 | | $ | 212,312 | | $ | 173,044 | |
Operating expenses: |
|
|
|
|
|
|
|
|
|
|
|
|
|
|
|
|
|
|
|
|
|
|
|
|
|
|
|
|
| | Cost of sales (exclusive of depreciation and amortization shown separately below) | | | 274,653 | | | 93,627 | | | 14,153 | | | 226,236 | | | 14,153 | | | 155,357 | | | 121,146 | | | 168,368 | | | 133,099 | |
| | Selling, general and administrative expense(2) | | | 26,322 | | | 13,035 | | | 14,364 | | | 28,960 | | | 14,364 | | | 32,009 | | | 29,595 | | | 27,651 | | | 24,024 | |
| | Depreciation and amortization expense | | | 12,412 | | | 1,087 | | | 201 | | | 6,226 | | | 201 | | | 2,400 | | | 2,001 | | | 1,672 | | | 2,760 | |
| | |
| |
| | Total operating expenses | | | 313,387 | | | 107,749 | | | 28,718 | | | 261,422 | | | 28,718 | | | 189,766 | | | 152,742 | | | 197,691 | | | 159,883 | |
| | |
| |
| Income (loss) from operations | | | 26,633 | | | 12,539 | | | (9,773 | ) | | 21,503 | | | (9,773 | ) | | 18,055 | | | (5,717 | ) | | 14,621 | | | 13,161 | |
Other income (expense)(3) |
|
|
5,906 |
|
|
75 |
|
|
(50 |
) |
|
(307 |
) |
|
(50 |
) |
|
106 |
|
|
174 |
|
|
54 |
|
|
110 |
|
| Interest expense, net | | | (17,169 | ) | | (4,958 | ) | | (333 | ) | | (12,139 | ) | | (333 | ) | | (5,163 | ) | | (3,122 | ) | | (3,102 | ) | | (5,190 | ) |
| | |
| |
| Income (loss) before income tax expense (benefit) | | | 15,370 | | | 7,656 | | | (10,156 | ) | | 9,057 | | | (10,156 | ) | | 12,998 | | | (8,665 | ) | | 11,573 | | | 8,081 | |
| Income tax expense (benefit) | | | 5,304 | | | 2,748 | | | (1,916 | ) | | 3,055 | | | (1,916 | ) | | (3,211 | ) | | (4,195 | ) | | 1,385 | | | 3,254 | |
| | |
| |
| Income (loss) from continuing operations | | | 10,066 | | | 4,908 | | | (8,240 | ) | | 6,002 | | | (8,240 | ) | | 16,209 | | | (4,470 | ) | | 10,188 | | | 4,827 | |
Discontinued operations: |
|
|
|
|
|
|
|
|
|
|
|
|
|
|
|
|
|
|
|
|
|
|
|
|
|
|
|
|
| | Loss from discontinued operations before income tax (benefit) | | | — | | | — | | | — | | | — | | | — | | | — | | | (348 | ) | | (4,469 | ) | | (3,807 | ) |
| Income tax (benefit) | | | — | | | — | | | — | | | — | | | — | | | — | | | (159 | ) | | (1,760 | ) | | (1,523 | ) |
| | |
| |
| Income (loss) before cumulative effect of change in account principle | | | 10,066 | | | 4,908 | | | (8,240 | ) | | 6,002 | | | (8,240 | ) | | 16,209 | | | (4,659 | ) | | 7,479 | | | 2,543 | |
| Cumulative effect of change in account principle(4) | | | — | | | — | | | — | | | — | | | — | | | — | | | — | | | (39,414 | ) | | — | |
| | |
| |
| Net income (loss) | | | 10,066 | | | 4,908 | | | (8,240 | ) | | 6,002 | | | (8,240 | ) | | 16,209 | | | (4,659 | ) | | (31,935 | ) | | 2,543 | |
| Preferred interest and dividend requirement | | | (2,134 | ) | | (765 | ) | | (190 | ) | | (1,798 | ) | | (190 | ) | | (2,206 | ) | | (2,212 | ) | | (2,236 | ) | | (2,236 | ) |
| | |
| |
| |
Net income (loss) applicable to common unitholders/shareholders |
|
$ |
7,932 |
|
$ |
4,143 |
|
$ |
(8,430 |
) |
$ |
4,204 |
|
$ |
(8,430 |
) |
$ |
14,003 |
|
$ |
(6,871 |
) |
$ |
(34,171 |
) |
$ |
307 |
|
| |
Net income (loss) applicable to common unitholders/shareholders:(5) |
|
|
|
|
|
|
|
|
|
|
|
|
|
|
|
|
|
|
|
|
|
|
|
|
|
|
|
|
| | Basic | | | | | | | | | | | | | | | | | | | | | | | | | | | | |
| | | Income (loss) from continuing operations | | $ | 1.38 | | $ | 1.54 | | $ | (1.99 | ) | $ | 1.49 | | $ | (1.99 | ) | $ | 3.21 | | $ | (1.40 | ) | $ | 1.66 | | $ | 0.54 | |
| | | Income (loss) from discontinued operations | | | — | | | — | | | — | | | — | | | — | | | — | | | (0.04 | ) | | (0.57 | ) | | (0.48 | ) |
| | | Income (loss) from cumulative effect of change in accounting principle | | | — | | | — | | | — | | | — | | | — | | | — | | | — | | | (8.24 | ) | | — | |
| |
| | | Basic earnings per unit/share | | $ | 1.38 | | $ | 1.54 | | $ | (1.99 | ) | $ | 1.49 | | $ | (1.99 | ) | $ | 3.21 | | $ | (1.44 | ) | $ | (7.14 | ) | $ | 0.06 | |
| |
| | Diluted | | | | | | | | | | | | | | | | | | | | | | | | | | | | |
| | | Income (loss) from continuing operations | | $ | 1.38 | | $ | 1.54 | | $ | (1.99 | ) | $ | 1.49 | | $ | (1.99 | ) | $ | 3.20 | | $ | (1.40 | ) | $ | 1.66 | | $ | 0.54 | |
| | | Income (loss) from discontinued operations | | | — | | | — | | | — | | | — | | | — | | | — | | | (0.04 | ) | | (0.57 | ) | | (0.48 | ) |
| | | Income (loss) from cumulative effect of change in accounting principle | | | — | | | — | | | — | | | — | | | — | | | — | | | — | | | (8.24 | ) | | — | |
| |
| | | Diluted earnings per unit/share | | $ | 1.38 | | $ | 1.54 | | $ | (1.99 | ) | $ | 1.49 | | $ | (1.99 | ) | $ | 3.20 | | $ | (1.44 | ) | $ | (7.14 | ) | $ | 0.06 | |
| |
Weighted average common units/shares: |
|
|
|
|
|
|
|
|
|
|
|
|
|
|
|
|
|
|
|
|
|
|
|
|
|
|
|
|
| | Basic | | | 5,762,022 | | | 2,681,564 | | | 4,243,092 | | | 2,821,840 | | | 4,243,092 | | | 4,367,999 | | | 4,782,596 | | | 4,783,392 | | | 4,779,255 | |
| |
| | Diluted | | | 5,762,022 | | | 2,681,564 | | | 4,243,092 | | | 2,821,840 | | | 4,243,092 | | | 4,371,695 | | | 4,782,596 | | | 4,783,392 | | | 4,779,255 | |
| |
32
|
| | Successor
| | Predecessor
|
|---|
| | As of
June 30,
| | As of
December 31,
| | As of December 31,
|
|---|
(dollars in thousands)
| | 2006
| | 2005
| | 2004
| | 2003
| | 2002
| | 2001
|
|---|
|
| Balance sheet data: | | | | | | | | | | | | | | | | | | |
| Cash and cash equivalents | | $ | 24,259 | | $ | 41,146 | | $ | 134 | | $ | 3,125 | | $ | — | | $ | 583 |
| Working capital | | | 172,548 | | | 153,187 | | | 60,868 | | | 53,633 | | | 22,196 | | | 62,460 |
| Net property, plant, and equipment | | | 41,072 | | | 40,940 | | | 10,423 | | | 11,668 | | | 11,065 | | | 10,417 |
| Total assets | | | 518,136 | | | 520,221 | | | 118,862 | | | 105,560 | | | 121,650 | | | 148,718 |
| Long-term debt and capital leases | | | 286,752 | | | 286,688 | | | 47,883 | | | 50,973 | | | 65,206 | | | 57,170 |
| Mandatorily redeemable preferred stock(6) | | | — | | | — | | | 55,979 | | | 53,918 | | | 52,253 | | | 46,017 |
| Preferred units included in total partners' capital(7) | | | 52,852 | | | 50,718 | | | — | | | — | | | — | | | — |
| Total partners' capital and shareholder equity (deficit) | | | 83,982 | | | 71,812 | | | (11,755 | ) | | (25,533 | ) | | (18,523 | ) | | 15,648 |
|
- (1)
- Periods prior to February 1, 2005 represent the Predecessor prior to the consummation of the Buy-out Transaction, and our historical consolidated financial data for such periods do not give effect to the Buy-out Transaction. See "Management's discussion and analysis of financial condition and results of operations—Predecessor and Successor."
- (2)
- Selling, general and administrative expense for the period January 1, 2005 to January 31, 2005 includes $12.0 million in Buy-out Transaction related expenses and the period February 1, 2005 to December 31, 2005 includes approximately $5.5 million (£3.1 million) in bonus payments and applicable payroll taxes to certain MIM Ltd. employees prior to the MIM Acquisition.
- (3)
- Other (income) expense for the six months ended June 30, 2006 includes a $6.1 million foreign exchange gain on the PAL Floating Rate Notes denominated in US dollars.
- (4)
- The cumulative effect of change in accounting principle for the year ended December 31, 2002 relates to our adoption of the provisions of the Financial Accounting Standards Board's Statement of Financial Accounting Standards No. 142,Goodwill and Other Intangible Assets, which resulted in a reduction in the carrying value of goodwill.
- (5)
- The per share data in this table represents Edgen/Murray, L.P.'s performance on a historic basis and does not reflect the effects of the Contribution or this offering.
- (6)
- Mandatorily redeemable preferred stock was replaced by redeemable preferred stock on February 1, 2005 in connection with the Buy-out Transaction.
- (7)
- In connection with the formation of Edgen/Murray, L.P. in 2005, preferred partnership units were issued to existing Edgen shareholders and certain members of MIM Ltd. management. See "Management discussion and analysis of financial condition and results of operations—Formation of holding company and acquisitions."
33
Unaudited pro forma condensed combined
financial statements
The following unaudited pro forma condensed combined financial statements are presented to illustrate the estimated effects of the following transactions on our historical financial position and results of operations:
- •
- the Buy-out Transaction and related financing, including the issuance of $105.0 million aggregate principal amount of Edgen Senior Secured Notes and preferred shares of Edgen and borrowings under the Edgen Credit Facility;
- •
- the Western Flow Acquisition; and
- •
- the MIM Acquisition and related transactions, including issuance of $130.0 million aggregate principal amount of PAL Floating Rate Notes, an additional $31.0 million aggregate principal amount of Edgen Senior Secured Notes, the issuance of preferred partnership units of Edgen/Murray, L.P., and rental expense and depreciation expense associated with the sale and leaseback of the Newbridge, Scotland facility.
We have derived our historical condensed consolidated statement of operations data for the period February 1, 2005 to December 31, 2005 (Successor), and the period January 1, 2005 to January 31, 2005 (Predecessor) from our audited consolidated financial statements included elsewhere in this prospectus.
We have derived the MIM Ltd. historical consolidated statement of operations data for the period February 1, 2005 to December 16, 2005 from the audited financial statements prepared in accordance with UK GAAP which are not included elsewhere in this prospectus. The financial data from the historical consolidated financial statements have been converted to US GAAP with the application of US GAAP reconciling items, and amounts have been converted from UK pounds to US dollars.
We have derived the Western Flow historical statement of operations data for the period January 1, 2005 to July 15, 2005 from the unaudited financial statements prepared in accordance with US GAAP but not included elsewhere in this prospectus.
The unaudited pro forma condensed combined statements of operations for the year ended December 31, 2005 assume that the transactions described above took place on January 1, 2005, the beginning of our 2005 fiscal year. The information presented in the unaudited pro forma condensed combined financial statements is not necessarily indicative of our financial position or results of operations that would have occurred if the transactions described above had been consummated as of the dates indicated, nor should it be construed as being a representation of our future financial position or results of operations.
The pro forma adjustments are based upon currently available information and certain assumptions that we believe are reasonable under the circumstances as a result, this preliminary allocation may change. The acquisitions of Western Flow, MIM Ltd. and MIM US are accounted for using the purchase method of accounting and the resulting assets acquired and liabilities assumed have been reflected at their estimated fair market values at the date of acquisition. These adjustments are more fully described in the notes to the unaudited pro forma condensed combined financial statements below.
The unaudited pro forma statement of operations does not give effect to this assumed initial public offering and the use of proceeds including the repayment of the PAL Floating Rate Notes and the redemption of preference shares.
The pro forma condensed combined financial statements should be read in conjunction with, and are qualified in their entirety by reference to, the sections entitled "Selected historical consolidated financial data of Edgen/Murray, L.P.," "Management's discussion and analysis of financial condition and results of operations" and with our audited consolidated financial statements and the related notes thereto and the unaudited condensed consolidated financial statements and the related notes thereto contained elsewhere in this prospectus.
34
| |
| | Historical
| |
| |
| |
|---|
| | Successor
| | Predecessor
| |
| |
| |
| |
| |
|---|
(dollars in thousands)
| | Period
February 1,
2005 to
December 31,
2005
| | Period
January 1,
2005 to
January 31,
2005
| | Western
Flow
Products, Inc.
| | Murray
International
Metals, Ltd.
| | Pro forma adjustments
for acquisitions
and related debt
financing
| | Pro forma
for acquisitions and related debt financing year ended December 31,
2005
| |
|---|
| |
|---|
| Statement of operations: | | | | | | | | | | | | | | | | | | | |
| Sales | | $ | 282,925 | | $ | 18,945 | | $ | 3,061 | | $ | 295,510 | | $ | — | | $ | 600,441 | |
| Operating expenses: | | | | | | | | | | | | | | | | | | | |
| | Cost of sales (exclusive of depreciation and amortization shown separately below) | | | 226,236 | | | 14,153 | | | 1,947 | | | 239,799 | | | 162 | (1) | | 482,297 | |
| | Selling, general and administrative expense | | | 28,960 | | | 14,364 | | | 367 | | | 20,640 | | | (150 | )(2) | | 64,181 | |
| | Depreciation and amortization expense | | | 6,226 | | | 201 | | | 8 | | | 708 | | | 15,505 | (3) | | 22,648 | |
| | |
| |
| |
| |
| |
| |
| |
| | Total operating expenses | | | 261,422 | | | 28,718 | | | 2,322 | | | 261,147 | | | 15,517 | | | 569,126 | |
| | |
| |
| Income (loss) from operations | | | 21,503 | | | (9,773 | ) | | 739 | | | 34,363 | | | (15,517 | ) | | 31,315 | |
| Other income (expense) | | | (307 | ) | | (50 | ) | | — | | | 105 | | | — | | | (252 | ) |
| Interest income (expense), net | | | (12,139 | ) | | (333 | ) | | 4 | | | (2,962 | ) | | (18,348 | )(4) | | (33,778 | ) |
| | |
| |
| Income (loss) from continuing operations before income tax expense (benefit) | | | 9,057 | | | (10,156 | ) | | 743 | | | 31,506 | | | (33,865 | ) | | (2,715 | ) |
| Income tax expense (benefit) | | | 3,055 | | | (1,916 | ) | | 227 | | | 8,626 | | | (10,159 | )(5) | | (167 | ) |
| | |
| |
| Income (loss) before minority interest | | | 6,002 | | | (8,240 | ) | | 516 | | | 22,880 | | | (23,706 | ) | | (2,548 | ) |
| Minority interest | | | — | | | — | | | — | | | (642 | ) | | 642 | (6) | | — | |
| | |
| |
| Net income (loss) | | | 6,002 | | | (8,240 | ) | | 516 | | | 22,238 | | | (23,064 | ) | | (2,548 | ) |
| Preferred interest and dividend requirement | | | (1,798 | ) | | (190 | ) | | — | | | — | | | (2,536 | )(7) | | (4,524 | ) |
| | |
| |
| |
| |
| |
| |
| |
| Net income (loss) applicable to common unitholders/shareholders | | $ | 4,204 | | $ | (8,430 | ) | $ | 516 | | $ | 22,238 | | $ | (25,600 | ) | $ | (7,072 | ) |
| | |
| |
| |
- (1)
- Represents the impact of additional costs of sales related to the increase in value of inventory at the acquisition date of Edgen and MIM Ltd. so as to state inventory at fair value.
- (2)
- Reflects the elimination of certain annual management and directors fees paid prior to the Buy-out Transaction on February 1, 2005.
- (3)
- The adjustment to depreciation and amortization expense consists of the following:
|
| |
|
|---|
| Additional depreciation expense(a) | | $ | 831 |
| Additional amortization expense(b) | | | 14,674 |
| | |
|
| | | $ | 15,505 |
|
(a) Represents additional depreciation expense related to (i) the increase in property, plant and equipment as a result of the allocation of a portion of the Edgen purchase price in excess of the net book value to the assets acquired in the Buy-out Transaction so as to state the assets at fair value, and (ii) the incremental depreciation expense related to the sale and leaseback of MIM Ltd.'s Newbridge, Scotland facility.
(b) Represents additional amortization expense associated with the amortization of other intangible assets acquired in the Buy-out Transaction and the MIM Acquisition which are being amortized over seven to ten years, except for backlog which is amortized over a nine month period. Therefore, the $5.9 million backlog intangible was fully amortized in the pro forma period presented. Amortization expense associated with these other intangible assets is not deductible for US or UK income tax purposes.
35
- (4)
- Represents the adjustments to interest expense as follows:
| |
| |
| |
|---|
| Elimination of historical interest expense(a) | | $ | (15,385 | ) |
| Interest on the initial Edgen Senior Secured Notes(b) | | | 13,430 | |
| Interest on the PAL Floating Rate Notes(c) | | | 14,196 | |
| Interest on the Edgen Credit Facility(d) | | | 106 | |
| Interest expense on sale and leaseback of Newbridge facility(e) | | | 1,651 | |
| Accretion of original discount on the additional Edgen Senior Secured Notes(f) | | | 233 | |
| Accretion of original discount on the PAL Floating Rate Notes(g) | | | 260 | |
| Amortization of debt issue costs(h) | | | 3,857 | |
| | |
| |
| Total | | $ | 18,348 | |
| |
(a) Reflects the elimination of historical interest expense on debt settled in connection with the Buy-out Transaction and debt not assumed in the Western Flow Acquisition and MIM Acquisition.
(b) Represents interest expense relating to the Edgen Senior Secured Notes which includes $105.0 million aggregate principal amount issued in connection with the Buy-out Transaction in February 2005 and $31.0 million aggregate principal amount issued to fund the MIM US Acquisition in December 2005.
(c) Represents interest expense relating to the PAL Floating Rate Notes. Interest expense has been calculated based on assumed borrowings of $130.0 million converted at an assumed exchange rate of UK£1.00=$1.77 and at an assumed interest rate of approximately 10.92%, which is based on LIBOR of 4.67% (representing the six month LIBOR at December 16, 2005) plus 625 basis points over the term of the notes using the effective interest rate method. Each one-eighth percent change in the interest rate would not have a material change in the assumed pro forma interest expense.
(d) For purposes of calculating interest on the Edgen Credit Facility, LIBOR is assumed to be 2.5% for the period January 1, 2005 to January 31, 2005 resulting in an interest rate of approximately 4.0% and assumes $2.2 million borrowings under our revolving credit facilities. Each one-eighth percent change in the interest rate would not have a material change in the assumed pro forma interest expense.
(e) Reflects interest expense related to the sale and leaseback of the Newbridge, Scotland facility with an implicit interest rate of 9.16%.
(f) The amortization of the original discount of $1.4 million using the effective interest method over the term of the Edgen Senior Secured Notes in the aggregate principal amount of $31.0 million (six years) issued in connection with the MIM US Acquisition.
(g) The amortization of the original discount of $1.3 million using the effective interest method over the term of the PAL Floating Rate Notes (five years).
(h) The amortization of debt issue costs of $11.1 million using the effective interest method over the term of the PAL Floating Rate Notes (five years) and debt issue costs of $9.8 million over the term of the Edgen Senior Secured Notes (six years).
- (5)
- Reflects the tax effect of the pro forma adjustments at a statutory rate of 30% in the United Kingdom.
- (6)
- Adjustment to eliminate the allocation of income to the minority interest as the minority interest was acquired in connection with the MIM Acquisition on December 16, 2005.
- (7)
- The adjustment to preferred interest and dividend requirement consists of the following:
| |
| |
| |
|---|
| Elimination of dividends(a) | | $ | 190 | |
| Accrued but unpaid dividends(b) | | | (150 | ) |
| Difference in accrued interest(c) | | | (2,576 | ) |
| | |
| |
| | | $ | (2,536 | ) |
| |
(a) Reflects the elimination of dividends on Edgen's mandatorily redeemable preferred stock, which was retired in connection with the Buy-out Transaction on February 1, 2005.
(b) Represents accrued but unpaid dividends on Edgen's 8.5% cumulative compounding preferred stock issued to our shareholders in connection with the Buy-out Transaction on February 1, 2005 through December 15, 2005.
(c) Represents the incremental difference in accrued preferred interest at 8.5% per annum on preferred units exchanged and issued in connection with the formation of Edgen/Murray, L.P.
36
Management's discussion and analysis of financial condition and results of operations
The following Management's discussion and analysis of financial condition and results of operations contains forward-looking statements that involve risks and uncertainties. Our actual results could differ materially from those anticipated in these forward looking statements as a result of certain factors, including those set forth under the heading "Special note regarding forward-looking statements" above and "Risk factors." Unless otherwise provided below, references to "we," "us" and "our" refer to Edgen Murray Plc and its subsidiaries, after giving effect to the Contribution. The following discussion should be read in conjunction with our consolidated financial statements and related notes thereto and our condensed consolidated financial statements and related notes thereto included elsewhere in this prospectus.
General
Background
We are a leading global distributor and marketer of high performance steel products for use primarily in specialized applications in the energy infrastructure market. The products we sell are generally highly engineered prime carbon or alloy steel pipe, pipe components and high grade structural sections and plates, which are designed to withstand the effects of corrosive or abrasive materials and possess performance characteristics required in extreme operating conditions, including high pressure and high/low temperature environments.
We distribute and market products and provide comprehensive procurement and project management solutions for our customers on projects spanning the complete lifecycle of the global energy infrastructure market, including exploration and production, new rig construction, gathering and transmission, refining and processing, power generation, petrochemical and maintenance, repair and operations (MRO). Our global sales and distribution network enables us to efficiently procure and deliver these high performance products worldwide to customers who may not have the relationships, resources or logistical support or who may not be willing or able to purchase in sufficient volume or on a cost effective basis to complete procurement independently for their projects. Our customers are principally end-users that operate in or service the energy infrastructure industry and providers of MRO products.
Principal factors that affect our business
Our business is substantially dependent upon conditions in the energy industry and, in particular, capital expenditures by customers in the oil and gas exploration and production, gathering and transmission, crude oil refining and the energy processing and power generation industries. The level of energy-related capital expenditures generally depends on prevailing views of future oil, natural gas, refined products, electric power and petrochemical prices, which are influenced by numerous factors, including but not limited to:
- •
- changes in US and international economic conditions;
- •
- demand for oil, natural gas, refined products, petrochemicals and electric power, particularly in the developed OECD markets and rapidly developing markets such as China and India;
- •
- worldwide political conditions, particularly in significant oil-producing regions such as the Middle East, West Africa and Latin America;
- •
- actions taken by OPEC;
- •
- the availability and discovery rate of new oil and natural gas reserves in offshore areas;
37
- •
- the cost of offshore exploration for, and production and transportation of, oil and natural gas;
- •
- the ability of oil and natural gas companies to generate funds or otherwise obtain external capital for exploration, development and production operations;
- •
- technological advances affecting energy exploration, production, transportation, storage and refining;
- •
- the availability of offshore drilling rigs for exploration, appraisal and developmental drilling;
- •
- the availability of infrastructure to efficiently transport natural gas from remote regions to points of consumption;
- •
- the existence of capacity to process or upgrade heavy and sour grades of crude oil and bitumen;
- •
- increases in power generation capacity in the US and international markets;
- •
- weather conditions;
- •
- environmental or other government regulations; and
- •
- tax policies.
Fluctuations in the costs of the products we supply are largely driven by changes in the condition of the general economy, changes in product inventories held by our customers, our vendors and other distributors and prevailing steel prices around the world. We have historically managed to successfully defend our profit margins by adjusting the prices we charge our customers to reflect variances in the cost of our products.
Formation
Edgen was formed on November 30, 2000. On February 1, 2005, Edgen Acquisition Corp. a corporation newly formed by JCP and certain members of Edgen management, purchased all of the outstanding capital stock of Edgen from its existing shareholders. The Buy-out Transaction was funded with proceeds to Edgen Acquisition Corp. from the issuance and sale of the Edgen Senior Secured Notes of $105.0 million and from an equity investment from funds managed by JCP and certain members of Edgen management. Simultaneous with the Buy-out Transaction and the related financing transactions, Edgen Acquisition Corp. was merged with and into Edgen, with Edgen surviving the merger.
In December, 2005, Edgen's shareholders organized a new holding company, Edgen/Murray, L.P., to hold all of the outstanding equity interests of Edgen and a newly created holding company in the United Kingdom, PAL. On December 16, 2005, Edgen/Murray, L.P. through its subsidiaries acquired MIM Ltd. and its subsidiaries.
MIM Ltd. and its subsidiary Murray International Metals Pte. Limited ("MIM Singapore") were acquired through PAL (the "MIM UK Acquisition"). MIM Ltd.'s wholly owned subsidiary, Murray International Metals, Inc. ("MIM US") was acquired through Edgen Carbon (the "MIM US Acquisition"). The MIM UK Acquisition and the MIM US Acquisition are collectively referred to as the "MIM Acquisition." The aggregate purchase price in the MIM Acquisition was approximately $204.0 million (including $23.0 million of assumed debt reflecting the capital treatment of related sale and leaseback of certain facilities under US GAAP).
References to the "Successor" in respect of the periods prior to the formation of Edgen/Murray, L.P. are references to Edgen and its subsidiaries and for periods after formation are references to Edgen/Murray, L.P. and its subsidiaries. References to the "Predecessor" in respect of the periods prior to the formation of Edgen Acquisition Corp. and the acquisition of Edgen by Edgen Acquisition Corp. are references to Edgen prior to the change in control on February 1, 2005. Edgen/Murray, L.P. is
38
controlled by funds managed by JCP. The MIM Acquisition was funded through equity contributions by existing and new limited partners of Edgen/Murray, L.P. and the proceeds from the issuance of the PAL Floating Rate Notes and an additional $31.0 million in aggregate principal amount of Edgen Senior Secured Notes.
Factors affecting comparability of financial information
During 2005, the presentation of the results of our operations and cash flows were impacted by significant transactions including the Buy-out Transaction on February 1, 2005, and the MIM Acquisition and MIM US Acquisition on December 16, 2005.
Fair value accounting—predecessor and successor
As a result of the Buy-out Transaction on February 1, 2005, we have applied purchase accounting in accordance with Statement of Financial Accounting Standards ("SFAS") No. 141,Business Combinations, due to a change in control which required us to record the acquired assets and liabilities at their respective fair values as of the acquisition date while periods prior to February 1, 2005 are presented at historical values at the date of each respective transaction.
Non-GAAP presentation
In evaluating our results of operations and financial performance, our management has used non-GAAP combined operating results and cash flow results for the twelve months ended December 31, 2004 and the six months ended June 30, 2005 each as a single measurement period when compared to the year ended December 31, 2005 and the six months ended June 30, 2006, respectively. The combined presentation for the twelve month period ended December 31, 2005 represents the mathematical addition of the results of operations of the Predecessor for the period from January 1, 2005 to January 31, 2005, and the Successor for the period from February 1, 2005 to December 31, 2005. The combined presentation for the six months ended June 30, 2005 represents the mathematical addition of the results of operations of the Predecessor for the period from January 1, 2005 to January 31, 2005, and the results of operations of the Successor for the period February 1, 2005 to June 30, 2005.
We believe the non-GAAP combined presentation provides relevant information for investors. These combined results, however, are not intended to represent what our operating results would have been had the Buy-out Transaction occurred at the beginning of the period. A reconciliation showing the mathematical combination of our operating results for such periods is included below under "—Results of operations."
Acquisition of MIM Ltd. and its subsidiaries
With the MIM Acquisition on December 16, 2005, our overall consolidated financial results for the six months ended June 30, 2006 and the twelve months ended December 31, 2005 were significantly impacted and, as a result, there is limited comparability to prior periods.
Difference in subsidiary fiscal year
Effective September 30, 2006, PAL and its subsidiaries changed their fiscal year end to December 31. Prior to that date, PAL and its subsidiaries had a fiscal year ending January 31 which differed from our fiscal year ending of December 31. As a result, our consolidated balance sheet as of December 31, 2005 includes the consolidated balance sheet of PAL and its subsidiaries as of January 31, 2006 and our consolidated statement of operations, statement of partners' capital and shareholders' equity, and statement of cash flows for the period February 1, 2005 to December 31, 2005 includes fifteen days of operating results of PAL and its subsidiaries reflecting the fifteen day period Edgen/Murray, L.P. owned MIM Ltd. Due to the difference in fiscal year end periods, the financial results included in our
39
consolidated financial statements reflects the consolidated financial results of PAL for the period January 17, 2006 to January 31, 2006, the most comparable period. As a result, net income of PAL for the period December 17, 2005 to January 16, 2006 has been recorded as a direct charge to the consolidated statement of partners' capital and shareholders' equity (deficit).
Our condensed consolidated balance sheet as of June 30, 2006 includes the consolidated balance sheet of PAL and its subsidiaries as of July 31, 2006. Our condensed consolidated statement of operations, statement of partners' capital and statement of cash flows for the six months ended June 30, 2006 include the consolidated financial results of PAL and its subsidiaries for the six months ended July 31, 2006.
Operating segments
We currently manage our operations in five segments: the Americas—Carbon, Americas—Alloy, UK, Singapore and the UAE. These five reporting segments represent four geographic markets—the Americas, Europe/West Africa, Asia/Pacific and the Middle East. The Americas—Alloy and Americas—Carbon segments are headquartered in Baton Rouge, Louisiana and market products to customers in the United States, Canada and Latin America. The UK segment, headquartered in Newbridge, Scotland, markets products to customers in Europe, the Caspian Sea region and West Africa. The Singapore segment, headquartered in Singapore and supported by a sales office in Perth, Australia, markets products to customers in the Asia/Pacific region. The UAE segment, headquartered in Dubai, United Arab Emirates, markets products to customers located in the Middle East region and South Asia. For purposes of this analysis, we refer to our UK segment as UK (Europe/West Africa), we refer to our Singapore segment as Singapore (Asia/Pacific) and we refer to our UAE segment as UAE (Middle East).
Effects of currency fluctuations
As of and for the six months ended June 30, 2006 and as of and for the combined twelve months ended December 31, 2005, approximately 23.9% and 20.4%, respectively, of our revenues and approximately 3.6% and 20.6% of our long-term assets were denominated in UK pounds, our functional currency in the United Kingdom. As a result, a material change in the value of the UK pound relative to the US dollar could significantly impact our revenues, cash flows and net income. The balance sheet amounts are translated into US dollars at the exchange rate at the end of the month and the income statement amounts are translated at the average exchange rate for the month.
From time to time, we also enter into purchase and sales commitments that are denominated in another foreign currency (primarily the Euro). Our practices include entering into foreign currency forward exchange contracts to minimize foreign currency exposure related to forecasted purchases and sales of certain inventories. These risks can create volatility in earnings and cash flows from period to period. We do not use derivative financial instruments for speculative purposes.
Revenue sources
We generate substantially all of our revenues, net of returns and allowances, from the sale of our products to third parties. Additionally, sales are reduced by sales discounts and incentives provided to our customers. We recognize revenue on products sales when title transfers to the customer and risk of loss is assumed.
Principal costs and expenses
Our principal costs and expenses consist of the following: cost of sales (exclusive of depreciation and amortization), selling, general and administrative expenses, depreciation and amortization, and interest expense.
40
Our most significant cost is cost of sales (exclusive of depreciation and amortization) which includes the cost of the products we distribute, freight in and freight out and services provided by third parties to prepare the product for sale. Our product costs are reduced by vendor discounts and purchase incentives. We buy and pay for most of our products on standard commercial terms (e.g., payment typically due within 30 to 60 days).
Selling, general and administrative expenses include sales and administrative employee compensation and benefit costs, as well as travel expenses for sales representatives, information technology infrastructure and communication costs, office rent and supplies, professional services, and other general corporate expenses. Selling, general and administrative expenses also include costs for warehouse personnel and benefits, supplies, equipment maintenance and rental and contract storage and distribution expenses.
Depreciation and amortization consists of amortization of acquired other intangible assets, including customer relationships and backlog, and the depreciation of property, plant and equipment including leasehold improvement, capitalized leases, and picking and lifting equipment.
Interest expense includes interest incurred on our indebtedness and amortization of deferred financing costs associated with such indebtedness.
Critical accounting policies
The preparation of financial statements, in conformity with accounting principles generally accepted in the United States of America, requires management to make judgments, estimates and assumptions that affect the reported amounts of assets, liabilities, revenues and expenses in our consolidated financial statements. We base our estimates on historical experience and other assumptions that we believe are reasonable under the circumstances, the results of which form the basis for our judgments about the carrying values of assets and liabilities that are not readily apparent from other sources. Our actual results may differ from these estimates under different circumstances or conditions. If actual amounts are ultimately different from these estimates, the revisions are included in our results of operations for the period in which the actual amounts become known.
We believe the following critical accounting policies and estimates affect our more significant judgments and estimates used in preparing our consolidated financial statements. (See note 1 of the notes to our audited consolidated financial statements included elsewhere in this prospectus for a summary of our significant accounting policies.)
Revenue recognition
Revenue is recognized on product sales when the customer takes title and assumes risk of loss. Revenue is recorded, net of discounts, sales incentives, value added tax and similar taxes as applicable in foreign jurisdictions. We monitor and track the amount of rebates, returns and discounts to customers based on historical experience to estimate the amount of reduction to revenue.
Accounts receivable
We maintain an allowance for doubtful accounts to reflect our estimate of the uncollectibility of accounts receivable. Concentration of credit risk with respect to accounts receivable is within several industries and is limited because of our broad customer base. We perform ongoing credit evaluations of customers and set credit limits based upon reviews of customers' current credit information and payment histories. We monitor customer payments and maintain a provision for estimated uncollectible accounts based on historical experience and specific customer collection issues that we have identified. Estimation of such losses requires adjusting historical loss experience for current economic conditions and judgments about the probable effects of economic conditions on certain customers. The rate of future credit losses may not be similar to past experience.
41
We record the effect of any necessary adjustments prior to the publication of our consolidated financial statements. We consider all available information when assessing the adequacy of the provision for allowances, claims and doubtful accounts. Adjustments made with respect to the allowance for doubtful accounts often relate to improved information not previously available. Uncertainties with respect to the allowance for doubtful accounts are inherent in the preparation of financial statements.
Inventories
We state our inventories at the lower of cost or market (net realizable value). We account for our inventories using the weighted average cost method of accounting. Cost includes all costs incurred in bringing the product to its present location and condition, based on purchase cost on a weighted average cost basis. Inventory is written off for obsolete, slow moving or defective items where appropriate. We regularly review our inventory on hand and update our allowances based on historical and current sales trends. Changes in product demand and our customer base may affect the value of inventory on hand and may require higher inventory allowances. Uncertainties with respect to the inventory valuation are inherent in the preparation of financial statements. For example, in 2003, our financial results included a $2.4 million write-down of inventory associated with the collapse of the power generation construction market.
Goodwill and other intangible assets
Goodwill represents the excess of the amount we paid to acquire a company over the estimated fair value of tangible assets and identifiable assets acquired, less liabilities assumed. As of June 30, 2006 and December 31, 2005, the goodwill and other intangible assets with indefinite lives balance was $84.2 million and $82.0 million, representing 16.3% and 15.8% of total assets, respectively.
We account for goodwill under the provisions of SFAS No.142,Goodwill and Other Intangible Assets. Under these rules we test goodwill and other intangible assets with indefinite lives for impairment annually or at any other time when impairment indicators exist. As of January 1, 2006, we performed our annual goodwill impairment test, which requires comparison of our estimated fair value to our book value including goodwill. As a result of the test, we believe the goodwill on our consolidated balance sheet is not impaired. In assessing the recoverability of our goodwill and other indefinite lived intangible assets, we must make assumptions regarding estimated future cash flows and other factors to determine the fair value of the respective assets. We estimate future cash flows at the reporting unit level. If these estimates or their related assumptions change in the future, we may be required to record impairment charges not previously recorded for these assets. For example, an impairment of 10% of our goodwill at December 31, 2005 would have reduced operating income by $7.0 million and net income by $4.4 million for the combined twelve months ended December 31, 2005.
Long-lived assets
We assess the impairment of long-lived assets, including finite lived intangible assets such as customer relationships, when events or changes in circumstances indicate that the carrying value of the assets or the asset group may not be recoverable. The asset impairment review assesses the fair value of the assets based on the future cash flows the assets are expected to generate. An impairment loss is recognized when estimated undiscounted future cash flows expected to result from the use of the asset plus net proceeds expected from the disposition of the asset (if any) are less than the related asset's carrying amount. Impairment losses are measured as the amount by which the carrying amounts of the assets exceed their fair values. Estimates of future cash flows are judgments based on our experience and knowledge of our operations and the industries in which we operate. We also estimate the useful lives of other finite lived intangible assets based on estimates of the economic benefit expected to be received from the acquired assets which could differ from actual results. These estimates can be significantly affected by future changes in market conditions, the economic environment capital spending decisions of our customers and inflation. As of June 30, 2006 and December 31, 2005, our
42
long-lived assets were $120.2 million and $127.5 million, representing 23.2% and 24.5% of total assets, respectively. For example, a one year reduction in the useful lives of customer relationship intangible assets, our largest long-lived asset which is amortized over approximately 7 years, would have reduced operating income and net income by $2.0 million and $1.2 million, respectively, for the combined twelve months ended December 31, 2005.
Share-based payments
Prior to January 1, 2006, we issued stock-based compensation in the form of restricted common partnership units to certain members of management and a director. We account for these restricted common units by applying theAccounting Principles Board ("APB") Opinion No. 25,Accounting for Stock Issued to Employees, which does not require us to recognize compensation expense related to these employee stock-based compensation. For stock-based compensation grants after January 1, 2006, we account for them using the fair value recognition provision of SFAS 123(R),Share-Based Payment ("SFAS 123(R)").
The fair value of restricted common units granted was estimated by management and/or our controlling shareholder, JCP, using an internal valuation methodology. A market approach was generally used to estimate our enterprise value using estimates of EBITDA multiplied by relevant market multiples, adjusted to take into account particular characteristics of our businesses. We used market multiples of companies that we believed to be most comparable to our businesses.
Income tax expense estimates and policies
As part of the income tax provision process of preparing our consolidated financial statements, we are required to estimate our income taxes. This process involves estimating our current tax exposure together with assessing temporary differences resulting from differing treatment of items for tax and accounting purposes. These differences result in deferred tax assets and liabilities. We must then assess the likelihood that our deferred tax assets will be recovered from future taxable income, and to the extent we believe the recovery is not likely, we must establish a valuation allowance. Further, to the extent that we establish a valuation allowance or increase this allowance in a financial accounting period, we must include a tax provision, or reduce our tax benefit in our consolidated statement of operations. We use our judgment to determine our provision or benefit for income taxes, deferred tax assets and liabilities and any valuation allowance recorded against our net deferred tax assets.
We recorded a valuation allowance in 2002 against a portion of deferred tax assets because management believed that the deferred tax assets related to goodwill impairment (see note 10 to our audited consolidated financial statements included elsewhere in this report) would not more than likely be realized in full through future operating results and the reversal of taxable timing differences. Based on operating results for year ended December 31, 2004 and projected operating results for the years ended December 31, 2005 and 2006, management believed this was no longer the case and the valuation allowance was reversed as of December 31, 2004. This resulted in an increase in the deferred tax asset and a related decrease in income tax expense of $7.1 million.
There are various factors that may cause our tax assumptions to change in the near term, and we may have to record a valuation allowance against our deferred tax assets. We cannot predict whether future US federal and state income tax laws and regulations might be passed that could have a material effect on our results of operations. We assess the impact of significant changes to the US federal and state income tax laws and regulations on a regular basis and update the assumptions and estimates used to prepare our financial statements when new legislation and regulations are enacted.
43
Results of operations
Overview
Our financial results for the six months ended June 30, 2006 and the combined twelve months ended December 31, 2005 were positively impacted by various factors including:
- •
- sustained historically high oil and gas prices, which have driven increased capital expenditures by the customers we serve;
- •
- increased demand in our Asia/Pacific market, driven by increased consumption of energy in developing countries; and
- •
- increases in sales prices, particularly for our alloy products, because of limited availability from our vendors driven by demand for specialty materials used in the energy infrastructure industry.
Six months ended June 30, 2006 compared to combined six months ended June 30, 2005
The following table provides our statement of operations data for the six months ended June 30, 2006 and the combined six months ended June 30, 2005. The period-to-period comparisons of financial results are not necessarily indicative of future results, or in the case of the interim periods, results for a full year.
Statement of operations data
| |
| | Successor
| | Predecessor
| | Non-GAAP
combined
| |
|---|
(dollars in thousands)
| | Six months
ended
June 30,
2006
| | Period
February 1,
2005 to
June 30,
2005
| | Period
January 1,
2005 to
January 31,
2005
| | Six months
ended
June 30,
2005
| |
|---|
| |
| Sales | | $ | 340,020 | | $ | 120,288 | | $ | 18,945 | | $ | 139,233 | |
| Operating expenses: | | | | | | | | | | | | | |
| | Cost of sales (exclusive of depreciation and amortization shown separately below) | | | 274,653 | | | 93,627 | | | 14,153 | | | 107,780 | |
| | Selling, general and administrative expense | | | 26,322 | | | 13,035 | | | 14,364 | | | 27,399 | |
| | Depreciation and amortization expense | | | 12,412 | | | 1,087 | | | 201 | | | 1,288 | |
| | |
| |
| Total operating expenses | | | 313,387 | | | 107,749 | | | 28,718 | | | 136,467 | |
| Income (loss) from operations | | | 26,633 | | | 12,539 | | | (9,773 | ) | | 2,766 | |
| Other income (expense) | | | 5,906 | | | 75 | | | (50 | ) | | 25 | |
| Interest expense, net | | | (17,169 | ) | | (4,958 | ) | | (333 | ) | | (5,291 | ) |
| | |
| |
| Income (loss) from operations before income tax expense (benefit) | | | 15,370 | | | 7,656 | | | (10,156 | ) | | (2,500 | ) |
| Income tax expense (benefit) | | | 5,304 | | | 2,748 | | | (1,916 | ) | | 832 | |
| | |
| |
| Net income (loss) | | $ | 10,066 | | $ | 4,908 | | $ | (8,240 | ) | $ | (3,332 | ) |
| |
44
Sales
| |
(dollars in thousands)
| | Six months
ended
June 30, 2006
| | Non-GAAP
combined
six months
ended
June 30, 2005
| | % Increase
| |
|---|
| |
Reporting segment
| |
| |
| |
| |
|---|
| Americas—Alloy products | | $ | 49,200 | | $ | 37,174 | | 32.3 | % |
| Americas—Carbon products | | | 138,762 | | | 102,059 | | 36.0 | |
| | |
| | | |
| | Total | | | 187,962 | | | 139,233 | | 34.9 | |
| UK (Europe/West Africa) | | | 82,808 | | | — | | — | |
| Singapore (Asia/Pacific) | | | 39,763 | | | — | | — | |
| UAE (Middle East) | | | 32,517 | | | — | | — | |
| Eliminations | | | (3,030 | ) | | — | | — | |
| | |
| | | |
| | Total | | $ | 340,020 | | $ | 139,233 | | 144.2 | % |
| |
Overall
For the six months ended June 30, 2006, our consolidated sales increased $200.8 million, or 144.2%, to $340.0 million compared to the combined six months ended June 30, 2005. This increase in sales was primarily the result of the MIM Acquisition and the Western Flow Acquisition which contributed $152.2 million and $6.5 million in sales, respectively, sales price increases for alloy and carbon steel products, particularly stainless steel pipe, and steady demand for oil, natural gas and refined products which drive capital expenditures and maintenance projects for the products that we supply.
Sales order backlog increased from $164.1 million at December 31, 2005 to $197.8 million at June 30, 2006. Because of increased new project and expansion spending within the energy infrastructure market and as a result of the MIM Acquisition in late 2005, our backlog has expanded to include project orders which typically have a longer term from the date of sales order to shipment, as opposed to maintenance and repair orders which tend to ship quickly. As a result, project orders may have a significant impact on our backlog, and ultimately our sales, from period to period. Project orders are driven by scheduled shipment dates and planned major capital expenditures, as opposed to quick-ship inventory orders used primarily for daily customer repair and maintenance activity.
For the six months ended June 30, 2006, our top ten customers represented 35% of our consolidated sales and no single customer represented more than 10% of consolidated sales.
Americas—Alloy products. For the six months ended June 30, 2006, alloy product sales increased $12.0 million, or 32.3%, to $49.2 million compared to the combined six months ended June 30, 2005. This increase was the result of the Western Flow Acquisition which contributed $6.5 million in sales driven by energy infrastructure projects in Canada and sales price increases, particularly for stainless steel pipe.
Americas—Carbon products. For the six months ended June 30, 2006, carbon product sales increased $36.7 million, or 36.0%, to $138.8 million compared to the combined six months ended June 30, 2005. This increase was driven by $24.2 million in sales contributed by the MIM US Acquisition, an increase in sales volume of pipe and fittings to the gas transmission market, and sales price increases for our carbon products.
45
UK (Europe/West Africa)
For the six months ended June 30, 2006, sales of $82.8 million primarily reflect the sale of high grade carbon steel pipe, plates and sections to our oil field services and fabrication customers. Sales of these products are driven by oil and gas drilling, and by the construction and maintenance of infrastructure to support oil and gas exploration, production and storage activities.
Singapore (Asia/Pacific)
Similar to our UK segment, for the six months ended June 30, 2006, sales of $39.8 million in our Singapore segment reflect demand for high grade welded and seamless carbon steel pipe, plates and sections. Our business in this segment is closely related to the construction of onshore and offshore oil and gas platforms. The Singapore market is currently characterized by significant capital expenditures for new oil and gas platforms and other infrastructure to support oil and gas exploration and production.
UAE (Middle East)
For the six months ended June 30, 2006, our sales of $32.5 million in the UAE segment reflect the demand for high-grade steel plates and for non-specialty carbon steel products. We supply these products primarily to fabricators of onshore and offshore structures as well as general fabrication and construction markets in this geographical region.
Operating income (loss)
| |
(dollars in thousands)
| | Six months
ended
June 30, 2006
| | % of sales
| | Non-GAAP
combined
six-months
ended
June 30,
2005
| | % of sales
| |
|---|
| |
| Reporting segment | | | | | | | | | | | |
| Americas—Alloy products | | $ | 7,628 | | 15.5 | % | $ | 6,669 | | 17.9 | % |
| Americas—Carbon products | | | 12,752 | | 9.2 | | | 12,477 | | 12.2 | |
| | |
| | | |
| | | |
| | Total | | | 20,380 | | 10.8 | | | 19,146 | | 13.8 | |
| UK (Europe/West Africa) | | | 9,502 | | 11.5 | | | — | | — | |
| Singapore (Asia/Pacific) | | | 6,970 | | 17.5 | | | — | | — | |
| UAE (Middle East) | | | 3,949 | | 12.1 | | | — | | — | |
| General corporate | | | (14,168 | ) | | | | (16,380 | ) | | |
| | |
| | | |
| | | |
| | Total | | $ | 26,633 | | 7.8 | % | $ | 2,766 | | 2.0 | % |
| |
Overall
Our consolidated operating income for the six months ended June 30, 2006 increased $23.9 million to $26.6 million as compared to $2.8 million for the combined six months ended June 30, 2005. Approximately $19.4 million of the increase in total operating income was the result of operating income from the MIM Acquisition. General corporate operating loss decreased by approximately $2.2 million. The decrease in general corporate operating loss was primarily the result of approximately $12.0 million in Buy-out Transaction related expenses incurred in the combined six months ended June 30, 2005 which did not occur in the same period in 2006, partially offset by increased amortization expense of other intangible assets of $6.6 million, and by an increase in general corporate selling, general and administrative expenses related to the MIM Acquisition and the Western Flow Acquisition.
Americas—Alloy products. Our alloy products operating income for the six months ended June 30, 2006 was $7.6 million, or 15.5% of sales. This represented a $1.0 million increase from the combined
46
six months ended June 30, 2005. The increase was primarily the result of increased sales volumes, margin increases related to sales driven by the Western Flow Acquisition, partially offset by a $0.5 million increase in amortization related to other intangible assets and by an increase in selling, general and administrative expenses related to the Western Flow Acquisition. In addition, cost of sales (exclusive of depreciation and amortization) for the six months ended June 30, 2006 increased due primarily to higher product costs compared to the same period in 2005 and due to narrower margins on large energy infrastructure projects in the second quarter 2006, and was negatively impacted by $0.2 million related to a purchase price allocation adjustment that increased the value of our alloy inventory as of February 1, 2005. As of June 30, 2006, the remaining purchase price adjustment included in inventory on the balance sheet was not material.
Americas—Carbon products. Our carbon products operating income for the six months ended June 30, 2006 was $12.8 million, or 9.2% of sales. This represented an increase of $0.3 million from the combined six months ended June 30, 2005. The increase in operating income was driven primarily by the MIM US Acquisition, and was partially offset by a $6.6 million increase in amortization related to other intangible assets and by an increase in selling, general and administrative expenses related to the MIM US Acquisition.
UK (Europe/West Africa)
For the six months ended June 30, 2006, operating income and operating income as a percentage of sales of $9.5 million and 11.5%, respectively, primarily reflects the sale of high grade carbon steel pipe, plates and sections to our oil field services and fabrication customers. Sales of these products are driven by oil and gas drilling, and by the construction and maintenance of infrastructure to support oil and gas exploration, production and storage activities.
Singapore (Asia/Pacific)
Similar to our UK segment, for the six months ended June 30, 2006, operating income and operating income as a percentage of sales of $7.0 million and 17.5%, respectively, in our Singapore segment reflect demand for high grade welded and seamless carbon steel pipe, plates and sections. Our business in this segment is closely related to the construction of onshore and offshore oil and gas platforms. The Singapore market is currently characterized by significant capital expenditures for new oil and gas platforms and other infrastructure to support oil and gas exploration and production which supported higher operating income as a percentage of sales compared to our other carbon geographical segments.
UAE (Middle East)
For the six months ended June 30, 2006, our operating income and operating income as a percentage of sales of $3.9 million and 12.1%, respectively, in the UAE segment reflects a higher demand for high-grade steel plates and for non-specialty carbon steel products. We supply these products primarily to fabricators of onshore and offshore structures as well as general fabrication and construction markets in this geographical region. These products are subject to intense price competition due to supply and demand.
General corporate
Operating income increased for the six months ended June 30, 2006 as a result of a reduction in general corporate expenses of $2.2 million, or 13.5%, compared to the combined six months ended June 30, 2005. The decrease in general corporate was primarily attributable to $12.0 million in Buy-out Transaction related expenses incurred during the combined six months ended June 30, 2005 which did not occur in the same period in 2006, offset by $4.5 million in amortization of other intangible assets acquired in the MIM Acquisition. The decrease in general corporate expenses was also partially offset
47
by increases in employee and facility costs, including rental payments under the Newbridge, Scotland finance lease, related to the MIM Acquisition and the Western Flow Acquisition.
Other income (expense)
Other income (expense) for the six months ended June 30, 2006 of $5.9 million was primarily attributable to a foreign exchange gain on the PAL Floating Rate Notes. The PAL Floating Rate Notes are denominated in US dollars on the financial statements of our United Kingdom subsidiary, Pipe Acquisition Finance Plc ("PAF"), and the gain reflects the change in the relative value of the US dollar to the UK pound, which strengthened during the six months ended June 30, 2006.
Interest expense, net
Interest expense, net for the six months ended June 30, 2006 increased $11.9 million, to $17.2 million from $5.3 million for the combined six months ended June 30, 2005. The increase in interest expense was the result of (i) the issuance of the PAL Floating Rate Notes, (ii) the issuance of an additional $31.0 million aggregate principal amount of Edgen Senior Secured Notes in December 2005 which were not outstanding in the same period in 2005 and (iii) outstanding borrowings under our subsidiaries' revolving credit facilities during the second quarter 2006, partially offset by the retirement of $47.7 million of indebtedness outstanding prior to the Buy-out Transaction. Interest expense for the six months ended June 30, 2006 includes $2.0 million of debt issue costs amortization compared to $0.5 million of debt issue costs amortization for the combined six months ended June 30, 2005.
Income tax expense
Income tax expense was $5.3 million for the six months ended June 30, 2006 compared to income tax expense of $0.8 million for the combined six months ended June 30, 2005. The effective tax rate was approximately 35% for the six months ended June 30, 2006 and was approximately 33% for the combined six months ended June 30, 2005. The increase was primarily the result of an increase in our state income taxes for our US subsidiaries, which was partially offset by lower income tax rates related to our foreign subsidiaries in the United Kingdom and Singapore.
48
Combined twelve months ended December 31, 2005 compared to year ended December 31, 2004
The following table provides our statements of operations data for the combined twelve months ended December 31, 2005 and the year ended December 31, 2004. The period-to-period comparisons of financial results are not necessarily indicative of future results.
| |
| | Successor
| | Predecessor
| |
| | Predecessor
| |
|---|
| | Non-GAAP
combined
| |
|---|
| | Period
February 1,
2005 to
December 31,
2005
| | Period
January 1,
2005 to
January 31,
2005
| | Year ended
December 31,
| |
|---|
| | Twelve months
ended
December 31,
2005
| |
|---|
(dollars in thousands)
| | 2004
| | 2003
| |
|---|
| |
|---|
| Sales | | $ | 282,925 | | $ | 18,945 | | $ | 301,870 | | $ | 207,821 | | $ | 147,025 | |
| Operating expenses: | | | | | | | | | | | | | | | | |
| | Cost of sales (exclusive of depreciation and amortization) | | | 226,236 | | | 14,153 | | | 240,389 | | | 155,357 | | | 121,146 | |
| | Selling, general, and administrative expense | | | 28,960 | | | 14,364 | | | 43,324 | | | 32,009 | | | 29,595 | |
| | Depreciation and amortization expense | | | 6,226 | | | 201 | | | 6,427 | | | 2,400 | | | 2,001 | |
| | |
| |
| Total operating expenses | | | 261,422 | | | 28,718 | | | 290,140 | | | 189,766 | | | 152,742 | |
| Income (loss) from operations | | | 21,503 | | | (9,773 | ) | | 11,730 | | | 18,055 | | | (5,717 | ) |
| Other income (expense) | | | (307 | ) | | (50 | ) | | (357 | ) | | 106 | | | 174 | |
| Interest expense | | | (12,139 | ) | | (333 | ) | | (12,472 | ) | | (5,163 | ) | | (3,122 | ) |
| | |
| |
| Income (loss) from continuing operations before income tax expense | | | 9,057 | | | (10,156 | ) | | (1,099 | ) | | 12,998 | | | (8,665 | ) |
| Income tax expense (benefit) | | | 3,055 | | | (1,916 | ) | | 1,139 | | | (3,211 | ) | | (4,195 | ) |
| | |
| |
| Income (loss) from continuing operations | | | 6,002 | | | (8,240 | ) | | (2,238 | ) | | 16,209 | | | (4,470 | ) |
| Discontinued operations, net of tax | | | — | | | — | | | — | | | — | | | (189 | ) |
| | |
| |
| Net income (loss) | | $ | 6,002 | | $ | (8,240 | ) | $ | (2,238 | ) | $ | 16,209 | | $ | (4,659 | ) |
| |
Sales
| |
(dollars in thousands)
| | Non-GAAP
combined
twelve
months
ended
December
31, 2005
| | Year ended
December
31, 2004
| | %
Increase
| |
|---|
| |
| Reporting segment | | | | | | | | | |
| Americas—Alloy products | | $ | 76,594 | | $ | 52,251 | | 46.6 | % |
| Americas—Carbon products | | | 205,097 | | | 155,570 | | 31.8 | |
| | |
| | | |
| | Total | | | 281,691 | | | 207,821 | | 35.5 | |
| UK (Europe/West Africa) | | | 10,290 | | | — | | — | |
| Singapore (Asia/Pacific) | | | 6,264 | | | — | | — | |
| UAE (Middle East) | | | 3,625 | | | — | | — | |
| | |
| | | |
| | Total | | $ | 301,870 | | $ | 207,821 | | 45.3 | % |
| |
Overall
For the combined twelve months ended December 31, 2005, our consolidated sales increased $94.0 million, or 45.3%, to $301.9 million compared to the year ended December 31, 2004. Sales volumes were positively impacted by the worldwide demand for oil and gas, and refined products, particularly in non-OECD markets. Sales prices were positively impacted by a favorable change in the mix of products sold and by successful price increases achieved for iron ore, nickel, chrome and copper-
49
based products. Of the $94.0 million increase, $25.9 million was related to revenue from the MIM Acquisition and the Western Flow Acquisition. Our sales order backlog significantly increased from $36.7 million at December 31, 2004 to $164.1 million at December 31, 2005 primarily due to the MIM Acquisition which constituted $93.1 million of total backlog as of December 31, 2005 and to large project orders for three customers totaling $43.8 million or 26.7% of the sales backlog at December 31, 2005. We anticipate substantially all of our backlog will be shipped in 2006.
For the combined twelve months ended December 31, 2005, our top ten customers represented 26% of our consolidated sales and no single customer represented more than 9% of consolidated sales.
Americas—Alloy products. For the combined twelve months ended December 31, 2005, our alloy products sales increased $24.3 million, or 46.6%, to $76.6 million compared to the year ended December 31, 2004. The increase in sales was the result of increased alloy pipe sales volumes, increased foreign sales and improved pricing, partially offset by a decrease in stainless and low temperature pipe sales volume.
Americas—Carbon products. For the combined twelve months ended December 31, 2005, our carbon products sales increased $49.5 million, or 31.8%, to $205.1 million as compared to the year ended December 31, 2004. The increase was driven by the MIM US Acquisition and a change in product mix as a result of demand for higher priced seamless products primarily from the oil and gas industry. General demand for both welded and seamless pipe and for high yield carbon fittings and components provided the basis for continued sales price increases.
UK (Europe/West Africa), Singapore (Asia/Pacific) and UAE (Middle East)
Sales from the UK, Singapore and UAE segments for the combined twelve months ended December 31, 2005 of $20.2 million, reflect sales from the MIM Acquisition from the date of acquisition, December 16, 2005, primarily from customers which use our products in oil and gas drilling, and construction and maintenance of infrastructure to support oil and gas exploration, production and storage activities.
Operating income (loss)
| |
(dollars in thousands)
| | Non-
GAAP combined
twelve months ended
December 31,
2005
| | % of sales
| | Year ended
December 31,
2004
| | % of sales
| |
|---|
| |
| Reporting segment | | | | | | | | | | | |
| Americas—Alloy products | | $ | 10,746 | | 14.0 | % | $ | 5,309 | | 10.2 | % |
| Americas—Carbon products | | | 19,327 | | 9.4 | | | 21,844 | | 14.0 | |
| | |
| | | |
| | | |
| | Total | | | 30,073 | | 10.7 | | | 27,153 | | 13.1 | |
| UK (Europe/West Africa) | | | 1,548 | | 15.0 | | | — | | — | |
| Singapore (Asia/Pacific) | | | 747 | | 11.9 | | | — | | — | |
| UAE (Middle East) | | | 289 | | 8.0 | | | — | | — | |
| General corporate | | | (20,927 | ) | | | | (9,098 | ) | | |
| | |
| | | |
| | | |
| | Total | | $ | 11,730 | | 3.9 | % | $ | 18,055 | | 8.7 | % |
| |
Overall
Our consolidated operating income of $11.7 million for the combined twelve months ended December 31, 2005 decreased $6.3 million from operating income of $18.1 million for the year ended December 31, 2004. The consolidated operating income for the combined twelve months ended December 31, 2005 included Buy-out Transaction related expenses of approximately $12.0 million, an increase in depreciation and amortization expense of $4.1 million related to acquired customer
50
relationships and backlog, and a purchase price allocation adjustment in cost of sales of $1.7 million. Operating income was also reduced by increases in alloy and carbon product costs when compared to 2004 and higher freight costs driven by increased fuel and shipping costs. Consolidated operating income as a percentage of consolidated sales for the combined twelve months ended December 31, 2005 and the year ended December 31, 2004 was 3.9% and 8.7%, respectively. The decrease as a percentage of consolidated sales reflects the $12.0 million in Buy-out Transaction related expenses, the increase in depreciation and amortization expense of $4.1 million and the $1.7 million purchase price allocation adjustment, offset in part by a reduction of selling, general and administrative expenses which included a reduction in the employee bonus pool accrual and related payroll taxes.
The MIM Acquisition had a $3.1 million positive impact on operating income.
Americas—Alloy products. Our alloy products operating income for the combined twelve months ended December 31, 2005 was $10.7 million, or 14.0% of sales. This represented an increase of $5.4 million compared to the year ended December 31, 2004. The majority of the increase was the result of the sales increase previously discussed which was partially offset by the $1.7 million purchase price allocation adjustment that increased the value of our alloy inventory as of February 1, 2005, an increase in salaries and related benefits and payroll taxes and an increase in travel and selling expenses associated with increased business development efforts.
Americas—Carbon products. Our carbon products operating income for the combined twelve months ended December 31, 2005 was $19.3 million, or 9.4% of sales. This represented a decrease of $2.5 million compared to the year ended December 31, 2004. The decrease in operating income was driven by higher inventory costs during 2005 when compared to 2004, offset by a reduction in the employee bonus pool accrual and related payroll taxes within selling, general and administrative expenses.
UK (Europe/West Africa), Singapore (Asia/Pacific) and UAE (Middle East)
Operating income from the UK, Singapore and UAE segments for the combined twelve months ended December 31, 2005 represents fifteen days of operating income of $2.6 million and operating income as a percentage of sales of 12.8%.
General corporate
The $21.0 million operating loss in general corporate includes $12.0 million in Buy-out Transaction related expenses which did not occur during 2004. General corporate operating loss in 2005 decreased when compared to 2004 due to a $3.2 million reduction in the employee bonus pool accrual and related payroll taxes, a reduction in management and director fees paid to our previous owners before February 1, 2005, and a decrease in property taxes for the combined twelve months ended December 31, 2005 compared to 2004. This reduction in operating loss was offset by increases in employee salaries and related benefits and payroll taxes, increases in travel and selling expenses associated with increased business development efforts, and expenses related to the MIM Acquisition and the Western Flow Acquisition during 2005.
Interest expense, net
Interest expense net, for the combined twelve months ended December 31, 2005 increased $7.3 million, or 141.6%, to $12.5 million. Interest expense net, for the year ended December 31, 2004 was $5.2 million. The increase in interest expense was the result of the issuance of $105.0 million aggregate principal amount of Edgen Senior Secured Notes on February 1, 2005 and borrowings under the Edgen Credit Facility, partially offset by the retirement of $47.7 million in indebtedness outstanding prior to the Buy-out Transactions. Also, interest expense increased by $0.8 million as a result of the issue of an additional amount of $31.0 million aggregate principal amount the Edgen Senior Secured Notes and the issue PAL Floating Rate Notes on December 16, 2005. Interest expense for the combined twelve months ended December 31, 2005 included $1.2 million of debt issue costs amortization compared to $1.5 million for the year ended December 31, 2004.
51
Income tax expense
Income tax expense was $3.1 million for the period February 1, 2005 to December 31, 2005 compared to an income tax benefit of $(1.9 million) for the period January 1, 2005 to January 31, 2005 and income tax benefit of $(3.2 million) for the year ended December 31, 2004. The effective tax rate was approximately 34% for the combined twelve months ended December 31, 2005 and approximately 25% for the year ended December 31, 2004. The income tax benefit and effective tax rate for the combined twelve months ended December 31, 2005 reflects the impact of Buy-out Transaction related expenses, which may not be fully deductible for income tax purposes and the impact of our UK and Singapore foreign subsidiaries which are subject to lower income tax rates. For the year ended December 31, 2004, the effective tax rate reflects the reversal of the valuation allowance recorded against the deferred tax asset related to goodwill impairment in 2002. Additionally, deferred tax liabilities recorded in connection with the Buy-out Transaction included temporary differences consisting of customer relationships being amortized for book purposes but not deductible for income tax purposes, non-deductible trade name intangibles with indefinite lives, and a fair value adjustment to inventory which is reduced in the period the inventory is sold.
Year ended December 31, 2004 compared to year ended December 31, 2003
Sales
| |
| | Year ended December 31,
| |
| |
|---|
| | % Increase
| |
|---|
(dollars in thousands)
| | 2004
| | 2003
| |
|---|
| |
| Reporting segment | | | | | | | | | |
| Americas—Alloy products | | $ | 52,251 | | $ | 41,011 | | 27.4 | % |
| Americas—Carbon products | | | 155,570 | | | 106,014 | | 46.7 | |
| |
| |
| |
|---|
| | Total | | $ | 207,821 | | $ | 147,025 | | 41.4 | % |
| |
Overall. For the year ended December 31, 2004, our consolidated sales increased $60.8 million, or 41.4%, to $207.8 million as compared to the year ended December 31, 2003. This increase in overall sales was primarily the result of commodity price increases, increased sales volume, strong organic growth (which includes the establishment of a sales offices in Canada, an international sales office in Houston, Texas and the appointment of sales agents in Scotland, China and Asia, all of which increased our international sales), and of changes in customer and product mix. The worldwide demand for iron ore, nickel, chrome and copper positively impacted pipe and component prices during 2004, which, in turn, positively impacted our overall sales. Overall sales order backlog grew from $13.4 million at December 31, 2003 to $36.7 million at December 31, 2004.
For the year ended December 31, 2004 and 2003, our top ten customers represented less than 23% and 24%, respectively, of our consolidated sales for those periods and no single customer represented more than 6% and 7%, respectively, of consolidated sales. For the years ended December 31, 2004 and 2003, there was not a material difference between our overall customer concentration levels as compared to our customer concentration levels on a segment basis.
Americas—Alloy products. For the year ended December 31, 2004, our alloy products sales increased $11.2 million, or 27.4%, to $52.3 million. This increase was primarily the result of increased sales of our products for use in processing and petrochemical maintenance and construction projects as well as our international business development efforts. Alloy products sales order backlog grew from $3.9 million at December 31, 2003 to $18.5 million at December 31, 2004.
Americas—Carbon products. For the year ended December 31, 2004, our carbon products sales increased $49.6 million, or 46.7%, to $155.6 million. This increase was primarily the result of increased sales to the oil and gas industry and our international business development efforts. Carbon products sales order backlog grew from $9.5 million at January 1, 2004 to $18.2 million at December 31, 2004.
52
Operating income (loss)
| |
| | Year ended December 31,
| |
|---|
(dollars in thousands)
| | 2004
| | % of sales
| | 2003
| | % of sales
| |
|---|
| |
| Reporting segment | | | | | | | | | | | |
| Americas—Alloy products | | $ | 5,309 | | 10.2 | % | $ | 1,435 | | 3.5 | % |
| Americas—Carbon products | | | 21,844 | | 14.0 | | | 1,626 | | 1.5 | |
| General corporate | | | (9,098 | ) | | | | (8,778 | ) | | |
| | |
| | | |
| | | |
| Total | | $ | 18,055 | | 8.7 | % | $ | (5,717 | ) | (3.9 | )% |
| |
Overall. Our consolidated operating income for the year ended December 31, 2004 increased $23.8 million to $18.1 million for the year ended December 31, 2004 from an operating loss of $5.7 million for the year ended December 31, 2003. Our consolidated operating income as a percentage of consolidated sales increased to 8.7% for the year ended December 31, 2004 from a consolidated operating loss of 3.9% as a percentage of consolidated sales for the year ended December 31, 2003. The increase in consolidated operating income was the result of increased sales and a decrease in cost of sales as we experienced the impact of inventory profits in a rapidly rising sales price environment, of improved purchasing arrangements with key vendors in 2004 and of improved controls over operating expenses and staff reductions, partially offset by increases in employee performance bonuses.
Americas—Alloy products. Our alloy products operating income for the year ended December 31, 2004 was $5.3 million, or 10.2% of sales. This represented an increase of $3.9 million from the year ended December 31, 2003. The majority of the increase was the result of sales increases and a decrease in cost of sales as a result of inventory gains in a rapidly rising sales price environment and of reduced staff expenses.
Americas—Carbon products. Our carbon products operating income for the year ended December 31, 2004 was $21.8 million, or 14.0% of sales. This represented an increase of $20.2 million from the year ended December 31, 2003. Similar to the alloy product group results, the increase in operating income was driven primarily by sales increases and a decrease in cost of sales as a result of inventory gains in a rapidly rising sales price environment, and by reduced staff expenses.
General corporate. General corporate operating loss was increased by our employee bonus pool which was significantly higher during the year ended December 31, 2004 compared to the year ended December 31, 2003. For the years ended December 31, 2004 and 2003, the bonus accruals were $6.1 million and $0.6 million, respectively. The bonus pool is based on achieving a target EBITDA that excludes bonus expense. The bonus pool achieved in 2004 was higher than expected due to strong business performance relative to our business plan. During 2004, the increase in general corporate operating loss was partially offset by cost savings driven by reduced staffing levels and reduced expenses for consultants in 2004 as compared to 2003.
Interest expense, net
Interest expense, net increased $2.1 million, or 65.4%, to $5.2 million for the year ended December 31, 2004 from $3.1 million for the year ended December 31, 2003. The increase in interest expense was the result of the amortization of deferred financing costs incurred in connection with obtaining a new revolving credit facility in February 2004 and slightly higher interest rates during 2004 on our variable rate debt.
Income tax expense
Income tax benefit decreased to $(3.2 million) for the year ended December 31, 2004 from an income tax benefit of $(4.2 million) for the year ended December 31, 2003. The income tax benefit of
53
$(3.2 million) in the year ended December 31, 2004 was primarily the result of the reversal of the valuation allowance recorded against the deferred tax asset related to goodwill impairment (see notes 5 and 10 to our audited consolidated financial statements included elsewhere herein). This reversal created an increase in the deferred tax asset and corresponding decrease in income tax expense of $7.1 million for the year ended December 31, 2004. Net of this adjustment, income tax expense would have been $3.9 million for an effective tax rate of 30.1%.
Liquidity and capital resources
We finance our operations principally through cash flows generated from operations and borrowings under our revolving credit facilities. Our principal liquidity requirements are to meet debt service requirements, finance our capital expenditures and provide working capital. In addition, we may need capital to fund strategic business acquisitions. Our primary source of acquisition funds has historically been the issuance of preferred and common equity and debt securities and cash flows from operations.
Our ability to make payments on and to refinance our indebtedness, and to fund planned capital expenditures will depend on our ability to generate cash in the future, which, to a certain extent, is subject to general economic, financial, competitive, legislative, regulatory and other factors that are beyond our control. Additionally, the Edgen Senior Secured Notes, restrict Edgen's ability to pay dividends or make certain other restricted payments to us by the indenture. As of June 30, 2006 and December 31, 2005, our total indebtedness, excluding discounts, was $286.8 million and $286.7 million, respectively, which included $1.8 million and no borrowings under our facilities, respectively. Under our various credit facilities, we had approximately $68.5 million available in borrowings and other commitments as of June 30, 2006.
Concurrent with the completion of this offering, we intend to replace the PAL Working Capital Facility (as defined in "—Liquidity and capital resources—Debt") with a new $125.0 million multi-currency revolving credit facility (the "New Revolving Credit Facility"). The New Revolving Credit Facility would be available to all non-US subsidiaries, based on various allocations, and will provide for borrowings in US dollars, Canadian dollars, UK pounds, Singapore dollars, Euros and other currencies approved by the lenders.
We expect to have the ability to elect how interest under the New Revolving Credit Facility will be computed. We anticipate that interest under the New Revolving Credit Facility will be based on either (i) the London Interbank Offered Rate, or LIBOR, plus an applicable margin per annum which may vary based on certain leverage ratios, or (ii) in the case of US dollar loans, the prime rate.
We expect the New Revolving Credit Facility agreement to contain financial and non-financial covenants that will limit our ability to among other things:
- •
- incur additional indebtedness;
- •
- grant loans;
- •
- make distributions;
- •
- make acquisitions; and
- •
- make certain asset dispositions.
The New Revolving Credit Facility may also contain, among others, financial covenants requiring us to maintain specified financial ratios, on a consolidated basis (all US and non-US subsidiaries), that may limit total consolidated debt to consolidated EBITDA, as defined in the New Revolving Credit Facility,
54
or require certain coverage of fixed charges. We also anticipate that the New Revolving Credit Facility obligations may be secured by first priority liens on all of the assets of our non-US subsidiaries.
Based on our current level of operations, we believe our cash flows from operations, available cash and available borrowings under our existing facilities, will be adequate to meet our liquidity needs for at least the next twelve months. Additionally, we continue to evaluate appropriate growth strategies including possible acquisition opportunities. These growth strategies may require us to use cash on hand, make additional borrowings under our revolving credit facilities, or enter into other financing arrangements in order to support these growth strategies, including additional equity offerings. We cannot assure you, however, that our business will generate sufficient cash flows from operations or that future borrowings will be available to us under our revolving credit facilities in an amount sufficient to enable us to service our indebtedness or to fund our other liquidity needs.
Preferred interest and dividends
Preferred interest and dividends were $2.1 million for the combined twelve months ended December 31, 2005 as compared to $2.2 million for the year ended December 31, 2004. Prior to the Buy-out Transaction, we had mandatorily redeemable preferred stock which was cancelled and replaced by redeemable preferred stock issued in connection with the Buy-out Transaction. On December 16, 2005, the $21.6 million in redeemable preferred stock was exchanged for preferred partnership units in Edgen/Murray, L.P. together with accrued dividends of $1.7 million, and $27.3 million in new Edgen/Murray, L.P. preferred partnership units was issued in connection with the MIM Acquisition. The Edgen/Murray, L.P. preferred partnership units have comparable terms to the previously issued redeemable preferred stock issued on February 1, 2005, including the accumulation of preferred interest at 8.5% per annum. Preferred interest related to these preferred partnership units was approximately $0.2 million for the combined twelve months ended December 31, 2005. Preferred interest and dividends was $2.1 million for the six months ended June 30, 2006 and $1.0 million for the combined six months ended June 30, 2005 due to the additional preferred partnership units issued on December 15, 2006.
Statement of cash flow data
| |
| |
| |
| |
| | Predecessor
| |
|---|
| | Successor
| | Non-GAAP
combined
| | Non-GAAP
combined
| |
|---|
| | Year ended
December 31,
| |
|---|
| | Six months
ended
June 30, 2006
| | Six months
ended
June 30, 2005
| | Twelve months
ended
December 31, 2005
| |
|---|
(dollars in thousands)
| | 2004
| | 2003
| |
|---|
| |
|---|
| Cash flows provided by (used in) activities: | | | | | | | | | | | | | | | | |
| | Operating | | $ | (7,064 | ) | $ | (10,148 | ) | $ | 24,288 | | $ | 5,849 | | $ | 24,739 | |
| | Investing | | | (13,545 | ) | | (121,536 | ) | | (161,887 | ) | | (1,036 | ) | | (3,115 | ) |
| | Financing | | | (2,708 | ) | | 134,765 | | | 159,120 | | | (7,803 | ) | | (18,499 | ) |
| |
Six months ended June 30, 2006 compared to combined six months ended June 30, 2005
Operating activities. Net cash outflows from operating activities were $(7.1 million) for the six months ended June 30, 2006 and $(10.1 million) for the combined six months ended June 30, 2005. The decrease in net cash outflows from operating activities is primarily the result of sales increases partially offset by higher product costs.
Investing activities. Net cash outflows from investing activities were $(13.6 million) for the six months ended June 30, 2006 compared with net cash outflows from investing activities of $(121.5 million) for the combined six months ended June 30, 2005. The reduction in cash outflows is the result of no acquisitions during the six months ended June 30, 2006 compared to the acquisition of Edgen for a
55
cash purchase price of approximately $121.0 million during the combined six months ended June 30, 2005, an increase in capital expenditures in support of increased facilities and equipment related to our Canadian operations, and corporate expenditures related to information technology infrastructure.
Financing activities. Net cash outflows from financing activities were $(2.7 million) for the six months ended June 30, 2006 compared with net cash inflows of $134.8 million from financing activities during the combined six months ended June 30, 2005. The decrease in cash inflows from financing activities was due primarily to the issuance of the Edgen Senior Secured Notes, additional borrowings under the our credit facilities and the issuance of common and preferred stock in connection with the Buy-out Transaction for the combined six months ended June 30, 2005.
Combined twelve months ended December 31, 2005 compared to year ended December 31, 2004
Operating activities. Net cash provided by operating activities was $24.3 million for the combined twelve months ended December 31, 2005 compared with net cash provided by operating activities of $5.8 million for the year ended December 31, 2004. The increase in cash provided by operating activities was primarily attributable to cash generated from our acquired subsidiaries in Scotland, and was offset by approximately $12.0 million in Buy-out Transaction related expenses paid during the combined twelve months ended December 31, 2005 as previously discussed. Cash outflows from operating activities for the combined twelve months ended December 31, 2005 included a scheduled $5.2 million interest payment on the Edgen Senior Secured Notes and the receipt of approximately $4.7 million in income tax refunds.
Investing activities. Net cash outflows from investing activities were $(161.9 million) for the combined twelve months ended December 31, 2005 compared with net cash outflow of $(1.0 million) for the year ended December 31, 2004. The increase in cash outflows was due primarily to the Buy-out Transaction and the Western Flow Acquisition and the MIM Acquisition for a combined cash purchase price of approximately $160.6 million.
Financing activities. Net cash inflows from financing activities were $159.1 million for the combined twelve months ended December 31, 2005 compared with net cash outflow of $(7.8 million) from financing activities in the year ended December 31, 2004. Net cash flows from financing activities of $166.9 million was due primarily to the issuance of the Edgen Senior Secured Notes for $134.6 million, net of discount, and the issuance of common and preferred units/shares with proceeds of $53.0 million in connection with the Buy-out Transaction partially offset by loan repayments. Cash outflows from financing activities for the combined twelve months ended December 31, 2005 included the payment of financing fees related to the issuance of the notes and our new revolving credit facilities, and a $5.1 million payment to extinguish debt assumed in the MIM US Acquisition.
Year ended December 31, 2004 compared to year ended December 31, 2003
Operating activities. Net cash provided by operating activities was $5.8 million for the year ended December 31, 2004 compared with net cash provided by operating activities of $24.7 million for the year ended December 31, 2003. The increase in cash provided by operating activities was primarily attributable to increased working capital requirements of $36.0 million, which was partially offset by increased operating income and increased income tax deferrals.
Investing activities. Net cash outflows from investing activities were $(1.0 million) for the year ended December 31, 2004 compared with net cash outflow from investing activities of $(3.1 million) for the year ended December 31, 2003. Capital expenditures for the year ended December 31, 2004 were $1.1 million versus $2.5 million for the year ended December 31, 2003. Cash outflows from investing activities decreased by $2.1 million from period to period because capital expenditures for the year ended December 31, 2004 were limited to general maintenance expenditures while capital expenditures for the year ended December 31, 2003 included significant expenditures for our new enterprise
56
resource planning (ERP) system as well as for the refurbishment of equipment, equipment replacement and improvement of leasehold property.
Financing activities. Net cash outflows from financing activities were $(7.8 million) for the year ended December 31, 2004 compared with net cash outflow of $(18.5 million) from financing activities in the year ended December 31, 2003. The increase in cash flows from financing activities of $10.7 million in the year ended December 31, 2004 as compared to the year ended December 31, 2003 is due primarily to the repayment of debt in 2003.
Debt
PAL Floating Rate Notes. Our subsidiary, PAL, has outstanding $130.0 million aggregate principal amount of floating rate notes due 2010 which were issued in December 2005 in connection with the MIM Acquisition (see note 2 to our audited consolidated financial statements included elsewhere in this prospectus). The PAL Floating Rate Notes were issued by PAL's subsidiary Pipe Acquisition Finance Plc, which was organized by PAL for the purposes of issuing the PAL Floating Rate Notes. Interest accrues on the PAL Floating Rate Notes at a rate equal to a six-month LIBOR plus an applicable margin of 6.25% per annum and is payable semi-annually in cash on each June 15 and December 15, commencing on June 15, 2006.
All of PAL's subsidiaries fully and unconditionally guarantee the PAL Floating Rate Notes on a joint and several basis. The PAL Floating Rate Notes are secured by liens on substantially all of the assets of PAL and its subsidiaries (other than certain excluded assets), subject to permitted liens. Neither Edgen/Murray, L.P. nor Edgen and its subsidiaries guarantees the PAL Floating Rate Notes.
The terms of the PAL Floating Rate Notes contain various covenants that limit, among other things, PAL's ability to incur additional indebtedness, pay dividends or dispose of all or substantially all of its assets. At any time on or after December 15, 2006, PAF may redeem the PAL Floating Rate Notes, at its option, at stated redemption prices, plus accrued and unpaid interest to the date of redemption. We intend to repay the PAL Floating Rate Notes with proceeds from this offering
Edgen Senior Secured Notes. Our subsidiary, Edgen has outstanding $136.0 million aggregate principal amount of 97/8% senior secured notes due 2011. The $136.0 million includes $105.0 million aggregate principal amount of notes issued in connection with the Buy-out Transaction in February 2005 and $31.0 million aggregate principal amount of notes issued to fund the MIM US Acquisition in December 2005 (see note 2 to our audited consolidated financial statements included elsewhere in this prospectus).
All of Edgen's domestic subsidiaries fully and unconditionally guarantee the Edgen Senior Secured Notes on a joint and several basis. The Edgen Senior Secured Notes and the related guarantees are secured by liens on substantially all of Edgen's assets and the assets of its existing and future domestic restricted subsidiaries (other than certain excluded assets such as Edgen's leasehold interests and the capital stock of Edgen's existing and future subsidiaries). None of Edgen Murray Plc, Edgen/Murray, L.P., PAL and MIM Ltd. guarantee the Edgen Senior Secured Notes.
The indenture governing the Edgen Senior Secured Notes contains various covenants that limit, among other things: (i) Edgen's ability and the ability of its subsidiaries to incur additional indebtedness, issue shares of preferred stock, incur liens and enter into certain transactions with affiliates; (ii) Edgen's ability to pay dividends or make certain other restricted payments; and (iii) Edgen's ability and the ability of its subsidiaries to merge or consolidate with any other person or sell, assign, transfer, convey or otherwise dispose of all or substantially all of Edgen's assets. See "Risk factors—We are a holding company, with no revenue generating operations of our own. We depend on the performance of our subsidiaries and their ability to make distribution to us."
57
Edgen Credit Facility. On February 1, 2005, Edgen entered into a five-year $20.0 million senior secured revolving credit facility, with a $5.0 million sub-limit for letters of credit ("the Edgen Credit Facility"). Interest is determined based on several alternative rates as stipulated in the loan and security agreement governing the Edgen Credit Facility, including the base lending rate per annum plus an applicable margin, or LIBOR plus an applicable margin at the option of Edgen.
The loan and security agreement governing the Edgen Credit Facility contains covenants that restrict, among other things, Edgen's ability to incur additional indebtedness, pay dividends and create certain liens. Edgen borrowed approximately $2.7 million under the Edgen Credit Facility in connection with the consummation of the Buy-out Transaction. As of December 31, 2005, Edgen had no amounts outstanding under the Edgen Credit Facility. The Edgen Credit Facility is secured by a first priority security interest in all of Edgen and Edgen's domestic subsidiaries' working capital assets, which is contractually senior to the liens on such assets securing the senior secured notes, and by a second priority security interest in substantially all of Edgen and Edgen's domestic subsidiaries' other assets (other than certain excluded assets such as Edgen's leasehold interests and the capital stock of Edgen's existing and future subsidiaries), which is contractually subordinated to the liens on such assets securing the senior secured notes.
PAL Working Capital Facility. In connection with the MIM Acquisition, MIM Ltd. entered into a combined multi-currency working capital facility, a letter of credit facility and a forward foreign exchange contracts facility (collectively, the "PAL Working Capital Facility") with the Bank of Scotland with total available commitments of UK£27.0 million (approximately $50.3 million at June 30, 2006). Of the total commitments, the maximum amount of cash borrowings available under the PAL Working Capital Facility is UK£12.0 million (approximately $22.4 million at June 30, 2006). The PAL Working Capital Facility expires on maturity of the PAL Floating Rate Notes. The amounts outstanding under the PAL Working Capital Facility incur interest at the Bank of England inter-bank rate plus a margin of 1.75% (6.25% at June 30, 2006).
PAL also has available to it certain credit facilities with local lenders in Dubai and Singapore (the "PAL Foreign Facilities"). The PAL Foreign Facilities provide access to, among other things, short term loans, performance bonds, financial guarantees and trust receipts. The weighted average interest rate on borrowings outstanding at June 30, 2006 and December 31, 2005 is 6.92% and 6.29%, respectively.
The PAL Working Capital Facility guarantees any borrowings and commitments under the PAL Foreign Facilities, subject to certain sub-limits stated in each foreign facility. Any borrowings or commitments under the PAL Foreign Facilities reduces the availability under the PAL Working Capital Facility.
Third party guarantees
Edgen and PAL provide performance guarantees on behalf of their subsidiaries directly with third parties in the normal course of business.
In addition, PAL has entered into performance guarantees on behalf of a foreign subsidiary which guarantee payment to a customer if a foreign subsidiary fails to perform completely under various contracts. For guarantees that expire within one year, the maximum potential amount of future payments (undiscounted) for non-performance totaled $5.7 million and $7.1 million at June 30, 2006 and December 31, 2005, respectively. For guarantees that do not have an expiration date, there was no maximum amount regarding future payment and the total amount outstanding relating to guarantees of $5.1 million at December 31, 2005. There were no guarantees expiring within one year as of June 30, 2006.
58
Commitments and contractual obligations
Our contractual obligations and commitments principally include obligations associated with our outstanding indebtedness and future minimum operating lease obligations as set forth in the following tables as of December 31, 2005:
|
| | Actual payments due by period
ending December 31,
|
|---|
(dollars in thousands)
| | 2006
| | 2007
and 2008
| | 2009
and 2010
| | 2011
and
thereafter
| | Total
|
|---|
|
| Contractual obligations | | | | | | | | | | | | | | | |
| Long term debt(1) | | $ | 29,957 | | $ | 55,416 | | $ | 55,282 | | $ | 266,000 | | $ | 406,655 |
| Finance lease(2) | | | 2,131 | | | 4,262 | | | 4,262 | | | 42,342 | | | 52,997 |
| Operating lease obligations | | | 2,030 | | | 2,411 | | | 1,194 | | | 892 | | | 6,527 |
| Purchase commitments(3) | | | 175,929 | | | — | | | — | | | — | | | 175,929 |
| | |
|
| Total | | $ | 210,047 | | $ | 62,089 | | $ | 60,738 | | $ | 309,234 | | $ | 642,108 |
|
- (1)
- Includes interest obligations on the Edgen Senior Secured Notes at an interest rate of 9.875% per annum, the PAL Floating Rate Notes at an assumed six-month LIBOR rate plus an applicable margin of 6.25% per annum (10.92% at December 31, 2005) and $2.2 million borrowings drawn under our revolving credit facilities at the date of the Buy-out Transaction. We plan to repay the entire $130 million principal amount of the PAL Floating Rate Notes with proceeds of this offering.
- (2)
- Includes interest obligations under the sale and leaseback of the Newbridge facility lease at 9.16%, the implicit interest rate.
- (3)
- Includes purchase commitments for inventory. As of December 31, 2005, our sales order backlog was approximately $164.1 million. Both our purchase commitments and sales order backlog have been impacted by several outstanding large customer orders as of December 31, 2005.
Recent accounting pronouncements
From time to time, new accounting pronouncements are issued by the Financial Accounting Standards Board ("FASB") which are adopted by us as of the specified effective date. Unless otherwise discussed, management believes the impact of recently issued standards which are not yet effective will not have a material impact on our consolidated financial statements upon adoption.
In December 2004, the FASB issued SFAS 123(R),Share-Based Payment ("SFAS 123(R)"), which is a revision of SFAS 123:Accounting for Stock-Based Compensation and supersedes APB Opinion 25,Accounting for Stock Issued to Employees. Generally, the valuation methods contained in SFAS 123(R) are similar to those in SFAS 123, but SFAS 123(R) requires all share-based payments to employees, including grants of employee share options, to be charged to the statement of operations. Pro forma disclosure is no longer an alternative. With limited exceptions, the amount charged to the statement of operations for share options will be measured based on the grant date fair value of the option amortized over the period to the date of vesting of the award. SFAS 123(R) is effective as of the beginning of the first interim or annual reporting period that begins after June 15, 2005. There was no impact on our consolidated financial statements as a result of the adoption of SFAS 123(R) on January 1, 2006.
In June 2006, the FASB issued FASB Interpretation No. 48,Accounting for Uncertainty in Income Taxes—an interpretation of FASB Statement No. 109 ("FIN 48"), which clarifies the accounting for uncertainty in income taxes recognized in an enterprise's financial statements in accordance with SFAS No. 109,Accounting for Income Taxes. This Statement is effective for fiscal years beginning after December 15, 2006. FIN 48 will be adopted during the first quarter of 2007, and it is not expected to have a material impact on our consolidated financial statements.
59
In February 2006, the FASB issued SFAS No. 155,Accounting for Certain Hybrid Financial Instruments—an amendment of FASB Statements No. 133 and 140 ("SFAS 155"). SFAS No. 155 amends FASB Statements No. 133, "Accounting for Derivative Instruments and Hedging Activities, and No. 140,Accounting for Transfers and Servicing of Financial Assets and Extinguishments of Liabilities." SFAS 155 resolves issues addressed in FASB Statement No. 133 Implementation Issue No. D1, "Application of Statement 133 to Beneficial Interests in Securitized Financial Assets." SFAS 155 is effective for fiscal years beginning after September 15, 2006. The adoption of SFAS 155 is not expected to have any impact on our results of operations.
In September 2006, the FASB issued SFAS No. 157,Fair Value Measurements ("SFAS 157"), which establishes asingle authoritative definition of fair value, sets out a frame-work for measuring fair value, and requires additional disclosures about fair-value measurements. SFAS No. 157 applies to fair value measurements that are already required or permitted by existing standards except for measurements of share-based payments and measurements that are similar to, but not intended to be, fair value. SFAS No. 157 does not impose any additional fair value measurements in financial statements and is effective for fiscal years beginning after November 15, 2007 and interim periods within those fiscal years. The adoption of SFAS 157 is not expected to have a material impact on our consolidated financial statements.
In September 2006, the SEC staff issued Staff Accounting Bulletin No. 108,Considering the Effects of Prior Year Misstatements when Quantifying Misstatements in Current Year Financial Statements ("SAB No. 108"). SAB No. 108 establishes a single quantification framework wherein the significance measurement is based on the effects of the misstatements on each of the financial statements as well as the related financial statement disclosures. SAB No. 108 is effective for the first annual period ending after November 15, 2006. We do not expect that the adoption of SAB No. 108 will have a material effect on its results of operations or financial position.
Off-balance sheet arrangements
We did not have any off-balance sheet arrangements as defined in Item 303(a)(4) of Regulation S-K as of June 30, 2006 and December 31, 2005.
Quantitative and qualitative disclosures about market risk
In the normal course of operations, we are exposed to market risks arising from adverse changes in interest rates and foreign exchange rates. Market risk is defined for these purposes as the potential change in the fair value of financial assets or liabilities resulting from an adverse movement in interest rates or foreign exchange rates.
Management is responsible for raising financing for operations, together with associated liquidity management, and the management of foreign exchange and interest rate risk. Our treasury operations are conducted under the oversight of management, who receive regular updates of treasury activity. Financial instruments are entered into for risk management purposes only. Our policy on foreign exchange rate hedging requires that only known firm commitments are hedged and that no trading in financial instruments is undertaken.
Our principal risks are exposures to changes in interest rates and currency exchange rates. These risks are closely monitored and evaluated by appropriate management. Following evaluation of those positions, we selectively enter into derivative financial instruments to manage any exposures. Currently, we have only entered into derivative financial instruments to manage exposures related to currency exchange rate changes.
60
Interest rate risk
We have certain interest rate risk associated with the PAL Floating Rate Notes, which mature in 2010 and are denominated in US dollars. Our PAL Floating Rate Notes accrue interest at a rate equal to LIBOR plus an applicable margin of 6.25% per annum (11.69% at June 30, 2006). A 100 basis point increase in interest rates, applied to the PAL Floating Rate Notes would have increased our annual interest expense by $1.3 million. We plan to repay the PAL Floating Rate Notes with the proceeds from this offering.
At June 30, 2006, we also had $1.8 million in variable rate borrowings under our revolving credit facilities. A 100 basis point increase in interest rates, applied to our borrowings at June 30, 2006, would have increased our annual interest expense by less than $0.1 million.
We have additional interest rate risk associated with the PAL Working Capital Facility with total available commitments of $50,317 (27,000 GBP). The amounts outstanding under the PAL Working Capital Facility incur interest at the Bank of England inter-bank rate plus a margin of 1.75% (6.25% at June 30, 2006).
We have available certain credit facilities with local lenders in Dubai and Singapore. The PAL Foreign Facilities provide access to, among other things, short term loans, performance bonds, financial guarantees and trust receipts at variable rates. The weighted average interest rate on borrowings, at June 30, 2006 is 6.92%.
Management continuously monitors the exposure related to the PAL Floating Rate Notes as well as exposure under its credit facilities.
Foreign currency risk
We assess currency exchange exposure on certain monetary assets and liabilities and enters into financial instruments, as it believes necessary, to manage this risk. During the normal course of business, we are exposed to foreign currency risk. These risks can create volatility in earnings and cash flows from year to year. We use derivative financial instruments to reduce exposure to foreign currency movements on foreign currency purchases and sales. We do not use derivative financial instruments for speculative purposes.
In our business, we may enter into purchase and sales commitments that are denominated in a foreign currency (primarily the Euro). Our practices include entering into foreign currency forward exchange contracts to minimize foreign currency exposure related to forecasted purchases and sales of certain inventories. These risks can create volatility in earnings and cash flows from year to year. We use derivative financial instruments to reduce exposure to foreign currency movements on foreign currency purchases and sales. We do not use derivative financial instruments for speculative purposes.
For the six months ended June 30, 2006, a gain of $0.2 million was included in the statement of operations. The fair value of these foreign currency forward derivative contracts was a liability of $0.2 million and $0.4 million at June 30, 2006 and December 31, 2005, respectively. At June 30, 2006 and December 31, 2005, the total notional amount of outstanding currency exchange contracts was $36.8 million and $29.7 million, respectively. We did not have any off-balance sheet arrangements as of December 31, 2004.
As of and for the six months ended June 30, 2006, approximately 23.9% of our revenues and 20.4% of our long-term assets were denominated in UK pounds, our functional currency in the United Kingdom. As a result, a material decrease in the value of the UK pound relative to the US dollar may negatively impact our revenues, cash flows and net income. Each one percentage point change in the value of the UK pound for the six month period ended June 30, 2006 would have impacted our revenues by approximately $0.9 million. We do not currently use hedges or forward contracts to offset this risk.
61
We also have foreign currency exposure related to our PAL Floating Rate Notes which are denominated in US dollars on our UK subsidiary which exposes us to foreign exchange gains or losses depending on the fluctuation of the US dollar to UK pounds. We intend to repay our PAL Floating Rate Notes with the proceeds from the offering. For the six months ended June 30, 2006, we recognized a $6.1 million foreign currency exchange gain related to our PAL Floating Rate Notes.
Credit risk
Our credit risk on liquid resources and derivative financial instruments is limited because the counterparties are banks with high credit ratings assigned by international credit-rating agencies. We have no significant concentration of credit risk with a specific counterparty because exposure is spread over a number of counterparties.
62
Business
Overview
We are a leading global distributor and marketer of high performance steel products for use primarily in specialized applications in the energy infrastructure market. The products we sell are generally highly engineered prime carbon or alloy steel pipe, pipe components and high grade structural sections and plates, which are designed to withstand the effects of corrosive or abrasive materials and possess performance characteristics required in extreme operating conditions, including high pressure and high/low temperature environments.
We distribute products and provide comprehensive procurement and project management solutions to our customers on projects spanning the complete lifecycle of the global energy infrastructure market, including exploration and production, new rig construction, gathering and transmission, refining and processing, power generation, petrochemical and maintenance, repair and operations (MRO). Our global sales and distribution network enables us to efficiently procure and deliver these high performance products worldwide to customers who may not have the relationships, resources or logistical support or who may not be willing or able to purchase in sufficient volume or on a cost-effective basis to complete procurement independently for their projects. Our customers are principally end-users that operate in or service the energy infrastructure market and providers of MRO products. For the six months ended June 30, 2006, approximately 81% of our total revenue was attributable to customers that operate in or service the energy infrastructure market and, within that market, approximately 59% of our total revenue was attributable to customers that operate in or service the oil and gas industry.
We operate in four geographic markets — the Americas, Europe/West Africa, Asia/Pacific and the Middle East. Our worldwide sales and distribution network enables us to promptly deliver our products and respond to our customers' needs. We currently serve customers in more than 50 countries worldwide through 23 locations internationally, including 17 in the Americas, three in Europe/West Africa, two in Asia/Pacific and one in the Middle East. We are capable of supplying our complete product offering in all of the regions in which we operate. We stock and distribute inventory and support our customers through our global network of field locations, which are in close proximity to our customers' operations. This network allows us to service projects in remote and challenging locations, while also supporting the daily MRO requirements of installed facilities.
We are a critical link between our customers and the manufacturers from whom we purchase our products (our vendors). We use our in-depth market knowledge and our value-added vendor relationships to provide our customers with complete logistical support for their projects, including inventory management and just-in-time product delivery on a worldwide basis. We maintain a broad product offering, which includes more than 44,000 SKUs, and manage a large inventory of components and more than 100,000 tons of pipes plates and sections. As a result, we are able to supply products that are not generally otherwise available to our customers on a quick-response basis or that cannot be purchased in the smaller quantities needed by customers for specific projects. Our global scale has allowed us to establish strong ties and preferential purchasing terms with our vendors. We also provide additional support for our vendors including sales, marketing and credit functions with respect to the products we distribute.
We employ experienced local market specialists and sales personnel in each of our geographical regions of operation, many of whom have technical backgrounds, training or relevant industry experience. Our sales personnel provide value-added customer support, including, technical consultation on product selection and integration in large, complex projects. In addition to the comprehensive knowledge of our products and the industries we supply, our local market personnel understand the characteristics of the
63
different geographies they serve. We are also well positioned to be a key vendor for our customers' greenfield projects and MRO needs because of the familiarity we have with our customers' existing infrastructure and upcoming projects.
End market overview
We sell our products principally to customers who develop, service and own the infrastructure that comprises much of the global energy value chain. We supply specialized steel products to fabricators and contractors engaged in the development of new energy infrastructure projects and the maintenance of existing facilities. We also supply products for ongoing MRO projects to other distributors and the ultimate owners and operators of these facilities, including major oil and independent exploration and production companies, gas transmission companies, independent refiners, petrochemical manufacturers and ethanol producers. The alloy-based specialty pipes, fittings and flanges that we distribute and market are principally used in high-pressure, extreme temperature and high-corrosion applications in the process and power generation industries. The carbon-based products that we distribute and market, including prime carbon specialty pipes, fittings and flanges, high grade structural steel products, steel tubes, plates and sections, are principally used in high-yield, high-tensile applications in the oil and gas exploration and production, gathering and transmission, crude oil refining and the energy processing and power generation industries.
We believe the following trends will drive capital investment in the end markets we serve and, in turn, demand for our highly specialized products:
- •
- Increasing global demand for crude oil and natural gas. Worldwide economic expansion, particularly in emerging economies, has resulted in growing demand for hydrocarbons. Tight capacity, continued conflict in the Middle East, instability in other large oil and natural gas producing regions of the world and extreme weather conditions have challenged industrial economies to seek more secure supplies of energy, thereby driving an increasing focus on oil and gas exploration and production throughout the world.
- •
- Rising activity in developing international markets. Many crude oil and natural gas producers have significant operations in international markets with large untapped reserves, such as Southeast Asia, West Africa and the Middle East. In many of these markets, a significant investment in production infrastructure is required to develop new crude discoveries. According to Spears & Associates, Inc., international offshore drilling and completion spending accounts for 70% of worldwide offshore drilling and completion spending and has increased from $20.9 billion in 2000 to $29.9 billion in 2005, representing a compound annual growth rate of 7.4%, and is expected to increase by a compound annual growth rate of 16.0% between 2005 and 2008, reaching $46.7 billion in 2008. Our global network of field location is well positioned to serve this fast growing market.
- •
- Increasing exploration and development activity in deepwater markets. One of the primary challenges facing oil and gas companies today is replacing produced reserves with new resources. Crude oil and natural gas producers are increasingly focusing their efforts on remote deepwater areas where geological formations have historically been less explored. Driven by technological innovations and a strong commodity price environment, deepwater oil and gas activity has increased significantly in recent years. According to Douglas-Westwood Ltd., global spending in water depths greater than 500 meters has increased from $8.6 billion in 2002 to $14.7 billion in 2005, representing a compound annual growth rate of 19.6%, and is projected to grow by a compound annual growth rate of 9.2% from 2005 through 2010, reaching $22.8 billion in 2010. Drilling for and producing oil and gas reserves in remote deepwater areas requires the use of technically sophisticated assets that are in scarce supply or require long lead times and significant capital to fabricate, including deepwater drilling rigs and higly engineered floating production facilities. We expect the demand for our
64
specialized products to continue to increase as oil and gas producers continue to invest in the infrastructure needed to commercially produce these deepwater reserves. We supply carbon conductor pipe that is required to begin the drilling of an offshore well, high grade structural pipe, plate, and sections that are required for the construction of offshore platforms (both fixed and floating) and wellhead connections.
- •
- New rig construction. Increasing global drilling activity has driven an increase in utilization levels of offshore drilling rigs capable of drilling in harsher environments, particularly higher specification rigs, prompting the industry to invest substantial capital in maintenance, upgrades and new rig construction. This has created a construction backlog in shipyards around the world. There are currently 66 mobile offshore drilling units under construction at an aggregate projected cost of $13.5 billion. As reflected in the chart below, new rig construction is expected to remain robust through 2008. We supply high grade structural pipe, plate and sections that are required for the construction of drilling rigs.
Newbuild orderbook through 2008
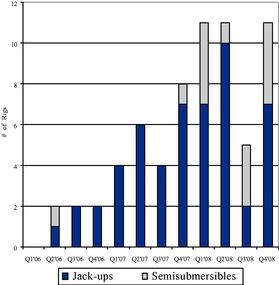
Source: ODS-Petrodata
65
- •
- Increasing investment in natural gas transmission capacity in under-supplied regional markets. As global energy infrastructure capacity has developed to match rising global energy demand, investment in the expansion of natural gas transmission capacity has increased commensurately. According to the Pipeline & Gas Journal's 2006 international survey, over the past year, new and planned pipeline mileage has increased globally by more than 15,650 miles. Currently there are 62,056 pipeline miles in the planning phase and 8,365 miles are in various stages of construction, for a worldwide total of 70,421 miles planned or under construction. The majority of these projects are located in the Asia/Pacific region, the former Soviet Union, Eastern Europe and South and Central America. A significant investment in new natural gas transmission capacity is also occurring in the US The chart below illustrates the Energy Information Administration's (EIA) forecast of natural gas pipeline additions and expansions in the US through 2008, which indicates that annual pipeline mileage additions are projected to increase from annual additions and expansions of 1,152 miles in 2005 to over 4,700 miles by 2008. Large-scale projects such as the Rockies Express Pipeline are being commenced in response to the need for additional pipeline routes in North America to deliver natural gas from gas rich basins to under-supplied markets such as the Northeast. Additionally, projects such as the $20 billion Alaska gas pipeline, which has the capacity to transport 4-5 billion cubic feet of natural gas per day across 2,140 miles from Alaska's North Slope to Alberta, Canada signal the growing need to transport gas from isolated producing regions to markets that are short supply of natural gas. We offer customers high-yield carbon steel pipe, pipe fittings and components for natural gas gathering and transmission systems that are required to distribute natural gas from producing points to markets for direct use, further processing and/or storage.
Additions to natural gas pipeline mileage 1998-2008
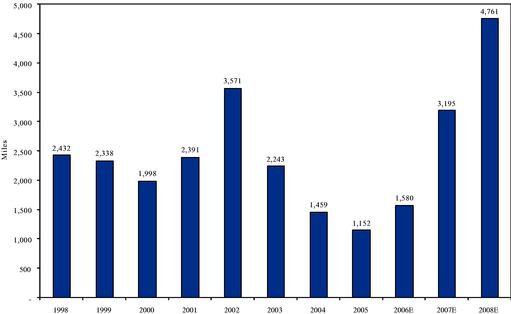
Source: Pipeline & Gas Journal
- •
- Proliferation of natural gas monetization projects. Commercialization of remote natural gas resources is a leading industry initiative to satisfy increasing global natural gas demand. With advancements in technologies related to the transportation and storage of natural gas, proven natural gas reserves have grown at a higher rate than proven crude oil reserves in recent years. Industry participants believe that the investment in natural gas monetization projects will continue to grow at a high rate
66
because natural gas is abundantly available around the world and a cleaner burning hydrocarbon than crude oil. It is also expected that pipelines will continue to dominate gas transportation, but other technologies will be required to overcome ever-increasing distances between production centers and markets, facilitating the commercialization of large offshore natural gas resource bases. Liquefied natural gas (LNG) and gas-to-liquid (GTL) technologies are expected to grow in importance as a choice for transportation and use. In North America alone, Cambridge Energy Research Associates (CERA) projects that sustainable LNG regasification capacity is expected to roughly quadruple from its current level of 3.7 billion cubic feet per day to approximately 16 billion cubic feet per day in 2010. There are about 40 LNG import terminals that are currently being discussed by the industry for development in North America according to the Federal Energy Regulatory Commission. Until recently the GTL business had contributed only a small proportion of liquids production (160,000 barrels per day in 2005), but there are a number of projects under way and planned that are expected to boost liquids production capacity to 480,000 barrels per day by 2010 and 1 million barrels per day in 2015 according to CERA. We believe we are well positioned to capitalize on increasing investment in gas monetization projects as our products serve as components for the construction of these facilities.
- •
- Significant capital investment in oil sands production and conversion capacity. Oil sands resource development is a complex and capital-intensive process. The development of Canada's vast oil sands deposits is expected to make a significant contribution to future global crude oil production and, in turn, should increase demand for our products that are components of the infrastructure needed to produce, refine and transport this resource. According to the Alberta Energy and Utilities Board (EUB), Alberta's oil sands areas contain an ultimate recoverable crude bitumen resource of 315 billion barrels, with remaining established reserves of almost 174 billion barrels at year-end 2004. Alberta's oil sands industry has benefited from a multi-billion-dollar investment in infrastructure and technology focused on developing the non-conventional resource. According to the Canadian Association of Petroleum Producers (CAPP), the industry will invest approximately $8.8 billion in 2006 in the Canadian oil sands in addition to the $35 billion that was invested from 1996 to 2004. CAPP also projects that approximately $45 billion of capital will be invested in oil sands projects between 2005 and 2010. High oil prices, coupled with robust global oil demand, are expected to continue to drive oil sands development, which will, in turn, increase the demand for our products that are components of the infrastructure needed to produce, refine and transport this resource.
- •
- Global investment in power generation capacity. As developing countries continue to experience economic growth and environmental regulations require or encourage the retirement or refurbishment of older power facilities, demand for power generation capacity continues to increase. The EIA estimates total domestic electricity sales volumes will increase 50% from current levels by 2030, growing from 3,567 billion kilowatt-hours (kWh) in 2004 to 5,341 billion kWh in 2030. Moreover, according to the EIA, inefficient, older generating capacity will be retired, necessitating 347 gigawatts of new capacity by 2030. Globally, the EIA forecasts that electricity demand will grow from its current level of 14.7 trillion kWh to 30.1 trillion kWh by 2030, a compound annual growth rate of 4.3%. The bulk of this incremental demand is expected to originate in countries outside the OECD, where the power generation markets are less developed. We believe that our worldwide footprint should allow us to capitalize on this forecasted growth of capacity in the power generating industry. The industry utilizes natural gas, fuel oils, hydro-power, steam, and coal as fuel sources to fire boiler, heater and turbine systems that generate power. We supply seamless carbon pipe, seamless alloy pipe and fitting and components that can withstand the effects of these extremely high pressure and heating systems.
- •
- Significant expansion of US ethanol production capacity. There are currently 101 operating ethanol plants in the US and another 43 plants either known to be under construction or undergoing expansion. With the US currently producing approximately 4.5 billion gallons of ethanol annually,
67
production is expected to double by the end of the decade based upon current expansion plans, according to the US Department of Agriculture. The US government last year enacted a mandate for renewable fuels use in gasoline which calls for 7.5 billion gallons of use annually by 2012. We distribute specialty components that are required to build and operate ethanol plants as well as address the MRO requirements of existing ethanol plants.
Our competitive strengths
We consider the following to be our principal competitive strengths:
Our distribution model. Our global distribution model provides our customers with a comprehensive procurement and project management solution focused on high performance steel products. We distinguish ourselves from our competitors because we have built a global business that combines local knowledge and presence with a solution-driven approach to managing our customers' needs for design, purchase and delivery of specialized steel products. We efficiently procure and deliver a broad range of products, some requiring large orders with long lead times, to customers who may not have the relationships, resources or logistical support and who may not be purchasing in sufficient volume to independently procure supplies for their projects or MRO needs. In addition, we use our knowledge and our value-added vendor relationships to provide our customers with complete logistical support for their projects, including inventory management and just-in-time product delivery on a worldwide basis.
We have a knowledgeable and experienced sales force. Our sales and support team is experienced and knowledgeable of both the design specifications of our customers' projects and facilities, as well as their ongoing needs and is able to provide valuable support to our customers while meeting their product requirements. Many of our sales and support personnel have technical backgrounds and training and on average have more than 15 years of industry experience. Our regional offices are staffed by personnel with knowledge of our customers' product requirements, local market conditions and codes and regulations. Furthermore, we have local knowledge and relationships that facilitate procurement, service and delivery in regional markets. Our sales specialists are skilled both in managing the intricate logistics inherent in complex projects and in accommodating the expedited MRO requirements of our customers. This enables our customers to focus on their installed facilities and the engineering, design and construction elements of their projects with the knowledge that the components we provide will be delivered as they are needed. The extensive average tenure and industry experience of personnel throughout our global sales organization is one of our major strengths and we believe would be difficult for our competitors to replicate.
We have strong vendor relationships. We are a volume purchaser of specialty steel products and serve as a critical link between our vendors and our customers. Many of the products we supply to our customers are difficult for individual customers to purchase on a cost-effective basis directly from manufacturers, who hold limited inventories and often require large orders and lengthy lead times for new production runs. Moreover, there are a limited number of vendors with the capability to produce high grade specialty steel products. We have demonstrated to our vendors that we are a consistent, high-volume purchaser of their products and a valuable, reliable sales channel. As a result, we have developed strong, longstanding relationships and negotiated preferred pricing arrangements with key vendors which we believe would be difficult for other to replicate. Although we concentrate our purchasing power on a select group of highly valued vendors, we currently have multiple sources for the products that we distribute and are not dependent on any single manufacturer.
We command premium margins through the combination of a broad offering of specialized products and value-added customer support. We focus on products that are highly specialized and that are generally regarded as critical to our customers' operations and new projects. For many of our customers, we function as the sole source of their specialty steel product requirements. In addition to our product
68
offerings, we provide technical consultation in areas such as design efficiency and logistics which are valued by our customers. The specialized nature of our products in combination with technical support we offer allows us to capture premium margins for the products we distribute versus those generally earned on non-specialized steel products.
We have a broad customer base. We market our products to a diverse base of more than 2,750 customers, whose operations are in geographic locations around the world and who participate in all sectors of the energy industry. Our customers are generally large, well-capitalized companies who are recognized as leaders in their respective industries. Our customers include engineering and construction firms, equipment fabricators, multi-national major integrated oil and gas companies, independent oil and gas companies, natural gas transmission and distribution companies, petrochemical companies, mining companies, oil sands developers, power generation companies and utilities, alternative energy providers, and certain integrated MRO distribution companies. Our top ten customers accounted for approximately 35% of our total sales for the six months ended June 30, 2006.
Our management team is experienced and incentivized. Our senior management team has an average of 26 years of industry experience. Many of our senior managers have significant relevant experience in the industries we serve or with vendors who supply high performance steel products to the energy infrastructure market. The compensation of our senior managers is tied to financial performance measures, which we believe creates value for our shareholders. In addition, many of our senior executives have significant experience in the geographies in which we conduct business. Following the closing of this offering, our senior management will own approximately % of our ordinary shares.
Our business strategy
Increase market share among existing and new customers. We have developed strong customer relationships in the industries we serve. Given our significant international expansion, highlighted by the acquisition of MIM Ltd., we believe that significant opportunities exist to cross-sell our combined products and procurement and distribution capabilities. As a result of the MIM Acquisition, we have strengthened our product offerings outside of the United States by augmenting our product portfolio, management expertise and sales force. For instance, we seek to provide additional products to existing customers who may not utilize the full breadth of our distribution platform. In particular, we expect to expand our alloy steel product distribution efforts to existing customers of MIM Ltd., which did not previously offer alloy steel products. Similarly, we expect Edgen's historical customers to benefit from the expanded global footprint of the historical MIM Ltd. business. Finally, we believe the scope of our combined business will attract new customers, particularly among large multi-national companies in the energy infrastructure industry.
Leverage our knowledge of the energy infrastructure industry in high growth markets. We distribute products used in the complete lifecycle of the energy infrastructure market in most of the world's more established energy producing regions. As part of our strategy of maximizing sales to current customers and developing new customer relationships, we plan to leverage our experience in the energy infrastructure market to achieve greater penetration of emerging high-growth regional infrastructure markets such as the Canadian oil sands and the Caspian Sea markets. We plan to continue to identify new uses for our products in higher growth infrastructure applications, such as LNG, GTL and alternative energy production.
Optimize our vendor relationships, purchasing and inventory levels. We have significantly consolidated our purchasing power among certain vendors, while keeping secondary vendors for all key products. By consolidating our purchasing power we believe that we have gained favored status with certain vendors that value both our global footprint and volume purchasing capabilities. Because of this, we are often considered the preferred or sole distribution channel for their specialty steel products. For the six
69
months ended June 30, 2006, approximately 45% of our purchases were from our top ten vendors. As we continue to strengthen our vendor relationships, we are able to devote greater resources to providing our customers with products that have fewer substitutes and are more critical to their business.
Pursue opportunistic strategic acquisitions and investments and continue global expansion. We intend to seek opportunities to strengthen our global franchise through selective acquisitions and strategic investments. In particular, we will consider investments that enhance our global presence in the energy infrastructure market and enable us to leverage our existing operations. We evaluate strategic acquisition opportunities in our core business and consider adding products that enhance the breadth of our product offering, with a view to expanding our geographical reach to attract new customers and more effectively service existing customers. In addition, we intend to selectively establish new regional offices, particularly in the Asia/Pacific region, to facilitate our expansion into emerging regional markets and to better serve our growing customer base in this region.
Our history and formation
Edgen Murray Plc was formed as an English public limited company in November 2006 to serve as a holding company for the assets previously held by our predecessor, Edgen/Murray, L.P. and to serve as the issuer in this offering. Substantially all the directly held assets of Edgen/Murray, L.P. were the shares of common stock of Edgen and the ordinary shares of PAL, an English company organized by JCP and certain members of Edgen and MIM Ltd. management to effect the acquisition of MIM Ltd.
Edgen was founded in 1983 as Thomas Pipe and Steel, Inc. in Baton Rouge, Louisiana and was acquired in 1996 by an investor group. Following its acquisition in 1996, Edgen rapidly grew its business in the United States, expanding from a single location distribution business with a limited product offering, into a leading distributor with multiple distribution facilities and a broad product offering including alloy pipe and carbon and alloy fittings and flanges, and high grade, structural steel products including sections, plates and tubulars.
In February 2005, all of the outstanding equity interests in Edgen were acquired by certain members of Edgen management and JCP, a New York-based private equity investment firm. In December 2005, Edgen's shareholders organized a new holding company, Edgen/Murray, L.P. to hold all of the outstanding equity interests of Edgen and PAL. On December 16, 2005, Edgen/Murray, L.P. through its subsidiaries, acquired MIM Ltd. and its subsidiaries.
MIM Ltd. was founded in 1976 in Edinburgh, Scotland to supply the developing offshore oil and gas industry with high grade steel products, in particular oil and gas infrastructure projects located in the extreme environmental conditions of the North Sea. Following its founding in 1976, MIM Ltd. grew its business into a leading global distributor of high grade steel products supplying primarily the offshore oil and gas industry in several geographical markets worldwide, including the Caspian Sea region, West Africa, Asia/Pacific and the Middle East. MIM Ltd. achieved this growth through greenfield start-up distribution centers and by expanding its distribution capabilities worldwide through branch offices, representative offices and agencies.
Geographical markets
We operate as a single global business and organize our operations into four geographical markets.
Americas. Our Americas operations are headquartered in Baton Rouge, Louisiana and distribute alloy and carbon-based specialty pipes, fittings and flanges. Our alloy products are principally used in high-pressure, extreme temperature and high-corrosion applications such as in heating, desulphurization, refrigeration and liquefied natural gas units in the processing and refining industries,
70
and in heat recovery steam generation units in the power generation industry. Our carbon-based specialty pipes, fittings and flanges are principally used in applications that require high-yield, high-tensile materials such as the gathering and transmission of oil, natural gas and phosphates and conductor casing. Our carbon products distributed in the Americas also include high yield and special grade structural steel, primarily high grade steel tubes, plates and sections, used in the construction of offshore drilling oil and gas infrastructure, drilling and production platforms and wellheads used in oil and gas projects.
Our Americas operations operate through a network of 17 locations, including 15 in the United States and two in Canada. We also have a sales agency arrangement in Rio de Janeiro, Brazil. We currently stock inventory for distribution at 13 of our locations in the Americas. Sales for the Americas region (reflected in our Americas—Carbon and Americas—Alloy segments) were 55% of total sales for the six months ended June 30, 2006.
Europe/West Africa. MIM Ltd. opened its first purpose built facility in Newbridge, Scotland in 1982 and has added further warehousing and office accommodation over the years to satisfy the increasing demand for its products. From our location in Newbridge, Scotland we coordinate our business activities for our sales in Europe, the Caspian Sea region and West Africa. We further have a sales office in Darlington, England, which is responsible for all our customers located within the English geographical area, but excluding London-based customers who are served from our Newbridge, Scotland facility. As part of our strategy to serve the Caspian Sea region, we have entered into a stocking arrangement in Baku, Azerbaijan in connection with a consignment sale arrangement with one of our customers. We primarily distribute high performance steel long products, plates, seamless and welded pipe to the energy infrastructure market, in the Europe, Caspian Sea and West Africa regions. Our vendors are manufacturers of high performance steel products.
Sales for the Europe/West Africa region (reflected in our UK segment) were 24% of total sales for the six months ended June 30, 2006.
Asia/Pacific. We opened a representative office in Singapore in 1992 in response to the demands of our existing customers. In 1997, we converted our Singapore representative office into a branch office, and thereafter established our Singapore operations as a separate operating subsidiary in 2002. In June 2005, we opened a new stocking facility in Tuas, Singapore. In addition to our facilities in Singapore, we have a sales office in Perth, Australia and agency relationships in Brunei, China, Indonesia, New Zealand, South Korea and Vietnam. Our customers in this region are primarily servicing the global energy infrastructure market. Our vendors are manufacturers of high performance steel products.
Sales for the Asia/Pacific region (reflected in our Singapore segment) were 12% of total sales for the six months ended June 30, 2006.
Middle East. MIM Ltd. opened its office in the United Arab Emirates in 1984, originally establishing its base in Sharjah to target the oil and gas industry in the Middle East, and in 1999 established a facility in the Jebel Ali Free Zone in Dubai, United Arab Emirates. From our locations in the United Arab Emirates we coordinate our business activities for our sales in the Persian Gulf region, the wider Middle East and South Asia. Our facility in the Jebel Ali Free Zone, Dubai largely services our business in this region outside of the United Arab Emirates as it has the advantage of duty free sales on export-bound products. Sales within the United Arab Emirates are subject to duty and are typically channeled through our Sharjah branch. In addition, we have agency relationships in Abu Dhabi, Qatar and Saudi Arabia. Our customers in this region are primarily servicing the global energy infrastructure market.
71
Sales for the Middle East region (reflected in our UAE segment) were 10% of total sales for the six months ended June 30, 2006.
Products
We distribute high-performance steel products for use primarily in specialized applications in the energy infrastructure market. These products are generally highly engineered prime carbon or alloy steel pipe, pipe components and high grade structural sections and plates which are designed to withstand the effects of corrosive on abrasive materials and possess performance characteristics required in extreme operating conditions, including high pressure and high/low temperature environments. Our products are used in refining, petrochemical, power generation, mechanical construction, offshore production, platform construction and certain specific oil and gas applications. They are used for maintenance and repair projects, expansions of infrastructure and development projects. We offer our customers a broad product offering, which includes over 44,000 SKUs, and manage a large inventory of components and more than 100,000 tons of pipes, plates and sections, allowing us to supply products that are not generally otherwise available to our customers on a quick-response basis.
We principally distribute two categories of products: alloy products and carbon products.
- •
- Alloy steel is composed of iron, carbon and one or more other elements (such as chromium, cobalt, nickel, molybdenum) that undergo a special heat treatment to achieve specific physical properties. The alloy products we sell are principally used in high-pressure, extreme temperature and high-corrosion applications, such as in heating, desulphurization, refrigeration and liquefied natural gas units in the processing and refining industries, and in heat recovery steam generation units in the power generation industry. Substantially all of our alloy products are purchased from manufacturers located in Germany, Italy, South Korea or Japan.
- •
- Our carbon-based specialty pipe, fittings and flanges products are principally used in high-yield, high-tensile, abrasive applications such as the gathering and transmission of oil, natural gas and phosphates, conductor casing and structural supports for the offshore drilling and production segment of the oil and gas industry. Our carbon products are purchased from manufacturers located worldwide, including the United States.
We also offer a wide range of cutting and finishing services for our products primarily through third-party service providers.
72
Summary of primary products
|
Product
| | Characteristics
| | Material
| | Qualities
| | Primary Applications
|
|---|
|
|---|
| Alloy products | | | | | | | | |
Stainless |
|
Seamless |
|
12-16% chromium,
8-12% nickel |
|
Corrosion resistance |
|
Refining, petrochemical and power |
| Duplex | | Seamless | | 20% chromium | | Higher corrosion resistance | | Refining, petrochemical and power |
| ChromeMoly | | Seamless | | Chromium and molybdenum | | High temperature and pressure tolerance | | Refining, petrochemical and power |
| Nickel alloys | | Seamless | | High nickel | | High temperature and highest corrosion resistance | | Refining, petrochemical and power |
| Carbon products | | | | | | | | |
| Carbon | | Welded and seamless | | < 1% carbon | | High and low pressure tolerance | | Mechanical construction, certain processing |
| Large diameter carbon | | Welded, thicker walled | | < 1% carbon | | High structural strength | | Offshore jacket and topside and onshore structural, marine riser and conductor, booster line and annulus pipe |
| High yield carbon | | Welded or seamless, thinner walled | | Carbon and alloys | | Lighter weight, high bursting strength | | Gathering and transmission pipelines |
| Section | | Seamless and welded | | Carbon | | High yield and various thickness, lengths and widths | | Offshore topside and onshore structural |
| Plate | | Hot-rolled | | Carbon | | High yield and various thickness, lengths and widths | | Offshore jacket and topside and onshore structural |
|
Customer support
Complete procurement and project management solutions. The orders placed by our customers require that we supply a full range of products. Accordingly, we have developed and are able to provide complete procurement solutions to our customers. We believe that the management of product procurement for complex projects is of significant value to our customers, particularly where the range of products required is beyond the scope of one or more distributors or manufacturers. We further believe the benefits to our customers of placing a single purchase order covering a full range of products required for a project are significant in both commercial and logistics terms.
An integral component of our ability to deliver complete procurement solutions to our customers is the integration of stock and mill supply sources and, given the significant levels of stock available to us, we can fulfill all our customers' requirements through a combination of mill rollings and immediate stock supply. We also offer a wide range of cutting and finishing services primarily through third party service providers. This integrated approach both maximizes material availabilities in terms of real fabrication site needs while retaining optimum project cost controls.
Maintenance and repair operations. Our business model allows us to meet the project requirements of our clients and the ongoing maintenance and repair operations of their installed facilities. Our large inventory of specialized steel products in strategic global locations can provide the immediate just-in-time delivery of solutions that fit our customer's requirements. We maintain the ability to access inventories globally allowing our offices to ship from any of our locations.
73
Logistics. Project management support and the rapid just-in-time delivery of maintenance and repair components require coordinated shipping expertise. Each of our Americas, Europe/West Africa, Asia/Pacific and Middle East geographical markets include specialized logistic units which ensure that contracts and quick-ship maintenance and repair requirements are fulfilled to our customer's expectations.
Customers
We have a diverse base of over 2,750 customers from a variety of geographic locations and industries. Our customers are generally large, well capitalized companies who are recognized as leaders in their respective industries. Our customers include engineering and construction firms, equipment fabricators, multi-national major integrated oil and gas companies, independent oil and gas companies, natural gas transmission and distribution companies, petrochemical companies, mining companies, oil sands developers, power generation companies and utilities, alternative energy providers, and certain integrated MRO distribution companies. For the six months ended June 30, 2006, our top ten customers accounted for approximately 35% of our total sales.
Sales and marketing
Our sales force operates under a regional branch model. The regional managers employ a mix of district managers and inside and outside sales representatives in their respective territories. The sales representatives are located at various branch locations and are responsible for order solicitation, account and relationship management and market development. The regional managers have responsibility for pricing, order placement and fulfillment, customer service, business development and marketing strategies. In select markets, we contract with agents to market and sell our products. Where agents are used, negotiation and agreement on sales terms is managed by the respective regional manager. Regional managers report to geographic market presidents/directors who have final authority on all sales and marketing issues. The regional branch model allows the president to have direct control over the management and implementation of our sales and marketing strategy.
The sales force is assisted by a product management team that is responsible for procurement, pricing, product forecasting and vendor development. These teams are organized in a fashion that supports the Regional Managers in their sales efforts.
Vendors
We have mutually beneficial, longstanding relationships with an established network of vendors. This network of vendor relationships enables us to stock and distribute a considerable breadth of products. For the six months ended June 30, 2006, approximately 45% of our purchases were from our top ten vendors. Consolidating our purchasing power has resulted in favored status with certain of our vendors in regard to lead times, discounts and payment terms. As we continue to strengthen our vendor relationships, we are able to devote increased resources to providing our customers with products that are of greater importance to their business and have fewer substitutes. Although we concentrate our purchasing power on a select group of highly valued vendors, we have multiple sources for the products we distribute and are not dependent on any single vendor.
We are a volume purchaser of high specialty steel products and provide significant value-added support as an intermediary between high grade steel manufacturing vendors and end-users. There are a limited number of vendors with the capabilities to produce these steel products, and we believe that we have demonstrated to our vendors over time that we are a high quality, reliable and high-volume purchaser of their products. In addition, our significant participation in large long-term projects enables us to plan our purchases and provides our vendors with critical visibility to schedule their production. As a result
74
we have developed strong, longstanding relationships with an established network of steel manufacturing vendors that we believe would be difficult for others to replicate.
We use general economic indicators, inquiries, orders and continuous interaction with our customers to help us determine customer usage patterns, expected delivery dates and the nature of active projects in the market. Our company-wide management information system assists in evaluating historical usage, the inventory at each of our locations, and other purchasing data.
Intellectual property
We have common law trademark rights to a number of names and marks important to our business, including Edgen™, Bartow Steel™, Resource Pipe Co.™, SISCO™, Thomas Pipe™, Pro Metals™, and Radnor Alloys™, although we have not obtained federal registrations for them.
Employees
As of September 30, 2006, our workforce consisted of 377 full-time employees, of whom 124 are sales personnel who have an average of more than 15 years of industry experience. As of September 30, 2006, we employ 258 employees in the Americas geographic markets, 65 employees in the Europe/West Africa geographic markets, 34 employees in the Middle East geographic markets and 20 employees in the Asia/Pacific geographic markets. We are not a party to any collective bargaining agreements, and we consider our relations with our employees to be good.
Competition
Our products are sold in highly competitive markets. Companies in the markets in which we operate compete primarily on price and ability to deliver products in a timely manner. Purchase decisions are also influenced by previous experience with a particular distributor and a distributor's ability to supply the full range of pipes, pipe components, tubes, plates and sections. We have numerous competitors who compete with us for customers as well as approved vendor sources in the distribution of high grade steel products and alloy and carbon specialty products. We believe that none of our competitors offer the depth and breadth of products in stock that we offer in any particular market, although we have competitors with respect to many of the specific products we offer in specific markets, who may be larger and have greater resources than we do.
Properties
Through our subsidiary and branch offices, we currently own or lease facilities in seven countries: United States, Canada, United Kingdom, Dubai, UAE, Singapore and Australia. 17 of our facilities provide stocking facilities, including 12 stocking facilities in the United States; two stocking facilities in the United Kingdom (one facility in Newbridge, Scotland; one facility in Kirknewton, Scotland); one facility in Edmonton, Canada; one facility in the United Arab Emirates (Jebel Ali Free Zone, Dubai) and one facility in Singapore (Tuas, Singapore). In addition, currently four of our facilities are sales facilities only, including sales facilities in: Darlington, England; Calgary, Canada; Perth, Australia; and Houston, Texas. We also have a stocking facility at one of our customer's location in Baku, Azerbaijan, Azerbaiza.
We use agents in Abu Dhabi, Brazil, Brunei, China, India, Indonesia, New Zealand, Qatar, Saudi Arabia, South Korea and Vietnam whose properties are neither owned nor leased by us. We have a branch office in Sharjah, United Arab Emirates which has no permanent physical presence. We lease residential premises as staff accommodations in the UAE.
The following table provides a summary of our facilities.
75
Summary of leased and owned facilities
|
Location
| | Building
(sq. ft.)
| | Lease/Own
| | Facility description
|
|---|
|
| Americas | | | | | | |
| Baton Rouge, Louisiana | | 14,497 | | Lease | | Office/Warehouse |
| Baton Rouge, Louisiana | | 7,560 | | Lease | | Office/Warehouse |
| Charlotte, North Carolina | | 12,550 | | Lease | | Office/Warehouse/Yard |
| Calgary, Alberta | | 425 | | Lease | | Office |
| Edmonton, Alberta | | 16,078 | | Lease | | Office/Warehouse |
| Edmonton, Alberta | | 19,426 | | Lease | | Warehouse |
| Henderson, Colorado | | 2,500 | | Lease | | Office/Warehouse/Yard |
| Houston, Texas | | 51,000 | | Lease | | Office/Warehouse/Yard |
| Houston, Texas | | 2,010 | | Lease | | Office |
| Houston, Texas | | 17,750 | | Lease | | Office/Warehouse/Yard |
| Irwindale, California | | 8,692 | | Lease | | Office/Warehouse |
| Mulberry, Florida | | 46,816 | | Own | | Office/Warehouse/Yard |
| Odessa, Texas | | 5,000 | | Lease | | Office/Warehouse/Yard |
| Port Allen, Louisiana | | 9,500 | | Own | | Office/Warehouse/Yard |
| St. Charles, Illinois | | 22,000 | | Lease | | Office/Warehouse |
| St. Louis, Missouri | | 2,800 | | Lease | | Office/Yard |
| Westchester, Pennsylvania | | 16,000 | | Lease | | Office/Warehouse |
United Kingdom |
|
|
|
|
|
|
| Darlington, England | | less than 2,000 | | Own | | Office |
| Kirknewton, Scotland | | N/A | | Own | | Yard |
| Newbridge, Scotland | | 210,000 | | Lease | | Office/Warehouse/Yard |
Asia/Pacific |
|
|
|
|
|
|
| Perth, Australia | | less than 2,000 | | Lease | | Office |
| Tuas, Singapore | | 71,687 | | Lease | | Office/Warehouse |
Middle East |
|
|
|
|
|
|
| Jebel Ali, Dubai, UAE | | 2,660 | | Lease | | Office/Yard |
|
Information technology
During 2003, we integrated our information technology infrastructure for our Americas geographic market by implementing a company-wide management information system. This system makes it possible for us to centrally manage the purchasing, accounts payable, accounts receivable, and inventory for the entire company from a single location. This integrated system allows a complete sharing of information within our Americas geographic market, and positioned us to improve profitability through continued operational efficiencies, enhanced information flow, and the capacity to accommodate continued growth. During 2006, the Western Flow and MIM US businesses were fully integrated into this management information system.
The business applications for our Europe/West Africa, Asia/Pacific and Middle East geographic markets are on servers which are controlled and managed at our leased facility in Newbridge, Edinburgh. These systems include applications dedicated to sales and marketing, finance and administration, budgeting and reporting and inventory management. We rely on two key business software packages: one is an integrated mid-range financial package for general business matters that has a consistent chart of accounts of all of our entities and the other is a bespoke application that functions as our stock management system.
76
Legal proceedings
We are from time to time a party to various claims and legal proceedings related to our business. There are no current material claims or legal proceedings pending against us that, in the opinion of our management, individually or in the aggregate, if determined adversely to us, would have a material adverse effect on our business, financial condition, results of operations or liquidity. Additionally, management is not aware of any legal issues that may have an adverse effect on us in the foreseeable future.
Environmental matters
Our operations are subject to various laws and regulations relating to environmental concerns. As with other companies engaged in like businesses, the nature of our operations expose us to the risk of liabilities or claims with respect to environmental matters, including those relating to the disposal and release of hazardous substances. In addition, our operations are also governed by laws and regulations relating to workplace safety and worker health which, among other things, regulate employee exposure to hazardous chemicals in the workplace. Management believes that our operations are in substantial compliance with such laws and regulations applicable to us.
We have not made any material expenditures during the last three fiscal years in order to comply with environmental laws or regulations. Based on our experience to date, we believe that the future cost of compliance with existing environmental laws and regulations (and liability for known environmental conditions) will not have a material adverse effect on our business, consolidated financial condition, results of operations or liquidity. However, we cannot predict what environmental or health and safety legislation or regulations will be enacted in the future or how existing or future laws or regulations will be enforced, administered or interpreted, nor can we predict the amount of future expenditures that may be required in order to comply with such environmental or health and safety laws or regulations or to respond to such environmental claims.
Seasonality
Some of our customers are in seasonal businesses, especially those customers who purchase our products for use in new capital expenditure projects at refineries, oil and gas infrastructure, and processing and power generation plants. As a consequence, our results of operations and working capital, including our accounts receivable, inventory and accounts payable, may fluctuate during the year. However, because of our geographic, product and customer diversity, our operations have not shown any material seasonal trends. We believe that our significant operations around the world moderate our seasonality. In addition, our sales to MRO distributors, who tend not to be seasonal purchasers, mitigate the overall effects of seasonality on our business. Sales in the months of November and December traditionally have been lower than in other months because of a reduced number of working days for shipments of our products and holiday closures for some of our customers. We cannot assure you that period-to-period fluctuations will not occur in the future. Results of any one or more quarters are, therefore, not necessarily indicative of annual results.
Working capital practices
Volatility in the specialty pipe, pipe components, and high grade structural steel industry and the price of high grade steel tubes, plates and sections used in the offshore oil and gas industry, from time to time, can result in significant fluctuations in cash flow supporting our working capital levels. Inventory and accounts receivable comprise a large percentage of our total assets and can vary significantly from quarter to quarter. At June 30, 2006 and December 31, 2005, inventory and accounts receivable represented approximately 51% and 47%, respectively, of total assets excluding cash. See "Management's discussion and analysis of financial condition and results of operations—Liquidity and capital resources."
77
Management
Directors and senior management
The following table sets forth the names, ages and titles, as well as a brief account of the business experience, as of the date of this prospectus, of the members of our board of directors and our senior management:
|
Name
| | Age
| | Position
|
|---|
|
| Daniel J. O'Leary | | 51 | | Chairman, President, Chief Executive Officer and Director |
| David L. Laxton, III | | 56 | | Executive Vice President and Chief Financial Officer |
| Robert L. Gilleland | | 65 | | President—Edgen Alloy Products Group L.L.C. |
| Craig S. Kiefer | | 52 | | President—Edgen Carbon Products Group L.L.C. |
| Kenneth A. Cockburn | | 53 | | Managing Director, Murray International Metals Ltd. |
| Nicholas Daraviras | | 33 | | Director |
| James L. Luikart | | 61 | | Director |
| Edward J. DiPaolo | | 53 | | Director |
|
Daniel J. O'Leary, Chairman, President, Chief Executive Officer and Director, has been involved in the steel pipe and distribution industries for 28 years. Mr. O'Leary was appointed to our board of directors on November 2, 2006 and Chairman, President and Chief Executive Officer on November 9, 2006. Prior to these appointments, Mr. O' Leary served as the President and Chief Executive Officer of Edgen since August 2003 and as a member of Edgen's board of directors since February 2005. Prior to joining Edgen, Mr. O'Leary served as President and Chief Operating Officer of Stupp Corporation, an independent manufacturer of electric-resistance welded custom steel line pipe, from 1999 to 2002. Prior to joining Stupp Corporation, he was Executive Vice-President and Chief Operating Officer of Maverick Tube Corporation, a pipe manufacturing company. He has also held management and executive positions with Red Man Pipe & Supply Company and Lone Star Steel Company. Mr. O'Leary is a former Vice-Chairman of the Committee on Pipe and Tube Imports and a member of the National Association of Steel Pipe Distributors. Mr. O'Leary is a graduate of the University of Tulsa with a B.S. in Education.
David L. Laxton, III, Executive Vice President and Chief Financial Officer, has more than 20 years experience in industrial distribution. Mr. Laxton was appointed as our Executive Vice President and Chief Financial Officer on November 9, 2006. Prior to these appointments, Mr. Laxton served as the Executive Vice President and Chief Financial Officer of Edgen since joining in 1996. Mr. Laxton was appointed as a director of Edgen in August 2005. Prior to joining Edgen, Mr. Laxton served as Chief Financial Officer of a distributor of tube fittings, controls and filtration products from January 1991 to December 1996. Mr. Laxton has also held consulting positions with a big four accounting firm and with an investment banking firm. Mr. Laxton is currently Vice Chairman of American Gateway Bank and is the former president of the Baton Rouge Chapter of the National Association of Purchasing Management. Mr. Laxton is a member of the Advisory Committee to the School of Accounting at Louisiana State University. Mr. Laxton received a B.A. in History and an M.S. in Accounting from Louisiana State University.
Robert L. Gilleland, President—Edgen Alloy Products Group L.L.C., has over 30 years of experience in the pipe and steel industry. Mr. Gilleland joined Edgen in 1998 as Senior Vice President and General
78
Manager and was promoted to President of Edgen's Alloy Products Group in September 2003. Prior to joining Edgen, Mr. Gilleland was employed with LaBarge Pipe & Steel Company for 16 years. He was Executive Vice President and part owner in a leveraged buy-out of LaBarge Pipe & Steel Company in 1982. At LaBarge Pipe & Steel Company, Mr. Gilleland was responsible, for inventory, purchasing and sales activities. Prior to joining LaBarge Pipe & Steel Company Mr. Gilleland was employed with Edgcomb Metals Company, a subsidiary of Williams Companies, for 18 years. He holds a B.S. in Business Administration from Western Kentucky University.
Craig S. Kiefer, President—Edgen Carbon Products Group, L.L.C., has more than 30 years of experience in the industrial distribution market and manages our Americas geographical market. Mr. Kiefer joined Edgen in April 2002 as the President of Service Industrial Supply Co. (SISCO). He was promoted to President of Edgen's Carbon Products Group in March 2003. Prior to joining Edgen, Mr. Kiefer was President and Chief Executive Officer of SISCO, which he formed in 1979 and which was acquired by Edgen in 2002.
Kenneth A. Cockburn, Managing Director, Murray International Metals Limited, has been involved in the steel pipe and distribution industries for 28 years and manages our Europe/West Africa, Asia/Pacific and Middle East geographical markets. Mr. Cockburn joined MIM Ltd. in 1977 and was appointed to MIM Ltd.'s board of directors in 1986. Mr. Cockburn was promoted to Managing Director of MIM Ltd. in 1991.
Nicholas Daraviras, Director, was appointed to our board of directors on November 2, 2006 and has previously served on the board of directors of Edgen since February, 2005 and MIM Ltd. since December, 2005. Mr. Daraviras is a Managing Director of JCP. He joined JCP in 1996. Mr. Daraviras also serves as a director of The Sheridan Group and various private companies in which JCP also has an interest. Mr. Daraviras received his B.S. and an M.B.A. from The Wharton School of the University of Pennsylvania.
James L. Luikart, Director, was appointed to our board of directors on November 2, 2006 and had previously served on the board of directors of Edgen since February, 2005 and MIM Ltd. since December, 2005. Mr. Luikart is Executive Vice President of JCP. Mr. Luikart joined JCP in 1995 after spending over twenty years with Citicorp, the last seven years of which were as Vice President of Citicorp Venture Capital, Ltd. Mr. Luikart also serves as a director of The Sheridan Group, W&T Offshore, Inc., and various private companies in which JCP also has an interest. Mr. Luikart received a B.A. in History magna cum laude from Yale University and an M.I.A. from Columbia University.
Edward J. DiPaolo, Director, was appointed to our board of directors on November 2, 2006 and had previously served on the board of directors of Edgen from June, 2001 until December 2004. Mr. DiPaolo has over 26 years in energy services through his employment with Halliburton Energy Services where he held several positions including Group Senior Vice President Global Business Development and Senior Vice President Global Business Development. In 2002, Mr. DiPaolo retired from Halliburton Energy Services. Mr. DiPaolo currently serves as a director of Natural Gas Systems, Inc., Boots & Coots International Well Control, Inc. and Innicor Subsurface Technologies Inc. and has served as a director for various privately held companies. Mr. DiPaolo received a B.S. in Agricultural Engineering from West Virginia University.
Composition of our board of directors
Our directors are elected at each annual general meeting of our shareholders and serve until their successors are elected or appointed, unless their office is earlier vacated. Our articles currently provide that the number of directors may be determined by our shareholders by ordinary resolution at general meetings and, in default of such determination, there is a minimum number of two directors and no
79
maximum; provided that, additional directors may be appointed at general meetings of our shareholders or by the directors.
We expect to amend our articles, including the provisions relating to size and election of our board of directors, and intend to appoint additional independent directors within 12 months following this offering.
Committees of the board of directors
We anticipate that, prior to this offering, our board of directors will establish an audit committee, a compensation committee and a corporate governance and nominating committee, and our board of directors intends to adopt new charters for its committees that comply with current federal and NYSE rules relating to corporate governance matters. Following the closing of this offering, we intend to make copies of the committee charters as well as our corporate governance guidelines and our code of ethics, available on our website.
Audit Committee
Our audit committee will be responsible for overseeing our financial reporting processes on behalf of our board of directors. Our independent registered public accounting firm will report directly to our audit committee. Specific responsibilities of our audit committee will include:
- •
- evaluating the performance, and assessing the qualifications, of our independent registered public accounting firm and recommending to our board of directors the appointment of, and compensation for, our independent registered public accounting firm for the purpose of preparing or issuing a registered public accounting firm report or performing other audit, review or attest services;
- •
- subject to the appointment of our independent registered public accounting firm by our shareholders, determining and approving the engagement of, and compensation to be paid to, our independent registered public accounting firm;
- •
- determining and approving the engagement, prior to the commencement of such engagement, of, and compensation for, our independent registered public accounting firm to perform any proposed permissible non-audit services;
- •
- reviewing our financial statements and management's discussion and analysis of financial condition and results of operations and recommending to our board of directors whether or not such financial statements and management's discussion and analysis of financial condition and results of operations should be approved by our board of directors;
- •
- conferring with our independent registered public accounting firm and with our management regarding the scope, adequacy and effectiveness of internal control over financial reporting in effect;
- •
- establishing procedures for the receipt, retention and treatment of complaints received by us regarding accounting, internal accounting controls or auditing matters and the confidential and anonymous submission by our employees of concerns regarding questionable accounting or auditing matters;
- •
- reviewing and discussing with our management and independent registered public accounting firm, as appropriate, our guidelines and policies with respect to risk assessment and risk management, including our major financial risk exposures and investment and hedging policies and the steps taken by our management to monitor and control these exposures; and
- •
- reviewing our compliance with environmental, health and safety and other laws and regulations that may have an impact on our financial results.
80
Compensation Committee
Specific responsibilities of our compensation committee will include:
- •
- reviewing and making recommendations to our board of directors with respect to our senior management in relation to their:
- •
- annual base salary;
- •
- annual incentive bonus, including the specific goals and amount;
- •
- equity compensation;
- •
- employment agreements, severance arrangements and change in control agreements/provisions; and
- •
- other benefits, compensations, compensation policies or arrangements;
- •
- reviewing and making recommendations to our board of directors regarding general compensation goals and guidelines for employees and the criteria by which bonuses to employees are determined;
- •
- overseeing management succession planning;
- •
- preparing any report on compensation to be included in our periodic filings or proxy statement; and
- •
- acting as administrator of our amended equity incentive plan and determining its use, from time to time, as a form of incentive compensation for those entitled to receive grants of stock options and other benefits under that plan.
Corporate Governance and Nominating Committee
Specific responsibilities of our corporate governance and nominating committee will include:
- •
- reviewing board structure, composition and practices, and making recommendations on these matters to our board of directors;
- •
- reviewing, soliciting and making recommendations to our board of directors and shareholders with respect to candidates for election to the board;
- •
- reviewing the compensation payable to board and committee members and providing recommendations to our board of directors in regard thereto; and
- •
- developing and reviewing a set of corporate governance principles for our company.
Director compensation
Our policy is not to pay director compensation to directors who are also our employees. We anticipate that each outside director will enter into compensation arrangements to be determined. One of our directors, Mr. DiPaolo, receives director fees as a director of Edgen. Edgen pays Mr. DiPaolo $20,000 in director fees annually. For the period February 1, 2005 to December 31, 2005 Edgen paid Mr. DiPaolo $10,000 in director fees and on December 16, 2005 Edgen/Murray, L.P. granted Mr. DiPaolo restricted common partnership units with a fair value of approximately $60,400 for services rendered as a board member and audit committee member of Edgen. We expect to enter into similar arrangements with Mr. DiPaolo in connection with his directorship of Edgen Murray Plc. All of our directors are entitled to receive reimbursement of their out-of-pocket expenses in connection with their travel to and attendance at meetings of the board of directors or committees thereof.
81
Management compensation
The following table sets forth certain information with respect to annual compensation for services in all capacities for the combined twelve months ended December, 31 2005 paid to each member of our senior management.
Summary compensation table
|
| |
| |
| |
| |
| | Long-term compensation
| |
|
|---|
| |
| | Annual compensation
| |
| |
|
|---|
Name and principal position
| |
| | Special
Bonus(2)
| | Restricted common
partnership units awards(3)
| | All other
compensation(4)
|
|---|
| | Year
| | Salary
| | Bonus(1)
|
|---|
|
Daniel J. O'Leary
Chairman, President and Chief Executive Officer | | 2005 | | $ | 290,800 | | $ | 332,981 | | $ | 2,210,000 | | $ | 566,884 | | $ | 2,665 |
David L. Laxton, III
Executive Vice President and Chief Financial Officer | | 2005 | | $ | 237,901 | | $ | 216,0000 | | $ | 1,100,00 | | $ | 242,947 | | $ | 1,460 |
Robert L. Gilleland
President—Edgen Alloy Products Group L.L.C. | | 2005 | | $ | 227,563 | | $ | 216,000 | | $ | 420,000 | | $ | 161,969 | | $ | 3,050 |
Craig S. Kiefer
President—Edgen Carbon Products Group L.L.C. | | 2005 | | $ | 196,806 | | $ | 192,000 | | $ | 370,000 | | $ | 161,969 | | $ | 3,485 |
Kenneth A. Cockburn
Managing Director—Murray International Metals Ltd. | | 2005 | | $ | 406,709 | | $ | 61,629 | | $ | — | | $ | 289,920 | | $ | 1,277,794 |
|
- (1)
- Includes bonuses under employee bonus plans, employment agreements and additional bonus award for Mr. O'Leary in 2005. See "—Employment agreements," and "—Employee incentive and bonus plan," below.
- (2)
- Includes bonuses awarded under the transaction fee agreement, value bonus compensation and senior management bonuses paid in connection with the Buy-out Transaction. See "Certain relationships and related transactions—Other relationships and related party transactions—Transaction fee agreement," and "—Value bonus compensation."
- (3)
- As of December 31, 2005, the aggregate number and value of the restricted common partnership units of Edgen/Murray, L.P. held by our named senior management was: Mr. O'Leary 93,855 units/$566,884; Mr. Laxton 40,223 units/$242,947; Mr. Gilleland 26,816 units/$161,969; Mr. Kiefer 26,816 units/$161,969; and Mr. Cockburn 48,000 units/$289,920 which were granted to Mr. Cockburn in 2006. In February 2006, Mr. O'Leary was granted 17,493 restricted common partnership units/$105,658 and Mr. Laxton was granted 11,662 restricted common partnership units/$70,438. These restricted common partnerships units of Edgen/Murray, L.P. will not be exchanged for ordinary shares in connection with the Contribution and will remain outstanding and represent the indirect right to receive our ordinary shares held by Edgen/Murray, L.P.
- (4)
- Represents the dollar value of any premiums paid by, or on behalf of, Edgen Murray Plc during the covered fiscal year with respect to term life insurance for the benefit of the named executive officer and club membership allowances for all employees as indicated, except for Mr. Cockburn. Mr. Cockburn's other compensation includes amounts paid related to pension costs, including the under funding of his pension plan relating to his previous employment by Murray International Holdings Limited ("MIH") and MIM Ltd., an auto allowance and certain medical and disability insurance premiums.
82
Employment agreements
Either we or one of our subsidiaries has entered into an employment agreement with each of our executive officers, Mr. O'Leary, Mr. Laxton, Mr. Gilleland, Mr. Kiefer and Mr. Cockburn. We anticipate that either the employment agreements with Mr. O'Leary and Mr. Laxton will be assigned to us by our subsidiary Edgen or we will enter into employment agreements with Messrs. O' Leary and Laxton.
The employment agreement with Mr. O'Leary provides that he will be employed as Edgen's President and Chief Executive Officer and is for a three year term with automatic one year extensions. Mr. O'Leary is entitled to a current base salary of $275,000 which may be increased by the Board of Directors. Beginning in January 2007, Mr. O'Leary will be entitled to an annual base salary of $425,000. He is also entitled to an annual bonus based on a targeted EBITDA amount, as determined by Edgen's board of directors, which is subject to a downward working capital adjustment. The target bonus for 2005 was up to 100% of Mr. O'Leary's salary. The target bonus for 2007 may be up to 100% of his 2007 annual base salary. Mr. O'Leary is also entitled to a supplemental annual payment of $9,500, four weeks vacation and an automobile allowance. Additionally, Edgen is obligated to pay premiums for term life insurance on Mr. O'Leary's life. The employment agreement may be terminated by us for Mr. O'Leary's disability, for cause (as defined in the agreement), or for any reason other than cause (with severance, payable upon termination other than for cause, for an amount equal to Mr. O'Leary's annual base salary for one year, plus the his full or pro-rata share of the annual bonus, if any).
The employment agreement with Mr. Laxton provides that he will be employed as Edgen's Chief Financial Officer and Executive Vice President and is for a three year term with automatic one year extensions. Mr. Laxton is entitled to a current base salary of $225,000 which may be increased by the Board of Directors. Beginning in January 2007, Mr. Laxton will be entitled to an annual base salary of $325,000. He is also entitled to an annual bonus based on a targeted EBITDA amount, as determined by Edgen's board of directors, which is subject to a downward working capital adjustment. The target bonus for 2005 was up to 100% of Mr. Laxton's salary. The target bonus for 2007 may be up to 100% of his annual base salary. Mr. Laxton is also entitled to a supplemental annual payment of $7,500, four weeks vacation and an automobile allowance. Additionally, Edgen is obligated to pay premiums for term life insurance on Mr. Laxton's life. The employment agreement may be terminated by us on substantially the same basis as detailed in the description of Mr. O'Leary's employment agreement.
The employment agreement with Mr. Gilleland provides that he will be employed as Edgen's President and is for a one year term with automatic one year extensions. Mr. Gilleland is entitled to a current base salary of $210,017 which may be increased by the Board of Directors. Beginning in January 2007, Mr. Gilleland will be entitled to an annual base salary of $240,000. He is also entitled to an annual bonus based on a targeted EBITDA amount, as determined by Edgen's board of directors, which is subject to a downward working capital adjustment. The target bonus for 2005 was up to 100% of Mr. Gilleland's salary. The target bonus for 2007 may be up to 100% of his annual base salary. Mr. Gilleland is also entitled to four weeks vacation and an automobile allowance. The employment agreement may be terminated by us on substantially the same basis as detailed in the description of Mr. O'Leary's employment agreement.
The employment agreement with Mr. Kiefer provides that he will be employed as Edgen's President and is for a one year term with automatic one year extensions. Mr. Kiefer is entitled to a current base salary of $180,000 which may be increased by the Board of Directors. Beginning in January 2007, Mr. Kiefer will be entitled to an annual base salary of $240,000. He is also entitled to an annual bonus based on a targeted EBITDA amount, as determined by Edgen's board of directors, which is subject to a downward working capital adjustment. The target bonus for 2005 was up to 100% of Mr. Kiefer's
83
salary. The target bonus for 2007 may be up to 100% of his annual base salary. Mr. Kiefer is also entitled to four weeks vacation and an automobile allowance. The employment agreement may be terminated by us on substantially the same basis as detailed in the description of Mr. O'Leary's employment agreement.
The employment agreement with Mr. Cockburn provides that he will be employed as MIM Ltd.'s Managing Director and provides for his employment until he reaches the age of 65. Mr. Cockburn is entitled to a current base salary of £334,600 which may be increased by the Board of Directors. He is also entitled to an annual bonus based on the discretion of the board of directors of MIM Ltd. Mr. Cockburn is also entitled to seven weeks vacation. The employment agreement may be terminated by us for Mr. Cockburn's disability, for cause, or for any reason other than cause (with severance, payable upon termination other than for cause, for an amount equal to Mr. Cockburn's annual base salary for the remaining term under the agreement, plus the his full or pro-rata share of the annual bonus, if any).
Employee incentive and bonus plans
Employee Bonus Plan. For 2006 we have adopted an employee bonus plan based on a targeted pre-bonus EBITDA and minimum pre-bonus EBITDA. These targets are recommended by our senior management and determined and approved by our board of directors. Each of our employees has a target bonus associated with his or her position with the company and the target bonuses range from 10% to 100% of base salary. If EBITDA is less than or equal to the minimum EBITDA, then the employee is not entitled to any bonus. If, however, the EBITDA is greater than the minimum EBITDA, then the employee is entitled to receive a bonus in an amount equal to 2% of the employee's annual target bonus for each 1% of EBITDA in excess of the minimum EBITDA. Employees continue to earn an additional 1% of the target bonus for each 1% that EBITDA exceeds the target EBITDA. All bonuses under this plan are paid on or before March 15 of the year following the year in which the bonus is earned.
Edgen/Murray, L.P. Incentive Plan (For Edgen Corporation and its Subsidiaries). Certain directors, senior management and other key employees of Edgen and its subsidiaries are entitled to receive restricted common partnership units under the Edgen/Murray, L.P. Incentive Plan (For Edgen Corporation and its subsidiaries), the Edgen/Murray, L.P. limited partnership interest employee incentive plan for Edgen and its subsidiaries. The Edgen/Murray, L.P. Incentive Plan (For Edgen Corporation and its Subsidiaries) authorizes the granting of awards to employees of up to 550,000 restricted common partnership units. As of June 30, 2006, 320,719 restricted common partnership units had been granted under this plan. One-half of the restricted common units granted to an employee under the Edgen/Murray, L.P. Incentive Plan (For Edgen Corporation and its Subsidiaries) vest based on time over a five year period, vesting in equal installments each year, subject to an employee's continued employment with Edgen. The other half of the restricted common units vest based on Edgen and its subsidiaries' performance over a five year period, vesting in equal installments each year, subject to the attainment by us of certain financial goals. Vesting of restricted common partnership units that may, based on time or performance, vest in any given year accelerate in the case of certain defined events occurring in such year, such as change of control events relating to Edgen or ourselves; provided that Edgen/Murray, L.P. may, in its sole discretion, modify or accelerate the vesting of all unvested options or any portion thereof. The restricted common partnership units issued under the Edgen/Murray, L.P. Incentive Plan (for Edgen Corporation and its Subsidiaries) will not be exchanged for ordinary shares in connection with the Contribution and will remain outstanding.
Edgen/Murray, L.P. Incentive Plan (For Pipe Acquisition Limited and its Subsidiaries). Certain of directors, senior management and other key employees of PAL are entitled to receive restricted
84
common partnership units under the Edgen/Murray, L.P. Incentive Plan (For Pipe Acquisition Limited and its Subsidiaries), the Edgen/Murray, L.P. limited partnership interest employee incentive plan for PAL and certain of its subsidiaries. The Edgen/Murray, L.P. Incentive Plan (For Pipe Acquisition Limited and its Subsidiaries) authorizes the granting of awards to employees of up to 300,000 restricted common partnership units. As of June 30, 2006, 180,000 restricted common partnership units had been granted under this plan. 27.8% of the restricted common partnership units granted to an employee under the Edgen/Murray, L.P. Incentive Plan (For Pipe Acquisition Limited and its Subsidiaries) vest based on time over a five year period, vesting in equal installments each year, subject to an employee's continued employment with us. The remainder of the restricted common units vest based on PAL and its subsidiaries' performance over a five year period, vesting in equal installments each year, subject to the attainment by us of certain financial goals. Vesting of restricted common partnership units that may, based on time or performance, vest in any given year accelerate in the case of certain defined events occurring in such year, such as change of control events relating to PAL or ourselves; provided that Edgen/Murray, L.P. may, in its sole discretion, modify or accelerate the vesting of all unvested options or any portion thereof. The restricted common partnership units issued under the Edgen/Murray, L.P. Incentive Plan (For PAL and its Subsidiaries) will not be exchanged for ordinary shares in connection with the Contribution and will remain outstanding.
401(k) plans
Edgen sponsors a defined contribution plan, or 401(k) plan, intended to qualify under section 401 of the Internal Revenue Code. Substantially all of Edgen's US employees are eligible to participate in the 401(k) plan on the first day of the month in which the employee has attained 18 years of age and 90 days of employment. Employees may make pre-tax contributions of their eligible compensation, not to exceed the limits under the Internal Revenue Code. Edgen matches 50% of the employee's contributions, up to a maximum of 6% of the employee's eligible compensation. Any profit sharing contributions are discretionary in amount and occurrence (and are not limited to current or accumulated net profits). Employees may direct their investments among various pre-selected investment alternatives. Employer contributions to the 401(k) plan, including profit sharing contributions, fixed contributions and employer matching contributions, vest 25% after the second year of employment, 50% after the third year of employment, 75% after the fourth year of employment and 100% after the fifth year of employment.
Effective December 16, 2005, Edgen began sponsoring a 401(k) profit-sharing plan for its subsidiary, MIM US, which covers eligible employees at least 21 years of age who have completed at least three months of service. The plan allows for employee contributions through salary deductions up to 19% of total compensation, subject to the statutory limits. Employer matching contributions can be made at our discretion.
Limitation of liability and indemnification of directors and officers
See "Description of share capital—Limitation of liability and indemnification of directors and officers" for a description of certain provisions of the UK Companies Act 1985, as amended, and our Articles of Association that limit the liability of directors and officers under certain circumstances.
85
Security ownership of certain beneficial owners
and management
The following table sets forth certain information regarding the ownership of our ordinary and preference shares before and after this offering by (i) each person or entity known to us to own more than 5% of any class of shares, (ii) each member of our board of directors and each of our named executive officers and (iii) all of the members of the board of directors and executive officers as a group. The following table gives effect to the Contribution and the columns relating to beneficial ownership of our shares after the offering reflect the redemption of all our preference shares and no exercise of the underwriters' over-allotment option. To our knowledge, each of the security holders listed below has sole voting and investment power as to the partnership interests shown unless otherwise noted and subject to community property laws where applicable.
Beneficial ownership of the securities listed in the table has been determined in accordance with the applicable rules and regulations promulgated under the Exchange Act.
|
| | Shares beneficially owned prior to this offering(1)
| | Shares beneficially owned after this offering(1)(9)
|
|---|
| | Ordinary Shares
| | Preference Shares
| | Ordinary Shares
|
|---|
| | Number
| | Percent
| | Number
| | Percent
| | Number
| | Percent
|
|---|
|
| Principal shareholders: | | | | | | | | | | | | |
| Funds managed by Jefferies Capital Partners(2) | | | | 74.5% | | | | 75.9% | | | | |
| Murray Metals Group Limited(3) | | | | 5.0% | | | | 12.4% | | | | |
| Named Executive Officers and Directors: | | | | | | | | | | | | |
| | Daniel J. O'Leary(4) | | | | 3.5% | | | | 1.6% | | | | |
| | David L. Laxton(4) | | | | 1.7% | | | | 0.8% | | | | |
| | Robert L. Gilleland(4) | | | | 1.2% | | | | 0.7% | | | | |
| | Craig S. Kiefer(4) | | | | 1.2% | | | | 0.7% | | | | |
| | Kenneth A. Cockburn(5) | | | | 3.1% | | | | 2.1% | | | | |
| | Nicholas Daraviras(6) | | | | — | | | | — | | | | |
| | James L. Luikart(6)(7) | | | | 74.5% | | | | 75.9% | | | | |
| | Edward J. DiPaolo(7)(8) | | | | 0.3% | | | | 0.1% | | | | |
| | All executive officers and directors as a group (8 persons) | | | | 85.5% | | | | 81.9% | | | | |
|
- (1)
- Pursuant to Rule 13d-3 under the Exchange Act, a person has beneficial ownership of any securities as to which such person, directly or indirectly, through any contract, arrangement, undertaking, relationship or otherwise has or shares voting power and/or investment power and as to which such person has the right to acquire such voting and /or investment power within 60 days. Percentage of beneficial ownership as to any person as of a particular date is calculated by dividing the number of shares beneficially owned by such person by the sum of the number of shares outstanding as of such date plus the number of shares as to which such person has the right to acquire voting and/or investment power within 60 days.
- (2)
- Consists of (a) ordinary shares held by ING Furman Selz Investors III L.P., ordinary shares held by ING Barings U.S. Leveraged Equity Plan LLC and ordinary shares held by ING Barings Global Leveraged Equity Plan Ltd. and (b) preference shares held by ING Furman Selz Investors III L.P., preference shares held by ING Barings U.S. Leveraged Equity Plan LLC and preference shares held by ING Barings Global Leveraged Equity Plan Ltd. ING Furman Selz Investors III L.P., ING Barings U.S. Leveraged Equity Plan LLC and ING Barings Global Leveraged Equity Plan Ltd. are private equity investment funds managed by JCP. Brian P. Friedman and Mr. Luikart are the managing members of the managers of these funds and may be considered the beneficial owners of the shares owned by ING Furman Selz Investors III L.P., ING Barings U.S. Leveraged Equity Plan LLC and ING Barings Global Leveraged Equity Plan Ltd., but each of Messrs. Friedman and Luikart expressly disclaim beneficial ownership of such shares, except to the extent of each of their pecuniary interests therein. The address for each of the funds managed by Jefferies Capital Partners is 520 Madison Avenue, 12th Floor, New York, New York 10022.
- (3)
- Murray Metals Group Limited is an affiliate of MIH. The address of Murray Metals Group Limited is 9 Charlotte Square, Edinburgh EH2 4DR, United Kingdom.
- (4)
- The address of each such person is c/o Edgen Corporation, 18444 Highland Road, Baton Rouge, Louisiana 70809.
- (5)
- The address of Mr. Cockburn is Newbridge Industrial Estates, Newbridge, Midlothian, EH28 8PJ, United Kingdom.
- (6)
- The address of each of Mr. Daraviras and Mr. Luikart is c /o Jefferies Capital Partners, 520 Madison Avenue, 12th Floor, New York, New York 10022.
86
- (7)
- Includes ordinary shares and preference shares owned by ING Furman Selz Investors III L.P., ING Barings U.S. Leveraged Equity Plan LLC and ING Barings Global Leveraged Equity Plan Ltd. Mr. Luikart is a managing member of the manager of these funds and may be considered the beneficial owner of such shares, but he expressly disclaims such beneficial ownership of the common and preferred partnership units owned by ING Furman Selz Investors III L.P., ING Barings U.S. Leveraged Equity Plan LLC and ING Barings Global Leveraged Equity Plan Ltd., except to the extent of his pecuniary interest therein.
- (8)
- The address of Mr. DiPaolo is 363 N. Sam Houston Parkway East, Suite 550, Houston, Texas 77060. ordinary shares and preference shares listed for Mr. DiPaolo are owned by Hickory Hills Investments, Ltd., a family limited partnership of which Mr. DiPaolo is a limited partner.
- (9)
- If the underwriters' over-allotment option is exercised in full, the following individuals and entities will sell the following number of shares: .
87
Certain relationships and related party transactions
We have entered into the following agreements with our named executive officers and our directors.
Employment agreements
We have entered into employment agreements with certain of our executive officers. For more information regarding these agreements, see "Management—Employment agreements."
Director and officer indemnification
The UK Companies Act 1985, as amended, and our Articles of Association contain provisions for the indemnification of our senior managers. See "Description of share capital—Limitation of liability and indemnification of directors and officers."
The Buy-out Transaction
On December 31, 2004, Edgen entered into a stock purchase agreement with its then existing stockholders and Edgen Acquisition Corp., a corporation newly formed by JCP in connection with the Buy-out Transaction, pursuant to which Edgen Acquisition Corp. agreed to purchase all of Edgen's outstanding capital stock from Edgen's then existing stockholders. The acquisition closed on February 1, 2005.
At the closing of Buy-out Transaction, Edgen Acquisition Corp. entered into agreements with funds managed by JCP and certain members of Edgen management pursuant to which they acquired shares of Edgen Acquisition Corp. Pursuant to these agreements, the JCP funds and the management investors purchased shares of common stock and preferred stock of Edgen Acquisition Corp. having a combined aggregate value of approximately $24.0 million. Following the closing of the Buy-out Transaction and the merger of Edgen Acquisition Corp. with and into Edgen, the funds managed by JCP and the management investors owned all of the outstanding common stock and preferred stock of Edgen and entered into certain securities holders agreements relating to their ownership of shares of Edgen common and preferred stock.
Immediately following the Buy-out Transaction on February 1, 2005, the outstanding securities of Edgen consisted of 2,681,564 shares of common stock and 21,600 shares of Series A preferred stock, which were beneficially owned as set forth below.
|
| | Common Stock
| | Preferred Stock
|
|---|
| | Number of
Shares
| | Percent
| | Number of
Shares
| | Percent
|
|---|
|
| Principal Stockholders: | | | | | | | | |
| Funds managed by Jefferies Capital Partners | | 2,161,000 | | 80.6% | | 19,449 | | 90.0% |
Executive Officers and Directors: |
|
|
|
|
|
|
|
|
| | Daniel J. O'Leary | | 168,855 | | 6.3% | | 675 | | 3.1% |
| | David L. Laxton | | 75,223 | | 2.8% | | 315 | | 1.5% |
| | Robert L. Gilleland | | 56,816 | | 2.1% | | 270 | | 1.3% |
| | Craig S. Kiefer | | 56,816 | | 2.1% | | 270 | | 1.3% |
|
88
Formation of Edgen/Murray, L.P. and the MIM Acquisition
In connection with the MIM Acquisition, Edgen's stockholders organized a new holding company, Edgen/Murray, L.P. and transferred all of their equity interests in Edgen to Edgen/Murray, L.P., in exchange for common and preferred partnership interests of Edgen/Murray, L.P., and Edgen became a wholly owned subsidiary of Edgen/Murray, L.P. Concurrently, the securities holders agreements entered into in connection with the Buy-out Transaction were terminated and the investors in Edgen/Murray, L.P. entered into a limited partnership agreement governing their partnership interests in Edgen/Murray, L.P.
Following these transactions and the closing of the MIM Acquisition, the funds managed by JCP continued to own a majority of the common and preferred interests of Edgen/Murray, L.P. and continued to control Edgen/Murray, L.P. Edgen management owned approximately 11% of the common partnership units and 6% of the preferred partnership units of Edgen/Murray, L.P. and MIM Ltd. management owned % of the common partnership units and % of the preferred partnership units of Edgen/Murray, L.P.
The MIM UK Acquisition closed on December 16, 2005 and was funded with proceeds from the offering of the PAL Floating Rate Notes and cash equity investments of approximately $32.8 million by certain funds managed by JCP and certain members of MIM Ltd. and Edgen management, and rollover equity investments by certain members of MIM Ltd. management and MIH. Immediately following the closing of the MIM Acquisition on December 16, 2005, the outstanding securities of Edgen/Murray, L.P. consisted of common partnership units and preferred partnership units, which were beneficially owned as set forth below:
|
| | Common
Partnership Units
| | Preferred
Partnership Units
|
|---|
| | Number of
Units
| | Percent
| | Number of
Units
| | Percent
|
|---|
|
| Principal Equity Holders: | | | | | | | | |
| Funds managed by Jefferies Capital Partners | | 4,207,067.82 | | | | 38,382.23 | | |
| Murray Metals Group Limited | | 282,795.80 | | | | 6,285.02 | | |
Executive Officers and Directors: |
|
|
|
|
|
|
|
|
| | Daniel J. O'Leary | | 197,308.57 | | | | 819.28 | | |
| | David L. Laxton | | 94,192.68 | | | | 401.05 | | |
| | Robert L. Gilleland | | 64,123.03 | | | | 352.68 | | |
| | Craig S. Kiefer | | 64,123.03 | | | | 352.68 | | |
| | Kenneth A. Cockburn | | | | | | | | |
| | Edward J. DiPaolo | | 13,653.69 | | | | 31.20 | | |
|
Formation of Edgen Murray Plc and the Contribution
We were formed as a public limited company organized under the laws of England under the name Edgen Murray Plc in November 2006, as a wholly owned subsidiary of Edgen/Murray, L.P. and an affiliate of Edgen/Murray, L.P. Our business is currently conducted through Edgen, a corporation organized under the laws of Nevada, and MIM Ltd., a private limited company organized under the laws of England, and their subsidiaries.
On , Edgen/Murray, L.P. contributed the common shares of Edgen and PAL to Edgen Murray Plc and Edgen Murray Plc issued ordinary shares and preference shares to Edgen/Murray, L.P. in exchange for these shares. Following this exchange, Edgen/Murray, L.P. effected
89
a special distribution whereby the holders of Edgen/Murray, L.P. preferred partnership interests received Edgen Murray Plc preference shares held by Edgen/Murray, L.P. and the holders of Edgen/Murray, L.P. common partnerships interests (other than the holders of restricted common partnership interests held by certain members of our management and employees under the Edgen/Murray, L.P. equity incentive plans) received Edgen Murray Plc ordinary shares held by Edgen/Murray, L.P.
As a result of the Contribution, but prior to giving effect to this offering, the equity holders of Edgen/Murray, L.P. (other than the holders of restricted common partnership interests under the Edgen/Murray, L.P. equity incentive plans) became the owners of of Edgen Murray Plc. Accordingly, JCP and its affiliates beneficially own approximately % of our ordinary shares and % of our preference shares and certain of our management and employees beneficially own approximately % of our ordinary shares and % of our preference shares. See "Security ownership of certain beneficial owners and management."
All of our preference shares will be redeemed by us with a part of the proceeds of this offering. There will be no preference shares of Edgen Murray Plc outstanding when the redemption of our preference shares is completed. Following the consummation of this offering and the redemption of the preference shares, JCP and its affiliates will beneficially own approximately % of our ordinary shares and none of our preference shares and certain of our management and employees will beneficially own approximately % of our ordinary shares and none of our preference shares.
For further information regarding the redemption of our preference shares and their potential impact on an investment in our ordinary shares or ADSs, please see "Capitalization", "Dilution" and "Description of share capital."
Other relationships and related transactions
Transaction fee agreement. Pursuant to a transaction fee agreement by and among Edward J. DiPaolo, John B. Elstrott, Edgar Hotard, Daniel J. O'Leary, David L. Laxton, III and Edgen, upon the consummation of the Buy-out Transaction on February 1, 2005, Edgen paid a transaction fee in an amount equal to $2,480,000, which was allocated among Messrs. DiPaolo, Elstrott, Hotard, O'Leary and Laxton. Messrs. O'Leary and Laxton received $1,240,000, and $620,000 of this amount, respectively, as dictated by the transaction fee agreement.
Value bonus compensation. Upon the consummation of the Buy-out Transaction on February 1, 2005, pursuant to value bonus compensation awards approved by the board of directors of Edgen, certain members of Edgen management became eligible for value bonuses in an aggregate amount of $3,000,000, which bonuses were distributed to certain senior managers of Edgen, including Daniel J. O'Leary, David L. Laxton, III, Robert L. Gilleland and Craig S. Kiefer who received $970,000, $480,000, $420,000 and $370,000, respectively.
Furthermore, the board of directors of Edgen approved an additional senior management bonus equal to 20% of the net proceeds from the sale of Edgen in excess of $64,000,000. The amount of this bonus was approximately $1,500,000 in the aggregate, and was distributed among the senior management by the mutual agreement of Mr. Kleinman, a Harvest Partners board member, and Mr. O'Leary.
2006 bonus payments. On February 27, 2006, Edgen/Murray, L.P. granted a cash bonus and restricted common units to David J. O'Leary and David L. Laxton III of $60,000 and 17,492.75 units with an approximate fair value of $90,000, and $40,000 and 11,661.83 units with an approximate fair value of $60,000, respectively. These bonuses and additional awards were issued in recognition of the services provided to us and our subsidiaries during the MIM Acquisition and their future employment as the Chief Executive Officer and Chief Financial Officer, respectively, of Edgen/Murray, L.P.
90
Certain transactions with MIM Ltd. senior management. Concurrently with or immediately after the closing of the MIM Acquisition, Ken Cockburn, the managing director of MIM Ltd., received cash payments in relation to matters arising out of the transaction. Cash payments included a payment of UK£550,000 ($974,930) in connection with certain future pension obligations.
Certain transactions with MIH and its affiliates. Subsequent to the MIM Acquisition on December 16, 2005, MIM Ltd. has continued to enter into limited transactions with the previous owner of the business, MIH, which is also a limited partner of Edgen/Murray, L.P. These transactions are not significant to our operations, except for certain resources and processes of the Carnegie Systems Management Limited (CSM). CSM provides information systems and network engineering to MIM Ltd. and its subsidiaries. Fees for these services are generally estimated and paid quarterly, with an annual make whole payment for any outstanding amounts. Fees were $22,976 for the period December 17, 2005 to December 31, 2006, and $283,552 for the six months ended June 30, 2006.
Investors and registration rights agreement
We intend to enter into an investors and registration rights agreement prior to the closing of this offering pursuant to which JCP will have the right to designate a certain number of directors to our board of directors, so long as JCP or funds managed by JCP beneficially own a specified percentage of our then-outstanding ordinary shares. Initially, the director(s) designated by JCP to our board of directors will be Messrs. O'Leary, Daraviras, Luikart and DiPaolo. Pursuant to the investors and registration rights agreement, we may be required to register the sale of ADSs representing our ordinary shares held by certain funds managed by JCP, certain members of our management and the other limited partners of Edgen/Murray, L.P. (the "Edgen/Murray Partners") who will become our shareholders as a result of the Contribution. We expect that under the investors and registration rights agreement, JCP will have the right, on two occasions, to request us to register the sale of ADSs representing ordinary shares held by the Edgen/Murray Partners and may require us to make available shelf registration statements permitting sales of ADSs representing ordinary shares into the market from time to time. In addition, we expect that the Edgen/Murray Partners will have the ability to exercise certain piggyback registration rights in connection with registered offerings initiated by us.
Management agreements
In connection with the Buy-out Transaction, Edgen entered into a management agreement with JCP. Pursuant to this management agreement, JCP may provide management, business and organizational strategy and merchant and investment banking services to Edgen. In exchange for these services, Edgen may pay JCP an annual management fee in an amount agreed to between JCP and Edgen from time to time, plus reasonable out-of-pocket expenses. In addition, JCP may negotiate with Edgen to provide additional management, financial or other corporate advisory services in connection with any transaction. The management agreement provides that JCP will be paid a transaction fee for such services rendered by JCP in an amount mutually agreed upon by JCP and Edgen, plus reasonable out-of-pocket expenses. The management agreement has an initial term of ten years.
No management fees have been paid under this agreement, and the parties to this agreement intend to terminate the management agreement prior to the closing of this offering.
Underwriting
Jefferies & Company, Inc., one of the underwriters of this offering, is an affiliate of JCP and is participating as an underwriter in this offering and will be entitled to underwriting discounts and commissions with respect to the ADSs purchased by it in this offering. In addition, JCP will receive a portion of the net proceeds of this offering in connection with the redemption of our preference shares. See "Underwriting." In addition to the foregoing, Jefferies & Company was an initial purchaser with respect to the offerings of the PAL Floating Rate Notes and the Edgen Senior Secured Notes in 2005, for which it received customary underwriters' discount and commissions. Mr. Brian P. Friedman, who serves as President of JCP, is also the Chairman of the Executive Committee of Jefferies & Company, Inc.
91
Description of share capital
The following summarizes the material provisions of our share capital and related summary information about provisions of our memorandum of association and our articles of association and about applicable English law. For our authorized capitalization and shares outstanding see "Capitalization."
General
We were incorporated on November 2, 2006 with an authorized share capital of UK£50,000 divided into 50,000 ordinary shares of £1 each. On November 2, 2006, Edgen/Murray L.P. applied for the allotment 49,998 ordinary shares of UK£1 each against its irrevocable undertaking to pay up to a quarter of the amount of the nominal value of the ordinary shares on February 28, 2007 or on a later demand by Edgen Murray Plc, In consideration for our agreement to include its name in the Register of Members prior to the contribution of which one was issued to each subscriber to the memorandum of association.
Since our incorporation, the following changes have been made to our authorized and issued share capital:
- (i)
- By resolution of our shareholders passed on :
- (1)
- (2)
- (ii)
- By resolution of our shareholders passed on :
- (1)
- (2)
- (iii)
- On , pursuant to the Contribution, ordinary shares and preference shares in the Edgen Murray Plc were issued to holders of equity interests in Edgen/Murray, L.P. on the following basis:
- (1)
- for every common partnership unit in Edgen/Murray, L.P., ordinary shares of the Edgen Murray Plc; and
- (2)
- for every preferred partnership unit of in Edgen/Murray, L.P., preference shares of the Edgen Murray Plc.
After giving effect to this offering, and the changes to our share capital described above, there will be an aggregate of ordinary shares outstanding. Except as set forth above, holders of our ordinary shares are not required to make any additional contributions of capital for our ordinary shares in the future.
Registration Rights
In connection with this offering, we have entered into an investors and registration rights agreement with certain of our shareholders. See "Certain relationships and related party transactions—Investors and registration rights agreement."
92
Shareholders' meetings
Under English law, there are two types of general meetings of shareholders, annual general meetings and extraordinary general meetings. We must hold an annual general meeting in each calendar year not later than 15 months from the previous general meeting; except that if we hold our first annual general meeting within 18 months of our incorporation, we need not hold an annual general meeting in the year of incorporation or in the following year. At an annual general meeting, shareholders vote on matters including the election of directors, appointment of auditors, fixing of directors' remuneration, approval of the annual accounts and the board of directors' report and declaration of dividends. Any other general meeting is an extraordinary general meeting.
Our board of directors may convene an extraordinary general meeting of shareholders and must convene one if demanded by the holders of at least 10% of our paid-up shares. An annual general meeting and an extraordinary general meeting called to pass a special resolution must be called upon at least 21 days' notice specifying the place, day and time of the meeting and the general nature of the business of the meeting. A special resolution is required to amend the company's name or its memorandum or articles of association. The necessary quorum for our general meetings is two persons holding or representing by proxy issued shares carrying a right to vote upon the business to be transacted.
An ordinary resolution requires a simple majority of the votes cast at a general meeting. A special resolution requires at least 75% of the votes of attending shareholders (in person or by proxy) who are entitled to vote on the resolution in question.
Voting rights
Every shareholder who is present in person or by a duly authorized representative, has one vote and on a poll every shareholder present in person or by proxy has one vote for every share of which he is a holder. A poll may be demanded by any shareholder having the right to vote at the meeting. In the event of an equality of votes, the chairman shall be entitled to have a casting vote in addition to any other vote he may have.
Issue of shares and changes in capital
Subject to compliance with English law and without prejudice to the rights of existing shareholders, we may issue redeemable shares provided that there are non-redeemable shares in issue at the time.
Our current authorized but unissued ordinary shares are at the disposal of our board of directors, who may issue, grant options or otherwise dispose of those ordinary shares to any persons and on any terms they deem appropriate, provided the issuance does not violate the UK Companies Act 1985 or our articles of association.
Under Section 80 of the UK Companies Act 1985, and subject to limited exceptions for employee share option schemes, our board of directors may not issue shares (or grant any right to subscribe for or convert other securities into shares) without the authorization of the shareholders by an ordinary resolution. The ordinary resolution must state the maximum number of shares which the board of directors may issue under it and the date it will expire, which must be within five years.
If we issue shares for cash, Section 89 of the UK Companies Act 1985 requires us, subject to limited exceptions for employee share option schemes, to first offer these shares to existing shareholders on the same terms and in proportion to their holdings. However, Section 95 of the UK Companies Act 1985 provides that a special resolution of the shareholders may give the board of directors the power to issue shares without first offering them to existing shareholders.
93
Following admission of our ADSs to listing on NYSE, Edgen Murray Plc will be subject to the statutory rights of preemption in Section 89 of the UK Companies Act 1985. The statutory rights of preemption apply to the authorized, but unissued share capital of Edgen Murray Plc. The statutory rights of preemption have been disapplied to:
- (i)
- permit the directors to allot up to ordinary shares in this offering;
- (ii)
- give the directors flexibility in relation to rights issues; and
- (iii)
- permit the directors to allot ordinary shares for cash following this offering having a nominal value of up to percent of the issued ordinary share capital following admission of our ADSs to listing on the NYSE.
We may by ordinary resolution:
- •
- increase our share capital;
- •
- consolidate and divide all or any of our share capital into shares of a larger amount;
- •
- sub-divide all or part of our share capital into shares of a smaller amount; and
- •
- cancel any shares which have not, at the date of the ordinary resolution, been taken or agreed to be taken by any person and diminish the amount of its authorized share capital by the amount of the shares so cancelled.
Dividends
Subject to English law, our shareholders may declare a dividend at a general meeting upon the recommendation of our board of directors. The shareholders may declare a smaller dividend than recommended by our board of directors but they may not declare a larger dividend. Our board of directors may pay interim dividends if it appears to them that they are justified by our financial position.
Subject to the rights attached to any shares issued on any special terms and conditions, dividends shall be declared and paid according to the amounts paid up on the shares in respect of which the dividend is paid, but no amount paid. Any dividend on the shares unclaimed for a period of 12 years after having become due for payment shall, if the directors so resolve, be forfeited and shall revert to us. No dividend on a share will bear interest, unless provided by the rights attaching to the share.
Notification of interests in shares
Section 198 of the UK Companies Act 1985 requires any person, subject to limited exceptions, who acquires an interest of 3% or more or, in the case of certain interests, 10% or more of our shares to notify us in writing of his interest within two business days following the day on which the obligation to notify arises. After the shareholder exceeds that level of share ownership, that person must make a similar notification for each one percent increase or decrease, rounded down to the next whole number. For the purposes of the notification obligation, the interest of a person in the shares means any kind of interest in shares, subject to certain exceptions, including any share:
- •
- In which such person's spouse or child or stepchild is interested; or
- •
- In which a corporate body is interested where either:
- •
- that corporate body or its directors are accustomed to act under that person's directions or instructions; or
94
- •
- that person is entitled to exercise or control the exercise of one-third or more of the voting power of that corporate body; or
- •
- In which another party is interested where the person and that other party are parties to a "concert party" agreement under Section 204 of the UK Companies Act 1985 and any interest in shares is acquired by any one of the parties pursuant to the agreement.
A "concert party" agreement is an agreement under which one or more parties acquire interests in shares of a particular company and impose obligations or restrictions on any one or more of the parties as to the use, retention or disposal of such interests.
In addition, Section 212 of the UK Companies Act 1985 enables us, by notice in writing, to require a person whom we know or have reasonable cause to believe to be, or to have been at any time during the three years immediately preceding the date on which we issue the notice, interested in our shares to confirm that fact, and where such person holds or has during this relevant time held an interest in our shares to give such further information as may be required relating to his or her interest and any other interest in our shares of which that person is aware.
The UK Companies Act 1985 allows us to apply to the UK courts to restrict the rights attaching to our shares held by shareholders who fail to comply with Section 212 of the UK Companies Act 1985.
Transfer of shares
A shareholder may transfer all or any of his shares in any manner which is permitted by any applicable statutory provision and our articles of association.
A shareholder may transfer all or any of his shares by an instrument of transfer in any usual form, or in such other form as the board of directors may approve. The instrument of transfer shall be signed by or on behalf of the transferor and, except in the case of a fully paid share, by or on behalf of the transferee. The directors may refuse to register the transfer of a share which is not fully paid to a person of whom they do not approve and they may refuse to register the transfer of a share on which the company has a lien.
Shareholders' right to institute action on behalf of or in the interest of Edgen Murray Plc
English case law has established generally that we, rather than our shareholders, are the proper claimant in an action in respect of a wrong done to us or where there is an irregularity in our internal management. Exceptions to this general rule include illegal acts or acts outside our powers, failure to adopt a required special resolution, fraud committed on minority shareholders by persons who control us and an infringement of the personal rights of a shareholder. A court may allow a shareholder to bring an action in our name where our affairs have been or are being conducted in a manner that is unfairly prejudicial to some of our shareholders.
Right to inspect documents
Under English law, holders of shares are entitled to inspect company documents such as our Register of Members and our minutes from general meetings. In addition, shareholders are entitled to a copy of our Annual Report and Accounts, together with the Auditor's Report. All of these rights may be exercised free of charge. Rights of inspection without charge also extend to our Register of Directors and Secretaries, directors' service contracts (in certain circumstances), our Register of Charges (plus documents creating or evidencing charges) and our Register of Directors' Interests.
95
Exchange controls
There are currently no UK government laws, decrees, regulations or other legislation which restrict or which may affect the import or export of capital, including the availability of cash and cash equivalents for use by us or the remittance of dividends, interest or other payments to non-resident holders of our securities, except as otherwise described under "Certain Income Tax Consequences" below.
Limitation of liability and indemnification of directors and officers
UK Companies Act 1985, as amended. As a company incorporated in England, Edgen Murray Plc is subject to the UK Companies Act 1985, as amended.
Section 309A of the UK Companies Act 1985 provides that companies cannot exempt a director from any liability attaching to him in connection with any negligence, default, breach of duty or breach of trust by him in relation to the company. However, a company may indemnify a director against such liabilities provided that it does not indemnify the director against any liability he incurs, amongst others, to the company or to an associated company, to pay a criminal fine or a regulatory penalty, in defending criminal proceedings in which he is convicted, in defending civil proceedings brought by the company, or an associated company, in which judgment is given against him. A company may also purchase and maintain for a director of a company or an associated company insurance against any such liability.
Section 727 of the UK Companies Act 1985 provides that, in any proceedings for negligence, default, breach of duty or breach of trust against an officer of a company, where it appears to the court that the officer is or may be liable with respect of the negligence, default, breach of duty or breach of trust, but that he has acted honestly and reasonably, and that having regard to all the circumstances of the case he ought fairly to be excused for the negligence, default, breach of duty or breach of trust, the court may relieve him, either wholly or partly, from his liability on such terms as it thinks fit. Furthermore, if any such officer has reason to believe that a claim will or might be made against him with respect of any negligence, default, breach of duty or breach of trust, he may apply to court for relief, and the court may grant relief in the same manner as set out above.
Our Articles of Association. Article 11 of our Articles of Association provides:
- "11.
- "11. Protection From Liability
For the purposes of this article a "Liability" is any liability incurred by a person in connection with any negligence, default, breach of duty or breach of trust by him in relation to us or otherwise in connection with his duties, powers or office and "Associated Company" shall bear the meaning referred to in section 309A(6) of the Act. Subject to the provisions of the Act and without prejudice to any protection from liability which may otherwise apply:
- 11.1
- the directors shall have power to purchase and maintain for any director of the Company, any director of an Associated Company, any auditor of the Company and any officer of the Company (not being a director or auditor of the Company, insurance against any Liability.
- 11.2
- every director or auditor of the Company and every officer of the Company (not being a director or auditor of the Company shall be indemnified out of our assets against any loss or liability incurred by him in defending any proceedings in which judgment is given in his favor or in which he is acquitted or in connection with any application in which relief is granted to him by the court from any Liability.
- 11.3
- regulation 118 in Table A shall not apply to the Company."
96
Description of American Depositary Shares
American Depositary Shares
, as Depositary, will deliver the ADSs. Each ADS will represent ordinary shares. The ordinary shares or the right to receive ordinary shares will be deposited by us with a custodian, the London office of the Depositary. Each ADS will also represent securities, cash or other property deposited with the Depositary but not distributed to ADS holders. Your ADSs will be evidenced by what are known as American Depositary Receipts, or ADRs. The Depositary's corporate trust office is located at . Its principal executive office is located at .
You may hold ADSs either directly or indirectly through your broker or another financial institution. If you hold ADSs directly, by having an ADS registered in your name on the books of the Depositary you are an ADS holder. This description assumes you hold your ADSs directly. If you hold the ADSs indirectly through your broker or financial institution nominee, you must rely on the procedures of your broker or other financial institution to assert the rights of ADS holders described in this section. You should speak to your broker or financial institution for further information about those procedures.
As an ADS holder, we will not treat you as one of our shareholders and you will not have shareholder rights. English law governs shareholder rights. The Depositary will be the holder of the ordinary shares underlying your ADSs. As a holder of ADSs, you will have ADS holder rights. A deposit agreement dated , 2006 among us, the Depositary and you, as an ADS holder, and the owners and beneficial owners of ADSs, will set out ADS holder rights as well as the rights and obligations of the Depositary. The principal terms of the deposit agreement are expected to be as set out in the following paragraphs. Pursuant to the deposit agreement we expect we will agree to pay the reasonable expenses and out-of-pocket charges of the Depositary and those of any registrar of the ADSs. The laws of the State of New York are expected to govern the deposit agreement and the ADSs.
Share dividends and other distributions
The Depositary will agree to pay to you the cash dividends or other distributions it or the custodian receives from us on deposited ordinary shares or other deposited securities after deducting its fees and expenses. You will receive these distributions in proportion to the number of ordinary shares your ADSs represent.
Cash. Whenever we make a cash distribution on the ordinary shares on deposit with the custodian, we will notify the Depositary and deposit the funds with the custodian. Upon confirmation of the deposit of the requisite funds, the Depositary will convert any cash dividend or other cash distribution we pay on the ordinary shares into US dollars, if it can do so on a reasonable basis and can transfer those US dollars to the United States. If that is not possible or if approval of any government is needed and cannot be obtained or cannot be obtained within a reasonable period, the deposit agreement will allow the Depositary to distribute UK pounds to those ADS holders to whom it is possible to do so. The Depositary will hold the UK pounds for the account of the ADS holders who have not been paid. It will not invest the UK pounds and it will not be liable for any interest to the ADS holder.
Before making a distribution, any withholding taxes that must be paid under applicable US tax law will be deducted. See "Income tax considerations" for more information. The Depositary will distribute only whole US dollars and cents and will round fractional cents to the nearest whole cent. If the exchange rates fluctuate at a time when The Depositary cannot convert the UK pounds, you may lose some or all of the value of the distribution.
Ordinary shares. The Depositary may distribute new ADSs representing any ordinary shares we may distribute as a dividend or free distribution, if we furnish it promptly with satisfactory evidence that it is
97
legal for it to do so. The Depositary will only distribute whole ADSs. It will sell ordinary shares which would require it to deliver a fractional ADS and distribute the net proceeds in the same way it does cash. If the Depositary does not distribute additional ADSs, the outstanding ADSs will also represent the new ordinary shares.
Rights to receive additional ordinary shares. If we offer holders of our ordinary shares any rights to subscribe for additional ordinary shares or any other rights, the Depositary may, after consultation with us, make these rights available to you. We must furnish it with satisfactory evidence that it is legal for it to do so. If the Depositary determines, after consultation with us, that it is not lawful and feasible to make these rights available to you, the Depositary may sell the rights and distribute the proceeds in the same way it does cash. The Depositary may allow rights that are not distributed or sold to lapse. In that case, you would receive no value for them.
If the Depositary makes rights available to you, upon instruction from you, it will exercise the rights and purchase the ordinary shares on your behalf. The Depositary will then deposit the ordinary shares and deliver ADSs to you. It will only exercise rights if you pay it the exercise price and any other charges the rights require you to pay.
The US securities laws may restrict the sale, deposit, cancellation and transfer of the ADSs issued after the exercise of rights. For example, you may not be able to trade the ADSs freely in the United States. Under the deposit agreement, the Depositary will not distribute rights to holders of ADSs unless the distribution and sale of rights and the securities to which these rights relate are either exempt from, or not subject to, registration under the Securities Act with respect to all holders of ADSs, or are registered under the provisions of the Securities Act. We can give no assurance that we can establish an exemption from registration under the Securities Act, and we are under no obligation to file a registration statement with respect to these rights or underlying securities or to endeavor to have a registration statement declared effective. In this case, the Depositary may deliver the ADSs under a separate restricted deposit agreement which will contain the same provisions as the agreement except for the changes needed to put the restrictions in place.
Other distributions. The Depositary will send to you anything else we distribute on deposited securities by any means it thinks is legal, fair and practical. If it cannot make the distribution in that way, The Depositary may either sell what we distributed and distribute the net proceeds in the same way it does cash or it may decide to hold what we distributed, in which case the ADSs will also represent the newly distributed property.
The Depositary is not responsible if it decides that it is unlawful or impractical to make a distribution available to any ADS holders. We have no obligation to register ADSs, shares, rights or other securities under the Securities Act. We also have no obligation to take any other action to permit the distribution of ADSs, shares, rights or anything else to ADS holders. This means that you may not receive the distribution we make on our ordinary shares or any value for them if it is illegal or impractical for us to make them available to you.
Deposit, withdrawal and cancellation
The Depositary will deliver ADSs if you or your broker deposit ordinary shares or evidence of rights to receive ordinary shares with the custodian. Ordinary shares deposited in the future with the custodian must be accompanied by certain documents, including instruments showing that such ordinary shares have been properly transferred or endorsed to you. Upon payment of its fees and expenses and of any taxes or charges, such as stamp duty or stock transfer taxes or fees, the Depositary will register the appropriate number of ADSs in the names you request and will deliver the ADRs at its corporate trust office to the persons you request.
98
You may turn in your ADSs at the Depositary's corporate trust office. Upon payment of its fees and expenses and of any taxes or charges, such as stamp taxes or stock transfer taxes or fees, the Depositary will deliver the underlying shares to an account designated by you and any other deposited securities underlying the ADSs at the office of the custodian, or at your request, risk and expense, the Depositary will deliver the deposited securities at its corporate trust office.
Voting rights
You may instruct the Depositary to vote the ordinary shares underlying your ADSs only if we ask the Depositary to ask for your instructions. Otherwise, you will not be able to exercise your right to vote unless you withdraw the ordinary shares. However, you may not know about the meeting long enough in advance to withdraw the ordinary shares.
If we ask for your instructions, the Depositary will notify you of the upcoming vote and arrange to deliver our voting materials to you. The materials will describe the matters to be voted on and explain how you, on a certain date, may instruct the Depositary to vote the ordinary shares or other deposited securities underlying your ADSs as you direct. For instructions to be valid, the Depositary must receive them on or before the date specified. The Depositary will try, as far as practicable, subject to English law and the provisions of our memorandum and articles of association, to vote or to have its agents vote the ordinary shares or other deposited securities as you instruct. The Depositary will only vote or attempt to vote as you instruct. However, if the Depositary does not receive your voting instructions, it will give a proxy to vote your ordinary shares to our designated representative.
We cannot assure you that you will receive the voting materials in time to ensure that you can instruct the Depositary to vote your ordinary shares. In addition, the Depositary and its agents are not responsible for failing to carry out voting instructions or for the manner of carrying out voting instructions as long as they act in good faith and are not negligent. This means that you may not be able to exercise your right to vote and there may be nothing you can do if your ordinary shares are not voted as you requested.
Record date
The Depositary will fix record dates that are the same, or as close as practicable to, the corresponding record date for the ordinary shares
- •
- for the determination of the ADS holders who will be:
- •
- entitled to receive a dividend, distribution or rights;
- •
- entitled to give instructions for the exercise of voting rights at a meeting of holders of ordinary shares or other deposited securities; or
- •
- responsible for any charges assessed by the Depositary;
- •
- for fixing the date on or after which each ADS will represent the charged number of ordinary shares all subject to the provisions of the deposit agreement.
Notices and reports
Upon receipt of notice of any meeting of holders of ADSs or other deposited securities, if requested in writing by us, the Depositary will, as soon as practicable thereafter, mail to the owners of ADSs a notice which contains (a) such information as is contained in such notice of meeting received by the Depositary from us, (b) a statement that the owners of ADSs as of the close of business on a specified record date will be entitled, subject to any applicable provisions of English law and of our
99
memorandum and articles of association, to instruct the Depositary as to the exercise of the voting rights, if any, pertaining to the amount of ordinary shares or other deposited securities represented by their respective ADSs, and (c) a statement as to the manner in which instructions may be given.
The Depositary will make available for inspection by registered holders at its corporate trust office any reports and communications, including any proxy soliciting material, received from us, which are both (a) received by the Depositary as the holder of the deposited securities, and (b) made generally available to the holders of such deposited securities by us. The Depositary will also, upon written request, send to the registered holders copies of such reports when furnished by us pursuant to the deposit agreement. Any such reports and communications, including any proxy soliciting material, furnished to the Depositary by us will be furnished in English. The Depositary will also make available for inspection at its corporate trust office its books for the registration and transfer of ADSs. However, any such inspection will not be for the purpose of communicating with registered holders of ADSs in the interest of a business or object other than the business of our company, or matters relating to the deposit agreement or the ADSs.
Fees and expenses
|
ADS holders must pay:
| | For:
|
|---|
|
| $ (or less) per ADSs (or portion of ADSs) | | Each issuance of ADSs, including as a result of a distribution of shares or rights or other property and each cancellation of ADSs, including if the deposit agreement terminates |
$ (or less) per ADS (or portion thereof) |
|
Any cash payment |
A fee equivalent to the fee that would be payable if securities distributed to you had been ordinary shares and the ordinary shares had been deposited for issuance of ADS |
|
Distribution of securities distributed to holders of deposited securities which are distributed by the Depositary to ADS holders |
$ per ADS per calendar year (to the extent the Depositary has not collected a cash distribution fee of $ per ADS during that calendar year) |
|
Depositary services |
Registration or transfer fees |
|
Transfer and registration of ordinary shares on the share register of the foreign registrar to or from the name of the Depositary or its agent when you deposit or withdraw ordinary shares |
Expenses of the Depositary |
|
Conversion of UK pounds to US dollars; cable, telex and facsimile transmission expenses |
Taxes and other governmental charges the Depositary or the custodian have to pay on any ADS or ordinary share underlying an ADS such as stock transfer taxes, stamp duty tax, stamp duty reserve tax or withholding taxes |
|
As necessary |
Any charges incurred by the Depositary or its agents for servicing the Deposited securities |
|
As necessary |
|
|
|
|
100
Payment of taxes
You will be responsible for any taxes or other governmental charges payable on your ADSs or on the deposited securities underlying your ADSs. The Depositary may refuse to transfer your ADSs or allow you to withdraw the deposited securities underlying your ADSs until such taxes or other charges are paid. It may apply payments owed to you or sell deposited securities underlying your ADSs to pay any taxes owed and you will remain liable for any deficiency. If it sells deposited securities, it will, if appropriate, reduce the number of ADSs to reflect the sale and pay to you any proceeds, or send to you any property, remaining after it has paid the taxes.
Reclassifications, recapitalizations and mergers
If we change the nominal or par value of our ordinary shares; reclassify, split up or consolidate any of the deposited securities; distribute securities on the ordinary shares that are not distributed to you; or recapitalize, reorganize, merge, sell all or substantially all of our assets, or take any similar action, then:
- •
- the cash, ordinary shares or other securities received by the Depositary will become deposited securities and each ADS will automatically represent its equal share of the new deposited securities, and
- •
- The Depositary may, with our approval, and will, if we ask it to in writing, distribute new ADSs or ask you to surrender your outstanding ADSs in exchange for new ADSs, identifying the new deposited securities.
Amendment and termination
We may agree with the Depositary to amend the deposit agreement and the ADSs for any reason without your consent. If the amendment adds or increases fees or charges, except for taxes and other governmental charges or registration fees, cable, telex or facsimile transmission costs, delivery costs or other such expenses, or prejudices an important right of ADS holders, it will only become effective 30 days after the Depositary notifies you of the amendment.
At the time an amendment becomes effective, you are considered, by continuing to hold your ADSs, to agree to the amendment and to be bound by the ADSs and the deposit agreement as amended.
The Depositary will terminate the agreement if we ask it to do so. The Depositary may also terminate the agreement if it has informed us that it would like to resign and we have not appointed a new depositary bank within 60 days. In both cases, the Depositary must notify you at least 30 days before termination.
After termination, the Depositary and its agents will be required to only collect distributions on the deposited securities, will sell rights as provided in the deposit agreement and will deliver ordinary shares and other deposited securities upon cancellation of ADSs.
At any time after the expiration of one year from the date of termination, the Depositary may sell any remaining deposited securities by public or private sale. After that, the Depositary will hold the proceeds of the sale, as well as any other cash it is holding under the deposit agreement for the pro rata benefit of the ADS holders that have not surrendered their ADSs. It will not invest the money and will have no liability for interest. The Depositary's only obligation will be to account for the proceeds of the sale and other cash. After termination our only obligations will be with respect to indemnification and to pay certain amounts to the Depositary.
101
Limitations on obligations and liability to ADS holders
The deposit agreement will expressly limit our obligations and the obligations of the Depositary, and it limits our liability and the liability of the Depositary. We and the Depositary will:
- •
- only be obligated to take the actions specified in the deposit agreement without negligence or bad faith;
- •
- not be liable if either is prevented or delayed by law or circumstances beyond our control from performing our obligations under the deposit agreement;
- •
- not be liable if either exercises discretion permitted under the deposit agreement;
- •
- have no obligation to become involved in a lawsuit or other proceeding related to the ADSs or the agreement on your behalf or on behalf of any other person; and
- •
- rely upon any documents we believe to be genuine and to have been signed or presented by the proper party.
In the deposit agreement, we and the Depositary agree to indemnify each other under specified circumstances.
Requirements for Depositary actions
Before the Depositary will deliver or register a transfer of ADSs, make a distribution on ADSs or approve a withdrawal of underlying ordinary shares, the Depositary may require:
- •
- payment of stock transfer or other taxes or other governmental charges and transfer or registration fees charged by third parties for the transfer of any ordinary shares or other deposited securities;
- •
- production of satisfactory proof of the identity and genuineness of any signature or other information it deems necessary; and
- •
- compliance with regulations it may establish, from time to time, consistent with the deposit agreement, including presentation of transfer documents.
The Depositary may refuse to deliver or register transfers of ADSs when our books or those of the Depositary are closed, or at any time if the Depositary or we think it advisable to do so.
You have the right to cancel your ADSs and withdraw the underlying shares at any time except:
- •
- when temporary delays arise because the Depositary or we have closed transfer books or the deposit of ordinary shares in connection with voting at a shareholders' meeting, or paying a dividend on the ordinary shares;
- •
- when you or other ADS holders seeking to withdraw shares owe money to pay fees, taxes and similar charges; or
- •
- when it is necessary to prohibit withdrawals in order to comply with any laws or governmental regulations that apply to ADSs or to the withdrawal of ordinary shares or other deposited securities.
This right of withdrawal may not be limited by any other provision of the deposit agreement.
Books of the Depositary
The Depositary or its agent will maintain a register for the registration, transfer, combination and split-up of ADSs. You may inspect such records at such office during regular business hours, but solely
102
for the purpose of communicating with other holders in the interest of business matters relating to the deposit agreement.
The Depositary will maintain facilities to record and process the issuance, cancellation, combination, split-up and transfer of ADSs. These facilities may be closed from time to time, to the extent not prohibited by law.
Pre-release of ADSs
In specified circumstances, subject to the provisions of the agreement, the Depositary may deliver ADSs before deposit of the underlying shares. This is called a pre-release of the ADSs. The Depositary also may deliver ordinary shares upon cancellation of pre-released ADSs even if the Depositary knows the ADSs have been pre-released and the ADSs are cancelled before the pre-release transaction has been closed. A pre-release is closed as soon as the underlying shares are delivered to the Depositary. The Depositary may receive ADSs instead of ordinary shares to close a pre-release. The Depositary may pre-release ADSs only under the following conditions:
- •
- before or at the time of the pre-release, the person to whom the pre-release is being made must represent to the Depositary in writing that it or its customer:
- •
- owns the ordinary shares or ADSs to be remitted;
- •
- assigns all beneficial rights, title and interest in the ordinary shares or ADSs to the Depositary as Depositary and for the benefit of the owners, and
- •
- will not take any action with respect to the shares or ADSs that is inconsistent with the transfer of beneficial ownership (including, without the consent of the Depositary, disposing of such shares or ADSs) other than in satisfaction of such pre-release,
- •
- the pre-release must at all times be fully collateralized with cash or other collateral that the Depositary considers appropriate, and
- •
- The Depositary must be able to close out the pre-release on not more than five business days' notice.
In addition, the Depositary will limit the number of ADSs that may be outstanding at any time as a result of pre-release to 30 percent of total shares deposited, although the Depositary may disregard the limit from time to time, if it thinks it is appropriate to do so.
In addition, the Depositary will limit the number of ADSs that may be outstanding at any time as a result of a pre-release, although the Depositary may disregard the limit from time to time if, in its judgment, it is appropriate to do so.
Disclosure of interests
By purchasing ADSs, you agree to comply with our articles of association and the laws of England regarding any disclosure requirements regarding ownership of ordinary shares, all as if the ADSs were, for this purpose, the ordinary shares they represent. By purchasing ADSs, you also agree to be bound by provisions of the deposit agreement mandating compliance with the disclosure requirements of English company law.
To facilitate compliance with the notification requirements, ADS holders may deliver any notification to the Depositary, and the Depositary will, as soon as practicable, forward the notification to us and, to the extent practicable and as permitted by applicable law, any authorities in England as specified by the ADS holder.
103
Shares eligible for future sale
Prior to this offering, there has been no public market in the United States or elsewhere for our ordinary shares or ADSs. Although we expect to have our ADSs approved for listing on the NYSE, we cannot assure you that there will be an actual public market for ADSs. Future sales of substantial amounts of our ADSs in the public market following this offering or the anticipation of these sales occurring could adversely affect prevailing market prices for our ADSs or could impair our ability to raise capital through an offering of our ADSs in the future. For a further discussion of this risk, see "Risk Factors-Risks Related to our American Depositary Shares and this offering—ADSs eligible for public sale after this offering could adversely affect the price of our ordinary shares."
Our officers, directors and shareholders, who collectively hold an aggregate of ordinary shares, and the underwriters have entered into lock-up agreements in connection with this offering. These lock-up agreements provide that, with limited exceptions, our officers, directors and other shareholders have agreed not to offer, sell, contract to sell, grant any option to purchase or otherwise dispose of any of our ordinary shares for a period after the effective date of this offering. Details of these agreements and the periods for which they apply are set out on page .
Upon the completion of this offering, we will have ordinary shares outstanding, based on the number of shares outstanding as of , 2006, immediately following the Contribution described under "Certain relationships and related party transactions—Formation of Edgen Murray Plc and the contribution" beginning on page . All of the ordinary shares sold in this offering in the form of ADSs will be freely tradable in the US public market without restriction under the Securities Act, except for any shares purchased by our "affiliates" as that term is defined in Rule 144 under the Securities Act. Some of the remaining ordinary shares held by existing shareholders are "restricted" shares as that term is defined in Rule 144 under the Securities Act. We issued and sold the restricted shares in private transactions in reliance upon exemptions from registration under the Securities Act. Restricted shares may be sold in the public market only if they are registered under the Securities Act or if they qualify for an exemption from registration, such as Rule 144 under the Securities Act, which is summarized below. The holders of of our ordinary shares after the offering will be entitled to registration rights under which we will be required to register the resale of their shares under the Securities Act. See "Certain relationships and related party transaction—Investors and registration rights agreement."
In general, under Rule 144 as currently in effect, a person, or persons whose shares are aggregated, who has beneficially owned restricted shares for at least one year, including the holding period of any prior owner except an affiliate, would be entitled to sell within any three-month period a number of ordinary shares that does not exceed the greater of:
- •
- one percent of the number of ordinary shares then outstanding, which will equal approximately ordinary shares immediately after the offering, or
- •
- the average weekly trading volume of the ADSs on the NYSE during the four calendar weeks preceding the filing of a Form 144 with respect to such sale.
Sales under Rule 144 are also subject to manner of sale provisions and notice requirements and to the availability of current public information about us. Under Rule 144(k), a person who is not deemed to have been an affiliate of our company at any time during the three months preceding a sale, and who has beneficially owned the shares proposed to be sold for at least two years including the holding period of any prior owner except an affiliate, is entitled to sell the ordinary shares without complying with the manner of sale, public information, volume limitation or notice provisions of Rule 144.
104
Income tax considerations
US federal income taxation
The following is the opinion of Dechert LLP and describes the material US federal income tax consequences that are relevant with respect to the acquisition, ownership and disposition of ordinary shares and/or ADSs by a US Holder (as defined below). This summary addresses only US federal income tax considerations of US Holders that will hold ordinary shares and /or ADSs as capital assets. It does not purport to be a comprehensive description of all the tax considerations that may be relevant to a decision to purchase ordinary shares and/or ADSs. In particular, this summary does not address all of the tax considerations applicable to holders that may be subject to special tax rules including, without limitation, the following: (a) financial institutions; (b) insurance companies; (c) dealers or traders in securities, currencies or notional principal contracts; (d) tax-exempt entities; (e) persons that will hold ordinary shares and/or ADSs as part of a "hedging" or "conversion" transaction or as a position in a "straddle" or as part of a "synthetic security" or other integrated transaction for US federal income tax purposes; (f) persons that have a "functional currency" other than the US dollar; (g) persons that own (or are deemed to own) 10% or more (by voting power) of our share capital who would, if we were considered to be a controlled foreign corporation for US federal income tax purposes, be subject to special rules; (h) regulated investment companies; (i) persons who hold ordinary shares and/or ADSs through partnerships or other pass-through entities; (j) real estate investment trusts; and (k) S corporations. Further, this summary does not address alternative minimum tax consequences.
This summary is based on the Internal Revenue Code of 1986, as amended (the Code), US Treasury regulations and judicial and administrative interpretations thereof, in each case as in effect and available on the date of this prospectus. All of the foregoing is subject to change, which change could apply retroactively and could affect the tax consequences described below.
Each prospective investor should consult its own tax advisor with respect to the US federal, estate, state, local, gift and other tax consequences of acquiring, owning and disposing of the ordinary shares and/or ADSs. US Holders should also review the discussion under "Taxation-UK Tax Considerations" for the UK tax consequences to a US Holder of the ownership of the ordinary shares and/or ADSs.
For purposes of this summary a "US Holder" is a beneficial owner of ordinary shares and/or ADSs that is, for US federal income tax purposes: (a) an individual who is a citizen or resident of the United States; (b) a corporation or other entity treated as a corporation, created or organized in or under the laws of the United States or any state or political subdivision thereof (including the District of Columbia); (c) an estate, the income of which is subject to US federal income taxation regardless of its source; or (d) a trust if (i) a court within the United States is able to exercise primary supervision over its administration and one or more United States persons have the authority to control all of the substantial decisions of such trust or (ii) the trust has a valid election in effect under applicable US Treasury regulations to be treated as a United States person. If a partnership or any other entity treated as a partnership for US federal income tax purposes holds ordinary shares and/or ADSs, the consequences to a partner will generally depend upon the status of the partner and upon the activities of the partnership. A partner of a partnership holding ordinary shares and/or ADSs should consult its own tax advisor. A "Non-US Holder" is a beneficial owner of ordinary shares and/or ADSs, other than a partnership or entity treated as a partnership, that is not a US Holder.
For US federal income tax purposes, a holder of ADSs generally will be treated as the owner of the shares represented by such ADSs.
105
Distributions
Subject to the discussion below under "Passive Foreign Investment Company Considerations," the gross amount of any distribution that is actually or constructively received by a US Holder with respect to its ordinary shares (including shares deposited in respect of ADSs) will be a dividend includible in gross income of a US Holder as ordinary income to the extent the amount of such distribution does not exceed our current and accumulated earnings and profits determined under US tax principles. To the extent the amount of such distribution exceeds our current and accumulated earnings and profits as so computed, it will be treated first as a non-taxable return of capital to the extent of such US Holder's adjusted tax basis in its ordinary shares and/or ADSs, and to the extent the amount of such distribution exceeds such adjusted tax basis, will be treated as gain from the sale of the ordinary shares and/or ADSs. Dividends paid on ordinary shares and/or ADSs generally will constitute income from sources outside the United States and will not be eligible for the "dividends received deduction" generally available to United States corporate shareholders. The gross amount of any dividend paid in foreign currency will be included in the gross income of a US Holder in an amount equal to the US dollar value of the foreign currency calculated by reference to the exchange rate in effect on the date the foreign currency is received by the Depositary, in the case of ADSs, or the US Holder, in the case of ordinary shares, regardless of whether the foreign currency is converted into US dollars. If the foreign currency is converted into US dollars on the date of receipt by the Depositary, in the case of ADSs, or the US Holder, in the case of ordinary shares, a US Holder generally should not be required to recognize foreign currency gain or loss in respect of the dividend. If the foreign currency received is not converted into US dollars on the date of receipt, a US Holder will have a basis in the foreign currency equal to its US dollar value on the date of receipt. Any gain or loss on a subsequent conversion or other disposition of the foreign currency will be treated as ordinary income or loss, and will generally be income or loss from sources within the United States for foreign tax credit limitation purposes. The amount of any distribution of property other than cash will be the fair market value of the property on the date of the distribution.
Under current US law, certain distributions received by individuals (as well as certain trusts and estates) in taxable years beginning before January 1, 2011, generally will be taxed at a preferential tax rate (rather than the higher rates of tax generally applicable to items of ordinary income). This preferential rate is only applicable to distributions paid by "qualified corporations" and only with respect to ordinary shares and/or ADSs held for a minimum holding period of more than 61 days during a specified 121-day period. If we are a passive foreign investment company (PFIC) (as discussed below under "Passive Foreign Investment Company Considerations"), we will not be considered a "qualified corporation" for these purposes. Accordingly, if we are a PFIC, distributions paid by us with respect to ordinary shares and/or ADSs will not be eligible for a reduced income tax rate. If we are not a PFIC, distributions paid by us will so qualify for the preferential rate, assuming the holding period requirement is also met. Prospective investors should consult their own tax advisors regarding the taxation of distributions under these rules.
A distribution of additional shares and/or ADSs to US Holders with respect to their ordinary shares and/or ADSs that is part of a pro rata distribution of ordinary shares to all shareholders (including holders of ADSs) generally will not be subject to US federal income tax.
For purposes of calculating the foreign tax credit, dividends paid on ordinary shares and/or ADSs will be treated as income from sources outside the United States and will generally constitute "passive income" or, in the case of certain US Holders, "financial services income" (or, for tax years beginning after December 31, 2006, as "passive category income," or, in the case of some US Holders, as "general category income.") The amount of the qualified dividend income, if any, paid to a US Holder that is subject to the reduced dividend income tax rate that is taken into account for purposes of calculating the US Holder's US foreign tax credit limitation must be reduced by the "rate differential
106
portion" of the dividend (which, assuming a US Holder is in the highest income tax bracket, would generally require a reduction of the dividend amount by approximately 57.14%). Prospective investors should consult their own tax advisors regarding the implications of the foreign tax credit provisions for them, in light of their particular situation.
Subject to the discussion under "Backup Withholding and Information Reporting," a Non-US Holder generally will not be subject to US federal income or withholding tax on dividends received on ordinary shares and /or ADSs unless that income is effectively connected with the conduct by that Non-US Holder of a trade or business within the United States (and, if any applicable income tax treaty so requires, is attributable to a permanent establishment maintained by the Non-US Holder in the United States).
Sale or other disposition
Subject to the discussion below under "Passive Foreign Investment Company Considerations," a US Holder will generally recognize a gain or loss for US federal income tax purposes upon the sale or exchange of ordinary shares and/or ADSs in an amount equal to the difference between the US dollar value of the amount realized from such sale or exchange and the US Holder's tax basis in such ordinary shares and/or ADSs. Such gain or loss will be a capital gain or loss and will be long-term capital gain (taxable at a reduced rate for non-corporate US Holders, including individuals, trusts or estates) if the ordinary shares and/or ADSs were held for more than one year. Any such gain or loss would generally be treated as from sources within the United States for foreign tax credit limitation purposes. The deductibility of capital losses is subject to significant limitations.
A US Holder that receives foreign currency on the sale or other disposition of ordinary shares and/or ADSs will realize an amount equal to the US dollar value of the foreign currency on the date of sale (or, in the case of cash basis and electing accrual basis taxpayers, the US dollar value of the foreign currency on the settlement date) provided that the ordinary shares or ADSs, as the case may be, are treated as being "traded on an established securities market." If a US Holder receives foreign currency upon a sale or exchange of ordinary shares and/or ADSs, gain or loss, if any, recognized on the subsequent sale, conversion or disposition of such foreign currency will be ordinary income or loss, and will generally be income or loss from sources within the United States for foreign tax credit limitation purposes. However, if such foreign currency is converted into US dollars on the date received by the US Holder, a cash basis or electing accrual US Holder should not recognize any gain or loss on such conversion.
Subject to the discussion below under "Backup Withholding and Information Reporting," a Non-US Holder generally will not be subject to US federal income or withholding tax on any gain realized on the sale or exchange of ordinary shares and/or ADSs unless: (a) that gain is effectively connected with the conduct by that Non-US Holder of a trade or business in the United States (and, if any applicable income tax treaty so requires, is attributable to a permanent establishment maintained by the Non-US Holder in the United States), or (b) in the case of any gain realized by an individual Non-US Holder, that holder is present in the United States for 183 days or more in the taxable year of the sale or exchange and certain other conditions are met.
Redemption
Subject to the discussion below under "Passive foreign investment company considerations," a redemption of ordinary shares and/or ADSs by us will be treated as a sale of the redeemed ordinary shares and/or ADSs by the US Holder (which is taxable as described under "Sale or Other Disposition") or, in certain circumstances, as a distribution to the US Holder (which is taxable as described under "Distributions").
107
Passive foreign investment company considerations
A corporation organized outside the United States generally will be classified as a PFIC for US federal income tax purposes in any taxable year in which either: (a) at least 75% of its gross income is "passive income" (the "income test"), or (b) at least 50% of the gross average quarterly fair market value of its assets is attributable to assets that produce "passive income" or are held for the production of passive income (the "asset test"). Passive income for this purpose generally includes dividends, interest, royalties, rents and gains from commodities and securities transactions. In determining whether it is a PFIC, a foreign corporation is required to take into account a pro rata portion of the income and assets of each corporation in which it owns, directly or indirectly, at least a 25% interest.
We believe that we will not be a PFIC for US federal income tax purposes for our current taxable year, and we believe it is unlikely that we will be a PFIC in any future year although no assurance may be given in that regard. If we are a PFIC in any year, special, possibly materially adverse, consequences would result for US Holders. If we are classified as a PFIC in any year that a US Holder is a shareholder, we generally will continue to be treated as a PFIC for that US Holder in all succeeding years, regardless of whether we continue to meet the income or asset test described above, unless the US Holder has made an election to recognize gain as if such US Holder sold its PFIC stock as of the last day of the last taxable year for which we were a PFIC.
Accurate predictions of the nature of our income and the composition of our assets are difficult. Prospective investors should consult their own tax advisers concerning the applicability of the PFIC rules.
Backup withholding and information reporting
Backup withholding and information reporting requirements may apply to certain payments to US Holders of dividends on ordinary shares and/or ADSs and to the proceeds of a sale or redemption of an ordinary share and/or ADS. We, our agent, a broker, or any paying agent, as the case may be, may be required to withhold tax from any payment that is subject to backup withholding at a rate of 28% (which rate may be subject to change in the future) of such payment if the US Holder fails (a) to furnish the US Holder's taxpayer identification number, (b) to certify that such US Holder is not subject to backup withholding or (c) to otherwise comply with the applicable requirements of the backup withholding rules. Certain US Holders (including, among others, corporations) are not subject to the backup withholding and information reporting requirements.
Non-US Holders who hold their ordinary shares and/or ADSs through a US broker or agent or through the US office of a non-US broker or agent may be required to comply with applicable certification procedures to establish that they are not US Holders in order to avoid the application of such information reporting requirements and backup withholding.
Backup withholding is not an additional tax. Any amounts withheld under the backup withholding rules from a payment to a US Holder generally may be claimed as a credit against such US Holder's US federal income tax liability provided that the required information is furnished to the US Internal Revenue Service.
Prospective investors should consult their own tax advisors as to their qualification for exemption from backup withholding and the procedure for obtaining this exemption.
UK tax considerations
The following is a summary of certain aspects of current UK tax legislation and H.M. Revenue and Customs practice. These considerations may not apply to certain categories of shareholders or ADS holders such as dealers. If you are in any doubt as to your taxation position or if you are subject to
108
tax in any jurisdiction other than the UK, you should consult an appropriate professional adviser immediately.
Taxation of dividends
Under current UK taxation legislation, no tax will be withheld or deducted for or on account of income tax from dividends paid by us.
A UK resident individual shareholder will generally be entitled to a tax credit in respect of any dividend received. The amount of the tax credit is equal to one-ninth of the cash dividend or 10% of the aggregate of the cash dividend and the associated tax credit (the "Gross Dividend"). An individual shareholder who, taking account of the Gross Dividend he receives, is liable to income tax at the basic or starting rate will pay income tax at 10 percent of the Gross Dividend so that the tax credit will satisfy his income tax liability on the dividend payment. An individual shareholder must, to the extent that this income, including the Gross Dividend, exceeds the threshold for higher rate income tax, pay income tax at 32.5 percent of the Gross Dividend. After deducting the tax credit, he would therefore have to account for additional income tax at 22.5 percent of the Gross Dividend.
UK resident shareholders who are not liable to UK tax on dividends, including pension funds and charities, will not be entitled to claim repayment of the tax credit attaching to dividends paid by us.
A UK resident corporate shareholder will generally not be subject to UK corporation tax on dividends. Such shareholders will not be able to claim repayment of the tax credit attaching to dividends paid by us.
A non-UK resident shareholder is not generally entitled to the benefit of a tax credit in respect of any dividend received. A non UK resident shareholder may also be subject to foreign taxation on dividend income under local law. A shareholder who is not resident in the UK for tax purposes should consult his own tax adviser concerning his tax liabilities on dividends.
The tax treatment described above will also apply where dividends are received in respect of shares held in ADS form.
Taxation of capital gains
A holder who is not resident or ordinarily resident in the UK and whose shares (or ADSs) are not attributable to a trade, profession or vocation carried on in the United Kingdom through a branch or agency (or permanent establishment) will not be subject to UK tax on capital gains realized on a disposal of the shares (or ADSs), save as mentioned in the following paragraph in relation to individuals. Such a holder may however be liable to non-UK tax under local law. A disposal of shares by a shareholder (or ADSs by an ADS holder) who is resident or, in the case of an individual, ordinarily resident for tax purposes in the United Kingdom or who is not UK-resident but carries on a trade, profession or vocation in the United Kingdom through a branch or agency (or permanent establishment in the case of a holder which is a company) to which the shares (or ADSs) are attributable, may, depending on the holder's circumstances and subject to any available exemption or relief, give rise to a chargeable gain or allowable loss for the purposes of the taxation of chargeable gains. A holder who is an individual and who has, on or after March 17, 1998, ceased to be resident or ordinarily resident for tax purposes in the United Kingdom for a period of less than 5 complete tax years and who disposes of the shares (or ADSs) during that period may also be liable to UK taxation of chargeable gains (subject to any available exemption or relief) if that holder returns to the United Kingdom as resident or ordinarily resident within that period.
On a disposal of shares (or ADSs) by an individual who is resident or ordinarily resident in the United Kingdom for taxation purposes, the shares (or ADSs) may attract taper relief, which reduces the amount of chargeable gains according to how long the shares (or ADSs) have been held.
109
A holder who is a company resident in the United Kingdom for tax purposes will benefit from indexation allowance which, in general terms, increases the capital gains tax base cost of an asset in accordance with changes in the retail prices index.
UK stamp duty and stamp duty reserve tax
No stamp duty or stamp duty reserve tax ("SDRT"), is payable on the issue of the shares other than an issue to issuers of depositary receipts or providers of clearance services (or their nominees or agents). Investors who receive shares in the form of ADSs will not be required to pay any UK stamp duty or SDRT in respect of the initial issuance of such ADSs.
The transfer on sale of a share outside the CREST system will generally be liable to ad valorem stamp duty at the rate of 0.5% of the amount or value of the consideration for the transfer rounded up to the nearest UK£5 The purchaser normally pays the stamp duty.
An unconditional agreement to sell a share will generally give rise to a liability on the purchaser to SDRT at the rate of 0.5% of the amount or value of the consideration for the sale. If a duly stamped transfer in respect of the agreement is produced within six years of the date that the agreement is entered into or (if later) the date that it becomes unconditional, any SDRT paid is repayable, generally with interest, and any unpaid SDRT charge is cancelled.
Issues or transfers of shares (1) to, or to a nominee or agent for, a person whose business is or includes issuing depositary receipts or (2) to, or to a nominee or agent for, a person whose business is or includes providing clearance services, will generally be subject to stamp duty or SDRT at 1.5% of the amount or value of the consideration or, in certain circumstances, the value of the shares transferred or the same price (rounded up to the nearest UK£5 in the case of stamp duty). Strictly the Depositary or clearance operator, or its nominee, as the case may be, will be accountable for this liability for stamp duty or SDRT. However, it will in practice generally be reimbursed by participants in the clearance service or depositary receipt scheme. As noted above, special arrangements have been made in relation to the payment of SDRT on the initial issue of shares in ADS form.
No UK stamp duty will be payable on the acquisition of any ADS or any subsequent transfer of an ADS provided that the transfer and any subsequent instrument of transfer remains at all times outside the United Kingdom and that the instrument of transfer is not executed in or brought into the United Kingdom. An agreement to transfer an ADS will not give rise to SDRT. On a transfer of shares from the custodian to a holder of an ADS upon cancellation of the ADS, a fixed stamp duty of UK£5 per instrument of transfer will be payable. Any transfer for value of the underlying shares represented by ADSs or agreement to transfer these underlying shares may give rise to a liability on the transferee to stamp duty or SDRT.
Clearance service providers may make an election under Section 97A of the Finance Act 1986 in respect of the shares. Under Section 97A of the Finance Act 1986, clearance services may, provided they meet certain conditions, elect for the 0.5% rate of stamp duty or SDRT to apply to transfers of securities both to and within such systems instead of the 1.5% rate applying to an issue or transfer of such securities into the clearance service and exemption for dealings within the clearance system.
Under the CREST system for paperless share transfers, no stamp duty or SDRT will arise on a transfer of shares into the system unless such transfer is made for a consideration in money or money's worth, in which case a liability to SDRT (usually at the rate of 0.5%) will arise. Paperless transfers of shares within CREST will be liable to SDRT rather than stamp duty.
THE ABOVE SUMMARIES REFLECT CERTAIN ASPECTS OF CURRENT LAW AND PRACTICE IN THE UNITED KINGDOM. PROSPECTIVE SHAREHOLDERS WHO ARE IN DOUBT AS TO THEIR TAX POSITION OR WHO MAY BE SUBJECT TO TAX IN ANY OTHER JURISDICTION SHOULD CONSULT THEIR PROFESSIONAL ADVISERS.
110
Underwriting
We are offering the ADSs described in this prospectus through a number of underwriters. J.P. Morgan Securities Inc., Lehman Brothers Inc. and Jefferies & Company, Inc. are acting as joint book-running managers of the offering. We have entered into an underwriting agreement with the underwriters. Subject to the terms and conditions of the underwriting agreement, we have agreed to sell to the underwriters, and each underwriter has severally agreed to purchase, at the public offering price less the underwriting discount set forth on the cover page of this prospectus, the number of ADSs listed next to its name in the following table:
|
Underwriters
| | Number of ADSs
|
|---|
|
| J.P. Morgan Securities Inc. | | |
| Lehman Brothers Inc. | | |
| Jefferies & Company, Inc. | | |
| Morgan Keegan & Company, Inc. | | |
| Stifel, Nicolaus & Company, Incorporated | | |
| | |
|
| Total | | |
|
|
|
|
The underwriters are committed to purchase all the ADSs offered by the allotment if they purchase any ADSs. The underwriting agreement provides that if an underwriter defaults, the purchase commitments of non-defaulting underwriters may be increased or the offering may be terminated. The underwriting agreement also provides that the obligations of the underwriters are subject to certain conditions precedent, including the absence of any material adverse change in our business and the receipt of certain certificates, opinions and letters from us our counsel and our independent auditors.
The underwriters propose to offer the ADSs directly to the pubic at the initial public offering price set forth on the cover page of this prospectus and to certain dealers at that price less a concession not in excess of $ per ADS. Any such dealers may resell ADSs to certain other brokers or dealers at a discount of up to $ per ADS from the initial public offering price. After the initial public offering of the ADSs, the offering price and other selling terms may be changed by the underwriters. Sales of ADSs made outside of the United States may be made by affiliates of the underwriters. The underwriters have informed us that they do not intend to confirm sales to discretionary accounts that exceed 5% of the total number of ADSs offered by them or without the prior specific written approval of the customers.
Option to purchase additional ADSs
The underwriters have an option to buy up to additional ADSs from certain of our shareholders to cover sales of ADSs by the underwriters which exceed the number of ADSs specified in the table above. The underwriters have 30 days from the date of this prospectus to exercise this overallotment option. If any ADSs are purchased with this overallotment option, the underwriters will purchase ADSs in approximately the same proportion as shown in the table above. If any additional ADSs are purchased, the underwriters will offer the additional ADSs on the same terms as those on which the ADSs are being offered.
Discounts and expenses
The underwriting fee is equal to the public offering price per ADSs less the amount paid by the underwriters to us per ADSs. The underwriting fee is $ per ADS. The following table shows the
111
per ADS and total underwriting discount to be paid to the underwriters assuming both no exercise and full exercise of the underwriters' option to purchase additional ADSs:
|
| | No Exercise
| | Full Exercise
|
|---|
|
| Per ADS | | $ | | $ |
| |
|
|---|
| Total | | $ | | $ |
|
|
|
|
|
|
We estimate that the total expenses of this offering, including registration, filing and listing fees, printing fees and legal and accounting expenses, but excluding the underwriting discount, will be approximately $ , all of which will be paid by us.
Electronic distribution
A prospectus in electronic format may be made available on the web sites maintained by one or more underwriters, or selling group members, if any, participating in the offering. The underwriters may agree to allocate a number of ADSs to underwriters and selling group members for sale to their online brokerage account holders. Internet distributions will be allocated by the representatives to underwriters and selling group members that may make Internet distributions on the same basis as other allocations.
Other than the prospectus in electronic format, the information on any underwriter's or selling group member's web site and any information contained in any other web site maintained by any underwriter or selling group member is not part of the prospectus or the registration statement of which this prospectus forms a part, has not been approved or endorsed by us or any underwriter or selling group member in its capacity as underwriter or selling group member and should not be relied upon by investors.
Lock-up agreements
We, all of our directors and execution officers and certain shareholders of our other outstanding ordinary shares have agreed that, without the prior written consent of J.P. Morgan Securities Inc., Lehman Brothers Inc. and Jefferies & Company, Inc., neither we nor any of them will, with limited exceptions as described below, during the period ending 180 days after the date of this prospectus,
- •
- offer, pledge, announce the intention to sell, contract to sell, sell any option or contract to purchase, purchase any option or contract to sell, grant any option, right or warrant to purchase, or otherwise transfer or dispose of, directly or indirectly, any ADSs or ordinary shares (including, without limitation, ordinary shares which may be deemed to be beneficially owned by such directors, officers and shareholders in accordance with the rules and regulations of the SEC and securities which may be issued upon exercise of a stock option or warrant) or any securities convertible into or exercisable or exchangeable for ordinary shares;
- •
- enter into any swap or other agreement that transfers, in whole or in part, any of the economic consequences of ownership of the ADSs or ordinary shares;
- •
- make any demand for or exercise any right or file or cause to be filed a registration statement, including any amendments thereto, with respect to the registration of any ordinary shares or securities convertible, exercisable or exchangeable into ordinary shares or any of our other securities; or
- •
- publicly disclose the intention to do any of the foregoing for a period of 180 days after the date of this prospectus;
112
whether any such transaction described above is to be settled by delivery of ordinary shares or such other securities, in cash or otherwise. These restrictions will not apply to shares that may be issued on the conversion of options to purchase our ordinary shares that are currently outstanding and vested or that will vest during the lock-up period and shares of restricted stock that are currently outstanding and vested or that will vest during the lock-up period. Ordinary shares issued or issuable pursuant to awards granted during the lock-up period will be subject to the lock-up restrictions described above.
Notwithstanding the foregoing, if (1) during the last 17 days of the 180-day restricted period, we issue an earnings release or material news or a material event relating to our company occurs; or (2) prior to the expiration of the 180-day restricted period, we announce that we will release earnings results during the 16-day period beginning on the last day of the 180-day period, the restrictions described above shall continue to apply until the expiration of the 18-day period beginning on the issuance of the earnings release or the occurrence of the material news or material event, unless such extension is waived in writing by J.P. Morgan Securities Inc., Lehman Brothers Inc. and Jefferies & Company, Inc.
J.P. Morgan Securities Inc., Lehman Brothers Inc. and Jefferies & Company, Inc. may release the ADSs or ordinary shares and other securities subject to the lock-up agreements described above in whole or in part at any time with or without notice. When determining whether or not to release common stock and other securities from lock-up agreements, J.P. Morgan Securities Inc., Lehman Brothers Inc. and Jefferies & Company, Inc. will consider, among other factors, the holder's reasons for requesting the release, the number of ordinary shares and other securities for which the release is being requested and market conditions at the time.
Indemnification
We have agreed to indemnify the underwriters against certain liabilities, including liabilities under the Securities Act.
Stamp taxes
If you purchase ADSs offered in this prospectus, you may be required to pay stamp taxes and other charges under the laws and practices of the country of purchase, in addition to the offering price listed on the cover page of this prospectus. For a discussion of the applicable UK and US tax provisions, see "Income tax considerations—UK tax considerations" and "Income tax considerations—US federal income taxation," respectively.
New York stock exchange
We intend to apply for listing of our ADSs on the NYSE under the symbol "EMY."
Stabilization, short positions and penalty bids
In connection with this offering, the underwriters may engage in stabilizing transactions, which involves making bids for, purchasing and selling ADSs in the open market for the purpose of preventing or retarding a decline in the market price of the ADSs while this offering is in progress. These stabilizing transactions may include making short sales of the ADSs, which involves the sale by the underwriters of a greater number of ADSs than they are required to purchase in this offering, and purchasing ADSs on the open market to cover positions created by short sales. Short sales may be "covered" shorts, which are short positions in an amount not greater than the underwriters' overallotment option referred to above, or may be "naked" shorts, which are short positions in excess of that amount. The underwriters may close out any covered short position either by exercising their overallotment option, in whole or in part, or by purchasing ADSs in the open market. In making this determination, the underwriters will
113
consider, among other things, the price of ADSs available for purchase in the open market compared to the price at which the underwriters may purchase ADSs through the overallotment option. A naked short position is more likely to be created if the underwriters are concerned that there may be downward pressure on the price of the ADSs in the open market that could adversely affect investors who purchase in this offering. To the extent that the underwriters create a naked short position, they will purchase ADSs in the open market to cover the position.
The underwriters have advised us that, pursuant to Regulation M under the Securities Act of 1933, they may also engage in other activities that stabilize, maintain or otherwise affect the price of the ADSs, including the imposition of penalty bids. This means that if the representatives of the underwriters purchase ADSs in the open market in stabilizing transactions or to cover short sales, the representatives can require the underwriters that sold those ADSs as part of this offering to repay the underwriting discount received by them.
These activities may have the effect of raising or maintaining the market price of the ADSs or preventing or retarding a decline in the market price of the ADSs and, as a result, the price of the ADSs may be higher than the price that otherwise might exist in the open market. If the underwriters commence these activities, they may discontinue them at any time. The underwriters may carry out these transactions on the NYSE, in the over-the-counter market or otherwise.
Offering price determination
Prior to this offering, there has been no public market for the ADSs. The initial public offering price of the ADSs will be determined by negotiations between the representatives of the underwriters and us. In determining the initial public offering price, representatives of the underwriters and us expect to consider a number of factors including:
- •
- the information set forth in this prospectus and otherwise available to the representatives;
- •
- our prospects and the history and prospects for the industry in which we compete;
- •
- an assessment of our management;
- •
- our prospects for future earnings;
- •
- the general condition of the securities markets at the time of this offering;
- •
- the recent market prices of, and demand for, publicly traded common stock of generally comparable companies; and
- •
- other factors deemed relevant by the underwriters and us.
None of the underwriters, our company or the selling shareholders can assure investors that an active trading market will develop for our ADSs, or that the ADSs will trade in the public market at or above the initial public offering price.
Relationships
JCP, an affiliate of Jefferies & Company, Inc., will receive a portion of the net proceeds of this offering in connection with the redemption of our preference shares. For a description of the redemption see "Use of Proceeds" and "Certain relationships and related party transactions—Formation of Edgen Murray Plc and the contribution." JCP has the right to designate a member to the Board of Directors of Edgen Murray Plc. For a description of the directors designated by an affiliate, see "Related Party Transactions." Mr. Brian P. Friedman, who serves as President of JCP, is also the Chairman of the Executive Committee of Jefferies & Company, Inc.
114
Entities affiliated with Jefferies & Company, Inc. beneficially own more than 10% of our ordinary shares. Jefferies & Company, Inc. is therefore deemed to have a "conflict of interest" under Rule 2720 of the Conduct Rules of the National Association of Securities Dealers, Inc. Accordingly, this offering will be made in compliance with the applicable provisions of Rule 2720 of the conduct rules. That rule requires that the initial public offering price can be no higher than that recommended by a "qualified independent underwriter," as defined by the NASD. Lehman Brothers Inc. has served in that capacity and performed due diligence investigations and reviewed and participated in the preparation of the registration statement of which this prospectus forms a part.
Certain of our executive officers and directors and affiliates of the underwriters who are holders of our outstanding preference shares will receive a portion of the proceeds of this offering.
Certain of the underwriters and their affiliates have provided in the past to us and our affiliates and may provide from time to time in the future certain commercial banking, financial advisory, investment banking and other services for us and such affiliates in the ordinary course of their business, for which they have received and may continue to receive customary fees and commissions. In addition, from time to time, certain of the underwriters and their affiliates may effect transactions for their own account or the account of customers, and hold on behalf of themselves or their customers, long or short positions in our debt or equity securities or loans, and may do so in the future.
115
Legal matters
Certain legal matters in connection with the offering with respect to the US federal securities laws, New York law and the laws of England and Wales will be passed upon for us by Dechert LLP, London, England and for the underwriters by Vinson & Elkins LLP, Houston, Texas and Vinson & Elkins, RLLP, London, England.
Experts
The balance sheet of Edgen Murray Plc as of November 4, 2006, included in this prospectus has been audited by Deloitte & Touche LLP, an independent registered public accounting firm, as stated in their report appearing herein, and has been so included in reliance upon the report of such firm given upon their authority as experts in accounting and auditing.
The consolidated financial statements of Edgen/Murray, L.P. and subsidiaries as of December 31, 2005 and 2004, and for the period February 1, 2005 to December 31, 2005, the period January 1, 2005 to January 31, 2005 and the years ended December 31, 2004 and 2003, included in this prospectus have been audited by Deloitte & Touche LLP, an independent registered public accounting firm, as stated in their report appearing herein, and has been so included in reliance upon the report of such firm given upon their authority as experts in accounting and auditing.
The consolidated financial statements of Murray International Metals Limited and subsidiaries as of January 31, 2005 and 2004 and for each of the three years in the period ended January 31, 2005 included in this prospectus have been audited by Deloitte & Touche LLP, independent auditors, as stated in their report appearing herein (which report expresses an unqualified opinion on the consolidated financial statements and includes an explanatory paragraph referring to the differences between accounting principles generally accepted in the United Kingdom and accounting principles generally accepted in the United States of America), and has been so included in reliance upon the report of such firm given upon their authority as experts in accounting and auditing.
Enforceability of certain judgments and service of process
Edgen Murray Plc is organized under the laws of England. Certain directors or officers of Edgen Murray Plc are neither citizens nor residents of the United States. A significant part of our assets and all of the assets of our directors and officers who are neither citizens nor residents of the United States are located outside the United States. Although we have agreed in certain circumstances to accept service of process in the United States by agents designated for such purpose, it may not be possible (a) to effect service of process upon certain of our directors or officers or (b) to enforce judgments of courts of the United States predicated upon the civil liability of such persons under the US securities laws against any such persons in the courts of a foreign jurisdiction. We have been advised by our English legal counsel, Dechert LLP, that there is also doubt as to the direct enforceability in the United Kingdom against any of these persons, in an original action or in an action for the enforcement of judgments of US courts, of civil liabilities predicated solely upon the federal securities laws of the United States.
Currency and exchange rate information
In this prospectus, references to "US dollars," "$" or "¢" are to the lawful currency of the United States, and all areas subject to its jurisdiction. References to "UK pounds," "UK£" or "pence" are to the lawful currency of the United Kingdom. References to "Euro" or "€" are to the single currency adopted by participating member states of the European Union as their lawful currency in accordance
116
with legislation of the European Union relating to Economic and Monetary Union. References to "Singapore dollars" and "S$" are references to the lawful currency of Singapore. References to "AED" and "UAE dirhams" are references to lawful currency of the United Arab Emirates. References to "CAD" and "Canadian dollars" are references to lawful currency of Canada.
The following table sets forth for the periods presented and the dates indicated the high, low, period average and period end noon buying rates in the City of New York for cable transfers of UK pounds as certified for customs purposes by the Federal Reserve Bank of New York expressed as US dollars per UK£1.00 (the noon buying rate). The noon buying rate on , 2006 was UK£1 = $ . Unless otherwise indicated, UK pound amounts have been translated into US dollars at the , 2006 noon buying rate reported by the Federal Reserve Bank of New York.
|
| | High
| | Low
| | Period(1)
Average
| | Period
End
|
|---|
|
| Twelve months ended December 31, | | | | | | | | |
| 2002 | | 1.61 | | 1.41 | | 1.50 | | 1.61 |
| 2003 | | 1.78 | | 1.55 | | 1.63 | | 1.78 |
| 2004 | | 1.95 | | 1.75 | | 1.83 | | 1.92 |
| 2005 | | 1.93 | | 1.71 | | 1.82 | | 1.72 |
Three months ended |
|
|
|
|
|
|
|
|
| March 31, 2006 | | 1.79 | | 1.73 | | 1.75 | | 1.74 |
| June 30, 2006 | | 1.89 | | 1.74 | | 1.83 | | 1.85 |
| September 30, 2006 | | 1.91 | | 1.82 | | 1.88 | | 1.87 |
|
- (1)
- The daily average of the noon buying rates in the City of New York for cable transfers of UK pounds as certified for customs purposes by the Federal Reserve Bank of New York during the relevant period.
Where you can find more information
We have filed with the SEC a registration statement on Form S-1 under the Securities Act with respect to the ADSs evidenced by ADRs offered hereby. This prospectus, which forms part of the registration statement, does not contain all of the information set forth in the registration statement and the exhibits to the registration statement. Some items are omitted in accordance with the rules and regulations of the SEC. Any statement made in this prospectus concerning the contents of any contract, agreement or other document is not necessarily complete.
For further information about us, our ADSs and any document referred to in this prospectus, we refer you to the registration statement and the exhibits to the registration statement filed as part of the registration statement. If we have filed any contract, agreement or other document as an exhibit to the registration statement, you should read the exhibit for a more complete understanding of the documents or matter involved. The registration statement, its exhibits and schedules and other information that we have filed with or furnished to the SEC may be inspected at the SEC's public reference room at room 1024, 100F Street, N.E., Washington, DC 20549. Copies of this material can be obtained from the Public Reference Section of the SEC upon payment of fees prescribed by the SEC. You may call the SEC at (800) SEC-0350 for further information on the operation of the public reference room. Our filings will also be available to the public from commercial document retrieval services and the SEC Web site at www.sec.gov.
On our behalf, the depositary in respect of the ADSs will distribute to the holders of ADSs on an annual basis an annual report and interim reports. We will provide the Depositary with copies of any other notices, reports and communications we give to our shareholders and we will ask the Depositary to forward copies of these to you.
117
Index to Financial Statements
| Edgen Murray Plc—Audited balance sheet | | |
Report of independent registered public accounting firm |
|
F-3 |
| Balance sheet at November 4, 2006 | | F-4 |
| Note to balance sheet | | F-5 |
Edgen/Murray, L.P.—Audited and unaudited consolidated financial statements |
|
|
Audited consolidated financial statements |
|
|
| Report of independent registered public accounting firm | | F-7 |
| Consolidated balance sheets at December 31, 2005 (Successor) and 2004 (Predecessor) | | F-8 |
| Consolidated statements of operations for the period February 1, 2005 to December 31, 2005 (Successor), the period January 1, 2005 to January 31, 2005 (Predecessor) and the years ended December 31, 2004 and 2003 (Predecessor) | | F-9 |
| Consolidated statements of partners' capital and shareholders' equity (deficit) for the period December 17, 2005 to December 31, 2005 (Successor), the period February 1, 2005 to December 16, 2005 (Successor), the period January 1, 2005 to January 31, 2005 (Predecessor) and the years ended December 31, 2004 and 2003 (Predecessor) | | F-10 |
| Consolidated statements of cash flows for the period February 1, 2005 to December 31, 2005 (Successor), the period January 1, 2005 to January 31, 2005 (Predecessor) and the years ended December 31, 2004 and 2003 (Predecessor) | | F-13 |
| Notes to consolidated financial statements | | F-15 |
Unaudited condensed consolidated financial statements |
|
|
| Unaudited condensed consolidated balance sheet as of June 30, 2006 (Successor) | | F-51 |
| Unaudited condensed consolidated statements of operations for the six months ended June 30, 2006 (Successor), the period February 1, 2005 to June 30, 2005 (Successor) and the period January 1, 2005 to January 31, 2005 (Predecessor) | | F-52 |
| Unaudited condensed consolidated statement of partners' capital (Successor) for the six months ended June 30, 2006 | | F-53 |
| Unaudited condensed consolidated statements of cash flows for the six months ended June 30, 2006 (Successor), the period February 1, 2005 to June 30, 2005 (Successor) and the period January 1, 2005 to January 31, 2005 (Predecessor) | | F-54 |
| Notes to unaudited condensed consolidated financial statements | | F-55 |
Murray International Metals Limited—Audited consolidated financial statements |
|
|
Consolidated financial statements at January 31, 2005 and 2004 and for each of the three years in the period ended January 31, 2005 |
|
|
| Report of independent auditors | | F-74 |
| Consolidated profit and loss accounts for each of the three years in the period ended January 31, 2005 | | F-75 |
| Consolidated statements of total recognized gains and losses for each of the three years in the period ended January 31, 2005 | | F-76 |
| Consolidated balance sheets at January 31, 2005 and 2004 | | F-77 |
| Consolidated cash flow statements for each of the three years in the period ended January 31, 2005 | | F-78 |
| Notes to the consolidated financial statements | | F-79 |
| | | |
F-1
Unaudited condensed consolidated interim financial statements at July 31, 2005 and for the six months ended July 31, 2005 and 2004 |
|
|
| Unaudited condensed consolidated profit and loss accounts for the six months ended July 31, 2005 and 2004 | | F-107 |
| Unaudited condensed consolidated statements of total recognized gains and losses for the six months ended July 31, 2005 and 2004 | | F-108 |
| Unaudited condensed consolidated balance sheets at July 31, 2005 and January 31, 2005 | | F-109 |
| Unaudited condensed consolidated cash flow statements for the six months ended July 31, 2005 and 2004 | | F-110 |
| Notes to the unaudited condensed consolidated financial statements | | F-111 |
F-2
Report of independent registered public accounting firm
To the Shareholders of Edgen Murray Plc
We have audited the accompanying balance sheet of Edgen Murray Plc (the "Company") as of November 4, 2006. This financial statement is the responsibility of the Company's management. Our responsibility is to express an opinion on this financial statement based on our audit.
We conducted our audit in accordance with the standards of the Public Company Accounting Oversight Board (United States). Those standards require that we plan and perform the audit to obtain reasonable assurance about whether the balance sheet is free of material misstatement. The Company is not required to have, nor were we engaged to perform, an audit of its internal control over financial reporting. Our audit included consideration of internal control over financial reporting as a basis for designing audit procedures that are appropriate in the circumstances, but not for the purpose of expressing an opinion on the effectiveness of the Company's internal control over financial reporting. Accordingly, we express no such opinion. An audit also includes examining, on a test basis, evidence supporting the amounts and disclosures in the balance sheet, assessing the accounting principles used and significant estimates made by management, as well as evaluating the overall balance sheet presentation. We believe that our audit provides a reasonable basis for our opinion.
In our opinion, such balance sheet presents fairly, in all material respects, the financial position of Edgen Murray Plc at November 4, 2006 in conformity with accounting principles generally accepted in the United States of America.
/s/ Deloitte & Touche LLP
New Orleans, Louisiana
November 13, 2006
F-3
Edgen Murray Plc
Balance sheet
November 4, 2006
|
| | November 4, 2006
|
|---|
|
| ASSETS | | | |
| | Cash and cash equivalents | | $ | 4 |
| | |
|
| SHAREHOLDER'S EQUITY: | | | |
| | Ordinary shares, $2, nominal value, 2 shares | | $ | 4 |
|
See accompanying note to balance sheet.
F-4
Edgen Murray Plc
Note to balance sheet
November 4, 2006
1. Organization
On November 2, 2006, Edgen Murray Plc ("Edgen Murray Plc") was formed by Edgen/Murray, L.P. to become the new holding company for its subsidiaries, Edgen Corporation and Pipe Acquisition Ltd. Edgen Murray Plc issued two ordinary shares to Edgen/Murray, L.P.
Edgen Murray Plc intends to offer American Depositary Receipts, representing ordinary shares, pursuant to an initial public offering. In addition, Edgen Murray Plc will utilize proceeds from the offering to repay Pipe Acquisition Ltd.'s $130.0 million Senior Secured Floating Rate Notes due 2010 with accrued interest and related penalties, and to redeem its preference shares which will be exchanged with Edgen/Murray, L.P. units immediately prior to or simultaneously with an initial public offering.
During the period from incorporation to the date of these financial statements, November 4, 2006, Edgen Murray Plc had no operations and no cash flows other than the capitalization discussed above.
F-5
(This page has been left blank intentionally.)
F-6
Report of independent registered public accounting firm
To the Partners of Edgen/Murray, L.P.
Baton Rouge, Louisiana
We have audited the accompanying consolidated balance sheets of Edgen/Murray, L.P. and Subsidiaries (the "Company") as of December 31, 2005 and 2004 and the related consolidated statements of operations, partners' capital and shareholders' equity (deficit) and cash flows for the period February 1, 2005 to December 31, 2005, the period January 1, 2005 to January 31, 2005 and the years ended December 31, 2004 and 2003. These financial statements are the responsibility of the Company's management. Our responsibility is to express an opinion on the financial statements based on our audits.
We conducted our audits in accordance with the standards of the Public Company Accounting Oversight Board (United States). Those standards require that we plan and perform the audit to obtain reasonable assurance about whether the financial statements are free of material misstatement. The Company is not required to have, nor were we engaged to perform, an audit of its internal control over financial reporting. Our audits included consideration of internal control over financial reporting as a basis for designing audit procedures that are appropriate in the circumstances, but not for the purpose of expressing an opinion on the effectiveness of the Company's internal control over financial reporting. Accordingly, we express no such opinion. An audit also includes examining, on a test basis, evidence supporting the amounts and disclosures in the financial statements, assessing the accounting principles used and significant estimates made by management, as well as evaluating the overall financial statement presentation. We believe that our audits provide a reasonable basis for our opinion.
In our opinion, such consolidated financial statements present fairly, in all material respects, the financial position of the Company at December 31, 2005 and 2004, and the results of their operations and their cash flows for the period February 1, 2005 to December 31, 2005, the period January 1, 2005 to January 31, 2005 and the years ended December 31, 2004 and 2003 in conformity with accounting principles generally accepted in the United States of America.
/s/ Deloitte & Touche LLP
New Orleans, Louisiana
November 13, 2006
F-7
Edgen/Murray, L.P. and Subsidiaries
Consolidated balance sheets
December 31, 2005 and 2004
(In thousands, except per unit/share data)
| |
| | Successor
2005
| | Predecessor
2004
| |
|---|
| |
| Assets | | | | | | | |
| Current assets: | | | | | | | |
| | Cash and cash equivalents | | $ | 41,146 | | $ | 134 | |
| | Accounts receivable—net of allowance for doubtful accounts of $698 and $659, respectively | | | 111,019 | | | 31,751 | |
| | Accounts receivable—related parties | | | 565 | | | — | |
| | Inventory | | | 133,698 | | | 57,960 | |
| | Income tax receivable | | | 22 | | | 2,601 | |
| | Prepaid expenses and other current assets | | | 2,853 | | | 935 | |
| | Deferred tax asset | | | 1,703 | | | 1,472 | |
| | |
| |
| | Total current assets | | | 291,006 | | | 94,853 | |
| Property, plant and equipment—net | | | 40,940 | | | 10,423 | |
| Goodwill | | | 69,524 | | | 6,459 | |
| Other intangible assets | | | 99,081 | | | 59 | |
| Other assets | | | 179 | | | 115 | |
| Deferred tax asset | | | — | | | 6,918 | |
| Deferred financing costs | | | 19,491 | | | 35 | |
| | |
| |
| Total | | $ | 520,221 | | $ | 118,862 | |
| | |
| |
| Liabilities, redeemable preferred stock and partners' capital and shareholders' equity (deficit) | | | | | | | |
| Current liabilities: | | | | | | | |
| | Managed cash overdrafts | | $ | 1,162 | | $ | 1,361 | |
| | Accounts payable | | | 86,869 | | | 19,018 | |
| | Accounts payable—related parties | | | 196 | | | — | |
| | Accrued expenses and other current liabilities | | | 26,487 | | | 5,441 | |
| | Accrued interest payable | | | 7,375 | | | 935 | |
| | Deferred purchase price consideration | | | 13,167 | | | — | |
| | Current portion of capital lease | | | 232 | | | — | |
| | Current portion of long-term debt | | | 2,331 | | | 7,230 | |
| | |
| |
| | Total current liabilities | | | 137,819 | | | 33,985 | |
| Deferred tax liability | | | 26,465 | | | — | |
| Capital lease | | | 20,589 | | | — | |
| Long-term debt | | | 263,536 | | | 40,653 | |
| | |
| |
| Total liabilities | | | 448,409 | | | 74,638 | |
| Mandatorily redeemable preferred stock, $.01 par value, 372,644 shares authorized and designated; 367,644 shares plus accrued dividends issued and outstanding, Series A at December 31, 2004 | | | — | | | 51,979 | |
| Mandatorily redeemable preferred stock, $.01 par value, 10,000 shares authorized, issued, and outstanding, Series B at December 31, 2004 | | | — | | | 4,000 | |
| | |
| |
| | Total mandatorily redeemable preferred stock | | | — | | | 55,979 | |
Commitments and contingencies |
|
|
|
|
|
|
|
Partners' capital and shareholders' equity (deficit): |
|
|
|
|
|
|
|
| Partners' capital (note 9) | | | 72,920 | | | — | |
| Shareholders' equity (deficit): | | | | | | | |
| | Common stock—Class A, $.01 par value, 6,000,000 shares authorized; 4,307,880 shares issued and outstanding at December 31, 2004 | | | — | | | 43 | |
| | Common stock—Class B, $.01 par value, 505,512 shares authorized, issued, and outstanding at December 31, 2004 | | | — | | | 5 | |
| | Paid-in capital | | | — | | | 22,578 | |
| | Retained earnings (deficit) | | | — | | | (31,743 | ) |
| | Unearned stock-based compensation | | | (1,466 | ) | | — | |
| | Accumulated other comprehensive income | | | 358 | | | — | |
| | Less treasury stock 570,300 shares—at cost at December 31, 2004 | | | — | | | (2,638 | ) |
| | |
| |
| | | Total shareholders' equity (deficit) | | | 71,812 | | | (11,755 | ) |
| | |
| |
| Total | | $ | 520,221 | | $ | 118,862 | |
| |
See accompanying notes to consolidated financial statements.
F-8
Edgen/Murray, L.P. and Subsidiaries
Consolidated statements of operations
Period February 1, 2005 to December 31, 2005, period January 1, 2005 to January 31, 2005, and years ended December 31, 2004 and 2003
(In thousands, except per unit/share data)
| |
| | Successor
| | Predecessor
| |
|---|
| | Period
February 1,
2005 to
December 31,
2005
| | Period
January 1,
2005 to
January 31,
2005
| | 2004
| | 2003
| |
|---|
| |
| Sales | | $ | 282,925 | | $ | 18,945 | | $ | 207,821 | | $ | 147,025 | |
| Operating expenses: | | | | | | | | | | | | | |
| Cost of sales (exclusive of depreciation and amortization shown separately below) | | | 226,236 | | | 14,153 | | | 155,357 | | | 121,146 | |
| Selling, general, and administrative expense | | | 28,960 | | | 14,364 | | | 32,009 | | | 29,595 | |
| Depreciation and amortization expense | | | 6,226 | | | 201 | | | 2,400 | | | 2,001 | |
| | |
| |
| Total operating expenses | | | 261,422 | | | 28,718 | | | 189,766 | | | 152,742 | |
| | |
| |
| Income (loss) from operations | | | 21,503 | | | (9,773 | ) | | 18,055 | | | (5,717 | ) |
| Other income (expense): | | | | | | | | | | | | | |
| | Other income (expense) | | | (307 | ) | | (50 | ) | | 106 | | | 174 | |
| | Interest expense, net | | | (12,139 | ) | | (333 | ) | | (5,163 | ) | | (3,122 | ) |
| | |
| |
| Income (loss) from continuing operations before income tax expense (benefit) | | | 9,057 | | | (10,156 | ) | | 12,998 | | | (8,665 | ) |
| Income tax expense (benefit) | | | 3,055 | | | (1,916 | ) | | (3,211 | ) | | (4,195 | ) |
| | |
| |
| Income (loss) from continuing operations | | | 6,002 | | | (8,240 | ) | | 16,209 | | | (4,470 | ) |
| Discontinued operations: | | | | | | | | | | | | | |
| | Loss from discontinued operations before income tax (benefit) | | | — | | | — | | | — | | | (348 | ) |
| | Income tax (benefit) | | | — | | | — | | | — | | | (159 | ) |
| | |
| |
| Net income (loss) | | | 6,002 | | | (8,240 | ) | | 16,209 | | | (4,659 | ) |
| Preferred interest and dividend requirement | | | (1,798 | ) | | (190 | ) | | (2,206 | ) | | (2,212 | ) |
| | |
| |
| Net income (loss) applicable to partners and common shareholders | | $ | 4,204 | | $ | (8,430 | ) | $ | 14,003 | | $ | (6,871 | ) |
| | |
| |
| Net income (loss) applicable to common unit/shareholders: | | | | | | | | | | | | | |
| | Basic: | | | | | | | | | | | | | |
| | | Income (loss) from continuing operations | | $ | 1.49 | | $ | (1.99 | ) | $ | 3.21 | | $ | (1.40 | ) |
| | | Income (loss) from discontinued operations | | | — | | | — | | | — | | | (0.04 | ) |
| | |
| |
| | | Basic earnings per share | | $ | 1.49 | | $ | (1.99 | ) | $ | 3.21 | | $ | (1.44 | ) |
| | |
| |
| | Diluted: | | | | | | | | | | | | | |
| | | Income (loss) from continuing operations | | $ | 1.49 | | $ | (1.99 | ) | $ | 3.20 | | $ | (1.40 | ) |
| | | Income (loss) from discontinued operations | | | — | | | — | | | — | | | (0.04 | ) |
| | |
| |
| | | Diluted earnings per share | | $ | 1.49 | | $ | (1.99 | ) | $ | 3.20 | | $ | (1.44 | ) |
| | |
| |
| Weighted average common units/shares: | | | | | | | | | | | | | |
| | Basic | | | 2,821,840 | | | 4,243,092 | | | 4,367,999 | | | 4,782,596 | |
| | |
| |
| | Diluted | | | 2,821,840 | | | 4,243,092 | | | 4,371,695 | | | 4,782,596 | |
| | |
| |
| |
See accompanying notes to consolidated financial statements.
F-9
Edgen/Murray, L.P. and Subsidiaries
Consolidated statements of partners' capital
and shareholders' equity (deficit)
Period December 17, 2005 to December 31, 2005, period February 1, 2005 to December 16, 2005, period January 1, 2005 to January 31, 2005, and years ended December 31, 2004 and 2003
(In thousands, except per unit/share data)
| |
| | Class A
common
stock
| | Class B
common
stock
| | Paid-In
capital
| | Unearned
stock-based
compensation
| | Notes
receivable
from
shareholders
| | Accumulated
other
comprehensive
income
| | Retained
earnings
(deficit)
| | Treasury
stock
| | Total
| |
|---|
| |
| Shareholders' equity (deficit): | | | | | | | | | | | | | | | | | | | | | | | | | | | | |
| Predecessor | | | | | | | | | | | | | | | | | | | | | | | | | | | | |
| Balance—January 1, 2003 | | $ | 43 | | $ | 5 | | $ | 22,578 | | $ | — | | $ | (2,118 | ) | $ | — | | $ | (38,875 | ) | $ | (156 | ) | $ | (18,523 | ) |
| Payment of Shareholder Notes | | | — | | | — | | | — | | | — | | | 1,029 | | | — | | | — | | | — | | | 1,029 | |
| Net income | | | — | | | — | | | — | | | — | | | — | | | — | | | (4,660 | ) | | — | | | (4,660 | ) |
| Repurchase of Class A Common Stock | | | — | | | — | | | — | | | — | | | — | | | — | | | — | | | (1,168 | ) | | (1,168 | ) |
| Preferred dividend requirement | | | — | | | — | | | — | | | — | | | — | | | — | | | (2,212 | ) | | — | | | (2,212 | ) |
| | |
| |
| Balance—December 31, 2003 | | | 43 | | | 5 | | | 22,578 | | | — | | | (1,089 | ) | | — | | | (45,747 | ) | | (1,324 | ) | | (25,534 | ) |
| Payment of Shareholder Notes | | | — | | | — | | | — | | | — | | | 1,089 | | | — | | | — | | | — | | | 1,089 | |
| Net income | | | — | | | — | | | — | | | — | | | — | | | — | | | 16,210 | | | — | | | 16,210 | |
| Repurchase of Class A Common Stock | | | — | | | — | | | — | | | — | | | — | | | — | | | — | | | (1,314 | ) | | (1,314 | ) |
| Preferred dividend requirement | | | — | | | — | | | — | | | — | | | — | | | — | | | (2,206 | ) | | — | | | (2,206 | ) |
| | |
| |
| Balance—December 31, 2004 | | | 43 | | | 5 | | | 22,578 | | | — | | | — | | | — | | | (31,743 | ) | | (2,638 | ) | | (11,755 | ) |
| Preferred dividend requirement | | | — | | | — | | | — | | | — | | | — | | | — | | | (190 | ) | | — | | | (190 | ) |
| Net loss | | | — | | | — | | | — | | | — | | | — | | | — | | | (8,240 | ) | | — | | | (8,240 | ) |
| | |
| |
| Balance—January 31, 2005 | | $ | 43 | | $ | 5 | | $ | 22,578 | | $ | — | | $ | — | | $ | — | | $ | (40,173 | ) | $ | (2,638 | ) | $ | (20,185 | ) |
| | |
| |
(continued)
See accompanying notes to consolidated financial statements.
F-10
Edgen/Murray, L.P. and Subsidiaries
Consolidated statements of partners' capital
and shareholders' equity (deficit)
Period December 17, 2005 to December 31, 2005, period February 1, 2005 to December 16, 2005, period January 1, 2005 to January 31, 2005, and years ended December 31, 2004 and 2003
(In thousands, except per unit/share data) (continued)
| |
| | Class A
common
stock
| | Class B
common
stock
| | Paid-In
capital
| | Unearned
stock-based
compensation
| | Notes
receivable
from
shareholders
| | Accumulated
other
comprehensive
income
| | Retained
earnings
(deficit)
| | Treasury
stock
| | Total
| |
|---|
| |
| Successor | | | | | | | | | | | | | | | | | | | | | | | | | | | | |
| Balance—February 1, 2005 | | $ | — | | $ | — | | $ | — | | $ | — | | $ | — | | $ | — | | $ | — | | $ | — | | $ | — | |
| Net income | | | — | | | — | | | — | | | — | | | — | | | — | | | 4,941 | | | — | | | 4,941 | |
| Other comprehensive income: | | | | | | | | | | | | | | | | | | | | | | | | | | | | |
| Foreign translation adjustments, net of tax | | | — | | | — | | | — | | | — | | | — | | | 89 | | | — | | | — | | | 89 | |
| | | | | | | | | | | | | | | | | | | | | | | | | | |
| |
| Comprehensive income | | | — | | | — | | | — | | | — | | | — | | | — | | | — | | | — | | | 5,030 | |
| | | | | | | | | | | | | | | | | | | | | | | | | | |
| |
| Issuance of Class A common stock | | | 24 | | | — | | | 2,376 | | | — | | | — | | | — | | | — | | | — | | | 2,400 | |
| Issuance of stock based compensation | | | 3 | | | — | | | 279 | | | (282 | ) | | — | | | — | | | — | | | — | | | — | |
| Amortization of stock-based compensation | | | — | | | — | | | — | | | 282 | | | — | | | — | | | — | | | — | | | 282 | |
| Preferred dividend requirement | | | — | | | — | | | — | | | — | | | — | | | — | | | (1,622 | ) | | — | | | (1,622 | ) |
| | |
| |
| Balance—December 16, 2005 | | $ | 27 | | $ | — | | $ | 2,655 | | $ | — | | $ | — | | $ | 89 | | $ | 3,319 | | $ | — | | $ | 6,090 | |
| |
(continued)
F-11
Edgen/Murray, L.P. and Subsidiaries
Consolidated statements of partners' capital
and shareholders' equity (deficit)
Period December 17, 2005 to December 31, 2005, period February 1, 2005 to December 16, 2005, period January 1, 2005 to January 31, 2005, and years ended December 31, 2004 and 2003
(In thousands, except for per unit/share data) (continued)
| |
| | Preferred
units
| | Preferred
amount
| | Common
units
| | Common
amount
| |
|---|
| |
| Successor | | | | | | | | | | | |
| General partner: | | | | | | | | | | | |
| Balance at December 17, 2005 | | — | | $ | — | | — | | $ | — | |
| | Issuance of preferred and common units | | 1.00 | | | 1 | | 117.12 | | | 1 | |
| | |
| |
| Balance at December 31, 2005 | | 1.00 | | | 1 | | 117.12 | | | 1 | |
Limited partner: |
|
|
|
|
|
|
|
|
|
|
|
| Balance at December 17, 2005 | | — | | $ | — | | — | | $ | — | |
| | Exchange of Edgen common and preferred shares for Edgen/Murray, L.P. preferred and common units | | 23,221.76 | | | 23,222 | | 2,400,000.00 | | | 6,001 | |
| | Issuance of preferred and common units | | 27,319.38 | | | 27,319 | | 2,745,897.29 | | | 14,127 | |
| | Interest and Dividends | | — | | | 176 | | — | | | (176 | ) |
| | Exchange of restricted common shares for restricted common units | | — | | | — | | 281,564.00 | | | 1,419 | |
| | Issuance of restricted common units | | — | | | — | | 10,000.00 | | | 60 | |
| | Net income | | — | | | — | | — | | | 1,061 | |
| | Net income of PAL not included in statement of operations (note 1) | | — | | | — | | — | | | 1,018 | |
| | |
| |
| Balance at December 31, 2005 | | 50,541.14 | | | 50,717 | | 5,437,461.29 | | | 23,510 | |
Unit subscription receivable: |
|
|
|
|
|
|
|
|
|
|
|
| Balance at December 17, 2005 | | — | | $ | — | | — | | $ | — | |
| | Increase in unit subscription receivable | | — | | | (817 | ) | — | | | (492 | ) |
| | |
| |
| Balance at December 31, 2005 | | — | | | (817 | ) | — | | | (492 | ) |
Unit-based compensation expense: |
|
|
|
|
|
|
|
|
|
|
|
Balance at December 17, 2005 |
|
— |
|
$ |
— |
|
— |
|
$ |
— |
|
| | Issuance of restricted common units | | — | | | — | | — | | | (1,479 | ) |
| | Amortization of restricted common units | | — | | | — | | — | | | 13 | |
| | |
| |
| Balance at December 31, 2005 | | — | | | — | | — | | | (1,466 | ) |
Accumulated other comprehensive income: |
|
|
|
|
|
|
|
|
|
|
|
| Balance at December 17, 2005 | | — | | $ | — | | — | | $ | 89 | |
| | Foreign currency translation | | — | | | — | | — | | | 269 | |
| | |
| |
| Balance at December 31, 2005 | | — | | | — | | — | | | 358 | |
Total partners' capital |
|
50,542.14 |
|
$ |
49,901 |
|
5,437,578.41 |
|
$ |
21,911 |
|
| |
(concluded)
See accompanying notes to consolidated financial statements.
F-12
Edgen/Murray, L.P. and Subsidiaries
Consolidated statements of cash flows
Period February 1, 2005 to December 31, 2005, period January 1, 2005 to January 31, 2005, and years ended December 31, 2004 and 2003
(In thousands)
| |
| | Successor
| | Predecessor
| |
|---|
| | Period
February 1,
2005 to
December 31,
2005
| | Period
January 1,
2005 to
January 31,
2005
| | 2004
| | 2003
| |
|---|
| |
| CASH FLOWS FROM OPERATING ACTIVITIES: | | | | | | | | | | | | | |
| Net income (loss) | | $ | 6,002 | | $ | (8,239 | ) | $ | 16,210 | | $ | (4,660 | ) |
| Loss from discontinued operations, net of income taxes | | | — | | | — | | | — | | | 189 | |
| | |
| |
| Net income (loss) from continuing operations | | | 6,002 | | | (8,239 | ) | | 16,210 | | | (4,471 | ) |
| Adjustments to reconcile net income (loss) to net cash provided by operating activities: | | | | | | | | | | | | | |
| Depreciation and amortization | | | 6,226 | | | 201 | | | 2,400 | | | 2,001 | |
| Amortization of deferred financing costs | | | 1,225 | | | 35 | | | 1,519 | | | 160 | |
| Accretion of discount on long-term debt | | | 20 | | | — | | | — | | | — | |
| Stock-based compensation expense | | | 294 | | | — | | | — | | | — | |
| Provision for doubtful accounts | | | 180 | | | 27 | | | 353 | | | 869 | |
| Inventory purchase price allocation adjustment | | | 1,637 | | | — | | | — | | | — | |
| Deferred income tax expense (benefit) | | | 1,319 | | | — | | | (4,374 | ) | | (1,562 | ) |
| Gain on redemption of preferred and common stock | | | — | | | — | | | — | | | (82 | ) |
| Loss on foreign currency transactions | | | (315 | ) | | — | | | — | | | — | |
| Gain (loss) on sale of property, plant and equipment | | | 112 | | | — | | | — | | | (33 | ) |
| Changes in assets and liabilities: | | | | | | | | | | | | | |
| | (Increase) decrease in accounts receivable | | | (7,874 | ) | | 1,991 | | | (10,927 | ) | | 7,865 | |
| | (Increase) decrease in inventories | | | (7,137 | ) | | (3,184 | ) | | (4,486 | ) | | 10,211 | |
| | Decrease (increase) in prepaid expenses and other current assets | | | 854 | | | (2,951 | ) | | 951 | | | (16 | ) |
| | Increase (decrease) in accounts payable | | | 11,464 | | | 6,318 | | | (97 | ) | | 11,543 | |
| | (Decrease) increase in accrued liabilities and other expenses | | | 481 | | | 11,695 | | | 4,216 | | | (1,966 | ) |
| | Increase (decrease) in income tax payable | | | 1,219 | | | 775 | | | — | | | (1,631 | ) |
| | Decrease (increase) in income tax receivable | | | 4,659 | | | (2,418 | ) | | 186 | | | — | |
| | Decrease (increase) in other | | | (328 | ) | | — | | | (102 | ) | | (44 | ) |
| | |
| |
| Net cash provided by operating activities from continuing operations | | | 20,038 | | | 4,250 | | | 5,849 | | | 22,844 | |
| Net cash provided by operating activities from discontinued operations | | | — | | | — | | | — | | | 1,895 | |
Impact of MIM Acquisition on cash provided by operating activities (see notes 1 and 19) |
|
|
10,377 |
|
|
— |
|
|
— |
|
|
— |
|
| | |
| |
| Net cash provided by operating activities | | | 30,415 | | | 4,250 | | | 5,849 | | | 24,739 | |
CASH FLOWS FROM INVESTING ACTIVITIES: |
|
|
|
|
|
|
|
|
|
|
|
|
|
| Purchase of Edgen Corporation—net of cash acquired | | | (121,836 | ) | | — | | | — | | | — | |
| Purchase of Western Flow Products, Inc. | | | (1,746 | ) | | — | | | — | | | — | |
| Purchase of Murray International Metals Ltd. and Murray International Metals, Inc.—net of cash acquired (notes 2 and 19) | | | (36,986 | ) | | — | | | — | | | — | |
| Purchase of SISCO—net of cash acquired | | | — | | | — | | | — | | | (500 | ) |
| Purchase of ProMetals, Inc. | | | — | | | — | | | — | | | (400 | ) |
| Purchase of property, plant and equipment | | | (1,320 | ) | | (4 | ) | | (1,112 | ) | | (2,499 | ) |
| Proceeds from the sale of property, plant and equipment | | | 3 | | | 2 | | | 76 | | | — | |
| | |
| |
| Net cash used in investing activities from continuing operations | | | (161,885 | ) | | (2 | ) | | (1,036 | ) | | (3,399 | ) |
| Net cash provided by investing activities from discontinued operations | | | — | | | — | | | — | | | 284 | |
Impact of MIM Acquisition in cash used in financing activities (see notes 1 and 19) |
|
|
(142,025 |
) |
|
— |
|
|
— |
|
|
— |
|
| | |
| |
| Net cash used in investing activities | | | (303,910 | ) | | (2 | ) | | (1,036 | ) | | (3,115 | ) |
(continued)
|
|
| | | | | | | | | | | | | | |
F-13
| CASH FLOWS FROM FINANCING ACTIVITIES: | | | | | | | | | | | | | |
| Proceeds from issuance of long-term debt, net of discount | | | 134,605 | | | — | | | 1,500 | | | 6,066 | |
| Proceeds from issuance of common units | | | 13,288 | | | — | | | — | | | — | |
| Proceeds from issuance of preferred units | | | 39,672 | | | — | | | — | | | — | |
| Proceeds (payments) under credit facilities | | | 91 | | | 116 | | | 1,635 | | | (19,722 | ) |
| Deferred financing costs | | | (9,832 | ) | | — | | | (1,432 | ) | | — | |
| Principal payments on notes payable and long-term debt | | | (5,180 | ) | | (232 | ) | | (6,225 | ) | | (577 | ) |
| Purchase of common stock for treasury | | | — | | | — | | | (1,314 | ) | | (1,168 | ) |
| Proceeds from repayment of shareholder notes | | | — | | | — | | | 1,089 | | | 1,029 | |
| Redemption of preferred stock | | | — | | | — | | | (145 | ) | | (465 | ) |
| Increase (decrease) in managed cash overdraft | | | (12,047 | ) | | (1,361 | ) | | (2,912 | ) | | (3,662 | ) |
| | |
| |
| Net cash provided by (used in) financing activities from continuing operations | | | 160,597 | | | (1,477 | ) | | (7,804 | ) | | (18,499 | ) |
| Net cash provided by financing activities from discontinued operations | | | — | | | — | | | — | | | — | |
| Impact of MIM Acquisition on cash provided by financing activities (see notes 1 and 19) | | | 153,719 | | | — | | | — | | | — | |
| | |
| |
| Net cash provided by (used in) financing activities | | | 314,316 | | | (1,477 | ) | | (7,804 | ) | | (18,499 | ) |
| Effect of foreign currency exchange rate on cash | | | 325 | | | — | | | — | | | — | |
| | |
| |
| Net increase (decrease) in cash and cash equivalents | | | 41,146 | | | 2,771 | | | (2,991 | ) | | 3,125 | |
Cash and cash equivalents (beginning of period) |
|
|
— |
|
|
134 |
|
|
3,125 |
|
|
— |
|
| | |
| |
| Cash and cash equivalents (end of period) | | $ | 41,146 | | $ | 2,905 | | $ | 134 | | $ | 3,125 | |
| | |
| |
| SUPPLEMENTAL DISCLOSURES OF CASH FLOW INFORMATION | | | | | | | | | | | | | |
| Cash paid during the period for: | | | | | | | | | | | | | |
| Interest | | $ | 5,848 | | $ | 1,315 | | $ | 2,554 | | $ | 3,090 | |
| | |
| |
| Income taxes | | $ | 212 | | | — | | $ | 1,327 | | $ | 338 | |
| | |
| |
| NON-CASH INVESTING AND FINANCING ACTIVITES: | | | | | | | | | | | | | |
| Equipment acquired through capital leases | | $ | 88 | | $ | — | | $ | — | | $ | — | |
| | |
| |
| Issuance of note payable in connection with acquisition of Western Flow Products, Inc. | | | 246 | | | — | | | — | | | — | |
| | |
| |
| Issuance of Edgen/Murray, L.P. common and preferred units to sellers of Murray International Metals Ltd. and Murray International Metals, Inc. | | | 7,740 | | | — | | | — | | | — | |
| | |
| |
| Issuance of Edgen Corporation restricted stock | | | 282 | | | — | | | — | | | — | |
| | |
| |
| Exchange of Edgen Corporation restricted stock for Edgen/Murray, L.P. restricted common units | | | 1,419 | | | — | | | — | | | — | |
| | |
| |
| Issuance of Edgen/Murray, L.P. restricted common units | | | 60 | | | — | | | — | | | — | |
| | |
| |
| Dividends on Edgen Corporation preferred stock | | | 1,622 | | | 190 | | | 2,206 | | | 2,212 | |
| | |
| |
| Preferred interest on Edgen/Murray, L.P. preferred units | | | 176 | | | — | | | — | | | — | |
| | |
| |
| Common and preferred unit subscription receivable | | | 1,309 | | | — | | | — | | | — | |
| |
(concluded)
See accompanying notes to consolidated financial statements.
F-14
Edgen/Murray, L.P. and Subsidiaries
Notes to consolidated financial statements
Period February 1, 2005 to December 31, 2005,
period January 1, 2005 to January 31, 2005,
and years ended December 31, 2004 and 2003
(In thousands, except per unit/share data)
1. Organization and summary of significant accounting policies
Organization
Description of formation—Edgen/Murray, L.P. is a Delaware limited partnership that was formed on November 22, 2005 ("Edgen/Murray, L.P.") by Jefferies Capital Partners ("JCP") and certain members of the management (collectively, the "Edgen Shareholders") of Edgen Corporation ("Edgen") for the purpose of acquiring Murray International Metals Limited and subsidiaries. In a common control transaction, the Edgen Shareholders exchanged their direct ownership of Edgen for ownership interests in Edgen/Murray, L.P., which resulted in Edgen becoming a wholly owned subsidiary of Edgen/Murray, L.P. Prior to the formation of Edgen/Murray, L.P., Edgen was held directly by the Edgen Shareholders.
On February 1, 2005, Edgen Acquisition Corp., a corporation newly formed by the Edgen Shareholders, purchased all of the outstanding capital stock of Edgen from its existing shareholders for an aggregate purchase price of approximately $124,000 (excluding acquisition costs). Edgen Acquisition Corp. was merged with and into Edgen, which survived the merger.
On December 16, 2005, Edgen/Murray, L.P. formed Pipe Acquisition Limited ("PAL"). On that same day, Edgen/Murray, L.P. through its subsidiaries acquired Murray International Metals Ltd. ("MIM UK") and its subsidiaries (collectively referred to as "MIM").
References to the "Company" or the "Successor" in respect of the periods prior to the formation of Edgen/Murray, L.P. are references to Edgen and its subsidiaries and for periods after formation are references to Edgen/Murray, L.P. and its subsidiaries. References to the "Company" or the "Predecessor" in respect of the periods prior to the formation of Edgen Acquisition Corp., and the acquisition of Edgen by Edgen Acquisition Corp., are references to Edgen prior to the change in control on February 1, 2005.
F-15
Edgen/Murray, L.P. and Subsidiaries
Notes to consolidated financial statements (continued)
(In thousands, except per unit/share data)
As a result of the transactions described above, the organizational structure of Edgen/Murray, L.P. at December 31, 2005 is presented below:
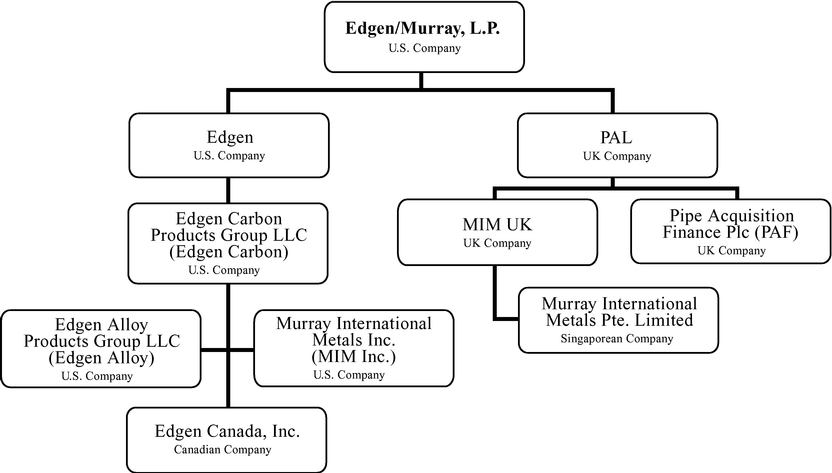
Description of operations—
The Company, through its subsidiaries, has operations in North America, United Kingdom ("UK"), Singapore and the United Arab Emirates ("UAE"). The Company is headquartered in Baton Rouge, Louisiana.
The Company's operations in North America distribute and market specialized, high performance steel products for use primarily in niche applications in the energy infrastructure market. The products the Company sells are generally highly engineered prime carbon or alloy steel pipe, pipe components and high grade structural sections and plates, which are designed to withstand the effects of corrosive or abrasive materials and possess performance characteristics required in extreme operating conditions, including high pressure and high/low temperature environments. These products are utilized by customers globally, from exploration and production, new rig construction, gathering and transmission and refining and processing to maintenance, repair and operations (MRO).
The Company's operations in the UK, Singapore and the UAE distribute and market specialty steel globally primarily to companies in the offshore oil and gas industry. The Company sells highly specialized steel sections used in the construction of offshore oil and gas platforms and wellheads located in deep water and ultra deep water oil and gas fields; sales are primarily to customers in the Caspian Sea region, West Africa, the Middle Eastern Gulf region, Southeast Asia and Australia. In addition, the operations in the UK have recently diversified into several alternative markets and products including civil fabrication, shipbuilding, renewable energy, yellow goods and mining.
F-16
Significant Accounting Policies
Basis of presentation—The consolidated financial statements and notes are presented in accordance with accounting principles generally accepted in the United States of America ("generally accepted accounting principles" or "GAAP"). The consolidated financial statements include the accounts of Edgen/Murray, L.P. and its wholly owned subsidiaries (see organizational chart above). There are no differences between the accounting policies of the Predecessor and Successor.
PAL and its subsidiaries have a fiscal year ending January 31 which differs from the Company's fiscal year end of December 31. The Company's consolidated balance sheet as of December 31, 2005 includes the consolidated balance sheet of PAL and its subsidiaries as of January 31, 2006. The Company's consolidated statement of operations for the period February 1, 2005 to December 31, 2005 includes fifteen days of operating results of PAL and its subsidiaries.
Due to the difference in fiscal year periods, the net income included in the consolidated financial statements of the Company reflects the operating results of PAL for the period January 17, 2006 to January 31, 2006. As a result, net income of PAL for the period December 17, 2005 to January 16, 2006 has been recorded as a direct charge to the statement of partners' capital and shareholders' equity (deficit). All intercompany transactions have been eliminated in consolidation.
Use of estimates—The preparation of the Company's consolidated financial statements in conformity with GAAP requires management to make estimates and assumptions that affect the reported amounts of assets and liabilities, the disclosure of contingent assets and liabilities at the date of the financial statements and the reported amounts of revenues and expenses during the reporting period. Actual results could differ from those estimates. Estimates and assumptions are primarily made in relation to the valuation of accounts receivable and inventory, the recoverability of goodwill and other intangible assets, and deferred tax assets in establishing a valuation allowance, if any.
Cash equivalents—The Company considers all highly-liquid investments with an original maturity of three months or less at the time of purchase to be cash equivalents.
Accounts receivable—Accounts receivable from customers is shown net of allowance for doubtful accounts which reflects the Company's estimate of the uncollectible accounts receivable based on the aging of specific customer receivable accounts.
Inventory—Inventory consists primarily of prime carbon steel pipe and plate, alloy grade pipe, fittings and flanges and structural sections and plates. Inventory is stated at the lower of cost or market (net realizable value). Cost is determined by the average cost method. Cost includes all costs incurred in bringing the product to its present location and condition, based on purchase cost on a weighted average cost basis. Net realizable value is based on estimated normal selling price less further costs expected to be incurred to completion and disposal. Inventory is written off for obsolete, slow-moving or defective items where appropriate.
Property, plant and equipment—Property, plant and equipment are recorded at cost. Depreciation of property, plant and equipment is provided for financial reporting purposes on the straight-line method over the estimated useful lives of the individual assets, which range from leasehold improvements, 2 to 10 years for equipment and computers and 10 to 50 years for buildings and land improvements. For income tax purposes, accelerated methods of depreciation are used. Ordinary maintenance and repairs which do not extend the physical or economic lives of the plant or equipment are charged to expense as incurred.
F-17
Leases—The Company enters into both finance and operating lease agreements. Fixed assets held under lease agreements, which confer rights and obligations similar to those attached to owned assets, are capitalized as fixed assets and are depreciated over their economic lives. The capital elements of future lease obligations are recorded as liabilities, while the interest element is charged to the statement of operations over the period of the related finance lease obligation. Rentals under operating leases are charged to the statements of operations on a straight-line basis over the lease term, even if the payments are not made on such a basis.
Goodwill and other intangible assets—Goodwill represents the excess of the amount the Company paid to acquire a company over the estimated fair value of tangible assets and identifiable assets acquired, less liabilities assumed. Other identifiable intangible assets include customer relationships, tradenames, backlog, non-competition agreements and trademarks. Other identifiable intangible assets with finite useful lives are amortized to expense over the estimated useful life of the asset. Customer relationships, non-competition agreements, and backlog are amortized on a straight-line basis over their estimated useful lives: 7 to 10 years for customer relationships, 1 to 5 years for non-competition agreements, and one year for backlog. Identifiable intangible assets with an indefinite useful life, including goodwill, tradenames and trademarks, are evaluated annually in the first quarter or more frequently if circumstances dictate, for impairment by comparison of their carrying amounts with the fair value of the individual assets. No goodwill, tradename or trademark impairment was identified in 2005, 2004 and 2003.
Impairment of long-lived assets—The Company assesses the impairment of long-lived assets, including property, plant and equipment and customer relationships, when events or changes in circumstances indicate that the carrying value of the assets or the asset group may not be recoverable. The asset impairment review assesses the fair value of the assets based on the future cash flows the assets are expected to generate. An impairment loss is recognized when estimated undiscounted future cash flows expected to result from the use of the asset plus net proceeds expected from the disposition of the asset (if any) are less than the related asset's carrying amount. Impairment losses are measured as the amount by which the carrying amounts of the assets exceed their fair values.
Deferred financing costs—Deferred financing costs are charged to operations as additional interest expense over the life of the underlying indebtedness using the interest method. Deferred financing costs charged to the statements of operations as interest during the period February 1, 2005 to December 31, 2005, the period January 1, 2005 to January 31, 2005 and the years ended December 31, 2004 and 2003 were $1,223, $35, $1,519 and $160, respectively.
Income taxes—Income taxes are provided using the liability method in accordance with Statement of Financial Accounting Standards ("SFAS") No. 109,Accounting for Income Taxes. Under this method, deferred income taxes are recorded based upon differences between the financial reporting and income tax basis of assets and liabilities and are measured using the enacted income tax rates and laws that will be in effect when the differences are expected to reverse.
Revenue recognition—Revenue is recognized on products sales when products are shipped or at the time of delivery, depending on the terms of the sale and when the customer takes title and assumes risk of loss. Revenue is recorded, net of discounts, rebates, value added tax and similar taxes as applicable in foreign jurisdictions. The Company monitors and tracks the amount of rebates, returns and discounts to customers based on historical experience to estimate the amount of reduction to revenue. Shipping and handling costs incurred are included as a component of cost of sales (exclusive of depreciation and amortization) on the statement of operations.
F-18
Unit/share-based compensation—The Company accounts for its unit/share-based employee compensation plan which allows for the granting of stock options and restricted stock/units using the intrinsic value-based method of accounting, as permitted, and discloses, if material, pro forma information as if accounted for using the fair value-based method as prescribed by accounting principles. Because the exercise price of the Company's employee stock options equals the market price of the underlying stock on the date of grant, no compensation expense is recognized on options granted.
If compensation cost for the Company's unit/share based compensation plan had been determined on the fair value method at the grant dates for awards, there would have been no material impact on the Company's reported net income or earnings per share. The fair value of options was estimated using a Black-Scholes option pricing model. Because employee stock options have differing characteristics and changes in the subjective input assumptions can materially affect the fair value estimate, the Black- Scholes valuation model does not necessarily provide a reliable measure of the fair value of employee options.
The Financial Accounting Standards Board ("FASB") has issued SFAS Statement No. 123(R),Share-Based Payment ("SFAS 123(R)"), that addresses the accounting for share-based payment transactions in which an enterprise receives employee services in exchange for (a) equity instruments of the enterprise or (b) liabilities that are based on the fair value of the enterprise's equity instruments or that may be settled by the issuance of such equity instruments. SFAS 123(R) eliminates the ability to account for share-based compensation transactions using the intrinsic value-based method of accounting, and generally requires instead that such transactions be accounted for using a fair-value based method. SFAS 123(R) permits use of option pricing models other than the Black-Scholes option pricing model. There was no impact on the Company's consolidated financial statements as a result of the adoption of SFAS 123(R) on January 1, 2006.
Earnings Per Share—Earnings per unit/share ("EPS") are presented under two formats: basic EPS and diluted EPS. Basic EPS is computed by dividing net income (after deducting dividends on preferred stock) by the weighted average number of units/shares outstanding during the period excluding non-vested shares. Diluted EPS is computed by dividing net income by the weighted average number of shares outstanding and non-vested stock shares. Prior to the cancellation of the Company's stock options on February 1, 2005, the weighted average number of shares was adjusted for the incremental shares issuable upon exercise of outstanding stock options.
Employee benefit plans—The Company has two primary 401(k) profit-sharing plans which provide benefits to employees based in the United States ("US Benefit Plan") and the United Kingdom (the "U.K. Benefit Plan"). The U.K. Pension Plan works on a "money purchase" basis, which means that the benefits at retirement are dependent upon the level of contributions paid, the investment return achieved, the charges deducted from the fund and the cost of buying a pension at retirement. Both the US and U.K. Employee Benefit Plans work on a defined contribution basis, whereby both the employee and the employer contribute a percentage of the employees' salary each month, depending on the level and length of service of the employee. Contributions by the Company are discretionary. The Company also maintains smaller defined contribution plans for employees of other countries, and records the required contributions to the plans during the year. See note 15 for further detail on these employee benefit plans.
Foreign currency—The Company's foreign subsidiaries maintain their accounting records in their respective functional currencies. Monetary assets and liabilities in foreign currencies are translated into the relevant measurement currency for each entity/division at the rate of exchange at the balance sheet date. Transactions in foreign currencies are translated into the relevant measurement currency at the average rate of exchange during the period.
F-19
The results of foreign operations, whose functional currency is not the US dollar, are translated at the average rates of exchange during the period and their assets and liabilities at the rates at the balance sheet date. The cumulative effect of exchange rate movements is included in a separate component of the Statement of Partners' Capital and Shareholders' Equity (Deficit), in accordance with the SFAS No. 52,Foreign Currency Translation and SFAS No. 130,Reporting Comprehensive Income. Foreign transaction gains or losses are charged to net income (loss) in the period the transactions are settled.
Derivative financial instruments—The Company enters into foreign currency forward exchange contracts to minimize its foreign exchange risks associated with certain inventory purchase transactions and sales which are denominated in a foreign currency (primarily the Euro). The Company does not enter into any financial instruments for investment or speculative purposes.
Monetary assets and liabilities denominated in foreign currencies at each period end are reported at the rates of exchange prevailing at the balance sheet date and all derivatives are carried at fair value on the balance sheet. The Company has not designated any of its derivative instruments as qualifying hedge instruments under SFAS No. 133,Accounting for Derivative Instruments and Hedging Activities. Accordingly, all gains and losses arising from changes in the fair value of derivatives are charged or credited in determining net income (loss) and are accounted for as other income (loss) on the consolidated statement of operations.
Other comprehensive income—Comprehensive income includes all changes in equity during the period presented that result from transactions and other economic events other than transactions with partners' and shareholders.
Fair values of financial instruments—The carrying value of cash and cash equivalents, accounts receivable, accounts payable and accrued liabilities approximate their fair value due to the short maturity of those instruments. The fair value of long-term debt was based on market quotes or recent trades. The fair value of derivatives is based on the estimated amount the Company would receive or pay if the transaction was terminated, taking into consideration prevailing exchange rates.
New accounting standards—From time to time, new accounting pronouncements are issued by the FASB which are adopted by the Company as of the specified effective date. Unless otherwise discussed, management believes the impact of recently issued standards which are not yet effective will not have a material impact on the Company's consolidated financial statements upon adoption.
In December 2004, the FASB issued SFAS 123(R), which is a revision of SFAS No. 123,Accounting for Stock-Based Compensation ("SFAS 123") and supersedes APB Opinion 25,Accounting for Stock Issued to Employees. Generally, the valuation methods contained in SFAS 123(R) are similar to those in SFAS 123, but SFAS 123(R) requires all share-based payments to employees, including grants of employee share options, be charged to the statement of operations. Pro forma disclosure is no longer an alternative. With limited exceptions, the amount charged to the statement of operations for share options will be measured based on the grant date fair value of the option amortized over the period to the date of vesting of the award. SFAS 123(R) is effective as of the beginning of the first interim or annual reporting period that begins after June 15, 2005. There was no impact on the Company's consolidated financial statements as a result of the adoption of SFAS 123(R) on January 1, 2006.
In June 2006, the FASB issued FASB Interpretation No. 48,Accounting for Uncertainty in Income Taxes—an interpretation of FASB Statement No. 109 ("FIN 48"), which clarifies the accounting for
F-20
uncertainty in income taxes recognized in an enterprise's financial statements in accordance with SFAS No. 109,Accounting for Income Taxes. FIN 48 is effective for fiscal years beginning after December 15, 2006. FIN 48 will be adopted during the first quarter of 2007, and it is not expected to have a material impact on the Company's consolidated financial statements.
In February 2006, the FASB issued SFAS No. 155,Accounting for Certain Hybrid Financial Instruments—an amendment of FASB Statements No. 133 and 140 ("SFAS 155"). SFAS 155 amends SFAS No. 133,Accounting for Derivative Instruments and Hedging Activities and SFAS No. 140,Accounting for Transfers and Servicing of Financial Assets and Extinguishments of Liabilities. SFAS 155 resolves issues addressed in SFAS No. 133 Implementation Issue No. D1,Application of Statement 133 to Beneficial Interests in Securitized Financial Assets. SFAS 155 is effective for fiscal years beginning after September 15, 2006. The adoption of SFAS 155 is not expected to have any impact on the Company's consolidated results of operations.
In September 2006, the FASB issued SFAS No. 157,Fair Value Measurements ("SFAS 157") which establishes a single authoritative definition of fair value, sets out a frame-work for measuring fair value, and requires additional disclosures about fair-value measurements. SFAS 157 applies to fair value measurements that are already required or permitted by existing standards except for measurements of share-based payments and measurements that are similar to, but not intended to be, fair value. SFAS 157 does not impose any additional fair value measurements in financial statements and is effective for fiscal years beginning after November 15, 2007 and interim periods within those fiscal years. The adoption of SFAS 157 is not expected to have a material impact on the Company's consolidated financial statements.
In September 2006, the SEC issued Staff Accounting Bulletin No. 108,Considering the Effects of Prior Year Misstatements when Quantifying Misstatements in Current Year Financial Statements ("SAB 108"). SAB 108 establishes a single quantification framework wherein the significance measurement is based on the effects of the misstatements on each of the financial statements as well as the related financial statement disclosures. SAB 108 is effective for the first annual period ending after November 15, 2006. The Company does not expect that the adoption of SAB 108 will have a material effect on its results of operations or financial position.
2. Acquisitions
Edgen Corporation
As described in note 1, on February 1, 2005, Edgen Acquisition Corp. purchased all of the outstanding capital stock of Edgen from its existing shareholders for an aggregate purchase price of approximately $124,000, which included the assumption or repayment of indebtedness of Edgen but excluded the payment of certain fees and expenses. The acquisition was funded with (i) proceeds to Edgen Acquisition Corp. from the issuance and sale of $105,000 aggregate principal amount of 97/8% Senior Secured Notes due 2011 (the "Edgen Senior Secured Notes"), (ii) from an equity investment from funds managed by the Edgen Shareholders and (iii) a payable to the sellers of approximately $2,975 based upon receipt of certain income tax refunds for the remainder of the purchase price.
As discussed in Note 1, Edgen Acquisition Corp. was merged with and into Edgen, which survived the merger and became liable for all obligations under the Edgen Senior Secured Notes and any other borrowings. The acquisition of Edgen, the offering and issuance of the Edgen Senior Secured Notes,
F-21
the equity investment, the related financing transactions and the merger are referred to collectively as the "Buy-out Transaction."
The estimated fair value of the assets acquired and liabilities assumed relating to the acquisition is summarized below:
| |
| Accounts receivable | | $ | 29,734 | |
| Inventory | | | 63,097 | |
| Other current assets | | | 17,982 | |
| Property, plant and equipment | | | 12,110 | |
| Goodwill | | | 22,048 | |
| Customer relationships, tradenames and other intangible assets | | | 26,625 | |
| Accounts payable | | | (25,336 | ) |
| Accrued expenses and other current liabilities | | | (12,959 | ) |
| Deferred tax liability | | | (11,442 | ) |
| Long-term debt | | | (23 | ) |
| | |
| |
| Purchase price (net of cash received of $3,583) | | $ | 121,836 | |
| |
Western Flow Products, Inc.
On July 15, 2005, Edgen Canada, acquired the common stock of Western Flow Products, Inc. ("Western Flow") for a purchase price of approximately $1,971 (2,400 Canadian dollars ("CAD")) consisting of a cash payment of approximately $1,725 (2,100 CAD) and the issuance of a note payable to the sellers for approximately $246 (300 CAD). Under the purchase agreement, an additional $451 (527 CAD) of purchase price was contingent upon the achievement of a specified earnings threshold subsequent to the acquisition. As of January 31, 2006, the earnings threshold was met and the amount became payable to the sellers. Western Flow is located in Edmonton, Alberta and is a specialty alloy pipe and components distributor primarily to the oil and gas, processing and power generation industries. The operations of this acquisition were merged into the Company's subsidiary, Edgen Canada, and are included in our operating results from the date of the acquisition.
The estimated fair value of the assets acquired and liabilities assumed relating to the acquisition is summarized below:
| |
| Accounts receivable | | $ | 1,215 | |
| Inventory | | | 878 | |
| Other current assets | | | 6 | |
| Property, plant and equipment | | | 32 | |
| Goodwill | | | 1,138 | |
| Accounts payable | | | (681 | ) |
| Accrued expenses and other current liabilities | | | (97 | ) |
| | |
| |
| Purchase price | | $ | 2,491 | |
| |
Murray International Metals Limited and subsidiaries (including Murray International Metals, Inc.)
On December 16, 2005, the Company acquired Murray International Metals Limited and its wholly owned subsidiaries. The acquisition was structured in two legally separate transactions.
F-22
PAL acquired MIM UK and its subsidiary Murray International Metals Pte. Limited ("MIM Singapore") from Murray International Holdings Limited ("MIH") (the "MIM UK Acquisition"). PAL purchased 100% of the outstanding share capital of MIM UK for an aggregate purchase price of approximately $170,263. The purchase price consisted of cash of $145,613, net of cash acquired of $456 (including $4,000 paid for acquisition costs), $13,129 of deferred consideration included in creditors falling due within one year at January 31, 2006, and the rollover of MIH and management shares valued at $11,180. The MIM UK Acquisition was funded primarily through an equity contribution to PAL of $26,462 by Edgen/Murray, L.P. and with proceeds from the issuance of $130,000 aggregate principal amount of Senior Secured Floating Rate Notes due 2010 (the "PAL Floating Rate Notes") issued by Pipe Acquisition Finance Plc ("PAF"), a finance subsidiary of PAL. In connection with the MIM UK Acquisition, MIM UK entered into a sale and leaseback transaction (see note 7).
Murray International Metals, Inc. ("MIM US"), a wholly owned subsidiary of MIM UK, was acquired by the Company, through its indirect wholly owned subsidiary Edgen Carbon (the "MIM US Acquisition"), for an aggregate purchase price, including assumption of debt, of approximately $20,600 and acquisition costs of $1,296, net of cash acquired of $10,848. The assumption of debt included a UK£2,900 (approximately $5,000) note payable to MIM UK which was funded and paid by Edgen upon closing. The MIM US Acquisition was funded with proceeds from the issuance of $31,000 aggregate principal amount of Edgen Senior Secured Notes. The MIM UK Acquisition and the MIM US Acquisition are collectively referred to as the "MIM Acquisition."
MIM UK is a supplier of high yield and special grade structural steel to oil and gas projects being engineered and managed by leading operators, engineering houses and offshore fabricators in the oil and gas industry throughout the world but primarily in the Europe/North Africa, the Middle East and Asia/Pacific while MIM US primarily services North and South America.
The fair value of assets acquired and liabilities assumed have been recorded based on preliminary estimates. The purchase price in excess of the fair value of the assets and liabilities acquired has been recorded as goodwill. The goodwill and other intangible assets are not deductible for tax purposes. As of December 31, 2005, the purchase price allocation includes the following:
| |
| Accounts receivable | | $ | 78,414 | |
| Inventory | | | 61,197 | |
| Other current assets | | | 874 | |
| Property, plant and equipment | | | 8,882 | |
| Goodwill | | | 46,191 | |
| Customer relationships, backlog and tradenames | | | 77,373 | |
| Other assets | | | 7,435 | |
| Deferred tax asset | | | 644 | |
| Accounts payable | | | (47,493 | ) |
| Accrued expenses and other current liabilities | | | (20,053 | ) |
| Current portion of long-term debt | | | (2,707 | ) |
| Deferred tax liability | | | (24,299 | ) |
| Note payable due to Murray International Holdings Limited | | | (5,147 | ) |
| | |
| |
| Purchase price (net of cash received of $11,304) | | $ | 181,311 | |
| |
F-23
The following table reflects the pro forma revenue and net income (loss) for the periods presented as if the MIM Acquisition and the acquisition of Western Flow had taken place as of January 1, 2004 including the impact of purchase accounting and the associated financing and the sale and leaseback transaction described in note 7:
|
| |
| | Predecessor
|
|---|
| | Successor
For the period
February 1, 2005
to December 31,
2005
|
|---|
| | For the period
January 1, 2005
to January 31,
2005
| | Year
ended
December 31,
2004
|
|---|
|
|---|
| | (unaudited)
|
|---|
| Revenue | | $ | 558,032 | | $ | 42,409 | | $ | 462,594 |
| Net income (loss) | | | 13,739 | | | (9,269 | ) | | 17,321 |
|
The unaudited pro forma consolidated financial information does not purport to represent what the Company's financial position or results of operations would actually have been if these transactions had occurred at such dates or to project the Company's future results of operations.
3. Property, plant and equipment
Property, plant and equipment at December 31, 2005 and 2004 consisted of the following:
| |
| | Successor
2005
| | Predecessor
2004
| |
|---|
| |
| Land and land improvements | | $ | 8,462 | | $ | 5,904 | |
| Building | | | 29,240 | | | 908 | |
| Equipment and computers | | | 22,170 | | | 16,250 | |
| Leasehold improvements | | | 884 | | | 2,256 | |
| | |
| |
| | | | 60,756 | | | 25,318 | |
| Less accumulated depreciation | | | (19,816 | ) | | (14,895 | ) |
| | |
| |
| Property, plant and equipment—net | | $ | 40,940 | | $ | 10,423 | |
| |
Substantially all of the Company's property, plant and equipment serves as collateral for the Company's credit arrangements and long-term debt (see note 6). Depreciation expense for the period February 1, 2005 to December 31, 2005, the period January 1, 2005 to January 31, 2005 and the years ended December 31, 2004 and 2003 was $2,689, $190, $2,282 and $1,896, respectively.
F-24
4. Intangible assets
Intangible assets at December 31, 2005 and 2004 consisted of the following:
|
| | Successor
2005
| | Predecessor
2004
|
|---|
|
| Customer relationships | | $ | 81,495 | | $ | — |
| Tradenames | | | 12,481 | | | — |
| Backlog | | | 5,091 | | | — |
| Non-compete agreements | | | — | | | 45 |
| Trademarks | | | 14 | | | 14 |
| | |
|
| | | $ | 99,081 | | $ | 59 |
|
In connection with the Buy-out Transaction on February 1, 2005 and the MIM Acquisition on December 16, 2005, customer relationships, backlog and tradename intangible assets were identified and recorded in the purchase price allocation (see note 2).
Customer relationships, backlog and non-compete agreements are subject to amortization while tradenames have indefinite lives and are not subject to amortization. Amortization expense was $3,537, $11, $118, and $154 for the period February 1, 2005 to December 31, 2005, the period January 1, 2005 to January 31, 2005 and the years ended December 31, 2004 and 2003, respectively. Accumulated amortization of intangible assets at December 31, 2005 and 2004 was $4,102 and $205, respectively.
The following table presents scheduled amortization expense for the next five years:
|
| 2006 | | $ | 18,166 |
| 2007 | | | 12,221 |
| 2008 | | | 12,221 |
| 2009 | | | 12,221 |
| 2010 | | | 12,221 |
|
5. Goodwill
Under SFAS No. 142,Goodwill and Intangible Assets, an impairment test is required to be performed upon adoption and at least annually thereafter. Material amounts of recorded goodwill attributable to each of the Company's reporting units were tested on January 1, 2005, 2004, and 2003 for impairment by comparing the fair value of each reporting unit with its carrying value. Fair value was determined using discounted cash flows, and guideline company multiples. Significant estimates used in the methodologies include estimates of future cash flows, future short-term and long-term growth rates, weighted average cost of capital and guideline company multiples for each of the reportable units. On an annual basis (absent any impairment indicators), the Company expects to perform its impairment tests during the first quarter. Based on the impairment test, the Company recognized no impairment charge in 2005, 2004 and 2003.
F-25
The following table reflects changes to goodwill during the period February 1, 2005 to December 31, 2005:
|
| Successor | | | |
| Balance at February 1, 2005 | | $ | — |
| Buy-out Transaction | | | 22,048 |
| Acquisition of Western Flow | | | 1,138 |
| Acquisition of MIM | | | 46,191 |
| Foreign currency translation adjustment | | | 147 |
| | |
|
| Balance at December 31, 2005 | | $ | 69,524 |
|
In connection with the Buy-out Transaction, the carrying value of goodwill as of February 1, 2005 of $6,459 was replaced with goodwill derived in the Buy-out Transaction purchase price allocation (see note 2). There were no other changes in the carrying amount of goodwill from January 1, 2004 to January 31, 2005. See note 13 for goodwill by reportable segment.
F-26
6. Credit arrangements and long-term debt
Credit arrangements and long-term debt consisted of the following at December 31, 2005 and 2004:
| |
| | Successor
2005
| | Predecessor
2004
| |
|---|
| |
| PAL Floating Rate Notes, net of discount of $1,271 December 31, 2005, interest accrues at the 6 month LIBOR plus 6.25% (10.92% at December 31, 2005); secured by a lien on the assets of PAL and its subsidiaries | | $ | 128,729 | | $ | — | |
| Edgen Senior Secured Notes, net of discount of $1,386 at December 31, 2005, secured by a lien on the assets of Edgen and its domestic subsidiaries | | | 134,614 | | | — | |
| Revolving credit facility, interest due monthly at a base rate of the lender's stated prime (7.25% at December 31, 2005) or LIBOR plus 200 basis points (6.16% at December 31, 2005) at the option of Edgen), through maturity in February 2010; secured by a lien on the assets of Edgen Alloy and Edgen Carbon | | | — | | | — | |
| Bank of Scotland and other foreign revolving credit facilities; interest at variable rates which range from 4.25% to 9.75%, through maturity in 2010; secured by a lien on the assets of PAL and its subsidiaries | | | 2,170 | | | — | |
| Revolving credit loans; interest due monthly at a base rate of LIBOR plus 300 basis points (5.4% at December 31, 2004), through maturity in February 2008; secured by a lien on the assets of Edgen Alloy and Edgen Carbon | | | — | | $ | 39,609 | |
| Term loan, quarterly principal payments beginning June 30, 2004, including interest at the base rate of LIBOR plus 300 basis points (5.4% at December 31, 2004) through maturity in February 2008; secured by a lien on the assets of Edgen Alloy and Edgen Carbon | | | — | | | 1,275 | |
| Demand note; monthly interest payments at LIBOR plus 10 basis points per annum (2.43% at December 31, 2004), commencing October 1, 2002 through maturity to September 2005, payable to Amsouth Bank | | | — | | | 4,490 | |
| Convertible term notes; interest due at maturity at 12% per annum, commencing October 25, 2000 through maturity in October 2005 | | | — | | | 2,042 | |
| Note payable to sellers of Western Flow, interest accrues at 6%, due with semi-annual payments scheduled in July 2006 and 2007 | | | 257 | | | — | |
| Various other debt; monthly payments range to $1; at an interest rate of 7.5% per annum, commencing July 2005 through maturity in June 2010; secured by equipment | | | 97 | | | 317 | |
| Unsecured subordinated promissory note to a corporation; annual payments of $150,000, including interest at 5.0% per annum, commencing March 31, 2004 through maturity in March 31, 2005 | | | — | | | 150 | |
| Total | | | 265,867 | | | 47,883 | |
| Less current portion | | | (2,331 | ) | | (7,230 | ) |
| | |
| |
| Long-term debt | | $ | 263,536 | | $ | 40,653 | |
| |
F-27
PAL Floating Rate Notes
On December 16, 2005, PAF issued the PAL Floating Rate Notes with an original discount of $1,296. The net proceeds were used to fund a portion of the MIM UK Acquisition (see note 2). Interest accrues on the PAL Floating Rate Notes at a rate equal to a six-month LIBOR plus an applicable margin of 6.25% per annum (10.92% at December 31, 2005) and is payable semiannually in cash on each June 15 and December 15, commencing on June 15, 2006.
At any time on or after December 15, 2006, PAF may redeem the PAL Floating Rate Notes, at its option, at the following redemption prices, plus accrued and unpaid interest to the date of redemption:
|
Year
| | Percentage
|
|---|
|
| 2006 | | 103% |
| 2007 | | 102% |
| 2008 | | 101% |
| 2009 and thereafter | | 100% |
|
In addition, at any time on or prior to December 15, 2006, PAF may redeem up to 35% of the aggregate principal amount of the PAL Floating Rate Notes with the net cash proceeds of one or more equity offerings (as defined by the terms of the PAL Floating Rate Notes). The redemption price is equal to 100% of the aggregate principal amount thereof, together with accrued and unpaid interest thereon. The terms of the PAL Floating Rate Notes also contain certain change in control and sale of asset provisions where the holders of the PAL Floating Rate Notes have the right to require PAF to repurchase all or any part of the PAL Floating Rate Notes at an offer price in cash equal to 101% and 100%, respectively, of the principal amount, plus accrued and unpaid interest to the date of repurchase.
The terms of the PAL Floating Rate Notes contain various covenants that limit, among other things, PAL's ability to incur additional indebtedness, pay dividends, or dispose of all or substantially all of its assets. PAL has a restricted payment pool available, as defined, under which it is allowed to make certain restricted payments.
The PAL Floating Rate Notes are unconditionally guaranteed, jointly and severally, on a senior secured basis by PAL and all of its subsidiaries. The PAL Floating Rate Notes are secured by security interests in all of the assets of PAL and its subsidiaries (other than certain excluded assets), subject to permitted liens. Neither Edgen/Murray, L.P. nor Edgen and its subsidiaries guarantees the PAL Floating Rate Notes.
Edgen Senior Secured Notes
On February 1, 2005, Edgen issued $105,000 aggregate principal amount of the Edgen Senior Secured Notes. The proceeds from the issuance of the Edgen Senior Secured Notes were used to retire substantially all of Edgen's long-term debt under its existing revolving credit facility and certain other notes and loans on February 1, 2005. On December 16, 2005, Edgen issued an additional $31,000 aggregate principal amount of Edgen Senior Secured Notes with the proceeds used to fund the MIM US Acquisition (see note 2).
Interest accrues on the Edgen Senior Secured Notes at the stated rate semi-annually and is payable in arrears on each February 1 and August 1, commencing on August 1, 2005.
F-28
Edgen may redeem some or all of the Edgen Senior Secured Notes at any time prior to February 1, 2008 at a make-whole redemption price set forth in the terms of the Edgen Senior Secured Notes. On or after February 1, 2008, Edgen may at its option, redeem some or all of the Edgen Senior Secured Notes at the following redemption prices, plus accrued and unpaid interest to the date of redemption:
|
| On or after: | | Percentage |
|
| February 1, 2008 | | 104.938% |
| February 1, 2009 | | 102.469% |
| February 1, 2010 | | 100.000% |
|
In addition, at any time prior to February 1, 2007, Edgen may redeem up to 35% of the aggregate principal amounts of the Edgen Senior Secured Notes issued under the indenture at a price equal to 109.875% of their principal amount, plus accrued and unpaid interest, to the date of redemption with the net cash proceeds of certain equity offerings. The terms of the Edgen Senior Secured Notes also contain certain change in control and sale of asset provisions where the holders of the Edgen Senior Secured Notes have the right to require Edgen to repurchase all or any part of the Edgen Senior Secured Notes at an offer price in cash equal to 101% and 100%, respectively, of their principal amount, plus accrued and unpaid interest, to the date of the repurchase.
The indenture governing the Edgen Senior Secured Notes contains various covenants that limit the Company's discretion in the operation of Edgen's business. The indenture among other things: (i) limits the ability and the ability of Edgen's subsidiaries to incur additional indebtedness, issue shares of preferred stock, incur liens and enter into certain transactions with affiliates; (ii) places restrictions on the ability to pay dividends or make certain other restricted payments; and (iii) places restrictions on the ability of Edgen's subsidiaries to merge or consolidate with any other person or sell, assign, transfer, convey or otherwise dispose of all or substantially all of the assets. The indenture provides for a restricted payment pool out of which Edgen is permitted to make certain restricted payments, including cash dividends, provided that no event of default has occurred and Edgen would be able to incur additional indebtedness under the applicable restrictive covenant. The restricted payment pool is generally an amount calculated based on 50% of Edgen's consolidated net income, as defined in the indenture, and earned during the period beginning on February 1, 2005 and ending on the last day of the most recent fiscal quarter prior to the restricted payment, as adjusted and subject to certain exceptions as provided in the indenture.
All of Edgen's domestic subsidiaries, including MIM US, fully and unconditionally guarantee the Edgen Senior Secured Notes on a joint and several basis. Neither Edgen/Murray, L.P. nor MIM UK guarantees the Edgen Senior Secured Notes. The Edgen Senior Secured Notes and the related guarantees are secured by a lien on substantially all of the Edgen's assets and the assets of its existing and future domestic restricted subsidiaries (other than certain excluded assets such as Edgen's and its existing and future subsidiaries' leasehold interests and the capital stock of its existing and future subsidiaries), subject to certain permitted liens and other limitations. Under an intercreditor agreement, the security interest in those assets consisting of inventory, accounts receivable, lockboxes, deposit accounts, securities accounts and financial assets credited thereto, and certain related assets that secure the Edgen Senior Secured Notes and the related guarantees, are subordinated to a lien thereon that secures Edgen's revolving credit facility. As a result of such lien subordination, the Edgen Senior Secured Notes are effectively subordinated to Edgen's revolving credit facility to the extent of the value of such assets.
There are no significant restrictions on Edgen's ability and the ability of the subsidiary guarantors to obtain funds from Edgen and the subsidiary guarantors' respective subsidiaries by dividend or loan.
F-29
Revolving credit facility—Edgen and its subsidiaries
In connection with the Buy-out Transaction, Edgen entered into a new $20,000 senior secured revolving credit facility (the "Credit Agreement") with GMAC Commercial Finance LLC ("GMAC CF"), replacing its approximate $55,500 revolving credit agreement with GMAC CF. The Credit Agreement is subject to certain borrowing limitations and matures on February 1, 2010. Under the Credit Agreement, interest accrues on borrowings (at the option of Edgen) at either (i) the prime rate of interest announced by GMAC CF (7.25% at December 31, 2005), or (ii) a Eurodollar rate based on LIBOR plus 2.00% per annum (6.16% at December 31, 2005). Edgen must also pay a monthly facility fee of 0.50% per annum on the unused portion of the maximum revolving amount. There were no borrowings under the Credit Agreement as of December 31, 2005.
The Credit Agreement is guaranteed by all of Edgen's domestic subsidiaries and is secured by a first priority security interest in all of Edgen's and its domestic subsidiaries' working capital assets and a second priority security interest in all of Edgen's and its domestic subsidiaries' other assets (other than certain excluded assets such as Edgen's leasehold interests and the capital stock of its subsidiaries). Pursuant to the terms of the intercreditor agreement described above, the security interest on the collateral consisting of working capital assets that secures the Edgen Senior Secured Notes and related guarantees is contractually subordinated to the liens thereon securing the Credit Agreement, and the security interest, if any, on substantially all of Edgen's and its domestic subsidiaries' other assets (other than certain excluded assets such as Edgen's leasehold interests and the capital stock of its subsidiaries) that secure the Credit Agreement are contractually subordinated to the liens thereon securing the Edgen Senior Secured Notes and related guarantees.
In addition, the Credit Agreement contains various affirmative and negative covenants, including limitations on additional indebtedness, the making of distributions, loans and advances, transactions with affiliates, dispositions or mergers, and the sale of assets.
Revolving Credit Facilities—PAL and its subsidiaries
In connection with the MIM UK Acquisition, MIM UK entered into a multicurrency revolving credit facility, a letter of credit facility, and a forward foreign exchange contracts facility with the Bank of Scotland (the "PAL Working Capital Facility") with total available commitments of UK£27,000 ($47,990 at December 31, 2005). Of the total commitments, the maximum amount of net borrowings available on the revolving credit facility are UK£12,000 ($21,329 at December 31, 2005). The Company paid fees of $889 to secure the PAL Working Capital Facility which are included in deferred financing costs, net of amortization as of December 31, 2005. The PAL Working Capital Facility expires on maturity of the PAL Floating Rate Notes. The amounts outstanding under the PAL Working Capital Facility incur interest at the Bank of England inter-bank rate plus a margin of 1.75% (6.25% at December 31, 2005).
PAL also has available to it certain credit facilities with local lenders in Dubai and Singapore (the "PAL Foreign Facilities"). The PAL Foreign Facilities provide access to, among other things, short term loans, performance bonds, financial guarantees and trust receipts. The weighted average interest rate on borrowings outstanding at December 31, 2005 is 6.29%.
The PAL Working Capital Facility guarantees any borrowings and commitments under the PAL Foreign Facilities, subject to certain sub-limits stated in each foreign facility. Any borrowings or commitments under the PAL Foreign Facilities reduces the availability under the PAL Working Capital Facility.
F-30
Facilities availability and utilization related to these banking facilities at December 31, 2005 is as follows:
Facilities availability
|
| Total availability | | $ | 47,990 |
| Utilized under PAL Working Capital Facility | | | 6,095 |
| Utilized under PAL Foreign Facilities | | | 9,889 |
| | |
|
| Facilities available | | $ | 32,006 |
|
Facilities utilized
|
| | Included in liabilities at December 31, 2005
| | Contingent liabilities and commitments
|
|---|
| | Within
accounts
payable
| | Within debt
and
managed cash
overdrafts
| | Performance
bonds/financial
guarantees
| | Letters
of credit
| | Foreign
currency
commitments
| | Total
utilization at
December 31, 2005
|
|---|
|
| PAL Foreign Facilities | | $ | 1,689 | | $ | 2,844 | | $ | 2,382 | | $ | 2,405 | | $ | 569 | | $ | 9,889 |
| PAL Working Capital Facility | | | — | | | — | | | 1,098 | | | 4,997 | | | — | | | 6,095 |
| | |
|
| Total | | $ | 1,689 | | $ | 2,844 | | $ | 3,480 | | $ | 7,402 | | $ | 569 | | $ | 15,984 |
|
Third party guarantees
PAL provides performance guarantees on behalf of its subsidiaries directly with third parties in the normal course of business.
PAL has entered into performance guarantees on behalf of a foreign subsidiary which guarantee payment to a customer if a foreign subsidiary fails to perform completely under various contracts. For guarantees that expire within one year, the maximum potential amount of future payments (undiscounted) for non-performance totaled $7,097 at December 31, 2005. For guarantees that do not have an expiration date, there was no maximum amount regarding future payment and the total amount outstanding relating to guarantees was $5,071 at December 31, 2005.
Prior to the MIM UK Acquisition, MIM UK issued several performance guarantees on behalf of other members of MIH. On December 16, 2005, in connection with the MIM UK Acquisition, PAL assumed the outstanding performance guarantees of $6,043 which are currently in the process of being transferred to the MIH in accordance with the MIM UK Acquisition purchase agreement. The maximum potential amount of future payments (undiscounted) PAL could be required to make under these guarantees was $6,043 at December 31, 2005, before any recovery through recourse provisions contained in the purchase agreement between the PAL and MIH. These guarantees do not have a stated expiration date and are not recorded on the balance sheet at December 31, 2005.
F-31
Scheduled annual maturities for all Company outstanding credit arrangements and long-term debt for the years after December 31, 2005 are as follows:
| |
| 2006 | | $ | 2,331 | |
| 2007 | | | 146 | |
| 2008 | | | 18 | |
| 2009 | | | 19 | |
| 2010 | | | 10 | |
| Thereafter | | | 266,000 | |
| | |
| |
| Subtotal | | | 268,524 | |
| Less: Discount on PAL Floating Rate Notes and Edgen Senior Secured Notes | | | (2,657 | ) |
| | |
| |
| Total | | $ | 265,867 | |
| |
7. Capital lease
In connection with the MIM Acquisition on December 16, 2005, MIM UK sold land, an office building and two warehouses at its Newbridge location for $23,040 less fees of approximately $308. Concurrent with the sale, MIM UK entered into an agreement to lease back all of the sold property for an initial lease term of 25 years. Under the lease agreement, the initial term will be extended for two further terms of ten years each unless cancelled by MIM UK. The lease is being accounted for as a capital lease because the net present value of the future minimum lease payments exceeds 90% of the fair value of the leased asset. The lease requires MIM UK to pay customary operating and repair expenses. Under purchase accounting, the Company determined that the lease terms were representative of fair value and did not record the liability (deferred gain) in its purchase price allocation related to a $2,604 gain on the sale.
The carrying value of the leased fixed assets at December 31, 2005, net of accumulated depreciation of $104, is $20,755 and is included in buildings within property, plant and equipment on the balance sheet. The following is a schedule of the future minimum lease payments under the finance lease and with the present value of the net minimum lease payments at December 31, 2005:
| |
| Year ending December 31: | | | | |
| | 2006 | | $ | 2,131 | |
| | 2007 | | | 2,131 | |
| | 2008 | | | 2,131 | |
| | 2009 | | | 2,131 | |
| | 2010 | | | 2,131 | |
| Later years | | | 42,342 | |
| | |
| |
| Total minimum lease payments | | | 52,997 | |
| Less: amount representing interest | | | (32,176 | ) |
| | |
| |
| Present value of minimum lease payments | | $ | 20,821 | |
| |
At December 31, 2005, the Company has recorded current and non-current obligations under the finance lease of $232 and $20,589, respectively. Depreciation expense for the period February 1, 2005 to December 31, 2005 was $34.
F-32
8. Redeemable and mandatorily redeemable preferred stock
Redeemable Preferred Stock
On February 1, 2005, Edgen issued Series A 81/2% Cumulative Compounding Preferred Stock, $.01 par value ("Series A Preferred Stock"), in connection with the Buy-out Transaction. The holders of Series A Preferred Stock are entitled to receive annual dividends when, as and if, declared. The dividends are cumulative, whether or not earned or declared, and accrue at a rate of 8.5%, compounding annually, and are payable in cash or shares of Series A Preferred Stock, at the discretion of Edgen's board of directors. Upon the occurrence of certain events, including a public offering, the sale of substantially all the assets of the Company, a change in control or the approval of Edgen's board of directors, the Series A Preferred Stock can be redeemed by Edgen at a price of $1,000 per share, plus accrued and unpaid dividends. For the period February 1, 2005 to December 31, 2005, Edgen accrued dividends of $1,622 on the shares of outstanding Series A Preferred Stock which was exchanged for Edgen/Murray, L.P. preferred units on December 15, 2005 (see note 9).
The Edgen Senior Secured Notes indenture restricts the payment of dividends to preferred shareholders as well as the redemption of the Series A Preferred Stock, subject to an incurrence test based on a consolidated net income threshold, and subject to available amounts as defined by the indenture.
Mandatorily Redeemable Preferred Stock
In connection with the Buy-out Transaction on February 1, 2005, all mandatorily redeemable preferred stock of Edgen was redeemed. Prior to February 1, 2005, the holders of the Series A Cumulative Redeemable Preferred Stock, $.01 par value ("Series A Redeemable Preferred Stock"), were entitled to receive cash dividends at the rate of $6.00 per annum per share. Outstanding shares of Series A Redeemable Preferred Stock are mandatorily redeemable by the Company upon the occurrence of certain events including a public offering, the sale of substantially all the assets of the Company or a change in control, at a price of $100.00 per share, plus accrued and unpaid dividends. The Preferred Stock is also subject to optional redemption at the discretion of the board of directors at a price of $100.00 per share, plus accrued and unpaid dividends.
Holders of the Series B Redeemable Preferred Stock, $.01 par value ("Series B Redeemable Preferred Stock"), with respect to rights of liquidation, winding up and dissolution, rank junior to the Series A Redeemable Preferred Stock, but senior to all other Edgen equity securities. The holders of the Series B Redeemable Preferred Stock are not entitled to receive cash dividends. The outstanding shares of Series B Redeemable Preferred Stock were mandatorily redeemable similarly to the Series A Redeemable Preferred Stock except that the redemption price is $400 per share plus a "return" amount up to an additional $400 per share.
9. Partners' capital and shareholders' equity (deficit)
Partners' capital—subsequent to exchange on December 16, 2005
On November 22, 2005, Edgen/Murray, L.P. was formed as a Delaware limited partnership by Edgen/Murray GP, LLC, the general partner and a company controlled by JCP. On December 15, 2005, the shareholders of Edgen exchanged (the "Exchange") their preferred shares and common shares of Edgen for preferred partnership units and common partnership units in Edgen/Murray, L.P. in proportion to the preferred shares and common shares held in Edgen, pursuant to the terms of an exchange agreement. At the time of the exchange, (i) 2,400,000 shares of common stock, par value $.01
F-33
per share, and (ii) 21,600 shares of preferred stock, par value $1,000 per share were issued and outstanding. Additionally, outstanding shares of restricted stock issued by Edgen were also exchanged for restricted common units proportionally as well as $1,622 in accrued preferred dividends.
The amended and restated partnership agreement of Edgen/Murray, L.P. (the "Partnership Agreement"), dated December 15, 2005, describes the partnership capital accounts as follows:
Preferred partnership units—A preferred partnership unit ("partnership unit") has an original stated value of $1,000 per unit which accrues interest annually with a compounding date of October 31, the preferred compounding date. Interest compounds based on the preferred redemption value (the "Preferred Redemption Value") as of a specified date and is comprised of (i) the preferred original stated value, plus (ii) an amount equal to the amount that would accrue during the period commencing on the date of issuance of such preferred unit and ending on such specified date on a principal amount equal to the unreturned preferred value, defined as the preferred original stated value increased for additional contributions and reduced by distributions, using a rate equal to 8.5% per annum.
Common partnership units—A common partnership unit ("a common unit") represents a fractional part of ownership of the partnership and is entitled to share in the profit and losses of the partnership which are allocated annually in proportion to the number of common units held by each holder of common units.
Under the Partnership Agreement, the general partner must approve all distributions. Any distributions are first made to the holders of preferred units, in proportion to the number of preferred units held by each holder of preferred units, until each holder has received cumulative aggregate distributions in an amount equal to, but not in excess of, the Preferred Redemption Value; and then made to the holders of common units, in proportion to the number of common units held by each holder of common units.
Non-vested common units—Effective December 15, 2005, Edgen's equity incentive plan was cancelled and Edgen exchanged all outstanding awards for awards issued under Edgen/Murray, L.P.'s equity incentive plan with substantially equivalent terms. The Edgen/Murray, L.P. incentive plan authorizes the granting of awards to Edgen employees of up to 550,000 common units of Edgen/Murray, L.P. that are subject to restrictions on transfer until such time as they are vested. Vesting is based on either time or a combination of performance and time. For the period February 1, 2005 to December 31, 2005, the statement of operations includes $282 of stock-based compensation expense related to the outstanding non-vested shares which were exchanged on December 15, 2005.
For the period February 1, 2005 to December 31, 2005, the statement of operations reflects $13 of stock-based compensation expense related to Edgen/Murray, L.P. non-vested common units issued on December 16, 2005.
Shareholders' equity (deficit)—subsequent to Buy-out Transaction by JCP on February 1, 2005
Common units—Prior to the Exchange on December 15, 2005, the capital accounts of the Company included shares of Class A Common Stock, $.01 par value, which were entitled to vote.
Non-vested common shares—On February 1, 2005, 281,565 shares of non-vested common stock were granted to certain employees of Edgen, including the Chief Executive Officer, the Chief Financial Officer and the two Operating Segment Presidents under a new incentive compensation plan. Vesting of the non-vested shares was based on either time or a combination of performance and time. The time-based vesting schedule was generally 20% per year over a five year period subject to the holder's
F-34
continued employment with the Company. Non-vested stock grants that used a vesting schedule that combined performance and time generally vested 10% per year over five years subject to continued employment with the Company plus an additional 10% or more per year for each year that the Company achieved certain performance goals as determined by the board of directors. Performance based non-vested stock was cumulative so if the performance goals were achieved in any year of the five year period, all non-vested stock subject to the performance criteria for that year and prior years would vest. If the performance goals were not achieved within five years of the grant date, the non-vested stock subject to the performance goals would be forfeited. Upon a change in control, all non- vested stock subject to time based vesting would fully and immediately vest.
For the period February 1, 2005 to December 31, 2005, the statement of operations includes $282 of stock-based compensation expense related to the outstanding non-vested shares which were exchanged on December 15, 2005.
Shareholders' equity (deficit)—prior to Buy-out Transaction by JCP on February 1, 2005
Prior to the Buy-out Transaction by JCP on February 1, 2005, the capital accounts of the Company included the following:
Common stock—The holders of Class A Common Stock $.01 per share ("Class A Common Stock"), and Class B Common Stock, $.01 per share ("Class B Common Stock"), were entitled to vote. In connection with the Buy-out Transaction, the Class B Common Stock, which was exchangeable at the option of the holder into Class A Common Stock on a one-to-one basis, was cancelled.
Shareholder loans—Through December 31, 2003 and pursuant to a management stock purchase agreement, certain officers, directors and managers of Edgen purchased 556,033 shares of Class A Common Stock and 7,570 shares of mandatorily redeemable preferred stock of Edgen in exchange for cash and promissory notes. All of the outstanding notes were paid in 2004 in conjunction with the buy back of the related outstanding shares by Edgen.
Stock options—In December 1998, the shareholders of Edgen approved a stock option plan to provide stock options as incentives and rewards for employees of Edgen. Under the stock option plan, a maximum of 550,000 shares of Edgen's Class A Common Stock could be granted. In connection with the Buy-out Transaction on February 1, 2005, Edgen's stock option plan and all outstanding stock options were cancelled and restricted stock was granted under a new incentive compensation plan.
Prior to cancellation, the terms of the stock options included an exercise price at the fair market value of the shares at the date of grant and the options vested ratably over a five year period. At December 31, 2004 and 2003, 113,283 and 113,283, respectively, options were outstanding and unexercised.
Edgen had granted stock options to employees with an exercise price equal to the fair value of the shares at the date of grant. We accounted for these stock option grants in accordance with APB Opinion 25 (the intrinsic value method). Under APB Opinion 25, because the exercise price of the Edgen's employee stock options equaled the market price of the underlying stock on the date of grant, no compensation expense was recognized.
For purpose of pro forma disclosures, as required by SFAS 123, the estimated fair value of the options (net of expected tax benefits) would be amortized to expense over the options' five year vesting period. The pro forma impact for the period January 1, 2005 through January 31, 2005 and for the years ended
F-35
December 31, 2004 and 2003 did not have a significant impact on Edgen's results of operations or financial position.
A summary of changes in options is as follows:
|
| | Predecessor
|
|---|
| |
| |
| | December 31,
|
|---|
| | Period
January 1, 2005
to January 31, 2005
| | 2004
| | 2003
|
|---|
| | Shares
| | Weighted
average
exercise
price
| | Shares
| | Weighted
average
exercise
price
| | Shares
| | Weighted
average
exercise
price
|
|---|
|
| Shares under option—beginning of period | | 113,283 | | $ | 6.53 | | 113,283 | | $ | 6.53 | | 204,769 | | $ | 7.50 |
| Shares granted | | — | | | | | — | | | | | 20,000 | | $ | 2.00 |
| Shares forfeited | | — | | | | | — | | | | | (111,486 | ) | $ | 7.50 |
| Shares exercised | | — | | | | | — | | | | | — | | | |
| Shares under option—end of period | | 113,283 | | $ | 6.53 | | 113,283 | | $ | 6.53 | | 113,283 | | $ | 6.53 |
| | |
|
| Shares exercisable—end of period | | 68,627 | | | | | 68,627 | | | | | 68,627 | | | |
| | |
| | | | |
| | | | |
| | | |
| Remaining authorized shares under approved plan—end of period | | 386,717 | | | | | 386,717 | | | | | 386,717 | | | |
|
The following table presents information relating to the Edgen's stock options outstanding at December 31, 2004 (share data in thousands):
|
| | Options outstanding
| | Options exercisable
|
|---|
Range of exercise prices
| | Number
outstanding
| | Weighted-
average
exercise
price
| | Weighted-
average
remaining
years
| | Number
exercisable
| | Weighted-
average
exercise
price
|
|---|
|
| $2.00-$7.50 | | 113,283 | | $ | 6.53 | | 4.95 | | 68,627 | | $ | 7.50 |
|
F-36
10. Income taxes
Deferred income taxes reflect the net tax effect of temporary differences between the carrying amounts of assets and liabilities for financial reporting purposes and the amounts for income tax purposes. Significant components of the Company's deferred tax assets and liabilities at December 31, 2005 and 2004 are as follows:
|
| | December 31,
|
|---|
| | Successor
2005
| | Predecessor
2004
|
|---|
|
| Deferred tax assets | | | | | | |
| Current deferred tax assets: | | | | | | |
| Deferred compensation | | $ | 125 | | $ | 208 |
| Inventory | | | 1,239 | | | 751 |
| Bad debt allowance | | | 325 | | | 235 |
| Net operating loss carryforwards | | | 216 | | | 369 |
| Accrued bonuses and professional fees | | | 59 | | | — |
| Other | | | 102 | | | 17 |
| | |
|
| | Total current deferred tax assets | | | 2,066 | | | 1,580 |
| Non-current deferred tax assets: | | | | | | |
| Goodwill impairment | | | 6,232 | | | 7,119 |
| Net operating loss carryforwards | | | 207 | | | 423 |
| Tax credits | | | 462 | | | — |
| Depreciation | | | 131 | | | — |
| Other | | | 147 | | | 159 |
| | |
|
| | Total non-current deferred tax assets | | | 7,179 | | | 7,701 |
| | |
|
| Total deferred tax assets | | | 9,245 | | | 9,281 |
Deferred tax liabilities |
|
|
|
|
|
|
| Current deferred tax liabilities: | | | | | | |
| Inventory—fair value purchase price adjustment | | | 98 | | | — |
| Cash discounts earned | | | 69 | | | 1 |
| Other | | | 196 | | | 107 |
| | |
|
| | Total current deferred tax liabilities | | | 363 | | | 108 |
| Non-current deferred tax liabilities: | | | | | | |
| Acquired customer relationships and tradenames | | | 32,141 | | | — |
| Depreciation | | | 697 | | | 782 |
| Unremitted earnings of foreign subsidiaries | | | 542 | | | — |
| Other | | | 264 | | | 1 |
| | |
|
| | Total non-current deferred tax liabilities | | | 33,644 | | | 783 |
| Total deferred tax liabilities | | | 34,007 | | | 891 |
| | |
|
| Net deferred tax (liability) asset | | $ | (24,762 | ) | $ | 8,390 |
|
F-37
As of December 31, 2005, deferred tax liabilities include the difference in book and tax basis related to other identifiable intangible assets, customer relationships and tradenames, identified in the Buy-out Transaction and the MIM Acquisition (see note 2).
As presented in the consolidated statement of cash flows, the change in deferred income taxes includes, among other items, the change in deferred income taxes related to the deferred income tax provision and the change between the deferred income taxes estimated and actual deferred income taxes for each year. The Company also acquired $644 in deferred tax assets and $35,741 in deferred tax liabilities in connection with the Buy-out Transaction and the MIM Acquisition in 2005.
Income (loss) from continuing operations for each jurisdiction follows for the respective period:
| |
| | Successor
| | Predecessor
| |
|---|
| | Period
February 1,
2005 to
December 31,
2005
| | Period
January 1,
2005 to
January 31,
2005
| | Year ended December 31,
| |
|---|
| | 2004
| | 2003
| |
|---|
| |
| United States | | $ | 7,644 | | $ | (10,156 | ) | $ | 12,998 | | $ | (8,665 | ) |
| Foreign | | | 1,413 | | | — | | | — | | | — | |
| | |
| |
| | | $ | 9,057 | | $ | (10,156 | ) | $ | 12,998 | | $ | (8,665 | ) |
| |
Components of income tax expense (benefit) are as follows:
| |
| |
| | Predecessor
| |
|---|
| | Successor
| |
|---|
| |
| | Year ended December 31,
| |
|---|
| | Period
February 1,
2005 to
December 31, 2005
| | Period
January 1,
2005 to
January 31, 2005
| |
|---|
| | 2004
| | 2003
| |
|---|
| |
| Current: | | | | | | | | | | | | | |
| United States | | $ | 3,807 | | $ | (2,015 | ) | $ | 1,163 | | $ | (2,792 | ) |
| Foreign | | | 273 | | | — | | | — | | | — | |
| | |
| |
| | | | 4,080 | | | (2,015 | ) | | 1,163 | | | (2,792 | ) |
| Deferred: | | | | | | | | | | | | | |
| United States | | | (1,036 | ) | | 99 | | | (4,374 | ) | | (1,562 | ) |
| Foreign | | | 11 | | | — | | | — | | | — | |
| | |
| |
| | | | (1,025 | ) | | 99 | | | (4,374 | ) | | (1,562 | ) |
| | |
| |
| Total | | $ | 3,055 | | $ | (1,916 | ) | $ | (3,211 | ) | $ | (4,354 | ) |
| |
For the period February 1, 2005 to December 31, 2005, the Company recorded $19 of income tax expense related to foreign currency translation included in other comprehensive income which is not reflected in the table above. For the year ended December 31, 2003, income tax expense (benefit) includes an income tax benefit of $(159) related to discontinued operations on the consolidated statement of operations.
F-38
For the period February 1, 2005 to December 31, 2005 and the year ended December 31, 2004, the Company made payments related to income taxes totaling $212 and $1,327, respectively. No tax payments were made for the period January 1, 2005 to January 31, 2005. In 2005, the Company deferred its third and fourth quarter 2005 estimated federal tax payments as allowed by the Katrina Emergency Tax Relief Act of 2005. These estimated 2005 tax payments were paid on February 28, 2006.
The total provision for income taxes varied from the US federal statutory rate due to the following:
|
| |
| |
| | Predecessor
|
|---|
| | Successor
|
|---|
| |
| |
| | Year ended December 31,
|
|---|
| | Period
February 1, 2005 to
December 31, 2005
| | Period
January 1, 2005 to
January 31, 2005
|
|---|
| | 2004
| | 2003
|
|---|
|
| Federal income tax expense (benefit) at statutory rate | | $ | 3,080 | | 34% | | $ | (3,453 | ) | (34)% | | $ | 4,419 | | 34% | | $ | (3,064 | ) | (35)% |
| Differences in foreign income tax rates | | | (202 | ) | (2)% | | | — | | — | | | — | | — | | | — | | — |
| State income taxes net of federal income tax benefit | | | 79 | | 1% | | | 53 | | 1% | | | 390 | | 3% | | | (270 | ) | (3)% |
| Decrease in valuation allowance | | | — | | — | | | — | | — | | | (8,014 | ) | (62)% | | | (873 | ) | (10)% |
| Non-deductible Buy-out Transaction expenses | | | — | | — | | | 1,475 | | 14% | | | — | | — | | | — | | — |
| Non-deductible expenses and other | | | 98 | | 1% | | | 9 | | — | | | (6 | ) | — | | | (147 | ) | (2)% |
| | |
|
| Total provision for income taxes | | $ | 3,055 | | 34% | | $ | (1,916 | ) | (19)% | | $ | (3,211 | ) | (25)% | | $ | (4,354 | ) | (50)% |
|
As of December 31, 2005, US taxes were not provided on earnings of Edgen Canada, Edgen's foreign subsidiary, as the Company has invested or expects to invest the undistributed earnings indefinitely. If in the future these earnings are repatriated to the United States, or if the Company determines that the earnings will be remitted in the foreseeable future, additional tax provisions may be required. With respect to UK taxes, $89 of taxes were provided on earnings of PAL's foreign subsidiary, MIM Singapore, as the Company expects a portion of the earnings to be distributed to PAL and are therefore not considered to be permanently invested in the subsidiary.
As of December 31, 2002, a valuation allowance was recorded against the deferred tax asset because management believed that the deferred tax assets related to the goodwill impairment would not more than likely be realized in full through future operating results and the reversal of taxable timing differences. Based on operating results for year ended December 31, 2004 and projected operating results for the years ended December 31, 2005 and 2006, management believed that a valuation allowance was no longer required and the valuation allowance was reversed as of December 31, 2004. This resulted in an increase in the deferred tax asset as of December 31, 2004 and a corresponding decrease in income tax expense for the year then ended of approximately $7,100.
For state income tax purposes, the Company has net operating loss carryforwards ("NOLs") of approximately $14,100 available to reduce future state taxable income. The Company's NOLs expire in varying amounts beginning in 2008 through 2023.
11. Commitments and contingencies
Operating leases
Through its subsidiaries, the Company leases various properties, warehouses, equipment, vehicles and office space under operating leases with remaining terms ranging from two to twelve years with various renewal options. Substantially all leases require payment of taxes, insurance and maintenance costs in
F-39
addition to rental payments. Total rental expense for all operating leases was $1,473, $100, $1,251, and $1,356 for the period February 1, 2005 to December 31, 2005, the period January 1, 2005 to January 31, 2005 and the years ended December 31, 2004 and 2003, respectively.
Future minimum payments under noncancelable leases with initial or remaining terms in excess of one year for fiscal years beginning after December 31, 2005 are:
|
| 2006 | | $ | 2,030 |
| 2007 | | | 1,362 |
| 2008 | | | 1,049 |
| 2009 | | | 644 |
| 2010 | | | 550 |
| Thereafter | | | 892 |
| | |
|
| Total | | $ | 6,527 |
|
These leases have various expiration dates ranging from 2006 to 2030. Certain leases contain renewal options of up to 20 years.
Employment agreements
In the ordinary course of business, the Company has entered into employment contracts with certain executives and former owners; these contracts provide for minimum salary levels and incentive bonuses.
Legal proceedings
The Company is involved in various claims, lawsuits and proceedings arising in the ordinary course of business. While there are uncertainties inherent in the ultimate outcome of such matters and it is impossible to presently determine the ultimate costs that may be incurred, management believes the resolution of such uncertainties and the incurrence of such costs will not have a material adverse effect on the Company's consolidated financial position, results of operations or cash flows.
12. Concentration of risks
During the period February 1, 2005 to December 31, 2005 and the period January 1, 2005 to January 31, 2005, the Company's ten largest customers represented approximately 26% and 22%, respectively, of the Company's sales and no one customer accounted for more than 10%.
For the years ended December 31, 2004 and 2003, the Company's ten largest customers represented approximately 22% and 24%, respectively, of the Company's sales and no one customer accounted for more than 10%.
Financial instruments which would potentially subject the Company to a significant concentration of credit risk consist primarily of accounts receivable. However, concentration of credit risk with respect to the accounts receivable is limited due to a large number of entities comprising the customer base.
The Company relies on a limited number of third parties to supply its inventory. During the period February 1, 2005 to December 31, 2005 and the period January 1, 2005 to January 31, 2005, the Company's ten largest vendors accounted for approximately 58% and 54%, respectively, of the
F-40
Company's purchases and the Company's single largest vendor accounted for approximately 15% and 11%, respectively, of the Company's purchases in these periods.
13. Segment and geographic area information
The Company has five reportable segments, which are primarily determined based upon the geographic locations of the Company's operations, and within its Americas operations by product lines. These reportable segments are the Americas—Alloy Products, the Americas—Carbon Products, UK, Singapore and UAE. The UK, Singapore and UAE segments were added as a result of the MIM Acquisition.
The Americas—Alloy products segment distributes specialty steel pipe and components for use in environments that are highly corrosive, extremely high or low temperature and/or involve high pressures. These products are sold primarily to the process/petrochemical and power generation industries. The Americas—Carbon products segment distributes specialty carbon steel pipe, pipe components and high grade structural sections and plates primarily for use in high pressure and/or abrasive environments. The primary industries served are the oil and gas production and transmission, the process and the power generation industries. The Americas—Alloy products and the Americas—Carbon products are headquartered in Baton Rouge, Louisiana and market products to customers in the United States, Canada and Latin America.
Similar to the Americas—Carbon products segment, the UK, Singapore and UAE segments are distributors of high grade steel tubes, plates and sections to primarily the offshore oil and gas industry. The UK segment, headquartered in Newbridge, Scotland, markets products to customers in Europe, the Caspian Sea region and West Africa. The Singapore segment, headquartered in Singapore and supported by a sales office in Perth, Australia, markets products to customers in the Asia/Pacific region. The UAE segment, headquartered in Dubai, United Arab Emirates, markets products to customers located in the Middle East region and South Asia.
A local management team manages each reportable segment independently, with oversight from the Company's executive management in Baton Rouge, Louisiana and Newbridge, Scotland. In addition, certain expenses of Edgen/Murray, L.P., other non-operational expenses and certain assets and liabilities, such as intangible assets, are not allocated to the segments but are included in general corporate.
The accounting policies of the segments are the same as those described in the summary of significant accounting policies. The Company evaluates performance based on profit or losses from operations before income taxes not including nonrecurring gains or losses and discontinued operations. The Company accounts for sales between segments at a margin agreed to between segment management.
The sales of the Americas segment do not include intersegment sales between Americas—Alloy products and Americas—Carbon products as they are eliminated within the segment results whereas sales between other segments are managed on a gross basis including intersegment sales.
F-41
The following table presents the financial information for each reportable segment:
| |
| | Successor
| | Predecessor
| |
|---|
| | February 1,
2005 to
December 31,
2005
| | January 1,
2005 to
January 31,
2005
| | December 31,
2004
| | December 31,
2003
| |
|---|
| |
| Sales: | | | | | | | | | | | | | |
| | Americas—Alloy products | | $ | 72,380 | | $ | 4,214 | | $ | 52,251 | | $ | 41,011 | |
| | Americas—Carbon products | | | 190,366 | | | 14,731 | | | 155,570 | | | 106,014 | |
| | UK | | | 10,290 | | | — | | | — | | | — | |
| | Singapore | | | 6,264 | | | — | | | — | | | — | |
| | UAE | | | 3,625 | | | — | | | — | | | — | |
| | |
| |
|
|
$ |
282,925 |
|
$ |
18,945 |
|
$ |
207,821 |
|
$ |
147,025 |
|
| | |
| |
| Intersegment sales: | | | | | | | | | | | | | |
| | Americas—Alloy products | | $ | 563 | | $ | — | | $ | 193 | | $ | — | |
| | Americas—Carbon products | | | 1,683 | | | 32 | | | 1,338 | | | 267 | |
| | UK | | | — | | | — | | | — | | | — | |
| | Singapore | | | — | | | — | | | — | | | — | |
| | UAE | | | — | | | — | | | — | | | — | |
| | |
| |
| | | $ | 2,246 | | $ | 32 | | $ | 1,531 | | $ | 267 | |
| | |
| |
| Operating income (loss): | | | | | | | | | | | | | |
| | Americas—Alloy products | | $ | 9,786 | | $ | 960 | | $ | 5,309 | | $ | 1,436 | |
| | Americas—Carbon products | | | 17,346 | | | 1,981 | | | 21,844 | | | 1,627 | |
| | UK | | | 1,548 | | | — | | | — | | | — | |
| | Singapore | | | 747 | | | — | | | — | | | — | |
| | UAE | | | 289 | | | — | | | — | | | — | |
| |
General corporate |
|
|
(8,213 |
) |
|
(12,714 |
) |
|
(9,098 |
) |
|
(8,780 |
) |
| | |
| |
| | | $ | 21,503 | | $ | (9,773 | ) | $ | 18,055 | | $ | (5,717 | ) |
| | |
| |
| Capital expenditures: | | | | | | | | | | | | | |
| | Americas—Alloy products | | $ | 670 | | $ | — | | $ | 213 | | $ | 172 | |
| | Americas—Carbon products | | | 260 | | | 4 | | | 456 | | | 357 | |
| | UK | | | — | | | — | | | — | | | — | |
| | Singapore | | | — | | | — | | | — | | | — | |
| | UAE | | | 5 | | | — | | | — | | | — | |
| |
General corporate |
|
|
385 |
|
|
— |
|
|
442 |
|
|
1,970 |
|
| | |
| |
| | | $ | 1,320 | | $ | 4 | | $ | 1,111 | | $ | 2,499 | |
| | |
| |
| Depreciation and amortization: | | | | | | | | | | | | | |
| | Americas—Alloy products | | $ | 1,360 | | $ | 15 | | $ | 177 | | $ | 177 | |
| | Americas—Carbon products | | | 3,110 | | | 81 | | | 960 | | | 1,028 | |
| | UK | | | 57 | | | — | | | — | | | — | |
| | Singapore | | | 9 | | | — | | | — | | | — | |
| | UAE | | | 14 | | | — | | | — | | | — | |
| |
General corporate |
|
|
1,676 |
|
|
105 |
|
|
1,263 |
|
|
796 |
|
| | |
| |
| | | $ | 6,226 | | $ | 201 | | $ | 2,400 | | $ | 2,001 | |
| |
During the period February 1, 2005 to December 31, 2005 and the period January 1, 2005 to January 31, 2005, the Company's ten largest customers represented approximately 26% and 22%, respectively, of the Company's sales and no one customer accounted for more than 10%. For the years ended December 31, 2004 and 2003, the Company's ten largest customers represented approximately 22% and 24%, respectively, of the Company's sales and no one customer accounted for more than 10%.
F-42
The Company's sales to external customers are attributed to the following countries based upon the Company's selling location:
|
| | Successor
| | Predecessor
|
|---|
| | February 1,
2005 to
December 31,
2005
| | January 1,
2005 to
January 31,
2005
| | December 31,
2004
| | December 31,
2003
|
|---|
|
| United States | | $ | 260,298 | | $ | 18,945 | | $ | 207,821 | | $ | 147,025 |
| Canada | | | 2,448 | | | — | | | — | | | — |
| UK | | | 10,290 | | | — | | | — | | | — |
| Singapore | | | 6,264 | | | — | | | — | | | — |
| UAE | | | 3,625 | | | — | | | — | | | — |
| Other | | | — | | | — | | | — | | | — |
| | |
|
| | | $ | 282,925 | | $ | 18,945 | | $ | 207,821 | | $ | 147,025 |
|
|
| |
| | Predecessor
|
|---|
| | Successor
|
|---|
| | As of
December 31,
2004
| |
December 31,
2003
|
|---|
| | December 31,
2005
|
|---|
|
| Total assets: | | | | | | | | | |
| | United States | | $ | 210,947 | | $ | 26,325 | | $ | 30,233 |
| | Canada | | | 4,113 | | | 79,177 | | | 61,526 |
| | UK | | | 106,047 | | | — | | | — |
| | Singapore | | | 42,247 | | | — | | | — |
| | UAE | | | 27,777 | | | — | | | — |
| | General corporate | | | 129,090 | | | 13,360 | | | 13,801 |
| | |
|
| | | | $ | 520,221 | | $ | 118,862 | | $ | 105,560 |
| | |
|
| Property, plant and equipment: | | | | | | | | | |
| | United States | | $ | 8,820 | | $ | 746 | | $ | 711 |
| | Canada | | | 455 | | | 6,975 | | | 7,436 |
| | UK | | | 22,267 | | | — | | | — |
| | Singapore | | | 6,191 | | | — | | | — |
| | UAE | | | 1,224 | | | — | | | — |
| | General corporate | | | 1,983 | | | 2,702 | | | 3,522 |
| | |
|
| | | | $ | 40,940 | | $ | 10,423 | | $ | 11,669 |
| | |
|
| Goodwill and other intangible assets: | | | | | | | | | |
| | United States | | $ | 63,095 | | $ | 400 | | $ | 400 |
| | Canada | | | 715 | | | 6,104 | | | 6,122 |
| | General corporate | | | 104,795 | | | 14 | | | 14 |
| | |
|
| | | | $ | 168,605 | | $ | 6,518 | | $ | 6,536 |
|
The Company has not allocated the goodwill and other intangibles to the UK, Singapore and UAE segments; instead, goodwill and other intangibles are reflected under general corporate.
F-43
14. Derivatives and other financial instruments
Treasury policy and risk management
Management is responsible for raising financing for operations, together with associated liquidity management, and the management of foreign exchange and interest rate risk. The treasury operations of the Company are conducted under the oversight of management, who receive regular updates of treasury activity. Financial instruments are entered into for risk management purposes only. The stated policy on foreign exchange rate hedging requires that only known firm commitments are hedged and that no trading in financial instruments is undertaken.
The Company's principal risks are its exposures to changes in interest rates and currency exchange rates. These risks are closely monitored and evaluated by appropriate management including the Chief Financial Officer and respective local accounting management for all Company locations. Following evaluation of those positions, the Company selectively enters into derivative financial instruments to manage any exposures. Currently, the Company has only entered into derivative financial instruments to manage exposures related to currency exchange rate changes.
F-44
Currency exchange rate risk
The Company assesses its currency exchange exposure on certain monetary assets and liabilities and enters into financial instruments, as it believes necessary, to manage this risk. During the normal course of business, the Company is exposed to foreign currency risk. These risks can create volatility in earnings and cash flows from year to year. The Company uses derivative financial instruments to reduce exposure to foreign currency movements on foreign currency purchases and sales. The Company does not use derivative financial instruments for speculative purposes.
The fair value of currency exchange derivative contracts outstanding at December 31, 2005 was a liability of $388. An amount equal to the change in the fair value of the contracts assumed through the MIM Acquisition on December 16, 2005, of $388, has been reflected in other income (expense) on the consolidated statement of operations.
At December 31, 2005, the total notional amount of outstanding foreign currency exchange contracts was $39,404. There were no outstanding foreign currency exchange contracts at December 31, 2004.
Credit risk
The Company's credit risk on liquid resources and derivative financial instruments is limited because the counterparties are banks with high credit ratings assigned by international credit-rating agencies. The Company has no significant concentration of credit risk with a specific counterparty because exposure is spread over a number of counterparties.
Fair values
Shown below is a comparison by category of the book values and the estimated fair value of the Company's financial assets and financial liabilities, and the associated derivative financial instruments described above. The fair value amounts shown are not necessarily indicative of the amounts that the Company would realize upon disposition nor do they indicate the Company's intent or ability to dispose of the financial instruments.
The comparison of carrying value and fair value of the Company's financial instruments at December 31, 2005 and 2004 is presented below.
|
| | Successor
December 31,
2005
| | Predecessor
December 31,
2004
|
|---|
| | Carrying value
| | Fair value
| | Carrying value
| | Fair value
|
|---|
|
| PAL Floating Rate Notes | | $ | 128,729 | | $ | 128,729 | | $ | — | | $ | — |
| Edgen Senior Secured Notes | | | 134,614 | | | 132,000 | | | — | | | — |
| Cash at bank and in hand | | | 41,146 | | | 41,146 | | | 134 | | | 134 |
| Accounts receivable | | | 111,584 | | | 111,584 | | | 31,751 | | | 31,751 |
| Accounts payable | | | 87,065 | | | 87,065 | | | 19,018 | | | 19,018 |
| Derivative financial instruments held: | | | | | | | | | | | | |
| Foreign currency forward contracts | | $ | (388 | ) | $ | (388 | ) | $ | — | | $ | — |
|
The fair value of the PAL Floating Rate Notes and the Edgen Senior Secured Notes, excluding unamortized discount, has been estimated based upon market quotes approximating the fair value at the balance sheet.
F-45
The fair value of cash at bank and in hand, accounts receivable and accounts payable approximates its carrying value due to the short-term maturity of these instruments.
The fair value of derivative instruments is based on the estimated amount the Company would receive or pay if the transaction was terminated, taking into consideration prevailing exchange rates.
The foreign currency forward contracts fair value includes the value of contracts used as hedges of future sales or purchases. The Company believes that the carrying amount of other financial assets and liabilities approximates their fair values.
15. Employee benefit plans
The Company has varying benefit arrangements for its employees. These arrangements vary by the employee's employment location.
United States employees
The Company maintains a 401(k) plan for all US employees who have met the eligibility requirements to participate. Under the plan, employees may contribute up to 15% of compensation, subject to an annual maximum as determined under the Internal Revenue Code. The Company matches 50% of up to 6% of the employees' contributions. The plan provides that employees' contributions will be 100% vested at all times and that the Company's contributions vest over a five year period. Effective December 16, 2005, the Company began sponsoring a 401(k) profit-sharing plan for MIM US, which covers eligible employees at least 21 years of age who have completed at least three months of service. The plan allows for employee contributions through salary deductions up to 19% of total compensation, subject to the statutory limits. Employer matching contributions can be made at the discretion of the Company. The Company contributed $252, $17, $251 and $272 to these plans for the period February 1, 2005 to December 31, 2005, the period January 1, 2005 to January 31, 2005 and the years ended December 31, 2004 and 2003, respectively.
United Kingdom employees
The U.K. Benefit Plan works on a "money purchase" basis; therefore, benefits at retirement are dependent upon the level of contributions made, the investment return achieved, the charges deducted from the fund and the cost of buying a pension at retirement. Both the employee and employer contribute a percentage of the employees' salary each month, based on the level and length of service. Contributions to the U.K. Benefit Plan were $8 for the period February 1, 2005 to December 31, 2005.
Middle East employees
For the benefit of certain employees resident in the Middle East, the Company operates a defined contribution saving plan, the assets and liabilities of which are held independently from the Company. Contributions for the period February 1, 2005 to December 31, 2005 were $1. The agreed contribution rate for the year ended December 31, 2005 was 10%.
16. Related party transactions
Edgen and subsidiaries
In connection with the Buy-out Transaction and pursuant to a transaction fee agreement with Edgen's board of directors and certain members of management, including Edward J. DiPaolo, John B. Elstrott, Edgar Hotard, Daniel J. O'Leary, and David L. Laxton, Edgen paid a transaction fee in an amount
F-46
equal to 2% of the aggregate purchase price of approximately $124,000, or $2,480, which was allocated among Messrs. DiPaolo, Elstrott, Hotard, O'Leary and Laxton. At the same time, pursuant to value bonus compensation awards approved by Edgen's board of directors, certain members of management became eligible for value bonuses in an aggregate amount of $3,000, which bonuses were distributed to these executive officers and other members of management. Furthermore, Edgen's board of directors approved an additional senior management bonus equal to 20% of the net proceeds from the sale of Edgen in excess of $64,000. The amount of this bonus was approximately $1,500 in the aggregate, and was distributed among the senior management and to key Edgen employees.
Prior to the consummation of the Buy-out Transaction, Harvest Partners and its affiliates owned approximately 63% of our outstanding preferred stock and approximately 70% of the outstanding Class A Common Stock. In addition, Harvest Partners and its affiliates held $5,000 principal amount of our then existing subordinated notes. Pursuant to an amended and restated management agreement between Harvest Partners and Edgen, Edgen paid Harvest Partners a quarterly management fee and reimbursed Harvest Partners for reasonable expenses. Management fees paid for the period January 1, 2005 to January 31, 2005 and the years ended December 31, 2004 and 2003 were $124, $496 and $496, respectively. Upon the consummation of the Buy-out Transaction, Edgen paid Harvest Partners a transaction fee in an amount equal to 0.826 times 2% of the aggregate purchase price of $124,000, or $2,048, at which time the management agreement was terminated. Effective February 1, 2005, Harvest Partners no longer holds any of the Company's equity or debt securities.
Prior to the consummation of the Buy-out Transaction, Stonehenge Capital owned approximately 17% of our outstanding preferred stock and approximately 20% of the Class A Common Stock. Pursuant to an amended and restated management agreement between Stonehenge Capital and Edgen, Edgen paid Stonehenge Capital a quarterly management fee and reimbursed Stonehenge Capital for reasonable expenses. Management fees paid to Stonehenge for the period January 1, 2005 to January 31, 2005 and the years ended December 31, 2004 and 2003, were $26, $104 and $104, respectively. Upon the consummation of the Buy-out Transaction, Edgen paid Stonehenge Capital a transaction fee in an amount equal to 0.174 times 2% of the aggregate purchase price of approximately $124,000, or $432, at which time the management agreement was terminated. Effective February 1, 2005, Stonehenge Capital no longer holds any of the Company's equity or debt securities.
On October 25, 2000, Edgen issued four convertible term notes, in an aggregate principal amount of $15,000, to certain shareholders of Edgen. Three convertible term notes were issued to affiliates of Harvest Partners in the total initial principal amount of approximately $12,700. The fourth convertible term note was issued to Bank One Equity Investors Inc. in the initial principal amount of approximately $2,200. In connection with the consummation of the Buy-out Transaction, Edgen repaid the remaining principal and interest obligations of approximately $2,800 in the aggregate (as of December 31, 2004) and these convertible term notes were terminated.
PAL and subsidiaries
Subsequent to the MIM Acquisition on December 16, 2005, MIM UK and its subsidiary continue to have limited transactions with MIM's previous owner, MIH, which is also a minority shareholder of Edgen/Murray, L.P. As of December 31, 2005, amounts due from these related parties was $565 and amounts due to these related parties was $196. The following is a summary of those transactions.
Trade sales and purchases
MIM UK continues to trade with certain subsidiaries of MIH (the "Murray Group companies") in the normal course of business. Sales to the Murray Group companies were $43 for the period February 1, 2005 to December 31, 2005.
F-47
Administrative expenses
PAL continues to use certain resources and processes of the Murray Group companies, such as information systems and network engineering. Fees for these services are generally estimated and paid quarterly, with an annual make whole payment for any outstanding amounts. Fees were $22 for the period February 1, 2005 to December 31, 2005.
Other
The Company entered into various other transactions with the Murray Group companies during the period from February 1, 2005 to December 31, 2005. These transactions relate to items such as human resources, accounting function services and other administration expenses paid by the Company, offset by the rental income received by the Company for partially leasing the Newbridge facility and housing for certain members of local management who are located outside the United States and the United Kingdom. These transactions were not material for the period.
17. Selected quarterly financial data (unaudited)
The table below sets forth unaudited financial information for each of the quarters in the year ended December 31, 2005, including the periods February 1, 2005 to March 31, 2005 and January 1, 2005 to January 31, 2005, and for each of the quarters in the year ended December 31, 2004 (in thousands):
| |
| | Successor
| | Predecessor
| |
|---|
| | 2005
| |
| |
| | 2004
| |
|---|
| | Period
February 1,
2005 to
March 31,
2005
| | Period
January 1,
2005 to
January 31,
2005
| |
|---|
| | Fourth
quarter
| | Third quarter
| | Second quarter
| | Fourth quarter
| | Third quarter
| | Second quarter
| | First quarter
| |
|---|
| |
| Sales | | $ | 86,924 | | $ | 75,712 | | $ | 74,394 | | $ | 45,895 | | $ | 18,945 | | $ | 57,894 | | $ | 53,054 | | $ | 54,041 | | $ | 42,831 | |
| Operating expenses: | | | | | | | | | | | | | | | | | | | | | | | | | | | | |
| Cost of sales (exclusive of depreciation and amortization) | | | 70,843 | | | 61,766 | | | 57,828 | | | 35,799 | | | 14,153 | | | 43,333 | | | 38,188 | | | 40,294 | | | 33,543 | |
| Selling, general and administrative expenses | | | 8,379 | | | 7,546 | | | 8,075 | | | 4,960 | | | 14,364 | | | 10,363 | | | 8,258 | | | 7,367 | | | 6,021 | |
| Depreciation and amortization | | | 4,537 | | | 603 | | | 609 | | | 477 | | | 201 | | | 604 | | | 592 | | | 607 | | | 597 | |
| | |
| |
| Operating expenses | | | 83,759 | | | 69,915 | | | 66,512 | | | 41,236 | | | 28,718 | | | 54,299 | | | 47,038 | | | 48,268 | | | 40,161 | |
| Income (loss) from operations | | | 3,165 | | | 5,797 | | | 7,882 | | | 4,659 | | | (9,773 | ) | | 3,596 | | | 6,016 | | | 5,773 | | | 2,670 | |
| Other income (expense) | | | (452 | ) | | 70 | | | 68 | | | 7 | | | (50 | ) | | 143 | | | (72 | ) | | 15 | | | 20 | |
| Interest expense | | | (4,017 | ) | | (3,164 | ) | | (3,023 | ) | | (1,935 | ) | | (333 | ) | | (1,984 | ) | | (1,551 | ) | | (905 | ) | | (723 | ) |
| | |
| |
| Income (loss) from operations before income tax expense | | | (1,304 | ) | | 2,703 | | | 4,927 | | | 2,731 | | | (10,156 | ) | | 1,755 | | | 4,393 | | | 4,883 | | | 1,967 | |
| Income tax expense (benefit) | | | (756 | ) | | 1,063 | | | 1,738 | | | 1,010 | | | (1,916 | ) | | (6,583 | ) | | 632 | | | 1,951 | | | 789 | |
| | |
| |
| Net income (loss) | | $ | (548 | ) | $ | 1,640 | | $ | 3,189 | | $ | 1,721 | | $ | (8,240 | ) | $ | 8,338 | | $ | 3,761 | | $ | 2,932 | | $ | 1,178 | |
| |
18. Effects of Hurricanes Katrina and Rita
In August 2005 and September 2005, Hurricanes Katrina and Rita struck the gulf coast of Louisiana, Mississippi, Alabama and Texas and caused extensive and catastrophic physical damage to those market areas. As a result of Hurricanes Katrina and Rita, our Louisiana and Texas locations sustained minor physical damage and were closed for a minimal number of days to secure our employees. Additionally,
F-48
our sales order backlog and shipments experienced a temporary decline immediately following the hurricanes; however, management believes our sales orders have returned to a more normal level as of December 31, 2005. In the future, management cannot predict whether, for how long, or to what extent these hurricanes will affect our operations or the operations of our customers and vendors in those market areas affected by the hurricanes.
19. Supplemental cash flow disclosure
As described in note 1, PAL and its subsidiaries have a fiscal year ending January 31 which differs from the Company's fiscal year end of December 31. The Company's consolidated balance sheet as of December 31, 2005 includes the consolidated balance sheet of PAL and its subsidiaries at January 31, 2006. Due to the difference in fiscal year end, the net income included in the consolidated statement of operations and the consolidated statement of cash flows for the period February 1, 2005 to December 31, 2005 reflecting the operating results of PAL and its subsidiaries for the period January 17, 2006 to January 31, 2006.
The impact of the MIM Acquisition on the statement of cash flows is comprised of the following components:
| Operating activities: | | | | |
| | Net income | | $ | 1,016 | |
| | Depreciation, amortization and other | | | 1,407 | |
| | Change in working capital | | | 7,954 | |
| | |
| |
| Impact of MIM Acquisition on cash provided by operating activities | | | 10,377 | |
| Investing activities: | | | | |
| | Acquisition of MIM Ltd., net of cash acquired | | | (141,886 | ) |
| | Purchases of property, plant, and equipment | | | (139 | ) |
| | |
| |
| Impact of MIM Acquisition on cash used in investing activities | | | (142,025 | ) |
| Financing activities: | | | | |
| | Proceeds from issuance of PAL Floating Rate Notes | | | 126,814 | |
| | Increase in managed bank overdraft | | | 12,676 | |
| | Borrowings under revolving lines of credit | | | (635 | ) |
| | Debt financing costs | | | (11,259 | ) |
| | Proceeds from issuance of common and preferred units | | | 26,123 | |
| | |
| |
| Impact of MIM Acquisition on cash provided by financing activities | | | 153,719 | |
| Effect on foreign currency exchange rate on cash | | | 333 | |
F-49
(This page has been left blank intentionally.)
F-50
Edgen/Murray, L.P. and Subsidiaries
Condensed consolidated balance sheet
June 30, 2006
(In thousands)
(Unaudited)
|
| Assets | | | |
| Current assets: | | | |
| | Cash and cash equivalents | | $ | 24,259 |
| | Accounts receivable—net of allowance for doubtful accounts of $447 | | | 127,199 |
| | Accounts receivable—related parties | | | 396 |
| | Inventory | | | 137,670 |
| | Income tax receivable | | | 248 |
| | Prepaid expenses and other current assets | | | 3,875 |
| | Deferred tax asset | | | 1,734 |
| | |
|
| | | Total current assets | | | 295,381 |
| Property, plant and equipment—net | | | 41,072 |
| Goodwill | | | 71,337 |
| Other intangible assets | | | 91,976 |
| Other assets | | | 143 |
| Deferred financing costs | | | 18,227 |
| | |
|
| Total | | $ | 518,136 |
| | |
|
| Liabilities and partners' capital | | | |
| Current liabilities: | | | |
| | Managed cash overdrafts | | $ | 3,914 |
| | Accounts payable | | | 91,780 |
| | Accounts payable—related parties | | | 207 |
| | Accrued expenses and other current liabilities | | | 17,179 |
| | Accrued interest payable | | | 7,595 |
| | Deferred purchase price consideration | | | 1,758 |
| | Current portion of capital lease | | | 246 |
| | Current portion of long-term debt | | | 154 |
| | |
|
| | | Total current liabilities | | | 122,833 |
| Deferred tax liability | | | 24,969 |
| Capital lease | | | 21,467 |
| Long-term debt | | | 264,885 |
| | |
|
| | Total liabilities | | | 434,154 |
| Commitments and contingencies | | | |
Partners' capital: |
|
|
|
| | Partners' capital (note 7) | | | 83,982 |
| | |
|
| | Total | | $ | 518,136 |
|
See accompanying notes to unaudited condensed consolidated financial statements.
F-51
Edgen/Murray, L.P. and Subsidiaries
Condensed consolidated statements of operations
Six months ended June 30, 2006, period February 1, 2005 to
June 30, 2005 and period January 1, 2005 to January 31, 2005
(In thousands, except per unit/share data)
(Unaudited)
| |
| | Successor
| | Predecessor
| |
|---|
| | Six Months
Ended
June 30, 2006
| | Period
February 1, 2005 to
June 30, 2005
| | Period
January 1, 2005 to
January 31, 2005
| |
|---|
| |
| Sales | | $ | 340,020 | | $ | 120,288 | | $ | 18,945 | |
| Operating expenses: | | | | | | | | | | |
| Cost of sales (exclusive of depreciation and amortization shown separately below) | | | 274,653 | | | 93,627 | | | 14,153 | |
| Selling, general, and administrative expense | | | 26,322 | | | 13,035 | | | 14,364 | |
| Depreciation and amortization expense | | | 12,412 | | | 1,087 | | | 201 | |
| | |
| |
| Total operating expenses | | | 313,387 | | | 107,749 | | | 28,718 | |
| Operating income (loss) | | | 26,633 | | | 12,539 | | | (9,773 | ) |
| Other income (expense): | | | | | | | | | | |
| | Other income (expense) | | | 5,906 | | | 75 | | | (50 | ) |
| | Interest expense, net | | | (17,169 | ) | | (4,958 | ) | | (333 | ) |
| | |
| |
| Income (loss) from operations before Income tax expense (benefit) | | | 15,370 | | | 7,656 | | | (10,156 | ) |
| Income tax expense (benefit) | | | 5,304 | | | 2,748 | | | (1,916 | ) |
| | |
| |
| Net income (loss) | | | 10,066 | | | 4,908 | | | (8,240 | ) |
| Preferred interest and dividend Requirement | | | (2,134 | ) | | (765 | ) | | (190 | ) |
| | |
| |
| Net income (loss) applicable to common unitholder/shareholder | | $ | 7,932 | | $ | 4,143 | | $ | (8,430 | ) |
| | |
| |
| Net income (loss) applicable to common unit/shareholders: | | | | | | | | | | |
| | | Basic earnings per share | | $ | 1.38 | | $ | 1.54 | | $ | (1.99 | ) |
| | |
| |
| | | Diluted earnings per share | | $ | 1.38 | | $ | 1.54 | | $ | (1.99 | ) |
| | |
| |
| Weighted average common units/shares: | | | | | | | | | | |
| | Basic | | | 5,762,022 | | | 2,681,564 | | | 4,243,092 | |
| | |
| |
| | Dilutive | | | 5,762,022 | | | 2,681,564 | | | 4,243,092 | |
| | |
| |
| |
See accompanying notes to unaudited condensed consolidated financial statements.
F-52
Edgen/Murray, L.P. and Subsidiaries
Condensed consolidated statement of partners' capital
Six months ended June 30, 2006
(In thousands, except per unit data)
(Unaudited)
| |
| | Preferred units
| | Preferred amount
| | Common units
| | Common amount
| |
|---|
| |
| General partner: | | | | | | | | | | | |
| Balance at January 1, 2006 and June 30, 2006 | | 1.00 | | $ | 1 | | 117.12 | | $ | 1 | |
Limited partner: |
|
|
|
|
|
|
|
|
|
|
|
| Balance at January 1, 2006 | | 50,541.14 | | | 50,717 | | 5,437,461.29 | | | 23,510 | |
| | Net income | | — | | | — | | — | | | 10,066 | |
| | Issuance of restricted common units | | — | | | — | | 209,156.43 | | | 1,263 | |
| | Interest and dividends | | — | | | 2,134 | | — | | | (2,134 | ) |
| | |
| |
| Balance at June 30, 2006 | | 50,541.14 | | | 52,851 | | 5,646,617.72 | | | 32,705 | |
Unit subscription receivable: |
|
|
|
|
|
|
|
|
|
|
|
| Balance at January 1, 2006 | | — | | $ | (817 | ) | — | | $ | (492 | ) |
| Decrease in unit subscription receivable | | — | | | 817 | | — | | | 492 | |
| | |
| |
| Balance at June 30, 2006 | | — | | | — | | — | | | — | |
Unit-based compensation expense: |
|
|
|
|
|
|
|
|
|
|
|
| Balance at January 1, 2006 | | — | | $ | — | | — | | $ | (1,466 | ) |
| | Issuance of restricted common units | | — | | | — | | — | | | (1,263 | ) |
| | Amortization of restricted common units | | — | | | — | | — | | | 315 | |
| | |
| |
| Balance at June 30, 2006 | | — | | | — | | — | | | (2,414 | ) |
Accumulated other comprehensive income: |
|
|
|
|
|
|
|
|
|
|
|
| Balance at January 1, 2006 | | — | | $ | — | | — | | $ | 359 | |
| Foreign currency translation | | — | | | — | | — | | | 479 | |
| | |
| |
| Balance at June 30, 2006 | | — | | | — | | — | | | 838 | |
| | |
| |
| Total partners' capital | | 50,542.14 | | $ | 52,852 | | 5,646,734.84 | | $ | 31,130 | |
| |
See accompanying notes to unaudited condensed consolidated financial statements.
F-53
Edgen/Murray, L.P. and Subsidiaries
Condensed consolidated statements of cash flows
Six months ended June 30, 2006, period February 1, 2005 to
June 30, 2005 and period January 1, 2005 to January 31, 2005
(In thousands)
(Unaudited)
| |
| | Successor
| | Predecessor
| |
|---|
| | Six months
ended
June 30, 2006
| | Period
February 1, 2005 to
June 30, 2005
| | Period
January 1, 2005 to
January 31, 2005
| |
|---|
| |
| Cash flows from operating activities: | | | | | | | | | | |
| | Net cash (used in) provided by operating activities | | $ | (7,064 | ) | $ | (14,398 | ) | $ | 4,250 | |
| | |
| |
| Cash flows from investing activities: | | | | | | | | | | |
| Purchase of Edgen Corporation, net of cash acquired | | | — | | | (120,952 | ) | | — | |
| Purchase of Murray International Metals, Ltd.—deferred purchase consideration | | | (11,954 | ) | | — | | | — | |
| Purchase of Western Flow Products, Inc.—additional contingent purchase price | | | (451 | ) | | — | | | — | |
| Purchase of property, plant and equipment | | | (1,216 | ) | | (582 | ) | | (4 | ) |
| Proceeds from the sale of property, plant and equipment | | | 76 | | | — | | | 2 | |
| | |
| |
| | Net cash used in investing activities | | | (13,545 | ) | | (121,534 | ) | | (2 | ) |
| | |
| |
| Cash flows from financing activities: | | | | | | | | | | |
| Principal payments on long-term debt, notes payable and capital leases | | | (136 | ) | | (23 | ) | | (232 | ) |
| Proceeds from issuance of long-term debt | | | — | | | 105,000 | | | — | |
| Proceeds (payments) under revolving credit agreements | | | (418 | ) | | 13,992 | | | 116 | |
| Deferred financing costs | | | (799 | ) | | (7,288 | ) | | — | |
| Issuance of common stock | | | — | | | 2,400 | | | — | |
| Issuance of preferred stock | | | — | | | 21,600 | | | — | |
| Stock subscription receivable | | | 1,309 | | | — | | | — | |
| Increase (decrease) in managed cash overdraft | | | 2,752 | | | 561 | | | (1,361 | ) |
| | |
| |
| | Net cash provided by (used in) financing activities | | | 2,708 | | | 136,242 | | | (1,477 | ) |
| Effect of foreign currency exchange rate on cash | | | 1,014 | | | — | | | — | |
| Net (decrease) increase in cash and cash equivalents | | | (16,887 | ) | | 310 | | | 2,771 | |
| Cash and cash equivalents (beginning of period) | | | 41,146 | | | — | | | 134 | |
| | |
| |
| Cash and cash equivalents (end of period) | | $ | 24,259 | | $ | 310 | | $ | 2,905 | |
| | |
| |
| Cash paid for income taxes | | $ | 8,332 | | $ | 197 | | $ | — | |
| | |
| |
| Cash paid for interest | | $ | 14,737 | | $ | 183 | | $ | 1,315 | |
| | |
| |
| Non-cash financing activities: | | | | | | | | | | |
| Issuance of restricted common units/shares | | $ | 1,708 | | $ | — | | $ | — | |
| |
See accompanying notes to unaudited condensed consolidated financial statements.
F-54
Edgen/Murray, L.P. and Subsidiaries
Notes to condensed consolidated financial statements
Six months ended June 30, 2006,
period February 1 to June 30, 2005,
and period January 1, 2005 to January 31, 2005
(In thousands, except unit/share data)
(Unaudited)
1. Organization and summary of significant accounting policies
Organization
Description of formation—Edgen/Murray, L.P. is a Delaware limited partnership that was formed on November 22, 2005 ("Edgen/Murray, L.P."), by Jefferies Capital Partners ("JCP") and certain members of the management (collectively, the "Edgen Shareholders") of Edgen Corporation ("Edgen") for the purpose of acquiring Murray International Metals Limited and subsidiaries. In a common control transaction, the Edgen Shareholders exchanged their direct ownership of Edgen for ownership interests in Edgen/Murray, L.P., which resulted in Edgen becoming a wholly owned subsidiary of Edgen/Murray, L.P. Prior to the formation of Edgen/Murray, L.P., Edgen was held directly by the Edgen Shareholders.
On February 1, 2005, Edgen Acquisition Corp., a corporation newly formed by the Edgen Shareholders, purchased all of the outstanding capital stock of Edgen from its existing shareholders for an aggregate purchase price of approximately $124,000 (excluding acquisition costs). Edgen Acquisition Corp. was merged with and into Edgen Corporation, which survived the merger.
On December 16, 2005, Edgen/Murray, L.P. formed Pipe Acquisition Limited ("PAL"). On that same day, Edgen/Murray, L.P. through its subsidiaries acquired Murray International Metals Ltd. ("MIM UK") and its subsidiaries (collectively referred to as "MIM").
References to the "Company" or the "Successor" in respect of the periods prior to the formation of Edgen/Murray, L.P. are references to Edgen and its subsidiaries and for periods after formation are references to Edgen/Murray, L.P. and its subsidiaries. References to the "Company" or the "Predecessor" in respect of the periods prior to the formation of Edgen Acquisition Corp., and the acquisition of Edgen by Edgen Acquisition Corp., are references to Edgen prior to the change in control on February 1, 2005.
F-55
Edgen/Murray, L.P. and Subsidiaries
Notes to condensed consolidated financial statements
(In thousands, except unit/share data)
(Unaudited) (continued)
As a result of the transactions described above, the organizational structure of Edgen/Murray, L.P. at December 31, 2005 is presented below:
Description of operations—
The Company, through its subsidiaries, has operations in North America, United Kingdom, Singapore and the United Arab Emirates. The Company is headquartered in Baton Rouge, Louisiana.
The Company's operations in North America distribute and market specialized, high performance steel products for use primarily in niche applications in the energy infrastructure market. The products the Company sells are generally highly engineered prime carbon or alloy steel pipe, pipe components and high grade structural sections and plates, which are designed to withstand the effects of corrosive or abrasive materials and possess performance characteristics required in extreme operating conditions, including high pressure and high/low temperature environments. These products are utilized by customers globally, from exploration and production, new rig construction, gathering and transmission and refining and processing to maintenance, repair and operations (MRO).
The Company's operations in the United Kingdom, Singapore and the United Arab Emirates distribute and market specialty steel globally primarily to companies in the offshore oil and gas industry. The Company sells highly specialized steel sections used in the construction of offshore oil and gas platforms and well heads located in deep water and ultra deep water oil and gas fields; sales are primarily to customers in the Caspian Sea region, West Africa, the Middle Eastern Gulf region, Southeast Asia and Australia. In addition, the operations in the United Kingdom have recently
F-56
diversified into several alternative markets and products including civil fabrication, shipbuilding, renewable energy, yellow goods and mining.
Significant Accounting Policies
Basis of presentation—The condensed consolidated financial statements and notes are presented in accordance with accounting principles generally accepted in the United States of America ("generally accepted accounting principles" or "GAAP"). The condensed consolidated financial statements include the accounts of Edgen/Murray, L.P. and its wholly owned subsidiaries (see organizational chart above). There are no differences between the accounting policies of the Predecessor and Successor.
The Company's UK subsidiary, PAL, and its subsidiaries have a fiscal year ending January 31 which differs from the Company's fiscal year end of December 31. The Company's condensed consolidated balance sheet as of June 30, 2006 includes the consolidated balance sheet of PAL and its subsidiaries as of July 31, 2006. The Company's condensed consolidated statement of operations, statement of partners' capital, and statement of cash flows for the six months ended June 30, 2006 includes the results of PAL for the six months ended July 31, 2006. All intercompany transactions have been eliminated in consolidation.
Interim financial information—Certain information and footnote disclosures normally included in financial statements prepared in accordance with GAAP have been condensed or omitted pursuant to the rules and regulations promulgated by the Securities and Exchange Commission. However, management believes that the disclosures contained herein are adequate to make the information presented not misleading. The unaudited financial statements should be read in conjunction with the audited financial statements and accompanying notes as of December 31, 2005 and for the period February 1, 2005 to December 31, 2005 and the period January 1, 2005 to January 31, 2005.
Use of estimates—The preparation of the Company's condensed consolidated financial statements in conformity with GAAP requires management to make estimates and assumptions that affect the reported amounts of assets and liabilities, the disclosure of contingent assets and liabilities at the date of the financial statements and the reported amounts of revenues and expenses during the reporting period. Actual results could differ from those estimates. Estimates and assumptions are primarily made in relation to the valuation of accounts receivable and inventory, the recoverability of goodwill and other intangible assets, and deferred tax assets in establishing a valuation allowance, if any.
New accounting standards—From time to time, new accounting pronouncements are issued by the Financial Accounting Standards Board ("FASB") which are adopted by the Company as of the specified effective date. Unless otherwise discussed, management believes the impact of recently issued standards which are not yet effective will not have a material impact on the Company's consolidated financial statements upon adoption.
In December 2004, the FASB issued Statement of Financial Accounting Standards ("SFAS") No. 123(R),Share-Based Payment ("SFAS 123(R)"), which is a revision of SFAS No. 123.Accounting for Stock-Based Compensation and supersedes Accounting Principles Board ("APB") Opinion 25,Accounting for Stock Issued to Employees. Generally, the valuation methods contained in SFAS 123(R) are similar to those in SFAS 123, but SFAS 123(R) requires all share-based payments to employees, including grants of employee share options, be charged to the statement of operations. Pro forma
F-57
disclosure is no longer an alternative. With limited exceptions, the amount charged to the statement of operations for share options will be measured based on the grant date fair value of the option amortized over the period to the date of vesting of the award. SFAS 123(R) is effective as of the beginning of the first interim or annual reporting period that begins after June 15, 2005. There was no impact on the Company's consolidated financial statements as a result of the adoption of SFAS 123(R) on January 1, 2006.
In June 2006, the FASB issued FASB Interpretation No. 48,Accounting for Uncertainty in Income Taxes—an interpretation of FASB Statement No. 109 ("FIN 48"), which clarifies the accounting for uncertainty in income taxes recognized in an enterprise's financial statements in accordance with SFAS No. 109,Accounting for Income Taxes. FIN 48 is effective for fiscal years beginning after December 15, 2006. FIN 48 will be adopted during the first quarter of 2007, and it is not expected to have a material impact on the Company's consolidated financial statements.
In February 2006, the FASB issued SFAS No. 155,Accounting for Certain Hybrid Financial Instruments—an amendment of FASB Statements No. 133 and 140 ("SFAS 155"). SFAS 155 amends SFAS No. 133,Accounting for Derivative Instruments and Hedging Activities and SFAS No. 140,Accounting for Transfers and Servicing of Financial Assets and Extinguishments of Liabilities. SFAS 155 resolves issues addressed in SFAS No. 133 Implementation Issue No. D1,Application of Statement 133 to Beneficial Interests in Securitized Financial Assets. SFAS 155 is effective for fiscal years beginning after September 15, 2006. The adoption of SFAS 155 is not expected to have any impact on the Company's consolidated financial statements.
In September 2006, the FASB issued SFAS No. 157,Fair Value Measurements ("SFAS 157"), which establishes a single authoritative definition of fair value, sets out a frame-work for measuring fair value, and requires additional disclosures about fair-value measurements. SFAS 157 applies to fair value measurements that are already required or permitted by existing standards except for measurements of share-based payments and measurements that are similar to, but not intended to be, fair value. SFAS 157 does not impose any additional fair value measurements in financial statements and is effective for fiscal years beginning after November 15, 2007 and interim periods within those fiscal years. The adoption of SFAS 157 is not expected to have a material impact on the Company's consolidated financial statements.
In September 2006, the SEC issued Staff Accounting Bulletin No. 108,Considering the Effects of Prior Year Misstatements when Quantifying Misstatements in Current Year Financial Statements ("SAB 108"). SAB 108 establishes a single quantification framework wherein the significance measurement is based on the effects of the misstatements on each of the financial statements as well as the related financial statement disclosures. SAB 108 is effective for the first annual period ending after November 15, 2006. The Company does not expect that the adoption of SAB 108 will have a material effect on its results of operations or financial position.
2. Acquisitions
Western Flow Products, Inc.
On July 15, 2005, Edgen Canada, Inc., acquired the common stock of Western Flow Products, Inc. ("Western Flow") for a purchase price of approximately $1,971 (2,400 Canadian dollars ("CAD"))
F-58
consisting of a cash payment of approximately $1,725 (2,100 CAD) and the issuance of a note payable to the sellers for approximately $246 (300 CAD). Under the purchase agreement, an additional $451 (527 CAD) of purchase price was contingent upon the achievement of a specified earnings threshold subsequent to the acquisition and as of January 31, 2006, the earnings threshold was met and paid. Western Flow is located in Edmonton, Alberta and is a specialty alloy pipe and components distributor primarily to the oil and gas, processing and power generation industries. The operations of this acquisition have been merged into the Company's subsidiary, Edgen Canada, and are included in our operating results from the date of the acquisition.
The final purchase price allocation is summarized below:
| |
| Accounts receivable | | $ | 1,215 | |
| Inventory | | | 878 | |
| Other current assets | | | 6 | |
| Property, plant and equipment | | | 32 | |
| Goodwill | | | 1,138 | |
| Accounts payable | | | (681 | ) |
| Accrued expenses and other current liabilities | | | (97 | ) |
| | |
| |
| Purchase price, including acquisition costs of approximately $69 | | $ | 2,491 | |
| |
Murray International Metals Limited and Subsidiaries (including Murray International Metals, Inc.)
On December 16, 2005, the Company acquired Murray International Metals Limited and its wholly owned subsidiaries. The acquisition was structured in two legally separate transactions.
PAL acquired MIM UK and its subsidiary Murray International Metals Pte Limited ("MIM Singapore") from Murray International Holdings Limited ("MIH") (the "MIM UK Acquisition"). PAL purchased 100% of the outstanding share capital of MIM UK for an aggregate purchase price of approximately $170,263. The purchase price consisted of cash of $145,613, net of cash acquired of $456 (including $4,000 paid for acquisition costs), $13,129 of deferred consideration included in creditors falling due within one year at January 31, 2006, and the rollover of MIH and management shares valued at $11,180. The MIM UK Acquisition was funded primarily through an equity contribution to PAL of $26,462 by Edgen/Murray, L.P. and with proceeds from the issuance of $130,000 aggregate principal amount of Senior Secured Floating Rate Notes due 2010 (the "PAL Floating Rate Notes") issued by Pipe Acquisition Finance Plc, ("PAF"), a finance subsidiary of PAL. In connection with the MIM UK Acquisition, MIM UK entered into a sale and leaseback transaction (see note 6).
Murray International Metals, Inc. ("MIM US"), a wholly owned subsidiary of MIM UK, was acquired by the Company, through its indirect wholly owned subsidiary Edgen Carbon (the "MIM US Acquisition"), for an aggregate purchase price, including assumption of debt, of approximately $20,600 and acquisition costs of $1,296, net of cash acquired of $10,848. The assumption of debt included a UK£2,900 (approximately $5,000) note payable to MIM UK which was funded and paid by Edgen upon closing. The MIM US Acquisition was funded with proceeds from the issuance of $31,000 aggregate principal amount of Edgen Senior Secured Notes. The MIM UK Acquisition and the MIM US Acquisition are collectively referred to as the "MIM Acquisition."
F-59
MIM UK is a supplier of high yield and special grade structural steel to oil and gas projects being engineered and managed by leading operators, engineering houses and offshore fabricators in the oil and gas industry throughout the world but primarily in the Europe/North Africa, the Middle East and Asia/Pacific while MIM US primarily services North and South America.
The fair value of assets acquired and liabilities assumed have been recorded based on preliminary estimates. The purchase price in excess of the fair value of the assets and liabilities acquired has been recorded as goodwill. The goodwill and other intangible assets are not deductible for tax purposes. As of June 30, 2006, the purchase price allocation includes the following:
| |
| Accounts receivable | | $ | 78,414 | |
| Inventory | | | 61,197 | |
| Other current assets | | | 874 | |
| Property, plant and equipment | | | 8,882 | |
| Goodwill | | | 46,191 | |
| Customer relationships and tradenames | | | 77,373 | |
| Other assets | | | 7,435 | |
| Deferred tax asset | | | 644 | |
| Accounts payable | | | (47,493 | ) |
| Accrued expenses and other current liabilities | | | (20,053 | ) |
| Current portion of long-term debt | | | (2,707 | ) |
| Deferred tax liability | | | (24,299 | ) |
| Note payable due to Murray International Holdings Limited | | | (5,147 | ) |
| | |
| |
| Purchase price (net of cash received of $11,304) | | $ | 181,311 | |
| |
The following table reflects the pro forma revenue and net income (loss) for the six months ended June 30, 2005 as if the MIM Acquisition and the acquisition of Western Flow had taken place on January 1, 2005 including the impact of purchase accounting and the associated financing and the sale and leaseback transaction described in note 6:
| |
| | Successor
For the period
February 1, 2005
to June 30,
2005
| | Predecessor
For the period
January 1, 2005
to January 31,
2005
| |
|---|
| | (unaudited)
| |
|---|
| |
| Revenue | | $ | 225,259 | | $ | 42,409 | |
| Net income (loss) | | | 8,584 | | | (9,269 | ) |
| |
The unaudited pro forma consolidated financial information does not purport to represent what the Company's financial position or results of operations would actually have been if these transactions had occurred at such dates or to project the Company's future results of operations.
F-60
3. Goodwill and other intangible assets
The following table reflects changes to goodwill during the six months ended June 30, 2006:
|
| Balance at December 31, 2005 | | $ | 69,524 |
| Purchase price adjustments: | | | |
| Foreign currency translation adjustment | | | 1,813 |
| | |
|
| Balance at June 30, 2006 | | $ | 71,337 |
|
During the six months ended June 30, 2006, the Company completed its valuation of identifiable other intangible assets acquired in the MIM Acquisition. Under the Western Flow purchase agreement, an additional $451 (527 CAD) of purchase price was contingent upon the achievement of a specified earnings threshold subsequent to the acquisition and such earnings threshold was met and paid during the six months ended June 30, 2006. For goodwill by reportable segment, see note 9.
Intangible assets as of June 30, 2006 consisted of the following:
|
| Customer relationships | | $ | 77,879 |
| Tradenames | | | 12,888 |
| Backlog | | | 1,195 |
| Trademarks | | | 14 |
| | |
|
| | | $ | 91,976 |
|
In connection with the Buy-out Transaction on February 1, 2005 and the MIM Acquisition on December 16, 2005, customer relationships, backlog and tradename intangible assets were identified and recorded in the purchase price allocation (see note 2).
Customer relationships, backlog and non-compete agreements are subject to amortization while tradenames have indefinite lives and are not subject to amortization. Amortization expense was $5,704 for the six months ended June 30, 2006. Amortization expense was $29 and $10 for the period February 1, 2005 to June, 30, 2005 and the period January 1, 2005 to January 31, 2005, respectively. Accumulated amortization of intangible assets at June 30, 2006 was $9,806. Scheduled annual amortization expense for the next five years is approximately $12,221.
F-61
4. Credit arrangements and long-term debt
Credit arrangements and long-term debt consisted of the following at June 30, 2006:
| |
| PAL Floating Rate Notes due 2010, net of discount of $1,174 at June 30, 2006 | | $ | 128,185 | |
| Edgen Senior Secured Notes due 2011, net of discount of $1,282 at June 30, 2006; secured by a lien on the assets of Edgen and its domestic subsidiaries | | | 134,718 | |
| Revolving credit facility, interest due monthly at a base rate of the lender's stated prime (8.25% at June 30, 2006) or LIBOR plus 200 basis points (7.33% at June 30, 2006) at the option of Edgen, through maturity in February 2010; secured by a lien on the assets of Edgen Alloy and Edgen Carbon | | | 1,789 | |
| Bank of Scotland and foreign revolving credit facilities, interest at variable rates which range from 4.0% to 9.75% through maturity in 2010; secured by a lien on the assets of PAL and its subsidiaries | | | — | |
| Note payable to sellers of Western Flow (300,000 CAD), interest accrues at 6%, due with semi-annual payments scheduled in July 2006 and 2007 | | | 268 | |
| Various capital leases to a corporation; monthly payments range from $356 to $1,388; at an interest rate of 7.5% per annum, commencing July 2005 through maturity in June 2010; secured by equipment | | | 79 | |
| | |
| |
| Total | | | 265,039 | |
| | Less current portion | | | (154 | ) |
| | |
| |
| Long-term debt | | $ | 264,885 | |
| |
F-62
PAL Floating Rate Notes
On December 16, 2005, PAF issued the PAL Floating Rate Notes with an original discount of $1,296. The net proceeds were used to fund a portion of the MIM UK Acquisition (see note 2). Interest accrues on the PAL Floating Rate Notes at a rate equal to six-month LIBOR plus an applicable margin of 6.25% per annum (11.69% at June 30, 2006) and is payable semiannually in cash on each June 15 and December 15, commencing on June 15, 2006.
At any time on or after December 15, 2006, PAF may redeem the PAL Floating Rate Notes, at its option, at the following redemption prices, plus accrued and unpaid interest to the date of redemption:
|
Year
| | Percentage
|
|---|
|
| 2006 | | 103% |
| 2007 | | 102% |
| 2008 | | 101% |
| 2009 and thereafter | | 100% |
|
In addition, at any time on or prior to December 15, 2006, PAF may redeem up to 35% of the aggregate principal amount of the PAL Floating Rate Notes with the net cash proceeds of one or more equity offerings (as defined by the terms of the PAL Floating Rate Notes). The redemption price is equal to 100% of the aggregate principal amount thereof, together with accrued and unpaid interest thereon. The terms of the PAL Floating Rate Notes also contain certain change in control and sale of asset provisions where the holders of the PAL Floating Rate Notes have the right to require PAF to repurchase all or any part of the PAL Floating Rate Notes at an offer price in cash equal to 101% and 100%, respectively, of the principal amount, plus accrued and unpaid interest to the date of repurchase.
The terms of the PAL Floating Rate Notes contain various covenants that limit, among other things, PAL's ability to incur additional indebtedness, pay dividends, or dispose of all or substantially all of its assets. PAL has a restricted payment pool available, as defined, under which it is allowed to make certain restricted payments.
The PAL Floating Rate Notes are unconditionally guaranteed, jointly and severally, on a senior secured basis by PAL and all of its subsidiaries. The PAL Floating Rate Notes are secured by security interests in all of the assets of PAL and its subsidiaries (other than certain excluded assets), subject to permitted liens. Neither Edgen/Murray, L.P. nor Edgen and its subsidiaries guarantees the PAL Floating Rate Notes.
On July 24, 2006, the Company began accruing additional interest of 0.25% on the PAL Floating Rate Notes in accordance with the indenture agreement as a result of not having a registration statement declared effective by the Securities and Exchange Commission within 220 days of the issue date not material to the condensed consolidated statement of operations.
Edgen Senior Secured Notes
On February 1, 2005, Edgen issued $105,000 aggregate principal amount of the Edgen Senior Secured Notes. The proceeds from the issuance of the Edgen Senior Secured Notes were used to retire substantially all of Edgen's long-term debt under its existing revolving credit facility and certain other notes and loans on February 1, 2005. On December 16, 2005, Edgen issued an additional $31,000 aggregate principal amount of Edgen Senior Secured Notes with the proceeds used to fund the MIM US Acquisition (see note 2).
F-63
Interest accrues on the Edgen Senior Secured Notes at the stated rate semi-annually and is payable in arrears on each February 1 and August 1, commencing on August 1, 2005.
Edgen may redeem some or all of the Edgen Senior Secured Notes at any time prior to February 1, 2008 at a make-whole redemption price set forth in the terms of the Edgen Senior Secured Notes. On or after February 1, 2008, Edgen may at its option, redeem some or all of the Edgen Senior Secured Notes at the following redemption prices, plus accrued and unpaid interest to the date of redemption:
|
| On or after: | | Percentage |
|
| February 1, 2008 | | 104.938% |
| February 1, 2009 | | 102.469% |
| February 1, 2010 | | 100.000% |
|
In addition, at any time prior to February 1, 2007, Edgen may redeem up to 35% of the aggregate principal amounts of the Edgen Senior Secured Notes issued under the indenture at a price equal to 109.875% of their principal amount, plus accrued and unpaid interest, to the date of redemption with the net cash proceeds of certain equity offerings. The terms of the Edgen Senior Secured Notes also contain certain change in control and sale of asset provisions where the holders of the Edgen Senior Secured Notes have the right to require Edgen to repurchase all or any part of the Edgen Senior Secured Notes at an offer price in cash equal to 101% and 100%, respectively, of their principal amount, plus accrued and unpaid interest, to the date of the repurchase.
The indenture governing the Edgen Senior Secured Notes contains various covenants that limit the Company's discretion in the operation of Edgen's business. The indenture, among other things: (i) limits the ability and the ability of Edgen's subsidiaries to incur additional indebtedness, issue shares of preferred stock, incur liens and enter into certain transactions with affiliates; (ii) places restrictions on the ability to pay dividends or make certain other restricted payments; and (iii) places restrictions on the ability of the Edgen's subsidiaries to merge or consolidate with any other person or sell, assign, transfer, convey or otherwise dispose of all or substantially all of the assets. The indenture provides for a restricted payment pool out of which Edgen is permitted to make certain restricted payments, including cash dividends, provided that no event of default has occurred and Edgen would be able to incur additional indebtedness under the applicable restrictive covenant. The restricted payment pool is generally an amount calculated based on 50% of Edgen's consolidated net income, as defined in the indenture, and earned during the period beginning on February 1, 2005 and ending on the last day of the most recent fiscal quarter prior to the restricted payment, as adjusted and subject to certain exceptions as provided in the indenture.
All of Edgen's domestic subsidiaries, including MIM US, fully and unconditionally guarantee the Edgen Senior Secured Notes on a joint and several basis. Neither Edgen/Murray, L.P. nor MIM UK guarantees the Edgen Senior Secured Notes. The Edgen Senior Secured Notes and the related guarantees are secured by a lien on substantially all of the Edgen's assets and the assets of its existing and future domestic restricted subsidiaries (other than certain excluded assets such as Edgen's and its existing and future subsidiaries' leasehold interests and the capital stock of its existing and future subsidiaries), subject to certain permitted liens and other limitations. Under an intercreditor agreement, the security interest in those assets consisting of inventory, accounts receivable, lockboxes, deposit accounts, securities accounts and financial assets credited thereto, and certain related assets that secure the Edgen Senior Secured Notes and the related guarantees, are subordinated to a lien thereon that
F-64
secures Edgen's revolving credit facility. As a result of such lien subordination, the Edgen Senior Secured Notes are effectively subordinated to Edgen's revolving credit facility to the extent of the value of such assets.
There are no significant restrictions on Edgen's ability and the ability of the subsidiary guarantors to obtain funds from Edgen and the subsidiary guarantors' respective subsidiaries by dividend or loan.
Revolving credit facility—Edgen and its subsidiaries
In connection with the Buy-out Transaction, Edgen entered into a new $20,000 senior secured revolving credit facility (the "Credit Agreement") with GMAC Commercial Finance LLC ("GMAC CF"), replacing its approximate $55,500 revolving credit agreement with GMAC CF. The Credit Agreement is subject to certain borrowing limitations and matures on February 1, 2010. Under the Credit Agreement, interest accrues on borrowings (at the option of Edgen) at either (i) the prime rate of interest announced by GMAC CF (8.25% at June 30, 2006), or (ii) a Eurodollar rate based on LIBOR plus 2.00% per annum (7.33% at June 30, 2006). The Company must also pay a monthly facility fee of 0.50% per annum on the unused portion of the maximum revolving amount. There were $1,789 borrowings under the Credit Agreement as of June 30, 2006.
The Credit Agreement is guaranteed by all of Edgen's domestic subsidiaries and is secured by a first priority security interest in all of Edgen's and its domestic subsidiaries' working capital assets and a second priority security interest in all of Edgen's and its domestic subsidiaries' other assets (other than certain excluded assets such as Edgen's leasehold interests and the capital stock of its subsidiaries). Pursuant to the terms of the intercreditor agreement described above, the security interest on the collateral consisting of working capital assets that secures the Edgen Senior Secured Notes and related guarantees is contractually subordinated to the liens thereon securing the Credit Agreement, and the security interest, if any, on substantially all of Edgen's and its domestic subsidiaries' other assets (other than certain excluded assets such as Edgen's leasehold interests and the capital stock of its subsidiaries) that secure the Credit Agreement are contractually subordinated to the liens thereon securing the Edgen Senior Secured Notes and related guarantees.
In addition, the Credit Agreement contains various affirmative and negative covenants, including limitations on additional indebtedness, the making of distributions, loans and advances, transactions with affiliates, dispositions or mergers, and the sale of assets.
Revolving credit facilities—PAL and its subsidiaries
In connection with the MIM UK Acquisition, MIM UK entered into a multicurrency revolving credit facility, a letter of credit facility, and a forward foreign exchange contracts facility with the Bank of Scotland (the "PAL Working Capital Facility") with total available commitments of £27,000 ($50,317 at June 30, 2006). Of the total commitments, the maximum amount of net borrowings available on the revolving credit facility are UK£12,000 ($22,363 at June 30, 2006). The PAL Working Capital Facility expires on maturity of the PAL Floating Rate Notes. The amounts outstanding under the PAL Working Capital Facility incur interest at the Bank of England inter-bank rate plus a margin of 1.75% (6.25% at June 30, 2006).
PAL also has available to it certain credit facilities with local lenders in Dubai and Singapore (the "PAL Foreign Facilities"). The PAL Foreign Facilities provide access to, among other things, short term loans, performance bonds, financial guarantees and trust receipts. The weighted average interest rate on borrowings outstanding at June 30, 2006 is 6.92%.
F-65
The PAL Working Capital Facility guarantees any borrowings and commitments under the PAL Foreign Facilities, subject to certain sub-limits stated in each foreign facility. Any borrowings or commitments under the PAL Foreign Facilities reduces the availability under the PAL Working Capital Facility.
Facilities availability and utilization related to these banking facilities at June 30, 2006 is as follows:
Facilities availability
|
| Total availability | | $ | 50,317 |
| Utilized under PAL Working Capital Facility | | | 1,402 |
| Utilized under PAL Foreign Facilities | | | 19,598 |
| | |
|
| Facilities available | | $ | 29,317 |
|
Facilities utilized
|
| | Included in liabilities
at June 30, 2006
| | Contingent liabilities and commitments
|
|---|
| | Within
accounts
payable
| | Within
debt and
managed cash
overdrafts
| | Performance
bonds/financial
guarantees
| | Letters
of credit
| | Foreign
currency
commitments
| | Total
utilization
at June 30, 2006
|
|---|
|
| PAL Foreign Facilities | | $ | 2,258 | | $ | 577 | | $ | 2,786 | | $ | 13,043 | | $ | 934 | | $ | 19,598 |
| PAL Working Capital Facility | | | — | | | — | | | 1,197 | | | 194 | | | 12 | | | 1,402 |
| | |
|
| Total | | $ | 2,258 | | $ | 577 | | $ | 3,983 | | $ | 13,237 | | $ | 946 | | $ | 21,000 |
|
Third party guarantees
PAL provides performance guarantees on behalf of its subsidiaries directly with third parties in the normal course of business.
PAL has entered into performance guarantees on behalf of a foreign subsidiary which guarantee payment to a customer if a foreign subsidiary fails to perform completely under various contracts. For guarantees that expire within one year, the maximum potential amount of future payments (undiscounted) for non-performance totaled $5,701 at June 30, 2006. For guarantees that do not have an expiration date, there was no maximum amount regarding future payment. There were no guarantees expiring within one year as of June 30, 2006.
Prior to the MIM UK Acquisition, MIM UK issued several performance guarantees on behalf of other members of MIH. On December 16, 2005, in connection with the MIM UK Acquisition, PAL assumed the outstanding performance guarantees of $6,043 which were in the process of being transferred to the MIH in accordance with the MIM UK Acquisition purchase agreement as of the acquisition date. The maximum potential amount of future payments (undiscounted) PAL could be required to make under these guarantees was $1,864 at June 30, 2006 before any recovery through recourse provisions contained in the purchase agreement between the PAL and MIH. These guarantees do not have a stated expiration date and are not recorded on the balance sheet at June 30, 2006.
F-66
5. Capital lease
In connection with the MIM UK Acquisition on December 16, 2005, MIM UK sold land, an office building and two warehouses at its Newbridge location for $23,040 less fees of approximately $308. Concurrent with the sale, MIM UK entered into an agreement to lease back all of the sold property for an initial lease term of 25 years. Under the lease agreement, the initial term will be extended for two further terms of ten years each unless cancelled by MIM UK. The lease is being accounted for as a capital lease because the net present value of the future minimum lease payments exceeds 90% of the fair value of the leased asset. The lease requires MIM UK to pay customary operating and repair expenses. Under purchase accounting, the Company determined that the lease terms were representative of fair value and did not record the liability (deferred gain) in its purchase price allocation related to a $2,604 gain on the sale.
The carrying value of the leased fixed assets at June 30, 2006, net of accumulated depreciation of $547, is $21,323 and is included in buildings within property, plant and equipment on the balance sheet. At June 30, 2006, the Company had recorded current and non-current obligations under the finance lease of $246 and $21,467, respectively. Amortization expense for the six months ended June 30, 2006 was $424.
6. Redeemable preferred stock
On February 1, 2005, Edgen issued Series A 81/2% Cumulative Compounding Preferred Stock, $0.01 par value ("Series A Preferred Stock"), in connection with the Buy-out Transaction. The holders of Series A Preferred Stock are entitled to receive annual dividends when, as and if, declared. The dividends are cumulative, whether or not earned or declared, and accrue at a rate of 8.5%, compounding annually, and are payable in cash or shares of Series A Preferred Stock, at the discretion of Edgen's board of directors. Upon the occurrence of certain events, including a public offering, the sale of substantially all the assets of the Company, a change in control or the approval of Edgen's board of directors, the Series A Preferred Stock can be redeemed by the Company at a price of $1 per share, plus accrued and unpaid dividends. For the six months ended June 30, 2006 and the period February 1, 2005 to June 30, 2005, the Company accrued dividends of $923 and $765, respectively on the shares of outstanding Series A Preferred Stock.
For the period January 1, 2005 to January 31, 2005, the Predecessor Company had $190 in accrued dividends related to its mandatorily redeemable preferred stock which was cancelled on February 1, 2005 in connection with the Buy-out Transaction.
The Edgen Senior Secured Notes indenture restricts the payment of dividends to preferred shareholders as well as the redemption of the Series A Preferred Stock, subject to an incurrence test based on a consolidated net income threshold, and subject to available amounts as defined by the indenture.
7. Non-vested common units/shares
On February 1, 2005, 281,565 shares of non-vested common stock were granted to certain employees of the Edgen, including the Chief Executive Officer, the Chief Financial Officer and the two Operating
F-67
Segment Presidents under a new incentive compensation plan. Effective December 15, 2005, Edgen's equity incentive plan was cancelled and Edgen/Murray, L.P. exchanged all outstanding awards for awards issued under its equity incentive plan with substantially equivalent terms. The Edgen/Murray, L.P. incentive plan authorizes the granting of awards to Edgen/Murray, L.P. employees of up to 550,000 common units of Edgen/Murray, L.P. that are subject to restrictions on transfer until such time as they are vested. Vesting is based on either time or a combination of performance and time.
During 2006 and 2005, Edgen/Murray, L.P. granted approximately 56,155 and 10,000 shares of non-vested common units/shares, respectively, with vesting terms ranging from one to five years, of which all were outstanding at June 30, 2006. During the six months ended June 30, 2006, there were no forfeitures. The estimated weighted average grant date fair value of the non-vested common units as of June 30, 2006 was $6.04. The fair value price of the awards is a calculated value based on the grant date of each of the respective grants using a combination of a share-based pricing model and financial metrics from recent transactions of companies with similar characteristics of Edgen/Murray, L.P. For the six months ended June 30, 2006 and the period February 1, 2005 to June 30, 2005, stock-based compensation related to these restricted units/shares was $318 and $222, respectively. As of June 30, 2006, there was $2,414 of total unrecognized compensation cost related to non-vested common units to be recognized through August 2010.
8. Segment and geographic area information
The Company has five reportable segments, which are primarily determined based upon the geographic locations of the Company's operations, and within its Americas operations by product lines. These reportable segments are the Americas—Alloy products, the Americas—Carbon products, UK, Singapore and UAE. The UK, Singapore and UAE segments were added as a result of the MIM Acquisition.
The Americas—Alloy products segment distributes specialty steel pipe and components for use in environments that are highly corrosive, extremely high or low temperature and/or involve high pressures. These products are sold primarily to the process/petrochemical and power generation industries. The Americas—Carbon products segment distributes specialty carbon steel pipe, pipe components and high grade structural sections and plates primarily for use in high pressure and/or abrasive environments. The primary industries served are the oil and gas production and transmission, the process and the power generation industries. The Americas—Alloy products and the Americas—Carbon products are headquartered in Baton Rouge, Louisiana and market products to customers in the United States, Canada and Latin America.
Similar to the Americas—Carbon products segment, the UK, Singapore and UAE segments are distributors of high grade steel tubes, plates and sections to primarily the offshore oil and gas industry. The UK segment, headquartered in Newbridge, Scotland, markets products to customers in Europe, the Caspian Sea region and West Africa. The Singapore segment, headquartered in Singapore and supported by a sales office in Perth, Australia, markets products to customers in the Asia/Pacific region. The UAE segment, headquartered in Dubai, United Arab Emirates, markets products to customers located in the Middle East region and South Asia.
A local management team manages each reportable segment independently, with oversight from the Company's executive management in Baton Rouge, Louisiana and Newbridge, Scotland. In addition,
F-68
certain expenses of Edgen/Murray, L.P., other non-operational expenses and certain assets and liabilities, such as intangible assets, are not allocated to the segments but are included in general corporate.
The accounting policies of the segments are the same as those described in the summary of significant accounting policies. The Company evaluates performance based on profit or losses from operations before income taxes not including nonrecurring gains or losses and discontinued operations. The Company accounts for sales between segments at a margin agreed to between segment management. The sales of the America's segments do not include intersegment sales between Americas—Alloy Products and Americas—Carbon Products as they are eliminated within the segment results, whereas sales between the other segments are managed on gross basis including intersegment sales.
The following table presents the financial information for each reportable segment:
| |
| | Successor
| | Predecessor
| |
|---|
| | Six months
ended
June 30,
2006
| | Period
February 1,
2005 to
June 30,
2005
| | Period
January 1,
2005 to
January 31,
2005
| |
|---|
| |
| Sales: | | | | | | | | | | |
| | Americas—Alloy products | | $ | 49,200 | | $ | 32,960 | | $ | 4,214 | |
| | Americas—Carbon products | | | 138,762 | | | 87,328 | | | 14,731 | |
| | UK | | | 82,808 | | | — | | | — | |
| | Singapore | | | 39,763 | | | — | | | — | |
| | UAE | | | 32,517 | | | — | | | — | |
| | Eliminations | | | (3,030 | ) | | — | | | — | |
| | |
| |
| | | $ | 340,020 | | $ | 120,288 | | $ | 18,945 | |
| | |
| |
| Intersegment sales: | | | | | | | | | | |
| | Americas—Alloy products | | $ | 666 | | $ | 8 | | $ | 16 | |
| | Americas—Carbon products | | | 2,520 | | | 367 | | | 32 | |
| | UK | | | 1,099 | | | — | | | — | |
| | Singapore | | | 725 | | | — | | | — | |
| | UAE | | | 389 | | | — | | | — | |
| | |
| |
| | | $ | 5,399 | | $ | 375 | | $ | 48 | |
| | |
| |
| Operating income (loss): | | | | | | | | | | |
| | Americas—Alloy products | | $ | 7,628 | | $ | 5,709 | | $ | 960 | |
| | Americas—Carbon products | | | 12,752 | | | 10,496 | | | 1,981 | |
| | UK | | | 9,502 | | | — | | | — | |
| | Singapore | | | 6,970 | | | — | | | — | |
| | UAE | | | 3,949 | | | — | | | — | |
| | General corporate | | | (14,168 | ) | | (3,666 | ) | | (12,714 | ) |
| | |
| |
| | | $ | 26,633 | | $ | 12,539 | | $ | (9,773 | ) |
| | |
| |
| | | | | | | | | | | |
F-69
| Capital expenditures: | | | | | | | | | | |
| | Americas—Alloy products | | $ | 381 | | $ | 105 | | $ | — | |
| | Americas—Carbon products | | | 49 | | | 158 | | | 4 | |
| | UK | | | 73 | | | — | | | — | |
| | Singapore | | | 195 | | | — | | | — | |
| | UAE | | | 78 | | | — | | | — | |
| | General corporate | | | 645 | | | 319 | | | — | |
| | |
| |
| | | $ | 1,421 | | $ | 582 | | $ | 4 | |
| | |
| |
| Depreciation and amortization: | | | | | | | | | | |
| | Americas—Alloy products | | $ | 711 | | $ | 216 | | $ | 15 | |
| | Americas—Carbon products | | | 1,623 | | | 411 | | | 81 | |
| | UK | | | 681 | | | — | | | — | |
| | Singapore | | | 115 | | | — | | | — | |
| | UAE | | | 157 | | | — | | | — | |
| | General corporate | | | 9,125 | | | 460 | | | 105 | |
| | |
| |
| | | $ | 12,412 | | $ | 1,087 | | $ | 201 | |
| |
For the six months ended June 30, 2006, our top ten customers represented 35% of our consolidated sales and no single customer represented more than 10% of consolidated sales.
The Company's sales to external customers are attributed to the following countries based upon the Company's selling location:
|
| | Successor
| | Predecessor
|
|---|
| | Six months
ended
June 30,
2006
| | Period
February 1,
2005 to
June 30,
2005
| | Period
January 1,
2005 to
January 31,
2005
|
|---|
|
| United States | | $ | 49,180 | | $ | 32,960 | | $ | 4,214 |
| Canada | | | 138,665 | | | 87,328 | | | 14,731 |
| UK | | | 81,308 | | | — | | | — |
| Singapore | | | 38,739 | | | — | | | — |
| UAE | | | 32,128 | | | — | | | — |
| | |
|
| | | $ | 340,020 | | $ | 120,288 | | $ | 18,945 |
|
F-70
|
| | Successor
as of
June 30,
2006
|
|---|
|
| Total assets: | | | |
| | United States | | $ | 216,626 |
| | Canada | | | 9,826 |
| | UK | | | 106,953 |
| | Singapore | | | 35,830 |
| | UAE | | | 26,781 |
| | General corporate | | | 122,120 |
| | |
|
| | | $ | 518,136 |
| | |
|
| Property, plant, and equipment: | | | |
| | United States | | $ | 8,647 |
| | Canada | | | 435 |
| | UK | | | 22,796 |
| | Singapore | | | 6,103 |
| | UAE | | | 1,132 |
| | General corporate | | | 1,959 |
| | |
|
| | | $ | 41,072 |
| | |
|
| Goodwill & other intangible assets: | | | |
| | United States | | $ | 59,797 |
| | Canada | | | 1,214 |
| | General corporate | | | 102,302 |
| | |
|
| | | $ | 163,313 |
|
The Company has not allocated the goodwill and other intangibles to the UK, Singapore and UAE segments; instead goodwill and other intangibles are reflected under general corporate.
9. Related party transactions
PAL and subsidiaries
Subsequent to the MIM Acquisition on December 16, 2005, MIM UK and its subsidiary continue to have limited transactions with MIM's previous owner, MIH, which is also a minority shareholder of Edgen/Murray, L.P. As of June 30, 2006, amounts due from these related parties was $396 and amounts due to these related parties was $207. The following is a summary of those transactions.
Trade sales and purchases
MIM UK continues to trade with certain subsidiaries of MIH (the "Murray Group companies") in the normal course of business. Sales to the Murray Group companies were $515 for the six months ended June 30, 2006.
Administrative expenses
PAL continues to use certain resources and processes of the Murray Group companies such as information systems and network engineering. Fees for these services are generally estimated and paid
F-71
quarterly, with an annual make whole payment for any outstanding amounts. Fees were $343 for the six months ended June 30, 2006. Additionally, PAL has recognized $189 in recharges for services and resources provided to related parties associated with the Murray Group companies for the six months ended June 30, 2006.
Other
The Company entered into various other transactions with the Murray Group companies during the six months ended June 30, 2006. The Murray Group companies provide housing for certain members of local management who are located outside the United States and the United Kingdom for which $64 was paid for the six months ended June 30, 2006. The Company also charges the Murray Group companies rent and a service charge for the use of office and warehouse premises. These charges were $110 for the six months ended June 30, 2006.
10. Derivatives and other financial instruments
The Company assesses its currency exchange exposure on certain monetary assets and liabilities and enters into financial instruments, as it believes necessary, to manage this risk. During the normal course of business, the Company is exposed to foreign currency risk. This risk can create volatility in earnings and cash flows from year to year. The Company uses derivative financial instruments to reduce exposure to foreign currency movements on foreign currency purchases and sales. The Company does not use derivative financial instruments for speculative purposes.
For the six months ended June 30, 2006, a gain of $0.2 million was included in the condensed consolidated statement of operations. The fair value of these foreign currency forward derivative contracts was a liability of $163 at June 30, 2006.
At June 30, 2006, the total notional amount of outstanding currency exchange contracts was $14,629.
11. Commitments and contingencies
The Company is involved in various claims, lawsuits and proceedings arising in the ordinary course of business. While there are uncertainties inherent in the ultimate outcome of such matters and it is impossible to presently determine the ultimate costs that may be incurred, management believes the resolution of such uncertainties and the incurrence of such costs will not have a material adverse effect on the Company's consolidated financial position, results of operations or cash flows.
F-72
(This page has been left blank intentionally.)
F-73
Report of independent auditors
To the Directors of
Murray International Metals Limited and Subsidiaries
We have audited the accompanying consolidated balance sheets of Murray International Metals Limited and Subsidiaries at January 31, 2005 and 2004, and the related consolidated profit and loss accounts, statements of total recognized gains and losses, and statements of cash flows for each of the three years in the period ended January 31, 2005 (all expressed in UK pounds). These financial statements are the responsibility of the Company's management. Our responsibility is to express an opinion on these financial statements based on our audits.
We conducted our audits in accordance with auditing standards generally accepted in the United States of America. Those standards require that we plan and perform the audit to obtain reasonable assurance about whether the financial statements are free of material misstatement. An audit includes consideration of internal control over financial reporting as a basis for designing audit procedures that are appropriate in the circumstances, but not for the purpose of expressing an opinion on the effectiveness of the Company's internal control over financial reporting. Accordingly, we express no such opinion. An audit includes examining, on a test basis, evidence supporting the amounts and disclosures in the financial statements. An audit also includes assessing the accounting principles used and significant estimates made by management, as well as evaluating the overall financial statement presentation. We believe that our audits provide a reasonable basis for our opinion.
In our opinion, such financial statements present fairly, in all material respects, the financial position of the companies at January 31, 2005 and 2004, and the results of their operations and their cash flows for each of the three years in the period ended January 31, 2005 in conformity with accounting principles generally accepted in the United Kingdom.
Accounting principles generally accepted in the United Kingdom vary in certain significant respects from accounting principles generally accepted in the United States of America. Information relating to the nature and effect of such differences is presented in Note 24 to the financial statements.
/s/ Deloitte & Touche LLP
Edinburgh, United Kingdom
November 30, 2005
F-74
Murray International Metals Limited and Subsidiaries
Consolidated profit and loss accounts
| |
| |
| | Years ended January 31,
| |
|---|
(in thousands)
| | Note
| | 2005
| | 2004
| | 2003
| |
|---|
| |
| Turnover | | | | £ | 137,194 | | £ | 87,315 | | £ | 89,024 | |
| Cost of sales | | | | | (105,149 | ) | | (70,406 | ) | | (73,827 | ) |
| | | | |
| |
| Gross profit | | | | | 32,045 | | | 16,909 | | | 15,197 | |
| Distribution expenses | | | | | (5,395 | ) | | (4,261 | ) | | (3,758 | ) |
| Administrative expenses | | | | | (3,898 | ) | | (6,828 | ) | | (4,313 | ) |
| | | | |
| |
| Operating profit | | | | | 22,752 | | | 5,820 | | | 7,126 | |
| Investment income | | 4 | | | 34 | | | 24 | | | 126 | |
| Interest payable and similar charges | | 5 | | | (360 | ) | | (336 | ) | | (402 | ) |
| | | | |
| |
| Profit before taxation | | 6 | | | 22,426 | | | 5,508 | | | 6,850 | |
| Tax on profit | | 7 | | | (6,435 | ) | | (1,703 | ) | | (2,069 | ) |
| | | | |
| |
| Profit after taxation | | | | | 15,991 | | | 3,805 | | | 4,781 | |
| Minority interests | | | | | (296 | ) | | (50 | ) | | (23 | ) |
| | | | |
| |
| Profit for the year | | | | £ | 15,695 | | £ | 3,755 | | £ | 4,758 | |
| |
The accompanying notes form an integral part of these consolidated financial statements.
F-75
Murray International Metals Limited and Subsidiaries
Consolidated statements of total recognized gains and losses
| |
| |
| | Years ended January 31,
| |
|---|
(in thousands)
| | Note
| | 2005
| | 2004
| | 2003
| |
|---|
| |
| Profit for the year | | | | £ | 15,695 | | £ | 3,755 | | £ | 4,758 | |
| Currency translation adjustments | | 15 | | | (417 | ) | | (1,035 | ) | | (1,218 | ) |
| | | | |
| |
| Total recognized gains and losses for the year | | | | £ | 15,278 | | £ | 2,720 | | £ | 3,540 | |
| |
The accompanying notes form an integral part of these consolidated financial statements.
F-76
Murray International Metals Limited and Subsidiaries
Consolidated balance sheets
| |
| |
| | At January 31,
| |
|---|
(in thousands)
| | Note
| | 2005
| | 2004
| |
|---|
| |
| Fixed assets | | | | | | | | | |
| Tangible assets | | 9 | | £ | 16,248 | | £ | 14,079 | |
| Current assets | | | | | | | | | |
| Stocks | | | | | 28,337 | | | 15,983 | |
| Debtors: amounts falling due within one year | | 10 | | | 39,351 | | | 20,940 | |
| Debtors: amounts falling due after more than one year | | 10 | | | 173 | | | 222 | |
| Cash at bank and in hand | | | | | 3,735 | | | 2,874 | |
| | | | |
| |
| | | | | | 71,596 | | | 40,019 | |
| Creditors: amounts falling due within one year | | 11 | | | (44,469 | ) | | (24,104 | ) |
| | | | |
| |
| Net current assets | | | | | 27,127 | | | 15,915 | |
| | | | |
| |
| Total assets less current liabilities | | | | | 43,375 | | | 29,994 | |
| Creditors: amounts falling due after more than one year | | 12 | | | (18 | ) | | (37 | ) |
| | | | |
| |
| Net assets | | | | £ | 43,357 | | £ | 29,957 | |
| Capital and reserves | | | | | | | | | |
| Called up share capital | | 14 | | £ | 111 | | £ | 111 | |
| Share premium account | | 15 | | | 60 | | | 60 | |
| Profit and loss account | | 15 | | | 42,778 | | | 29,648 | |
| | | | |
| |
| Equity shareholders' funds | | 16 | | | 42,949 | | | 29,819 | |
| Minority interest | | | | | 408 | | | 138 | |
| | | | |
| |
| Total capital employed | | | | £ | 43,357 | | £ | 29,957 | |
| |
The accompanying notes form an integral part of these consolidated financial statements.
F-77
Murray International Metals Limited and Subsidiaries
Consolidated cash flow statements
| |
| |
| | Years ended January 31,
| |
|---|
(in thousands)
| | Note
| | 2005
| | 2004
| | 2003
| |
|---|
| |
| Net cash inflow from operating activities | | 17a | | £ | 8,378 | | £ | 11,622 | | £ | 3,929 | |
| Interest received | | | | | 34 | | | 24 | | | 147 | |
| Interest paid | | | | | (365 | ) | | (354 | ) | | (332 | ) |
| Dividends paid to minority interests | | | | | (26 | ) | | (10 | ) | | — | |
| | | | |
| |
| Net cash outflow from returns on investments and servicing of finance | | | | | (357 | ) | | (340 | ) | | (185 | ) |
| UK corporation tax paid | | | | | (4,588 | ) | | (1,033 | ) | | (1,361 | ) |
| Foreign tax paid | | | | | (629 | ) | | (585 | ) | | (911 | ) |
| | | | |
| |
| Net cash outflow from taxation | | | | | (5,217 | ) | | (1,618 | ) | | (2,272 | ) |
| Payments to acquire tangible fixed assets | | | | | (2,783 | ) | | (492 | ) | | (13,449 | ) |
| Proceeds from disposal of tangible fixed assets | | | | | 98 | | | 28 | | | 41 | |
| | | | |
| |
| Net cash outflow from capital expenditure and financial investment | | | | | (2,685 | ) | | (464 | ) | | (13,408 | ) |
| Equity dividends paid | | | | | (2,148 | ) | | (1,527 | ) | | (1,405 | ) |
| Cash (outflow)/inflow before financing | | | | | (2,029 | ) | | 7,673 | | | (13,341 | ) |
| (Decrease)/increase in short-term borrowings | | | | | (301 | ) | | (496 | ) | | 797 | |
| Net repayment of finance leases | | | | | (23 | ) | | (23 | ) | | (57 | ) |
| Cash (outflow)/inflow from financing | | | | | (324 | ) | | (519 | ) | | 740 | |
| | | | |
| |
| (Decrease)/increase in cash | | | | £ | (2,353 | ) | £ | 7,154 | | £ | (12,601 | ) |
| |
The accompanying notes form an integral part of these consolidated financial statements.
F-78
Murray International Metals Limited and Subsidiaries
Notes to the consolidated financial statements
(in thousands, except share and per share data)
1. Description of operations
Murray International Metals Limited (Murray) and Subsidiaries (collectively referred to as the Company) is a global distributor of specialty structural steel to the offshore oil and gas industry. The Company sells highly specialized steel sections used in the construction of offshore oil and gas platforms and wellheads located in deep water and ultra deep water oil and gas fields, primarily to customers in the Caspian Sea region, West Africa, the Middle Eastern Gulf region, Southeast Asia, and Australia. The Company is headquartered in Scotland and has offices in Singapore, the Middle East, the United States and other strategic locations.
In addition to the offshore business, the Company's operations in the United Kingdom have recently diversified into several alternative markets and products including civil fabrication, shipbuilding, renewable energy, yellow goods and mining.
The Company is an indirect, wholly owned subsidiary of Murray International Holdings Limited (MIH), a company registered in Scotland. MIH is owned, and controlled, primarily by Mr. D E Murray and members of his close family.
2. Summary of significant accounting policies
The consolidated financial statements are prepared in accordance with accounting policies generally accepted in the United Kingdom (UK GAAP). They are prepared under the historical cost convention. A summary of the significant accounting policies is set out below, all of which have been applied consistently throughout the years presented in these consolidated financial statements.
Basis of preparation
The accompanying consolidated financial statements include the accounts of Murray and all of its subsidiary undertakings after elimination of intercompany accounts and transactions. The portion of the income applicable to noncontrolling interests in subsidiary undertakings is reflected as minority interests in the consolidated profit and loss accounts. The following is a list of subsidiary undertakings at January 31, 2005 and 2004:
|
| | Holding
| | Percentage
|
|---|
|
| Murray International Metals Inc.—(MIM US) registered in USA | | Ordinary shares | | 100 |
| Murray International Metals (M) Sdn. Bhd.—registered in Malaysia | | Ordinary shares | | 100 |
| Murray International Metals Pte. Limited (MIM Singapore)—registered in Singapore | | Ordinary shares | | 92.5 |
|
Murray International Metals (M) Sdn. Bhd., a dormant subsidiary, was dissolved on July 7, 2005. The principal activities of the remaining subsidiaries are steel stockholding and distribution.
Use of estimates
The preparation of the Company's consolidated financial statements in conformity with UK GAAP requires management to make certain estimates and assumptions. These estimates and assumptions affect the reported amounts of assets, liabilities, the disclosure of contingent assets and liabilities at the date of the consolidated financial statements and reported amounts of revenues and expenses during
F-79
the reporting period. Actual results could differ from those estimates. Estimates and assumptions are primarily made in relation to the valuation of debtors and stocks.
Cash at bank and in hand
The Company considers cash in bank and deposits repayable on demand to be cash at bank and in hand. Deposits repayable on demand are those that can be withdrawn at any time without notice and without penalty or have an agreed maturity of not more than 24 hours.
Stocks
Stocks, which consist of goods for resale, are stated at the lower of cost and net realisable value. Cost includes all costs incurred in bringing the product to its present location and condition, based on purchase cost on a first-in first-out basis. Net realisable value is based on estimated normal selling price less further costs expected to be incurred to completion and disposal. Provision is made for obsolete, slow-moving or defective items where appropriate.
Tangible fixed assets
Tangible fixed assets, which include amounts under finance leases, are stated at cost, net of depreciation and any provisions for impairment. Major enhancements are capitalized, while expenditures for repairs and maintenance are expensed as incurred.
Depreciation is provided on tangible fixed assets on a straight line basis over the following estimated useful lives:
|
| Buildings | | 10-50 years |
| Plant and machinery | | 3-10 years |
| Fixtures and fittings | | 5-10 years |
| Motor vehicles | | 3-5 years |
|
Residual value is calculated based on prices prevailing at the date of acquisition.
The Company evaluates the recoverability of its tangible fixed assets for impairment whenever events or circumstances indicate that the carrying amounts of such assets (or group of assets) may not be recoverable. An impairment loss is recognized for the difference between the carrying amount of the fixed assets being evaluated and the estimated fair value of the assets.
Taxation
Current tax, including UK corporation tax and foreign tax, is provided at amounts expected to be paid (or recovered) using tax rates and laws that have been enacted by the balance sheet date. The Company's liabilities may be reduced in whole or in part by the use of losses from other companies owned by MIH (referred to collectively as the Murray Group). The tax benefits arising from the use of these losses are recognized in the consolidated financial statements of the surrendering Murray Group entity.
Deferred tax is recognized in respect of all timing differences that have originated but not reversed at the balance sheet date where transactions or events that result in an obligation to pay more tax in the future or a right to pay less tax in the future have occurred at the balance sheet date. Timing differences are differences between the Company's taxable profits and its results in the consolidated
F-80
financial statements that arise from the inclusion of gains and losses in tax assessments in periods different from those in which they are recognized in the consolidated financial statements. A deferred tax asset is regarded as recoverable, and therefore recognized, only when, on the basis of all available evidence, it can be regarded as more likely than not that there will be taxable profits against which the future reversal of the underlying timing differences can be deducted.
Deferred tax is recognized in respect of the retained earnings of foreign subsidiaries and associates only to the extent that, at balance sheet date, dividends have been accrued as receivable or a binding agreement to distribute past earnings in the future have been entered into by the subsidiary or associate.
Deferred tax is measured at the average tax rates that are expected to apply in the period in which the timing differences are expected to reverse, based on tax rates and laws that have enacted or substantially enacted by the balance sheet date. Deferred tax is not discounted.
Pension costs
The Company participates in the MIH pension scheme which provides benefits based on final pensionable pay for the benefit of its employees based in the United Kingdom (the UK Scheme). Contributions to the UK Scheme are charged to the profit and loss account as incurred. Contributions are determined by a qualified actuary on the basis of triennial valuations. The Company also maintains schemes for employees of other countries, and records the required contributions to the scheme during the year. See note 21 for further detail on these pension schemes.
Foreign currency
Monetary assets and liabilities in foreign currencies are translated into the relevant measurement currency for each entity/division at the rate of exchange ruling at the balance sheet date. Transactions in foreign currencies are translated into the relevant measurement currency at the rate of exchange ruling at the date of the transaction. Transaction gains and losses are recognized in arriving at operating net income.
The results of foreign operations, whose measurement currency is not British Pounds, are translated at the average rates of exchange during the period and their assets and liabilities at the rates ruling at the balance sheet date. The cumulative effect of exchange rate movements is included in a separate component of equity shareholders' funds.
Foreign currency exchange transaction gains and losses included in operating profit for the year amounted to a £61 gain, £25 gain and £55 gain, for the years ended January 31, 2005, 2004 and 2003, respectively.
Turnover
Turnover represents amounts billed to customers, net of discounts, rebates, value added tax and similar taxes. Turnover is recognized upon shipment to customers or at the time of delivery, depending on the terms of the sale. The Company monitors and tracks the amount of rebates, returns and discounts to customers based on historical experience to estimate the amount of reduction to revenue.
Leases
The Company enters into both operating and finance lease agreements.
F-81
Tangible assets held under lease agreements, which confer rights and obligations similar to those attached to owned assets, are capitalised as tangible fixed assets and are depreciated over their economic lives. The capital elements of future lease obligations are recorded as liabilities, while the interest element is charged to the profit and loss account over the period of the agreement to produce a constant rate of charge on the balance of the related finance lease obligation.
Rentals under operating leases are charged to the profit and loss account on a straight-line basis over the lease term, even if the payments are not made on such as basis.
Stock based compensation
The Company records share-based compensation for awards it grants to its employees in its own shares and does not record compensation expense for any instruments granted by MIH. If applicable, the Company records compensation expense for the excess of the market value of the option on the date of grant over the option price.
Financial instruments
The Company uses financial instruments to reduce its exposure to foreign exchange risk movements. To qualify as a hedge, a financial instrument must be related to actual assets or liabilities or to a firm commitment or anticipated transaction. Gains and losses on hedges of existing assets or liabilities are included in the carrying amounts of these assets or liabilities and are ultimately recognized in the profit and loss account as part of those carrying amounts. Gains and losses on qualifying hedges of firm commitments or anticipated transactions are also deferred and are recognized in the profit and loss account or as adjustments of the carrying amounts when the hedged transaction occurs. Gains and losses on financial instruments that do not qualify as hedges are recognized as other income or expense. If a financial instrument ceases to be a hedge, for example because the underlying hedged position is eliminated, the instrument is marked to market and any gains or losses are recognized as other income or expense.
Concentration of risk
Turnover is primarily derived from customers in the oil and gas industry. A significant portion of the Company's turnover comes from a limited number of customers. For the years ended January 31, 2005, 2004 and 2003 the Company's ten largest customers represented approximately 43.2%, 46.4% and 46.7%, respectively, of the Company's turnover. During the years ended January 31, 2005 and 2004 no individual customer accounted for more than 10% of turnover. During the year ended January 31, 2003 one customer represented 11.5% or £10,214 of turnover.
The Company relies on a limited number of third parties to supply its stocks. For the year ended January 31, 2005, the Company's ten largest vendors accounted for approximately 77% of the Company's purchases and the Company's single largest vendor accounted for approximately 34% of the Company's purchases. If these vendors experience interruptions or other problems delivering the stocks on a timely basis, operating results could suffer.
Recent accounting pronouncements
In November 2002, the Accounting Standards Board (ASB) issued Financial Reporting Standard (FRS) 17 (revised)Retirement Benefits (FRS 17) that sets out the requirements for accounting for retirement benefits such as pensions and medical care during retirement. This replaces Statement of Standard Accounting Practice (SSAP) 24Accounting for pension costs and Urgent Issues Task Force
F-82
(UITF) Abstract 6Accounting for post-retirement benefits other than pensions. This standard covers (a) the accounting for fair value of the assets and liabilities arising from an employer's retirement benefit obligations and any related funding; (b) the operating costs of providing retirement benefits to employees which are recognised in the accounting periods in which the benefits are earned by the employees, and the related finance costs and any other changes in value of the assets and liabilities are recognised in the accounting periods in which they arise; and (c) the requirement that the consolidated financial statements contain adequate disclosure of the cost of providing retirement benefits and the related gains, losses, assets and liabilities. FRS 17 is effective for the Company beginning February 1, 2005. The Company does not anticipate that the adoption of FRS 17 will have a significant impact on its consolidated financial statements.
In April 2004, the ASB issued FRS 20Share Based Payment (FRS 20) that specifies the accounting treatment to be adopted (including the disclosures to be provided) by entities making share-based payments. In particular, the standard requires entities to recognise an expense, measured at fair value, in respect of the share-based payments they make. The term "share-based payments' includes all types of executive share option and share purchase plans and employee share option and share purchase schemes, including Save-As-You-Earn plans and similar arrangements. It also includes arrangements such as share appreciation rights, where a cash payment is made, the amount of which depends on the share price. The standard applies to transactions with employees and it also applies to transactions with vendors of goods or non-employee services that involve share-based payments being made in exchange for those goods or services. The provisions of this standard are effective for the Company beginning February 1, 2006. The Company does not anticipate the adoption of FRS 20 will have a significant impact on its consolidated financial statements.
In May 2004, the ASB issued FRS 21Events after the Balance Sheet Date (FRS 21) replacing SSAP 17Accounting for post balance sheet events, and reflects the proposals of Financial Reporting Exposure Draft 27Reporting Events after the Balance Sheet Date. The standard sets out the recognition and measurement requirements for two types of event after the balance sheet date being: those that provide evidence of conditions that existed at the balance sheet date for which the entity shall adjust the amounts recognised in its consolidated financial statements (adjusting events) and those that are indicative of conditions that arose after the balance sheet date for which the entity does not adjust the amounts recognised in its consolidated financial statements (non-adjusting events). The standard removes the requirement to report dividends proposed after the balance sheet date in the profit and loss account and instead requires disclosures in the notes to the consolidated financial statements. The provisions of this standard are effective for the Company beginning February 1, 2006.
In December 2004, the ASB issued FRS 23The Effects of Changes in Foreign Exchange Rates replacing SSAP 20Foreign Currency Translation. The standard prescribes how entities should include foreign currency transactions and foreign operations in their consolidated financial statements and how they should translate consolidated financial statements into a presentation currency. The provisions of this standard are effective for the Company beginning February 1, 2006. The Company is in the process of evaluating the impact of adopting this standard on its consolidated financial statements.
In December 2004, the ASB issued FRS 25Financial Instruments and Disclosures (FRS 25). This standard sets out requirements for the presentation of, and disclosures relating to, financial instruments. The presentation requirements of the standard deals with the classification of capital instruments issued between debt and equity and the implications of that classification for dividends and
F-83
interest expense. The disclosure requirements require entities to provide a range of primarily risk-based qualitative and quantitative disclosures about the financial instruments they hold or have issued. The disclosures required by FRS 25 are effective for the Company beginning February 1, 2006 and will result in the inclusion of additional disclosures related to, among other things, the management of the risk associated with foreign currency transactions.
In December 2004, the ASB issued FRS 26Financial Instruments: Measurement (FRS 26) that establishes the principles for recognizing and measuring financial assets, financial liabilities and some contracts to buy or sell non-financial items. This standard requires that: all derivatives and all financial assets and financial liabilities that are held for trading be measured at fair value with all changes in those fair values recognized immediately in the profit and loss account; all loans and receivables held as assets and all financial assets that are being held to maturity by the reporting entity to be measured at cost-based amounts; all other financial assets to be measured at fair value with gains and losses recognised immediately in the statement of total recognised gains and losses; and all other financial liabilities to be measured at cost-based amounts. At present this standard is only mandatory for listed entities and for those companies preparing financial statements, in accordance with the fair value accounting rules set out in the Companies Act of 1985. The Company is in the process of determining whether it will adopt this standard in due course.
Statutory financial statements
The consolidated financial statements at January 31, 2005 and 2004 and for each of the three years in the period to January 31, 2005 do not comprise statutory accounts within the meaning of Section 240 of the UK Companies Act 1985.
Statutory financial statements prepared in accordance with UK GAAP for such years have been delivered to the Registrar of Companies for England and Wales. The auditors' report on those financial statements was unqualified.
3. Segmental and geographic information
The Company has four reportable segments, which are determined based upon the significant geographic locations of the Company's operations: United Kingdom, United Arab Emirates, Singapore and the United States. Each segment is a distributor of high grade steel tubes, plates and sections to primarily the offshore oil and gas industry. A local management team manages each segment independently, with oversight from the Company's management in the UK.
The accounting policies of the segments are the same as those described in the summary of significant accounting policies. The Company evaluates performance based on profit before taxation. The Company accounts for sales between segments at a margin percentage agreed between segment
F-84
management. The following segment information is consistent with internal management reporting for the years ended January 31:
|
| | United Kingdom
| | United Arab Emirates
| | Singapore
|
|---|
| | 2005
| | 2004
| | 2003
| | 2005
| | 2004
| | 2003
| | 2005
| | 2004
| | 2003
|
|---|
|
| Turnover from external customers | | £ | 67,400 | | £ | 46,303 | | £ | 46,911 | | £ | 29,393 | | £ | 15,671 | | £ | 17,453 | | £ | 24,355 | | £ | 11,286 | | £ | 8,716 |
| Intersegment turnover | | | 3,364 | | | 1,856 | | | 2,332 | | | 1,275 | | | 180 | | | 2,014 | | | 252 | | | 452 | | | 280 |
| Gross profit | | | 14,761 | | | 9,203 | | | 8,349 | | | 8,359 | | | 3,263 | | | 2,490 | | | 6,006 | | | 2,055 | | | 1,861 |
| Depreciation expense | | | 391 | | | 385 | | | 357 | | | 139 | | | 121 | | | 140 | | | 32 | | | 36 | | | 32 |
| Interest expense, net | | | 285 | | | 270 | | | 204 | | | 13 | | | 2 | | | (2 | ) | | 34 | | | 27 | | | 29 |
| Operating profit | | | 9,541 | | | 1,385 | | | 3,550 | | | 6,524 | | | 1,946 | | | 1,263 | | | 4,759 | | | 1,072 | | | 889 |
| Segment profit before taxation | | | 9,245 | | | 1,122 | | | 3,353 | | | 6,525 | | | 1,943 | | | 1,258 | | | 4,732 | | | 1,039 | | | 860 |
| Tax on profit | | | 2,852 | | | 423 | | | 769 | | | 1,957 | | | 561 | | | 692 | | | 909 | | | 252 | | | 130 |
| At January 31: | | | | | | | | | | | | | | | | | | | | | | | | | | | |
| Long lived assets | | £ | 13,591 | | £ | 13,403 | | | n/a | | £ | 521 | | £ | 541 | | | n/a | | £ | 2,083 | | £ | 63 | | | n/a |
|
|
| | United States
| | Eliminations
| | Total Consolidated
|
|---|
| | 2005
| | 2004
| | 2003
| | 2005
| | 2004
| | 2003
| | 2005
| | 2004
| | 2003
|
|---|
|
| Turnover from external customers | | £ | 16,046 | | £ | 14,055 | | £ | 15,944 | | £ | — | | £ | — | | £ | — | | £ | 137,194 | | £ | 87,315 | | £ | 89,024 |
| Intersegment turnover | | | 86 | | | 25 | | | 11 | | | (4,977 | ) | | (2,513 | ) | | (4,637 | ) | | — | | | — | | | — |
| Gross profit | | | 2,919 | | | 2,388 | | | 2,497 | | | — | | | — | | | — | | | 32,045 | | | 16,909 | | | 15,197 |
| Depreciation expense | | | 18 | | | 18 | | | 20 | | | — | | | — | | | — | | | 580 | | | 560 | | | 549 |
| Interest expense, net | | | (6 | ) | | 13 | | | 45 | | | — | | | — | | | — | | | 326 | | | 312 | | | 276 |
| Operating profit | | | 1,928 | | | 1,417 | | | 1,424 | | | — | | | — | | | — | | | 22,752 | | | 5,820 | | | 7,126 |
| Segment profit before taxation | | | 1,924 | | | 1,404 | | | 1,379 | | | — | | | — | | | — | | | 22,426 | | | 5,508 | | | 6,850 |
| Tax on profit | | | 717 | | | 467 | | | 478 | | | — | | | — | | | — | | | 6,435 | | | 1,703 | | | 2,069 |
| At January 31: | | | | | | | | | | | | | | | | | | | | | | | | | | | |
| Long lived assets | | £ | 53 | | £ | 72 | | | n/a | | | — | | | — | | | n/a | | £ | 16,248 | | £ | 14,079 | | | n/a |
|
The above also presents the Company's sales to external customers which, based on the Company's selling location, are attributable to the UK and to foreign countries.
4. Investment income
Investment income consists of the following for the years ended January 31:
|
| | 2005
| | 2004
| | 2003
|
|---|
|
| Interest receivable and similar income | | £ | 34 | | £ | 24 | | £ | 126 |
|
F-85
5. Interest payable and similar charges
Interest payable and similar charges are derived from the following sources for the years ended January 31:
|
| | 2005
| | 2004
| | 2003
|
|---|
|
| On bank loans and overdrafts | | £ | 352 | | £ | 324 | | £ | 393 |
| On finance leases obligations | | | 4 | | | 7 | | | 6 |
| On other loans | | | 4 | | | 5 | | | 3 |
| | |
|
| | | £ | 360 | | £ | 336 | | £ | 402 |
|
6. Profit before taxation
Profit before taxation is stated after charging (crediting) the following for the years ended January 31:
| |
| | 2005
| | 2004
| | 2003
| |
|---|
| |
| Depreciation of tangible fixed assets: | | | | | | | | | | |
| —owned | | £ | 525 | | £ | 472 | | £ | 456 | |
| —held under finance lease agreements | | | 55 | | | 88 | | | 93 | |
| Gain on disposal of tangible fixed assets | | | (81 | ) | | (13 | ) | | (29 | ) |
| Operating lease rentals | | | 418 | | | 435 | | | 550 | |
| Auditors' remuneration | | | 50 | | | 46 | | | 60 | |
| Staff costs | | | 3,590 | | | 2,905 | | | 2,673 | |
| |
F-86
7. Tax on profit
The tax charge consists of the following for the years ended January 31:
| |
| | 2005
| | 2004
| | 2003
| |
|---|
| |
| Current tax | | | | | | | | | | |
| UK corporation tax | | £ | 4,738 | | £ | 988 | | £ | 1,515 | |
| Double tax relief | | | — | | | — | | | (86 | ) |
| | |
| |
| | | | 4,738 | | | 988 | | | 1,429 | |
| Foreign tax | | | 1,649 | | | 717 | | | 681 | |
| | |
| |
| | | | 6,387 | | | 1,705 | | | 2,110 | |
| Adjustments in respect of prior years | | | | | | | | | | |
| UK corporation tax | | | — | | | — | | | (21 | ) |
| Foreign tax | | | — | | | — | | | (50 | ) |
| | |
| |
| Total current tax | | | 6,387 | | | 1,705 | | | 2,039 | |
| Deferred tax (see note 13) | | | 48 | | | (2 | ) | | 30 | |
| | |
| |
| Total tax on profit | | £ | 6,435 | | £ | 1,703 | | £ | 2,069 | |
| |
The differences between the total current tax shown above and the amount calculated by applying the standard rate of UK corporation tax to the profit before tax are as follows for the years ended January 31:
| |
| | 2005
| | 2004
| | 2003
| |
|---|
| |
| Profit before tax | | £ | 22,426 | | £ | 5,508 | | £ | 6,850 | |
| Tax on profit at standard UK corporation tax rate of 30% | | | 6,728 | | | 1,652 | | | 2,055 | |
| Effects of: | | | | | | | | | | |
| —Expenses not deductible for tax purposes | | | 90 | | | 70 | | | 56 | |
| —Capital allowances in excess of depreciation | | | (53 | ) | | (32 | ) | | (5 | ) |
| —Short-term timing differences | | | 6 | | | 35 | | | (24 | ) |
| —Double tax relief in respect of foreign dividend income | | | (282 | ) | | (213 | ) | | — | |
| —Underlying tax in respect of foreign dividend income | | | 80 | | | 72 | | | — | |
| —Foreign tax rate differential | | | (182 | ) | | 121 | | | 28 | |
| —Adjustments to tax charge in respect of previous years | | | — | | | — | | | (71 | ) |
| | |
| |
| Current tax charge for year | | £ | 6,387 | | £ | 1,705 | | £ | 2,039 | |
| |
F-87
8. Dividends
The Company paid the following dividends during the years ended January 31:
|
| | 2005
| | 2004
| | 2003
|
|---|
|
| Interim dividend paid to all shareholders; £17.2290, £13.7466 and £12.6495 per ordinary share, respectively | | £ | 1,915 | | £ | 1,527 | | £ | 1,405 |
| Interim dividend paid to director shareholders of £21.0002, nil and nil per ordinary share, respectively | | | 233 | | | — | | | — |
| | |
|
| | | £ | 2,148 | | £ | 1,527 | | £ | 1,405 |
|
No final dividend was proposed by the directors for any of the years presented. See note 14 for a description of the restrictions surrounding the payment of dividends.
9. Tangible fixed assets
Tangible fixed assets consist of the following at January 31:
|
| | 2005
| | 2004
|
|---|
|
| Freehold land and buildings | | £ | 15,259 | | £ | 13,262 |
| Plant and machinery, including motor vehicles and fixtures and furniture | | | 989 | | | 817 |
| | |
|
| | | £ | 16,248 | | £ | 14,079 |
|
Movements in tangible fixed assets were as follows for the years ended January 31:
| |
| | Freehold land
and buildings
| | Plant and
machinery
| | Total
| |
|---|
| |
| Cost | | | | | | | | | | |
| Beginning of year | | £ | 13,785 | | £ | 3,555 | | £ | 17,340 | |
| Additions | | | 2,157 | | | 482 | | | 2,639 | |
| Disposals | | | — | | | (203 | ) | | (203 | ) |
| Transfers | | | 140 | | | 31 | | | 171 | |
| Exchange adjustment | | | (10 | ) | | (31 | ) | | (41 | ) |
| | |
| |
| End of year | | £ | 16,072 | | £ | 3,834 | | £ | 19,906 | |
| | |
| |
| Depreciation | | | | | | | | | | |
| Beginning of year | | £ | 523 | | £ | 2,738 | | £ | 3,261 | |
| Charge for the year | | | 271 | | | 309 | | | 580 | |
| Disposals | | | — | | | (187 | ) | | (187 | ) |
| Transfers | | | 23 | | | 5 | | | 28 | |
| Exchange adjustment | | | (4 | ) | | (20 | ) | | (24 | ) |
| | |
| |
| End of year | | £ | 813 | | £ | 2,845 | | £ | 3,658 | |
| | |
| |
| Net book value | | | | | | | | | | |
| End of year | | £ | 15,259 | | £ | 989 | | £ | 16,248 | |
| Beginning of year | | £ | 13,262 | | £ | 817 | | £ | 14,079 | |
| |
Plant and machinery held under finance lease agreements had a net book value of £111 and £125 at January 31, 2005 and 2004, respectively.
F-88
10. Debtors
Debtors consist of the following at January 31:
|
| | 2005
| | 2004
|
|---|
|
| Amounts falling due within one year: | | | | | | |
| Trade debtors, net of allowance for doubtful debts | | £ | 37,769 | | £ | 20,072 |
| Amounts owed by members of the Murray Group | | | 930 | | | 302 |
| Foreign tax recoverable | | | — | | | 153 |
| Other debtors | | | 244 | | | 246 |
| Prepayments and accrued income | | | 408 | | | 167 |
| | |
|
| | | | 39,351 | | | 20,940 |
Amounts falling due after more than one year: |
|
|
|
|
|
|
| Net deferred tax assets (note 13) | | | 163 | | | 211 |
| Other debtors | | | 10 | | | 11 |
| | |
|
| | | | 173 | | | 222 |
| | |
|
| | | £ | 39,524 | | £ | 21,162 |
|
11. Creditors: amounts falling due within one year
Creditors consist of the following at January 31:
|
| | 2005
| | 2004
|
|---|
|
| Trade creditors | | £ | 29,434 | | £ | 13,802 |
| Bank loans and overdrafts (note 19) | | | 7,985 | | | 4,673 |
| Amounts owed to members of the Murray Group | | | 2,685 | | | 3,358 |
| Foreign tax payable | | | 1,061 | | | 230 |
| Current element of finance lease obligations (note 12) | | | 37 | | | 41 |
| Social security and PAYE | | | 82 | | | 69 |
| Other creditors | | | 701 | | | 261 |
| Other accruals | | | 2,484 | | | 1,670 |
| | |
|
| | | £ | 44,469 | | £ | 24,104 |
|
12. Creditors: amounts falling due after more than one year
Creditors falling due after more than one year represent amounts payable under finance lease agreements. The following represents the total amount due under these agreements at January 31:
|
| | 2005
| | 2004
|
|---|
|
| —Payable within one year (note 11) | | £ | 37 | | £ | 41 |
| —Payable between one and two years (note 20) | | | 18 | | | 37 |
| | |
|
| | | £ | 55 | | £ | 78 |
|
Finance lease obligations are secured by the related assets. The leases expire in 2006.
F-89
13. Deferred taxes
The movement in deferred taxes is as follows for the years ending January 31:
|
| | 2005
| | 2004
|
|---|
|
| Beginning of year | | £ | 211 | | £ | 209 |
| (Charged)/credited to the profit and loss account | | | (48 | ) | | 2 |
| | |
|
| End of year | | £ | 163 | | £ | 211 |
|
The ending balance consists of the following at January 31:
| |
| | 2005
| | 2004
| |
|---|
| |
| Bad debt provision | | £ | 73 | | £ | 58 | |
| Accruals | | | 49 | | | 55 | |
| Stocks | | | 25 | | | 26 | |
| Depreciation | | | — | | | 47 | |
| Other timing differences | | | 16 | | | 25 | |
| | |
| |
| | | | 163 | | | 211 | |
| Transferred to debtors (note 10) | | | (163 | ) | | (211 | ) |
| | |
| |
| | | £ | — | | £ | — | |
| |
The Company does not have any other provisions for liabilities or charges.
14. Called up share capital
Called up share capital consists of the following at January 31:
|
| | 2005
| | 2004
|
|---|
|
| Authorized | | | | |
| 150,000 ordinary shares of £1 each | | £150 | | £150 |
| Allotted, called-up and fully paid | | | | |
| 111,111 of ordinary shares of £1 each | | £111 | | £111 |
|
Under English law, the Company can pay dividends only out of its distributable profits, defined as the accumulated realized profits under UK GAAP, of Murray, so far as not previously utilized by distribution or capitalization, less accumulated realized and unrealized losses, so far as not previously written off in a reduction or reorganization of capital duly made. The Company can make a distribution only if the distribution does not reduce net assets below the aggregate of the called up share capital and undistributable reserves. Any payment of dividends is at the discretion of the board of directors.
F-90
15. Reserves
The movement in reserves is as follows for the year ended January 31, 2005:
| |
| | Profit
and loss
account
| | Share
premium
account
| | Total
| |
|---|
| |
| Beginning of the year | | £ | 29,648 | | £ | 60 | | £ | 29,708 | |
| Currency translation adjustments | | | (417 | ) | | — | | | (417 | ) |
| Retained profit for the year (note 16) | | | 13,547 | | | — | | | 13,547 | |
| | |
| |
| End of the year | | | £42,778 | | | £60 | | | £42,838 | |
| |
16. Reconciliation of movements in equity shareholders' funds
A reconciliation of the movement in equity shareholders' funds is as follows for the years ended January 31:
| |
| | 2005
| | 2004
| | 2003
| |
|---|
| |
| Profit for the year | | £ | 15,695 | | £ | 3,755 | | £ | 4,758 | |
| Equity dividends paid (note 8) | | | (2,148 | ) | | (1,527 | ) | | (1,405 | ) |
| | |
| |
| Retained profit for the year | | | 13,547 | | | 2,228 | | | 3,353 | |
| Currency translation adjustments | | | (417 | ) | | (1,035 | ) | | (1,218 | ) |
| | |
| |
| Net addition to shareholders' funds | | | 13,130 | | | 1,193 | | | 2,135 | |
| Opening shareholders' funds | | | 29,819 | | | 28,626 | | | 26,491 | |
| | |
| |
| Closing shareholders' funds | | £ | 42,949 | | £ | 29,819 | | £ | 28,626 | |
| |
17. Consolidated cash flow statement notes
- (a)
- Reconciliation of operating profit to operating cash flows is as follows for the years ended January 31:
| |
| | 2005
| | 2004
| | 2003
| |
|---|
| |
| Operating profit | | £ | 22,752 | | £ | 5,820 | | £ | 7,126 | |
| Depreciation charges | | | 580 | | | 560 | | | 549 | |
| Gain on disposal of tangible fixed assets | | | (81 | ) | | (13 | ) | | (29 | ) |
| (Increase)/decrease in stock | | | (12,354 | ) | | 1,305 | | | 5,794 | |
| (Increase)/decrease in debtors | | | (18,600 | ) | | 3,113 | | | (3,847 | ) |
| Increase/(decrease) in creditors | | | 16,079 | | | 837 | | | (5,664 | ) |
| | |
| |
| Net cash inflow from operating activities | | £ | 8,378 | | £ | 11,622 | | £ | 3,929 | |
| |
F-91
- (b)
- Analysis and reconciliation of net debt is as follows for the year ended January 31, 2005:
| |
| | Beginning of year
| | Cash flow
| | Exchange
movements
| | End of year
| |
|---|
| |
| Cash at bank and in hand | | £ | 2,874 | | £ | 1,260 | | £ | (399 | ) | £ | 3,735 | |
| Bank overdraft | | | (4,372 | ) | | (3,613 | ) | | — | | | (7,985 | ) |
| Finance lease obligations | | | (78 | ) | | 23 | | | — | | | (55 | ) |
| Debt due within one year | | | (301 | ) | | 301 | | | — | | | — | |
| | |
| |
| Net debt | | £ | (1,877 | ) | £ | (2,029 | ) | £ | (399 | ) | £ | (4,305 | ) |
| |
- (c)
- Reconciliation of net cash outflow to movement in net (debt)/funds is as follows for the years ended January 31:
| |
| | 2005
| | 2004
| | 2003
| |
|---|
| |
| (Decrease)/increase in cash, net of overdrafts | | | £(2,353 | ) | | £7,154 | | | £(12,601 | ) |
| Cash outflow/(inflow) from movement in debt and finance leases | | | 324 | | | 519 | | | (740 | ) |
| | |
| |
| Change in net (debt)/funds resulting from cash flows | | | (2,029 | ) | | 7,673 | | | (13,341 | ) |
| New finance leases | | | — | | | — | | | (54 | ) |
| Currency translation adjustments | | | (399 | ) | | (1,005 | ) | | (1,132 | ) |
| | |
| |
| Movement in net (debt)/funds in the year | | | (2,428 | ) | | 6,668 | | | (14,527 | ) |
| Net (debt)/funds at beginning of year | | | (1,877 | ) | | (8,545 | ) | | 5,982 | |
| | |
| |
| Net debt at end of year | | £ | (4,305 | ) | £ | (1,877 | ) | £ | (8,545 | ) |
| |
18. Fair value of financial instruments
The fair value of cash at bank and in hand and other liquid resources (defined as current assets and liabilities excluding cash at bank and in hand), approximates its carrying value due to the short term maturity of these instruments. The debtors and creditors are determined based on forward rates where there is an associated derivative contract. The fair value of derivative instruments is based on the estimated amount the Company would receive or pay if the transaction was terminated, taking into consideration prevailing exchange rates.
The comparison of book and fair values of the Company's financial instruments at January 31, 2005 and 2004 is presented below.
|
| | 2005
| | 2004
|
|---|
| | Carrying value
| | Fair value
| | Carrying value
| | Fair value
|
|---|
|
| Cash at bank and in hand | | £ | 3,735 | | £ | 3,735 | | £ | 2,874 | | £ | 2,874 |
| Liquid resources | | | 67,688 | | | 67,688 | | | 36,923 | | | 36,923 |
| Instruments with off-balance sheet risk: | | | | | | | | | | | | |
| | Foreign currency forward contracts | | | — | | | (29 | ) | | — | | | 72 |
|
The foreign currency forward contracts fair value includes the value of contracts used as hedges of future sales or purchases.
F-92
19. Financing arrangements
The Company's outstanding borrowings with third parties at January 31 are as follows:
|
| | 2005
| | 2004
|
|---|
|
| Bank overdrafts | | £7,985 | | £4,372 |
| Other bank debt | | — | | 301 |
| | |
|
| Total (note 11) | | £7,985 | | £4,673 |
|
Bank facilities
The Company participates in a banking facility with other members of the Murray Group (MIH Facility). The MIH Facility provides access to, among other things, additional overdraft facilities, short term loans and letters of credit. The amounts outstanding under the MIH facility at January 31, 2005 and 2004 incurred interest at 1% above the Bank of England inter-bank rate. The interest rates on amounts outstanding at January 31, 2005 and 2004 were 5.75% and 4.75%, respectively.
Subsidiaries of the Company also have available credit facilities with various local lenders that carry variable interest rates. These facilities provide access to, among other things short term loans, performance bonds, financial guarantees and trust receipts.
The Company's contingent liabilities under the bank facilities at January 31, 2005 are as follows:
|
| | Term
| | Performance
Bonds/Financial
Guarantees
| | Letters
of Credit
|
|---|
|
| MIH Facility—Related party(1) | | 2009 | | £ | 226,992 | | £ | — |
| MIH Facility—Third party | | 2009 | | | 811 | | | 3,822 |
| Subsidiaries' facilities | | Various | | | 919 | | | 2,757 |
| | | | |
|
| Total | | | | | £228,722 | | | £6,579 |
|
- (1)
- In connection with the MIH Facility, the Company has guaranteed bank borrowings of MIH and other members of the Murray Group, which are secured by a debenture on the assets of the Company, and by cross guarantees from MIH and other members of the Murray Group. The amount of the guarantee fluctuates based on total outstanding debt under the MIH Facility. The total amount of debt outstanding under the MIH Facility at January 31, 2005 was £226,992, representing the maximum amount payable under the guarantees on that date. The guarantees currently do not have an expiration date, other than the expiration of the MIH Facility.
At January 31, 2005 and 2004, unused availability under the letter of credit facilities, excluding the MIH Facility, was £5.7 million and £2.6 million, respectively.
Third party guarantees
The Company provides performance guarantees on behalf of its subsidiaries and other members of the Murray Group directly with third parties during the normal course of business.
Performance guarantees provided on behalf of its subsidiaries, which guarantee payment to a customer if a subsidiary fails to perform completely under various contracts, were entered into by the Company. For guarantees that expire within one year of each respective balance sheet date, the maximum potential amount of future payments (undiscounted) for non-performance totalled £2,736 at January 31, 2005. For guarantees that do not have an expiration date, there was no maximum amount regarding future payment and the total amount outstanding relating to guarantees was £858 at January 31, 2005.
F-93
Performance guarantees on behalf of a member of the Murray Group, which guarantee payment if the other member of the Murray Group fails to perform completely under various contracts, were entered into by the Company. The maximum potential amount of future payments (undiscounted) the Company could be required to make under these guarantees was £5,050 at January 31, 2005, before any recovery through recourse provisions. Recourse provisions include a counter indemnity issued by the lender of the MIH Facility. These guarantees do not expire and can be withdrawn by the Company at any time.
The Company is registered for VAT purposes with other members of the Murray Group and shares a common registration number. As a result, it has jointly guaranteed the VAT liability of MIH, and failure by other members of the Murray Group to meet their VAT liabilities would give rise to additional liabilities for the Company. The directors are of the opinion that no liability is likely to arise from the failure of other members of the Murray Group.
20. Commitments and contingent liabilities
(a) Lease commitments
The Company leases certain property and motor vehicles under operating leases. The minimum annual rentals under these leases are as follows at January 31:
|
| | Land and buildings
| | Other
|
|---|
| | 2005
| | 2004
| | 2005
| | 2004
|
|---|
|
| Operating leases which expire | | | | | | | | | | | | |
| —Within 1 year | | £ | 205 | | £ | 210 | | £ | 46 | | £ | 4 |
| —Within 2–5 years | | | 10 | | | 22 | | | 75 | | | 107 |
| | |
|
| | | £ | 215 | | £ | 232 | | £ | 121 | | £ | 111 |
|
The Company's total obligations under operating and finance leases are as follows at January 31, 2005:
| |
| | Operating
leases
| | Finance
leases
| |
|---|
| |
| Years ending January 31: | | | | | | | |
| 2006 | | £ | 238 | | £ | 40 | |
| 2007 | | | 99 | | | 19 | |
| 2008 | | | 34 | | | — | |
| 2009 | | | 31 | | | — | |
| 2010 | | | 9 | | | — | |
| Thereafter | | | — | | | — | |
| | |
| |
| Total minimum lease payments | | £ | 411 | | £ | 59 | |
| Less amounts representing interest | | | | | | (4 | ) |
| | | | | |
| |
| Total finance lease obligations | | | | | | 55 | |
| Less current portion (note 12) | | | | | | (37 | ) |
| | | | | |
| |
| Long term portion (note 12) | | | | | £ | 18 | |
| |
F-94
These leases have various expiration dates ranging from 2005 to 2010. Certain leases contain renewal options of up to 10 years.
(b) Capital commitments
The Company has entered into non-cancellable contracts primarily for the purchase of land and a building in Singapore, which totalled £1,193 and £9 at January 31, 2005 and 2004, respectively.
(c) Litigation
From time to time, the Company has been party to various legal proceedings arising in the normal course of business. In the opinion of the Company's directors, there are currently no proceedings which, if determined adversely against the Company, would have a material effect on the Company's balance sheet, profit and loss account or cash flows.
21. Employee benefits
(a) Pension arrangement
The Company has varying pension arrangements for its employees, which depend on the location where the individual is employed.
(i) United Kingdom employees
The Company participates in the MIH Staff Pension and Life Assurance Plan, a pension scheme for the benefit of the employees in the United Kingdom sponsored by MIH. This is a defined benefit multi-employer scheme, the assets and liabilities of which are held independently from MIH. The Company is unable to identify its share of the underlying assets and liabilities of the scheme and accordingly, accounts for the scheme as if it were a defined contribution scheme.
Contributions to the scheme for the years ended January 31, 2005, 2004 and 2003 were £106, £102 and £94, respectively. The agreed employer contribution rate was 9.75% until September 30, 2003, and 10% thereafter. The contributions were determined by a qualified actuary on the basis of a triennial valuation using the projected unit method. An updated valuation of the scheme at October 1, 2004 indicated that the scheme was adequately funded in accordance with the statutory minimum funding requirement. The assumptions which have the most significant effect on the results of the triennial valuation are those relating to the rate of return on investments and the rate of increase in pensionable salaries. In the October 1, 2004 triennial valuation it was assumed that the investment returns would be 7.5% per annum and that pensionable salary increases would average 4.5% per annum.
(ii) Middle East employees
For the benefit of certain employees resident in the Middle East, the Company operates a defined contribution saving scheme, the assets and liabilities of which are held independently from the Company. Contributions to the savings scheme for the years ended January 31, 2005, 2004 and 2003 were £14, £13 and £14, respectively. The agreed contribution rate for the year ended January 31, 2005 was 8.75%.
F-95
(iii) United States employees
MIM US operates a 401(k) profit sharing plan for certain employees resident in the United States. Employer contributions are at the discretion of the Company and were £7, £8, and £8 for the years ended January 31, 2005, 2004 and 2003, respectively.
(b) Employee Share Option Scheme
MIH operates an Unapproved Employee Share Option Scheme, which is open to three directors of MIH. One of those directors is also a director of the Company. This individual was granted options to purchase 71,699 ordinary shares in MIH at a price of £6.40 per share. The options were granted in June 2002, and are exercisable on or after May 8, 2003 until May 8, 2011. No options were exercised during any of the periods presented.
(c) Phantom Share Option Scheme
The Company operates a Phantom Share Scheme (Phantom Scheme), which is open to employees or directors of the Company by invitation of the Shareholders'. Two directors of the Company have been invited to participate in the Phantom Scheme. The Phantom Scheme granted each individual a right over intangible units that mirror the Company's net asset growth. Each individual was granted 1,600 units with a base value of £157 per unit. The individual is required to sell the units to the Company in exchange for a bonus calculated based on the terms of the agreement at the time of certain events (such as retirement). In addition, the individuals may exchange 50% of their units for a bonus after ten years and forfeit the remaining 50% of the units. The units provide an additional bonus at the occurrence of certain events such as the disposal of the Company to an entity not associated with MIH, or a listing of the Company's shares on an exchange.
22. Related party transactions
The debtor and creditor balances as a result of transactions with Murray Group companies are as follows:
|
| | Debtors
| | Creditors
|
|---|
| | 2005
| | 2004
| | 2005
| | 2004
|
|---|
|
| Forth Steel Limited | | £ | 301 | | £ | 171 | | £ | 76 | | £ | 67 |
| Charlotte Ventures Energy Limited | | | 375 | | | — | | | — | | | — |
| Murray Group Management Limited | | | 149 | | | 2 | | | 2,399 | | | 3,127 |
| Northern Steel Stocks Limited | | | 40 | | | 6 | | | 20 | | | 14 |
| MGSH Limited | | | 36 | | | — | | | — | | | — |
| Premier Alloys Limited | | | 8 | | | 54 | | | 30 | | | 19 |
| Austin Trumanns Steel Limited | | | — | | | 8 | | | 89 | | | 62 |
| Carnegie Systems Management Limited | | | 5 | | | 27 | | | 69 | | | 68 |
| Other | | | 16 | | | 34 | | | 2 | | | 1 |
| | |
|
| | | £ | 930 | | £ | 302 | | £ | 2,685 | | £ | 3,358 |
|
F-96
Trade sales and purchases
The Company trades with members of the Murray Group in the normal course of business. Sales to Murray Group companies were as follows for the years ended January 31:
|
| | 2005
| | 2004
| | 2003
|
|---|
|
| Forth Steel Limited | | £ | 1,118 | | £ | 904 | | £ | 1,050 |
| Premier Alloys Limited | | | — | | | 35 | | | 35 |
| Northern Steel Stocks Limited | | | 38 | | | 386 | | | 44 |
| Austin Trumanns Steel Limited | | | 9 | | | 4 | | | 34 |
| | |
|
| | | £ | 1,165 | | £ | 1,329 | | £ | 1,163 |
|
Purchases from Murray Group companies were as follows for the years ended January 31:
|
| | 2005
| | 2004
| | 2003
|
|---|
|
| Forth Steel Limited | | £ | 388 | | £ | 309 | | £ | 243 |
| Premier Alloys Limited | | | 82 | | | 94 | | | 66 |
| Northern Steel Stocks Limited | | | 65 | | | 109 | | | 156 |
| Austin Trumanns Limited | | | 274 | | | 188 | | | 42 |
| | |
|
| | | £ | 809 | | £ | 700 | | £ | 507 |
|
Intercompany recharges
The Company uses the resources and processes of Murray Group Management Limited (MGM). Carnegie Systems Management Limited (CSM), and the Rangers Football Club Plc (Rangers), as described below. There are no formal agreements governing provision of services among the Murray Group companies or the method of payment for the services, except with CSM.
Some expenses incurred by the Company are allocated to the Company and to other companies in the Murray Group, based on an estimate of resources used. These expenses include management fees, information technology, and advertising and entertainment.
Total charges from Murray Group companies were as follows for the years ended January 31:
|
| | 2005
| | 2004
| | 2003
|
|---|
|
| MGM (management fees) | | £ | 681 | | £ | 3,761 | | £ | 784 |
| CSM (information technology) | | | 271 | | | 292 | | | 186 |
| Rangers (advertising and entertainment) | | | 58 | | | 59 | | | 74 |
| | |
|
| | | £ | 1,010 | | £ | 4,112 | | £ | 1,044 |
|
The charge for the year ended January 31, 2004, includes a £3,000 charge from MGM which was in excess of MGM's costs incurred in the period.
F-97
Total recharges by the Company to Murray Group companies were as follows for the years ended January 31:
|
| | 2005
| | 2004
| | 2003
|
|---|
|
| Forth Steel Limited | | £ | 70 | | £ | 51 | | £ | 104 |
| Northern Steel Stocks Limited | | | 54 | | | 44 | | | 90 |
| MGSH Limited | | | 58 | | | 41 | | | 40 |
| Premier Alloys Limited | | | 299 | | | 245 | | | 271 |
| CSM | | | 22 | | | 27 | | | 28 |
| Other | | | 9 | | | 1 | | | 6 |
| | |
|
| | | £ | 512 | | £ | 409 | | £ | 539 |
|
Management fees—MGM, a wholly-owned subsidiary of MIH, provides, and arranges third party agents to provide, certain corporate services, on a non-exclusive basis. These services primarily consist of the following types of services, which are charged as follows:
- •
- The Company's turnover relative to other subsidiaries of MIH, for legal, tax, and accounting, management, office and facilities;
- •
- A pro rata allocation of the Company's headcount for human resource services; and
- •
- A pro rata allocation of the Company's indebtedness for funding charges.
Charges from MGM for these services totalled £408, £3,478 and £572 for the years ended January 31, 2005, 2004 and 2003, respectively. MIH also charges the Company for other miscellaneous charges. Management fees are paid monthly.
In the year ended January 31, 2003, the Company recharged a portion of the management fee charged by MGM to other companies within the Murray Group, leaving a charge of £456 remaining within the Company's results.
Information technology—CSM provides information systems and network engineering to the Company. Fees for these services are generally estimated and paid quarterly, with an annual make whole payment for any outstanding amounts.
Advertising and entertainment—Purchases from the Rangers are in respect of advertising and entertaining. A portion of these costs were recharged to other Murray Group companies, leaving £28, £29 and £33 of costs for the years ended January 31, 2005, 2004 and 2003, respectively.
HR and accounting function
The Company provided human resource services and accounting functions to a number of companies in the Murray Group. The Company charged £296, £193 and £205 for such services in the years ended January 31, 2005, 2004 and 2003, respectively.
Fees for these services are generally estimated and paid quarterly, with an annual make whole payment for any outstanding amounts. Normal trade credit conditions attach to payment and receipt of the above transactions.
F-98
Rental income
The Company charges CSM and Premier Alloys Limited rent and business rates, for the use of office and warehouse premises. These charges were £177, £165 and £134 for the years ended January 31, 2005, 2004 and 2003, respectively.
Other
The Company's banking facilities are arranged centrally for the whole Murray Group and the costs of arrangement are recharged through the MGM charge detailed above. These facility fees are recharged on a percentage of indebtedness basis.
The Company has also entered into an agreement to guarantee the outstanding balances of MIH with the Bank of Scotland—see note 19 for further details of the guarantees provided by the Company.
The Company has entered into a tax agreement with MIH that establishes the basis upon which certain tax matters in the United Kingdom, including the surrender of tax losses and the re-allocation of income or gain where permitted by UK tax law, between the Company and other MIH subsidiaries subject to tax in the United Kingdom, will be conducted. In the years ended January 31, 2005, 2004 and 2003, the Company received gross tax losses of £15,291, £3,318 and £4,619, respectively. The Company paid £4,587, £995, and £1,386, respectively, for these losses, which equals the tax effect of the loss received.
MIH maintains property, business interruption, general liability and related insurance coverage for the Murray Group for which the Company is a named party. The Company incurred £228, £238, and £192 for this insurance in the years ended January 31, 2005, 2004 and 2003.
The Company provides housing for directors of the Company outside the UK. This amounted to £65, £72, and £82 for the years ended January 31, 2005, 2004 and 2003 respectively.
The Company transferred a funding balance of £375 to Charlotte Ventures Energy Limited in the year ended January 31, 2005. This is repayable within one year or on demand.
23. Subsequent events (Unaudited)
On May 18, 2005, Jefferies Capital Partners ("JCP") entered into a letter of intent with MIH to acquire all of the equity interests of the Company. In addition, MIH and the Company agreed in principle to sell to Edgen Carbon Products Group, L.L.C., a wholly-owned subsidiary of Edgen Corporation ("Edgen") all of the equity interests of the Company's US subsidiary, MIM US. On November 30, 2005, JCP through a newly established holding company, Pipe Acquisition Limited ("Pipe"), entered into a sale and purchase agreement with MIH and certain other persons, pursuant to which Pipe agreed to purchase all of the outstanding shares of the Company from its shareholders for an aggregate purchase price of approximately £87,000. On the same date, Edgen entered into a sale and purchase agreement with the Company and certain other persons pursuant to which Edgen agreed to purchase all of the outstanding capital stock of MIM US for an aggregate purchase price of approximately £12,000, plus certain agreed dividends.
The acquisition of the Company and the acquisition of MIM US by Edgen will be funded with the proceeds of a $130,000 high yield debt offering by Pipe Acquisition Finance Plc, a majority owned subsidiary of Pipe, the issuance and sale by Edgen of $31,000 97/8% senior secured notes due 2011 and
F-99
equity investments by funds managed by JCP and certain members of MIM Ltd. and Edgen management.
24. Reconciliation to accounting principles in the United States
The Company's consolidated financial statements have been prepared in accordance with UK GAAP, which differs in certain respects from accounting principles generally accepted in the United States (US GAAP). Such differences involve methods for measuring the amounts in the consolidated financial statements, as well as additional disclosures required by US GAAP. The differences between UK GAAP and US GAAP applicable to the Company are quantified and described below.
Reconciliation of profit for the year
The effects of the application of US GAAP on profit for the year are set out below for the years ended January 31:
| |
| | Notes
| | 2005
| | 2004
| |
|---|
| |
| Profit for the year under UK GAAP | | | | £ | 15,695 | | £ | 3,755 | |
| Derivative financial instruments | | (a | ) | | (87 | ) | | 102 | |
| Software development costs | | (b | ) | | (129 | ) | | (37 | ) |
| Management fees | | (c | ) | | — | | | 3,000 | |
| Deferred taxes | | (d | ) | | (146 | ) | | (24 | ) |
| Tax impact of US GAAP adjustments | | (e | ) | | 65 | | | (19 | ) |
| | | | |
| |
| Net income under US GAAP | | | | | £15,398 | | | £6,777 | |
| |
Reconciliation of equity shareholders' funds
The effects of the application of US GAAP on shareholders' funds at January 31, 2005 and 2004:
| |
| |
| | 2005
| | 2004
| |
|---|
| |
| Equity shareholders' funds under UK GAAP | | | | £ | 42,949 | | £ | 29,819 | |
| Derivative financial instruments | | (a | ) | | (24 | ) | | 63 | |
| Software development costs | | (b | ) | | 133 | | | 262 | |
| Deferred taxes | | (d | ) | | (1,667 | ) | | (1,521 | ) |
| Tax impact of US GAAP adjustments | | (e | ) | | (33 | ) | | (98 | ) |
| | | | |
| |
| Shareholders' equity under US GAAP | | | | £ | 41,358 | | £ | 28,525 | |
| |
Notes
(a) Derivative financial instruments
During the normal course of business, the Company is exposed to foreign currency risk. These risks can create volatility in earnings and cash flows from year to year, and hence the Company uses derivative financial instruments to reduce exposure to foreign currency movements on foreign currency purchases and sales.
Under UK GAAP, the Company applies hedge accounting and does not separately record its derivative instruments on the balance sheet at fair value. Accordingly, commercial activities denominated in foreign currencies are recorded in sterling at actual exchange rates at the date of the transaction or at
F-100
the contracted rate if the transaction is covered by a forward exchange contract. Monetary assets and liabilities denominated in foreign currencies at year end are reported at the rates of exchange prevailing at the year end, or if hedged at the appropriate hedged rate. Where the Company enters into forward contracts which are not linked to a trade or where the underlying transaction has been settled, a gain or loss will arise during the period from inception to maturity of the underlying transaction. The realized fair value is recorded at each balance sheet date. When the Company enters into sale and purchase contracts in foreign currencies these contracts are not always denominated in the functional currency of either party to the transaction. This results in an embedded derivative as there is an implicit forward purchase or sale of that currency. The fair value of these embedded derivatives is not recognised under UK GAAP.
Under US GAAP, monetary assets and liabilities denominated in foreign currencies at year end are reported at the rates of exchange prevailing at the balance sheet date and all derivatives, whether designated in a hedging relationship or not, are carried at fair value on the balance sheet. The Company has not designated any of its derivative instruments as qualifying hedge instruments under SFAS 133Accounting for Derivative Instruments and Hedging Activities. Accordingly all gains and losses arising from changes in the fair value of derivatives and embedded derivatives are charged or credited in determining net income under US GAAP.
The fair value of the derivatives outstanding at January 31, 2005 was a liability of £29 and at January 31, 2004 was an asset of £72. Valuations prepared by a bank have been used to calculate the fair value of the forward foreign exchange contracts.
(b) Software development costs
Under UK GAAP, software development costs are written off to the profit and loss account as they are incurred.
Under US GAAP, certain internal and external costs incurred to acquire or create internal use software are capitalized in accordance with AICPA Statement of Position 98-1,Accounting for the Costs of Computer Software Developed or Obtained for Internal Use. Capitalized software is included in property, plant and equipment and is depreciated over three years when development is complete.
(c) Management fees
Under UK GAAP, any management fees charged by other Group companies to the Company are recorded as operating expenses in the period that they are incurred by the Company.
Staff Accounting Bulletin (SAB) Topic IB,Subsidiaries or Divisions Sold or Spun Off, requires the Company's financial statements to reflect a reasonable allocation of the costs historically incurred by MIH in operating the Murray Group. Accordingly, any management fees that are charged to the Company in excess of the underlying cost of services rendered by MIH or other members of the Murray Group are treated as dividends payable to other Murray Group companies. In the year ended January 31, 2004, the Company was charged a management fee totalling £3,478. Of this amount, £3,000 is considered excess to the underlying costs incurred by MGM to manage the Company. Consequently, this amount has been recorded as a deemed dividend for US reporting purposes.
(d) Deferred taxes
Under UK GAAP, the Company accounts for taxes in accordance with FRS 19,Deferred Taxes (FRS 19) while under US GAAP, the Company accounts for taxes in accordance with SFAS 109,Accounting
F-101
for Income Taxes (SFAS 109). The differences between these standards that have an impact on the Company are as follows:
Under UK GAAP, a capital gain has been rolled over into the tax base cost of fixed assets, which gives rise to a temporary difference. This gain has not been recognised as a deferred tax liability as FRS 19 only requires recognition where there is a binding contract to sell the fixed asset that has a reduced base cost as a result of the gain being rolled over, and a taxable gain is expected to arise. Under US GAAP, a deferred tax liability is recognised for this item pursuant to SFAS 109.
Under UK GAAP, deferred tax liabilities on unremitted earnings of subsidiaries are only permitted to be recognised when the dividends have been accrued, or when there is a binding agreement to distribute past earnings. Under US GAAP, deferred tax liabilities on unremitted earnings of subsidiaries are recorded where such earnings are not considered to be permanently invested in subsidiaries.
The geographical sources of profit before taxation were as follows for the years ended January 31:
|
| | 2005
| | 2004
|
|---|
|
| United Kingdom | | £ | 15,550 | | £ | 6,115 |
| Foreign | | | 6,659 | | | 2,459 |
| | |
|
| Profit before taxation | | | £22,209 | | | £8,574 |
|
The tax on profit consists of the following for the years ended January 31:
|
| | 2005
| | 2004
|
|---|
|
| Current | | | | | | |
| United Kingdom | | £ | 4,738 | | £ | 995 |
| Foreign | | | 1,649 | | | 710 |
| | |
|
| Total current | | £ | 6,387 | | £ | 1,705 |
| Deferred | | | | | | |
| United Kingdom | | £ | 148 | | £ | 35 |
| Foreign | | | (20 | ) | | 7 |
| | |
|
| Total deferred | | £ | 128 | | £ | 42 |
| | |
|
| Tax on profit | | £ | 6,515 | | £ | 1,747 |
|
A reconciliation of tax on profit with the amount computed by applying the statutory income tax rate to profit for the year is as follows for the years ended January 31:
|
| | 2005
| | 2004
|
|---|
|
| Statutory rate | | 30.0% | | 30.0% |
| Foreign tax rate differential | | (1.6)% | | (0.3)% |
| Deductible dividend | | — | | (10.5)% |
| Non-deductible expenses | | 0.8% | | 1.0% |
| Other | | 0.1% | | 0.2% |
| | |
|
| | | 29.3% | | 20.4% |
|
F-102
Deferred income taxes reflect the net tax effect of temporary differences between the carrying amounts of assets and liabilities for financial reporting purposes and the amounts for income tax purposes. Significant components of the Company's deferred tax assets and liabilities at January 31, 2005 and 2004 are as follows:
| |
| | 2005
| | 2004
| |
|---|
| |
| Assets: | | | | | | | |
| Current: | | | | | | | |
| Bad debt provision | | £ | 73 | | £ | 58 | |
| Accruals | | | 49 | | | 55 | |
| Stocks | | | 25 | | | 27 | |
| Other | | | 35 | | | 31 | |
| | |
| |
| Current deferred tax assets | | | 182 | | | 171 | |
| Non current: | | | | | | | |
| Depreciation | | | — | | | 47 | |
| Tax credits | | | 60 | | | 76 | |
| | |
| |
| Non current deferred tax assets | | | 60 | | | 123 | |
| | |
| |
| Total deferred tax assets | | | 242 | | | 294 | |
| Liabilities: | | | | | | | |
| Current: | | | | | | | |
| Derivatives | | | — | | | (19 | ) |
| Non current: | | | | | | | |
| Unremitted earnings of foreign subsidiaries | | | (137 | ) | | (8 | ) |
| Deferred capital gain on property sale | | | (1,590 | ) | | (1,590 | ) |
| Other | | | (50 | ) | | (84 | ) |
| | |
| |
| Non current deferred tax liabilities | | | (1,777 | ) | | (1,682 | ) |
| Total deferred tax liabilities | | | (1,777 | ) | | (1,701 | ) |
| | |
| |
| Net deferred tax liability | | £ | (1,535 | ) | £ | (1,407 | ) |
| |
(e) Tax impact of US GAAP adjustments
This adjustment reflects the effect of providing for the applicable effective tax rate on relevant US GAAP adjustments.
(f) Cash flow statements
The consolidated cash flow statements have been prepared under UK GAAP in accordance with FRS 1,Cash Flow Statements, (revised) (FRS 1) and presents substantially the same information as required under SFAS 95,Statements of cash flows (SFAS 95). There are certain differences between FRS 1 and SFAS 95, with regard to classification of items within the cash flow statement.
In accordance with FRS 1, cash flows are prepared separately for operating activities, returns on investments and servicing of finance, taxation, capital expenditure and financial investment, acquisitions and disposals, equity dividends paid, management of liquid resources and financing. Under SFAS 95, cash flows are classified under operating activities, investing activities and financing activities. Under FRS 1, cash is defined as cash in hand and deposits repayable on demand, less overdrafts repayable on
F-103
demand. Under SFAS 95, cash and cash equivalents are defined as cash and investments with original maturities of three months or less.
A reconciliation between the consolidated statements of cash flows presented based on UK GAAP measurement principles using US GAAP disclosures and presentational principles, is shown below for the years ended January 31:
| |
| | 2005
| | 2004
| |
|---|
| |
| Operating activities: | | | | | | | |
| Net cash inflow from operating activities under UK GAAP | | £ | 8,378 | | £ | 11,622 | |
| Interest received and paid | | | (331 | ) | | (330 | ) |
| Net cash outflow from taxation | | | (5,217 | ) | | (1,618 | ) |
| | |
| |
| Net cash provided by operating activities under US GAAP | | | 2,830 | | | 9,674 | |
| Investing activities: | | | | | | | |
| Net cash outflow from capital expenditure and financial investment | | | (2,685 | ) | | (464 | ) |
| | |
| |
| Net cash used in investing activities under US GAAP | | | (2,685 | ) | | (464 | ) |
| Financing activities: | | | | | | | |
| Cash outflow from financing under UK GAAP | | | (324 | ) | | (519 | ) |
| Dividends paid to minority interests | | | (26 | ) | | (10 | ) |
| Equity dividends paid | | | (2,148 | ) | | (1,527 | ) |
| Increase/(decrease) in bank overdrafts | | | 3,613 | | | (5,938 | ) |
| | |
| |
| Net cash provided by/(used in) financing activities under US GAAP | | | 1,115 | | | (7,994 | ) |
| Effect of exchange rate changes on cash | | | (399 | ) | | (1,005 | ) |
| | |
| |
| Net increase in cash and cash equivalents under US GAAP | | | 861 | | | 211 | |
| Cash and cash equivalents under US GAAP at beginning of year | | | 2,874 | | | 2,663 | |
| | |
| |
| Cash and cash equivalents under US GAAP at end of year | | £ | 3,735 | | £ | 2,874 | |
| |
(g) Financial statement presentation
Consolidated balance sheet presentation
The balance sheet prepared in accordance with UK GAAP differs in certain respects from US GAAP. Under UK GAAP, current assets are netted against current liabilities in the balance sheet whereas US GAAP requires the separate presentation of total assets and total liabilities. In addition, current assets under UK GAAP include amounts that fall due after more than one year. Under US GAAP, such assets would be reclassified as non-current assets.
Recent accounting pronouncements
In November 2004, the Financial Accounting Standards Board (FASB) issued SFAS 151,Inventory Costs (SFAS 151), to clarify that abnormal amounts of idle facility expense, freight, handling costs and wasted materials (spoilage) should be recognised as current period charges. In addition, SFAS 151 requires that the allocation of fixed production overheads to inventory values be based on the normal capacity of the production facilities. SFAS 151 is effective for costs incurred in respect of inventories for reporting periods beginning after June 15, 2005. The adoption of SFAS 151 is not expected to have a material effect on the results or net assets of the Company.
F-104
In December 2004, the FASB issued SFAS 153,Exchanges of Nonmonetary Assets on amendment of Accounting Principles Board (APB) 29 (APB 29) (SFAS 153), which, for periods beginning after June 15, 2005, no longer allows the exemption included in APB 29 which permitted certain non-monetary exchanges of similar productive assets to be accounted for at book value with no gain or loss being recognised. Under SFAS 153 such non-monetary transactions have to be accounted for at fair value, recognising any gain or loss, if the transaction meets a commercial substance criterion and the fair value is determinable. SFAS 153 did not affect the guidance in APB 29 for non-monetary exchanges of inventory. The adoption of SFAS 153 is not expected to have a material effect on the results or net assets of the Company.
In December 2004, the FASB issued SFAS 123(R),Share-Based Payment (SFAS 123(R)), which is a revision of SFAS 123,Accounting for Stock-Based Compensation and supersedes APB Opinion 25,Accounting for Stock Issued to Employees. Generally the valuation methods contained in SFAS 123(R) are similar to those in SFAS 123, but SFAS 123(R) requires all share based payments to employees, including grants of employee share options, to be charged to the statement of income. Pro forma disclosure is no longer an alternative. With limited exceptions, the amount charged to the statement of income for share options will be measured based on the grant date fair value of the option amortised over the period to the date of vesting of the award. SFAS 123(R) is effective for annual reporting periods beginning after June 15, 2005. The adoption of SFAS 123(R) is not expected to have a material effect on the results or net assets of the Company.
In May 2005, the FASB issued SFAS 154,Accounting Changes and Error Corrections (SFAS 154), which is effective for periods beginning after December 15, 2005. This statement replaces APB Opinion 20,Accounting Changes (APB 20) and SFAS 3,Reporting Accounting Changes in Interim Financial Statements. APB 20 previously required that most voluntary changes in accounting principle be recognised by including, in net income of the period of the change, the cumulative effect of changing to the new accounting principle. SFAS 154 requires retrospective application to prior periods' financial statements of changes in accounting principle, unless it is impracticable to determine either the period specific effects or the cumulative effect of the change. The adoption of SFAS 154 is not expected to have a material effect on the results or net assets of the Company.
F-105
(This page has been left blank intentionally.)
F-106
Murray International Metals Limited and Subsidiaries
Condensed consolidated profit and loss accounts
| |
| | Six months ended July 31,
| |
|---|
(in thousands)
| | 2005
| | 2004
| |
|---|
| |
|---|
| | (unaudited)
| |
|---|
| Turnover | | £ | 83,946 | | £ | 60,631 | |
| Cost of sales | | | (67,605 | ) | | (46,894 | ) |
| | |
| |
| Gross profit | | | 16,341 | | | 13,737 | |
| Other operating expenses (net) | | | (4,838 | ) | | (4,111 | ) |
| | |
| |
| Operating profit | | | 11,503 | | | 9,626 | |
| Investment income | | | 32 | | | 11 | |
| Interest payable and similar charges | | | (332 | ) | | (120 | ) |
| | |
| |
| Profit before taxation | | | 11,203 | | | 9,517 | |
| Tax on profit | | | (3,542 | ) | | (3,048 | ) |
| | |
| |
| Profit after taxation | | | 7,661 | | | 6,469 | |
| Minority interest | | | (181 | ) | | (111 | ) |
| | |
| |
| Profit for the period | | £ | 7,480 | | £ | 6,358 | |
| |
The accompanying notes form an integral part of these condensed consolidated interim financial statements.
F-107
Murray International Metals Limited and Subsidiaries
Condensed consolidated statements
of total recognized gains and losses
| |
| | Six months ended July 31,
| |
|---|
(in thousands)
| | 2005
| | 2004
| |
|---|
| |
|---|
| | (unaudited)
| |
|---|
| Profit for the period | | £ | 7,480 | | £ | 6,358 | |
| Currency translation adjustments | | | 1,256 | | | (77 | ) |
| | |
| |
| Total recognized gains and losses for the period | | £ | 8,736 | | £ | 6,281 | |
| |
The accompanying notes form an integral part of these condensed consolidated interim financial statements.
F-108
Murray International Metals Limited and Subsidiaries
Condensed consolidated balance sheets
| |
(in thousands)
| | At
July 31,
2005
| | At
January 31,
2005
| |
|---|
| |
|---|
| | (unaudited)
| |
|---|
| Fixed assets | | | | | | | |
| Tangible assets | | £ | 17,241 | | £ | 16,248 | |
| Current assets | | | | | | | |
| Stocks | | | 37,684 | | | 28,337 | |
| Debtors: amounts falling due within one year | | | 43,732 | | | 39,351 | |
| Debtors: amounts falling due after more than one year | | | 242 | | | 173 | |
| Cash at bank and in hand | | | 6,201 | | | 3,735 | |
| | |
| |
| | | | 87,859 | | | 71,596 | |
| Creditors: amounts falling due within one year | | | (57,839 | ) | | (44,469 | ) |
| Net current assets | | | 30,020 | | | 27,127 | |
| | |
| |
| Total assets less current liabilities | | | 47,261 | | | 43,375 | |
| Creditors: amounts falling due after more than one year | | | (13 | ) | | (18 | ) |
| | |
| |
| Net assets | | £ | 47,248 | | £ | 43,357 | |
| Capital and reserves | | | | | | | |
| Called up share capital | | £ | 111 | | £ | 111 | |
| Share premium account | | | 60 | | | 60 | |
| Profit and loss account | | | 46,581 | | | 42,778 | |
| | |
| |
| Equity shareholders' funds | | | 46,752 | | | 42,949 | |
| Minority interest | | | 496 | | | 408 | |
| | |
| |
| Total capital employed | | £ | 47,248 | | £ | 43,357 | |
| |
The accompanying notes form an integral part of these condensed consolidated interim financial statements.
F-109
Murray International Metals Limited and Subsidiaries
Condensed consolidated cash flow statements
| |
| | Six months ended July 31,
| |
|---|
(in thousands)
| | 2005
| | 2004
| |
|---|
| |
|---|
| | (unaudited)
| |
|---|
| Net cash (outflow)/inflow from operating activities | | £ | (2,968 | ) | £ | 159 | |
| Interest received | | | 32 | | | 11 | |
| Interest paid | | | (267 | ) | | (149 | ) |
| Dividends paid to minority interest | | | (118 | ) | | (26 | ) |
| | |
| |
| Net cash outflow from returns on investments and servicing of finance | | | (353 | ) | | (164 | ) |
| UK corporation tax paid | | | (2,382 | ) | | (2,157 | ) |
| Foreign tax paid | | | (1,293 | ) | | (315 | ) |
| | |
| |
| Net cash outflow from taxation | | | (3,675 | ) | | (2,472 | ) |
| Payments to acquire tangible fixed assets | | | (1,175 | ) | | (1,190 | ) |
| Proceeds from disposal of tangible fixed assets | | | 12 | | | 75 | |
| | |
| |
| Net cash outflow from capital expenditure and financial investment | | | (1,163 | ) | | (1,115 | ) |
| Equity dividends paid | | | (4,933 | ) | | (2,148 | ) |
| | |
| |
| Cash outflow before financing | | | (13,092 | ) | | (5,740 | ) |
| Increase/(decrease) in short-term borrowings | | | 1,587 | | | (301 | ) |
| Net (decrease)/increase in finance leases | | | (20 | ) | | 3 | |
| | |
| |
| Cash inflow/(outflow) from financing | | | 1,567 | | | (298 | ) |
| | |
| |
| Decrease in cash in the period | | £ | (11,525 | ) | £ | (6,038 | ) |
| |
The accompanying notes form an integral part of these condensed consolidated interim financial statements.
F-110
Murray International Metals Limited and Subsidiaries
Notes to the condensed consolidated interim financial statements
(in thousands, except share and per share data)
1. Description of operations
Murray International Metals Limited (Murray) and Subsidiaries (collectively referred to as the Company) is primarily a global distributor of specialty structural steel to the offshore oil and gas industry. The Company sells highly specialized steel sections used in the construction of offshore oil and gas platforms and wellheads located in deep water and ultra deep water oil and gas fields, primarily to customers in the Caspian Sea region, West Africa, the Middle Eastern Gulf region, Southeast Asia, and Australia. The Company is headquartered in Scotland and has offices in Singapore, the Middle East, the United States and other strategic locations.
In addition to the offshore business, the Company's operations in the United Kingdom have recently diversified into several alternative markets and products including civil fabrication, shipbuilding, renewable energy, yellow goods and mining.
The Company is an indirect, wholly owned subsidiary of Murray International Holdings Limited (MIH), a company registered in Scotland. MIH is owned, and controlled, primarily by Mr. D. E. Murray and members of his close family.
2. Summary of significant accounting policies
The accompanying condensed consolidated interim financial statements are unaudited and are prepared on the basis of the accounting policies as set forth in the Company's consolidated financial statements for the year ended January 31, 2005. Certain information and footnote disclosures normally included in consolidated financial statements prepared in accordance with applicable accounting standards generally accepted in the United Kingdom ("UK GAAP") have been condensed or omitted. However, such information reflects all adjustments (consisting of normal recurring adjustments), which are, in the opinion of management, necessary to fairly state the results of interim periods. Interim results are not necessarily indicative of results to be expected for the full year.
The January 31, 2005 balance sheet was derived from audited consolidated financial statements but does not include all disclosures required by accounting principles generally accepted in the United States of America ("US GAAP"). However, the Company believes that the disclosures are adequate to make the information presented not misleading.
These interim consolidated financial statements should be read in conjunction with the Company's consolidated balance sheets at January 31, 2005 and 2004 and, and the related consolidated profit and loss accounts, statements of recognized gains and losses and statements of cash flows for the periods then ended.
Concentration of risk
Turnover is primarily derived from customers in the oil and gas industry. During the periods ended July 31, 2005 and 2004 the Company's ten largest customers, represented approximately 57.4% and 49.9%, respectively, of the Company's turnover. During the period ended July 31, 2005 two customers individually represented greater than 10% of sales; one customer representing 16.1% and the other 10.9%. Total amounts owed from these customers was £13,553 at July 31, 2005. During the period ended July 31, 2004, no individual customer accounted for more than 10% of turnover.
The Company relies on a limited number of third parties to supply its stocks. For the six months ended July 31, 2005, our ten largest vendors accounted for approximately 72% of our purchases and our single
F-111
largest vendor accounted for approximately 34% of our purchases. If these vendors experience interruptions or other problems delivering the stocks on a timely basis, operating results could suffer.
Recent accounting pronouncements
In November 2002, the Accounting Standards Board (ASB) issued Financial Reporting Standard (FRS) 17 (revised)Retirement Benefits (FRS 17) that sets out the requirements for accounting for retirement benefits such as pensions and medical care during retirement. This replaces Statement of Standard Accounting Practice (SSAP) 24Accounting for pension costs and Urgent Issues Task Force (UITF) Abstract 6Accounting for post-retirement benefits other than pensions. This standard covers (a) the accounting for fair value of the assets and liabilities arising from an employer's retirement benefit obligations and any related funding; (b) the operating costs of providing retirement benefits to employees which are recognised in the accounting periods in which the benefits are earned by the employees, and the related finance costs and any other changes in value of the assets and liabilities are recognised in the accounting periods in which they arise; and (c) the requirement that the consolidated financial statements contain adequate disclosure of the cost of providing retirement benefits and the related gains, losses, assets and liabilities. FRS 17 is effective for the Company beginning February 1, 2005. The Company does not anticipate that the adoption of FRS 17 will have a significant impact on its consolidated financial statements.
In April 2004, the ASB issued FRS 20Share Based Payment (FRS 20) that specifies the accounting treatment to be adopted (including the disclosures to be provided) by entities making share-based payments. In particular, the standard requires entities to recognise an expense, measured at fair value, in respect of the share-based payments they make. The term "share-based payments' includes all types of executive share option and share purchase plans and employee share option and share purchase schemes, including Save-As-You-Earn plans and similar arrangements. It also includes arrangements such as share appreciation rights, where a cash payment is made, the amount of which depends on the share price. The standard applies to transactions with employees and it also applies to transactions with vendors of goods or non-employee services that involve share-based payments being made in exchange for those goods or services. The provisions of this standard are effective for the Company beginning February 1, 2006. The Company does not anticipate the adoption of FRS 20 will have a significant impact on its consolidated financial statements.
In May 2004, the ASB issued FRS 21Events after the Balance Sheet Date (FRS 21) replacing SSAP 17Accounting for post balance sheet events, and reflects the proposals of Financial Reporting Exposure Draft 27Reporting Events after the Balance Sheet Date. The standard sets out the recognition and measurement requirements for two types of event after the balance sheet date being: those that provide evidence of conditions that existed at the balance sheet date for which the entity shall adjust the amounts recognised in its consolidated financial statements (adjusting events) and those that are indicative of conditions that arose after the balance sheet date for which the entity does not adjust the amounts recognised in its consolidated financial statements (non-adjusting events). The standard removes the requirement to report dividends proposed after the balance sheet date in the profit and loss account and instead requires disclosures in the notes to the consolidated financial statements. The provisions of this standard are effective for the Company beginning February 1, 2006.
In December 2004, the ASB issued FRS 23The Effects of Changes in Foreign Exchange Rates replacing SSAP 20Foreign Currency Translation. The standard prescribes how entities should include foreign currency transactions and foreign operations in their consolidated financial statements and how they should translate consolidated financial statements into a presentation currency. The provisions of this
F-112
standard are effective for the Company beginning February 1, 2006. The Company is in the process of evaluating the impact of adopting this standard on its consolidated financial statements.
In December 2004, the ASB issued FRS 25Financial Instruments and Disclosures (FRS 25). This standard sets out requirements for the presentation of, and disclosures relating to, financial instruments. The presentation requirements of the standard deals with the classification of capital instruments issued between debt and equity and the implications of that classification for dividends and interest expense. The disclosure requirements require entities to provide a range of primarily risk-based qualitative and quantitative disclosures about the financial instruments they hold or have issued. The disclosures required by FRS 25 are effective for the Company beginning February 1, 2006 and will result in the inclusion of additional disclosures related to, among other things, the management of the risk associated with foreign currency transactions.
In December 2004, the ASB issued FRS 26Financial Instruments: Measurement (FRS 26) that establishes the principles for recognizing and measuring financial assets, financial liabilities and some contracts to buy or sell non-financial items. This standard requires that: all derivatives and all financial assets and financial liabilities that are held for trading be measured at fair value with all changes in those fair values recognized immediately in the profit and loss account; all loans and receivables held as assets and all financial assets that are being held to maturity by the reporting entity to be measured at cost-based amounts; all other financial assets to be measured at fair value with gains and losses recognised immediately in the statement of total recognised gains and losses; and all other financial liabilities to be measured at cost-based amounts. At present this standard is only mandatory for listed entities and for those companies preparing financial statements, in accordance with the fair value accounting rules set out in the Companies Act of 1985. The Company is in the process of determining whether it will adopt this standard in due course.
3. Segmental and geographic information
The Company has four reportable segments, which are determined based upon the significant geographic locations of the Company's operations: United Kingdom, United Arab Emirates, Singapore and the United States. Each segment is a distributor of high grade steel tubes, plates and sections to primarily the offshore oil and gas industry. A local management team manages each segment independently, with oversight from the Company's management in the UK.
The accounting policies of the segments are the same as those described in the summary of significant accounting policies. The Company evaluates performance based on profit before taxation. The Company accounts for sales between segments at a margin percentage agreed between segment
F-113
management. The following segment information is consistent with internal management reporting for the year periods ended July 31:
|
2005:
| | UK
| | UAE
| | Singapore
| | US
| | Eliminations
| | Total
consolidated
|
|---|
|
| Turnover from external customers | | £ | 41,213 | | £ | 15,705 | | £ | 20,089 | | £ | 6,939 | | £ | — | | £ | 83,946 |
| Intersegment turnover | | | 1,182 | | | 978 | | | — | | | 17 | | | (2,177 | ) | | — |
| Gross profit | | | 8,292 | | | 2,629 | | | 4,010 | | | 1,410 | | | — | | | 16,341 |
| Operating profit | | | 5,590 | | | 1,652 | | | 3,283 | | | 978 | | | — | | | 11,503 |
| Profit before taxation | | | 5,383 | | | 1,603 | | | 3,230 | | | 987 | | | — | | | 11,203 |
|
|
2004:
| | UK
| | UAE
| | Singapore
| | US
| | Eliminations
| | Total
consolidated
|
|---|
|
| Turnover from external customers | | £ | 31,877 | | £ | 11,689 | | £ | 8,797 | | £ | 8,268 | | £ | — | | £ | 60,631 |
| Intersegment turnover | | | 1,731 | | | 40 | | | 27 | | | 24 | | | (1,822 | ) | | — |
| Gross profit | | | 6,311 | | | 3,875 | | | 2,440 | | | 1,111 | | | — | | | 13,737 |
| Operating profit | | | 3,882 | | | 3,045 | | | 1,933 | | | 766 | | | — | | | 9,626 |
| Profit before taxation | | | 3,781 | | | 3,042 | | | 1,927 | | | 767 | | | — | | | 9,517 |
|
4. Reserves
The movement in reserves is as follows for the period ended July 31, 2005:
|
| | Profit
and loss
account
| | Share
premium
account
| | Total
|
|---|
|
| Beginning of the period | | £ | 42,778 | | £ | 60 | | £ | 42,838 |
| Movement in currency translation | | | 1,256 | | | — | | | 1,256 |
| Retained profit for the period (note 5) | | | 2,547 | | | — | | | 2,547 |
| | |
|
| End of the period | | £ | 46,581 | | £ | 60 | | £ | 46,641 |
|
5. Reconciliation of movements in equity shareholders' funds
A reconciliation of the movement in equity shareholders' funds is as follows for the periods ended July 31:
| |
| | 2005
| | 2004
| |
|---|
| |
| Profit for the period | | £ | 7,480 | | £ | 6,358 | |
| Equity dividends paid | | | (4,933 | ) | | (2,148 | ) |
| | |
| |
| Retained profit for the period | | | 2,547 | | | 4,210 | |
| Currency translation adjustment | | | 1,256 | | | (77 | ) |
| | |
| |
| Net addition to shareholders' funds | | | 3,803 | | | 4,133 | |
| Opening shareholders' funds | | | 42,949 | | | 29,819 | |
| | |
| |
| Closing shareholders' funds | | £ | 46,752 | | £ | 33,952 | |
| |
F-114
6. Consolidated cash flow notes
- (a)
- Reconciliation of operating profit to operating cash flows is as follows for the six months ended July 31:
| |
| | 2005
| | 2004
| |
|---|
| |
| Operating profit | | £ | 11,503 | | £ | 9,626 | |
| Depreciation charges | | | 329 | | | 275 | |
| Gain on disposal of tangible fixed assets | | | (11 | ) | | (59 | ) |
| Increase in stock | | | (9,347 | ) | | (1,661 | ) |
| Increase in debtors | | | (4,209 | ) | | (12,386 | ) |
| (Decrease)/increase in creditors | | | (1,233 | ) | | 4,364 | |
| | |
| |
| Net cash (outflow)/inflow from operating activities | | £ | (2,968 | ) | £ | 159 | |
| |
- (b)
- Analysis and reconciliation of net debt is as follows for the six months ended July 31, 2005:
| |
| | Beginning of
period
| | Cash flow
| | Exchange
movements
| | End of period
| |
|---|
| |
| Cash at bank and in hand | | £ | 3,735 | | £ | 1,333 | | £ | 1,133 | | £ | 6,201 | |
| Bank overdraft | | | (7,985 | ) | | (12,858 | ) | | — | | | (20,843 | ) |
| Finance lease obligations | | | (55 | ) | | 20 | | | — | | | (35 | ) |
| Debt due within one year | | | — | | | (1,587 | ) | | — | | | (1,587 | ) |
| | |
| |
| Net debt | | £ | (4,305 | ) | £ | (13,092 | ) | £ | 1,133 | | £ | (16,264 | ) |
| |
- (c)
- Reconciliation of net cash outflow to movement in net debt is as follows for the six months ended July 31:
| |
| | 2005
| | 2004
| |
|---|
| |
| Decrease in cash, net of overdrafts | | £ | (11,525 | ) | £ | (6,038 | ) |
| Cash (inflow)/outflow from increase/(decrease) in debt and finance leases | | | (1,567 | ) | | 298 | |
| Change in net debt resulting from cash flows | | | (13,092 | ) | | (5,740 | ) |
| Translation difference | | | 1,133 | | | (77 | ) |
| | |
| |
| Movement in net debt in the period | | | (11,959 | ) | | (5,817 | ) |
| Net debt at beginning of period | | | (4,305 | ) | | (1,876 | ) |
| | |
| |
| Net debt at end of period | | £ | (16,264 | ) | £ | (7,693 | ) |
| |
7. Financing arrangements
The Company's outstanding borrowings with third parties at July 31 are as follows:
|
| | 2005
|
|---|
|
| Bank overdrafts | | £ | 20,843 |
| Other bank debt | | | 1,587 |
| | |
|
| Total | | £ | 22,430 |
|
F-115
Bank facilities
The Company participates in a banking facility with other members of the Murray Group (MIH Facility). The MIH Facility provides access to, among other things, additional overdraft facilities, short term loans and letters of credit. The amounts outstanding under the MIH Facility at July 31, 2005 incurred interest at 1% above the Bank of England inter-bank rate. The interest rate on amounts outstanding at July 31, 2005, was 5.75%.
Subsidiaries of the Company also have available credit facilities with various local lenders that carry variable interest rates. These facilities provide access to among other things short term loans, performance bonds, guarantees and trust receipts.
The Company's contingent liabilities under the bank facilities other financing arrangements at July 31, 2005 are as follows:
|
| | Term
| | Performance
bonds/financial
guarantees
| | Letters of
credit
|
|---|
|
| MIH Facility—Related party(1) | | 2009 | | £ | 222,816 | | £ | — |
| MIH Facility—Third party | | 2009 | | | 712 | | | 2,258 |
| Subsidiaries' facilities | | Various | | | 1,354 | | | 4,644 |
| | | | |
|
| Total | | | | £ | 224,882 | | £ | 6,902 |
|
- (1)
- In connection with the MIH Facility, the Company has guaranteed bank borrowings of MIH and other members of the Murray Group, which are secured by a debenture on the assets of the Company, and by cross guarantees from MIH and other members of the Murray Group. The amount of the guarantee fluctuates based on total outstanding debt under the MIH Facility. The total amount of debt outstanding under the MIH Facility at July 31, 2005 was £222,816, representing the maximum amount payable under the guarantees on those dates. The guarantees currently do not have an expiration date, other than the expiration of the MIH Facility.
At July 31, 2005, unused availability under the letter of credit facilities, excluding the MIH Facility, was £4.5 million.
Third party guarantees
The Company provides performances guarantees on behalf of its subsidiaries and other members of Murray Group directly with third party during the normal course of business. Performance guarantees provided on behalf of its subsidiaries, which guarantee payment to a customer if a subsidiary fails to perform completely under various contracts, were entered into by the Company. For guarantees that expire within one year of each respective balance sheet date, the maximum potential amount of future payments (undiscounted) for non-performance totalled £900 at July 31, 2005. For guarantees expiring on December 31, 2006, there was no maximum amount regarding future payment and the total amount outstanding relating to guarantees was £297 at July 31, 2005.
Performance guarantees on behalf of a member of the Murray Group, which guarantees payment if the other member of the Murray Group fails to perform completely under various contracts, were entered into by the Company. The maximum potential amount of future payments (undiscounted) the Company could be required to make under these guarantees was £3,750 at July 31, 2005 before any recovery through recourse provisions. Recourse provisions include a counter indemnity issued by the lender of the MIH facility. These guarantees do not expire and can be withdrawn by the Company at any time.
F-116
The Company is registered for VAT purposes with other members of the Murray Group and share a common registration number. As a result, it has jointly guaranteed the VAT liability of MIH, and failure by other members of the Murray Group to meet their VAT liabilities would give rise to additional liabilities for the Company. The directors are of the opinion that no liability is likely to arise from the failure of other members of the Murray Group.
8. Commitments and contingent liabilities
(a) Lease commitments
The Company leases certain property and motor vehicles under non-cancellable operating leases. The following presents the future minimum lease payments on these operating leases:
| |
| | Operating leases
| | Finance leases
| |
|---|
| |
| Six months ended January 31, 2006 | | £ | 191 | | £ | 18 | |
| Years ending January 31: | | | | | | | |
| 2007 | | | 190 | | | 19 | |
| 2008 | | | 78 | | | — | |
| 2009 | | | 57 | | | — | |
| 2010 | | | 25 | | | — | |
| 2011 | | | — | | | | |
| Thereafter | | | — | | | — | |
| | |
| |
| Total minimum lease payments | | £ | 541 | | | 37 | |
| | |
| |
| Less amount representing interest | | | | | | (2 | ) |
| | |
| |
| Total finance lease obligations | | | | | | 35 | |
| Less current portion | | | | | | (22 | ) |
| | |
| |
| Long term portion | | | | | £ | 13 | |
| |
These leases have various expiration dates ranging from 2005 to 2010. Certain leases contain renewal options up to 10 years.
(b) Capital commitments
The Company has entered into non-cancellable contracts primarily for the purchase of land and a building in Singapore, which totalled £278 at July 31, 2005.
(c) Litigation
From time to time, the Company has been party to various legal proceedings arising in the normal course of business. In the opinion of the Company's directors there are currently no proceedings which, if determined adversely against the Company, would have a material effect on the Company's balance sheet, profit and loss account or cash flows.
F-117
9. Related party transactions
The debtor and creditor balances as a result of transactions with Murray Group companies are as follows at July 31:
|
| | Debtors
| | Creditors
|
|---|
| | 2005
| | 2004
| | 2005
| | 2004
|
|---|
|
| Forth Steel Limited | | £ | 645 | | £ | 376 | | | 105 | | | 3 |
| Charlotte Ventures Energy Limited | | | 375 | | | — | | | — | | | — |
| Murray Group Management Limited | | | 156 | | | 84 | | | 2,487 | | | 2,393 |
| Northern Steel Stocks Limited | | | 195 | | | 6 | | | — | | | 2 |
| Premier Alloys Limited | | | 28 | | | 20 | | | 9 | | | 5 |
| Austin Trumanns Steel Limited | | | — | | | 4 | | | 37 | | | 11 |
| Ireland Alloys Limited | | | 500 | | | — | | | — | | | — |
| Other | | | 19 | | | 6 | | | 1 | | | 4 |
| | |
|
| | | £ | 1,918 | | £ | 496 | | £ | 2,639 | | £ | 2,418 |
|
Trade sales and purchases
The Company trades with Murray Group companies in the normal course of business. Sales to these companies were as follows for the six months ended July 31:
|
| | 2005
| | 2004
|
|---|
|
| Forth Steel Limited | | £ | 993 | | £ | 488 |
| Premier Alloys Limited and other | | | 2 | | | 14 |
| | |
|
| | | £ | 995 | | £ | 502 |
|
Purchases from Murray Group companies were as follows for the six months ended July 31:
|
| | 2005
| | 2004
|
|---|
|
| Forth Steel Limited | | | 213 | | | 96 |
| Premier Alloys Limited | | | 54 | | | 34 |
| Northern Steel Stocks Limited | | | 6 | | | 105 |
| Austin Trumanns Steel Limited | | | 84 | | | 53 |
| | |
|
| | | £ | 357 | | £ | 288 |
|
Intercompany recharges
The Company also uses the resources and processes of Murray Group Management Limited (MGM), Carnegie Systems Management Limited (CSM) and the Rangers Football Plc Club (Rangers) as described below. There are no formal agreements governing provision of services among the Murray Group companies or the method of payment for the services except for CSM.
Some expenses incurred by the Company are allocated to companies in the Murray Group, based on management's estimate of resources used, including management fees, information technology and advertising and entertainment.
F-118
Total charges from Murray Group companies were as follows for the six month periods ended July 31:
|
| | 2005
| | 2004
|
|---|
|
| MGM (management fees) | | £ | 374 | | £ | 384 |
| CSM (information technology) | | | 153 | | | 101 |
| Rangers (advertising and entertainment) | | | 31 | | | 29 |
| | |
|
| | | £ | 558 | | £ | 514 |
|
Total recharges to Murray Group companies were as follows for the six month periods ended July 31:
|
| | 2005
| | 2004
|
|---|
|
| Forth Steel Limited | | £ | 32 | | £ | 32 |
| Northern Steel Stocks Limited | | | 23 | | | 21 |
| MGSH Limited | | | 14 | | | 17 |
| Premier Alloys Limited | | | 156 | | | 148 |
| Other | | | 11 | | | 12 |
| | |
|
| | | £ | 236 | | £ | 230 |
|
Management fees—MGM, a wholly-owned subsidiary of MIH, provides, and arranges third party agents to provide, certain corporate services, on a non-exclusive basis. These services primarily consist of the following types of services, which are charged as follows:
- •
- The Company's turnover relative to other subsidiaries of MIH, for legal, tax, and accounting, management, office and facilities;
- •
- A pro rata allocation of headcount for the Company as regards human resource services; and
- •
- A pro rata allocation of the Company's indebtedness as regards the funding charges.
Recharges from MGM for these services totalled £256 and £243 for the six months ended July 31, 2005 and 2004, respectively. MIH also charges the Company for other miscellaneous charges. Management fees are paid monthly.
Information technology—CSM provides information systems and network engineering to the Company. Fees for these services are generally estimated and paid quarterly, with an annual make whole payment for any outstanding amounts.
Advertising and entertainment
Purchases from Rangers Football Club Limited are in respect of advertising and entertaining. A portion of these costs were recharged to other companies in the Murray Group, leaving costs of £15 and £15 for the respective six month periods.
F-119
HR and accounting function
The Company provided human resource services and accounting functions to a number of Murray Group Companies. Charges for these services were £128 and £122 for the six months ended July 31, 2005 and 2004, respectively.
Fees for these services are generally estimated and paid quarterly, with an annual make whole payment for any outstanding amounts.
Rental income
The Company charges CSM and Premier Alloys Limited for use of, and rates related to, office and warehouse premises. These charges were £90 and £83 for the six months ended July 31, 2005 and 2004, respectively.
Other
The Company's banking facilities are arranged centrally for the whole Murray Group and the costs of arrangement are recharged through the MGM charge detailed above. These facility fees are recharged on a percentage of indebtedness basis.
The Company has also entered into an agreement to guarantee the outstanding balances of MIH with the Bank of Scotland—see note 7 for further details of the guarantees provided by the Company.
The parent company, MIH, maintains property, business interruption, general liability and related insurance coverage for the MIH group of companies for which the Company is a named party. Charges for this insurance were £95 and £119 for the six month periods ended July 31, 2005 and 2004, respectively.
The Company provides housing for directors of the Company outside the UK. This amounted to £32 and £33 for the six months ended July 31, 2005 and 2004, respectively.
The Company transferred a funding balance of £500 to Ireland Alloys Limited during the six months ended July 31 2005. This is repayable within one year or on demand. At July 31, 2005, a balance of £375 is due from Charlotte Ventures Energy Limited in relation to a funding loan which is repayable within one year or on demand.
10. Subsequent events (unaudited)
On May 18, 2005, Jefferies Capital Partners ("JCP") entered into a letter of intent with MIH to acquire all of the equity interests of the Company. In addition, MIH and the Company agreed in principle to sell to Edgen Carbon Products Group, L.L.C., a wholly-owned subsidiary of Edgen Corporation ("Edgen") all of the equity interests of the Company's US subsidiary, MIM US. On November 30, 2005, JCP through a newly established holding company, Pipe Acquisition Limited ("Pipe"), entered into a sale and purchase agreement with MIH and certain other persons, pursuant to which Pipe agreed to purchase all of the outstanding shares of the Company from its shareholders for an aggregate purchase price of approximately £87,000. On the same date, Edgen entered into a sale and purchase agreement with the Company and certain other persons pursuant to which Edgen agreed
F-120
to purchase all of the outstanding capital stock of MIM US for an aggregate purchase price of approximately £12,000 plus certain agreed dividends.
The acquisition of the Company and the acquisition of MIM US by Edgen will be funded with the proceeds of a $130,000 high yield debt offering by Pipe Acquisition Finance Plc, a majority owned subsidiary of Pipe, the issuance and sale by Edgen of $31,000 97/8% senior secured notes due 2011, equity investments by funds managed by JCP and certain members of MIM Ltd. and Edgen management.
11. Reconciliation to accounting principles in the United States
The Company's consolidated financial statements have been prepared in accordance with UK GAAP, which differs in certain respects from US GAAP. Such differences involve methods for measuring the amounts in the consolidated financial statements, as well as additional disclosures required by US GAAP. The differences between UK GAAP and US GAAP applicable to the Company are quantified and described below.
Reconciliation of profit for the period
The effects of the application of US GAAP on profit are as follows for the periods ended July 31:
| |
in thousands
| | Notes
| | 2005
| | 2004
| |
|---|
| |
| Profit for the financial period under UK GAAP | | | | £ | 7,480 | | £ | 6,358 | |
| Derivative financial instruments | | (a) | | | 32 | | | (175 | ) |
| Software development costs | | (b) | | | (65 | ) | | (20 | ) |
| Deferred taxes | | (c) | | | 46 | | | 47 | |
| Tax impact of US GAAP adjustments | | (d) | | | 10 | | | 58 | |
| | | | |
| |
| Net income under US GAAP | | | | £ | 7,503 | | £ | 6,268 | |
| |
Reconciliation of shareholders' funds
The effects of the application of US GAAP on shareholders' funds are as follows at July 31:
| |
(in thousands)
| | Notes
| | 2005
| |
|---|
| |
| Equity shareholders' funds under UK GAAP | | | | £ | 46,752 | |
| Derivative financial instruments | | (a) | | | 8 | |
| Software development costs | | (b) | | | 68 | |
| Deferred taxes | | (c) | | | (1,621 | ) |
| Tax impact of US GAAP adjustments | | (d) | | | (23 | ) |
| | | | |
| |
| Shareholders' equity under US GAAP | | | | £ | 45,184 | |
| |
(a) Derivative financial instruments
During the normal course of business, the Company is exposed to foreign currency risk. These risks can create volatility in earnings and cash flows from year to year, and hence the company uses derivative financial instruments to reduce exposure to foreign currency movements on foreign currency purchases and sales.
F-121
Under UK GAAP, the Company applies hedge accounting and does not separately record its derivative instruments on the balance sheet at fair value. Accordingly, commercial activities denominated in foreign currencies are recorded in sterling at actual exchange rates at the date of the transaction or at the contracted rate if the transaction is covered by a forward exchange contract. Monetary assets and liabilities denominated in foreign currencies at year end are reported at the rates of exchange prevailing at the year end, or if hedged at the appropriate hedged rate. Where the Company enters into forward contracts which are not linked to a trade or where the underlying transaction has been settled, a gain or loss will arise during the period from inception to maturity of the underlying transaction. The realized fair value is recorded at each balance sheet date. When the Company enters into sale and purchase contracts in foreign currencies these contracts are not always denominated in the functional currency of either party to the transaction. This results in an embedded derivative as there is an implicit forward purchase or sale of that currency. The fair value of these embedded derivatives is not recognised under UK GAAP.
Under US GAAP, monetary assets and liabilities denominated in foreign currencies at year end are reported at the rates of exchange prevailing at the balance sheet date and all derivatives, whether designated in a hedging relationship or not, are carried at fair value on the balance sheet. The Company has not designated any of its derivative instruments as qualifying hedge instruments under SFAS 133 "Accounting for Derivative Instruments and Hedging Activities". Accordingly all gains and losses arising from changes in the fair value of derivatives and embedded derivatives are charged or credited in determining net income under US GAAP.
The fair value of derivatives outstanding at July 31, 2005 was a liability of £68.
(b) Software development costs
Under UK GAAP, software development costs are written off to the profit and loss account as they are incurred.
Under US GAAP, certain internal and external costs incurred to acquire or create internal use software are capitalized in accordance with AICPA Statement of Position 98-1, "Accounting for the Costs of Computer Software Developed or Obtained for Internal Use." Capitalized software is included in property, plant and equipment and is depreciated over three years when development is complete.
(c) Deferred taxes
Under UK GAAP, the Company accounts for taxes in accordance with FRS 19,Deferred Taxes (FRS 19) while under US GAAP, the Company accounts for taxes in accordance with SFAS 109,Accounting for Income Taxes (SFAS 109). The differences between these standards that have an impact on the Company are as follows:
Under UK GAAP, a capital gain has been rolled over into the tax base cost of fixed assets, which gives rise to a temporary difference. This gain has not been recognised as a deferred tax liability as FRS 19 only requires recognition where there is a binding contract to sell the fixed asset that has a reduced base cost as a result of the gain being rolled over, and a taxable gain is expected to arise. Under US GAAP, a deferred tax liability is recognised for this item pursuant to SFAS 109.
Under UK GAAP, deferred tax liabilities on unremitted earnings of subsidiaries are only permitted to be recognised when the dividends have been accrued, or when there is a binding agreement to
F-122
distribute past earnings. Under US GAAP, deferred tax liabilities on unremitted earnings of subsidiaries are recorded where such earnings are not considered to be permanently invested in subsidiaries.
(d) Tax impact of US GAAP adjustments
This adjustment reflects the effect of providing for the applicable effective tax rate on relevant US GAAP adjustments.
(e) Cash flow statements
The consolidated cash flow statements have been prepared under UK GAAP in accordance with FRS 1,Cash flow statement, (revised) (FRS 1) and presents substantially the same information as required under Statement of Financial Accounting Standards (SFAS) 95,Statements of Cash Flows (SFAS 95). There are certain differences between FRS 1 (revised) and SFAS 95 with regard to classification of items within the cash flow statement.
In accordance with FRS 1, cash flows are prepared separately for operating activities, returns on investments and servicing of finance, taxation, capital expenditure and financial investment, acquisitions and disposals, equity dividends paid, management of liquid resources and financing. Under SFAS 95, cash flows are classified under operating activities, investing activities and financing activities. Under FRS 1, cash is defined as cash in hand and deposits repayable on demand, less overdrafts repayable on demand. Under SFAS 95, cash and cash equivalents are defined as cash and investments with original maturities of three months or less.
F-123
A reconciliation between the consolidated statements of cash flows presented based on UK GAAP measurement principles using US GAAP disclosures and presentational principles, is shown below for the periods ended July 31:
| |
in thousands
| | 2005
| | 2004
| |
|---|
| |
| Operating activities: | | | | | | | |
| Net cash (outflow)/inflow from operating activities (UK GAAP) | | £ | (2,968 | ) | £ | 159 | |
| Net cash outflow from returns on investments and servicing of finance | | | (235 | ) | | (138 | ) |
| Taxation | | | (3,675 | ) | | (2,472 | ) |
| | |
| |
| Net cash used by operating activities (US GAAP) | | | (6,878 | ) | | (2,451 | ) |
Investing activities: |
|
|
|
|
|
|
|
| Net cash outflow from capital expenditure and financial investment | | | (1,163 | ) | | (1,115 | ) |
| | |
| |
| Net cash used in investing activities (US GAAP) | | | (1,163 | ) | | (1,115 | ) |
Financing activities: |
|
|
|
|
|
|
|
| Cash inflow/(outflow) from financing (UK GAAP) | | | 1,567 | | | (298 | ) |
| Dividends paid to minority interests | | | (118 | ) | | (26 | ) |
| Equity dividends paid | | | (4,933 | ) | | (2,148 | ) |
| Increase in bank overdrafts | | | 12,858 | | | 7,050 | |
| | |
| |
| Net cash provided by/(used in) financing activities (US GAAP) | | | 9,374 | | | 4,578 | |
| | |
| |
| Effect of exchange rate changes on cash | | | 1,133 | | | (77 | ) |
| | |
| |
| Net increase/(decrease) in cash and cash equivalents under US GAAP | | | 2,466 | | | 935 | |
| Cash and cash equivalents under US GAAP at beginning of period | | | 3,735 | | | 2,874 | |
| | |
| |
| Cash and cash equivalents under US GAAP at end of period | | £ | 6,201 | | £ | 3,809 | |
| |
(f) Financial statement presentation
Consolidated balance sheet presentation
The balance sheet prepared in accordance with UK GAAP differs in certain respects from US GAAP. Under UK GAAP, current assets are netted against current liabilities in the balance sheet whereas US GAAP requires the separate presentation of total assets and total liabilities. In addition, current assets under UK GAAP include amounts that fall due after more than one year. Under US GAAP, such assets would be reclassified as non-current assets.
Recent accounting pronouncements
In November 2004, the Financial Accounting Standards Board (FASB) issued SFAS 151,Inventory Costs (SFAS 151), to clarify that abnormal amounts of idle facility expense, freight, handling costs and wasted materials (spoilage) should be recognised as current period charges. In addition, SFAS 151 requires that the allocation of fixed production overheads to inventory values be based on the normal capacity of the production facilities. SFAS 151 is effective for costs incurred in respect of inventories for reporting periods beginning after June 15, 2005. The adoption of SFAS 151 is not expected to have a material effect on the results or net assets of the Company.
F-124
In December 2004, the FASB issued SFAS 153,Exchanges of Nonmonetary Assets on Amendment of Accounting Principles Board (APB) 29 (APB 29) (SFAS 153), which, for periods beginning after June 15, 2005, no longer allows the exemption included in APB 29 which permitted certain non-monetary exchanges of similar productive assets to be accounted for at book value with no gain or loss being recognised. Under SFAS 153 such non-monetary transactions have to be accounted for at fair value, recognising any gain or loss, if the transaction meets a commercial substance criterion and the fair value is determinable. SFAS 153 did not affect the guidance in APB 29 for non-monetary exchanges of inventory. The adoption of SFAS 153 is not expected to have a material effect on the results or net assets of the Company.
In December 2004, the FASB issued SFAS 123(R),Share-Based Payment (SFAS 123(R)), which is a revision of SFAS 123,Accounting for Stock-Based Compensation and supersedes APB Opinion 25,Accounting for Stock Issued to Employees. Generally the valuation methods contained in SFAS 123(R) are similar to those in SFAS 123, but SFAS 123(R) requires all share based payments to employees, including grants of employee share options, to be charged to the statement of income. Pro forma disclosure is no longer an alternative. With limited exceptions, the amount charged to the statement of income for share options will be measured based on the grant date fair value of the option amortised over the period to the date of vesting of the award. SFAS 123(R) is effective for annual reporting periods beginning after June 15, 2005. The adoption of SFAS 123(R) is not expected to have a material effect on the results or net assets of the Company.
In May 2005, the FASB issued SFAS 154,Accounting Changes and Error Corrections (SFAS 154), which is effective for periods beginning after December 15, 2005. This statement replaces APB Opinion 20,Accounting Changes (APB 20) and SFAS 3,Reporting Accounting Changes in Interim Financial Statements. APB 20 previously required that most voluntary changes in accounting principle be recognised by including, in net income of the period of the change, the cumulative effect of changing to the new accounting principle. SFAS 154 requires retrospective application to prior periods' financial statements of changes in accounting principle, unless it is impracticable to determine either the period specific effects or the cumulative effect of the change. The adoption of SFAS 154 is not expected to have a material effect on the results or net assets of the Company.
F-125
American Depositary Shares
Representing
Ordinary Shares
Prospectus
| JPMORGAN | | LEHMAN BROTHERS | | JEFFERIES & COMPANY |
| MORGAN KEEGAN & COMPANY, INC. | STIFEL NICOLAUS |
, 2006
Part II
Information not required in a prospectus
Item 13.Other expenses of issuance and distribution
The following table sets forth the fees and expenses, payable by the Registrant in connection with the issuance and distribution of the securities being registered hereunder. All amounts shown are estimates except for the SEC registration fee and the NASD filing.
|
| SEC registration fee | | $ | 21,400 |
| NASD fee | | | |
| Legal fees and expenses | | | |
| Printing and engraving expenses | | | |
| Blue sky fees | | | |
| NYSE fees | | | |
| Transfer agent fees | | | |
| Accounting fees and expenses | | | |
| Miscellaneous | | | |
| | |
|
| Total | | $ | |
|
- *
- To be provided by amendment.
Item 14.Indemnification of directors and officers
Our articles of association provide that, subject to the UK Companies Act 1985 and every other statute, statutory instrument, regulation or order for the time being in force concerning companies registered under the UK Companies Act 1985, every director or other officer (excluding an auditor) of the Company shall be indemnified out of the assets of the Company against all liabilities incurred by him in the actual or purported execution or discharge of his duties or the exercise or purported exercise of his or otherwise in relation to or in connection with his duties, powers or office. However, the indemnity shall not apply to any liability to the extent that it is recovered from any other person and is subject to such officer taking all reasonable steps to effect such recovery, to the intent that the indemnity shall not apply where an alternative right of recovery is available and capable of being enforced.
The Articles provide that the registrant may obtain insurance of the registrant's expense to any person who is or was an officer, director or employee against liability and expenses whether or not such liability or expenses would be indemnified by the registrant under its articles. The registrant intends to enter into indemnification agreements with its directors and officers.
The underwriting agreement provides that the underwriters are obligated, under certain circumstances, to indemnify our directors, officers and controlling persons against certain liabilities, including liabilities under the Securities Act. Reference is made to the form of underwriting agreement filed as Exhibit 1.1 hereto.
Reference is made to Item 17 for our undertakings with respect to indemnification for liabilities arising under the Securities Act.
Item 15.Recent sales of unregistered securities
In connection with its initial incorporation on November 2, 2006, the registrant issued one ordinary share to each of two subscribers, one of whom is Edgen/Murray, L.P. On the same date, Edgen/Murray,
II-1
L.P. applied for the allotment to it of 49,998 ordinary shares against its irrevocable undertaking to pay up a quarter of the nominal value of the alloted shares on February 28, 2007 or on later demand by Edgen Murray Plc in consideration for Edgen Murray Plc's agreement to include its name in the Register of Members prior to the Contribution. These additional 49,998 shares will be cancelled in connection with the Contribution, described below. The issuance of shares in connection with our incorporation were made in reliance on the exemption from registration under Section 4(2) of the Securities Act.
The contribution was approved by the General Partner of Edgen/Murray, L.P. and by the board of directors of Edgen Murray Plc prior to the filing of this Registration Statement.
Edgen/Murray, L.P. will contribute all of its assets to Edgen Murray Plc in exchange for ordinary and preference shares (collectively, the "Contribution"). The preference shares to be issued by Edgen Murray Plc will have a liquidation preference in an amount equal to the accrued liquidation preference with respect to all outstanding preferred partnership interests of Edgen/Murray, L.P. The only assets of Edgen Murray Plc will be the funds received in connection with its formation and the assets received in the Contribution. The ordinary and preference shares issued by Edgen Murray Plc in connection with the Contribution (collectively, the "Contribution Shares"), together with the ordinary shares issued as part of Edgen Murray Plc's initial incorporation, will constitute the entire share capital of Edgen Murray Plc prior to consummation of this offering. The decision as to the investment and value of the Contribution Shares to be issued in the Contribution will have been made by the General Partner of Edgen/Murray L.P. and the Board of Directors of Edgen Murray Plc, with the exact number of Contribution Shares to be determined by reference to the price range of the ordinary shares (and ADSs) to be issued in connection with this offering. The issuance of Contribution Shares would be on reliance on the exemption from registration under Section 4(2) of the Securities Act.
The deposit of ordinary shares sold in this offering and the issuance of ADR against such transactions will be registered on a registration statement on Form F-6. Edgen Murray Plc may establish a separate restricted ADR facility whereby holders of restricted ordinary shares would be able to make deposits against delivery of restricted ADRs. Any such restricted ADRs will be in certificated form bearing a restrictive legend and will not be permitted to be transferred to the unrestricted ADR facility unless the shares represented such restricted ADRs are registered or are eligible for transfer under Rule 144 or Regulation S and otherwise in accordance with applicable US federal securities laws.
Item 16.Exhibits and Financial Statement Schedule
- (a)
- Exhibits
Exhibit Number
| | Description
|
|---|
| 1.1 | | Form of Underwriting Agreement.** |
2.1 |
|
Stock Purchase Agreement, dated as of December 31, 2004, by and among Edgen Acquisition Corp., Edgen Corporation, the shareholders of Edgen Corporation parties thereto, and Harvest Partners III, L.P (incorporated by reference to Exhibit 2.1 of Edgen Corporation's Form S-4 dated May 2, 2005 filed with the SEC on May 2, 2005 (File No. 333-124543)). |
2.2 |
|
Agreement for the Sale and Purchase of Shares in Murray International Metals Limited, dated November 30, 2005, by and among the Sellers party thereto, Pipe Acquisition Limited, Murray International Holdings Limited and Edgen Carbon Products Group, LLC.* |
| | | |
II-2
2.3 |
|
Agreement for the Sale and Purchase of Stock in Murray International Metals Inc., dated November 30, 2005, by and between Edgen Carbon Products Group, LLC and Murray International Metals Limited.* |
3.1 |
|
Articles of Association of Edgen Murray Plc.* |
3.2 |
|
Memorandum of Association of Edgen Murray Plc.* |
4.1 |
|
Indenture, dated as of February 1, 2005, by and between Edgen Corporation (as successor in interest to Edgen Acquisition Corp.) and The Bank of New York, as trustee and collateral agent (incorporated by reference to Exhibit 4.1 of Edgen Corporation's Form S-4 dated May 2, 2005 filed with the SEC on May 2, 2005 (File No. 333-124543)). |
4.2 |
|
Indenture, dated as of December 16, 2005, by and among Pipe Acquisition Finance Plc, Pipe Acquisition Limited, Murray International Metals Limited and The Bank of New York.* |
4.3 |
|
Supplemental Indenture, dated as of February 1, 2005, by and among Edgen Corporation, Edgen Louisiana Corporation, Edgen Alloy Products Group, L.L.C., Edgen Carbon Products Group, L.L.C. and The Bank of New York, as trustee and collateral agent (incorporated by reference to Exhibit 4.2 of Edgen Corporation's Form S-4 dated May 2, 2005 filed with the SEC on May 2, 2005 (File No. 333-124543)). |
4.4 |
|
Second Supplemental Indenture, dated as of December 16, 2005, by and among Edgen Corporation, Edgen Louisiana Corporation, Edgen Alloy Products Group, L.L.C., Edgen Carbon Products Group, L.L.C., Murray International Metals, Inc. and The Bank of New York, as trustee and collateral agent (incorporated by reference to Exhibit 99.2 of Edgen Corporation's Form 8-K dated December 21, 2005 filed with the SEC on December 21, 2005 (File No. 000-1318246)). |
4.5 |
|
Supplemental Indenture, dated as of January 25, 2006, by and among Murray International Metals Pte. Limited, Pipe Acquisition Finance Plc, Pipe Acquisition Limited, Murray International Metals Limited and The Bank of New York.* |
4.6 |
|
Debenture, dated as of December 16, 2005, by and among Pipe Acquisition Finance Plc, Pipe Acquisition Limited, Murray International Metals Limited and The Bank of New York.* |
4.7 |
|
Debenture, dated as of January 25, 2006, by and among Pipe Acquisition Finance Plc, Murray International Metals Pte. Limited and The Bank of New York.* |
4.8 |
|
Security Agreement, dated as of February 1, 2005, by and among Edgen Corporation, Edgen Louisiana Corporation, Edgen Alloy Products Group, L.L.C., Edgen Carbon Products Group, L.L.C. and The Bank of New York, as collateral agent (incorporated by reference to Exhibit 4.3 of Edgen Corporation's Form S-4 dated May 2, 2005 filed with the SEC on May 2, 2005 (File No. 333-124543)). |
4.9 |
|
Form of 97/8% Senior Secured Notes due 2011 (included in Exhibit 4.1). |
4.10 |
|
Form of Senior Secured Floating Rate Notes due 2010 (included in Exhibit 4.2). |
5.1 |
|
Form of Opinion of Dechert LLP.** |
| | | |
II-3
10.1 |
|
Purchase Agreement, dated December 7, 2005, by and between Edgen Corporation, Edgen Louisiana Corporation, Edgen Alloy Products Group, L.L.C., Edgen Carbon Products Group, L.L.C., Murray International Metals, Inc. and Jefferies & Company, Inc., as initial purchaser (incorporated by reference to Exhibit 99.1 of Edgen Corporation's Form 8-K dated December 1, 2005 filed with the SEC on December 1, 2005 (File No. 333-124543)). |
10.2 |
|
Purchase Agreement, dated December 13, 2005, by and among Pipe Acquisition Finance Plc, Pipe Acquisition Limited, Murray International Metals Limited, Murray International Metals Pte. Limited and Jefferies & Company, Inc., as initial purchaser.* |
10.3 |
|
Registration Rights Agreement, dated as of December 16, 2005, by and among Pipe Acquisition Finance Plc, Pipe Acquisition Limited, Murray International Metals Limited, Murray International Metals Pte. Limited and Jefferies & Company, Inc.* |
10.4 |
|
Working Capital Facility, dated as of December 16, 2005, by and among Pipe Acquisition Limited, certain Subsidiaries of Pipe Acquisition Limited, the lenders party thereto and The Governor and Company of The Bank of Scotland, as administrative agent.* |
10.5 |
|
Accession Letter to Working Capital Facility, dated January 25, 2006, by Murray International Metals Pte. Limited.* |
10.6 |
|
Senior Intercreditor Agreement, dated as of December 16, 2005, by and among Pipe Acquisition Finance Plc, Pipe Acquisition Limited, Murray International Metals Limited, The Governor and the Company of The Bank of Scotland and The Bank of New York.* |
10.7 |
|
Deed of Accession to Senior Intercreditor Agreement, dated as of January 25, 2006, by Murray International Metals Pte. Limited.* |
10.8 |
|
Amended and Restated Loan and Security Agreement, dated February 1, 2005, among Edgen Carbon Products Group and L.L.C., Edgen Alloy Products Group, L.L.C., as borrowers, Edgen Corporation and Edgen Louisiana Corporation, as guarantors, the financial institutions party thereto, as lenders, and GMAC Commercial Finance LLC, as agent for the lenders (incorporated by reference to Exhibit 10.4 of Edgen Corporation's Form S-4 dated May 2, 2005 filed with the SEC on May 2, 2005 (File No. 333-124543) ). |
10.9 |
|
Intercreditor Agreement, dated as of February 1, 2005, by and between GMAC Commercial Finance LLC, as agent, and The Bank of New York, as trustee, as acknowledged and agreed to by Edgen Corporation, Edgen Louisiana Corporation, Edgen Alloy Products Group, L.L.C. and Edgen Carbon Products Group (incorporated by reference to Exhibit 10.3 of Edgen Corporation's Form S-4 dated May 2, 2005 filed with the SEC on May 2, 2005 (File No. 333-124543)). |
10.10 |
|
Joinder and Amendment No. 1, dated December 16, 2005, by and among Edgen Corporation, Murray International Metals, Inc. and the other Guarantors named therein and GMAC Commercial Finance LLC (incorporated by reference to Exhibit 99.4 of Edgen Corporation's Form 8-K dated December 21, 2005 filed with the SEC on December 21, 2005 (File No. 333-124543)). |
| | | |
II-4
10.11 |
|
Amended and Restated Employment Agreement, dated as of January 1, 2005, by and between Daniel J. O'Leary, Edgen Louisiana Corporation and Edgen Corporation (incorporated by reference to Exhibit 10.5 of Edgen Corporation's Form S-4 dated May 2, 2005 filed with the SEC on May 2, 2005 (File No. 333-124543)). |
10.12 |
|
Amended and Restated Employment Agreement, dated as of January 1, 2005, by and between David L. Laxton, III, Edgen Louisiana Corporation and Edgen Corporation (incorporated by reference to Exhibit 10.6 of Edgen Corporation's Form S-4 dated May 2, 2005 filed with the SEC on May 2, 2005 (File No. 333-124543)). |
10.13 |
|
Service Agreement, dated December 16, 2005, by and between Murray International Metals Limited and Kenneth Cockburn.* |
10.14 |
|
Employment Agreement, dated as of January 1, 2004, by and among Robert L. Gilleland, Edgen Alloy Products Group, L.L.C., and Edgen Corporation (incorporated by reference to Exhibit 10.11 of Edgen Corporation's Annual Report on Form 10-K for the fiscal year ended December 31, 2005 filed with the SEC on April 3, 2006 (File No. 333-124543)). |
10.15 |
|
Amended and Restated Employment Agreement, dated as of April 30, 2004, by and between Craig S. Kiefer, Edgen Carbon Products Group, L.L.C., and Edgen Corporation (incorporated by reference to Exhibit 10.12 of Edgen Corporation's Annual Report on Form 10-K for the fiscal year ended December 31, 2005 filed with the SEC on April 3, 2006 (File No. 333-124543)). |
10.16 |
|
Lease Agreement, dated as of December 16, 2005, by and among MIM Ltd. and Steels (U.K.) QRS 16 58, Inc.* |
10.17 |
|
Lease Guarantee, dated January 25, 2006, by and among Murray International Metals Pte. Limited and Murray International Metals Ltd.* |
10.18 |
|
Sale and Purchase Agreement, dated February 21, 2004, by and among Tuas Hi-Tech Park Pte. Ltd. and Murray International Metals Pte. Limited.* |
10.19 |
|
Land Lease, dated May 15, 1999, by and among The Government of Dubai and Murray International Metals Limited operating as Murray International Metals Middle East.* |
10.20 |
|
Edgen/Murray, L.P. Incentive Plan (For Edgen Corporation and its Subsidiaries) (incorporated by reference to Exhibit 10.10 of Edgen Corporation's Annual Report on Form 10-K for the fiscal year ended December 31, 2005 filed with the SEC on April 3, 2006 (File No. 333-124543)). |
10.21 |
|
Edgen/Murray, L.P. Incentive Plan (For Pipe Acquisition Limited and its Subsidiaries), adopted March 28, 2006.* |
21.1 |
|
List of Subsidiaries of the Registrant.** |
23.1 |
|
Consent of Dechert LLP (incorporated by reference to Exhibit 5.1).* |
23.2 |
|
Consent of Deloitte & Touche LLP.* |
23.3 |
|
Consent of Deloitte & Touche LLP.* |
| | | |
II-5
24.1 |
|
Powers of Attorney for Edgen Murray Plc.* |
- *
- Filed herewith.
- **
- To be filed by amendment.
- (b)
- Financial statement schedules.
All schedules are omitted because the required information is inapplicable or the information is presented in the Consolidated Financial Statements or related notes.
Item 17.Undertakings
The undersigned registrant hereby undertakes to provide to the underwriters at the closing specified in the underwriting agreement certificates in such denominations and registered in such names as required by the underwriters to permit prompt delivery to each purchaser.
Insofar as indemnification for liabilities arising under the Securities Act of 1933 may be permitted to directors, officers and controlling persons of the registrant pursuant to the foregoing provisions, or otherwise, the registrant has been advised that in the opinion of the Securities and Exchange Commission such indemnification is against public policy as expressed in the Securities Act of 1933 and is, therefore, unenforceable. In the event that a claim for indemnification against such liabilities (other than the payment by the registrant of expenses incurred or paid by a director, officer or controlling person of the registrant in the successful defense of any action, suit or proceeding) is asserted by such director, officer or controlling person in connection with the securities being registered, the registrant will, unless in the opinion of its counsel the matter has been settled by controlling precedent, submit to a court of appropriate jurisdiction the question whether such indemnification by it is against public policy as expressed in the Securities Act of 1933 and will be governed by the final adjudication of such issue.
The undersigned registrant hereby undertakes that:
- (1)
- For purposes of determining any liability under the Securities Act of 1933, the information omitted from the form of prospectus filed as part of this registration statement in reliance upon Rule 430A and contained in a form of prospectus filed by the registrant pursuant to Rule 424(b)(1) or (4) or 497(h) under the Securities Act shall be deemed to be part of this registration statement as of the time it was declared effective.
- (2)
- For the purpose of determining any liability under the Securities Act of 1933, each post-effective amendment that contains a form of prospectus shall be deemed to be a new registration statement relating to the securities offered therein, and the offering of such securities at that time shall be deemed to be the initial bona fide offering thereof.
II-6
Signatures
Pursuant to the requirements of the Securities Act of 1933, the registrant certifies that it has reasonable grounds to believe that it meets all of the requirements for filing on Form S-1 and has duly caused this registration statement to be signed on its behalf by the undersigned, thereunto duly authorized, in Baton Rouge, Louisiana on November 9, 2006.
| | | EDGEN MURRAY PLC |
|
|
By: |
/s/ DANIEL J. O'LEARY |
| | | |
Name: Daniel J. O'Leary
Title: Chairman, President, Chief Executive Officer and Director
|
Pursuant to the requirements of the US Securities Act of 1933, this registration statement has been signed by the following persons in the capacities and on the dates indicated.
|
Signature
| | Title
| | Date
|
|---|
|
|
|
|
|
|
/s/ DANIEL J. O'LEARY
Daniel J. O'Leary |
|
Chairman, President, Chief Executive Officer and Director
(Principal Executive Officer) |
|
November 9, 2006 |
/s/ DAVID L. LAXTON, III
David L. Laxton, III |
|
Executive Vice President and Chief Financial Officer
(Principal Financial Officer and Principal Accounting Officer) |
|
November 9, 2006 |
/s/ NICHOLAS DARAVIRAS
Nicholas Daraviras |
|
Director |
|
November 9, 2006 |
/s/ JAMES L. LUIKART
James L. Luikart |
|
Director |
|
November 9, 2006 |
/s/ EDWARD J. DIPAOLO
Edward J. DiPaolo |
|
Director |
|
November 9, 2006 |
II-7
Authorized representative in the United States:
Pursuant to the requirements of the US Securities Act of 1933, as amended, Edgen Murray Plc has duly caused this registration statement to be signed by the following duly authorized representative in the United States:
| November 9, 2006 | | |
By: |
/s/ DAVID L. LAXTON, III |
|
|
| |
Name: David L. Laxton, III
Title: Executive Vice President and Chief Financial Officer
| | |
II-8
Index of exhibits
- (a)
- Exhibits
| 1.1 | | Form of Underwriting Agreement.** |
2.1 |
|
Stock Purchase Agreement, dated as of December 31, 2004, by and among Edgen Acquisition Corp., Edgen Corporation, the shareholders of Edgen Corporation parties thereto, and Harvest Partners III, L.P (incorporated by reference to Exhibit 2.1 of Edgen Corporation's Form S-4 dated May 2, 2005 filed with the SEC on May 2, 2005 (File No. 333-124543)). |
2.2 |
|
Agreement for the Sale and Purchase of Shares in Murray International Metals Limited, dated November 30, 2005, by and among the Sellers party thereto, Pipe Acquisition Limited, Murray International Holdings Limited and Edgen Carbon Products Group, LLC.* |
2.3 |
|
Agreement for the Sale and Purchase of Stock in Murray International Metals Inc., dated November 30, 2005, by and between Edgen Carbon Products Group, LLC and Murray International Metals Limited.* |
3.1 |
|
Articles of Association of Edgen Murray Plc.* |
3.2 |
|
Memorandum of Association of Edgen Murray Plc.* |
4.1 |
|
Indenture, dated as of February 1, 2005, by and between Edgen Corporation (as successor in interest to Edgen Acquisition Corp.) and The Bank of New York, as trustee and collateral agent (incorporated by reference to Exhibit 4.1 of Edgen Corporation's Form S-4 dated May 2, 2005 filed with the SEC on May 2, 2005 (File No. 333-124543)). |
4.2 |
|
Indenture, dated as of December 16, 2005, by and among Pipe Acquisition Finance Plc, Pipe Acquisition Limited, Murray International Metals Limited and The Bank of New York.* |
4.3 |
|
Supplemental Indenture, dated as of February 1, 2005, by and among Edgen Corporation, Edgen Louisiana Corporation, Edgen Alloy Products Group, L.L.C., Edgen Carbon Products Group, L.L.C. and The Bank of New York, as trustee and collateral agent (incorporated by reference to Exhibit 4.2 of Edgen Corporation's Form S-4 dated May 2, 2005 filed with the SEC on May 2, 2005 (File No. 333-124543)). |
4.4 |
|
Second Supplemental Indenture, dated as of December 16, 2005, by and among Edgen Corporation, Edgen Louisiana Corporation, Edgen Alloy Products Group, L.L.C., Edgen Carbon Products Group, L.L.C., Murray International Metals, Inc. and The Bank of New York, as trustee and collateral agent (incorporated by reference to Exhibit 99.2 of Edgen Corporation's Form 8-K dated December 21, 2005 filed with the SEC on December 21, 2005 (File No. 000-1318246)). |
4.5 |
|
Supplemental Indenture, dated as of January 25, 2006, by and among Murray International Metals Pte. Limited, Pipe Acquisition Finance Plc, Pipe Acquisition Limited, Murray International Metals Limited and The Bank of New York.* |
4.6 |
|
Debenture, dated as of December 16, 2005, by and among Pipe Acquisition Finance Plc, Pipe Acquisition Limited, Murray International Metals Limited and The Bank of New York.* |
| | | |
II-9
4.7 |
|
Debenture, dated as of January 25, 2006, by and among Pipe Acquisition Finance Plc, Murray International Metals Pte. Limited and The Bank of New York.* |
4.8 |
|
Security Agreement, dated as of February 1, 2005, by and among Edgen Corporation, Edgen Louisiana Corporation, Edgen Alloy Products Group, L.L.C., Edgen Carbon Products Group, L.L.C. and The Bank of New York, as collateral agent (incorporated by reference to Exhibit 4.3 of Edgen Corporation's Form S-4 dated May 2, 2005 filed with the SEC on May 2, 2005 (File No. 333-124543)). |
4.9 |
|
Form of 97/8% Senior Secured Notes due 2011 (included in Exhibit 4.1). |
4.10 |
|
Form of Senior Secured Floating Rate Notes due 2010 (included in Exhibit 4.2). |
5.1 |
|
Form of Opinion of Dechert LLP.** |
10.1 |
|
Purchase Agreement, dated December 7, 2005, by and between Edgen Corporation, Edgen Louisiana Corporation, Edgen Alloy Products Group, L.L.C., Edgen Carbon Products Group, L.L.C., Murray International Metals, Inc. and Jefferies & Company, Inc., as initial purchaser (incorporated by reference to Exhibit 99.1 of Edgen Corporation's Form 8-K dated December 1, 2005 filed with the SEC on December 1, 2005 (File No. 333-124543)). |
10.2 |
|
Purchase Agreement, dated December 13, 2005, by and among Pipe Acquisition Finance Plc, Pipe Acquisition Limited, Murray International Metals Limited, Murray International Metals Pte. Limited and Jefferies & Company, Inc., as initial purchaser.* |
10.3 |
|
Registration Rights Agreement, dated as of December 16, 2005, by and among Pipe Acquisition Finance Plc, Pipe Acquisition Limited, Murray International Metals Limited, Murray International Metals Pte. Limited and Jefferies & Company, Inc.* |
10.4 |
|
Working Capital Facility, dated as of December 16, 2005, by and among Pipe Acquisition Limited, certain Subsidiaries of Pipe Acquisition Limited, the lenders party thereto and The Governor and Company of The Bank of Scotland, as administrative agent.* |
10.5 |
|
Accession Letter to Working Capital Facility, dated January 25, 2006, by Murray International Metals Pte. Limited.* |
10.6 |
|
Senior Intercreditor Agreement, dated as of December 16, 2005, by and among Pipe Acquisition Finance Plc, Pipe Acquisition Limited, Murray International Metals Limited, The Governor and the Company of The Bank of Scotland and The Bank of New York.* |
10.7 |
|
Deed of Accession to Senior Intercreditor Agreement, dated as of January 25, 2006, by Murray International Metals Pte. Limited.* |
10.8 |
|
Amended and Restated Loan and Security Agreement, dated February 1, 2005, among Edgen Carbon Products Group and L.L.C., Edgen Alloy Products Group, L.L.C., as borrowers, Edgen Corporation and Edgen Louisiana Corporation, as guarantors, the financial institutions party thereto, as lenders, and GMAC Commercial Finance LLC, as agent for the lenders (incorporated by reference to Exhibit 10.4 of Edgen Corporation's Form S-4 dated May 2, 2005 filed with the SEC on May 2, 2005 (File No. 333-124543) ). |
| | | |
II-10
10.9 |
|
Intercreditor Agreement, dated as of February 1, 2005, by and between GMAC Commercial Finance LLC, as agent, and The Bank of New York, as trustee, as acknowledged and agreed to by Edgen Corporation, Edgen Louisiana Corporation, Edgen Alloy Products Group, L.L.C. and Edgen Carbon Products Group (incorporated by reference to Exhibit 10.3 of Edgen Corporation's Form S-4 dated May 2, 2005 filed with the SEC on May 2, 2005 (File No. 333-124543)). |
10.10 |
|
Joinder and Amendment No. 1, dated December 16, 2005, by and among Edgen Corporation, Murray International Metals, Inc. and the other Guarantors named therein and GMAC Commercial Finance LLC (incorporated by reference to Exhibit 99.4 of Edgen Corporation's Form 8-K dated December 21, 2005 filed with the SEC on December 21, 2005 (File No. 333-124543)). |
10.11 |
|
Amended and Restated Employment Agreement, dated as of January 1, 2005, by and between Daniel J. O'Leary, Edgen Louisiana Corporation and Edgen Corporation (incorporated by reference to Exhibit 10.5 of Edgen Corporation's Form S-4 dated May 2, 2005 filed with the SEC on May 2, 2005 (File No. 333-124543)). |
10.12 |
|
Amended and Restated Employment Agreement, dated as of January 1, 2005, by and between David L. Laxton, III, Edgen Louisiana Corporation and Edgen Corporation (incorporated by reference to Exhibit 10.6 of Edgen Corporation's Form S-4 dated May 2, 2005 filed with the SEC on May 2, 2005 (File No. 333-124543)). |
10.13 |
|
Service Agreement, dated December 16, 2005, by and between Murray International Metals Limited and Kenneth Cockburn.* |
10.14 |
|
Employment Agreement, dated as of January 1, 2004, by and among Robert L. Gilleland, Edgen Alloy Products Group, L.L.C., and Edgen Corporation (incorporated by reference to Exhibit 10.11 of Edgen Corporation's Annual Report on Form 10-K for the fiscal year ended December 31, 2005 filed with the SEC on April 3, 2006 (File No. 333-124543)). |
10.15 |
|
Amended and Restated Employment Agreement, dated as of April 30, 2004, by and between Craig S. Kiefer, Edgen Carbon Products Group, L.L.C., and Edgen Corporation (incorporated by reference to Exhibit 10.12 of Edgen Corporation's Annual Report on Form 10-K for the fiscal year ended December 31, 2005 filed with the SEC on April 3, 2006 (File No. 333-124543)). |
10.16 |
|
Lease Agreement, dated as of December 16, 2005, by and among MIM Ltd. and Steels (U.K.) QRS 16 58, Inc.* |
10.17 |
|
Lease Guarantee, dated January 25, 2006, by and among Murray International Metals Pte. Limited and Murray International Metals Ltd.* |
10.18 |
|
Sale and Purchase Agreement, dated February 21, 2004, by and among Tuas Hi-Tech Park Pte. Ltd. and Murray International Metals Pte. Limited.* |
10.19 |
|
Land Lease, dated May 15, 1999, by and among The Government of Dubai and Murray International Metals Limited operating as Murray International Metals Middle East.* |
10.20 |
|
Edgen/Murray, L.P. Incentive Plan (For Edgen Corporation and its Subsidiaries) (incorporated by reference to Exhibit 10.10 of Edgen Corporation's Annual Report on Form 10-K for the fiscal year ended December 31, 2005 filed with the SEC on April 3, 2006 (File No. 333-124543)). |
10.21 |
|
Edgen/Murray, L.P. Incentive Plan (For Pipe Acquisition and its Subsidiaries), adopted March 28, 2006.* |
| | | |
II-11
21.1 |
|
List of Subsidiaries of the Registrant.** |
23.1 |
|
Consent of Dechert LLP (incorporated by reference to Exhibit 5.1).* |
23.2 |
|
Consent of Deloitte & Touche LLP.* |
23.3 |
|
Consent of Deloitte & Touche LLP.* |
24.1 |
|
Powers of Attorney for Edgen Murray Plc.* |
- *
- Filed herewith.
- **
- To be filed by amendment.
- (b)
- Financial statement schedules.
All schedules are omitted because the required information is inapplicable or the information is presented in the Consolidated Financial Statements or related notes.
II-12
QuickLinks
Table of contentsAbout this prospectusDealer prospectus delivery obligationSpecial note regarding industry and market dataProspectus summaryThe offeringSummary historical consolidated and pro forma condensed combined financial dataRisk factorsSpecial note regarding forward-looking statementsUse of proceedsDividend policyCapitalizationDilutionSelected historical consolidated financial data of Edgen/Murray, L.P.Unaudited pro forma condensed combined financial statementsManagement's discussion and analysis of financial condition and results of operationsBusinessNewbuild orderbook through 2008Additions to natural gas pipeline mileage 1998-2008Summary of primary productsSummary of leased and owned facilitiesManagementSummary compensation tableSecurity ownership of certain beneficial owners and managementCertain relationships and related party transactionsDescription of share capitalDescription of American Depositary SharesShares eligible for future saleIncome tax considerationsUnderwritingLegal mattersExpertsEnforceability of certain judgments and service of processCurrency and exchange rate informationWhere you can find more informationIndex to Financial StatementsReport of independent registered public accounting firmEdgen Murray Plc Balance sheet November 4, 2006Edgen Murray Plc Note to balance sheet November 4, 2006Report of independent registered public accounting firmEdgen/Murray, L.P. and Subsidiaries Consolidated balance sheets December 31, 2005 and 2004 (In thousands, except per unit/share data)Edgen/Murray, L.P. and Subsidiaries Consolidated statements of operations Period February 1, 2005 to December 31, 2005, period January 1, 2005 to January 31, 2005, and years ended December 31, 2004 and 2003 (In thousands, except per unit/share data)Edgen/Murray, L.P. and Subsidiaries Consolidated statements of partners' capital and shareholders' equity (deficit) Period December 17, 2005 to December 31, 2005, period February 1, 2005 to December 16, 2005, period January 1, 2005 to January 31, 2005, and years ended December 31, 2004 and 2003 (In thousands, except per unit/share data)Edgen/Murray, L.P. and Subsidiaries Consolidated statements of cash flows Period February 1, 2005 to December 31, 2005, period January 1, 2005 to January 31, 2005, and years ended December 31, 2004 and 2003 (In thousands)Edgen/Murray, L.P. and Subsidiaries Notes to consolidated financial statements Period February 1, 2005 to December 31, 2005, period January 1, 2005 to January 31, 2005, and years ended December 31, 2004 and 2003 (In thousands, except per unit/share data)Edgen/Murray, L.P. and Subsidiaries Condensed consolidated balance sheet June 30, 2006 (In thousands) (Unaudited)Edgen/Murray, L.P. and Subsidiaries Condensed consolidated statements of operations Six months ended June 30, 2006, period February 1, 2005 to June 30, 2005 and period January 1, 2005 to January 31, 2005 (In thousands, except per unit/share data) (Unaudited)Edgen/Murray, L.P. and Subsidiaries Condensed consolidated statement of partners' capital Six months ended June 30, 2006 (In thousands, except per unit data) (Unaudited)Edgen/Murray, L.P. and Subsidiaries Condensed consolidated statements of cash flows Six months ended June 30, 2006, period February 1, 2005 to June 30, 2005 and period January 1, 2005 to January 31, 2005 (In thousands) (Unaudited)Edgen/Murray, L.P. and Subsidiaries Notes to condensed consolidated financial statements Six months ended June 30, 2006, period February 1 to June 30, 2005, and period January 1, 2005 to January 31, 2005 (In thousands, except unit/share data) (Unaudited)Report of independent auditorsMurray International Metals Limited and Subsidiaries Consolidated profit and loss accountsMurray International Metals Limited and Subsidiaries Consolidated statements of total recognized gains and lossesMurray International Metals Limited and Subsidiaries Consolidated balance sheetsMurray International Metals Limited and Subsidiaries Consolidated cash flow statementsMurray International Metals Limited and Subsidiaries Condensed consolidated profit and loss accountsMurray International Metals Limited and Subsidiaries Condensed consolidated statements of total recognized gains and lossesMurray International Metals Limited and Subsidiaries Condensed consolidated balance sheetsMurray International Metals Limited and Subsidiaries Condensed consolidated cash flow statementsPart II Information not required in a prospectusSignaturesIndex of exhibits