 Fortress Investment Group LLC 2013 Credit Suisse Financial Services Forum February 2013 All information contained herein is qualified in its entirety by the disclaimer on the next page of this document. Exhibit 99.1 |
 Disclaimer 1 |
 2 Figures as of September 30, 2012. Executive Summary Compelling valuation today with tremendous upside potential Large diversified asset management firm with stable & substantial base earnings Catalysts in place to drive earnings growth & multiple expansion $51.5 billion of fee-paying AUM across four large, established investment management businesses Highly diversified revenue model, product offerings and client base Recurring management fees from $26 billion of alternative capital in long-term, locked up structures Strong investment performance and robust capital raising momentum across all businesses Significant incentive income potential based on embedded gains, continued fund performance and PE realization activity Rock solid balance sheet with substantial current value and potential for meaningful further appreciation |
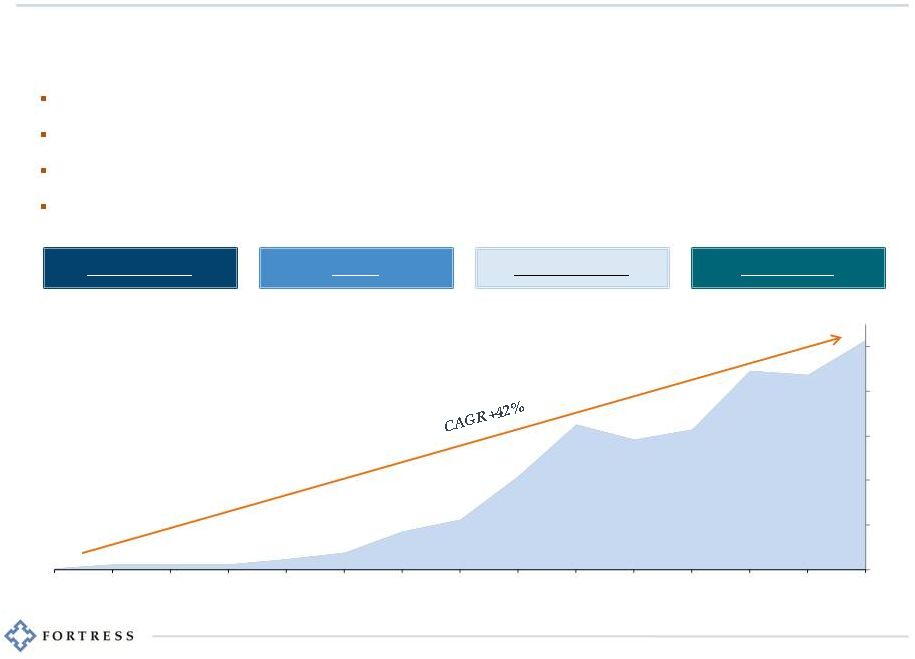 Who is Fortress Investment Group? 3 Figures as of September 30, 2012. Founded as a pure private equity firm in 1998, Fortress has transitioned into a highly diversified, global investment manager with $51.5 billion of AUM 1998 – Launched first private equity fund 2002 – Added credit and liquid markets businesses 2007 – First publicly traded alternative asset manager with IPO on the NYSE 2010 – Acquired Logan Circle Partners, an established, highly scalable traditional fixed income business Credit Private Equity Liquid Markets Logan Circle Fee-Paying Assets Under Management ($ billions) 0 10 20 30 40 50 1998 1999 2000 2001 2002 2003 2004 2005 2006 2007 2008 2009 2010 2011 3Q12 |
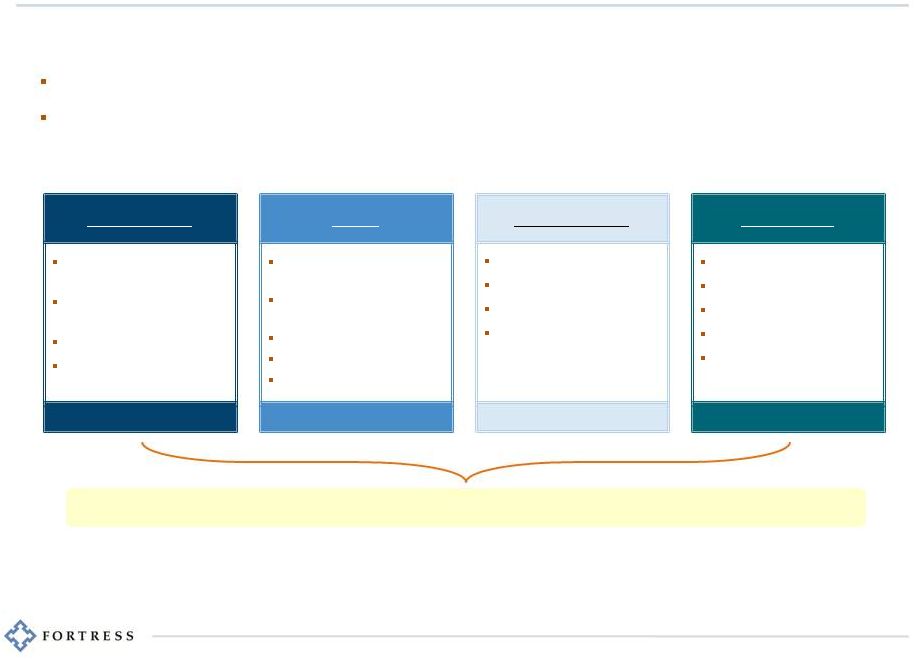 Fortress Today: A Diversified Business Model for All Seasons 4 Figures as of September 30, 2012. Non-correlated alternative strategies complemented by long-only fixed income strategies Specialized expertise and deep experience across various market cycles, geographies and asset classes Strong investment performance and capital raising momentum across all businesses Sector- and asset-specific investment expertise aligned with large scale market opportunities Financial Services / Mortgage Servicing Transportation & Infrastructure Senior Living & Care Permanent Equity Vehicles Credit Private Equity Liquid Markets Logan Circle Undervalued & Distressed Assets Operationally Intense, Complex Deals Restructuring Real Estate Lending Global Macro Asia Macro Convex Asia Endowment-Style Core fixed income Short & Long Duration High Yield Emerging Markets Multi-Sector $14.7B of AUM $11.8B of AUM $4.4B of AUM $20.6B of AUM |
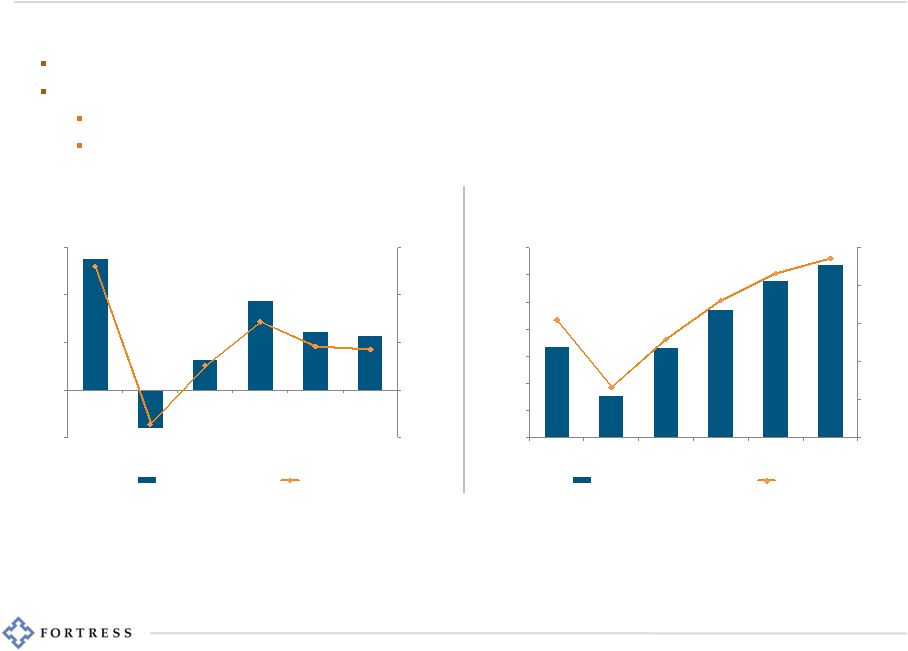 5 Earnings have stabilized and balance sheet is stronger than ever Tremendous results in 2007 demonstrate earnings power of the business model Navigated the crisis and have since emerged consistently profitable and with greater financial flexibility In 4Q12 paid in full $181 million of outstanding corporate debt (from peak of $800 million in 2008) Year-end pro-forma total debt balance of $149.5 million (short-term note issued to repurchase shares) Pre-Tax Distributable Earnings (1) ($ millions) Financial Performance Since IPO Net Cash & Investments (3) ($ millions) -$0.50 $0.00 $0.50 $1.00 $1.50 -$200 $0 $200 $400 $600 2007 2008 2009 2010 2011 Ann. 2012 Pre-Tax DE Per Share $0.00 $0.50 $1.00 $1.50 $2.00 $2.50 $0 $200 $400 $600 $800 $1,000 $1,200 $1,400 2007 2008 2009 2010 2011 3Q2012 Net Cash & Investments Per Share (per share) (per share) $0.43 $2.37 (2) (1) Pre-Tax Distributable Earnings is a non-GAAP financial measure described in Fortress’s third quarter 2012 earnings release. The release is available in the “Public Shareholders – News” section of Fortress’s website, www.fortress.com. For a reconciliation of GAAP Net Income to Pre-Tax Distributable Earnings please see appendix slide #1. Annualized 2012 figures reflect annualized nine months ended September 30, 2012 pre-tax distributable earnings. (2) For a reconciliation of Weighted Average Class A Shares Outstanding (Used for Basic EPS) to Weighted Average Dividend Paying Shares and Units Outstanding (Used for DEPS) please see appendix slide #2. (3) Net Cash and Investments means cash & cash equivalents plus investments less debt outstanding, which is a non-GAAP financial measure described in Fortress’s third quarter 2012 earnings release. The release is available in the “Public Shareholders – News” section of Fortress’s website, www.fortress.com. For a reconciliation of GAAP Book Value Per Share to Net Cash and Investments Per Share please see appendix slide #3. |
 Business Segment Overview 6 |
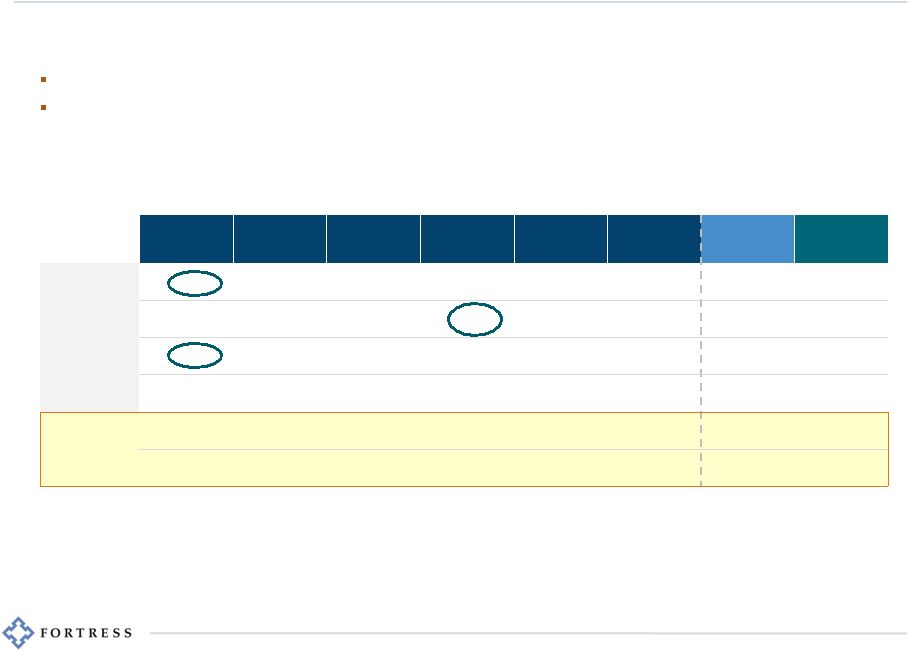 2007 2008 2009 2010 2011 Annualized 2012 (2) Average High PE & Castles 312 81 137 145 118 112 151 312 (3) Credit 61 35 44 168 138 107 92 168 Liquid 161 102 28 64 14 20 65 161 Logan Circle n/a n/a n/a (15) (17) (9) (14) (9) Total 534 (4) 216 208 358 253 230 294 632 Per share $1.25 $0.48 $0.42 $0.69 $0.48 $0.43 $0.61 (5) $1.31 (5) 7 ($ millions) Fund Management Distributable Earnings – By Business (1) Earnings Breakdown by Business Peak performance years in alternatives businesses point to significant upside potential Core alternatives businesses poised for growth and increased earnings Logan Circle approaching profitability with substantial scale-based potential (1) Fund Management Distributable Earnings is a non-GAAP financial measure described in Fortress’s third quarter 2012 earnings release. The release is available in the “Public Shareholders – News” section of Fortress’s website, www.fortress.com. For a reconciliation of GAAP Net Income to Pre-Tax Distributable Earnings and Fund Management Distributable Earnings please see appendix slide #1. (2) Annualized 2012 figures reflect annualized nine months ended September 30, 2012 fund management distributable earnings. (3) Fortress has reserved $60 million of net intrinsic clawback liabilities in respect of DE previously distributed. (4) 2007 total does not include unallocated expenses of $9 million. (5) Pro-forma share count based on repurchase of 51.3 million shares completed in 4Q2012. |
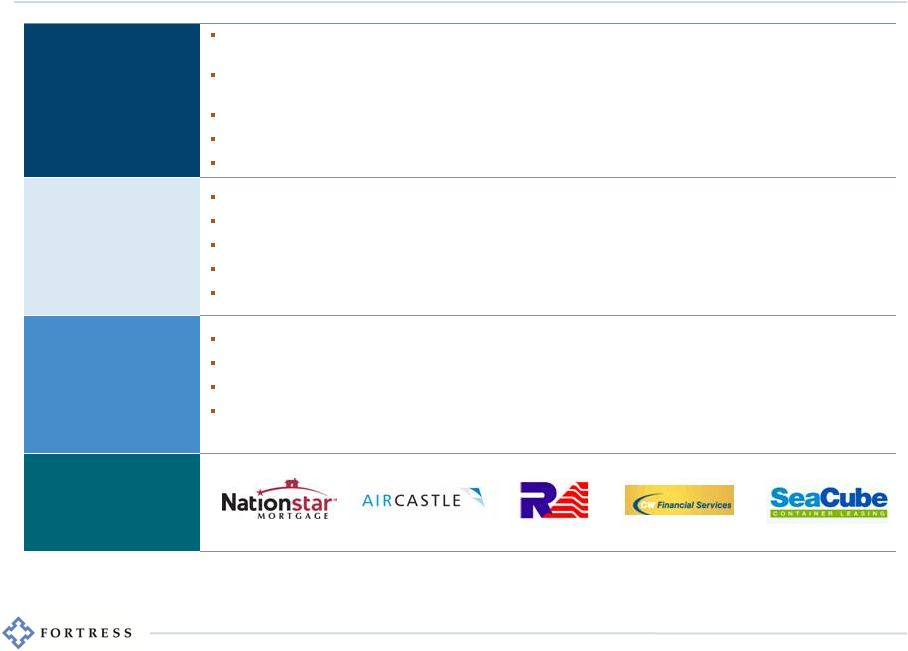
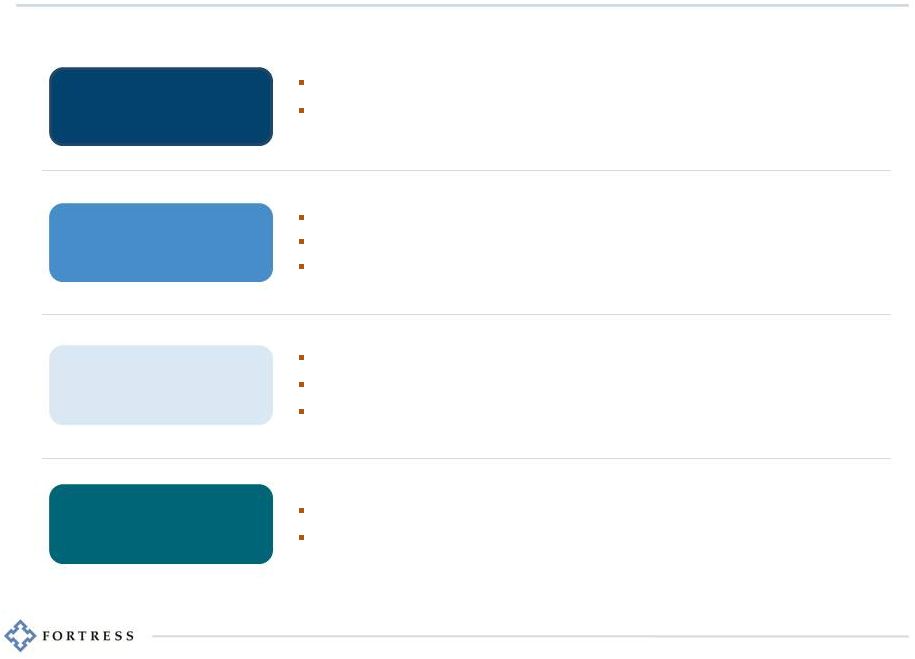 8 Catalysts for Business Earnings Growth Private Equity Credit Logan Circle Liquid Markets Significant value generation potential from legacy buyout funds Transition to permanent capital vehicles and sector-specific funds to capitalize on enormous current market opportunity set Industry leading credit fund performance Substantial embedded earnings potential from unrecognized incentive income Ample dry powder for global investment opportunities Outstanding 2012 performance across flagship Macro and Asia Macro funds Increased capital inflow momentum Well-positioned to generate higher levels of incentive income Tremendous recent AUM growth, driven by strong investment performance Highly scalable platform and experience managing substantially more capital |
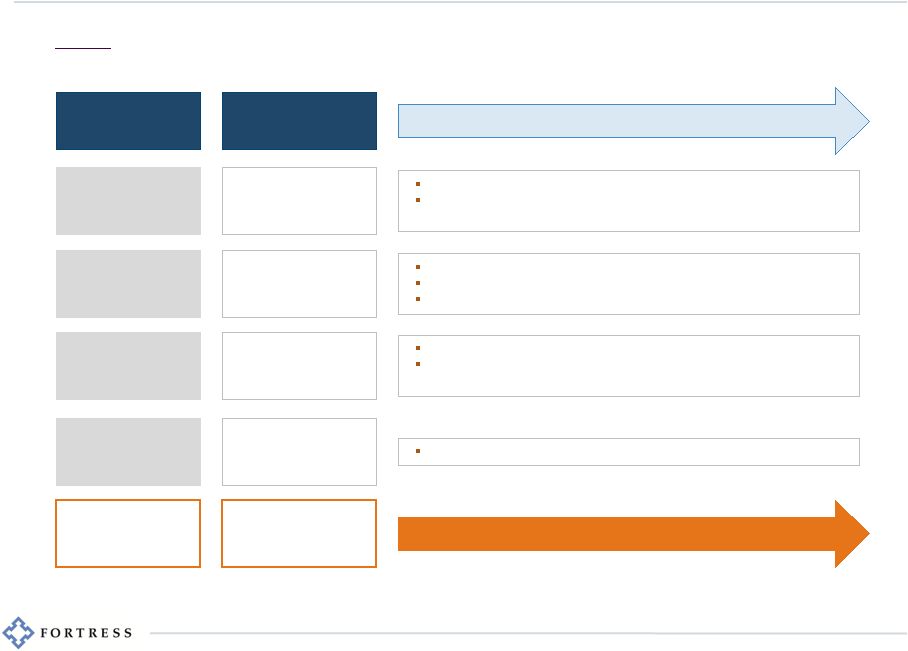
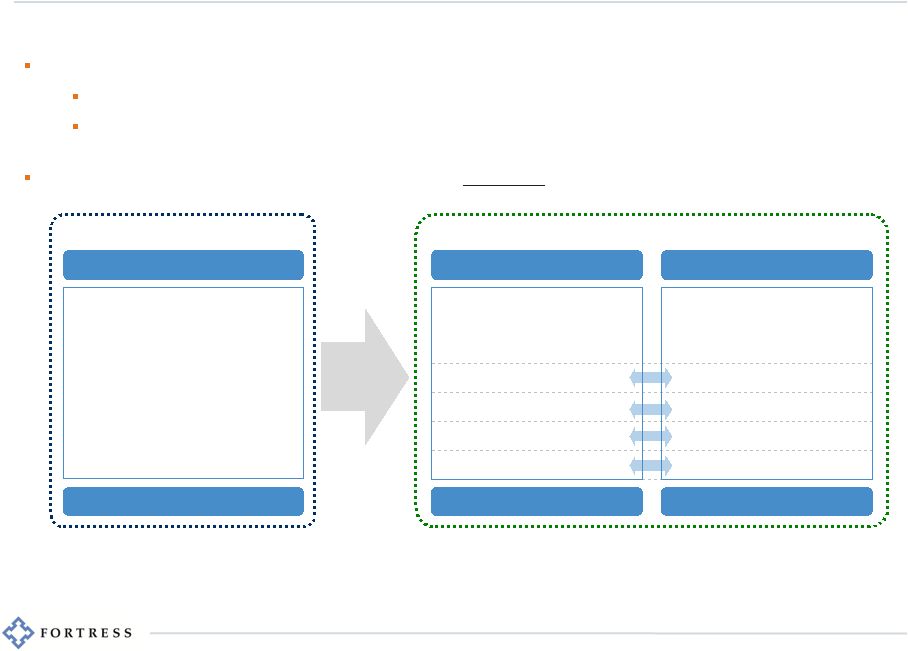 9 Private Equity: Strategic Evolution of the Business Goal is to generate stable net mgmt fees of $100mm+ through general and new investment vehicles Transformation from traditional buyout funds to opportunistic, sector-specific funds and permanent capital vehicles Permanent equity capital – primarily listed vehicles that own assets and provide financing Sector-specific private equity funds – to make opportunistic investments in large industries where Fortress has deep knowledge and expertise; may also seed public companies In certain sectors, permanent capital vehicles are or may be paired with sector focused funds Newcastle New Residential (1) MSR Fund (existing) Eurocastle Italian NPL Fund (4) WWTAI (2) Infrastructure Fund (4) Senior Housing (3) China Senior Housing Fund (4) General Buyout Funds Sector-Focused Funds Permanent Capital Diversified private equity funds investing across multiple industries Fortress Investment Fund I Fortress Investment Fund II Fortress Investment Fund III Fortress Investment Fund IV Fortress Investment Fund V Fortress Coinvestment Funds Existing AUM: $11.0B Fortress-managed public companies Existing AUM: $3.7B Sector-specific private equity funds Existing AUM: $0.6B (5) Traditional Model New Model (1) Newcastle’s ability to complete a spin-off of New Residential is subject to certain conditions, such as the SEC declaring the registration statement relating to the spin-off effective, the filing and approval of an application to list New Residential’s common stock on the NYSE, and the formal declaration of the distribution by the Board of Directors. (2) WWTAI is currently a private Fortress PE fund. (3) Senior housing properties currently owned by Newcastle and managed by FHC (FIG subsidiary). (4) Potential fund strategies. (5) Includes $0.6 billion raised for MSR Opportunities Fund not included in fee-paying AUM as of September 30, 2012. New Model |
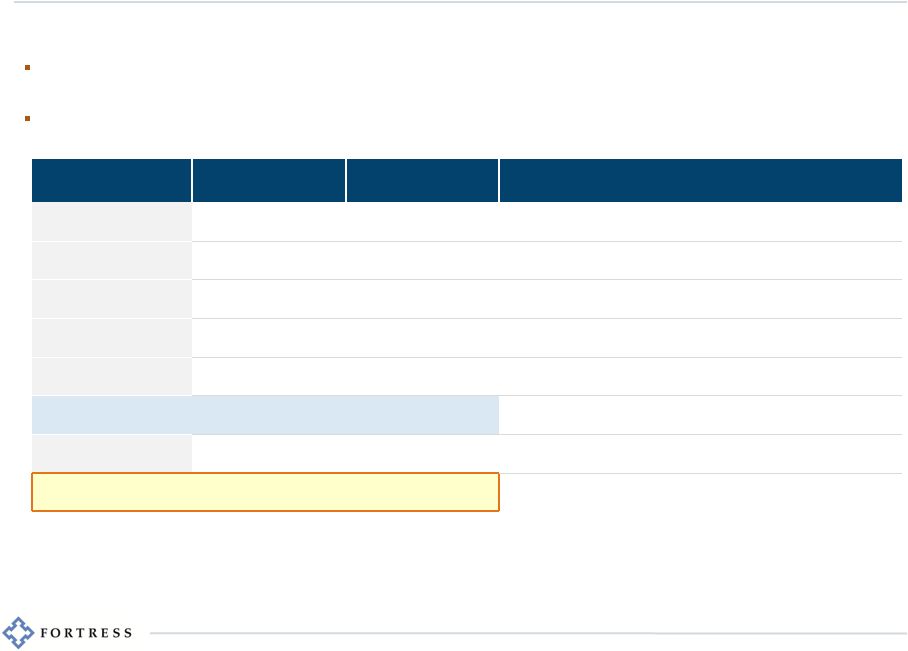 10 Private Equity: Harvesting Gains From Legacy Funds Continue to harvest the earnings from Funds I – V: high operating margins, substantial potential for promote and balance sheet appreciation Strong performance for older vintage funds; potential for newer vintage funds to generate attractive multiples & promote PE Fund (vintage) Current Fund NAV Current Gross Multiple (1) Key Drivers of Potential Future Value Generation Fund I (1999) $0.1bn 3.0x Italfondiario Fund II(2002) $0.1bn 1.8x GAGFAH Fund III (2004) $2.1bn 1.4x Nationstar, GAGFAH Fund IV (2006) $4.0bn 1.2x Nationstar, Holiday, Florida (3) Fund V (2007) $3.7bn 1.0x Florida (3) , Springleaf,Penn National Gaming, CW Financial Total Main Funds $10.0bn 1.4x Co-investments (2) $5.3bn 1.0x Florida (3) , Holiday Total PE Funds $15.3bn 1.3x Figures as of September 30, 2012. (1) Multiple equals current NAV plus inception to date distributions, divided by the lesser of capital committed or equity invested. For purposes of calculating the gross multiple, equity invested excludes capital called for management fees and other expenses. The inclusion of such amounts would reduce the gross multiple. Gross multiple is not an accurate indicator of the Company’s proximity to incentive income thresholds and is different from the statistic which would be computed based on the Company’s periodic 34 Act reporting, which reports net amounts. (2) Co-investments include Fund III Co, Fund IV Co, Fund V Co, FHIF, FECI, FRIC, FRID, FICO, GAGACQ-Co and FFPF. (3) Florida includes Florida East Coast and Flagler. Legacy PE funds have potential to generate substantial fees over next 5 years |
 11 Dry powder: if deployed/called will become AUM and begin generating management fees Unrecognized Incentive Income: will be recognized in distributable earnings with investment realizations Credit: Embedded Value Yet to Impact Earnings (1) Reflects incentive income generated by our credit PE funds gross of profit-sharing expenses. (2) The hypothetical assumptions for capital deployed, revenues, expenses and earnings are presented solely for illustrative purposes and actual results could differ materially. (3) There can be no assurance that Fortress will achieve any given target return or that dry powder will be deployed into AUM. Target returns are subject to a number of trends and uncertainties, many of which are beyond our control, that could cause actual results to differ materially. (4) Assumes management fee rate of 1.4% on fee-paying AUM. (5) Assumes incentive fee rate of 20%. Incentive income for credit PE funds will be recognized in distributable earnings when investments are realized. (6) Pro-forma share count based on repurchase of 51.3 million shares completed in 4Q2012. Return Assumptions (3) ($ millions) 10% 15% 20% 25% Gross Management Fees (4) $14 $14 $14 $14 Gross Incentive Income (5) $20 $30 $40 $50 Gross Segment Revenues $34 $44 $54 $64 Operating Margin 35% 35% 35% 35% Fund Mgmt DE $12 $15 $19 $22 Fund Mgmt DE/share (6) $0.02 $0.03 $0.04 $0.05 Hypothetical Annual Impact From Every $1bn of Capital Deployed (2) Unrecognized Credit PE Incentive Income (1) (millions) (per share) $0.00 $0.25 $0.50 $0.75 $1.00 $0 $100 $200 $300 $400 $500 4Q2011 1Q2012 2Q2012 3Q2012 Unrecognized Incentive Income Per Share $0.80 FCO I and FCO II have generated annualized inception-to-date net returns of 26.9% and 17.8%, respectively Credit PE funds currently have $6.5 billion of “dry powder” and $430 million of embedded unrecognized incentive income |
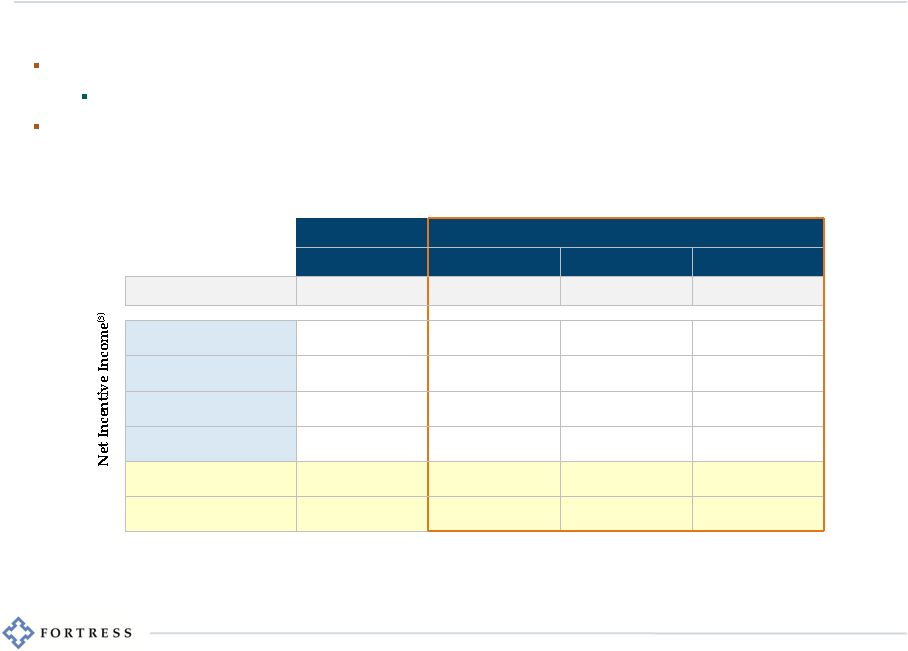 12 Liquid Markets: Significant Incentive Income Potential Strong investment performance and capital raising momentum Top-tier Macro Fund and Asia Macro Fund performance in 2012 has led to positive capital inflow momentum Nearly 100% of main Macro Fund and Asia Macro Fund NAV were above high-water marks at year-end Significant earnings potential from continued investment performance, growing AUM and higher incentive income (1) The hypothetical assumptions for capital inflows, revenues, expenses and earnings are presented solely for illustrative purposes and actual results could differ materially. (2) Assumes 1.7% management fee rate on AUM. Includes management fees earned from $1.4 billion of AUM in the Fortress Partners Funds. Assumes 20% margin on gross management fees. (3) Assumes 20% incentive fee rate on incentive-eligible NAV above respective performance thresholds. Assumes 50% margin on gross incentive income. (4) There can be no assurance that Fortress will achieve any given target return. Target returns are subject to a number of trends and uncertainties, many of which are beyond our control, that could cause actual results to differ materially. (5) Pro-forma share count based on repurchase of 51.3 million shares completed in 4Q2012. Current NAV Incremental Capital Inflows ~$3,000 +$1,000 +$2,000 +$3,000 Net Management Fees (2) $16 $18 $20 $22 10% annual return (4) $31 $38 $44 $50 15% annual return (4) $48 $57 $67 $77 20% annual return (4) $65 $78 $91 $104 25% annual return (4) $82 $99 $116 $132 Fund Mgmt DE $47 - $98 $56 - $117 $64 - $136 $72 - $155 Fund Mgmt DE/share (5) $0.10 - $0.20 $0.11 - $0.24 $0.13 - $0.28 $0.15 - $0.32 Hypothetical Liquid Hedge Fund Distributable Earnings (1) ($ millions) Liquid Hedge Fund Incentive-Eligible NAV Above Threshold |
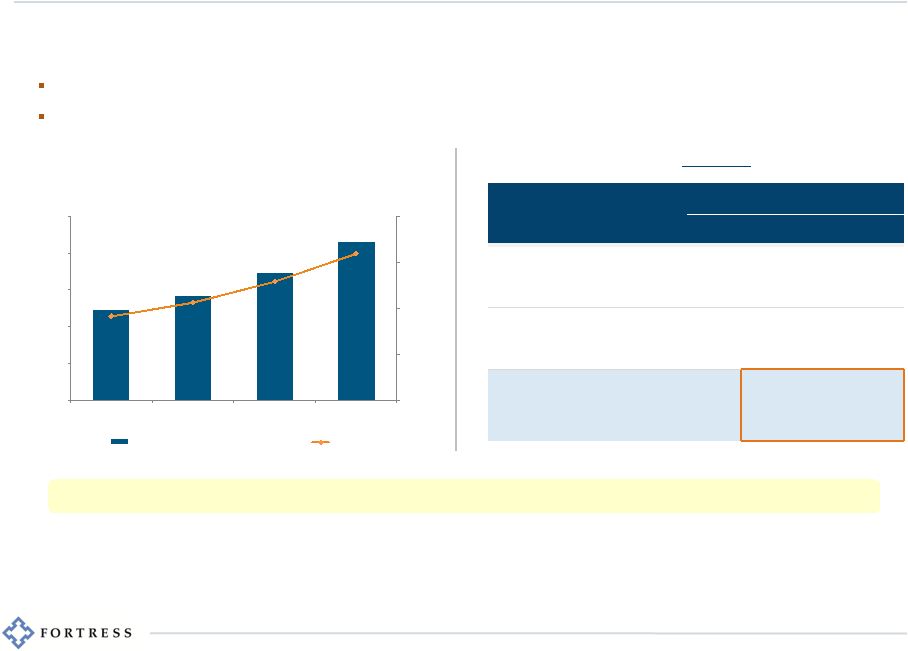
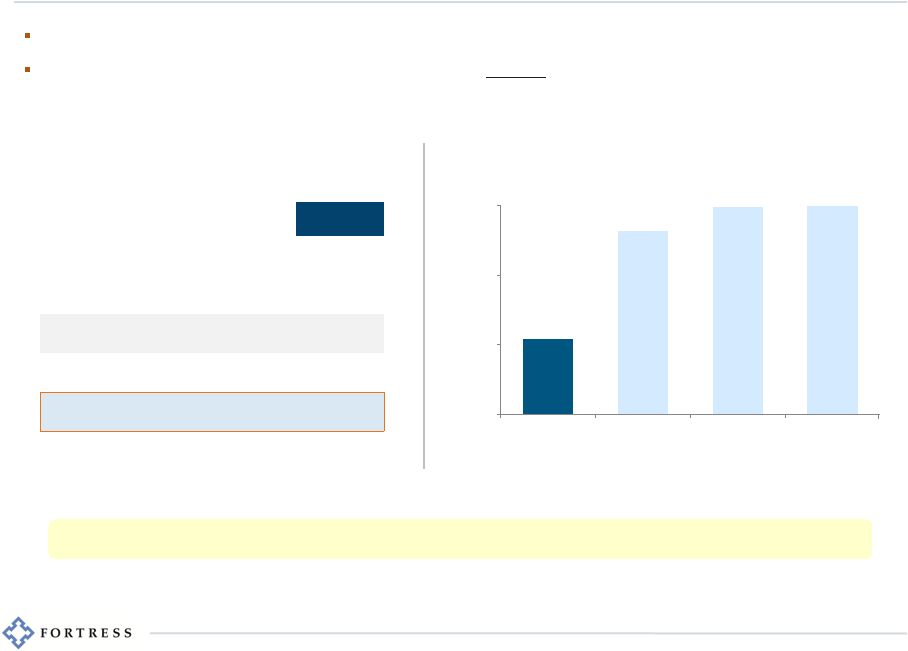
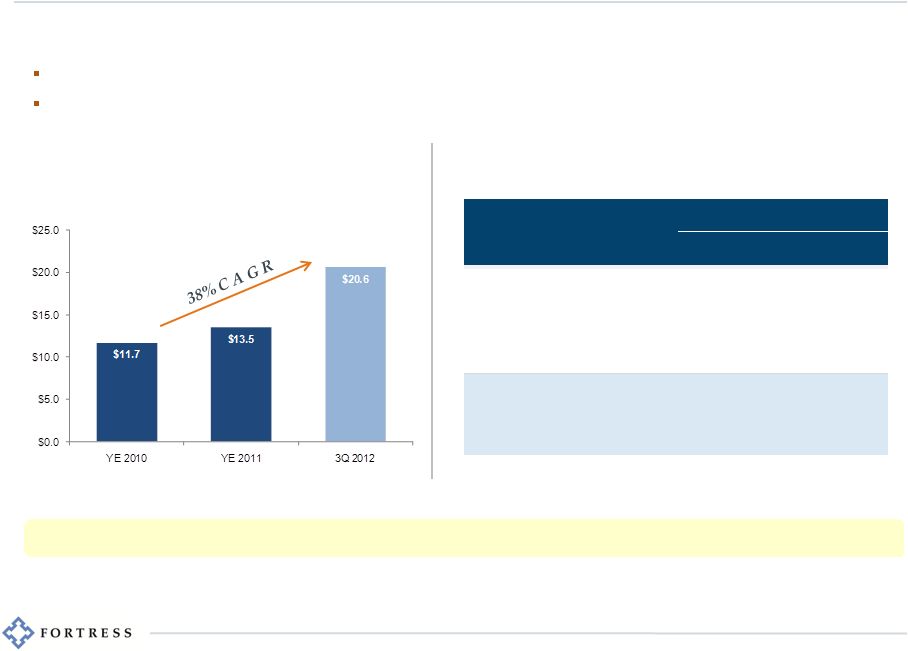 13 Logan Circle: AUM Growth & Scalability Substantial LCP Asset Flow Momentum (LCP AUM in billions) LCP AUM Growth to $40 Billion ($ millions) $40,000 $40,000 $40,000 Mgmt Fee Rate (bps) 15 15 15 Gross Annual Mgmt Fees $60 $60 $60 Operating Margin 30% 40% 50% Annual Fund Mgmt DE $18 $24 $30 Annual Fund Mgmt DE/share (2) $0.04 $0.05 $0.06 Hypothetical Annual Impact to DE from LCP AUM Growth (1) Established global platform built for enormous scalability and the potential to generate substantial fee earnings Since the acquisition of Logan Circle in 2010, AUM has grown over 75% to $20.6 billion Asset flow momentum has picked up substantially with $5.9 billion of client flows for the first nine months of 2012 14 of 15 Logan Circle strategies have outperformed their respective benchmarks since inception (1) The hypothetical assumptions for AUM growth, management fees, expenses and earnings are presented solely for illustrative purposes and actual results could differ materially. (2) Pro-forma share count based on repurchase of 51.3 million shares completed in 4Q2012. |
 14 Catalysts Sum to Substantial FIG Upside In every Fortress business, specific catalysts point to potential for significant earnings growth Business Annualized 2012 Earnings (1) Private Equity $112mm Credit $107mm Liquid Markets $20mm Logan Circle $(9)mm TOTAL $230mm $0.43 per share Incentive income from legacy buyout funds Management & Incentive fees from new permanent capital vehicles and sector-focused funds Deployment of dry powder Realization of unrecognized incentive income Continued strong performance Incremental capital inflows to existing and new strategies Continued strong performance coupled with NAV above high-water marks Continued fund outperformance and asset flow momentum Near-Term Growth Catalysts Increased Potential Earnings (1) Annualized 2012 figures reflect annualized nine months ended September 30, 2012 fund management distributable earnings. |
 15 Substantial Valuation Discount Based on Current Multiples Price / EPS Multiple Comparison (2) Price / EPS Multiple Calculation Per Share Current FIG Stock Price (1) $5.53 Less: Net Cash & Investments $2.37 Stock Price ex. B/S Value $3.16 2013 Consensus DEPS 0.59 Price / Earnings Multiple 5.4x Enormous valuation disconnect from large, traditional non-diversified asset managers Net of balance sheet value, Fortress currently trades at 5x 2013 consensus DE per share Traditional asset managers trade at an average of 15x earnings without the benefits of incentive income and long-term / perpetual capital commitments 5.4 x 13.1 x 14.9 x 15.0 x 0.0 x 5.0 x 10.0 x 15.0 x FIG Financial Select SPDR S&P 500 Traditional Asset Managers (1) FIG stock price as of February 8, 2013. (2) Sources: State Street Global Advisors, Bloomberg, Credit Suisse. |
 16 Recent FIG Highlights (1) Newcastle’s ability to complete a spin-off of New Residential is subject to certain conditions, such as the SEC declaring the registration statement relating to the spin-off effective, the filing and approval of an application to list New Residential’s common stock on the NYSE, and the formal declaration of the distribution by the Board of Directors. (2) Transaction expected to close in the first half of 2013 and is subject to customary closing conditions, including foreign and U.S. regulatory approvals. In addition, the transaction is subject to approval by the shareholders of SeaCube. Fund Investment Performance Drawbridge Special Opportunities Fund up 18% net in 2012; Fortress named “Credit-Focused Hedge Fund of the Year” by Institutional Investor for second consecutive year Fortress Asia Macro Funds FY 2012 net returns of 21%; named “Best Global Macro Fund” at the HFMWeek 2012 Asia Performance Awards Fortress Macro Funds FY 2012 net returns of 18% PE main fund NAV up 21% YTD through 3Q 2012 14 of 15 LCP strategies have outperformed their respective benchmarks YTD through 3Q 2012 Fundraising Activity FCO III Funds: held final close with $4.3 billion in commitments FJOF II Funds: held final close with $1.6 billion in commitments Liquid & Credit Hedge Funds: over $1 billion in third-party capital raised in 2012 MSR Fund: nearly $600 million raised in 2012 (newly launched sector-specific PE fund) Newcastle REIT: nearly $1 billion raised in last 12 months (through January 2013) Business Initiatives Launched Credit Real Estate platform (nearly $300mm raised to date) Launched Fortress Convex Asia Funds Shanghai Starcastle senior living joint venture established; US investments in additional senior living properties In January 2013, Newcastle announced creation of a new publicly traded residential-focused mortgage REIT (New Residential Investment Corp.) (1) Notable PE Liquidity & Realization Events (2) |
 Appendix 17 |
 18 Appendix Slide #1 Reconciliation of GAAP Net Income (Loss) to Pre-tax Distributable Earnings and Fund Management DE (dollars in millions) Nine Months Ended September 30, 2009 2010 2011 2012 GAAP Net Income (Loss) (909) $ (782) $ (1,117) $ (3) $ Principals' and Others' Interests in Income (Losses) of Consolidated Subsidiaries 654 497 685 (21) GAAP Net Income (Loss) Attributable to Class A Shareholders (255) $ (285) $ (432) $ (24) $ Private Equity incentive income (3) 38 44 10 Hedge Fund incentive income - 3 - 108 Reserve for clawback 27 - (5) 6 Distributions of earnings from equity method investees 1 15 11 4 Losses (earnings) from equity method investees (20) (87) (34) (100) Losses (gains) on options (1) (2) 5 2 Losses (gains) on other Investments (24) (1) 23 (31) Incentive income guarantee recorded as a loss (3) - - - Impairment of investments (101) (5) (4) (1) Adjust income from the receipt of options - - (13) (22) Mark-to-market of contingent consideration in business combination - (1) (3) - Amortization of intangible assets and impairment of goodwill - 1 22 - Employee, Principal and director compensation 218 218 235 162 Principals' forfeiture agreement expense (expired in 2011) 952 952 1,051 - Adjust non-controlling interests related to Fortress Operating Group units (660) (507) (691) 15 Tax receivable agreement liability reduction - (22) (3) 7 Taxes (5) 55 36 35 Pre-tax Distributable Earnings 126 $ 372 $ 242 $ 171 $ Investment Loss (income) 58 (34) (8) (10) Interest Expense 24 20 19 11 Fund Management DE 208 $ 358 $ 253 $ 172 $ Twelve Months Ended December 31, |
 19 Appendix Slide #1A ‘‘Distributable earnings’’ is Fortress’s supplemental measure of operating performance. It reflects the value created which management considers available for distribution during any period. As compared to generally accepted accounting principles (‘‘GAAP’’) net income, distributable earnings excludes the effects of unrealized gains (or losses) on illiquid investments, reflects contingent revenue which has been received as income to the extent it is not expected to be reversed, and disregards expenses which do not require an outlay of assets, whether currently or on an accrued basis. Distributable earnings is reflected on an unconsolidated and pre-tax basis, and, therefore, the interests in consolidated subsidiaries related to Fortress Operating Group units (held by the principals) and income tax expense are added back in its calculation. Distributable earnings is not a measure of cash generated by operations which is available for distribution nor should it be considered in isolation or as an alternative to cash flow or net income and it is not necessarily indicative of liquidity or cash available to fund the Company’s operations. For a complete discussion of distributable earnings and its reconciliation to GAAP, as well as an explanation of the calculation of distributable earnings impairment, see note 10 to the financial statements included in the Company’s Quarterly Report on Form 10-Q for the quarter ended September 30, 2012. Fortress’s management uses distributable earnings: Growing distributable earnings is a key component to the Company’s business strategy and distributable earnings is the supplemental measure used by management to evaluate the economic profitability of each of the Company’s businesses and total operations. Therefore, Fortress believes that it provides useful information to investors in evaluating its operating performance. Fortress’s definition of distributable earnings is not based on any definition contained in its amended and restated operating agreement. “Fund Management DE” is equal to pre-tax distributable earnings excluding our direct investment-related results. It is comprised of “Segment Revenues” net of “Segment Expenses” and “Principal Performance Payments.” Fund management DE and its components are used by the Company to analyze and measure the performance of our management business on a stand-alone basis. We define our segment operating margin to be equal to fund management DE divided by segment revenues. We believe that it is useful to provide investors with the opportunity to review our management business using the same metrics. Fund management DE and its components are subject to the same limitations as pre-tax distributable earnings, as described above. in its determination of periodic distributions to equity holders; in making operating decisions and assessing the performance of each of the Company’s core businesses; for planning purposes, including the preparation of annual operating budgets; and as a valuation measure in strategic analyses in connection with the performance of its funds and the performance of its employees. |
 20 Appendix Slide #2 (1) Includes both fully vested and nonvested restricted Class A shares. (2) Includes both fully vested and nonvested Fortress Operating Group RPUs. Reconciliation of Weighted Average Class A Shares Outstanding (Used for Basic EPS) to Weighted Average Dividend Paying Shares and Units Outstanding (Used for DEPS) Nine Months Ended September 30, 2009 2010 2011 2012 Weighted Average Class A Shares Outstanding (Used for Basic EPS) 125,740,897 165,446,404 186,662,670 212,297,285 Weighted average fully vested restricted Class A share units with dividend equivalent rights (1,185,375) (4,450,465) (4,082,385) (4,068,945) Weighted average fully vested restricted Class A shares (94,561) (174,203) (480,777) (706,787) Weighted Average Class A Shares Outstanding 124,460,961 160,821,736 182,099,508 207,521,553 Weighted average restricted Class A shares (1) 158,500 339,533 522,365 722,413 Weighted average fully vested restricted Class A share units which are entitled to dividend equivalent payments 1,185,375 4,450,465 4,082,385 4,068,945 Weighted average nonvested restricted Class A share units which are entitled to dividend equivalent payments 24,153,521 19,695,924 13,994,757 6,667,917 Weighted average Fortress Operating Group units 310,576,187 302,123,167 304,832,761 301,815,314 Weighted average Fortress Operating Group RPUs (2) 31,000,000 31,000,000 22,563,471 13,652,069 Weighted Average Class A Shares Outstanding (Used for DEPS) 491,534,544 518,430,825 528,095,247 534,448,211 Weighted average vested and nonvested restricted Class A share units which are not entitled to dividend equivalent payments 25,069,721 26,436,872 23,439,170 19,212,189 Weighted Average Fully Diluted Shares and Units Outstanding (Used for Diluted DEPS) 516,604,265 544,867,697 551,534,417 553,660,400 Twelve Months Ended December 31, |
 21 Appendix Slide #3 Reconciliation of GAAP Book Value Per Share to Net Cash and Investments Per Share (dollars and shares in thousands) GAAP Book Value Net Cash and Investments GAAP Book Value Net Cash and Investments GAAP Book Value Net Cash and Investments GAAP Book Value Net Cash and Investments Cash and Cash equivalents 253,731 $ 253,731 $ 333,166 $ 333,166 $ 210,632 $ 210,632 $ 197,099 $ 197,099 $ Investments 1,199,622 1,199,622 1,079,777 1,079,777 1,012,883 1,012,883 867,215 867,215 Due from Affilitates 289,889 - 298,689 - 303,043 - 64,511 Deferred Tax Asset 379,372 - 400,196 - 415,990 - 440,639 Other Assets 102,787 - 108,858 - 134,147 - 90,803 Assets 2,225,401 1,453,353 2,220,686 1,412,943 2,076,695 1,223,515 1,660,267 1,064,314 Debt Obligations Payable 180,528 $ 180,528 $ 261,250 $ 261,250 $ 277,500 $ 277,500 $ 397,825 $ 397,825 $ Accrued Compensation and Benefits 222,719 - 247,024 - 260,790 - 131,134 Due to Affiliates 345,009 - 354,158 - 342,397 - 345,976 Deferred Incentive Income 245,957 - 238,658 - 198,363 - 160,097 Other Liabilities 81,193 - 57,204 - 68,230 - 25,921 Liabilities 1,075,406 180,528 1,158,294 261,250 1,147,280 277,500 1,060,953 397,825 Net 1,149,995 $ 1,272,825 $ 1,062,392 $ 1,151,693 $ 929,415 $ 946,015 $ 599,314 $ 666,489 $ GAAP Basic Shares Dividend Paying Shares and Units GAAP Basic Shares Dividend Paying Shares and Units GAAP Basic Shares Dividend Paying Shares and Units GAAP Basic Shares Dividend Paying Shares and Units Class A Shares 219,361 219,361 189,254 189,254 169,110 169,110 145,485 145,485 Restricted Class A Shares 828 828 570 570 427 427 216 216 Fortress Operating Group Units 298,724 298,724 305,858 305,858 300,274 300,274 307,774 307,774 Fully Vested Class A Shares - Dividend Paying - 637 - 692 - 1,058 - 1,175 Nonvested Class A Shares - Dividend Paying - 6,434 - 13,668 - 19,258 - 25,218 Fortress Operating Group RPUs - 10,333 - 20,666 - 31,000 - 31,000 Shares Outstanding 518,913 536,317 495,682 530,708 469,811 521,127 453,475 510,868 Per Share 2.22 $ 2.37 $ 2.14 $ 2.17 $ 1.98 $ 1.82 $ 1.32 $ 1.30 $ As of September 30, 2012 As of December 31, 2011 As of December 31, 2010 As of December 31, 2009 Fortress believes that Net Cash and Investments is a useful supplemental measure because it provides investors with information regarding Fortress’s net investment assets. Net Cash and Investments excludes certain assets (due from affiliates, deferred tax asset, other assets) and liabilities (due to affiliates, accrued compensation and benefits, deferred incentive income and other liabilities), its utility as a measure of financial position is limited. Accordingly, Net Cash and Investments should be considered only as a supplement to GAAP Book Value as a measure of the Company’s financial position. The Company’s calculation of Net Cash and Investments may be different from the calculation used by other companies and, therefore, comparability may be limited |
 Fortress Investment Group LLC 1345 Avenue of the Americas New York, NY 10105 Contact: Gordon Runté, Managing Director of Investor Relations and Corporate Communications +1 212 798 6082 grunte@fortress.com |