 Fortress Investment Group LLC 2014 Credit Suisse Financial Services Forum February 2014 Exhibit 99.1 All information contained herein is qualified in its entirety by the disclaimer on the next page of this document. |
 Disclaimer 1 |
 2 “We believe a highly diversified, global asset manager delivering top- tier investment performance will create extraordinary opportunities for earnings growth and value creation.” - Wes Edens, Fortress Co-Founder, Co-Chairman & Head of Private Equity |
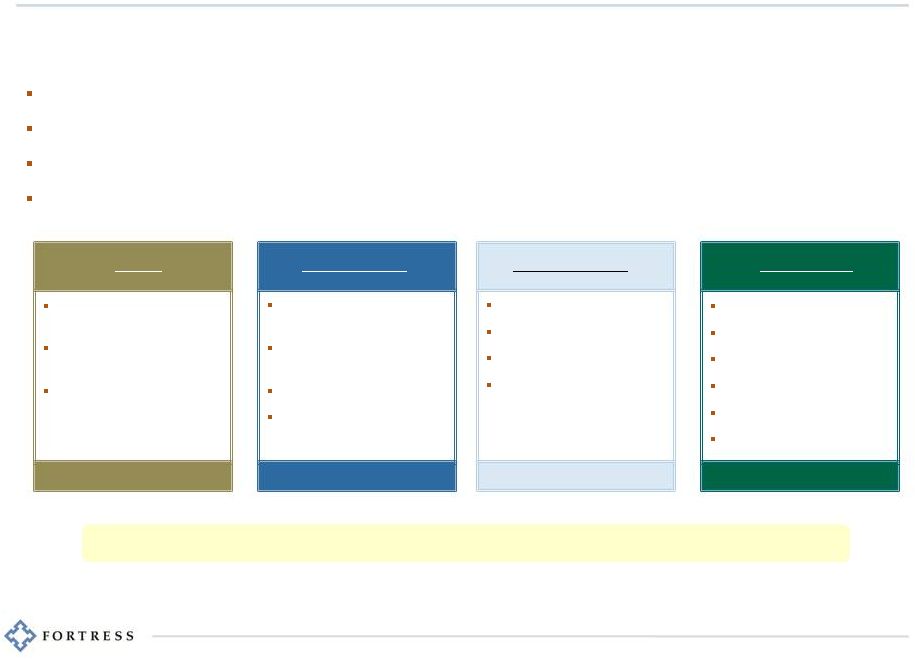 Fortress Today 3 Distressed & Undervalued Assets Operationally Intense, Complex Transactions Opportunistic Lending Situations and Securities Global Macro Convex Asia Endowment-Style Affiliated Manager Platform (Asia Macro) (1) Core-Based Fixed Income Sector-Based Fixed Income Short & Long Duration High Yield Emerging Markets Debt Growth Equities Three large, non-correlated alternative businesses complemented by a highly scalable traditional asset management platform Stable, recurring earnings base with significant incentive income upside potential Core strategies provide foundation for organic strategic growth Increasing scale of permanent equity platform provides high multiple, perpetual fee-based earnings Substantial balance sheet value relative to share price Financial Services / Mortgage Servicing Transportation & Infrastructure Senior Living & Care Permanent Equity Vehicles Private Equity $14.9B of AUM Liquid Markets $6.9B of AUM Credit $12.6B of AUM Logan Circle $23.6B of AUM (1) In January 2014, Fortress announced the launch of a new affiliated manager platform pursuant to which Fortress takes a non-control economic interest in a fund manager and earns fees for infrastructure, technology and related services, with Fortress Asia Macro Fund (“FAMF”) as the first fund to join the platform. (2) Based on annualized YTD 2013 results. On pace for highest full year of distributable earnings since 2007 (2) |
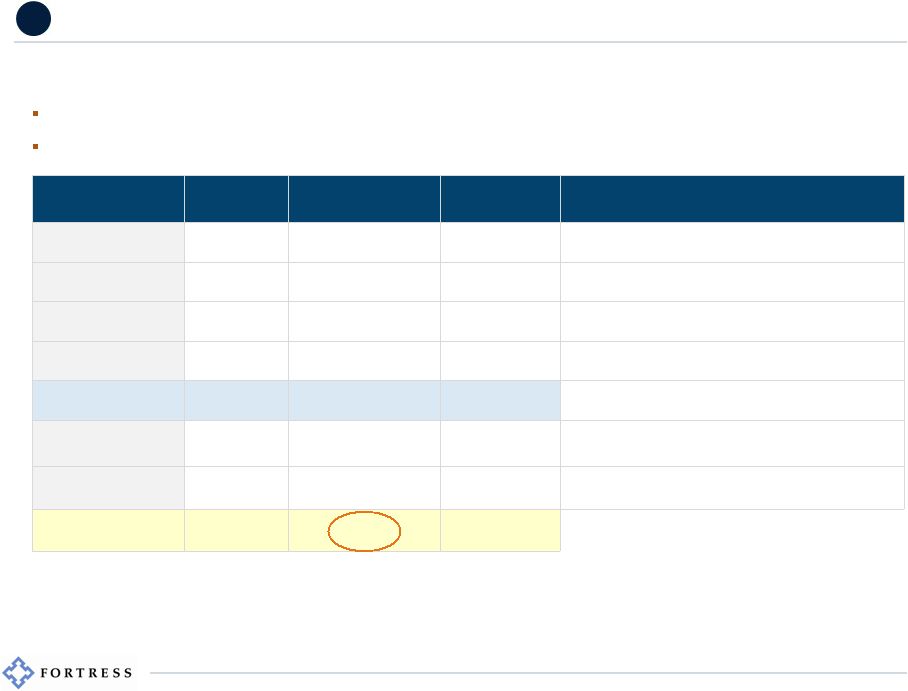
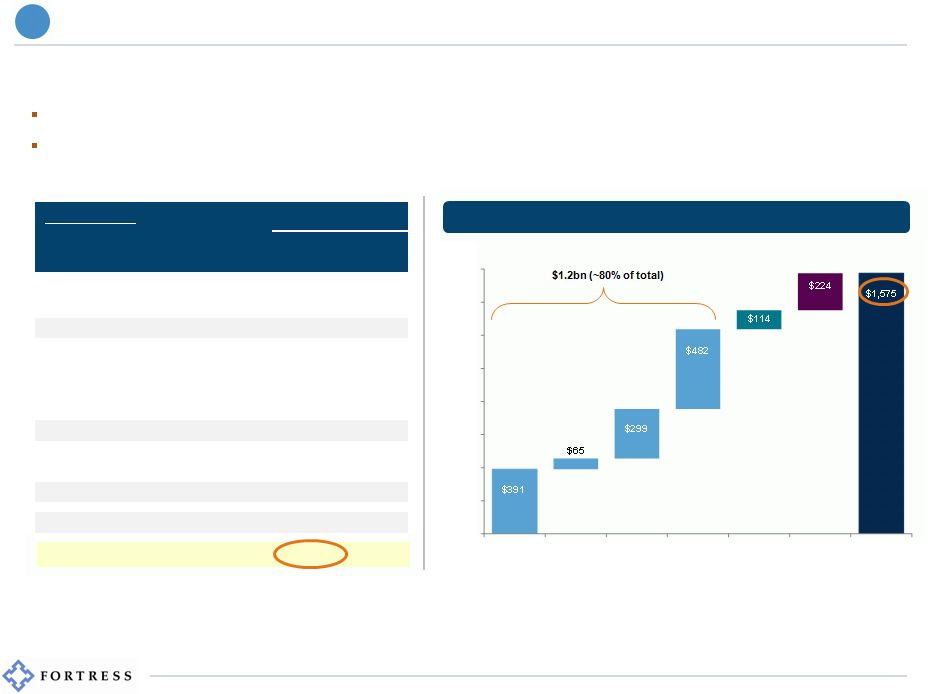
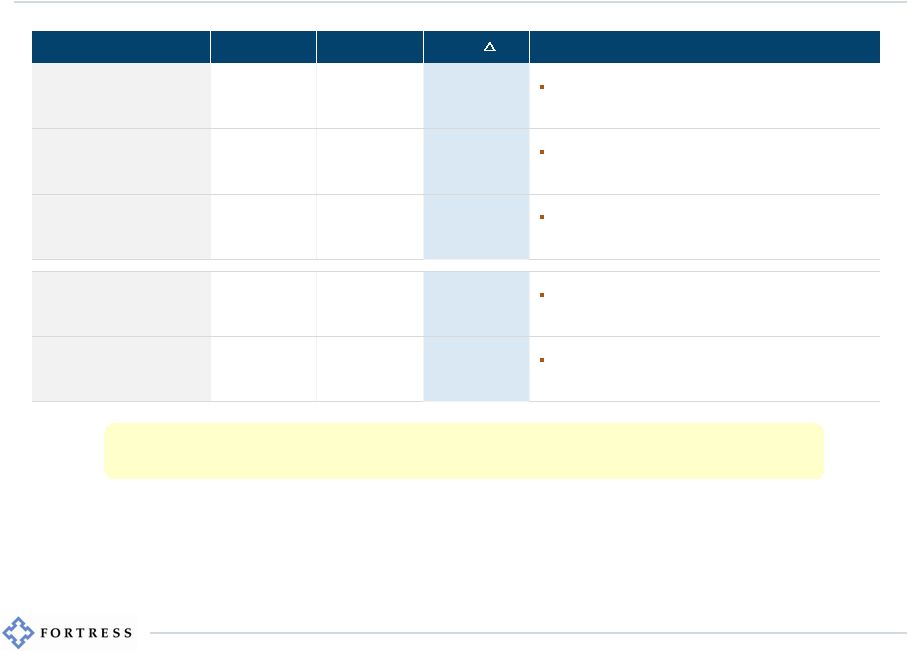 Strong YTD 2013 Results Reflect Strength of Earnings Model 4 (1) Reflects the nine month period from January 1, 2013 through September 30, 2013 for Management Fees and Incentive Income. As of September 30, 2013 for AUM, Gross Unrecognized Incentive Income and Net Cash & Investments. (2) Reflects the nine month period from January 1, 2012 through September 30, 2012 for Management Fees and Incentive Income. As of September 30, 2012 for AUM, Gross Unrecognized Incentive Income and Net Cash & Investments. (3) Includes $1.2 billion of Private Equity Castle equity eligible for incentive. (4) Based on 495 million dividend paying shares outstanding as of September 30, 2013. (5) Net Cash & Investments, which is a non-GAAP financial measure, means cash & cash equivalents plus investments less debt outstanding, as described in Fortress’s third quarter 2013 earnings release. The release is available in the “Public Shareholders – News” section of Fortress’s website, www.fortress.com. For a reconciliation of GAAP Book Value Per Share to Net Cash & Investments Per Share please see Appendix slide #6. (6) FIG stock price as of February 7, 2014. $ millions YTD 2013 (1) YTD 2012 (2) YoY Fee-Paying AUM $57,971 $51,475 +13% Eight consecutive quarters of over $1 billion in new alternative capital raised Management Fees $397 $348 +14% $27.4 billion of AUM in permanent equity or long-term investment structures Incentive Income $357 $164 +118% $18.8 billion (3) of incentive-eligible NAV above incentive income thresholds Gross Unrecognized Incentive Income $807 $543 +49% $1.63 per share (4) of gross embedded incentive income yet to impact DE Net Cash & Investments (5) $1,575 $1,243 +27% $3.18 per share (4) of Net Cash & Investments represents 40% of FIG’s share price (6) Financial performance and embedded value point to substantial momentum and valuation upside potential |
 5 Key Investment Themes (1) In January 2014, Fortress announced the launch of a new affiliated manager platform pursuant to which Fortress takes a non-control economic interest in a fund manager and earns fees for infrastructure, technology and related services, with Fortress Asia Macro Fund (“FAMF”) as the first fund to join the platform. (2) Source: Cambridge Associates, September 2013. (3) Net Cash & Investments, which is a non-GAAP financial measure, means cash & cash equivalents plus investments less debt outstanding, as described in Fortress’s third quarter 2013 earnings release. The release is available in the “Public Shareholders – News” section of Fortress’s website, www.fortress.com. For a reconciliation of GAAP Book Value Per Share to Net Cash & Investments Per Share please see Appendix slide #6. Highly diversified and scalable core investment platforms Meaningful growth potential from permanent capital vehicles and sector-specific funds Opportunities for strategic additions to Liquid Markets affiliated manager platform (1) Logan Circle build-out into broader traditional asset manager Strong investment performance across businesses Strong full year 2013 absolute returns in flagship liquid and credit hedge funds Top-tier Credit PE fund performance (2) ; all flagship Credit funds above preferred thresholds Significant value appreciation in legacy PE buyout funds Substantial, underappreciated balance sheet value Zero debt obligations outstanding $1.6 billion of Net Cash & Investments on the balance sheet (3) Potential for increased shareholder distributions from realization events 1 2 3 |
 6 Highly Diversified Business Model With Scalable Investment Platforms 1 |
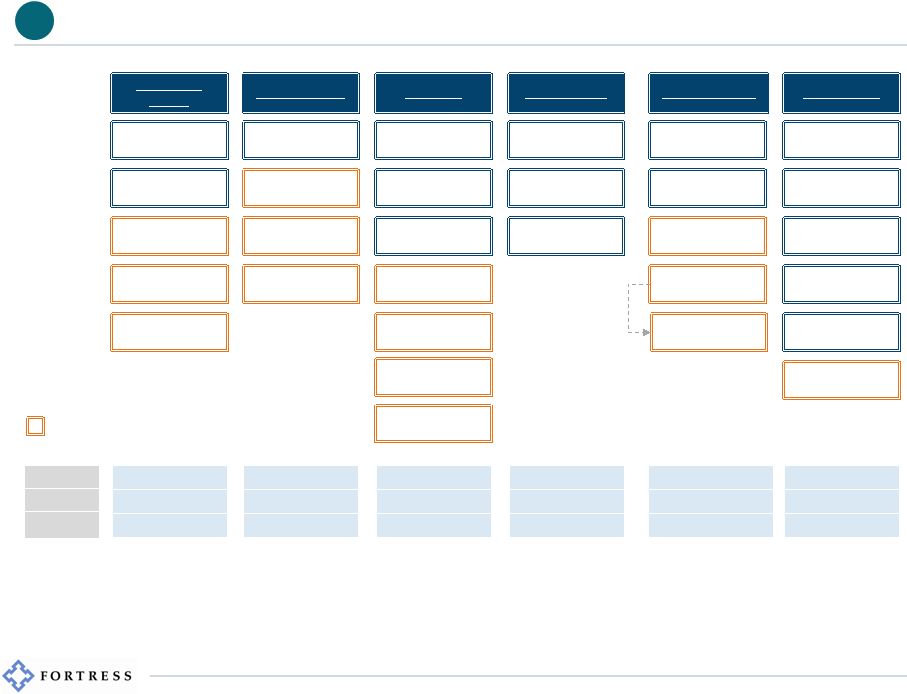 7 Diversified Business Model Continuing to Build From Core Strategies Permanent Equity Newcastle Eurocastle New Residential FTAI (2) New Media (1) Private Equity Credit PE Credit Hedge Liquid Markets Logan Circle General Buyout Funds (I-V) MSR Funds (I-II) Credit Opps. (I-II) Infrastructure (3) Italian NPLs (3) Real Assets Net Lease Life Settlements DBSO Worden Funds Value Recovery Funds Macro Endowment Style Convex Asia Asia Macro (5) Core-Based Fixed Income Short & Long Duration High Yield Emerging Markets Debt Growth Equities (1) The spin-off of Newcastle’s (NCT) media assets into New Media Investment Group Inc. (“New Media”) has been approved by Newcastle’s Board of Directors and is expected to be completed with the distribution of shares of common stock of New Media (NYSE: NEWM) on or about February 13, 2014. (2) Fortress’s ability to complete an IPO of Fortress Transportation and Infrastructure Investors LLC (“FTAI”) is subject to certain conditions, including but not limited to, the SEC declaring the registration statement relating to the IPO effective and approval of an application to list FTAI’s common stock on the NYSE. (3) Potential fund strategy or strategy still in fundraising period. (4) Japan Opportunity Fund was launched in June 2009; Japan Opportunity Fund II was launched in December 2011. (5) In January 2014, Fortress announced the launch of a new affiliated manager platform pursuant to which Fortress takes a non-control economic interest in a fund manager and earns fees for infrastructure, technology and related services, with Fortress Asia Macro Fund (“FAMF”) as the first fund to join the platform. (6) Subsequent to September 30, 2013, NCT raised $0.3 billion of permanent equity capital. 7 – 10 years $11.6 billion 1.2% 3 – 25 years $6.9 billion 1.4% Annual $5.7 billion 2.0% Monthly/Quarterly $6.9 billion 1.8% N/A $23.6 billion 0.2% Fund Life AUM Avg Mgmt Fee Rate Permanent $3.2 billion (6) 1.5% Japan Opps. (I-II) (4) Credit Opps. III Launched in last three years, in fundraising or potential strategy Real Estate Affiliated Manager Platform Sector-Based Fixed Income 1 |
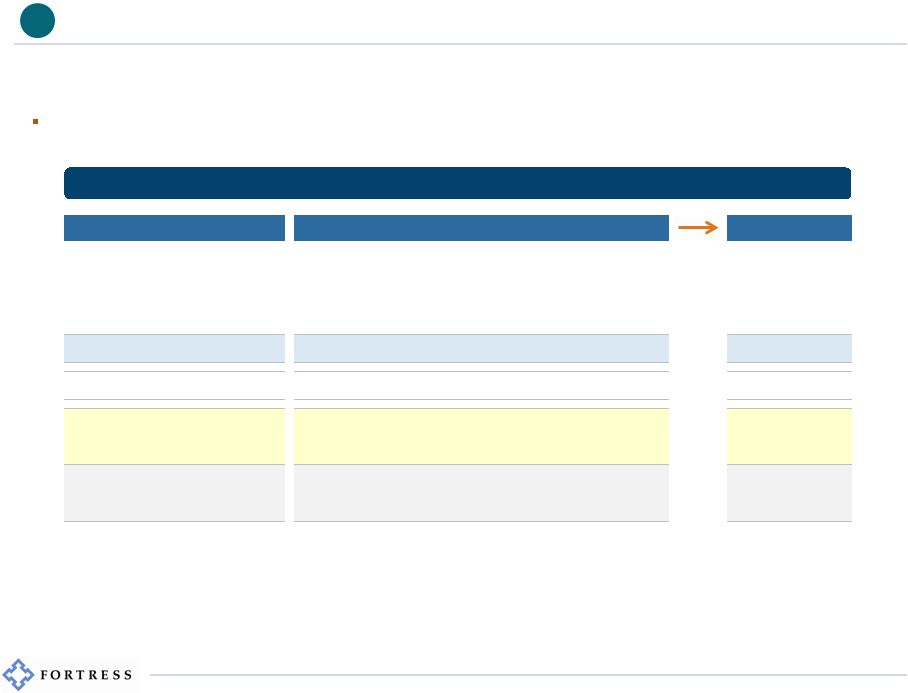
 Investment Opportunity Fortress Advantage Permanent Capital Vehicles Sector-Focused Funds Mortgage Servicing Rights (MSRs) MSR Fund I & Fund II Senior Housing & Care Transportation & Infrastructure acquisition of over $15 billion of assets worldwide since 2002 FTAI (2) Infrastructure Fund (3) Italian NPLs Italian NPL Fund (3) Total Capital Raised (2012 – December 2013) $1.8bn $2.6bn (4) Media 8 Build-out of Permanent Capital Vehicles & Sector PE Funds Leverage investment and operating experience in core sectors that have large, addressable markets, attractive supply/demand dynamics, favorable economics and long duration assets Fund currently raising private capital or public company with ability to raise additional equity 1 (1) Includes senior housing properties currently owned by Newcastle and managed by a FIG senior living property management subsidiary. (2) Fortress’s ability to complete an IPO of FTAI is subject to certain conditions, including but not limited to, the SEC declaring the registration statement relating to the IPO effective and approval of an application to list FTAI’s common stock on the NYSE. (3) Potential fund strategy or strategy still in fundraising period. (4) Includes $1.1 billion raised for MSR Fund II, $0.6 billion raised for MSR Fund I, $0.6 billion raised for Italian NPL Fund and $0.3 billion raised for WWTAI (now FTAI). (5) The spin-off of Newcastle’s media assets into New Media Investment Group Inc. (“New Media”) has been approved by Newcastle’s Board of Directors and is expected to be completed with the distribution of shares of common stock of New Media (NYSE: NEWM) on or about February 13, 2014. (5) |
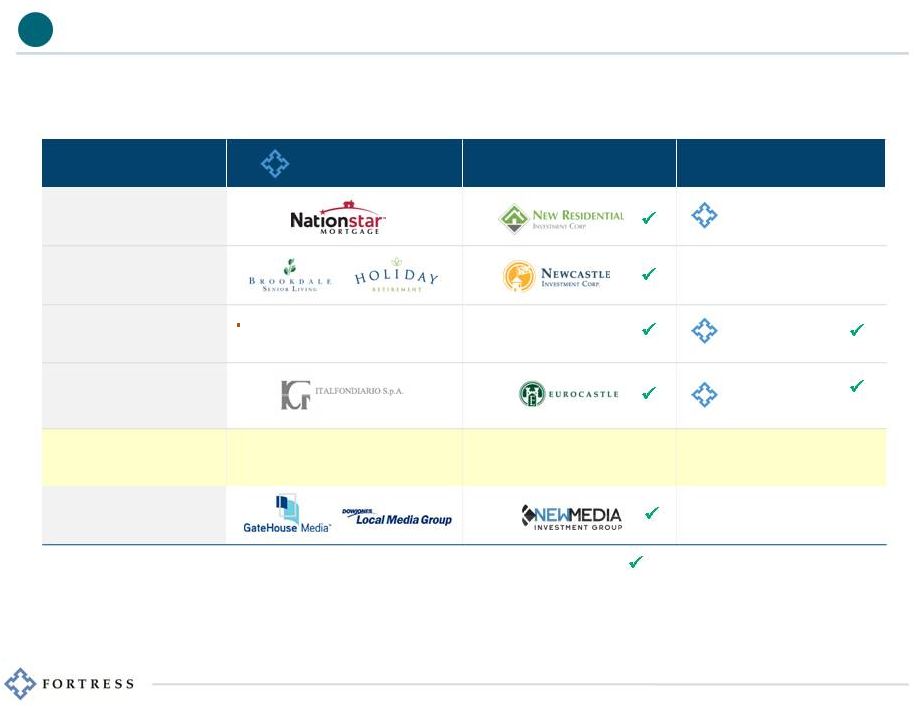
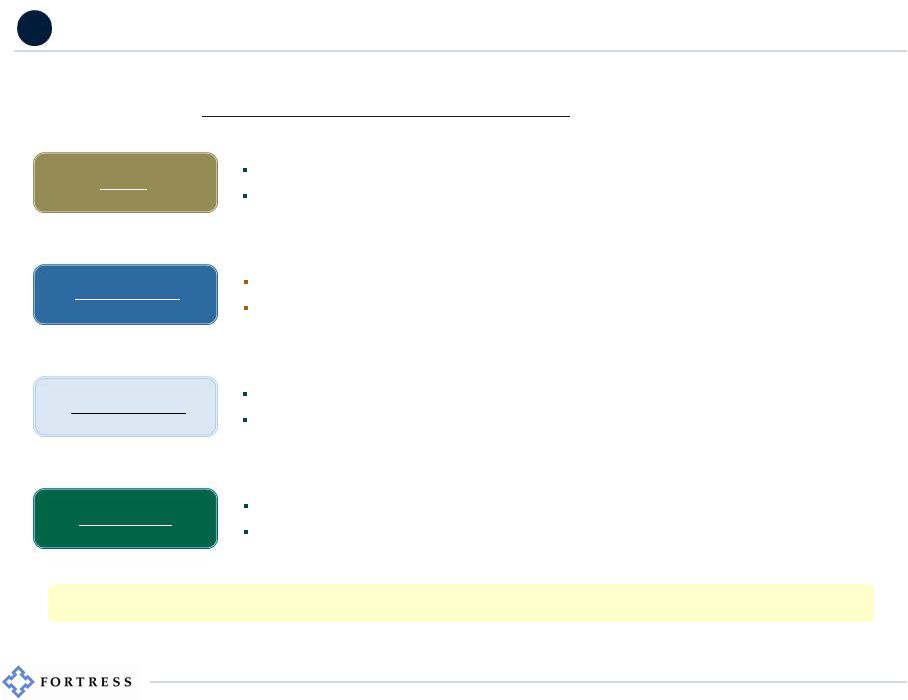
 9 NCT: A $2.0 Billion REIT (1) & Engine for Platform Diversification 1 Newcastle focused on harvesting value in core real estate investments, strategically acquiring senior housing properties and making opportunistic investments with attractive returns Each new permanent capital vehicle has meaningful growth prospects, which could drive additional management fees and potential incentive income to Fortress (1) Market Capitalization based on share price and shares outstanding as of February 7, 2014. (2) Newcastle, New Residential and New Media may invest in assets that differ significantly from its current portfolio and each company’s portfolio may change meaningfully over time. Any dividend declarations are at the sole discretion of the respective company’s Board of Directors and there can be no assurance of the amount or timing of any future dividends. New Media’s predecessor, GateHouse Media, Inc., recently emerged from bankruptcy, and there can be no assurance that it will be able to pay dividends. (3) The spin-off of Newcastle’s media assets into New Media has been approved by Newcastle’s Board of Directors and is expected to be completed with the distribution of shares of common stock of New Media (NYSE: NEWM) on or about February 13, 2014. NCT’s market cap was $8 million in 2009; combined market cap of NCT & NRZ is currently $3.5 billion (1) Senior Housing, CDOs, Other Debt Opportunistic REIT with Healthcare Focus Spun out from NCT in May 2013 Excess MSRs, Servicer Advances, RMBS, Residential Mortgage Loans Current Market Cap: $1.5 billion (1) Residential-focused Mortgage REIT Expected spin-off in February 2014 Local Newspapers, Local Directories, Digital Marketing Services (Propel) Dividend-Paying Local Media Owner (1) (2) (3) (2) (2) Current Market Cap: $2.0 billion |
 10 Meaningful Potential DE Upside from Growing Perm. Equity Platform Total permanent equity capital of $3.2 billion as of September 30, 2013 (1) There can be no assurance that Fortress will achieve any given target return. Target returns are subject to a number of trends and uncertainties, many of which are beyond our control, that could cause actual results to differ materially. (2) The hypothetical assumptions for AUM, management fees, incentive income, net returns and operating margins are presented solely for illustrative purposes and actual results could differ materially. (3) Assumes 1.5% management fee rate on incremental permanent equity capital. (4) Assumes 25% incentive fee rate over 10% hurdle. Net returns reflect performance data after taking into account management fees and expenses. (5) Assumes 10% appreciation on option grants of 10% of specified AUM. Assumes Fortress exercises its in-the-money Castle options and sells the resulting shares. (6) Assumes 70% operating margin. (7) Fund Management Distributable Earnings is a non-GAAP financial measure described in Fortress’s third quarter 2013 earnings release. The release is available in the “Public Shareholders – News” section of Fortress’s website, www.fortress.com. For a reconciliation of GAAP Net Income to Fund Management Distributable Earnings please see Appendix slide #2. (8) Based on 495 million dividend paying shares outstanding as of September 30, 2013. Assumed Incremental AUM $1,000 $2,000 $3,000 $10,000 Assumed Revenue Management Fees (3) $15 $30 $45 $150 $19 $38 $56 $188 Options (5) $10 $20 $30 $100 Total Revenue $44 $88 $131 $438 Assumed Expenses (6) ($13) ($26) ($39) ($131) Fund Mgmt DE (7) $31 $61 $92 $306 Fund Mgmt DE/share (8) $0.06 $0.12 $0.19 $0.62 Fund Mgmt DE at 15.0% net return $26 $53 $79 $263 Fund Mgmt DE at 20.0% net return $35 $70 $105 $350 Hypothetical Permanent Equity Capital Impact to Fortress Earnings (millions) (2) 1 Every $1 billion of incremental permanent equity capital could potentially generate annual distributable earnings of $26-35 million at a 15-20% target net investment return (1) Incentive Income, 17.5% net return (4) |
 11 Recently launched new affiliated manager platform to expand Fortress’s footprint in the liquid hedge fund investment space Fortress to take a minority, non-control economic interest in high potential start-up and established hedge fund managers Funds will be able to leverage Fortress’s existing technology, infrastructure and investor relationships Typical platform participant will pay fee to Fortress for back-office support and capital raising capabilities Liquid Markets: Scalability of New Affiliated Manager Platform Fortress Asia Macro Fund (“FAMF”) to become anchor strategy for new growth platform (1) Asia Macro Funds have $1.8 billion of AUM (2) FY 2013 net returns of 17.1% CIO Adam Levinson to remain as Graticule CIO and is expected to join FIG Board of Directors Fortress will retain perpetual minority interest in Graticule, including economics generated by FAMF and future Graticule funds Potential Platform Growth Fortress Asia Macro business will be rebranded as Graticule Asset Management Asia (“Graticule”) (1) In January 2014, Fortress announced the launch of a new affiliated manager platform pursuant to which Fortress takes a non-control economic interest in a fund manager and earns fees for infrastructure, technology and related services, with Fortress Asia Macro Fund (“FAMF”) as the first fund to join the platform. (2) Combined AUM for Fortress Asia Macro Ltd, Fortress Asia Macro LP and Fortress Asia Macro Managed Accounts as of September 30, 2013. FAMF / Graticule Multi-Manager / Multi-Strat Global L/S Equity Fixed-Income Relative Value Anchor Strategy Potential New Strategies Intend to add one or two managers each year Focused on smaller managers ($25mm – 500mm in AUM) 1 |
 12 Logan Circle’s AUM has more than doubled to $23.6 billion since acquisition in 2010 All Logan Circle fixed income strategies currently in the market raising new capital Recently launched new growth equities business; team that previously managed $20 billion currently raising capital for four new equity strategies with substantially higher fee rates (60bps) Logan Circle: Focus on Organic Growth and Strategic Expansion Hypothetical Annual Impact to DE from Assumed Logan Circle AUM Growth (1) Established, highly scalable global platform with potential to generate substantial fee earnings (1) The hypothetical assumptions for AUM growth, management fees, and operating margins are presented solely for illustrative purposes and actual results could differ materially. (2) Fund Management Distributable Earnings is a non-GAAP financial measure described in Fortress’s third quarter 2013 earnings release. The release is available in the “Public Shareholders – News” section of Fortress’s website, www.fortress.com. For a reconciliation of GAAP Net Income to Fund Management Distributable Earnings please see Appendix slide #2. (3) Based on 495 million dividend paying shares outstanding as of September 30, 2013. CORE FIXED INCOME Assumed AUM (millions) $30,000 $40,000 $50,000 Assumed Mgmt Fee Rate (bps) 15 16 17 Gross Annual Mgmt Fees $45 $64 $85 Assumed Operating Margin 20% 30% 40% Fund Mgmt DE (2) $9 $19 $34 Fund Mgmt DE/share (3) $0.02 $0.04 $0.07 NEW GROWTH EQUITIES Assumed AUM (millions) $5,000 $10,000 $20,000 Assumed Mgmt Fee Rate (bps) 60 60 60 Gross Annual Mgmt Fees $30 $60 $120 Assumed Operating Margin 20% 30% 40% Fund Mgmt DE (2) $6 $18 $48 Fund Mgmt DE/share (3) $0.01 $0.04 $0.10 1 |
 Strong Investment Performance is the Cornerstone of Growth & Value Creation 13 2 |
 14 Investment Performance Snapshot For additional investment performance disclosure please see Appendix slide #1. (1) As of September 30, 2013. Fortress Macro Funds FY 2013 net returns of 14.1% Fortress Asia Macro Funds FY 2013 net returns of 17.1% Fund performance drives new capital formation, higher incentive income and earnings growth DBSO LP and DBSO Ltd FY 2013 net returns of 18.4% and 15.6%, respectively FCO, FCO II and FJOF annualized ITD net returns of 25.9%, 18.4% and 20.6%, respectively (1) PE Fund YTD 2013 NAV appreciation of 17.2% (1) Over $6 billion of value created since the beginning of 2012 (1) 13 of 16 LCP fixed income strategies outperformed respective benchmarks YTD in 2013 (1) All 16 LCP fixed income strategies have outperformed respective benchmarks since inception (1) 2 Credit Private Equity Liquid Markets Logan Circle Strong YTD investment performance has led to $357 million of incentive income in the first nine months of 2013, a 28% increase compared to full year 2012 |
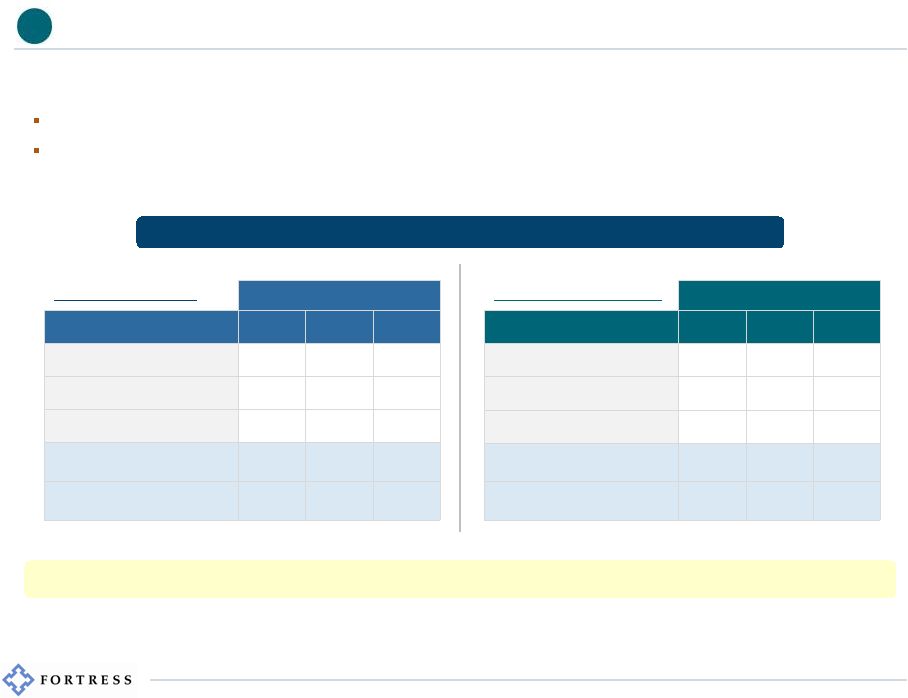
 15 Performance Drives...Substantial Embedded Value Yet to Impact DE $807 million, or $1.63 per share (1) , of gross unrecognized incentive income $706 million, or $1.43 per share (1) , of gross unrecognized incentive income from Credit Funds $90 million in gross unrecognized incentive income from in-the-money options for PE Castles (2) (1) Based on 495 million dividend paying shares outstanding as of September 30, 2013. (2) Unrecognized Incentive Income for Private Equity Castles includes incentive income that would have been recorded in Distributable Earnings if Fortress had exercised all of its in-the-money Newcastle, New Residential and Eurocastle options and sold all of the resulting shares at their September 30, 2013 closing price. (3) The Incentive Eligible NAV Above Incentive Threshold presented for Hedge Funds excludes sidepocket investments. The Incentive Eligible NAV Above Incentive Income Threshold presented for Private Equity Funds and Credit Private Equity Funds represents total fund NAV. Includes $1.2 billion of Private Equity Castle equity eligible for incentive as of September 30, 2013. (4) Unrecognized Incentive Income presented above includes the impact of sidepocket investments on Hedge Funds. Unrecognized Incentive Income for Private Equity Funds, Credit Private Equity Funds and Hedge Fund sidepocket and redeeming capital account (RCA) investments has not been recognized in Distributable Earnings and will be recognized when realized; Undistributed Incentive Income for other Hedge Fund investments was recognized in Distributable Earnings when earned. Gross Unrecognized Incentive Income (4) (millions) Incentive Eligible NAV Above Incentive Threshold (3) Gross Unrecognized Incentive Income (4) Credit PE Funds $8,247 $612 Credit Hedge Funds $4,794 $94 PE Funds $737 $5 PE Castles $1,196 $90 (2) Liquid Hedge Funds $3,831 $6 Total $18,805 $807 Incentive Eligible NAV Above Incentive Threshold (3) (billions) (millions) $16.3 $18.8 YE2012 3Q2013 $649 $807 YE2012 3Q2013 2 |
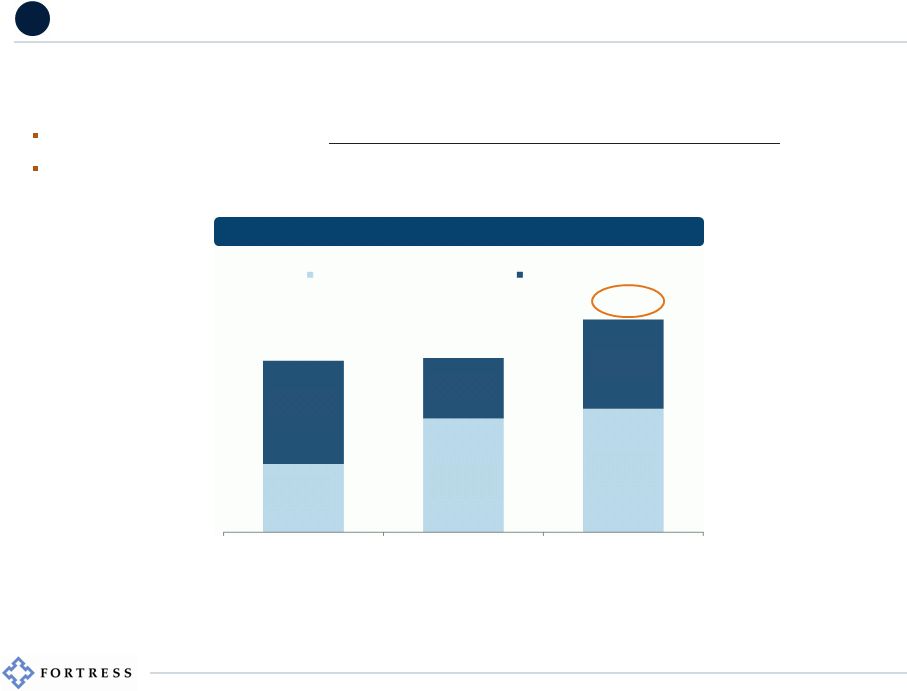 16 Performance Drives...Significant Credit Incentive Income (1) Annualized five-year net returns represent management’s unaudited return estimates from January 1, 2009 through December 31, 2013. 2 Credit Hedge and Credit PE Fund performance has resulted in substantial recognized and unrecognized incentive income Based on annualized YTD 2013 results, Credit business on pace for record full year of incentive income Annualized five-year net returns of 19.3% an 20.3% for DBSO LP and DBSO Ltd, respectively (1) Gross Recognized Credit Incentive Income (millions) $196 $199 $243 $78 $130 $141 $118 $69 $102 FY 2011 FY 2012 YTD 2013 Credit Hedge Funds Credit PE Funds |
 17 Performance Drives...Carry Potential in Main PE Funds 2 Legacy PE funds have potential to generate substantial fees over next three to five years $11.4 billion of value created since trough in 1Q 2009 Completed IPO of Springleaf (NYSE: LEAF) in 4Q 2013 at $17 per share, representing a 10x multiple of invested capital (1) For additional investment performance disclosure please see Appendix slide #1. (2) Multiple equals current NAV plus inception to date distributions, divided by the lesser of capital committed or equity invested. For purposes of calculating the gross multiple, equity invested excludes capital called for management fees and other expenses. The inclusion of such amounts would reduce the gross multiple. Gross multiple is not an accurate indicator of the Company’s proximity to incentive income thresholds and is different from the statistic which would be computed based on the Company’s periodic 34 Act reporting, which reports net amounts. (3) Florida includes Florida East Coast Railway and Flagler. (4) Includes Fund III Co, Fund IV Co, Fund V Co, FHIF, FECI, FRIC, FRID, FICO, GAGACQ-Co and FFPF. (5) Includes MSR Funds I & II and WWTAI (now FTAI). PE Fund (vintage) Current Fund NAV YTD 2013 Current Gross NAV Appreciation (1) Multiple (2) Select Investments Fund II (2002) $0.1bn 7.8% 1.8x GAGFAH* Fund III (2004) $2.8bn 45.5% 1.7x Nationstar*, GAGFAH* Fund IV (2006) $4.4bn 23.7% 1.5x Nationstar*, Florida (3) , Holiday Fund V (2007) $4.4bn 14.6% 1.3x Florida (3) , CW Financial, Springleaf*, Penn Gaming* Total Main Funds $11.7bn 24.4% 1.6x Co-investments (4) $5.6bn 5.0% 1.1x Florida (3) , Holiday Sector Funds (5) $0.6bn 13.0% 1.1x MSRs, Transportation & Infrastructure Assets Total PE Funds $17.9bn 17.2% 1.4x *Publicly traded company |
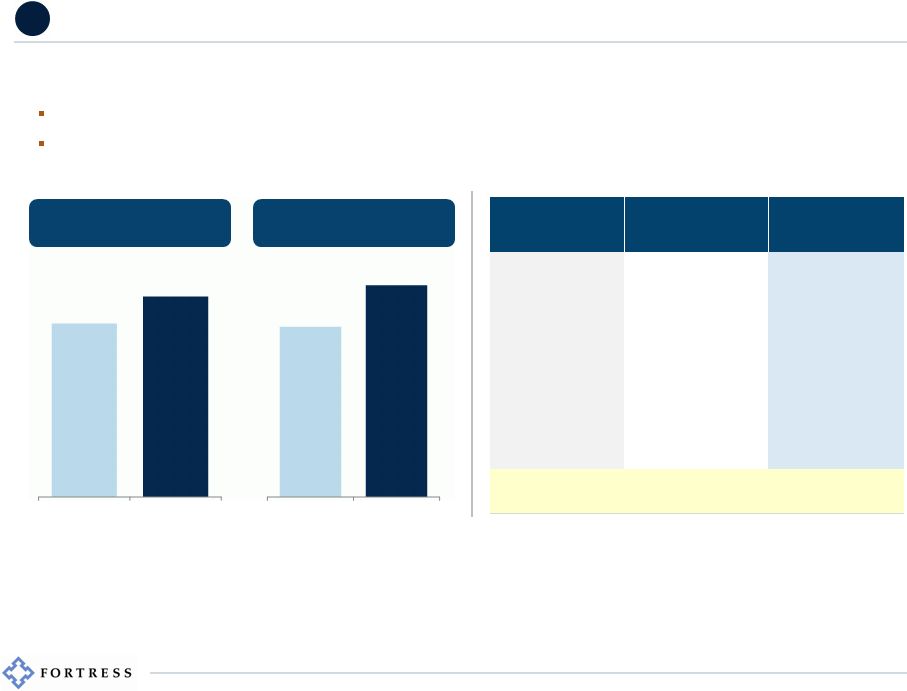
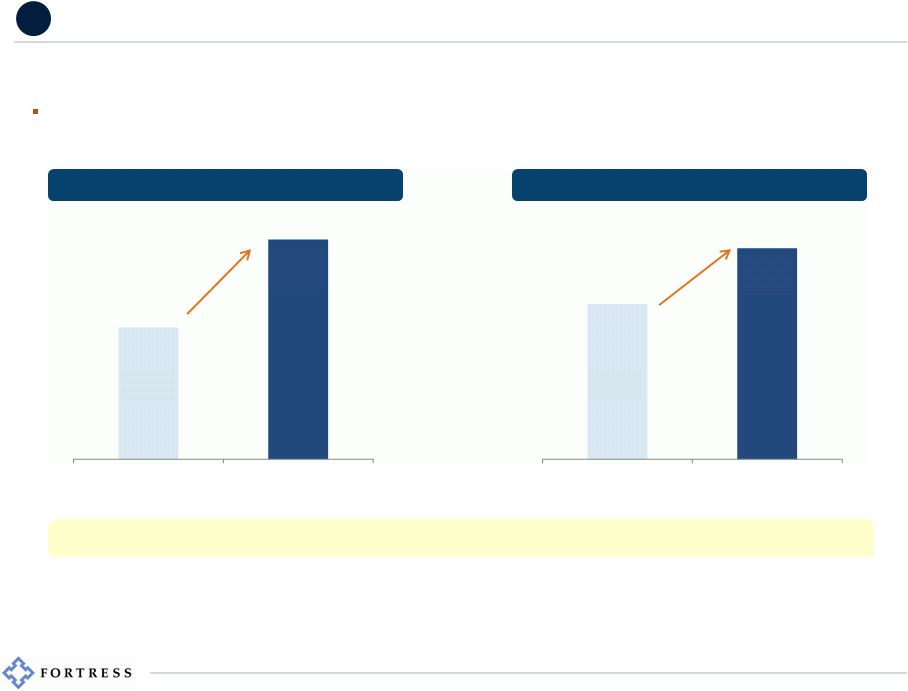 2 18 (1) Represents Fortress Macro Onshore Fund LP, Fortress Macro Fund Ltd, Fortress Macro MA1, Fortress Redwood Fund Ltd , Fortress Macro managed accounts, Drawbridge Global Macro Fund LP and Drawbridge Global Macro Intermediate Fund LP. (2) Net returns are for Fortress Macro Fund Ltd only and exclude certain other funds, which may have returns that are materially lower than those presented above. FY 2013 performance data are based on management’s unaudited return estimates for performance from January 1, 2013 to December 31, 2013. (3) The incentive income figures presented above are gross of profit-sharing expenses. Macro Fund (1) Incentive Income (3) Performance Drives...Macro Fund Flows & Incentive Income Macro Fund (1) Capital Raised +58% +36% Continued strong Macro Fund (1) performance can substantially alter earnings dynamics (billions) (millions) Macro Hedge Fund (1) performance can drive meaningful AUM and earnings growth Fortress Macro Fund net returns of 14.1% for FY 2013 (2) $0.6 FY 2012 YTD 2013 $1.0 $53 $72 FY 2012 YTD 2013 |
 Substantial & Underappreciated Value on Balance Sheet 19 3 |
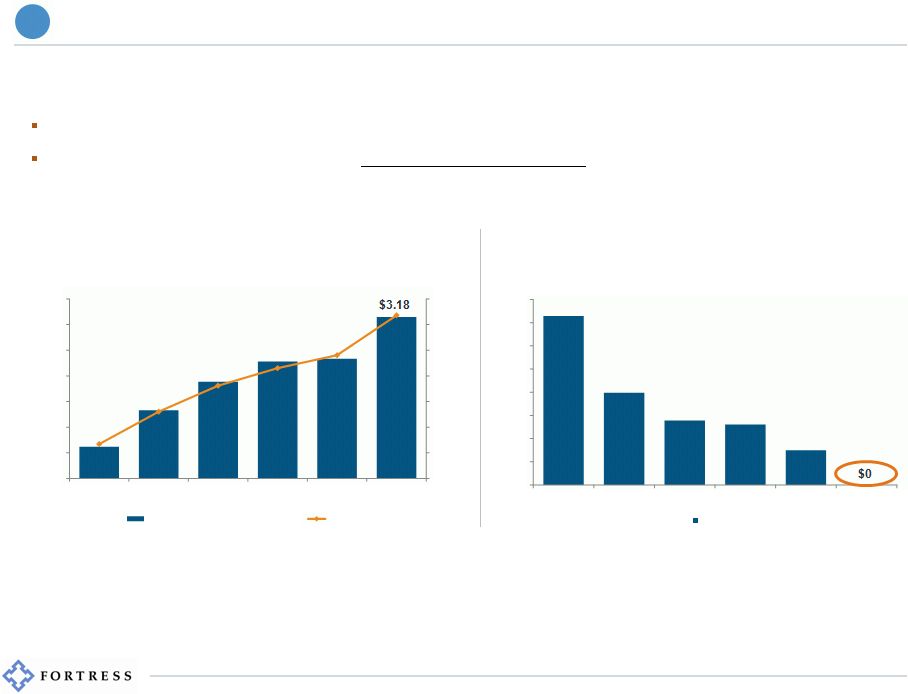 20 Balance Sheet in Strongest Position Since IPO... 3 Net Cash & Investments increased 37% YoY to $3.18 per share $603 million of embedded gains that would be recognized in earnings if investments were liquidated at current values $311 million of cash & cash equivalents and no outstanding debt obligations as of September 30, 2013 Net Cash & Investments (1) (millions) Outstanding Debt Obligations (millions) (per share) $0.00 $0.50 $1.00 $1.50 $2.00 $2.50 $3.00 $3.50 $0 $250 $500 $750 $1,000 $1,250 $1,500 $1,750 4Q08 4Q09 4Q10 4Q11 4Q12 3Q13 Net Cash & Investments Per Share $0 $100 $200 $300 $400 $500 $600 $700 $800 4Q08 4Q09 4Q10 4Q11 4Q12 3Q13 Total Debt (1) Net Cash & Investments, which is a non-GAAP financial measure, means cash & cash equivalents plus investments less debt outstanding, as described in Fortress’s third quarter 2013 earnings release. The release is available in the “Public Shareholders – News” section of Fortress’s website, www.fortress.com. For a reconciliation of GAAP Book Value Per Share to Net Cash & Investments Per Share please see Appendix slide #6. |
 21 ...With Considerable Upside Potential (1) GAGFAH, Newcastle, New Residential and Eurocastle shares. (2) Brookdale, Eurocastle, GAGFAH, Gatehouse, Walker & Dunlop, Penn Gaming and Nationstar shares. (3) Investments in GAGACQ, FRID, FRIC, FHIF and FECI. (4) Hedge Funds include Credit Hedge Fund and Liquid Hedge Fund Investments and related sidepockets. (5) Current Assets includes cash and direct investments in public stock. Balance Sheet As of Sept. 30, 2013 ($ millions) Carrying Value % of Total Cash & Cash Equivalents 311 20% Direct Public Stock (1) 80 5% Cash & Direct Equity Investments 391 25% Public Stock of Portfolio Co’s (2) 161 10% Private Co-Investment in Portfolio Co’s (3) 430 27% Direct Investment in PE Funds 216 14% Direct Investment in Credit PE Funds 145 9% Private Equity Fund Investments 952 60% Liquid Capital 120 8% Sidepocket Investments 104 6% Hedge Fund Investments (4) 224 14% Other Direct Investments 8 1% Total Cash & Investment Assets 1,575 100% Potential for increased distributions from balance sheet realization events Nearly 80% of balance sheet assets in cash, direct equity or 2007 or earlier vintage funds $807 million of private equity fund investments with meaningful upside potential Total Cash & Investments by Vintage or Type (millions) 3 $0 $200 $400 $600 $800 $1,000 $1,200 $1,400 $1,600 Current Assets Pre 2006 2006 2007 Post 2007 Hedge Funds Total (5) |
 22 Summary |
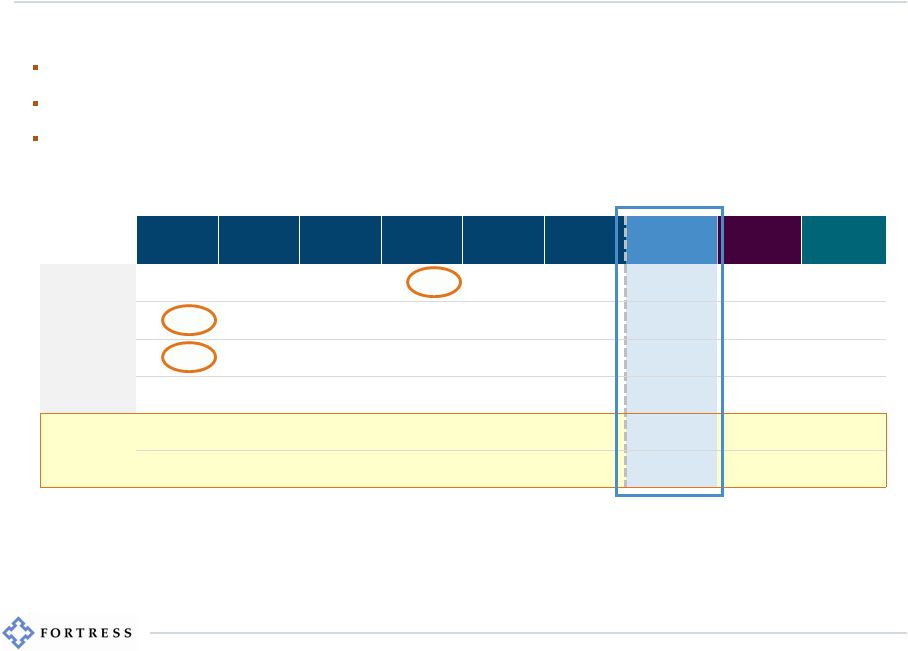 23 Strong YTD 2013 Results With Significant Upside Potential 2007 2008 2009 2010 2011 2012 LTM 3Q2013 (2) Annual Average (3) Annual High (3) Credit 61 35 44 168 138 126 177 95 168 PE & Castles 312 81 137 145 118 115 123 151 312 (4) Liquid 161 102 28 64 14 45 108 69 161 Logan Circle n/a n/a n/a (15) (17) (10) (10) (14) (10) Total (5) 524 216 208 358 253 277 398 301 631 Per share (6) $1.24 $0.48 $0.42 $0.69 $0.48 $0.52 $0.80 $0.61 $1.28 ($ millions) Fund Management Distributable Earnings – By Business (1) Growth opportunities across every business can meaningfully alter earnings dynamics New fund launches, growth of existing platforms and strategic additions can drive higher management fee revenues Hedge fund performance and increased PE realization activity can drive higher incentive income Balance sheet gains and dispositions can drive higher investment income (1) Fund Management Distributable Earnings is a non-GAAP financial measure described in Fortress’s third quarter 2013 earnings release. The release is available in the “Public Shareholders – News” section of Fortress’s website, www.fortress.com. For a reconciliation of GAAP Net Income to Fund Management Distributable Earnings please see Appendix slide #2. (2) Reflects the twelve month period from October 1, 2012 through September 30, 2013. (3) Does not include LTM 3Q2013 results. (4) Fortress has reserved $57 million of net clawback liabilities in respect of DE previously distributed. (5) Total Fund Management DE for 2007, 2008, 2009 and 2010 includes unallocated expenses of $9 million, $2 million, $1 million and $4 million, respectively. (6) Based on reported weighted average dividend paying shares outstanding in applicable period for 2007, 2008, 2009, 2010, 2011 and 2012. Based on 495 million dividend paying shares outstanding as of September 30, 2013 for LTM 3Q2013, Annual Average and Annual High. |
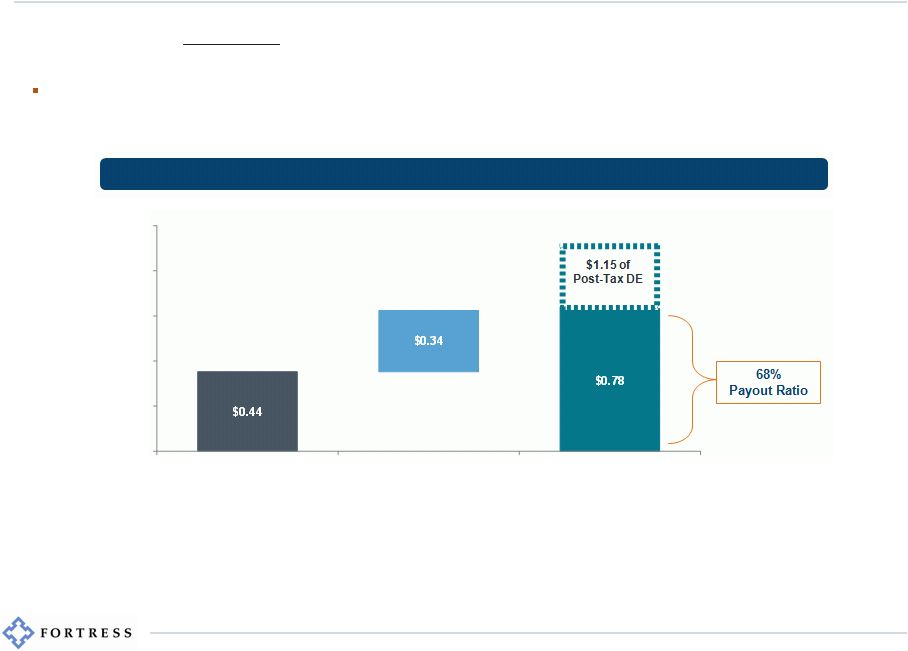 24 Substantial Cash Generation Supports Shareholder Distributions (1) Increased base quarterly dividend by 20% to $0.06 per share in 4Q 2012 (1) Any dividend declarations or share buybacks may be subject to approval by FIG’s Board of Directors and there can be no assurance of the amount or timing of any future dividends or share buybacks. (2) Repurchased 51.3 million shares in 4Q 2012 for a total purchase price of $180 million. 534 million shares outstanding at time of purchase. (3) Represents the period from 4Q 2011 through 3Q 2013. Shareholder Distributions Over Last Eight Quarters (per dividend paying share) (3) (2) $0.00 $0.25 $0.50 $0.75 $1.00 $1.25 Base Quarterly Distributions Share Repurchase Total Have distributed nearly 70% of post-tax DE over last eight quarters in the form of base quarterly dividends and 4Q 2012 share repurchase (2) |
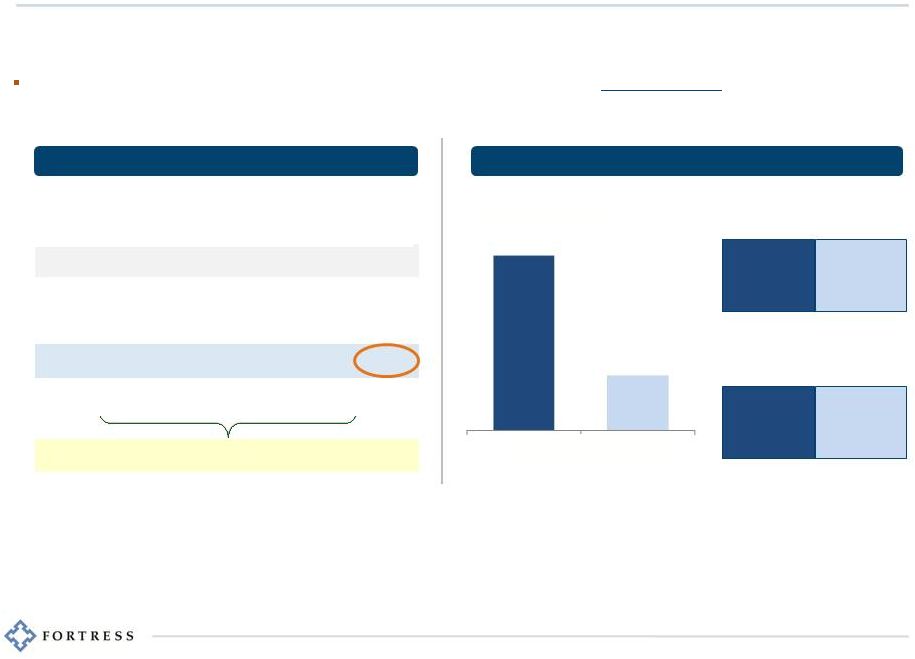 25 Significant Discount to Traditionals: Room For Multiple Expansion (1) “Traditional Asset Managers” defined as S&P 500 Asset Management and Custody Trust Banks Sub Industry Index from Bloomberg. (2) FIG stock price as of February 7, 2014. (3) Net Cash & Investments, which is a non-GAAP financial measure, means cash & cash equivalents plus investments less debt outstanding, as described in Fortress’s third quarter 2013 earnings release. The release is available in the “Public Shareholders – News” section of Fortress’s website, www.fortress.com. For a reconciliation of GAAP Book Value Per Share to Net Cash & Investments Per Share please see Appendix slide #6. (4) 2013 consensus earnings estimates per Bloomberg. (5) Trailing two-year CAGR of DEPS for FIG and EPS for Traditional Asset Managers. Based on annualized YTD 2013 results for FIG and FY 2013 results for Traditional Asset Managers. (6) Based on FIG’s stock price as of February 7, 2014 and annualized YTD 2013 dividend with no consideration given for potential 4Q top-up dividend. Annualized dividend yield for Traditional Asset Managers sourced from Bloomberg. (7) Based on YTD 2013 operating margin for FIG. FY 2013 Traditional Asset Manager operating margin sourced from Bloomberg. Earnings Growth (5) Dividend Yield (6) Operating Margin (7) 3.0% FIG 1.8% Trad. Asset Managers (1) 39% FIG 27% Trad. Asset Managers (1) (1) Price / Earnings Multiple Calculation (per share) Superior Valuation Metrics to Traditionals Current FIG Stock Price (2) $7.89 Less: Net Cash & Investments (3) $3.18 Stock Price ex. B/S Value $4.71 2013 Consensus DEPS (4) $0.75 Price / Earnings Ratio 10.5x Price / Earnings Ratio (ex. B/S Value) 6.3x Traditional Asset Manager Price / Earnings Ratio (1) 16.1x Implies FIG is trading at a ~60% discount to Traditionals 32% 10% FIG Trad. Asset Managers Fortress trades at a ~60% discount to traditional asset managers (1) (net of balance sheet value) despite superior earnings growth and operating fundamentals At a traditional asset manager multiple of 16x earnings, FIG would trade at over $12.00 per share – with no credit for embedded value and future growth |
 Appendix 26 |
 27 Appendix Slide #1 Liquid Hedge Funds Net returns are for Fortress Macro Fund Ltd and Fortress Asia Macro Fund Ltd only and exclude certain other funds, which may have returns that are materially lower than those presented above. Net returns reflect performance data after taking into account management fees and expenses borne by such funds and incentive allocations, as applicable. FY 2012 data reflect audited returns, while FY 2013 performance data are based on management’s unaudited return estimates for performance from January 1, 2013 to December 31, 2013. Such data may change upon completion of the month-end and year-end valuation procedures, and any such changes could be material. Credit Hedge Funds Net returns are for Drawbridge Special Opportunities Fund LP and Drawbridge Special Opportunities Fund Ltd only and exclude certain other funds, which may have returns that are materially lower than those presented above. Net returns reflect performance data after taking into account management fees and expenses borne by the above referenced funds, and incentive allocations, as applicable. Performance data for FY 2013 are based on management’s unaudited estimates, as of the date hereof, for performance of the above referenced funds from January 1, 2013 to December 31, 2013. Such data may change upon completion of the month-end and year-end valuation procedures, and any such changes could be material Private Equity Funds Percentages exclude certain other funds included in the Private Equity segment, which, if included, could materially reduce the percentages presented. Percentages represent the aggregate performance of multiple funds rather than any single fund. For additional detail regarding historical performance of individual funds, which presents fund performance as internal rates of return, please see “Management’s Discussion and Analysis of Financial Condition and Results of Operation” in our quarterly report on Form 10-Q for the period ending September 30, 2013. FY 2012 data reflect audited returns, while YTD 2013 data reflects unaudited return estimates through September 30, 2013. Such data may change upon completion of the month-end and year-end valuation procedures, and any such changes could be material. Credit PE Funds Net returns are for Fortress Credit Opportunities Funds I, Credit Opportunities Fund II and Japan Opportunity Fund only and exclude certain other funds, which may have returns that are materially lower than those presented above. Net returns represent net annualized internal rates of return to limited partners after management fees and incentive allocations, and are computed on an inception-to-date basis consistent with industry standards. Annualized inception-to-date data reflects management’s unaudited return estimates through September 30, 2013. Such data may change upon completion of the month-end and year-end valuation procedures, and any such changes could be material. |
 2010 2011 2012 GAAP Net Income (Loss) (782) $ (1,117) $ 219 $ Principals' and Others' Interests in (Income) Losses of Consolidated Subsidiaries 497 685 (141) GAAP Net Income (Loss) Attributable to Class A Shareholders (285) $ (432) $ 78 $ Private Equity incentive income 38 44 (2) Hedge Fund incentive income 3 - - Reserve for clawback - (5) 8 Distributions of earnings from equity method investees 15 11 6 Losses (earnings) from equity method investees (87) (34) (142) Losses (gains) on options (2) 5 (6) Losses (gains) on other Investments (1) 23 (41) Impairment of investments (5) (4) (1) Adjust income from the receipt of options - (13) (22) Mark-to-market of contingent consideration in business combination (1) (3) - Amortization of intangible assets and impairment of goodwill 1 22 - Employee, Principal and director compensation, primarily equity based 218 235 219 Principals' forfeiture agreement expense (expired in 2011) 952 1,051 - Adjust non-controlling interests related to Fortress Operating Group units (507) (691) 133 Tax receivable agreement liability reduction (22) (3) 9 Taxes 55 36 39 Pre-tax Distributable Earnings 372 $ �� 242 $ 278 $ Investment Loss (income) (34) (8) (16) Interest Expense 20 19 15 Fund Management DE 358 $ 253 $ 277 $ GAAP Revenues 950 $ 859 $ 970 $ Adjust management fees 2 (1) - Adjust incentive income 44 41 5 Adjust income from the receipt of options - (13) (22) Other revenues (156) (179) (196) Segment Revenues 840 $ 707 $ 757 $ Twelve Months Ended December 31, 28 Appendix Slide #2 Reconciliation of GAAP Net Income (Loss) to Pre-tax Distributable Earnings and Fund Management DE (dollars in millions) |
 September 30, 2012 June 30, 2013 September 30, 2013 GAAP Net Income (Loss) 7 $ (2) $ 101 $ 166 $ Principals' and Others' Interests in (Income) Losses of Consolidated Subsidiaries (6) - (59) (111) GAAP Net Income (Loss) Attributable to Class A Shareholders 1 $ (2) $ 42 $ 55 $ Private Equity incentive income 14 34 2 58 Hedge Fund incentive income 46 133 (6) 186 Reserve for clawback - - 1 3 Distributions of earnings from equity method investees 2 5 3 12 Losses (earnings) from equity method investees (48) (24) (57) (117) Losses (gains) on options 6 5 (3) (27) Losses (gains) on other Investments (4) (2) 4 (9) Impairment of investments (1) (1) - (1) Adjust income from the receipt of options (9) (10) - (36) Amortization of intangible assets and impairment of goodwill - - - - Employee, Principal and director compensation, primarily equity based 49 13 6 34 Adjust non-controlling interests related to Fortress Operating Group units 4 (4) 58 105 Tax receivable agreement liability reduction - - - 8 Taxes 4 1 15 42 Pre-tax Distributable Earnings 64 $ 148 $ 65 $ 313 $ Investment Loss (income) (4) (6) (13) (24) Interest Expense 3 2 1 5 Fund Management DE 63 $ 144 $ 53 $ 294 $ GAAP Revenues 181 $ 223 $ 232 $ 699 $ Adjust management fees - - - - Adjust incentive income 60 167 (3) 247 Adjust income from the receipt of options (9) (10) - (36) Other revenues (51) (53) (51) (156) Segment Revenues 181 $ 327 $ 178 $ 754 $ Three Months Ended Nine Months Ended September 30, 2013 29 Appendix Slide #3 Reconciliation of GAAP Net Income (Loss) to Pre-tax Distributable Earnings and Fund Management DE (dollars in millions) |
 30 Appendix Slide #3A ‘‘Distributable earnings’’ is Fortress’s supplemental measure of operating performance used by management in analyzing segment and overall results. It reflects the value created which management considers available for distribution during any period. As compared to generally accepted accounting principles (‘‘GAAP’’) net income, distributable earnings excludes the effects of unrealized gains (or losses) on illiquid investments, reflects contingent revenue which has been received as income to the extent it is not expected to be reversed, and disregards expenses which do not require an outlay of assets, whether currently or on an accrued basis. Distributable earnings is reflected on an unconsolidated and pre-tax basis, and, therefore, the interests in consolidated subsidiaries related to Fortress Operating Group units (held by the principals) and income tax expense are added back in its calculation. Distributable earnings is not a measure of cash generated by operations which is available for distribution nor should it be considered in isolation or as an alternative to cash flow or net income in accordance with GAAP and it is not necessarily indicative of liquidity or cash available to fund the Company’s operations. For a complete discussion of distributable earnings and its reconciliation to GAAP, as well as an explanation of the calculation of distributable earnings impairment, see note 10 to the financial statements included in the Company’s Quarterly Report on Form 10-Q for the quarter ended September 30, 2013. Fortress’s management uses distributable earnings: • in its determination of periodic distributions to equity holders; • in making operating decisions and assessing the performance of each of the Company’s core businesses; • for planning purposes, including the preparation of annual operating budgets; and • as a valuation measure in strategic analyses in connection with the performance of its funds and the performance of its employees. Growing distributable earnings is a key component to the Company’s business strategy and distributable earnings is the supplemental measure used by management to evaluate the economic profitability of each of the Company’s businesses and total operations. Therefore, Fortress believes that it provides useful information to investors in evaluating its operating performance. Fortress’s definition of distributable earnings is not based on any definition contained in its amended and restated operating agreement. “Fund management DE” is equal to pre-tax distributable earnings excluding our direct investment-related results. It is comprised of “Segment Revenues” net of “Segment Expenses” and “Principal Performance Payments.” Fund management DE and its components are used by management to analyze and measure the performance of our investment management business on a stand-alone basis. Fortress defines segment operating margin to be equal to fund management DE divided by segment revenues. The Company believes that it is useful to provide investors with the opportunity to review our investment management business using the same metrics. Fund management DE and its components are subject to the same limitations as pre-tax distributable earnings, as described above. |
 31 Appendix Slide #4 (1) Includes both fully vested and nonvested restricted Class A shares. (2) Includes both fully vested and nonvested Fortress Operating Group RPUs. Reconciliation of Weighted Average Class A Shares Outstanding (Used for Basic EPS) to Weighted Average Dividend Paying Shares and Units Outstanding (Used for DEPS) 2010 2011 2012 Weighted Average Class A Shares Outstanding (Used for Basic EPS) 165,446,404 186,662,670 214,399,422 Weighted average fully vested restricted Class A share units with dividend equivalent rights (4,450,465) (4,082,385) (3,194,380) Weighted average fully vested restricted Class A shares (174,203) (480,777) (737,309) Weighted Average Class A Shares Outstanding 160,821,736 182,099,508 210,467,733 Weighted average restricted Class A shares (1) 339,533 522,365 749,007 Weighted average fully vested restricted Class A share units which are entitled to dividend equivalent payments 4,450,465 4,082,385 3,194,380 Weighted average nonvested restricted Class A share units which are entitled to dividend equivalent payments 19,695,924 13,994,757 6,609,155 Weighted average Fortress Operating Group units 302,123,167 304,832,761 299,559,853 Weighted average Fortress Operating Group RPUs (2) 31,000,000 22,563,471 12,817,851 Weighted Average Class A Shares Outstanding (Used for DEPS) 518,430,825 528,095,247 533,397,979 Weighted average vested and nonvested restricted Class A share units which are not entitled to dividend equivalent payments 26,436,872 23,439,170 18,419,024 Weighted Average Fully Diluted Shares and Units Outstanding (Used for Diluted DEPS) 544,867,697 551,534,417 551,817,003 Twelve Months Ended December 31, “Dividend paying shares and units” represents the number of shares and units outstanding at the end of the period which were entitled to receive dividends or related distributions. The Company believes it is useful for investors in computing the aggregate amount of cash required to make a current per share distribution of a given amount per share. It excludes certain potentially dilutive equity instruments, primarily non-dividend paying restricted Class A share units, and, therefore, is limited in its usefulness in computing per share amounts. Accordingly, dividend paying shares and units should be considered only as a supplement and not an alternative to GAAP basic and diluted shares outstanding. The Company’s calculation of dividend paying shares and units may be different from the calculation used by other companies and, therefore, comparability may be limited. |
 32 Appendix Slide #5 (1) Includes both fully vested and nonvested restricted Class A shares. (2) Includes both fully vested and nonvested Fortress Operating Group RPUs. Reconciliation of Weighted Average Class A Shares Outstanding (Used for Basic EPS) to Weighted Average Dividend Paying Shares and Units Outstanding (Used for DEPS) Weighted Average Class A Shares Outstanding (Used for Basic EPS) 239,404,587 220,641,776 234,750,585 212,297,285 Weighted average fully vested restricted Class A share units with dividend equivalent rights (982,225) (2,519,869) (2,821,011) (4,068,945) Weighted average fully vested restricted Class A shares (952,016) (828,211) (909,641) (706,787) Weighted Average Class A Shares Outstanding 237,470,346 217,293,696 231,019,933 207,521,553 Weighted average restricted Class A shares 1 952,016 828,211 909,641 722,413 Weighted average fully vested restricted Class A share units which are entitled to dividend equivalent payments 982,225 2,519,869 2,821,011 4,068,945 Weighted average nonvested restricted Class A share units which are entitled to dividend equivalent payments 5,744,629 6,434,147 4,759,829 6,667,917 Weighted average Fortress Operating Group units 249,534,372 299,397,765 249,534,372 301,815,314 Weighted average Fortress Operating Group RPUs 2 - 10,333,334 3,255,189 13,652,069 Weighted Average Class A Shares Outstanding (Used for DEPS) 494,683,588 536,807,022 492,299,975 534,448,211 Weighted average vested and nonvested restricted Class A share units which are not entitled to dividend equivalent payments 14,766,136 16,426,317 15,761,068 19,212,189 Weighted Average Fully Diluted Shares and Units Outstanding (Used for Diluted DEPS) 509,449,724 553,233,339 508,061,043 553,660,400 Three Months Ended September 30, Nine Months Ended September 30, 2013 2012 2013 2012 “Dividend paying shares and units” represents the number of shares and units outstanding at the end of the period which were entitled to receive dividends or related distributions. The Company believes it is useful for investors in computing the aggregate amount of cash required to make a current per share distribution of a given amount per share. It excludes certain potentially dilutive equity instruments, primarily non-dividend paying restricted Class A share units, and, therefore, is limited in its usefulness in computing per share amounts. Accordingly, dividend paying shares and units should be considered only as a supplement and not an alternative to GAAP basic and diluted shares outstanding. The Company’s calculation of dividend paying shares and units may be different from the calculation used by other companies and, therefore, comparability may be limited. |
 33 Appendix Slide #6 Reconciliation of GAAP Book Value Per Share to Net Cash and Investments Per Share (dollars and shares in thousands) GAAP Book Value Net Cash and Investments GAAP Book Value Net Cash and Investments GAAP Book Value Net Cash and Investments Cash and Cash equivalents 311,114 $ 311,114 $ 104,242 $ 104,242 $ 253,731 $ 253,731 $ Investments 1,263,392 1,263,392 1,211,684 1,211,684 1,169,306 1,169,306 Investments in options¹ 100,123 - 38,077 - 30,316 - Due from Affilitates 165,801 - 280,557 - 289,889 - Deferred Tax Asset 370,944 - 402,135 - 379,372 - Other Assets 146,259 - 124,798 - 102,787 - Assets 2,357,633 1,574,506 2,161,493 1,315,926 2,225,401 1,423,037 Debt Obligations Payable - $ - $ 149,453 $ 149,453 $ 180,528 $ 180,528 $ Accrued Compensation and Benefits 305,361 - 146,911 - 222,719 - Due to Affiliates 343,495 - 357,407 - 345,009 - Deferred Incentive Income 287,182 - 231,846 - 245,957 - Other Liabilities 99,850 - 59,226 - 81,193 - Liabilities 1,035,888 - 944,843 149,453 1,075,406 180,528 Net 1,321,745 $ 1,574,506 $ 1,216,650 $ 1,166,473 $ 1,149,995 $ 1,242,509 $ GAAP Basic Shares Dividend Paying Shares and Units GAAP Basic Shares Dividend Paying Shares and Units GAAP Basic Shares Dividend Paying Shares and Units Class A Shares 238,613 238,613 217,458 217,458 219,361 219,361 Restricted Class A Shares 956 956 828 828 828 828 Fortress Operating Group Units 249,535 249,535 249,535 249,535 298,724 298,724 Fully Vested Class A Shares - Dividend Paying - 21 - 556 - 637 Nonvested Class A Shares - Dividend Paying - 5,745 - 6,434 - 6,434 Fortress Operating Group RPUs - - - 10,333 - 10,333 Shares Outstanding 489,104 494,870 467,821 485,144 518,913 536,317 Per Share 2.70 $ 3.18 $ 2.60 $ 2.40 $ 2.22 $ 2.32 $ As of December 31, 2012 As of September 30, 2013 As of September 30, 2012 Net cash and investments represents cash and cash equivalents plus investments less debt outstanding. The Company believes that net cash and investments is a useful supplemental measure because it provides investors with information regarding the Company’s net investment assets. Net cash and investments excludes certain assets (investments in options, due from affiliates, deferred tax asset, other assets) and liabilities (due to affiliates, accrued compensation and benefits, deferred incentive income and other liabilities), its utility as a measure of financial position is limited. Accordingly, net cash and investments should be considered only as a supplement and not an alternative to GAAP book value as a measure of the Company’s financial position. The Company’s calculation of net cash and investments may be different from the calculation used by other companies and, therefore, comparability may be limited. (1) The definition of net cash and investments has been modified to exclude investments in options. The intrinsic value of options in equity method investees totaled $90 million at quarter end and is included in our undistributed, unrecognized incentive income. This value represents incentive income that would have been recorded in Distributable Earnings if Fortress had exercised all of its in-the-money Newcastle, New Residential and Eurocastle options and sold all of the resulting shares at their September 30, 2013 closing price and differs from the fair value derived from option pricing models included in the table above. All prior periods have been recast to reflect this change |
 Fortress Investment Group LLC 1345 Avenue of the Americas New York, NY 10105 Contact: Gordon Runté, Managing Director of Investor Relations and Corporate Communications +1 212 798 6082 grunte@fortress.com |