UNITED STATES
SECURITIES AND EXCHANGE COMMISSION
Washington, D.C. 20549
FORM N‑CSR
CERTIFIED SHAREHOLDER REPORT OF REGISTERED
MANAGEMENT INVESTMENT COMPANIES
| | |
| Investment Company Act file number | | 811-21979 |
Nuveen Investment Trust V
(Exact name of registrant as specified in charter)
Nuveen Investments
333 West Wacker Drive
Chicago, Illinois 60606
(Address of principal executive offices) (Zip code)
Mark J. Czarniecki
Nuveen Investments
333 West Wacker Drive
Chicago, Illinois 60606
(Name and address of agent for service)
Registrant’s telephone number, including area code: (312) 917‑7700
Date of fiscal year end: December 31
Date of reporting period: June 30, 2024
| Item 1. | Reports to Stockholders. |
| | |
 | |
Semi-Annual Shareholder Report
June 30, 2024 |
Nuveen Global Real Estate Securities Fund
Class A Shares/NGJAX
Semi-Annual Report
This semi-annual shareholder report contains important information about the Class A Shares of the Nuveen Global Real Estate Securities Fund for the period of January 1, 2024 to June 30, 2024. You can find additional information at https://www.nuveen.com/en‑us/mutual‑funds/prospectuses. You can also request this information by contacting us at (800) 257‑8787.
What were the Fund costs for the last six months? (based on a hypothetical $10,000 investment)
| | | | |
| | |
| | | Cost of a $10,000 investment | | Costs paid as a percentage of
$10,000 investment* |
| | | |
| Class A Shares | | $65 | | 1.30% |
* This cost is annualized.
Fund Statistics (as of June 30, 2024)
| | | | |
| |
| Fund net assets | | $ | 41,320,587 | |
| |
| Total number of portfolio holdings | | | 123 | |
| |
| Portfolio turnover (%) | | | 34% | |
What did the Fund invest in? (as of June 30, 2024)
Availability of additional information about the Fund
You can find additional information about the Fund at https://www.nuveen.com/en‑us/mutual‑funds/prospectuses, including its:
| | • | | prospectus • financial statements and other information • fund holdings • proxy voting information |
You can also request this information at (800) 257‑8787.
| | |
670700665_SAR_0624 3734809‑INV‑B‑08/25 (A, C, I, R6) | |  |
| | |
| |
Semi-Annual Shareholder Report
June 30, 2024 |
Nuveen Global Real Estate Securities Fund
Class C Shares/NGJCX
Semi-Annual Report
This semi-annual shareholder report contains important information about the Class C Shares of the Nuveen Global Real Estate Securities Fund for the period of January 1, 2024 to June 30, 2024. You can find additional information at https://www.nuveen.com/en‑us/mutual‑funds/prospectuses. You can also request this information by contacting us at (800) 257‑8787.
What were the Fund costs for the last six months? (based on a hypothetical $10,000 investment)
| | | | |
| | |
| | | Cost of a $10,000 investment | | Costs paid as a percentage of
$10,000 investment* |
| | | |
| Class C Shares | | $103 | | 2.05% |
* This cost is annualized.
Fund Statistics (as of June 30, 2024)
| | | | |
| |
| Fund net assets | | $ | 41,320,587 | |
| |
| Total number of portfolio holdings | | | 123 | |
| |
| Portfolio turnover (%) | | | 34% | |
What did the Fund invest in? (as of June 30, 2024)
Availability of additional information about the Fund
You can find additional information about the Fund at https://www.nuveen.com/en‑us/mutual‑funds/prospectuses, including its:
| | • | | prospectus • financial statements and other information • fund holdings • proxy voting information |
You can also request this information at (800) 257‑8787.
| | |
670700657_SAR_0624 3734809‑INV‑B‑08/25 (A, C, I, R6) | | |
| | |
| |
Semi-Annual Shareholder Report
June 30, 2024 |
Nuveen Global Real Estate Securities Fund
Class R6 Shares/NGJFX
Semi-Annual Report
This semi-annual shareholder report contains important information about the Class R6 Shares of the Nuveen Global Real Estate Securities Fund for the period of January 1, 2024 to June 30, 2024. You can find additional information at https://www.nuveen.com/en‑us/mutual‑funds/prospectuses. You can also request this information by contacting us at (800) 257‑8787.
What were the Fund costs for the last six months? (based on a hypothetical $10,000 investment)
| | | | |
| | |
| | | Cost of a $10,000 investment | | Costs paid as a percentage of
$10,000 investment* |
| | | |
| Class R6 Shares | | $49 | | 0.98% |
* This cost is annualized.
Fund Statistics (as of June 30, 2024)
| | | | |
| |
| Fund net assets | | $ | 41,320,587 | |
| |
| Total number of portfolio holdings | | | 123 | |
| |
| Portfolio turnover (%) | | | 34% | |
What did the Fund invest in? (as of June 30, 2024)
Availability of additional information about the Fund
You can find additional information about the Fund at https://www.nuveen.com/en‑us/mutual‑funds/prospectuses, including its:
| | • | | prospectus • financial statements and other information • fund holdings • proxy voting information |
You can also request this information at (800) 257‑8787.
| | |
670700632_SAR_0624 3734809‑INV‑B‑08/25 (A, C, I, R6) | | |
| | |
| |
Semi-Annual Shareholder Report
June 30, 2024 |
Nuveen Global Real Estate Securities Fund
Class I Shares/NGJIX
Semi-Annual Report
This semi-annual shareholder report contains important information about the Class I Shares of the Nuveen Global Real Estate Securities Fund for the period of January 1, 2024 to June 30, 2024. You can find additional information at https://www.nuveen.com/en‑us/mutual‑funds/prospectuses. You can also request this information by contacting us at (800) 257‑8787.
What were the Fund costs for the last six months? (based on a hypothetical $10,000 investment)
| | | | |
| | |
| | | Cost of a $10,000 investment | | Costs paid as a percentage of
$10,000 investment* |
| | | |
| Class I Shares | | $53 | | 1.05% |
* This cost is annualized.
Fund Statistics (as of June 30, 2024)
| | | | |
| |
| Fund net assets | | $ | 41,320,587 | |
| |
| Total number of portfolio holdings | | | 123 | |
| |
| Portfolio turnover (%) | | | 34% | |
What did the Fund invest in? (as of June 30, 2024)
Availability of additional information about the Fund
You can find additional information about the Fund at https://www.nuveen.com/en‑us/mutual‑funds/prospectuses, including its:
| | • | | prospectus • financial statements and other information • fund holdings • proxy voting information |
You can also request this information at (800) 257‑8787.
| | |
670700640_SAR_0624 3734809‑INV‑B‑08/25 (A, C, I, R6) | | |
Not applicable to this filing.
| Item 3. | Audit Committee Financial Expert. |
Not applicable to this filing.
| Item 4. | Principal Accountant Fees and Services. |
Not applicable to this filing.
| Item 5. | Audit Committee of Listed Registrants. |
Not applicable to this registrant.
| (a) | Schedule of Investments is included as part of the financial statements filed under Item 7 of this Form N-CSR. |
| Item 7. | Financial Statements and Financial Highlights for Open-End Management Investment Companies. |
Item
7.
Financial
Statements
and
Financial
Highlights
for
Open-End
Management
Investment
Companies
Nuveen
Global
Infrastructure
Fund
Portfolio
of
Investments
June
30,
2024
(Unaudited)
Shares
Description
(a)
Value
LONG-TERM
INVESTMENTS
-
97.9%
X
–
COMMON
STOCKS
-
92
.8
%
X
431,482,680
CAPITAL
GOODS
-
3.6%
172,004
Ferrovial
SE
$
6,681,992
401,226
Infratil
Ltd
2,738,368
70,693
Vinci
SA
7,451,350
TOTAL
CAPITAL
GOODS
16,871,710
COMMERCIAL
&
PROFESSIONAL
SERVICES
-
6.0%
28,923
(b)
Casella
Waste
Systems
Inc,
Class
A
2,869,740
1,331,524
Cleanaway
Waste
Management
Ltd
2,457,287
53,839
Republic
Services
Inc
10,463,071
45,988
Waste
Connections
Inc
8,064,456
18,102
Waste
Management
Inc
3,861,881
TOTAL
COMMERCIAL
&
PROFESSIONAL
SERVICES
27,716,435
ENERGY
-
17.4%
79,366
Cheniere
Energy
Inc
13,875,558
428,266
Enbridge
Inc
15,241,987
96,513
Energy
Transfer
LP
1,565,441
36,886
Enterprise
Products
Partners
LP
1,068,956
87,022
Gibson
Energy
Inc
1,478,938
284,935
Kinder
Morgan
Inc
5,661,658
81,138
MPLX
LP
3,455,667
164,459
ONEOK
Inc
13,411,632
159,256
Pembina
Pipeline
Corp
5,909,020
46,649
Targa
Resources
Corp
6,007,458
105,184
TC
Energy
Corp
3,987,312
218,767
Williams
Cos
Inc/The
9,297,598
TOTAL
ENERGY
80,961,225
TELECOMMUNICATION
SERVICES
-
1.1%
93,203
(c)
Cellnex
Telecom
SA
3,031,378
207,782
Infrastrutture
Wireless
Italiane
SpA
2,164,194
TOTAL
TELECOMMUNICATION
SERVICES
5,195,572
TRANSPORTATION
-
24.2%
93,741
Aena
SME
SA
18,982,289
32,124
Aeroports
de
Paris
SA
3,912,735
63,729
Athens
International
Airport
SA
535,767
1,163,680
Atlas
Arteria
Ltd
3,955,600
1,897,792
Auckland
International
Airport
Ltd
8,819,859
25,342
Canadian
National
Railway
Co
2,993,651
26,247
Canadian
Pacific
Railway
Ltd
2,066,426
155,592
Central
Japan
Railway
Co
3,372,786
669,826
China
Merchants
Port
Holdings
Co
Ltd
995,307
92,677
CSX
Corp
3,100,046
279,531
East
Japan
Railway
Co
4,654,095
32,294
Flughafen
Zurich
AG
7,148,590
38,484
(b)
Fraport
AG
Frankfurt
Airport
Services
Worldwide
1,991,338
368,160
Getlink
SE
6,095,767
41,370
Grupo
Aeroportuario
del
Centro
Norte
SAB
de
CV,
ADR
2,798,681
27,617
Grupo
Aeroportuario
del
Pacifico
SAB
de
CV,
ADR
4,301,900
13,780
Grupo
Aeroportuario
del
Sureste
SAB
de
CV,
ADR
4,127,386
Shares
Description
(a)
Value
TRANSPORTATION
(continued)
330,018
International
Container
Terminal
Services
Inc
$
1,969,668
155,899
Japan
Airport
Terminal
Co
Ltd
5,330,297
122,280
Kamigumi
Co
Ltd
2,526,258
10,518
Norfolk
Southern
Corp
2,258,109
357,994
Port
of
Tauranga
Ltd
1,029,215
518,238
Qube
Holdings
Ltd
1,258,641
1,881,705
Transurban
Group
15,519,491
12,496
Union
Pacific
Corp
2,827,345
TOTAL
TRANSPORTATION
112,571,247
UTILITIES
-
40.5%
253,588
APA
Group
1,347,939
21,796
Brookfield
Renewable
Corp,
Class
A
618,571
263,208
CenterPoint
Energy
Inc
8,154,184
285,003
CK
Infrastructure
Holdings
Ltd
1,609,496
28,769
Clearway
Energy
Inc,
Class
C
710,307
188,571
CLP
Holdings
Ltd
1,525,184
164,182
CMS
Energy
Corp
9,773,754
38,210
DTE
Energy
Co
4,241,692
30,128
Duke
Energy
Corp
3,019,729
334,796
E.ON
SE
4,400,119
14,051
Elia
Group
SA/NV
1,312,317
60,896
Enagas
SA
905,518
105,284
Endesa
SA
1,978,178
568,213
Enel
SpA
3,942,711
214,750
Engie
SA
3,075,296
49,715
Entergy
Corp
5,319,505
135,029
Evergy
Inc
7,152,486
6,401
Eversource
Energy
363,001
134,094
Exelon
Corp
4,640,993
56,803
Hydro
One
Ltd
1,654,618
334,912
Iberdrola
SA
4,345,459
49,577
Italgas
SpA
244,829
185,533
National
Grid
PLC
2,071,686
73,843
National
Grid
PLC,
Sponsored
ADR
4,194,282
358,369
NextEra
Energy
Inc
25,376,109
215,233
NiSource
Inc
6,200,863
295,860
PG&E
Corp
5,165,716
437,959
Power
Grid
Corp
of
India
Ltd
1,734,450
44,451
Public
Service
Enterprise
Group
Inc
3,276,039
144,659
Redeia
Corp
SA
2,529,568
124,075
RWE
AG
4,256,437
992,217
Sembcorp
Industries
Ltd
3,507,077
47,642
Sempra
3,623,651
94,707
Severn
Trent
PLC
2,850,613
1,203,844
Snam
SpA
5,316,191
226,611
Southern
Co/The
17,578,215
204,447
SSE
PLC
4,617,144
867,180
Terna
-
Rete
Elettrica
Nazionale
6,684,770
169,561
Veolia
Environnement
SA
5,078,834
6,167
WEC
Energy
Group
Inc
483,863
248,738
Xcel
Energy
Inc
13,285,097
TOTAL
UTILITIES
188,166,491
TOTAL
COMMON
STOCKS
(cost
$341,116,451)
431,482,680
Nuveen
Global
Infrastructure
Fund
(continued)
Portfolio
of
Investments
June
30,
2024
(Unaudited)
Shares
Description
(a)
Value
X
–
REAL
ESTATE
INVESTMENT
TRUST
COMMON
STOCKS
-
4
.8
%
X
22,064,896
DATA
CENTER
REITS
-
2.3%
51,709
Digital
Realty
Trust
Inc
$
7,862,353
3,643
Equinix
Inc
2,756,294
TOTAL
DATA
CENTER
REITS
10,618,647
HEALTH
CARE
REITS
-
0.2%
289,258
Parkway
Life
Real
Estate
Investment
Trust
746,229
TOTAL
HEALTH
CARE
REITS
746,229
TELECOM
TOWER
REITS
-
2.3%
38,186
American
Tower
Corp
7,422,595
16,696
SBA
Communications
Corp
3,277,425
TOTAL
TELECOM
TOWER
REITS
10,700,020
TOTAL
REAL
ESTATE
INVESTMENT
TRUST
COMMON
STOCKS
(cost
$20,721,909)
22,064,896
Shares
Description
(a)
Value
X
–
INVESTMENT
COMPANIES
-
0.3%
X
1,596,038
394,039
3i
Infrastructure
PLC
$
1,596,038
TOTAL
INVESTMENT
COMPANIES
(cost
$1,557,482)
1,596,038
TOTAL
LONG-TERM
INVESTMENTS
(cost
$363,395,842)
455,143,614
Principal
Amount
(000)
Description
(a)
Coupon
Maturity
Value
SHORT-TERM
INVESTMENTS
-
1.5%
–
REPURCHASE
AGREEMENTS
-
1
.5
%
X
7,095,416
$
6,625
(d)
Fixed
Income
Clearing
Corporation
5.270%
7/01/24
$
6,625,000
470
(e)
Fixed
Income
Clearing
Corporation
1.600%
7/01/24
470,416
TOTAL
REPURCHASE
AGREEMENTS
(cost
$7,095,416)
7,095,416
TOTAL
SHORT-TERM
INVESTMENTS
(cost
$7,095,416)
7,095,416
TOTAL
INVESTMENTS
(cost
$
370,491,258
)
-
99
.4
%
462,239,030
OTHER
ASSETS
&
LIABILITIES,
NET
- 0.6%
2,858,414
NET
ASSETS
-
100%
$
465,097,444
For
Fund
portfolio
compliance
purposes,
the
Fund’s
industry
classifications
refer
to
any
one
or
more
of
the
industry
sub-classifications
used
by
one
or
more
widely
recognized
market
indexes
or
ratings
group
indexes,
and/or
as
defined
by
Fund
management.
This
definition
may
not
apply
for
purposes
of
this
report,
which
may
combine
industry
sub-classifications
into
sectors
for
reporting
ease.
(a)
All
percentages
shown
in
the
Portfolio
of
Investments
are
based
on
net
assets.
(b)
Non-income
producing;
issuer
has
not
declared
an
ex-dividend
date
within
the
past
twelve
months.
(c)
Security
is
exempt
from
registration
under
Rule
144A
of
the
Securities
Act
of
1933,
as
amended.
These
securities
are
deemed
liquid
and
may
be
resold
in
transactions
exempt
from
registration,
which
are
normally
those
transactions
with
qualified
institutional
buyers.
As
of
the
end
of
the
reporting
period,
the
aggregate
value
of
these
securities
is
$3,031,378
or
0.7%
of
Total
Investments.
(d)
Agreement
with
Fixed
Income
Clearing
Corporation,
5.270%
dated
6/28/24
to
be
repurchased
at
$6,627,909
on
7/1/24,
collateralized
by
Government
Agency
Securities,
with
coupon
rate
4.000%
and
maturity
date
1/31/31,
valued
at
$6,757,521.
(e)
Agreement
with
Fixed
Income
Clearing
Corporation,
1.600%
dated
6/28/24
to
be
repurchased
at
$470,479
on
7/1/24,
collateralized
by
Government
Agency
Securities,
with
coupon
rate
0.750%
and
maturity
date
8/31/26,
valued
at
$479,850.
ADR
American
Depositary
Receipt
REIT
Real
Estate
Investment
Trust
See
Notes
to
Financial
Statements
Nuveen
Global
Real
Estate
Securities
Fund
Portfolio
of
Investments
June
30,
2024
(Unaudited)
Shares
Description
(a)
Value
LONG-TERM
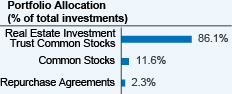
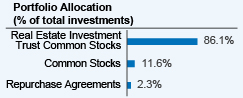
INVESTMENTS
-
98.0%
X
–
REAL
ESTATE
INVESTMENT
TRUST
COMMON
STOCKS
-
86
.4
%
X
35,677,006
DATA
CENTER
REITS
-
7.3%
8,279
Digital
Realty
Trust
Inc
$
1,258,822
2,344
Equinix
Inc
1,773,470
TOTAL
DATA
CENTER
REITS
3,032,292
DIVERSIFIED
REITS
-
4.3%
3,943
Armada
Hoffler
Properties
Inc
43,728
58,074
British
Land
Co
PLC/The
301,858
10,436
Charter
Hall
Group
77,602
5,032
Essential
Properties
Realty
Trust
Inc
139,437
52,797
Growthpoint
Properties
Australia
Ltd
76,189
95
Hulic
Reit
Inc
86,357
17,278
Merlin
Properties
Socimi
SA
192,585
220,758
Mirvac
Group
274,662
472
Star
Asia
Investment
Corp
175,349
66,786
Stockland
184,982
278
United
Urban
Investment
Corp
246,807
TOTAL
DIVERSIFIED
REITS
1,799,556
HEALTH
CARE
REITS
-
8.8%
10,466
American
Healthcare
REIT
Inc
152,908
4,425
CareTrust
REIT
Inc
111,068
45,793
Healthpeak
Properties
Inc
897,543
9,835
Omega
Healthcare
Investors
Inc
336,849
18,669
Parkway
Life
Real
Estate
Investment
Trust
48,162
15,243
Ventas
Inc
781,356
12,675
Welltower
Inc
1,321,369
TOTAL
HEALTH
CARE
REITS
3,649,255
HOTEL
&
RESORT
REITS
-
1.7%
6,763
Apple
Hospitality
REIT
Inc
98,334
11,499
Host
Hotels
&
Resorts
Inc
206,752
3,807
Ryman
Hospitality
Properties
Inc
380,167
TOTAL
HOTEL
&
RESORT
REITS
685,253
INDUSTRIAL
REITS
-
17.2%
11,148
Americold
Realty
Trust
Inc
284,720
2,754
ARGAN
SA
214,820
2,914
EastGroup
Properties
Inc
495,671
8,279
First
Industrial
Realty
Trust
Inc
393,335
154,428
Frasers
Logistics
&
Commercial
Trust
107,993
367
GLP
J-Reit
299,658
26,285
Goodman
Group
606,392
21,065
LXP
Industrial
Trust
192,113
50,458
Mapletree
Industrial
Trust
78,450
179,571
Mapletree
Logistics
Trust
170,522
24
Mitsui
Fudosan
Logistics
Park
Inc
64,811
4,391
Montea
NV
371,699
57,036
Nexus
Industrial
REIT
282,668
89
Nippon
Prologis
REIT
Inc
138,915
18,823
Prologis
Inc
2,114,011
7,826
Rexford
Industrial
Realty
Inc
348,961
888
STAG
Industrial
Inc
32,021
142,157
TF
Administradora
Industrial
S
de
RL
de
CV
304,051
214,764
Tritax
Big
Box
REIT
PLC
419,907
118,072
Urban
Logistics
REIT
PLC
175,365
TOTAL
INDUSTRIAL
REITS
7,096,083
Nuveen
Global
Real
Estate
Securities
Fund
(continued)
Portfolio
of
Investments
June
30,
2024
(Unaudited)
Shares
Description
(a)
Value
MULTI-FAMILY
RESIDENTIAL
REITS
-
9.8%
4,385
AvalonBay
Communities
Inc
$
907,213
4,200
Boardwalk
Real
Estate
Investment
Trust
216,378
334
Daiwa
Securities
Living
Investments
Corp
218,313
7,769
Equity
Residential
538,702
1,863
Essex
Property
Trust
Inc
507,109
130,552
(b)
Home
Reit
PLC
165
43,458
Ingenia
Communities
Group
138,082
35,814
InterRent
Real
Estate
Investment
Trust
311,790
22,629
Killam
Apartment
Real
Estate
Investment
Trust
281,860
40
Nippon
Accommodations
Fund
Inc
159,004
5,306
UDR
Inc
218,342
21,662
UNITE
Group
PLC/The
244,375
10,188
Veris
Residential
Inc
152,820
4,391
Xior
Student
Housing
NV
140,612
TOTAL
MULTI-FAMILY
RESIDENTIAL
REITS
4,034,765
OFFICE
REITS
-
5.5%
3,364
Alexandria
Real
Estate
Equities
Inc
393,487
3,576
Boston
Properties
Inc
220,139
9,002
COPT
Defense
Properties
225,320
9,516
Cousins
Properties
Inc
220,295
124
Daiwa
Office
Investment
Corp
218,664
40,521
Dexus
174,803
2,861
Gecina
SA
264,102
12,332
Hudson
Pacific
Properties
Inc
59,317
185
KDX
Realty
Investment
Corp
179,832
30
Nippon
Building
Fund
Inc
105,235
212
Orix
JREIT
Inc
210,087
TOTAL
OFFICE
REITS
2,271,281
OTHER
SPECIALIZED
REITS
-
3.7%
13,775
Gaming
and
Leisure
Properties
Inc
622,768
1,950
Iron
Mountain
Inc
174,759
25,805
VICI
Properties
Inc
739,055
TOTAL
OTHER
SPECIALIZED
REITS
1,536,582
REAL
ESTATE
OPERATING
COMPANIES
-
0.6%
212,859
Sirius
Real
Estate
Ltd
251,687
TOTAL
REAL
ESTATE
OPERATING
COMPANIES
251,687
RETAIL
REITS
-
14.0%
7,391
Acadia
Realty
Trust
132,447
8,472
Agree
Realty
Corp
524,756
35,979
Charter
Hall
Retail
REIT
77,657
8,764
CT
Real
Estate
Investment
Trust
84,434
3,487
Federal
Realty
Investment
Trust
352,082
187,616
Frasers
Centrepoint
Trust
294,160
629,107
Hammerson
PLC
220,285
45,450
Kimco
Realty
Corp
884,457
77,766
Link
REIT
301,994
3,792
NETSTREIT
Corp
61,051
2,253
NNN
REIT
Inc
95,978
11,614
Realty
Income
Corp
613,451
8,259
Regency
Centers
Corp
513,710
21,743
RioCan
Real
Estate
Investment
Trust
267,168
3,256
Simon
Property
Group
Inc
494,261
17,299
SITE
Centers
Corp
250,835
5,437
Urban
Edge
Properties
100,421
198,474
Vicinity
Ltd
244,041
18,524
Wereldhave
NV
262,171
TOTAL
RETAIL
REITS
5,775,359
Shares
Description
(a)
Value
SELF-STORAGE
REITS
-
5.1%
4,885
CubeSmart
$
220,656
2,291
Extra
Space
Storage
Inc
356,044
4,452
Public
Storage
1,280,618
24,768
Safestore
Holdings
PLC
240,228
TOTAL
SELF-STORAGE
REITS
2,097,546
SINGLE-FAMILY
RESIDENTIAL
REITS
-
4.3%
4,595
American
Homes
4
Rent,
Class
A
170,750
7,109
Equity
LifeStyle
Properties
Inc
463,009
24,346
Invitation
Homes
Inc
873,778
2,158
Sun
Communities
Inc
259,694
TOTAL
SINGLE-FAMILY
RESIDENTIAL
REITS
1,767,231
TELECOM
TOWER
REITS
-
3.9%
5,363
American
Tower
Corp
1,042,460
650
Crown
Castle
Inc
63,505
2,492
SBA
Communications
Corp
489,180
TOTAL
TELECOM
TOWER
REITS
1,595,145
TIMBER
REITS
-
0.2%
2,993
Weyerhaeuser
Co
84,971
TOTAL
TIMBER
REITS
84,971
TOTAL
REAL
ESTATE
INVESTMENT
TRUST
COMMON
STOCKS
(cost
$32,779,355)
35,677,006
Shares
Description
(a)
Value
X
–
COMMON
STOCKS
-
11
.6
%
X
4,798,841
HEALTH
CARE
EQUIPMENT
&
SERVICES
-
0.8%
35,610
Chartwell
Retirement
Residences
$
334,482
TOTAL
HEALTH
CARE
EQUIPMENT
&
SERVICES
334,482
REAL
ESTATE
MANAGEMENT
&
DEVELOPMENT
-
9.6%
104,926
Capitaland
India
Trust
75,714
9,590
CapitaLand
Investment
Ltd/Singapore
18,755
1,645
Catena
AB
82,206
44,526
City
Developments
Ltd
169,263
25,691
Hysan
Development
Co
Ltd
36,891
29,301
(c)
Instone
Real
Estate
Group
SE
257,315
82,685
Mitsui
Fudosan
Co
Ltd
761,026
9,773
Sagax
AB,
Class
B
250,444
284,684
Sino
Land
Co
Ltd
292,968
12,586
Sumitomo
Realty
&
Development
Co
Ltd
371,386
32,904
Sun
Hung
Kai
Properties
Ltd
285,098
21,247
TAG
Immobilien
AG
310,553
63,434
Tokyu
Fudosan
Holdings
Corp
425,802
2,727
VGP
NV
303,975
10,807
Vonovia
SE
307,550
TOTAL
REAL
ESTATE
MANAGEMENT
&
DEVELOPMENT
3,948,946
TELECOMMUNICATION
SERVICES
-
1.0%
7,157
(c)
Cellnex
Telecom
SA
232,778
16,994
Infrastrutture
Wireless
Italiane
SpA
177,004
TOTAL
TELECOMMUNICATION
SERVICES
409,782
Nuveen
Global
Real
Estate
Securities
Fund
(continued)
Portfolio
of
Investments
June
30,
2024
(Unaudited)
Shares
Description
(a)
Value
TRANSPORTATION
-
0.2%
4,866
Kyushu
Railway
Co
$
105,631
TOTAL
TRANSPORTATION
105,631
TOTAL
COMMON
STOCKS
(cost
$4,468,209)
4,798,841
TOTAL
LONG-TERM
INVESTMENTS
(cost
$37,247,564)
40,475,847
Principal
Amount
(000)
Description
(a)
Coupon
Maturity
Value
SHORT-TERM
INVESTMENTS
-
2.3%
X
–
REPURCHASE
AGREEMENTS
-
2
.3
%
X
950,000
$
950
(d)
Fixed
Income
Clearing
Corporation
5.270%
7/01/24
$
950,000
TOTAL
REPURCHASE
AGREEMENTS
(cost
$950,000)
950,000
TOTAL
SHORT-TERM
INVESTMENTS
(cost
$950,000)
950,000
TOTAL
INVESTMENTS
(cost
$
38,197,564
)
-
100
.3
%
41,425,847
OTHER
ASSETS
&
LIABILITIES,
NET
- (0.3)%
(
105,260
)
NET
ASSETS
-
100%
$
41,320,587
For
Fund
portfolio
compliance
purposes,
the
Fund’s
industry
classifications
refer
to
any
one
or
more
of
the
industry
sub-classifications
used
by
one
or
more
widely
recognized
market
indexes
or
ratings
group
indexes,
and/or
as
defined
by
Fund
management.
This
definition
may
not
apply
for
purposes
of
this
report,
which
may
combine
industry
sub-classifications
into
sectors
for
reporting
ease.
(a)
All
percentages
shown
in
the
Portfolio
of
Investments
are
based
on
net
assets.
(b)
For
fair
value
measurement
disclosure
purposes,
investment
classified
as
Level
3.
(c)
Security
is
exempt
from
registration
under
Rule
144A
of
the
Securities
Act
of
1933,
as
amended.
These
securities
are
deemed
liquid
and
may
be
resold
in
transactions
exempt
from
registration,
which
are
normally
those
transactions
with
qualified
institutional
buyers.
As
of
the
end
of
the
reporting
period,
the
aggregate
value
of
these
securities
is
$490,093
or
1.2%
of
Total
Investments.
(d)
Agreement
with
Fixed
Income
Clearing
Corporation,
5.270%
dated
6/28/24
to
be
repurchased
at
$950,417
on
7/1/24,
collateralized
by
Government
Agency
Securities,
with
coupon
rate
4.000%
and
maturity
date
1/31/31,
valued
at
$969,028.
REIT
Real
Estate
Investment
Trust
See
Notes
to
Financial
Statements
Nuveen
Real
Asset
Income
Fund
Portfolio
of
Investments
June
30,
2024
(Unaudited)
Principal
Amount
(000)
Description
(a)
Coupon
Maturity
Value
LONG-TERM
INVESTMENTS
-
98.0%
X
–
CORPORATE
BONDS
-
25.9%
X
267,106,838
CAPITAL
GOODS
-
0.7%
$
3,230
(b)
Advanced
Drainage
Systems
Inc
6.375%
6/15/30
$
3,241,676
2,335
(b)
Chart
Industries
Inc
7.500%
1/01/30
2,412,910
1,870
(b)
Trinity
Industries
Inc
7.750%
7/15/28
1,935,832
TOTAL
CAPITAL
GOODS
7,590,418
COMMERCIAL
&
PROFESSIONAL
SERVICES
-
0.4%
960
(b)
GFL
Environmental
Inc
6.750%
1/15/31
979,377
2,710
(b)
Wrangler
Holdco
Corp
6.625%
4/01/32
2,698,030
TOTAL
COMMERCIAL
&
PROFESSIONAL
SERVICES
3,677,407
CONSUMER
DISCRETIONARY
DISTRIBUTION
&
RETAIL
-
0.2%
1,715
(b)
LCM
Investments
Holdings
II
LLC
4.875%
5/01/29
1,603,063
TOTAL
CONSUMER
DISCRETIONARY
DISTRIBUTION
&
RETAIL
1,603,063
CONSUMER
SERVICES
-
1.2%
1,095
Choice
Hotels
International
Inc
0.000%
8/01/34
1,079,241
3,475
(b)
Churchill
Downs
Inc
5.750%
4/01/30
3,375,388
1,490
(b)
Hilton
Domestic
Operating
Co
Inc
5.875%
4/01/29
1,492,022
1,780
(b)
Hilton
Grand
Vacations
Borrower
Escrow
LLC
/
Hilton
Grand
Vacations
Borrower
Esc
6.625%
1/15/32
1,788,334
1,695
Piedmont
Operating
Partnership
LP
9.250%
7/20/28
1,808,337
1,525
(b)
Scientific
Games
International
Inc
7.500%
9/01/31
1,575,661
1,385
(b)
Six
Flags
Entertainment
Corp
0.000%
4/30/32
1,407,487
TOTAL
CONSUMER
SERVICES
12,526,470
ENERGY
-
5.5%
2,126
(b)
Archrock
Partners
LP
/
Archrock
Partners
Finance
Corp
6.250%
4/01/28
2,105,554
260
(b)
Blue
Racer
Midstream
LLC
/
Blue
Racer
Finance
Corp
7.250%
7/15/32
267,319
2,520
(b)
Blue
Racer
Midstream
LLC
/
Blue
Racer
Finance
Corp
7.000%
7/15/29
2,566,343
5,000
(b)
Buckeye
Partners
LP
6.875%
7/01/29
5,018,675
3,375
Cheniere
Energy
Partners
LP
4.500%
10/01/29
3,215,167
1,270
(b)
CNX
Midstream
Partners
LP
4.750%
4/15/30
1,144,478
250
(b)
CQP
Holdco
LP
/
BIP-V
Chinook
Holdco
LLC
5.500%
6/15/31
236,981
700
(b)
CQP
Holdco
LP
/
BIP-V
Chinook
Holdco
LLC
7.500%
12/15/33
726,109
1,625
(b)
Delek
Logistics
Partners
LP
/
Delek
Logistics
Finance
Corp
8.625%
3/15/29
1,672,221
1,730
Energy
Transfer
LP
5.550%
5/15/34
1,712,149
3,560
(b)
EQM
Midstream
Partners
LP
6.375%
4/01/29
3,595,981
1,215
EQM
Midstream
Partners
LP
5.500%
7/15/28
1,196,464
1,060
CAD
Gibson
Energy
Inc
5.250%
12/22/80
710,127
2,250
(b)
Global
Partners
LP
/
GLP
Finance
Corp
8.250%
1/15/32
2,312,622
1,680
(b)
Harvest
Midstream
I
LP
7.500%
5/15/32
1,705,781
1,380
CAD
Keyera
Corp
6.875%
6/13/79
1,007,222
1,470
(b)
Kinetik
Holdings
LP
5.875%
6/15/30
1,448,554
2,000
(b)
Kodiak
Gas
Services
LLC
7.250%
2/15/29
2,050,152
5,735
MPLX
LP
5.000%
3/01/33
5,479,148
2,195
(b)
PBF
Holding
Co
LLC
/
PBF
Finance
Corp
7.875%
9/15/30
2,247,079
3,461
CAD
Pembina
Pipeline
Corp
4.800%
1/25/81
2,264,089
1,565
(b)
Sunoco
LP
7.000%
5/01/29
1,603,942
1,640
Targa
Resources
Corp
6.150%
3/01/29
1,692,825
2,475
Targa
Resources
Corp
6.125%
3/15/33
2,541,790
415
CAD
Transcanada
Trust
4.200%
3/04/81
264,298
1,350
(b)
Transocean
Inc
8.750%
2/15/30
1,417,335
1,550
(b)
USA
Compression
Partners
LP
/
USA
Compression
Finance
Corp
7.125%
3/15/29
1,561,792
Nuveen
Real
Asset
Income
Fund
(continued)
Portfolio
of
Investments
June
30,
2024
(Unaudited)
Principal
Amount
(000)
Description
(a)
Coupon
Maturity
Value
ENERGY
(continued)
$
2,955
(b)
Venture
Global
LNG
Inc
9.500%
2/01/29
$
3,236,010
2,180
Williams
Cos
Inc/The
4.900%
3/15/29
2,150,392
TOTAL
ENERGY
57,150,599
EQUITY
REAL
ESTATE
INVESTMENT
TRUSTS
(REITS)
-
6.7%
3,925
Agree
LP
4.800%
10/01/32
3,680,582
2,080
Alexandria
Real
Estate
Equities
Inc
5.250%
5/15/36
2,001,400
2,875
American
Homes
4
Rent
LP
5.500%
2/01/34
2,827,034
4,280
American
Tower
Corp
5.500%
3/15/28
4,305,261
1,975
AvalonBay
Communities
Inc
5.000%
2/15/33
1,925,943
1,455
(b)
CTR
Partnership
LP
/
CareTrust
Capital
Corp
3.875%
6/30/28
1,337,070
1,740
CubeSmart
LP
4.375%
2/15/29
1,668,216
3,710
Essex
Portfolio
LP
5.500%
4/01/34
3,676,673
3,780
Extra
Space
Storage
LP
5.700%
4/01/28
3,822,274
3,585
Federal
Realty
OP
LP
5.375%
5/01/28
3,588,919
1,640
GLP
Capital
LP
/
GLP
Financing
II
Inc
6.750%
12/01/33
1,723,102
2,935
(b)
Goodman
US
Finance
Five
LLC
4.625%
5/04/32
2,716,798
2,235
(b)
Iron
Mountain
Inc
7.000%
2/15/29
2,274,316
945
(c)
Kilroy
Realty
LP
6.250%
1/15/36
896,831
2,720
Kimco
Realty
OP
LLC
4.600%
2/01/33
2,550,978
2,340
Kite
Realty
Group
LP
5.500%
3/01/34
2,287,776
1,840
Kite
Realty
Group
LP
4.000%
10/01/26
1,779,932
1,915
Mid-America
Apartments
LP
5.300%
2/15/32
1,906,584
888
(c)
MPT
Operating
Partnership
LP
/
MPT
Finance
Corp
5.000%
10/15/27
733,406
4,070
Prologis
LP
5.000%
3/15/34
3,980,672
3,070
(b)
Prologis
Targeted
US
Logistics
Fund
LP
5.500%
4/01/34
3,071,948
6,625
(b)
RHP
Hotel
Properties
LP
/
RHP
Finance
Corp
6.500%
4/01/32
6,625,479
1,210
(b)
Scentre
Group
Trust
2
5.125%
9/24/80
1,122,430
2,635
SITE
Centers
Corp
3.625%
2/01/25
2,600,017
2,590
SITE
Centers
Corp
4.700%
6/01/27
2,570,267
3,280
Welltower
OP
LLC
3.850%
6/15/32
2,954,437
TOTAL
EQUITY
REAL
ESTATE
INVESTMENT
TRUSTS
(REITS)
68,628,345
FINANCIAL
SERVICES
-
0.8%
3,015
(b)
HAT
Holdings
I
LLC
/
HAT
Holdings
II
LLC
8.000%
6/15/27
3,134,509
2,700
(b)
Hunt
Cos
Inc
5.250%
4/15/29
2,453,782
1,315
(b)
Starwood
Property
Trust
Inc
7.250%
4/01/29
1,329,099
1,330
(b)
Starwood
Property
Trust
Inc
4.375%
1/15/27
1,259,206
TOTAL
FINANCIAL
SERVICES
8,176,596
HEALTH
CARE
EQUIPMENT
&
SERVICES
-
0.3%
1,900
(b)
CHS/Community
Health
Systems
Inc
10.875%
1/15/32
1,977,494
1,250
(b)
LifePoint
Health
Inc
11.000%
10/15/30
1,377,210
TOTAL
HEALTH
CARE
EQUIPMENT
&
SERVICES
3,354,704
MEDIA
&
ENTERTAINMENT
-
0.9%
3,477
(b)
CCO
Holdings
LLC
/
CCO
Holdings
Capital
Corp
6.375%
9/01/29
3,304,991
2,500
(b)
CCO
Holdings
LLC
/
CCO
Holdings
Capital
Corp
5.125%
5/01/27
2,400,365
1,250
Lamar
Media
Corp
4.875%
1/15/29
1,201,167
2,000
(b)
Ziggo
Bond
Co
BV
6.000%
1/15/27
1,961,681
TOTAL
MEDIA
&
ENTERTAINMENT
8,868,204
REAL
ESTATE
MANAGEMENT
&
DEVELOPMENT
-
0.2%
2,775
EUR
(b),(c)
Peach
Property
Finance
GmbH
4.375%
11/15/25
2,563,415
TOTAL
REAL
ESTATE
MANAGEMENT
&
DEVELOPMENT
2,563,415
Principal
Amount
(000)
Description
(a)
Coupon
Maturity
Value
TELECOMMUNICATION
SERVICES
-
1.0%
$
2,750
(b),(c)
Frontier
Communications
Holdings
LLC
6.000%
1/15/30
$
2,392,395
750
(b)
Frontier
Communications
Holdings
LLC
8.625%
3/15/31
772,595
1,945
(b)
Iliad
Holding
SASU
8.500%
4/15/31
1,969,388
1,600
(b)
Iliad
Holding
SASU
7.000%
10/15/28
1,586,606
1,365
(b)
Iliad
Holding
SASU
6.500%
10/15/26
1,358,954
2,000
(b)
Level
3
Financing
Inc
10.500%
4/15/29
1,995,000
TOTAL
TELECOMMUNICATION
SERVICES
10,074,938
TRANSPORTATION
-
1.4%
4,500
(b)
Brightline
East
LLC
11.000%
1/31/30
4,103,393
2,300
(b)
Cargo
Aircraft
Management
Inc
4.750%
2/01/28
2,133,344
5,555
(b)
Genesee
&
Wyoming
Inc
6.250%
4/15/32
5,534,188
2,705
(b)
XPO
Inc
7.125%
6/01/31
2,763,460
TOTAL
TRANSPORTATION
14,534,385
UTILITIES
-
6.6%
2,420
AEP
Transmission
Co
LLC
5.150%
4/01/34
2,365,086
2,738
CAD
AltaGas
Ltd
7.350%
8/17/82
2,031,350
2,670
CAD
AltaGas
Ltd
5.250%
1/11/82
1,716,408
3,785
Ameren
Illinois
Co
4.950%
6/01/33
3,694,395
1,250
(b)
Calpine
Corp
5.125%
3/15/28
1,202,186
1,395
CAD
Capital
Power
Corp
7.950%
9/09/82
1,042,786
3,380
CenterPoint
Energy
Houston
Electric
LLC
5.200%
10/01/28
3,408,215
5,000
(b)
Clearway
Energy
Operating
LLC
4.750%
3/15/28
4,777,623
2,110
DTE
Electric
Co
5.200%
3/01/34
2,103,227
2,210
Duke
Energy
Progress
LLC
5.100%
3/15/34
2,191,763
1,775
(b)
Ferrellgas
LP
/
Ferrellgas
Finance
Corp
5.375%
4/01/26
1,736,458
1,975
(b)
Ferrellgas
LP
/
Ferrellgas
Finance
Corp
5.875%
4/01/29
1,817,096
1,510
Florida
Power
&
Light
Co
4.800%
5/15/33
1,468,139
6,265
(b)
ITC
Holdings
Corp
4.950%
9/22/27
6,206,225
910
(b)
NextEra
Energy
Operating
Partners
LP
4.500%
9/15/27
861,161
1,315
(b)
NextEra
Energy
Operating
Partners
LP
7.250%
1/15/29
1,348,493
2,381
GBP
NGG
Finance
PLC,
Reg
S
5.625%
6/18/73
2,991,009
2,000
(b)
NRG
Energy
Inc
5.250%
6/15/29
1,919,482
1,250
NRG
Energy
Inc
6.625%
1/15/27
1,247,507
1,905
OGE
Energy
Corp
5.450%
5/15/29
1,919,597
3,130
Pacific
Gas
and
Electric
Co
6.150%
1/15/33
3,179,691
1,810
(b)
Pattern
Energy
Operations
LP
/
Pattern
Energy
Operations
Inc
4.500%
8/15/28
1,675,366
1,275
Public
Service
Electric
and
Gas
Co
5.200%
3/01/34
1,275,504
2,245
Public
Service
Enterprise
Group
Inc
5.850%
11/15/27
2,283,410
2,765
(b)
RWE
Finance
US
LLC
5.875%
4/16/34
2,768,088
1,210
(b)
RWE
Finance
US
LLC
6.250%
4/16/54
1,194,807
700
(b)
Superior
Plus
LP
/
Superior
General
Partner
Inc
4.500%
3/15/29
642,372
3,315
(b)
TerraForm
Power
Operating
LLC
4.750%
1/15/30
3,021,626
3,330
(b)
Vistra
Operations
Co
LLC
7.750%
10/15/31
3,467,832
2,820
Wisconsin
Power
and
Light
Co
5.375%
3/30/34
2,801,392
TOTAL
UTILITIES
68,358,294
TOTAL
CORPORATE
BONDS
(cost
$269,495,737)
267,106,838
Shares
Description
(a)
Value
X
–
COMMON
STOCKS
-
23.1%
X
237,360,369
ENERGY
-
9.0%
480,749
Enbridge
Inc
$
17,109,857
489,372
Energy
Transfer
LP
7,937,614
169,767
Enterprise
Products
Partners
LP
4,919,848
283,233
Gibson
Energy
Inc
4,813,543
Nuveen
Real
Asset
Income
Fund
(continued)
Portfolio
of
Investments
June
30,
2024
(Unaudited)
Shares
Description
(a)
Value
ENERGY
(continued)
67,425
Keyera
Corp
$
1,867,427
639,737
Kinder
Morgan
Inc
12,711,574
124,237
MPLX
LP
5,291,254
190,937
ONEOK
Inc
15,570,912
343,615
Pembina
Pipeline
Corp
12,749,459
37,592
Plains
GP
Holdings
LP,
Class
A
707,481
49,836
TC
Energy
Corp
1,889,182
170,493
Williams
Cos
Inc/The
7,245,952
TOTAL
ENERGY
92,814,103
HEALTH
CARE
EQUIPMENT
&
SERVICES
-
1.0%
885,059
Chartwell
Retirement
Residences
8,313,298
143,742
Sienna
Senior
Living
Inc
1,497,258
TOTAL
HEALTH
CARE
EQUIPMENT
&
SERVICES
9,810,556
REAL
ESTATE
MANAGEMENT
&
DEVELOPMENT
-
0.5%
1,358,533
Capitaland
India
Trust
980,310
425,641
Hysan
Development
Co
Ltd
611,192
3,707,224
Sino
Land
Co
Ltd
3,815,107
TOTAL
REAL
ESTATE
MANAGEMENT
&
DEVELOPMENT
5,406,609
TELECOMMUNICATION
SERVICES
-
0.6%
764,512
HKT
Trust
&
HKT
Ltd
857,510
175,000
Infrastrutture
Wireless
Italiane
SpA
1,822,746
5,395,783
NETLINK
NBN
TRUST
3,302,729
TOTAL
TELECOMMUNICATION
SERVICES
5,982,985
TRANSPORTATION
-
2.2%
11,900
Aena
SME
SA
2,409,717
66,021
Athens
International
Airport
SA
555,036
1,249,011
Atlas
Arteria
Ltd
4,245,658
863,134
Aurizon
Holdings
Ltd
2,096,758
768,419
China
Merchants
Port
Holdings
Co
Ltd
1,141,808
1,064,545
Dalrymple
Bay
Infrastructure
Ltd
2,103,239
657,049
Enav
SpA
2,612,227
25,481
Grupo
Aeroportuario
del
Centro
Norte
SAB
de
CV,
ADR
1,723,790
19,412
Grupo
Aeroportuario
del
Pacifico
SAB
de
CV,
ADR
3,023,807
370,790
Transurban
Group
3,058,116
TOTAL
TRANSPORTATION
22,970,156
UTILITIES
-
9.8%
60,330
Algonquin
Power
&
Utilities
Corp
353,534
480,132
APA
Group
2,552,127
857
Canadian
Solar
Infrastructure
Fund
Inc
525,738
21,739
Canadian
Utilities
Ltd,
Class
A
469,564
664,595
CK
Infrastructure
Holdings
Ltd
3,753,163
130,823
Clearway
Energy
Inc,
Class
A
2,964,449
477,563
CLP
Holdings
Ltd
3,862,586
513,384
Contact
Energy
Ltd
2,814,319
110,530
Dominion
Energy
Inc
5,415,970
93,591
Duke
Energy
Corp
9,380,626
228,435
Enagas
SA
3,396,808
101,120
Endesa
SA
1,899,941
1,103,276
Enel
SpA
7,655,402
32,074
Entergy
Corp
3,431,918
182,778
Evergy
Inc
9,681,751
3,010
Eversource
Energy
170,697
235,504
Italgas
SpA
1,163,001
Shares
Description
(a)
Value
UTILITIES
(continued)
321,056
National
Grid
PLC
$
3,584,954
176,075
National
Grid
PLC,
Sponsored
ADR
10,001,060
21,549
Northwestern
Energy
Group
Inc
1,079,174
161,022
OGE
Energy
Corp
5,748,485
93,953
Pennon
Group
PLC
682,182
28,555
Pinnacle
West
Capital
Corp
2,181,031
135,958
Power
Assets
Holdings
Ltd
734,781
279,137
Redeia
Corp
SA
4,881,108
652,210
REN
-
Redes
Energeticas
Nacionais
SGPS
SA
1,601,583
1,997,825
Snam
SpA
8,822,421
12,765
Spire
Inc
775,218
350,643
Vector
Ltd
792,369
TOTAL
UTILITIES
100,375,960
TOTAL
COMMON
STOCKS
(cost
$210,176,621)
237,360,369
Shares
Description
(a)
Value
X
–
REAL
ESTATE
INVESTMENT
TRUST
COMMON
STOCKS
-
21.0%
X
216,458,743
DIVERSIFIED
REITS
-
1.2%
93,940
Armada
Hoffler
Properties
Inc
$
1,041,795
293,636
Charter
Hall
Long
Wale
REIT
635,909
782,309
Growthpoint
Properties
Australia
Ltd
1,128,908
83,873
ICADE
2,074,914
1,289,704
Mirvac
Group
1,604,623
10,376
Star
Asia
Investment
Corp
3,854,703
374,550
Stockland
1,037,417
815
United
Urban
Investment
Corp
723,554
TOTAL
DIVERSIFIED
REITS
12,101,823
HEALTH
CARE
REITS
-
2.8%
183,342
American
Healthcare
REIT
Inc
2,678,627
7,165,300
Assura
PLC
3,631,982
82,319
CareTrust
REIT
Inc
2,066,207
58,961
Community
Healthcare
Trust
Inc
1,379,098
36,473
Healthcare
Realty
Trust
Inc
601,075
584,611
Healthpeak
Properties
Inc
11,458,375
202,944
Omega
Healthcare
Investors
Inc
6,950,832
TOTAL
HEALTH
CARE
REITS
28,766,196
HOTEL
&
RESORT
REITS
-
0.5%
323,615
Apple
Hospitality
REIT
Inc
4,705,362
TOTAL
HOTEL
&
RESORT
REITS
4,705,362
INDUSTRIAL
REITS
-
4.3%
27,694
ARGAN
SA
2,160,211
284,873
Dexus
Industria
REIT
535,816
475,339
Dream
Industrial
Real
Estate
Investment
Trust
4,402,284
981,136
(b)
FIBRA
Macquarie
Mexico
1,664,097
4,332,467
Frasers
Logistics
&
Commercial
Trust
3,029,746
952
GLP
J-Reit
777,313
1,712
LaSalle
Logiport
REIT
1,573,720
1,771,832
LondonMetric
Property
PLC
4,314,802
277,999
LXP
Industrial
Trust
2,535,351
2,977,817
Mapletree
Industrial
Trust
4,629,781
5,667,875
Mapletree
Logistics
Trust
5,382,258
763,839
Nexus
Industrial
REIT
3,785,555
2,028,737
TF
Administradora
Industrial
S
de
RL
de
CV
4,339,135
1,191,329
Tritax
Big
Box
REIT
PLC
2,329,290
Nuveen
Real
Asset
Income
Fund
(continued)
Portfolio
of
Investments
June
30,
2024
(Unaudited)
Shares
Description
(a)
Value
INDUSTRIAL
REITS
(continued)
1,906,058
Urban
Logistics
REIT
PLC
$
2,830,943
TOTAL
INDUSTRIAL
REITS
44,290,302
MORTGAGE
REITS
-
0.1%
38,335
Blackstone
Mortgage
Trust
Inc,
Class
A
667,796
34,334
Starwood
Property
Trust
Inc
650,286
TOTAL
MORTGAGE
REITS
1,318,082
MULTI-FAMILY
RESIDENTIAL
REITS
-
0.8%
1,047
Daiwa
Securities
Living
Investments
Corp
684,352
15,821
Equity
Residential
1,097,028
3,970,455
(d)
Home
Reit
PLC
5,019
152,253
UDR
Inc
6,265,211
TOTAL
MULTI-FAMILY
RESIDENTIAL
REITS
8,051,610
OFFICE
REITS
-
2.1%
61,089
Boston
Properties
Inc
3,760,639
170,604
COPT
Defense
Properties
4,270,218
494
Daiwa
Office
Investment
Corp
871,127
427,360
Dexus
1,843,583
46,282
Gecina
SA
4,272,346
3,049
KDX
Realty
Investment
Corp
2,963,831
94,984
NSI
NV
1,955,119
706
Orix
JREIT
Inc
699,629
87,113
Postal
Realty
Trust
Inc,
Class
A
1,161,216
TOTAL
OFFICE
REITS
21,797,708
OTHER
SPECIALIZED
REITS
-
1.9%
174,133
Four
Corners
Property
Trust
Inc
4,295,861
238,745
Gaming
and
Leisure
Properties
Inc
10,793,661
156,506
VICI
Properties
Inc
4,482,332
TOTAL
OTHER
SPECIALIZED
REITS
19,571,854
REAL
ESTATE
OPERATING
COMPANIES
-
0.3%
2,900,122
Sirius
Real
Estate
Ltd
3,429,132
TOTAL
REAL
ESTATE
OPERATING
COMPANIES
3,429,132
RETAIL
REITS
-
6.0%
20,120
Agree
Realty
Corp
1,246,233
813,633
Charter
Hall
Retail
REIT
1,756,149
212,646
Choice
Properties
Real
Estate
Investment
Trust
1,995,815
257,892
Crombie
Real
Estate
Investment
Trust
2,403,511
183,076
CT
Real
Estate
Investment
Trust
1,763,782
2,304,291
Fortune
Real
Estate
Investment
Trust
1,109,777
3,458,810
Frasers
Centrepoint
Trust
5,423,006
335,301
Kimco
Realty
Corp
6,524,957
325,851
Link
REIT
1,265,398
50,705
NNN
REIT
Inc
2,160,033
389,050
Primaris
Real
Estate
Investment
Trust
3,773,761
209,195
Realty
Income
Corp
11,049,680
9,992
Regency
Centers
Corp
621,502
138,367
RioCan
Real
Estate
Investment
Trust
1,700,193
8,262
Saul
Centers
Inc
303,794
66,588
Simon
Property
Group
Inc
10,108,058
3,195,570
Vicinity
Ltd
3,929,223
1,728,381
Waypoint
REIT
Ltd
2,497,289
135,102
Wereldhave
NV
1,912,104
TOTAL
RETAIL
REITS
61,544,265
Shares
Description
(a)
Value
SELF-STORAGE
REITS
-
0.6%
78,113
CubeSmart
$
3,528,364
11,495
Extra
Space
Storage
Inc
1,786,438
3,966
Public
Storage
1,140,820
TOTAL
SELF-STORAGE
REITS
6,455,622
TELECOM
TOWER
REITS
-
0.4%
45,310
Crown
Castle
Inc
4,426,787
TOTAL
TELECOM
TOWER
REITS
4,426,787
TOTAL
REAL
ESTATE
INVESTMENT
TRUST
COMMON
STOCKS
(cost
$223,916,808)
216,458,743
Shares
Description
(a)
Coupon
Value
X
–
$25
PAR
(OR
SIMILAR)
RETAIL
PREFERRED
-
13.1%
X
134,927,973
EQUITY
REAL
ESTATE
INVESTMENT
TRUSTS
(REITS)
-
8.3%
288,151
Agree
Realty
Corp
4.250%
$
5,082,984
86,840
American
Homes
4
Rent
6.250%
2,029,451
158,959
American
Homes
4
Rent
5.875%
3,557,502
111,206
Armada
Hoffler
Properties
Inc
6.750%
2,379,808
196,949
Centerspace
6.625%
4,657,863
66,782
DiamondRock
Hospitality
Co
8.250%
1,682,907
139,710
Digital
Realty
Trust
Inc
5.200%
3,003,765
107,952
Digital
Realty
Trust
Inc
5.850%
2,625,393
115,301
Digital
Realty
Trust
Inc
5.250%
2,496,267
153,547
Federal
Realty
Investment
Trust
5.000%
3,235,235
27,491
Kimco
Realty
Corp
7.250%
1,500,184
136,777
Kimco
Realty
Corp
5.125%
2,797,090
173,142
Kimco
Realty
Corp
5.250%
3,629,056
4,704
Mid-America
Apartment
Communities
Inc
8.500%
249,971
108,703
National
Storage
Affiliates
Trust
6.000%
2,470,819
46,037
Pebblebrook
Hotel
Trust
6.375%
901,865
66,656
Pebblebrook
Hotel
Trust
5.700%
1,213,139
100,143
Pebblebrook
Hotel
Trust
6.300%
1,999,856
69,067
(c)
Public
Storage
3.950%
1,210,054
69,889
Public
Storage
4.125%
1,299,935
64,398
Public
Storage
4.700%
1,328,531
81,420
Public
Storage
3.900%
1,408,566
61,956
Public
Storage
5.050%
1,423,129
83,572
Public
Storage
3.875%
1,434,931
44,497
Public
Storage
5.150%
1,029,216
101,895
Public
Storage
4.875%
2,215,197
24,710
Public
Storage
5.600%
621,209
93,962
Public
Storage
4.100%
1,704,471
89,664
Public
Storage
4.625%
1,828,249
101,356
Public
Storage
4.000%
1,846,706
114,145
Public
Storage
4.000%
2,048,903
73,136
Public
Storage
4.750%
1,552,677
117,110
Realty
Income
Corp
6.000%
2,823,522
56,683
Rexford
Industrial
Realty
Inc
5.875%
1,231,155
183,080
Rexford
Industrial
Realty
Inc
5.625%
3,844,680
21,577
RLJ
Lodging
Trust
1.950%
537,052
13,507
Saul
Centers
Inc
6.000%
272,841
145,280
SITE
Centers
Corp
6.375%
3,188,896
40,732
Summit
Hotel
Properties
Inc
5.875%
815,047
74,470
Summit
Hotel
Properties
Inc
6.250%
1,595,892
85,469
Sunstone
Hotel
Investors
Inc
5.700%
1,719,636
61,920
Sunstone
Hotel
Investors
Inc
6.125%
1,350,475
38,104
UMH
Properties
Inc
6.375%
876,011
18,198
Vornado
Realty
Trust
5.250%
272,242
65,551
Vornado
Realty
Trust
5.250%
979,988
TOTAL
EQUITY
REAL
ESTATE
INVESTMENT
TRUSTS
(REITS)
85,972,366
Nuveen
Real
Asset
Income
Fund
(continued)
Portfolio
of
Investments
June
30,
2024
(Unaudited)
Shares
Description
(a)
Coupon
Value
FINANCIAL
SERVICES
-
0.2%
50,262
Brookfield
Finance
Inc
4.625%
$
829,323
28,909
National
Rural
Utilities
Cooperative
Finance
Corp
5.500%
706,247
TOTAL
FINANCIAL
SERVICES
1,535,570
REAL
ESTATE
MANAGEMENT
&
DEVELOPMENT
-
0.2%
71,029
Brookfield
Property
Partners
LP
5.750%
842,404
50,559
Brookfield
Property
Partners
LP
6.500%
717,938
20,831
Brookfield
Property
Partners
LP
6.375%
273,927
TOTAL
REAL
ESTATE
MANAGEMENT
&
DEVELOPMENT
1,834,269
UTILITIES
-
4.4%
52,583
BIP
Bermuda
Holdings
I
Ltd
5.125%
943,339
81,264
Brookfield
BRP
Holdings
Canada
Inc
4.625%
1,258,779
26,883
Brookfield
Infrastructure
Finance
ULC
5.000%
474,485
134,224
Brookfield
Infrastructure
Partners
LP
5.125%
2,491,198
41,025
Brookfield
Infrastructure
Partners
LP
5.000%
713,425
149,300
Brookfield
Renewable
Partners
LP
5.250%
2,745,627
59,357
CMS
Energy
Corp
5.625%
1,429,910
69,730
CMS
Energy
Corp
5.875%
1,681,888
139,028
CMS
Energy
Corp
4.200%
2,627,629
91,733
CMS
Energy
Corp
5.875%
2,220,856
94,161
DTE
Energy
Co
5.250%
2,224,083
144,605
DTE
Energy
Co
4.375%
2,793,769
141,667
DTE
Energy
Co
4.375%
2,812,090
78,768
Duke
Energy
Corp
5.625%
1,982,591
90,053
(c)
Duke
Energy
Corp
5.750%
2,251,325
90,672
Georgia
Power
Co
5.000%
2,284,934
44,931
SCE
Trust
VII
7.500%
1,175,844
38,460
SCE
Trust
VIII
6.950%
989,960
174,621
Sempra
5.750%
4,077,400
73,656
Southern
Co/The
5.250%
1,721,341
146,814
Southern
Co/The
4.950%
3,240,185
170,550
Southern
Co/The
4.200%
3,445,110
TOTAL
UTILITIES
45,585,768
TOTAL
$25
PAR
(OR
SIMILAR)
RETAIL
PREFERRED
(cost
$151,019,780)
134,927,973
Principal
Amount
(000)
Description
(a)
Coupon
Maturity
Value
X
–
$1,000
PAR
(OR
SIMILAR)
INSTITUTIONAL
PREFERRED
-
12.5%
X
129,117,809
CONSUMER
SERVICES
-
0.1%
$
600
EUR
Accor
SA,
Reg
S
7.250%
N/A
(e)
$
696,867
TOTAL
CONSUMER
SERVICES
696,867
ENERGY
-
4.9%
5,432
Enbridge
Inc
6.000%
1/15/77
5,275,612
4,410
Enbridge
Inc
5.500%
7/15/77
4,154,666
2,947
Enbridge
Inc
6.250%
3/01/78
2,825,844
2,815
Enbridge
Inc
5.750%
7/15/80
2,656,382
2,589
Enbridge
Inc
7.625%
1/15/83
2,646,566
1,897
Enbridge
Inc
8.500%
1/15/84
2,045,027
2,428
(f)
Energy
Transfer
LP
(TSFR3M
reference
rate
+
3.279%
spread)
8.606%
11/01/66
2,383,309
1,230
Energy
Transfer
LP
6.500%
N/A
(e)
1,213,211
1,291
(c)
Energy
Transfer
LP
7.125%
10/01/54
1,273,681
2,813
Energy
Transfer
LP
7.125%
N/A
(e)
2,786,389
975
Energy
Transfer
LP
8.000%
5/15/54
1,019,841
5,956
Enterprise
Products
Operating
LLC
5.250%
8/16/77
5,695,825
4,205
Enterprise
Products
Operating
LLC
5.375%
2/15/78
3,927,515
Principal
Amount
(000)
Description
(a)
Coupon
Maturity
Value
ENERGY
(continued)
$
1,609
CAD
Inter
Pipeline
Ltd/AB
6.625%
11/19/79
$
1,143,524
2,123
CAD
Keyera
Corp
5.950%
3/10/81
1,464,165
1,326
(f)
Plains
All
American
Pipeline
LP
(TSFR3M
reference
rate
+
4.372%
spread)
9.694%
N/A
(e)
1,320,177
2,450
Transcanada
Trust
5.500%
9/15/79
2,248,436
3,775
Transcanada
Trust
5.875%
8/15/76
3,694,614
2,345
Transcanada
Trust
5.600%
3/07/82
2,125,893
625
Transcanada
Trust
5.300%
3/15/77
586,091
TOTAL
ENERGY
50,486,768
FINANCIAL
SERVICES
-
0.5%
1,860
National
Rural
Utilities
Cooperative
Finance
Corp
7.125%
9/15/53
1,911,606
745
National
Rural
Utilities
Cooperative
Finance
Corp
5.250%
4/20/46
723,915
2,626
Transcanada
Trust
5.625%
5/20/75
2,582,769
TOTAL
FINANCIAL
SERVICES
5,218,290
REAL
ESTATE
MANAGEMENT
&
DEVELOPMENT
-
0.1%
1,463
(b)
EUSHI
Finance
Inc
7.625%
12/15/54
1,468,628
TOTAL
REAL
ESTATE
MANAGEMENT
&
DEVELOPMENT
1,468,628
TRANSPORTATION
-
0.2%
1,950
BNSF
Funding
Trust
I
6.613%
12/15/55
1,948,517
TOTAL
TRANSPORTATION
1,948,517
UTILITIES
-
6.7%
1,925
(b)
AES
Andes
SA
8.150%
6/10/55
1,925,000
3,310
AES
Corp/The
7.600%
1/15/55
3,350,923
1,285
CAD
AltaGas
Ltd
8.900%
11/10/83
1,007,965
2,015
CMS
Energy
Corp
3.750%
12/01/50
1,684,499
3,570
CMS
Energy
Corp
4.750%
6/01/50
3,269,202
1,775
ComEd
Financing
III
6.350%
3/15/33
1,754,504
3,270
Dominion
Energy
Inc
7.000%
6/01/54
3,402,317
3,230
Dominion
Energy
Inc
4.350%
N/A
(e)
3,030,752
2,755
Dominion
Energy
Inc
5.750%
10/01/54
2,747,247
4,683
Duke
Energy
Corp
4.875%
N/A
(e)
4,642,486
1,790
Edison
International
5.375%
N/A
(e)
1,743,728
2,570
Edison
International
5.000%
N/A
(e)
2,444,588
1,700
GBP
Electricite
de
France
SA,
Reg
S
5.875%
N/A
(e)
2,040,231
3,590
Emera
Inc
6.750%
6/15/76
3,562,871
3,374
Entergy
Corp
7.125%
12/01/54
3,344,096
1,700
NextEra
Energy
Capital
Holdings
Inc
3.800%
3/15/82
1,567,078
5,185
NextEra
Energy
Capital
Holdings
Inc
5.650%
5/01/79
4,948,759
1,157
NextEra
Energy
Capital
Holdings
Inc
6.750%
6/15/54
1,163,634
5,152
NiSource
Inc
6.950%
11/30/54
5,175,689
1,607
PPL
Capital
Funding
Inc
8.261%
3/30/67
1,594,303
2,600
Sempra
6.875%
10/01/54
2,584,004
3,320
Sempra
4.125%
4/01/52
3,055,896
4,242
Sempra
4.875%
N/A
(e)
4,160,620
2,590
Southern
Co/The
4.000%
1/15/51
2,511,096
2,125
GBP
SSE
PLC,
Reg
S
3.740%
N/A
(e)
2,587,251
TOTAL
UTILITIES
69,298,739
TOTAL
$1,000
PAR
(OR
SIMILAR)
INSTITUTIONAL
PREFERRED
(cost
$130,010,234)
129,117,809
Nuveen
Real
Asset
Income
Fund
(continued)
Portfolio
of
Investments
June
30,
2024
(Unaudited)
Shares
Description
(a)
Coupon
Value
X
–
CONVERTIBLE
PREFERRED
SECURITIES
-
1.8%
X
18,523,875
EQUITY
REAL
ESTATE
INVESTMENT
TRUSTS
(REITS)
-
1.0%
633,686
British
Land
Co
PLC/The
0.000%
$
3,293,785
17,112
Equity
Commonwealth
6.500%
426,260
17,536
LXP
Industrial
Trust
6.500%
795,609
134,625
Regency
Centers
Corp
6.250%
3,107,145
109,459
Regency
Centers
Corp
5.875%
2,380,733
TOTAL
EQUITY
REAL
ESTATE
INVESTMENT
TRUSTS
(REITS)
10,003,532
UTILITIES
-
0.8%
113,512
NextEra
Energy
Inc
6.926%
4,709,613
77,000
NextEra
Energy
Inc
7.299%
3,810,730
TOTAL
UTILITIES
8,520,343
TOTAL
CONVERTIBLE
PREFERRED
SECURITIES
(cost
$18,851,292)
18,523,875
Shares
Description
(a)
Value
X–
INVESTMENT
COMPANIES
-
0.5%
X
5,205,567
527,026
Greencoat
UK
Wind
PLC/Funds
$
879,402
504,067
JLEN
Environmental
Assets
Group
Ltd
Foresight
Group
Holdings
555,378
611,872
Renewables
Infrastructure
Group
Ltd/The
737,466
1,524,320
Sdcl
Energy
Efficiency
Income
Trust
PLC
1,288,892
1,237,236
Sequoia
Economic
Infrastructure
Income
Fund
Ltd
1,249,904
420,653
Starwood
European
Real
Estate
Finance
Ltd
494,525
TOTAL
INVESTMENT
COMPANIES
(cost
$6,384,080)
5,205,567
Principal
Amount
(000)
Description
(a)
Coupon
Maturity
Value
X–
MORTGAGE-BACKED
SECURITIES
-
0.1%
X
1,278,493
$
200
(b)
COMM
2014-UBS3
Mortgage
Trust,
2014
UBS3
4.767%
6/10/47
$
89,709
400
(b),(f)
Natixis
Commercial
Mortgage
Securities
Trust
2019-MILE,
(TSFR1M
reference
rate
+
2.829%
spread),
2019
MILE
8.158%
7/15/36
312,586
1,300
(b),(f)
Natixis
Commercial
Mortgage
Securities
Trust
2019-MILE,
(TSFR1M
reference
rate
+
0.043%
spread),
2019
MILE
9.658%
7/15/36
876,198
TOTAL
MORTGAGE-BACKED
SECURITIES
(cost
$1,898,898)
1,278,493
Principal
Amount
(000)
Description
(a)
Coupon
(g)
Reference
Rate
(g)
Spread
(g)
Maturity
(h)
Value
X
–
VARIABLE
RATE
SENIOR
LOAN
INTERESTS
-
0.0%
(g)
X
141,087
CONSUMER
DISCRETIONARY
DISTRIBUTION
&
RETAIL
-
0.0%
$
140
Wand
NewCo
3,
Inc.,
Term
Loan
B
,
(WI/DD)
TBD
TBD
TBD
TBD
$
141,087
TOTAL
CONSUMER
DISCRETIONARY
DISTRIBUTION
&
RETAIL
141,087
TOTAL
VARIABLE
RATE
SENIOR
LOAN
INTERESTS
(cost
$139,650)
141,087
TOTAL
LONG-TERM
INVESTMENTS
(cost
$1,011,893,100)
1,010,120,754
Shares
Description
(a)
Coupon
Value
INVESTMENTS
PURCHASED
WITH
COLLATERAL
FROM
SECURITIES
LENDING
-
0.6%
6,183,672
(i)
State
Street
Navigator
Securities
Lending
Government
Money
Market
Portfolio
5.330%(j)
$
6,183,672
TOTAL
INVESTMENTS
PURCHASED
WITH
COLLATERAL
FROM
SECURITIES
LENDING
(cost
$6,183,672)
6,183,672
Investments
in
Derivatives
Principal
Amount
(000)
Description
(a)
Coupon
Maturity
Value
SHORT-TERM
INVESTMENTS
-
1.1%
X
–
REPURCHASE
AGREEMENTS
-
1.1%
X
11,036,855
$
10,225
(k)
Fixed
Income
Clearing
Corporation
5.270%
7/01/24
$
10,225,000
812
(l)
Fixed
Income
Clearing
Corporation
1.600%
7/01/24
811,855
TOTAL
REPURCHASE
AGREEMENTS
(cost
$11,036,855)
11,036,855
TOTAL
SHORT-TERM
INVESTMENTS
(cost
$11,036,855)
11,036,855
TOTAL
INVESTMENTS
(cost
$1,029,113,627
)
-
99.7%
1,027,341,281
OTHER
ASSETS
&
LIABILITIES,
NET
- 0.3%
2,955,385
NET
ASSETS
-
100%
$
1,030,296,666
Futures
Contracts
-
Short
Description
Number
of
Contracts
Expiration
Date
Notional
Amount
Value
Unrealized
Appreciation
(Depreciation)
U.S.
Treasury
10-Year
Note
(53)
9/24
$
(5,755,946)
$
(5,829,172)
$
(73,226)
U.S.
Treasury
Ultra
10-Year
Note
(305)
9/24
(34,240,390)
(34,627,031)
(386,641)
U.S.
Treasury
Ultra
Bond
(70)
9/24
(8,610,918)
(8,774,063)
(163,145)
Total
$(48,607,254)
$(49,230,266)
$(623,012)
For
Fund
portfolio
compliance
purposes,
the
Fund’s
industry
classifications
refer
to
any
one
or
more
of
the
industry
sub-classifications
used
by
one
or
more
widely
recognized
market
indexes
or
ratings
group
indexes,
and/or
as
defined
by
Fund
management.
This
definition
may
not
apply
for
purposes
of
this
report,
which
may
combine
industry
sub-classifications
into
sectors
for
reporting
ease.
(a)
All
percentages
shown
in
the
Portfolio
of
Investments
are
based
on
net
assets.
(b)
Security
is
exempt
from
registration
under
Rule
144A
of
the
Securities
Act
of
1933,
as
amended.
These
securities
are
deemed
liquid
and
may
be
resold
in
transactions
exempt
from
registration,
which
are
normally
those
transactions
with
qualified
institutional
buyers.
As
of
the
end
of
the
reporting
period,
the
aggregate
value
of
these
securities
is
$159,920,857
or
15.6%
of
Total
Investments.
(c)
Investment,
or
a
portion
of
investment,
is
out
on
loan
for
securities
lending.
The
total
value
of
the
securities
out
on
loan
as
of
the
end
of
the
reporting
period
was
$5,915,119.
(d)
For
fair
value
measurement
disclosure
purposes,
investment
classified
as
Level
3.
(e)
Perpetual
security.
Maturity
date
is
not
applicable.
(f)
Variable
rate
security.
The
rate
shown
is
the
coupon
as
of
the
end
of
the
reporting
period.
(g)
Senior
loans
generally
pay
interest
at
rates
which
are
periodically
adjusted
by
reference
to
a
base
short-term,
floating
lending
rate
(Reference
Rate)
plus
an
assigned
fixed
rate
(Spread).
These
floating
lending
rates
are
generally
(i)
the
lending
rate
referenced
by
the
Secured
Overnight
Financing
Rate
(“SOFR”),
or
(ii)
the
prime
rate
offered
by
one
or
more
major
United
States
banks.
Senior
loans
may
be
considered
restricted
in
that
the
Fund
ordinarily
is
contractually
obligated
to
receive
approval
from
the
agent
bank
and/or
borrower
prior
to
the
disposition
of
a
senior
loan.
The
rate
shown
is
the
coupon
as
of
the
end
of
the
reporting
period.
(h)
Senior
loans
generally
are
subject
to
mandatory
and/or
optional
prepayment.
Because
of
these
mandatory
prepayment
conditions
and
because
there
may
be
significant
economic
incentives
for
a
borrower
to
prepay,
prepayments
of
senior
loans
may
occur.
As
a
result,
the
actual
remaining
maturity
of
senior
loans
held
may
be
substantially
less
than
the
stated
maturities
shown.
(i)
The
Fund
may
loan
securities
representing
up
to
one
third
of
the
value
of
its
total
assets
(which
includes
collateral
for
securities
on
loan)
to
broker
dealers,
banks,
and
other
institutions.
The
collateral
maintained
by
the
Fund
shall
have
a
value,
at
the
inception
of
each
loan,
equal
to
not
less
than
100%
of
the
value
of
the
loaned
securities.
The
cash
collateral
received
by
the
Fund
is
invested
in
this
money
market
fund.
(j)
The
rate
shown
is
the
one-day
yield
as
of
the
end
of
the
reporting
period.
(k)
Agreement
with
Fixed
Income
Clearing
Corporation,
5.270%
dated
6/28/24
to
be
repurchased
at
$10,229,490
on
7/1/24,
collateralized
by
Government
Agency
Securities,
with
coupon
rate
4.000%
and
maturity
date
1/31/31,
valued
at
$10,429,637.
(l)
Agreement
with
Fixed
Income
Clearing
Corporation,
1.600%
dated
6/28/24
to
be
repurchased
at
$811,963
on
7/1/24,
collateralized
by
Government
Agency
Securities,
with
coupon
rate
0.750%
and
maturity
date
8/31/26,
valued
at
$828,103.
ADR
American
Depositary
Receipt
CAD
Canadian
Dollar
EUR
Euro
GBP
Pound
Sterling
Nuveen
Real
Asset
Income
Fund
(continued)
Portfolio
of
Investments
June
30,
2024
(Unaudited)
Principal
denominated
in
U.S.
Dollars,
unless
otherwise
noted.
Reg
S
Regulation
S
allows
U.S.
companies
to
sell
securities
to
persons
or
entities
located
outside
of
the
United
States
without
registering
those
securities
with
the
Securities
and
Exchange
Commission.
Specifically,
Regulation
S
provides
a
safe
harbor
from
the
registration
requirements
of
the
Securities
Act
for
the
offers
and
sales
of
securities
by
both
foreign
and
domestic
issuers
that
are
made
outside
the
United
States.
REIT
Real
Estate
Investment
Trust
TBD
Senior
loan
purchased
on
a
when-issued
or
delayed-delivery
basis.
Certain
details
associated
with
this
purchase
are
not
known
prior
to
the
settlement
date
of
the
transaction.
In
addition,
senior
loans
typically
trade
without
accrued
interest
and
therefore
a
coupon
rate
is
not
available
prior
to
settlement.
At
settlement,
if
still
unknown,
the
borrower
or
counterparty
will
provide
the
Fund
with
the
final
coupon
rate
and
maturity
date.
TSFR
1M
CME
Term
SOFR
1
Month
TSFR
3M
CME
Term
SOFR
3
Month
WI/DD
When-issued
or
delayed
delivery
security.
See
Notes
to
Financial
Statements
Nuveen
Real
Estate
Securities
Fund
Portfolio
of
Investments
June
30,
2024
(Unaudited)
Shares
Description
(a)
Value
LONG-TERM
INVESTMENTS
-
97.5%
X
–
REAL
ESTATE
INVESTMENT
TRUST
COMMON
STOCKS
-
97
.5
%
X
944,394,061
DATA
CENTER
REITS
-
11.5%
302,762
Digital
Realty
Trust
Inc
$
46,034,962
85,990
Equinix
Inc
65,060,034
TOTAL
DATA
CENTER
REITS
111,094,996
DIVERSIFIED
REITS
-
0.7%
143,550
Armada
Hoffler
Properties
Inc
1,591,970
186,013
Essential
Properties
Realty
Trust
Inc
5,154,420
TOTAL
DIVERSIFIED
REITS
6,746,390
HEALTH
CARE
REITS
-
13.8%
385,705
American
Healthcare
REIT
Inc
5,635,150
164,185
CareTrust
REIT
Inc
4,121,044
1,703,297
Healthpeak
Properties
Inc
33,384,621
360,542
Omega
Healthcare
Investors
Inc
12,348,564
562,717
Ventas
Inc
28,844,873
467,797
Welltower
Inc
48,767,837
TOTAL
HEALTH
CARE
REITS
133,102,089
HOTEL
&
RESORT
REITS
-
2.6%
246,734
Apple
Hospitality
REIT
Inc
3,587,512
424,163
Host
Hotels
&
Resorts
Inc
7,626,451
139,885
Ryman
Hospitality
Properties
Inc
13,968,916
TOTAL
HOTEL
&
RESORT
REITS
25,182,879
INDUSTRIAL
REITS
-
14.7%
410,647
Americold
Realty
Trust
Inc
10,487,924
107,879
EastGroup
Properties
Inc
18,350,218
306,063
First
Industrial
Realty
Trust
Inc
14,541,053
777,691
LXP
Industrial
Trust
7,092,542
692,758
Prologis
Inc
77,803,652
288,268
Rexford
Industrial
Realty
Inc
12,853,870
32,825
STAG
Industrial
Inc
1,183,670
TOTAL
INDUSTRIAL
REITS
142,312,929
MULTI-FAMILY
RESIDENTIAL
REITS
-
8.9%
162,800
AvalonBay
Communities
Inc
33,681,692
283,568
Equity
Residential
19,662,605
68,964
Essex
Property
Trust
Inc
18,772,001
195,638
UDR
Inc
8,050,503
371,616
Veris
Residential
Inc
5,574,240
TOTAL
MULTI-FAMILY
RESIDENTIAL
REITS
85,741,041
OFFICE
REITS
-
4.2%
123,717
Alexandria
Real
Estate
Equities
Inc
14,471,177
130,232
Boston
Properties
Inc
8,017,082
329,962
COPT
Defense
Properties
8,258,949
347,294
Cousins
Properties
Inc
8,039,856
451,870
Hudson
Pacific
Properties
Inc
2,173,495
TOTAL
OFFICE
REITS
40,960,559
OTHER
SPECIALIZED
REITS
-
5.8%
502,636
Gaming
and
Leisure
Properties
Inc
22,724,174
71,684
Iron
Mountain
Inc
6,424,320
943,249
VICI
Properties
Inc
27,014,651
TOTAL
OTHER
SPECIALIZED
REITS
56,163,145
Nuveen
Real
Estate
Securities
Fund
(continued)
Portfolio
of
Investments
June
30,
2024
(Unaudited)
Shares
Description
(a)
Value
RETAIL
REITS
-
15.2%
274,298
Acadia
Realty
Trust
$
4,915,420
309,692
Agree
Realty
Corp
19,182,323
128,988
Federal
Realty
Investment
Trust
13,023,918
1,649,259
Kimco
Realty
Corp
32,094,580
138,444
NETSTREIT
Corp
2,228,948
83,593
NNN
REIT
Inc
3,561,062
430,375
Realty
Income
Corp
22,732,408
303,700
Regency
Centers
Corp
18,890,140
119,053
Simon
Property
Group
Inc
18,072,245
631,245
SITE
Centers
Corp
9,153,053
200,569
Urban
Edge
Properties
3,704,509
TOTAL
RETAIL
REITS
147,558,606
SELF-STORAGE
REITS
-
7.0%
179,744
CubeSmart
8,119,036
83,609
Extra
Space
Storage
Inc
12,993,675
163,519
Public
Storage
47,036,240
TOTAL
SELF-STORAGE
REITS
68,148,951
SINGLE-FAMILY
RESIDENTIAL
REITS
-
6.7%
168,083
American
Homes
4
Rent,
Class
A
6,245,964
260,224
Equity
LifeStyle
Properties
Inc
16,948,389
902,513
Invitation
Homes
Inc
32,391,192
79,247
Sun
Communities
Inc
9,536,584
TOTAL
SINGLE-FAMILY
RESIDENTIAL
REITS
65,122,129
TELECOM
TOWER
REITS
-
6.1%
199,287
American
Tower
Corp
38,737,407
23,835
Crown
Castle
Inc
2,328,680
91,974
SBA
Communications
Corp
18,054,496
TOTAL
TELECOM
TOWER
REITS
59,120,583
TIMBER
REITS
-
0.3%
110,594
Weyerhaeuser
Co
3,139,764
TOTAL
TIMBER
REITS
3,139,764
TOTAL
REAL
ESTATE
INVESTMENT
TRUST
COMMON
STOCKS
(cost
$703,075,238)
944,394,061
TOTAL
LONG-TERM
INVESTMENTS
(cost
$703,075,238)
944,394,061
Principal
Amount
(000)
Description
(a)
Coupon
Maturity
Value
SHORT-TERM
INVESTMENTS
-
2.2%
X
–
REPURCHASE
AGREEMENTS
-
2
.2
%
X
21,059,924
$
20,425
(b)
Fixed
Income
Clearing
Corporation
5.270%
7/01/24
$
20,425,000
635
(c)
Fixed
Income
Clearing
Corporation
1.600%
7/01/24
634,924
TOTAL
REPURCHASE
AGREEMENTS
(cost
$21,059,924)
21,059,924
TOTAL
SHORT-TERM
INVESTMENTS
(cost
$21,059,924)
21,059,924
TOTAL
INVESTMENTS
(cost
$
724,135,162
)
-
99
.7
%
965,453,985
OTHER
ASSETS
&
LIABILITIES,
NET
- 0.3%
2,437,931
NET
ASSETS
-
100%
$
967,891,916
For
Fund
portfolio
compliance
purposes,
the
Fund’s
industry
classifications
refer
to
any
one
or
more
of
the
industry
sub-classifications
used
by
one
or
more
widely
recognized
market
indexes
or
ratings
group
indexes,
and/or
as
defined
by
Fund
management.
This
definition
may
not
apply
for
purposes
of
this
report,
which
may
combine
industry
sub-classifications
into
sectors
for
reporting
ease.
(a)
All
percentages
shown
in
the
Portfolio
of
Investments
are
based
on
net
assets.
(b)
Agreement
with
Fixed
Income
Clearing
Corporation,
5.270%
dated
6/28/24
to
be
repurchased
at
$20,433,970
on
7/1/24,
collateralized
by
Government
Agency
Securities,
with
coupon
rate
4.000%
and
maturity
date
1/31/31,
valued
at
$20,833,599.
(c)
Agreement
with
Fixed
Income
Clearing
Corporation,
1.600%
dated
6/28/24
to
be
repurchased
at
$635,008
on
7/1/24,
collateralized
by
Government
Agency
Securities,
with
coupon
rate
0.750%
and
maturity
date
8/31/26,
valued
at
$647,681.
REIT
Real
Estate
Investment
Trust
See
Notes
to
Financial
Statements
Statement
of
Assets
and
Liabilities
See
Notes
to
Financial
Statements
June
30,
2024
(Unaudited)
Global
Infrastructure
Global
Real
Estate
Securities
Real
Asset
Income
Real
Estate
Securities
ASSETS
Long-term
investments,
at
value
†‡
$
455,143,614
$
40,475,847
$
1,010,120,754
$
944,394,061
Investments
purchased
with
collateral
from
securities
lending,
at
value
(cost
approximates
value)
–
–
6,183,672
–
Short-term
investments,
at
value
◊
7,095,416
950,000
11,036,855
21,059,924
Cash
–
47,486
–
–
Cash
denominated
in
foreign
currencies
^
117,588
14,545
1,843,218
–
Cash
collateral
at
broker
for
investments
in
futures
contracts
(1)
–
–
1,284,003
–
Receivables:
Dividends
1,128,047
175,737
2,726,599
3,703,731
Interest
2,972
417
6,541,286
9,055
Investments
sold
3,368,467
172,529
2,096,277
2,061,594
Reclaims
227,949
25,894
805,485
33,119
Reimbursement
from
Adviser
122,013
42,300
241,038
456,288
Shares
sold
684,761
326
290,339
1,266,703
Variation
margin
on
futures
contracts
–
–
277,750
–
Other
78,823
32,907
96,682
182,018
Total
assets
467,969,650
41,937,988
1,043,543,958
973,166,493
LIABILITIES
Cash
overdraft
239,023
–
617,323
–
Payables:
Management
fees
343,677
30,778
619,898
611,235
Collateral
from
securities
lending
–
–
6,183,672
–
Dividends
–
338,940
155,379
1,271,484
Capital
gain
taxes
107,121
–
–
–
Interest
387
30
885
759
Investments
purchased
-
regular
settlement
1,645,629
119,859
2,807,279
1,112,200
Investments
purchased
-
when-issued/delayed-delivery
settlement
–
–
139,650
–
Shares
redeemed
156,753
9,275
1,952,498
1,620,501
Accrued
expenses:
Custodian
fees
184,068
77,169
248,747
81,243
Directors/Trustees
fees
27,535
778
60,399
154,420
Professional
fees
29,192
26,107
37,409
44,858
Shareholder
reporting
expenses
22,701
13,290
141,536
62,338
Shareholder
servicing
agent
fees
95,039
984
214,129
290,510
12b-1
distribution
and
service
fees
14,876
191
68,488
25,029
Other
6,205
—
—
—
Total
liabilities
2,872,206
617,401
13,247,292
5,274,577
Net
assets
$
465,097,444
$
41,320,587
$
1,030,296,666
$
967,891,916
NET
ASSETS
CONSIST
OF:
Paid-in
capital
$
375,313,829
$
43,690,203
$
1,332,278,456
$
738,728,674
Total
distributable
earnings
(loss)
89,783,615
(
2,369,616
)
(
301,981,790
)
229,163,242
Net
assets
$
465,097,444
$
41,320,587
$
1,030,296,666
$
967,891,916
†
Long-term
investments,
cost
$
363,395,842
$
37,247,564
$
1,011,893,100
$
703,075,238
◊
Short-term
investments,
cost
$
7,095,416
$
950,000
$
11,036,855
$
21,059,924
‡
Includes
securities
loaned
of
$
—
$
—
$
5,915,119
$
—
^
Cash
denominated
in
foreign
currencies,
cost
$
117,539
$
14,550
$
1,841,961
$
—
(1)
Cash
pledged
to
collateralize
the
net
payment
obligations
for
investments
in
derivatives.
Statement
of
Assets
and
Liabilities
(continued)
See
Notes
to
Financial
Statements
Global
Infrastructure
Global
Real
Estate
Securities
Real
Asset
Income
Real
Estate
Securities
CLASS
A:
Net
assets
$
43,799,429
$
740,521
$
135,626,224
$
112,713,336
Shares
outstanding
3,960,911
42,184
6,625,529
7,757,021
Net
asset
value
("NAV")
per
share
$
11.06
$
17.55
$
20.47
$
14.53
Maximum
sales
charge
5.75%
5.75%
5.75%
5.75%
Offering
price
per
share
(NAV
per
share
plus
maximum
sales
charge)
$
11.73
$
18.62
$
21.72
$
15.42
CLASS
C:
Net
assets
$
6,873,032
$
44,769
$
48,126,619
$
2,611,626
Shares
outstanding
634,860
2,552
2,349,609
188,076
NAV
and
offering
price
per
share
$
10.83
$
17.54
$
20.48
$
13.89
CLASS
R6:
Net
assets
$
70,940,421
$
38,049,433
$
184,513,256
$
263,110,723
Shares
outstanding
6,416,986
2,168,058
8,956,329
17,376,638
NAV
and
offering
price
per
share
$
11.06
$
17.55
$
20.60
$
15.14
CLASS
I:
Net
assets
$
343,484,562
$
2,485,864
$
662,030,567
$
589,456,231
Shares
outstanding
31,156,515
141,697
32,337,385
39,599,601
NAV
and
offering
price
per
share
$
11.02
$
17.54
$
20.47
$
14.89
Authorized
shares
-
per
class
2
billion
Unlimited
2
billion
2
billion
Par
value
per
share
$
0.0001
$
0.01
$
0.0001
$
0.0001
See
Notes
to
Financial
Statements
Six
Months
Ended
June
30,
2024
(Unaudited)
Global
Infrastructure
Global
Real
Estate
Securities
Real
Asset
Income
Real
Estate
Securities
INVESTMENT
INCOME
Affiliated
income
$
258,630
$
26,491
$
439,404
$
790,580
Dividends
10,078,309
822,724
19,356,688
15,387,032
Interest
307,228
19,595
12,456,111
631,368
Securities
lending
income,
net
51,961
—
185,406
—
Tax
withheld
(739,575)
(54,620)
(1,189,270)
—
Total
investment
income
9,956,553
814,190
31,248,339
16,808,980
EXPENSES
–
–
–
–
Management
fees
2,088,375
186,956
3,838,997
3,959,666
12b-1
service
fees
-
Class
A
56,349
945
175,953
142,460
12b-1
distribution
and
service
fees
-
Class
C
36,607
232
269,784
15,187
Shareholder
servicing
agent
fees
-
Class
A
17,296
293
74,639
91,470
Shareholder
servicing
agent
fees
-
Class
C
2,810
18
28,659
2,446
Shareholder
servicing
agent
fees
-
Class
R6
2,323
1,002
10,786
11,712
Shareholder
servicing
agent
fees
-
Class
I
130,499
836
357,795
439,454
Interest
expense
1,860
124
4,070
2,233
Directors/Trustees
fees
8,193
742
18,193
16,315
Custodian
expenses
157,361
46,999
136,505
38,937
Registration
fees
36,335
34,100
43,750
39,088
Professional
fees
94,367
44,725
103,455
88,795
Shareholder
reporting
expenses
50,166
15,837
279,679
141,668
Other
8,885
5,986
16,507
9,535
Total
expenses
before
fee
waiver/expense
reimbursement
2,691,426
338,795
5,358,772
4,998,966
Fee
waiver/expense
reimbursement
(342,889)
(135,688)
(225,402)
(561,343)
Net
expenses
2,348,537
203,107
5,133,370
4,437,623
Net
investment
income
(loss)
7,608,016
611,083
26,114,969
12,371,357
REALIZED
AND
UNREALIZED
GAIN
(LOSS)
Realized
gain
(loss)
from:
Investments
4,412,335
142,778
(5,447,784)
14,434,323
Futures
contracts
—
—
912,873
—
Foreign
currency
transactions
(48,628)
(6,783)
(35,396)
—
Net
realized
gain
(loss)
4,363,707
135,995
(4,570,307)
14,434,323
Change
in
unrealized
appreciation
(depreciation)
on:
Investments
**
(6,931,204)
(2,221,807)
(13,188,882)
(44,509,847)
Futures
contracts
—
—
2,273,244
—
Foreign
currency
translations
(5,244)
(1,391)
(41,220)
—
Net
change
in
unrealized
appreciation
(depreciation)
(6,936,448)
(2,223,198)
(10,956,858)
(44,509,847)
Net
realized
and
unrealized
gain
(loss)
(2,572,741)
(2,087,203)
(15,527,165)
(30,075,524)
Net
increase
(decrease)
in
net
assets
from
operations
$
5,035,275
$
(1,476,120)
$
10,587,804
$
(17,704,167)
**
Net
of
change
in
foreign
capital
gains
tax
$
(59,538)
$
—
$
—
$
—
Statement
of
Changes
in
Net
Assets
June
30,
2024
See
Notes
to
Financial
Statements
Global
Infrastructure
Global
Real
Estate
Securities
Unaudited
Six
Months
Ended
6/30/24
Year
Ended
12/31/23
Unaudited
Six
Months
Ended
6/30/24
Year
Ended
12/31/23
OPERATIONS
Net
investment
income
(loss)
$
7,608,016
$
11,132,821
$
611,083
$
1,169,386
Net
realized
gain
(loss)
4,363,707
7,451,947
135,995
(
1,699,511
)
Net
change
in
unrealized
appreciation
(depreciation)
(
6,936,448
)
22,667,510
(
2,223,198
)
5,001,056
Net
increase
(decrease)
in
net
assets
from
operations
5,035,275
41,252,278
(
1,476,120
)
4,470,931
DISTRIBUTIONS
TO
SHAREHOLDERS
Dividends:
Class
A
—
(
1,020,446
)
(
11,025
)
(
17,378
)
Class
C
—
(
111,173
)
(
492
)
(
1,095
)
Class
R6
—
(
1,749,108
)
(
630,130
)
(
1,218,539
)
Class
I
—
(
8,217,071
)
(
36,981
)
(
67,730
)
Return
of
Capital:
Class
A
—
(
48,641
)
—
—
Class
C
—
(
9,598
)
—
—
Class
R6
—
(
73,976
)
—
—
Class
I
—
(
365,813
)
—
—
Total
distributions
—
(
11,595,826
)
(
678,628
)
(
1,304,742
)
FUND
SHARE
TRANSACTIONS
Subscriptions
38,992,817
77,546,708
565,212
1,299,206
Reinvestments
of
distributions
—
8,426,032
56,005
102,871
Redemptions
(
53,485,936
)
(
147,094,878
)
(
180,702
)
(
1,029,507
)
Net
increase
(decrease)
from
Fund
share
transactions
(
14,493,119
)
(
61,122,138
)
440,515
372,570
Net
increase
(decrease)
in
net
assets
(
9,457,844
)
(
31,465,686
)
(
1,714,233
)
3,538,759
Net
assets
at
the
beginning
of
period
474,555,288
506,020,974
43,034,820
39,496,061
Net
assets
at
the
end
of
period
$
465,097,444
$
474,555,288
$
41,320,587
$
43,034,820
Statement
of
Changes
in
Net
Assets
(continued)
See
Notes
to
Financial
Statements
Real
Asset
Income
Real
Estate
Securities
Unaudited
Six
Months
Ended
6/30/24
Year
Ended
12/31/23
Unaudited
Six
Months
Ended
6/30/24
Year
Ended
12/31/23
OPERATIONS
Net
investment
income
(loss)
$
26,114,969
$
55,551,530
$
12,371,357
$
26,757,383
Net
realized
gain
(loss)
(
4,570,307
)
(
48,015,985
)
14,434,323
27,445,193
Net
change
in
unrealized
appreciation
(depreciation)
(
10,956,858
)
79,955,696
(
44,509,847
)
51,178,164
Net
increase
(decrease)
in
net
assets
from
operations
10,587,804
87,491,241
(
17,704,167
)
105,380,740
DISTRIBUTIONS
TO
SHAREHOLDERS
Dividends:
Class
A
(
3,423,692
)
(
7,585,795
)
(
1,601,350
)
(
3,967,524
)
Class
C
(
1,107,007
)
(
3,151,082
)
(
29,555
)
(
105,263
)
Class
R6
(
4,692,337
)
(
8,825,179
)
(
4,252,118
)
(
11,183,009
)
Class
I
(
17,208,201
)
(
39,560,593
)
(
8,771,390
)
(
19,417,017
)
Total
distributions
(
26,431,237
)
(
59,122,649
)
(
14,654,413
)
(
34,672,813
)
FUND
SHARE
TRANSACTIONS
Subscriptions
92,194,591
182,856,316
183,549,004
228,196,157
Reinvestments
of
distributions
25,410,592
56,492,733
12,050,862
27,541,116
Redemptions
(
163,555,856
)
(
381,185,908
)
(
191,850,194
)
(
380,983,554
)
Net
increase
(decrease)
from
Fund
share
transactions
(
45,950,673
)
(
141,836,859
)
3,749,672
(
125,246,281
)
Net
increase
(decrease)
in
net
assets
(
61,794,106
)
(
113,468,267
)
(
28,608,908
)
(
54,538,354
)
Net
assets
at
the
beginning
of
period
1,092,090,772
1,205,559,039
996,500,824
1,051,039,178
Net
assets
at
the
end
of
period
$
1,030,296,666
$
1,092,090,772
$
967,891,916
$
996,500,824
The
following
data
is
for
a
share outstanding
for
each
fiscal year
end
unless
otherwise
noted:
Investment
Operations
Less
Distributions
Net
Asset
Value,
Beginning
of
Period
Net
Investment
Income
(NII)
(Loss)(a)
Net
Realized/
Unrealized
Gain
(Loss)
Total
From
NII
From
Net
Realized
Gains
Return
of
Capital
Total
Net
Asset
Value,
End
of
Period
Global
Infrastructure
Class
A
6/30/24(d)
$
10.94
$
0.16
$
(
0.04
)
$
0.12
$
—
$
—
$
—
$
—
$
11.06
12/31/23
10.31
0.22
0.66
0.88
(
0.24
)
—
(
0.01
)
(
0.25
)
10.94
12/31/22
11.69
0.13
(
0.88
)
(
0.75
)
(
0.25
)
(
0.38
)
—
(
0.63
)
10.31
12/31/21
10.97
0.19
1.37
1.56
(
0.20
)
(
0.64
)
—
(
0.84
)
11.69
12/31/20
11.45
0.13
(
0.46
)
(
0.33
)
(
0.11
)
(
0.04
)
—
(
0.15
)
10.97
12/31/19
9.48
0.22
2.56
2.78
(
0.20
)
(
0.61
)
—
(
0.81
)
11.45
Class
C
6/30/24(d)
10.75
0.12
(
0.04
)
0.08
—
—
—
—
10.83
12/31/23
10.13
0.13
0.65
0.78
(
0.15
)
—
(
0.01
)
(
0.16
)
10.75
12/31/22
11.50
0.04
(
0.87
)
(
0.83
)
(
0.16
)
(
0.38
)
—
(
0.54
)
10.13
12/31/21
10.87
0.10
1.35
1.45
(
0.18
)
(
0.64
)
—
(
0.82
)
11.50
12/31/20
11.35
0.05
(
0.46
)
(
0.41
)
(
0.03
)
(
0.04
)
—
(
0.07
)
10.87
12/31/19
9.41
0.14
2.52
2.66
(
0.11
)
(
0.61
)
—
(
0.72
)
11.35
Class
R6
6/30/24(d)
10.92
0.18
(
0.04
)
0.14
—
—
—
—
11.06
12/31/23
10.29
0.25
0.66
0.91
(
0.27
)
—
(
0.01
)
(
0.28
)
10.92
12/31/22
11.68
0.16
(
0.89
)
(
0.73
)
(
0.28
)
(
0.38
)
—
(
0.66
)
10.29
12/31/21
10.96
0.23
1.37
1.60
(
0.24
)
(
0.64
)
—
(
0.88
)
11.68
12/31/20
11.42
0.16
(
0.44
)
(
0.28
)
(
0.14
)
(
0.04
)
—
(
0.18
)
10.96
12/31/19
9.47
0.26
2.54
2.80
(
0.24
)
(
0.61
)
—
(
0.85
)
11.42
Class
I
6/30/24(d)
10.90
0.18
(
0.06
)
0.12
—
—
—
—
11.02
12/31/23
10.26
0.24
0.67
0.91
(
0.26
)
—
(
0.01
)
(
0.27
)
10.90
12/31/22
11.65
0.16
(
0.90
)
(
0.74
)
(
0.27
)
(
0.38
)
—
(
0.65
)
10.26
12/31/21
10.93
0.22
1.37
1.59
(
0.23
)
(
0.64
)
—
(
0.87
)
11.65
12/31/20
11.40
0.15
(
0.44
)
(
0.29
)
(
0.14
)
(
0.04
)
—
(
0.18
)
10.93
12/31/19
9.44
0.25
2.54
2.79
(
0.22
)
(
0.61
)
—
(
0.83
)
11.40
(a)
Based
on
average
shares
outstanding.
(b)
Total
returns
are
at
NAV
and
do
not
include
any
sales
charge.
Total
returns
are
not
annualized.
(c)
After
fee
waiver
and/or
expense
reimbursement
from
the
Adviser,
where
applicable.
See
Notes
to
Financial
Statements
for
more
information.
(d)
Unaudited.
(e)
Annualized.
See
Notes
to
Financial
Statements
Ratio/Supplemental
Data
Ratios
to
Average
Net
Assets
Total
Return(b)
Net
Assets,
End
of
Period
(000)
Gross
Expenses
Net
Expenses(c)
NII
(Loss)(c)
Portfolio
Turnover
Rate
1
.10
%
$
43,799
1
.38
%
(e)
1
.24
%
(e)
3
.03
%
(e)
38
%
8
.51
47,992
1
.31
1
.22
2
.05
90
(
6
.28
)
47,824
1
.34
1
.22
1
.18
121
14
.44
52,495
1
.32
1
.21
1
.66
128
(
2
.76
)
44,235
1
.35
1
.22
1
.24
181
29
.27
57,379
1
.36
1
.22
1
.99
144
0
.74
6,873
2
.13
(e)
1
.99
(e)
2
.26
(e)
38
7
.74
7,998
2
.06
1
.97
1
.29
90
(
7
.04
)
10,463
2
.09
1
.97
0
.40
121
13
.58
14,905
2
.07
1
.96
0
.89
128
(
3
.56
)
18,465
2
.10
1
.97
0
.49
181
28
.37
24,640
2
.11
1
.97
1
.26
144
1
.28
70,940
1
.06
(e)
0
.92
(e)
3
.40
(e)
38
8
.87
71,444
0
.99
0
.90
2
.37
90
(
6
.06
)
76,161
1
.02
0
.90
1
.45
121
14
.84
133,575
0
.99
0
.88
2
.00
128
(
2
.39
)
107,342
1
.01
0
.88
1
.57
181
29
.70
60,187
1
.03
0
.89
2
.26
144
1
.19
343,485
1
.13
(e)
0
.99
(e)
3
.32
(e)
38
8
.90
347,121
1
.06
0
.97
2
.30
90
(
6
.15
)
371,573
1
.09
0
.97
1
.40
121
14
.78
471,885
1
.07
0
.96
1
.89
128
(
2
.55
)
439,399
1
.10
0
.97
1
.50
181
29
.69
477,180
1
.11
0
.97
2
.24
144
Financial
Highlights
(continued)
The
following
data
is
for
a
share outstanding
for
each
fiscal year
end
unless
otherwise
noted:
Investment
Operations
Less
Distributions
Net
Asset
Value,
Beginning
of
Period
Net
Investment
Income
(NII)
(Loss)(a)
Net
Realized/
Unrealized
Gain
(Loss)
Total
From
NII
From
Net
Realized
Gains
Return
of
Capital
Total
Net
Asset
Value,
End
of
Period
Global
Real
Estate
Securities
Class
A
6/30/24(d)
$
18.48
$
0.23
$
(
0.90
)
$
(
0.67
)
$
(
0.26
)
$
—
$
—
$
(
0.26
)
$
17.55
12/31/23
17.10
0.46
1.42
1.88
(
0.50
)
—
—
(
0.50
)
18.48
12/31/22
24.08
0.37
(
6.42
)
(
6.05
)
(
0.47
)
(
0.32
)
(
0.14
)
(
0.93
)
17.10
12/31/21
21.25
0.54
5.32
5.86
(
1.08
)
(
1.95
)
—
(
3.03
)
24.08
12/31/20
22.22
0.30
(
0.64
)
(
0.34
)
(
0.45
)
(
0.18
)
—
(
0.63
)
21.25
12/31/19
19.07
0.36
4.84
5.20
(
1.33
)
(
0.72
)
—
(
2.05
)
22.22
Class
C
6/30/24(d)
18.47
0.16
(
0.90
)
(
0.74
)
(
0.19
)
—
—
(
0.19
)
17.54
12/31/23
17.09
0.32
1.43
1.75
(
0.37
)
—
—
(
0.37
)
18.47
12/31/22
24.06
0.21
(
6.40
)
(
6.19
)
(
0.32
)
(
0.32
)
(
0.14
)
(
0.78
)
17.09
12/31/21
21.25
0.35
5.31
5.66
(
0.90
)
(
1.95
)
—
(
2.85
)
24.06
12/31/20
22.21
0.14
(
0.62
)
(
0.48
)
(
0.30
)
(
0.18
)
—
(
0.48
)
21.25
12/31/19
19.06
0.19
4.84
5.03
(
1.16
)
(
0.72
)
—
(
1.88
)
22.21
Class
R6
6/30/24(d)
18.48
0.26
(
0.90
)
(
0.64
)
(
0.29
)
—
—
(
0.29
)
17.55
12/31/23
17.10
0.50
1.44
1.94
(
0.56
)
—
—
(
0.56
)
18.48
12/31/22
24.09
0.37
(
6.36
)
(
5.99
)
(
0.54
)
(
0.32
)
(
0.14
)
(
1.00
)
17.10
12/31/21
21.27
0.56
5.38
5.94
(
1.17
)
(
1.95
)
—
(
3.12
)
24.09
12/31/20
22.23
0.37
(
0.63
)
(
0.26
)
(
0.52
)
(
0.18
)
—
(
0.70
)
21.27
12/31/19
19.07
0.43
4.85
5.28
(
1.40
)
(
0.72
)
—
(
2.12
)
22.23
Class
I
6/30/24(d)
18.47
0.26
(
0.91
)
(
0.65
)
(
0.28
)
—
—
(
0.28
)
17.54
12/31/23
17.09
0.49
1.43
1.92
(
0.54
)
—
—
(
0.54
)
18.47
12/31/22
24.07
0.39
(
6.39
)
(
6.00
)
(
0.52
)
(
0.32
)
(
0.14
)
(
0.98
)
17.09
12/31/21
21.25
0.59
5.32
5.91
(
1.14
)
(
1.95
)
—
(
3.09
)
24.07
12/31/20
22.22
0.34
(
0.63
)
(
0.29
)
(
0.50
)
(
0.18
)
—
(
0.68
)
21.25
12/31/19
19.07
0.47
4.79
5.26
(
1.39
)
(
0.72
)
—
(
2.11
)
22.22
(a)
Based
on
average
shares
outstanding.
(b)
Total
returns
are
at
NAV
and
do
not
include
any
sales
charge.
Total
returns
are
not
annualized.
(c)
After
fee
waiver
and/or
expense
reimbursement
from
the
Adviser,
where
applicable.
See
Notes
to
Financial
Statements
for
more
information.
(d)
Unaudited.
(e)
Annualized.
See
Notes
to
Financial
Statements
Ratio/Supplemental
Data
Ratios
to
Average
Net
Assets
Total
Return(b)
Net
Assets,
End
of
Period
(000)
Gross
Expenses
Net
Expenses(c)
NII
(Loss)(c)
Portfolio
Turnover
Rate
(
3
.64
)
%
$
741
1
.96
%
(e)
1
.30
%
(e)
2
.64
%
(e)
34
%
11
.22
792
1
.83
1
.30
2
.67
81
(
25
.09
)
482
2
.14
1
.30
1
.90
102
28
.21
254
1
.89
1
.29
2
.19
130
(
1
.32
)
37
2
.45
1
.30
1
.48
159
27
.55
35
3
.21
1
.30
1
.60
198
(
4
.00
)
45
2
.71
(e)
2
.05
(e)
1
.81
(e)
34
10
.40
55
2
.58
2
.05
1
.85
81
(
25
.66
)
47
2
.89
2
.05
1
.07
102
27
.16
53
2
.64
2
.04
1
.44
130
(
2
.04
)
27
3
.20
2
.05
0
.71
159
26
.56
33
3
.96
2
.05
0
.86
198
(
3
.48
)
38,049
1
.64
(e)
0
.98
(e)
2
.98
(e)
34
11
.61
39,977
1
.49
0
.96
2
.91
81
(
24
.84
)
37,200
1
.79
0
.95
1
.86
102
28
.57
73,585
1
.54
0
.94
2
.33
130
(
0
.95
)
58,480
2
.15
1
.00
1
.87
159
27
.91
27,709
2
.88
0
.97
1
.93
198
(
3
.53
)
2,486
1
.71
(e)
1
.05
(e)
2
.98
(e)
34
11
.50
2,212
1
.58
1
.05
2
.86
81
(
24
.90
)
1,767
1
.89
1
.05
1
.94
102
28
.48
2,091
1
.64
1
.04
2
.45
130
(
1
.02
)
188
2
.20
1
.05
1
.71
159
27
.80
190
2
.96
1
.05
2
.06
198
Financial
Highlights
(continued)
The
following
data
is
for
a
share outstanding
for
each
fiscal year
end
unless
otherwise
noted:
Investment
Operations
Less
Distributions
Net
Asset
Value,
Beginning
of
Period
Net
Investment
Income
(NII)
(Loss)(a)
Net
Realized/
Unrealized
Gain
(Loss)
Total
From
NII
From
Net
Realized
Gains
Return
of
Capital
Total
Net
Asset
Value,
End
of
Period
Real
Asset
Income
Class
A
6/30/24(d)
$
20.77
$
0.49
$
(0.30)
$
0.19
$
(0.49)
$
—
$
—
$
(0.49)
$
20.47
12/31/23
20.18
0.93
0.66
1.59
(
1.00)
—
—
(1.00)
20.77
12/31/22
24.07
0.91
(3.75)
(2.84)
(0.91)
—
(0.14)
(1.05)
20.18
12/31/21
22.75
1.05
1.54
2.59
(1.27)
—
—
(1.27
)
24.07
12/31/20
24.76
0.90
(1.91)
(1.01)
(1.00)
—
—
(1.00)
22.75
12/31/19
21.46
0.99
3.73
4.72
(1.38)
—
(0.04)
(1.42)
24.76
Class
C
6/30/24(d)
20.79
0.41
(0.30)
0.11
(0.42)
—
—
(0.42)
20.48
12/31/23
20.19
0.77
0.67
1.44
(0.84)
—
—
(0.84)
20.79
12/31/22
24.07
0.74
(3.74)
(3.00)
(0.74)
—
(0.14)
(0.88)
20.19
12/31/21
22.76
0.86
1.55
2.41
(1.10)
—
—
(1.10)
24.07
12/31/20
24.77
0.73
(1.90)
(1.17)
(0.84)
—
—
(0.84)
22.76
12/31/19
21.47
0.81
3.74
4.55
(1.21)
—
(0.04)
(1.25)
24.77
Class
R6
6/30/24(d)
20.91
0.53
(0.31)
0.22
(0.53)
—
—
(0.53)
20.60
12/31/23
20.30
1.01
0.67
1.68
(1.07)
—
—
(1.07)
20.91
12/31/22
24.21
0.98
(3.77)
(2.79)
(0.98)
—
(0.14)
(1.12)
20.30
12/31/21
22.87
1.13
1.56
2.69
(1.35)
—
—
(1.35)
24.21
12/31/20
24.89
1.00
(1.95)
(0.95)
(1.07)
—
—
(1.07)
22.87
12/31/19
21.56
1.10
3.73
4.83
(1.46)
—
(0.04)
(1.50)
24.89
Class
I
6/30/24(d)
20.77
0.51
(
0.29)
0.22
(0.52)
—
—
(0.52)
20.47
12/31/23
20.18
0.98
0.65
1.63
(1.04)
—
—
(1.04)
20.77
12/31/22
24.07
0.97
(3.76)
(2.79)
(
0.96)
—
(0.14)
(1.10)
20.18
12/31/21
22.75
1.10
1.55
2.65
(1.33)
—
—
(1.33)
24.07
12/31/20
24.76
0.94
(1.90)
(0.96)
(1.05)
—
—
(
1.05)
22.75
12/31/19
21.46
1.05
3.73
4.78
(1.44)
—
(0.04)
(1.48)
24.76
(a)
Based
on
average
shares
outstanding.
(b)
Total
returns
are
at
NAV
and
do
not
include
any
sales
charge.
Total
returns
are
not
annualized.
(c)
After
fee
waiver
and/or
expense
reimbursement
from
the
Adviser,
where
applicable.
See
Notes
to
Financial
Statements
for
more
information.
(d)
Unaudited.
(e)
Annualized.
See
Notes
to
Financial
Statements
Ratio/Supplemental
Data
Ratios
to
Average
Net
Assets
Total
Return(b)
Net
Assets,
End
of
Period
(000)
Gross
Expenses
Net
Expenses(c)
NII
(Loss)(c)
Portfolio
Turnover
Rate
1.02
%
$
135,626
1.20
%
(e)
1.16
%
(e)
4.79
%
(e)
37
%
8.13
148,967
1.18
1.16
4.64
60
(12.00)
154,979
1.17
1.16
4.18
73
11.60
192,591
1.14
1.14
4.42
73
(3.71)
173,139
1.16
1.16
4.17
104
22.39
220,665
1.14
1.14
4.16
85
0.64
48,127
1.95
(e)
1.91
(e)
3.98
(e)
37
7.36
61,250
1.93
1.91
3.83
60
(12.64)
91,024
1.92
1.91
3.40
73
10.75
134,834
1.89
1.89
3.62
73
(4.43)
156,391
1.91
1.91
3.41
104
21.50
217,976
1.89
1.89
3.41
85
1.15
184,513
0.85
(e)
0.81
(e)
5.17
(e)
37
8.56
181,053
0.83
0.81
5.01
60
(11.72)
161,185
0.82
0.81
4.45
73
11.99
252,907
0.80
0.80
4.75
73
(3.40)
223,948
0.82
0.81
4.63
104
22.82
80,903
0.80
0.80
4.59
85
1.18
662,031
0.95
(e)
0.91
(e)
5.04
(e)
37
8.38
700,821
0.93
0.91
4.87
60
(11.77)
798,370
0.92
0.91
4.43
73
11.88
976,385
0.89
0.89
4.64
73
(3.47)
1,055,383
0.91
0.91
4.37
104
22.69
1,725,703
0.89
0.89
4.42
85
Financial
Highlights
(continued)
The
following
data
is
for
a
share outstanding
for
each
fiscal year
end
unless
otherwise
noted:
Investment
Operations
Less
Distributions
Net
Asset
Value,
Beginning
of
Period
Net
Investment
Income
(NII)
(Loss)(a)
Net
Realized/
Unrealized
Gain
(Loss)
Total
From
NII
From
Net
Realized
Gains
Total
Net
Asset
Value,
End
of
Period
Real
Estate
Securities
Class
A
6/30/24(d)
$
15.02
$
0.17
$
(0.45)
$
(0.28)
$
(0.21)
$
—
$
(0.21)
$
14.53
12/31/23
13.95
0.34
1.19
1.53
(0.35)
(
0.11)
(0.46)
15.02
12/31/22
22.36
0.25
(5.82)
(5.57)
(0.74)
(2.10)
(2.84)
13.95
12/31/21
18.40
0.23
7.12
7.35
(0.33)
(3.06)
(3.39)
22.36
12/31/20
20.22
0.21
(1.54)
(1.33)
(0.14)
(0.35)
(0.49)
18.40
12/31/19
18.03
0.33
4.16
4.49
(0.33)
(1.97)
(2.30)
20.22
Class
C
6/30/24(d)
14.36
0.10
(0.42)
(0.32)
(0.15)
—
(0.15)
13.89
12/31/23
13.33
0.20
1.17
1.37
(0.23)
(0.11)
(0.34)
14.36
12/31/22
21.51
0.09
(5.58)
(5.49)
(0.59)
(2.10)
(2.69)
13.33
12/31/21
17.80
0.03
6.90
6.93
(0.16)
(3.06)
(3.22)
21.51
12/31/20
19.55
0.06
(1.46)
(1.40)
—
(0.35)
(0.35)
17.80
12/31/19
17.49
0.16
4.03
4.19
(0.16)
(1.97)
(2.13)
19.55
Class
R6
6/30/24(d)
15.65
0.20
(0.47)
(0.27)
(0.24)
—
(0.24)
15.14
12/31/23
14.53
0.41
1.24
1.65
(0.42)
(0.11)
(0.53)
15.65
12/31/22
23.15
0.33
(6.03)
(5.70)
(0.82)
(2.10)
(2.92)
14.53
12/31/21
18.98
0.32
7.34
7.66
(0.43)
(3.06)
(3.49)
23.15
12/31/20
20.85
0.30
(1.59)
(1.29)
(0.23)
(0.35)
(0.58)
18.98
12/31/19
18.54
0.44
4.27
4.71
(0.43)
(1.97)
(2.40)
20.85
Class
I
6/30/24(d)
15.39
0.20
(0.47)
(0.27)
(0.23)
—
(0.23)
14.89
12/31/23
14.29
0.38
1.23
1.61
(0.40)
(0.11)
(0.51)
15.39
12/31/22
22.83
0.28
(5.93)
(5.65)
(0.79)
(2.10)
(2.89)
14.29
12/31/21
18.74
0.27
7.27
7.54
(0.39)
(3.06)
(3.45)
22.83
12/31/20
20.59
0.27
(1.58)
(1.31)
(0.19)
(0.35)
(0.54)
18.74
12/31/19
18.34
0.39
4.22
4.61
(0.39)
(1.97)
(2.36)
20.59
(a)
Based
on
average
shares
outstanding.
(b)
Total
returns
are
at
NAV
and
do
not
include
any
sales
charge.
Total
returns
are
not
annualized.
(c)
After
fee
waiver
and/or
expense
reimbursement
from
the
Adviser,
where
applicable.
See
Notes
to
Financial
Statements
for
more
information.
(d)
Unaudited.
(e)
Annualized.
(f)
Fund
did
not
have
waiver/reimbursement
for
periods
prior
to
fiscal
year
ended
December
31,
2021.
See
Notes
to
Financial
Statements
Ratio/Supplemental
Data
Ratios
to
Average
Net
Assets
Total
Return(b)
Net
Assets,
End
of
Period
(000)
Gross
Expenses
Net
Expenses(c)
NII
(Loss)(c)
Portfolio
Turnover
Rate
(1.89)
%
$
112,713
1.33
%
(e)
1.21
%
(e)
2.33
%
(e)
32
%
11.22
124,579
1.31
1.22
2.39
72
(24.87)
131,155
1.30
1.22
1.34
78
40.98
207,384
1.28
1.24
1.05
101
(6.37)
176,739
1.30
1.30
(f)
1.20
(f)
135
25
.24
249,172
1.30
1.30
(f)
1.56
(f)
109
(2.26)
2,612
2.08
(e)
1.96
(e)
1.44
(e)
32
10.46
3,713
2.06
1.97
1.47
72
(25.45)
6,377
2.05
1.97
0.56
78
39.85
12,195
2.03
2.00
0.16
101
(7.03)
14,874
2.05
2.05
(f)
0.32
(f)
135
24.28
37,352
2.06
2.06
(f)
0.79
(f)
109
(1.71)
263,111
0.92
(e)
0.80
(e)
2.68
(e)
32
11.66
322,442
0.93
0.84
2
.80
72
(24.59)
313,047
0.93
0.85
1.70
78
41.48
556,126
0.89
0.85
1.46
101
(5.95)
437,016
0.90
0.90
(f)
1.66
(f)
135
25.74
479,973
0.88
0.88
(f)
2.03
(f)
109
(1.76)
589,456
1.08
(e)
0.96
(e)
2.68
(e)
32
11.51
545,767
1.06
0.97
2.62
72
(24.70)
600,459
1.05
0.97
1.48
78
41.32
1,476,888
1.03
0.99
1.23
101
(6.12)
1,604,544
1.05
1.05
(f)
1.46
(f)
135
25.56
2,148,012
1.06
1.06
(f)
1.80
(f)
109
Notes
to
Financial
Statements
(Unaudited)
1.
General
Information
Trust
and
Fund
Information:
Nuveen
Investment
Funds,
Inc.
and
Nuveen
Investment
Trust
V
(each
a
“Trust”
and
collectively,
the
“Trusts”),
are
open-
end
management
investment
companies
registered
under
the
Investment
Company
Act
of
1940
(the
“1940
Act”)
as
amended.
Nuveen
Investment
Funds,
Inc.
is
comprised
of
Nuveen
Global
Infrastructure
Fund
(“Global
Infrastructure”),
Nuveen
Real
Asset
Income
Fund
(“Real
Asset
Income”)
and
Nuveen
Real
Estate
Securities
Fund
(“Real
Estate
Securities”),
among
others,
and
Nuveen
Investment
Trust
V
is
comprised
of
Nuveen
Global
Real
Estate
Securities
Fund
(“Global
Real
Estate
Securities”),
among
others,
(each
a
“Fund”
and
collectively,
the
“Funds”).
Nuveen
Investment
Funds,
Inc.
was
incorporated
in
the
State
of
Maryland
on
August
20,
1987
and
Nuveen
Investment
Trust
V
was
organized
as
a
Massachusetts
business
trust
on
September
27,
2006.
Current
Fiscal
Period:
The
end
of
the
reporting
period
for
the
Funds
is
June
30,
2024,
and
the
period
covered
by
these
Notes
to
Financial
Statements
is
the
six
months
ended
June
30,
2024
(the
"current
fiscal
period").
Investment
Adviser
and
Sub-Adviser:
The
Funds’
investment
adviser
is
Nuveen
Fund
Advisors,
LLC
(the
“Adviser”),
a
subsidiary
of
Nuveen,
LLC
(“Nuveen”).
Nuveen
is
the
investment
management
arm
of
Teachers
Insurance
and
Annuity
Association
of
America
(TIAA).
The
Adviser
has
overall
responsibility
for
management
of
the
Funds,
oversees
the
management
of
the
Funds’
portfolios,
manages
the
Funds’
business
affairs
and
provides
certain
clerical,
bookkeeping
and
other
administrative
services,
and,
if
necessary,
asset
allocation
decisions.
The
Adviser
has
entered
into
sub-
advisory
agreements
with
Nuveen
Asset
Management,
LLC,
(the
“Sub-Adviser”),
a
subsidiary
of
the
Adviser,
under
which
the
Sub-Adviser
manages
the
investment
portfolios
of
the
Funds.
Share
Classes
and
Sales
Charges:
Class
A
Shares
are
generally
sold
with
an
up-front
sales
charge.
Class
A
Share
purchases
of
$1
million
or
more
are
sold
at
net
asset
value
(“NAV”)
without
an
up-front
sales
charge
but
may
be
subject
to
a
contingent
deferred
sales
charge
(“CDSC”)
of
1%
if
redeemed
within
eighteen
months
of
purchase.
Class
C
Shares
are
sold
without
an
up-front
sales
charge
but
are
subject
to
a
CDSC
of
1%
if
redeemed
within
twelve
months
of
purchase.
Class
C
Shares
automatically
convert
to
Class
A
Shares
eight
years
after
purchase.
Class
R6
Shares
and
Class
I
Shares
are
sold
without
an
up-front
sales
charge.
2.
Significant
Accounting
Policies
The
accompanying
financial
statements
were
prepared
in
accordance
with
accounting
principles
generally
accepted
in
the
United
States
of
America
(“U.S.
GAAP”),
which
may
require
the
use
of
estimates
made
by
management
and
the
evaluation
of
subsequent
events.
Actual
results
may
differ
from
those
estimates.
Each
Fund
is
an
investment
company
and
follows
accounting
guidance
in
the
Financial
Accounting
Standards
Board
(“FASB”)
Accounting
Standards
Codification
946,
Financial
Services
—
Investment
Companies.
The
NAV
for
financial
reporting
purposes
may
differ
from
the
NAV
for
processing
security
and shareholder
transactions.
The
NAV
for
financial
reporting
purposes
includes
security
and
common
share
transactions
through
the
date
of
the
report.
Total
return
is
computed
based
on
the
NAV
used
for
processing
security
and
common
share
transactions.
The
following
is
a
summary
of
the
significant
accounting
policies
consistently
followed
by
the
Funds.
Compensation:
Neither
Trust
pays
compensation
directly
to
those
of its officers,
all
of
whom
receive
remuneration
for
their
services
to
each
Trust
from
the
Adviser
or
its
affiliates.
The
Funds’
Board
of
Directors/Trustees
(the
’’Board’’)
has
adopted
a
deferred
compensation
plan
for
independent
directors/trustees
that
enables
directors/trustees
to
elect
to
defer
receipt
of
all
or
a
portion
of
the
annual
compensation
they
are
entitled
to
receive
from
certain
Nuveen-advised
funds.
Under
the
plan,
deferred
amounts
are
treated
as
though
equal
dollar
amounts
had
been
invested
in
shares
of
select
Nuveen-advised
funds.
Distributions
to
Shareholders:
Distributions
to
shareholders
are
recorded
on
the
ex-dividend
date.
The
amount,
character
and
timing
of
distributions
are
determined
in
accordance
with
federal
income
tax
regulations,
which
may
differ
from
U.S.
GAAP.
The
tax
character
of
Fund
distributions
for
a
fiscal
year
is
dependent
upon
the
amount
and
tax
character
of
distributions
received
from
securities
held
in
the
Funds’
portfolios.
Distributions
received
from
certain
securities
in
which
the
Funds
invest,
most
notably
real
estate
investment
trust
(“REIT”)
securities,
may
be
characterized
for
tax
purposes
as
ordinary
income,
long-term
capital
gain
and/or
a
return
of
capital.
The
issuer
of
a
security
reports
the
tax
character
of
its
distributions
only
once
per
year,
generally
during
the
first
two
months
of
the
calendar
year
for
the
previous
year.
The
distribution
is
included
in
the
Funds’
ordinary
income
until
such
time
the
Fund
is
notified
by
the
issuer
of
the
actual
tax
character.
For
the
current
fiscal
period,
dividend
income,
net
realized
gain
(loss)
and
unrealized
appreciation
(depreciation)
recognized
on
the
Statement
of
Operations
reflect
the
amounts
of
ordinary
income,
capital
gain,
and/or
return
of
capital
as
reported
by
the
issuers
of
such
securities
as
of
the
prior
calendar
year
end.
Foreign
Currency
Transactions
and
Translation:
The
books
and
records
of
the
Funds
are
maintained
in
U.S.
dollars.
Assets,
including
investments,
and
liabilities
denominated
in
foreign
currencies
are
translated
into
U.S.
dollars
at
the
end
of
each
day.
Purchases
and
sales
of
securities,
income
and
expenses
are
translated
into
U.S.
dollars
at
the
prevailing
exchange
rate
on
the
respective
dates
of
the
transactions.
Net
realized
foreign
currency
gains
and
losses
resulting
from
changes
in
exchange
rates
associated
with
(i)
foreign
currency,
(ii)
investments
and
(iii)
derivatives
include
foreign
currency
gains
and
losses
between
trade
date
and
settlement
date
of
the
transactions,
foreign
currency
transactions,
and
the
difference
between
the
amounts
of
interest
and
dividends
recorded
on
the
books
of
the
Funds
and
the
amounts
actually
received
are
recognized
as
a
component
of
“Net
realized
gain
(loss)
from
foreign
currency
transactions”
on
the
Statement
of
Operations,
when
applicable.
Notes
to
Financial
Statements
(Unaudited)
(continued)
The
unrealized
gains
and
losses
resulting
from
changes
in
foreign
currency
exchange
rates
and
changes
in
foreign
exchange
rates
associated
with
(i)
investments
and
(ii)
other
assets
and
liabilities
are
recognized
as
a
component
of
“Change
in
unrealized
appreciation
(depreciation)
on foreign
currency
translations”
on
the
Statement
of
Operations,
when
applicable.
The
unrealized
gains
and
losses
resulting
from
changes
in
foreign
exchange
rates
associated
with
investments
in
derivatives
are
recognized
as
a
component
of
the
respective
derivative’s
related
“Change
in
unrealized
appreciation
(depreciation)”
on
the
Statement
of
Operations,
when
applicable.
As
of
the
end
of
the
reporting
period,
the
following
Funds'
investments
in
non-U.S.
securities
were
as
follows:
Foreign
Taxes:
The
Funds
may
be
subject
to
foreign
taxes
on
income,
gains
on
investments
or
foreign
currency
repatriation,
a
portion
of
which
may
be
recoverable.
The
Funds
will
accrue
such
taxes
and
recoveries
as
applicable,
based
upon
the
current
interpretation
of
tax
rules
and
regulations
that
exist
in
the
markets
in
which
the
Funds
invest.
Indemnifications:
Under each
Trust’s
organizational
documents,
its
officers
and
directors/trustees
are
indemnified
against
certain
liabilities
arising
out
of
the
performance
of
their
duties
to each
Trust.
In
addition,
in
the
normal
course
of
business, each
Trust
enters
into
contracts
that
provide
general
indemnifications
to
other
parties. Each
Trust’s
maximum
exposure
under
these
arrangements
is
unknown
as
this
would
involve
future
claims
that
may
be
made
against each
Trust
that
have
not
yet
occurred.
However, each
Trust
has
not
had
prior
claims
or
losses
pursuant
to
these
contracts
and
expects
the
risk
of
loss
to
be
remote.
Global
Infrastructure
Value
%
of
Net
Assets
Country:
Canada
$
33,331,951
7.2
%
Spain
31,772,391
6.8
France
25,613,983
5.5
Australia
24,538,958
5.3
Italy
18,352,694
4.0
Japan
15,883,436
3.4
United
Kingdom
15,329,764
3.3
New
Zealand
12,587,442
2.7
Mexico
11,227,966
2.4
Other
31,731,981
6.8
Total
non-U.S.
Securities
$220,370,566
47.4%
Global
Real
Estate
Securities
Value
%
of
Net
Assets
Country:
Japan
$
3,766,876
9.1
%
Australia
1,854,410
4.5
Canada
1,778,781
4.3
United
Kingdom
1,602,184
3.9
Germany
1,127,105
2.7
Singapore
963,020
2.3
Hong
Kong
916,951
2.2
Belgium
816,285
2.0
France
478,922
1.2
Other
1,501,238
3.7
Total
non-U.S.
Securities
$14,805,772
35.9%
Real
Asset
Income
Value
%
of
Net
Assets
Country:
Canada
$
126,043,275
12.2
%
United
Kingdom
38,975,951
3.8
Australia
32,864,044
3.2
Singapore
22,747,829
2.2
Italy
22,075,797
2.1
France
16,159,517
1.6
Hong
Kong
16,009,514
1.6
Japan
12,673,966
1.2
Spain
12,587,573
1.2
Other
40,545,215
4.0
Total
non-U.S.
Securities
$340,682,681
33.1%
Investments
and
Investment
Income:
Securities
transactions
are
accounted
for
as
of
the
trade
date
for
financial
reporting
purposes.
Trade
date
for
senior
and
subordinated
loans
purchased
in
the
“primary
market”
is
considered
the
date
on
which
the
loan
allocations
are
determined.
Trade
date
for
senior
and
subordinated
loans
purchased
in
the
“secondary
market”
is
the
date
on
which
the
transaction
is
entered
into.
Realized
gains
and
losses
on
securities
transactions
are
based
upon
the
specific
identification
method.
Dividend
income
is
recorded
on
the
ex-dividend
date
or,
for
foreign
securities,
when
information
is
available.
Non-cash
dividends
received
in
the
form
of
stock,
if
any,
are
recognized
on
the
ex-dividend
date
and
recorded
at
fair
value.
Interest
income,
which
is
recorded
on
an
accrual
basis
and
includes
accretion
of
discounts
and
amortization
of
premiums
for
financial
reporting
purposes.
Interest
income
also
reflects
payment-in-kind
(“PIK”)
interest,
paydown
gains
and
losses
and
fee
income,
if
any.
PIK
interest
represents
income
received
in
the
form
of
securities
in
lieu
of
cash.
Fee
income
consists
primarily
of
amendment
fees,
when
applicable.
Amendment
fees
are
earned
as
compensation
for
evaluating
and
accepting
changes
to
an
original
senior
loan
agreement
and
are
recognized
when
received.
Securities
lending
income
is
comprised
of
fees
earned
from
borrowers
and
income
earned
on
cash
collateral
investments.
Multiclass
Operations
and
Allocations:
Income
and
expenses
of
Global
Infrastructure,
Global
Real
Estate
Securities
and
Real
Estate
Securities
that
are
not
directly
attributable
to
a
specific
class
of
shares
are
prorated
among
the
classes
of
each
Fund
based
on
the
relative
net
assets
of
each
class.
Income
and
expenses
of
Real
Asset
Income
that
are
not
directly
attributable
to
a
specific
class
of
shares
are
prorated
among
the
classes
based
on
the
relative
settled
shares
of
each
class.
Expenses
directly
attributable
to
a
class
of
shares
are
recorded
to
the
specific
class.
12b-1
distribution
and
service
fees
are
allocated
on
a
class-specific
basis.
Sub-transfer
agent
fees
and
similar
fees,
which
are
recognized
as
a
component
of
“Shareholder
servicing
agent
fees”
on
the
Statement
of
Operations,
are
not
charged
to
Class
R6
Shares
and
are
prorated
among
the
other
classes
based
on
their
relative
net
assets
for
Global
Infrastructure,
Global
Real
Estate
Securities
and
Real
Estate
Securities
and
relative
settled
shares
for
Real
Asset
Income.
Realized
and
unrealized
capital
gains
and
losses
of
the
Funds
are
prorated
among
the
classes
based
on
the
relative
net
assets
of
each
class.
Netting
Agreements:
In
the
ordinary
course
of
business,
the
Funds
may
enter
into
transactions
subject
to
enforceable
master
repurchase
agreements,
International
Swaps
and
Derivatives
Association,
Inc.
(ISDA)
master
agreements
or
other
similar
arrangements
(“netting
agreements”).
Generally,
the
right
to
offset
in
netting
agreements
allows
each
Fund
to
offset
certain
securities
and
derivatives
with
a
specific
counterparty,
when
applicable,
as
well
as
any
collateral
received
or
delivered
to
that
counterparty
based
on
the
terms
of
the
agreements.
Generally,
each
Fund
manages
its
cash
collateral
and
securities
collateral
on
a
counterparty
basis.
With
respect
to
certain
counterparties,
in
accordance
with
the
terms
of
the
netting
agreements,
collateral
posted
to
the
Funds
is
held
in
a
segregated
account
by
the
Funds’
custodian
and/or
with
respect
to
those
amounts
which
can
be
sold
or
repledged,
are
presented
in
the
Funds’
Portfolio
of
Investments
or
Statement
of
Assets
and
Liabilities.
The
Funds’
investments
subject
to
netting
agreements
as
of
the
end
of
the
reporting
period,
if
any,
are
further
described
later
in
these
Notes
to
Financial
Statements.
3.
Investment
Valuation
and
Fair
Value
Measurements
The
Funds’
investments
in
securities
are
recorded
at
their
estimated
fair
value
utilizing
valuation
methods
approved
by
the
Adviser,
subject
to
oversight
of
the Board.
Fair
value
is
defined
as
the
price
that
would
be
received
upon
selling
an
investment
or
transferring
a
liability
in
an
orderly
transaction
to
an
independent
buyer
in
the
principal
or
most
advantageous
market
for
the
investment.
U.S.
GAAP
establishes
the
three-tier
hierarchy
which
is
used
to
maximize
the
use
of
observable
market
data
and
minimize
the
use
of
unobservable
inputs
and
to
establish
classification
of
fair
value
measurements
for
disclosure
purposes.
Observable
inputs
reflect
the
assumptions
market
participants
would
use
in
pricing
the
asset
or
liability.
Observable
inputs
are
based
on
market
data
obtained
from
sources
independent
of
the
reporting
entity.
Unobservable
inputs
reflect
management’s
assumptions
about
the
assumptions
market
participants
would
use
in
pricing
the
asset
or
liability.
Unobservable
inputs
are
based
on
the
best
information
available
in
the
circumstances.
The
following
is
a
summary
of
the
three-tiered
hierarchy
of
valuation
input
levels.
Level
1
–
Inputs
are
unadjusted
and
prices
are
determined
using
quoted
prices
in
active
markets
for
identical
securities.
Level
2
–
Prices
are
determined
using
other
significant
observable
inputs
(including
quoted
prices
for
similar
securities,
interest
rates,
credit
spreads,
etc.).
Level
3
–
Prices
are
determined
using
significant
unobservable
inputs
(including
management’s
assumptions
in
determining
the
fair
value
of
investments).
A
description
of
the
valuation
techniques
applied
to
the
Funds’
major
classifications
of
assets
and
liabilities
measured
at
fair
value
follows:
Equity
securities
and
exchange-traded
funds
listed
or
traded
on
a
national
market
or
exchange
are
valued
based
on
their
last
reported sales
price
or
official
closing
price of such
market
or
exchange
on
the
valuation
date.
Foreign
equity
securities
and
registered
investment
companies
that
trade
on
a
foreign
exchange
are
valued
at
the
last
reported sales
price
or
official
closing
price
on
the
principal
exchange
where
traded,
and
converted
to
U.S.
dollars
at
the
prevailing
rates
of
exchange
on
the valuation
date.
For
events affecting
the value
of
foreign
securities
between
the
time
when
the
exchange
on
which
they
are
traded
closes
and
the
time
when
the
Funds'
net
assets
are
calculated,
such
securities
will
be
valued
at
fair
value
in
accordance
with
procedures
adopted
by
the
Adviser,
subject
to
the
oversight
of
the
Board. To
the
extent
these
securities
are
actively
traded
and
no
valuation
adjustments
are
applied,
they
are
generally
classified
as
Level
1. When
valuation
adjustments
are
applied
to
the
most
recent
last
sales
price
or
official
closing
price, these
securities
are
generally
classified
as
Level
2.
Prices
of
fixed-income
securities
are
generally
provided
by
pricing
services
approved
by
the
Adviser,
which
is
subject
to
review
by
the
Adviser
and
oversight
of
the
Board. Pricing
services
establish
a
security’s
fair
value
using
methods
that
may
include
consideration
of
the
following:
yields
or
prices
of
investments
of
comparable
quality,
type
of
issue,
coupon,
maturity
and
rating,
market
quotes
or
indications
of
value
from
security
dealers,
Notes
to
Financial
Statements
(Unaudited)
(continued)
evaluations
of
anticipated
cash
flows
or
collateral,
general
market
conditions
and
other
information
and
analysis,
including
the
obligor’s
credit
characteristics
considered
relevant.
In
pricing
certain
securities,
particularly
less
liquid
and
lower
quality
securities,
pricing
services
may
consider
information
about
a
security,
its
issuer
or
market
activity
provided
by
the
Adviser.
These
securities
are
generally
classified
as
Level
2.
Prices
of
certain
American
Depositary
Receipts
(“ADR”)
held
by
the
Funds
that
trade
in
the
United
States
are
valued
based
on
the
last
traded
price,
official
closing
price,
or
an
evaluated
price
provided
by
the
pricing
services and
are
generally
classified
as
Level
1
or
2.
Investments
in
investment
companies
are
valued
at
their
respective
NAVs
or
share
price on
the
valuation
date
and
are
generally
classified
as
Level
1.
Repurchase
agreements
are
valued
at
contract
amount
plus
accrued
interest,
which
approximates
market
value.
These
securities
are
generally
classified
as
Level
2.
Futures
contracts
are
valued
using
the
closing
settlement
price
or,
in
the
absence
of
such
a
price,
the
last
traded
price
and
are
generally
classified
as
Level
1.
For
any
portfolio
security
or
derivative
for
which
market
quotations
are
not
readily
available
or
for
which
the
Adviser
deems
the
valuations
derived
using
the
valuation
procedures
described
above
not
to
reflect
fair
value,
the
Adviser
will
determine
a
fair
value
in
good
faith
using
alternative
procedures
approved
by
the
Adviser,
subject
to
the
oversight
of
the
Board.
As
a
general
principle,
the
fair
value
of
a
security
is
the
amount
that
the
owner
might
reasonably
expect
to
receive
for
it
in
a
current
sale.
A
variety
of
factors
may
be
considered
in
determining
the
fair
value
of
such
securities,
which
may
include
consideration
of
the
following:
yields
or
prices
of
investments
of
comparable
quality,
type
of
issue,
coupon,
maturity
and
rating,
market
quotes
or
indications
of
value
from
security
dealers,
evaluations
of
anticipated
cash
flows
or
collateral,
general
market
conditions
and
other
information
and
analysis,
including
the
obligor’s
credit
characteristics
considered
relevant.
To
the
extent
the
inputs
are
observable
and
timely,
the
values
would
be
classified
as
Level
2;
otherwise
they
would
be
classified
as
Level
3.
The
following
table
summarizes
the
market
value
of
the
Funds’
investments
as
of
the
end
of
the
reporting
period,
based
on
the
inputs
used
to
value
them:
Global
Infrastructure
Level
1
Level
2
Level
3
Total
Long-Term
Investments:
Common
Stocks
$
255,526,592
$
175,956,088
$
–
$
431,482,680
Real
Estate
Investment
Trust
Common
Stocks
21,318,667
746,229
–
22,064,896
Investment
Companies
–
1,596,038
–
1,596,038
Short-Term
Investments:
Repurchase
Agreements
–
7,095,416
–
7,095,416
Total
$
276,845,259
$
185,393,771
$
–
$
462,239,030
Global
Real
Estate
Securities
Level
1
Level
2
Level
3
Total
Long-Term
Investments:
Real
Estate
Investment
Trust
Common
Stocks
$
27,418,424
$
8,258,417
$
165
$
35,677,006
Common
Stocks
334,482
4,464,359
–
4,798,841
Short-Term
Investments:
Repurchase
Agreements
–
950,000
–
950,000
Total
$
27,752,906
$
13,672,776
$
165
$
41,425,847
Real
Asset
Income
Level
1
Level
2
Level
3
Total
Long-Term
Investments:
Corporate
Bonds
$
–
$
267,106,838
$
–
$
267,106,838
Common
Stocks
159,025,733
78,334,636
–
237,360,369
Real
Estate
Investment
Trust
Common
Stocks
139,585,769
76,867,955
5,019
216,458,743
$25
Par
(or
similar)
Retail
Preferred
134,927,973
–
–
134,927,973
$1,000
Par
(or
similar)
Institutional
Preferred
–
129,117,809
–
129,117,809
Convertible
Preferred
Securities
15,230,090
3,293,785
–
18,523,875
Investment
Companies
–
5,205,567
–
5,205,567
Mortgage-Backed
Securities
–
1,278,493
–
1,278,493
Variable
Rate
Senior
Loan
Interests
–
141,087
–
141,087
Investments
Purchased
with
Collateral
from
Securities
Lending
6,183,672
–
–
6,183,672
Short-Term
Investments:
Repurchase
Agreements
–
11,036,855
–
11,036,855
Investments
in
Derivatives:
Futures
Contracts*
(623,012)
–
–
(623,012)
Total
$
454,330,225
$
572,383,025
$
5,019
$
1,026,718,269
4.
Portfolio
Securities
Repurchase
Agreements:
In
connection
with
transactions
in
repurchase
agreements,
it
is
each
Fund's
policy
that
its
custodian
take
possession
of
the
underlying
collateral
securities,
the
fair
value
of
which
exceeds
the
principal
amount
of
the
repurchase
transaction,
including
accrued
interest,
at
all
times.
If
the
counterparty
defaults,
and
the
fair
value
of
the
collateral
declines,
realization
of
the
collateral
may
be
delayed
or
limited.
The
following
table
presents
the
repurchase
agreements
for
the
Funds
that
are
subject
to
netting
agreements
as
of
the
end
of
the
reporting
period,
and
the
collateral
delivered
related
to
those
repurchase
agreements.
Securities
Lending:
Each
Fund
may
lend
securities
representing
up
to
one-third
of
the
value
of
its
total
assets
to
broker-dealers,
banks,
and
other
institutions
in
order
to
generate
additional
income.
When
loaning
securities, a
Fund
retains
the
benefits
of
owning
the
securities,
including
the
economic
equivalent
of
dividends
or
interest
generated
by
the
security.
The
loans
are
continuous,
can
be
recalled
at
any
time,
and
have
no
set
maturity.
The
Funds’
custodian,
State
Street
Bank
and
Trust
Company,
serves
as
the
securities
lending
agent
(the
“Agent”).
When
a
Fund
loans
its
portfolio
securities,
it
will
receive,
at
the
inception
of
each
loan,
cash
collateral
equal
to
an
amount
not
less
than
100%
of
the
market
value
of
the
loaned
securities.
The
actual
percentage
of
the
cash
collateral
will
vary
depending
upon
the
asset
type
of
the
loaned
securities.
Collateral
for
the
loaned
securities
is
invested
in
a
government
money
market
vehicle
maintained
by
the
Agent,
which
is
subject
to
the
requirements
of
Rule
2a-7
under
the
1940
Act.
The
value
of
the
loaned
securities
and
the
liability
to
return
the
cash
collateral
received
are
recognized
on
the
Statement
of
Assets
and
Liabilities.
If
the
market
value
of
the
loaned
securities
increases,
the
borrower
must
furnish
additional
collateral
to
the
Fund,
which
is
also
recognized
on
the
Statement
of
Assets
and
Liabilities.
Securities
out
on
loan
are
subject
to
termination
at
any
time
at
the
option
of
the
borrower
or
the
Fund.
Upon
termination,
the
borrower
is
required
to
return
to
the
Fund
securities
identical
to
the
securities
loaned.
During
the
term
of
the
loan,
the
Fund
bears
the
market
risk
with
respect
to
the
investment
of
collateral
and
the
risk
that
the
Agent
may
default
on
its
contractual
obligations
to
the
Fund.
The
Agent
bears
the
risk
that
the
borrower
may
default
on
its
obligation
to
return
the
loaned
securities
as
the
Agent
is
contractually
obligated
to
indemnify
the
Fund
if
at
the
time
of
a
default
by
a
borrower
some
or
all
of
the
loan
securities
have
not
been
returned.
Securities
lending
income
recognized
by
a
Fund
consists
of
earnings
on
invested
collateral
and
lending
fees,
net
of
any
rebates
to
the
borrower
and
compensation
to
the
Agent.
Such
income
is
recognized
on
the
Statement
of
Operations.
As
of
the
end
of
the
current
reporting
period,
the
total
value
of
the
loaned
securities
and
the
total
value
of
collateral
received
were
as
follows:
Purchases
and
Sales:
Long-term
purchases
and
sales
during
the
current fiscal
period
were
as
follows:
Real
Estate
Securities
Level
1
Level
2
Level
3
Total
Long-Term
Investments:
Real
Estate
Investment
Trust
Common
Stocks
$
944,394,061
$
–
$
–
$
944,394,061
Short-Term
Investments:
Repurchase
Agreements
–
21,059,924
–
21,059,924
Total
$
944,394,061
$
21,059,924
$
–
$
965,453,985
*
Represents
net
unrealized
appreciation
(depreciation)
as
reported
in
Fund's
Portfolio
of
Investments.
Fund
Counterparty
Short-term
Investments,
at
Value
Collateral
Pledged
(From)
Counterparty
Global
Infrastructure
Fixed
Income
Clearing
Corporation
$
7,095,416
$(7,237,371)
Global
Real
Estate
Securities
Fixed
Income
Clearing
Corporation
950,000
(969,028)
Real
Asset
Income
Fixed
Income
Clearing
Corporation
11,036,855
(11,257,740)
Real
Estate
Securities
Fixed
Income
Clearing
Corporation
21,059,924
(21,481,280)
Fund
Asset
Class
out
on
Loan
Long-Term
Investments,
at
Value
Total
Collateral
Received
Real
Asset
Income
Corporate
Bonds
$4,576,390
$4,815,830
$1,000
Par
(or
similar)
Institutional
Preferred
1,251,977
1,278,518
$25
Par
(or
similar)
Retail
Preferred
86,752
89,325
$5,915,119
$6,183,672
Notes
to
Financial
Statements
(Unaudited)
(continued)
The
Funds
may
purchase
securities
on
a
when-issued
or
delayed-delivery
basis.
Securities
purchased
on
a
when-issued
or
delayed-delivery
basis
may
have
extended
settlement
periods;
interest
income
is
not
accrued
until
settlement
date.
Any
securities
so
purchased
are
subject
to
market
fluctuation
during
this
period. If
a
Fund
has
outstanding
when-issued/delayed-delivery
purchases
commitments
as
of
the
end
of
the
reporting
period,
such
amounts
are
recognized
on
the
Statement
of
Assets
and
Liabilities.
5.
Derivative
Investments
Each
Fund
is
authorized
to
invest
in
certain
derivative
instruments.
As
defined
by
U.S.
GAAP,
a
derivative
is
a
financial
instrument
whose
value
is
derived
from
an
underlying
security
price,
foreign
exchange
rate,
interest
rate,
index
of
prices
or
rates,
or
other
variables.
Investments
in
derivatives
as
of
the
end
of
and/or
during
the
current
fiscal
period,
if
any,
are
included
within
the
Statement
of
Assets
and
Liabilities
and
the
Statement
of
Operations,
respectively.
Futures
Contracts:
During
the
current
fiscal
period,
Real
Asset
Income
used
interest
rate
futures
to
partially
hedge
the
portfolio
against
movements
in
interest
rates.
A
futures
contract
is
an
agreement
between
two
parties
to
buy
and
sell
a
financial
instrument
for
a
set
price
on
a
future
date.
Upon
execution
of
a
futures
contract,
the
Fund
is
obligated
to
deposit
cash
or
eligible
securities,
also
known
as
“initial
margin,”
into
an
account
at
its
clearing
broker
equal
to
a
specified
percentage
of
the
contract
amount.
Securities
deposited
for
initial
margin,
if
any,
are
identified
in
the
Portfolio
of
Investments
and
cash
deposited
for
initial
margin,
if
any,
is
reflected
on
the
Statement
of
Assets
and
Liabilities.
During
the
period
the
futures
contract
is
open,
changes
in
the
market
value
of
the
contract
are
recognized
as
an
unrealized
gain
or
loss
by
“marking-
to-market”
on
a
daily
basis.
The
Fund
and
the
clearing
broker
are
obligated
to
settle
monies
on
a
daily
basis
representing
the
changes
in
the
value
of
the
contracts.
These
daily
cash
settlements
are
known
as
“variation
margin”
and
is
recognized
on
the
Statement
of
Assets
and
Liabilities
as
a
receivable
or
payable
for
variation
margin
on
futures
contracts.
When
the
contract
is
closed
or
expired,
the
Fund
records
a
realized
gain
or
loss
equal
to
the
difference
between
the
value
of
the
contract
on
the
closing
date
and
value
of
the
contract
when
originally
entered
into.
The
net
realized
gain
or
loss
and
the
change
in
unrealized
appreciation
(depreciation)
on
futures
contracts
held
during
the
period
is
included
on
the
Statement
of
Operations.
Risks
of
investments
in
futures
contracts
include
the
possible
adverse
movement
in
the
price
of
the
securities
or
indices
underlying
the
contracts,
the
possibility
that
there
may
not
be
a
liquid
secondary
market
for
the
contracts
and/or
that
a
change
in
the
value
of
the
contract
may
not
correlate
with
a
change
in
the
value
of
the
underlying
securities
or
indices.
The
average
notional
amount
of
futures
contracts
outstanding
during
the
current
fiscal
period
was
as
follows:
As
of the
end
of
the
reporting
period,
the
following
Funds
have
invested
in
derivative
contracts
which
are
reflected
in
the
Statement
of
Assets
and
Liabilities
as
follows:
During
the
current
fiscal
period,
the
effect
of
derivative
contracts
on
the
Fund's
Statement
of
Operations
was
as
follows:
Fund
Non-U.S.
Government
Purchases
Non-U.S.
Government
Sales
and
Maturities
Global
Infrastructure
$
174,456,390
$
178,097,892
Global
Real
Estate
Securities
14,296,927
13,829,131
Real
Asset
Income
380,504,288
410,157,854
Real
Estate
Securities
297,883,058
297,143,430
Fund
Average
Notional
Amount
of
Futures
Contracts
Outstanding
*
Real
Asset
Income
$
54,391,523
*
The
average
notional
amount
is
calculated
based
on
the
absolute
aggregate
notional
amount
of
contracts
outstanding
at
the
beginning
of
the
current
fiscal
period
and
at
the
end
of
each
fiscal
quarter
within
the
current
fiscal
period.
Asset
Derivatives
Liability
Derivatives
Derivative
Instrument
Risk
Exposure
Location
Value
Location
Value
Real
Asset
Income
Futures
Contracts
Interest
rate
-
$
–
Unrealized
depreciation
on
futures
contracts
*
$
(623,012)
1
1
1
1
1
1
1
1
*
The
fair
value
presented
includes
cumulative
gain
(loss)
on
open
futures
contracts;
however,
the
value
reflected
in
the
accompanying
Statements
of
Assets
and
Liabilities
is
only
the
receivable
or
payable
for
variation
margin
on
open
futures
contacts.
Market
and
Counterparty
Credit
Risk:
In
the
normal
course
of
business
each
Fund
may
invest
in
financial
instruments
and
enter
into
financial
transactions
where
risk
of
potential
loss
exists
due
to
changes
in
the
market
(market
risk)
or
failure
of
the
other
party
to
the
transaction
to
perform
(counterparty
credit
risk).
The
potential
loss
could
exceed
the
value
of
the
financial
assets
recorded
on
the
financial
statements.
Financial
assets,
which
potentially
expose
each
Fund
to
counterparty
credit
risk,
consist
principally
of
cash
due
from
counterparties
on
forward,
option
and
swap
transactions,
when
applicable.
The
extent
of
each
Fund’s
exposure
to
counterparty
credit
risk
in
respect
to
these
financial
assets
approximates
their
carrying
value
as
recorded
on
the
Statement
of
Assets
and
Liabilities.
Each
Fund
helps
manage
counterparty
credit
risk
by
entering
into
agreements
only
with
counterparties
the
Adviser
believes
have
the
financial
resources
to
honor
their
obligations
and
by
having
the
Adviser
monitor
the
financial
stability
of
the
counterparties.
Additionally,
counterparties
may
be
required
to
pledge
collateral
daily
(based
on
the
daily
valuation
of
the
financial
asset)
on
behalf
of
each
Fund
with
a
value
approximately
equal
to
the
amount
of
any
unrealized
gain
above
a
pre-determined
threshold.
Reciprocally,
when
each
Fund
has
an
unrealized
loss,
the
Funds
have
instructed
the
custodian
to
pledge
assets
of
the
Funds
as
collateral
with
a
value
approximately
equal
to
the
amount
of
the
unrealized
loss
above
a
pre-determined
threshold.
Collateral
pledges
are
monitored
and
subsequently
adjusted
if
and
when
the
valuations
fluctuate,
either
up
or
down,
by
at
least
the
pre-determined
threshold
amount.
6.
Fund
Shares
Transactions
in Fund
shares
during
the
current
and
prior
fiscal
period
were
as
follows:
Derivative
Instrument
Risk
Exposure
Net
Realized
Gain
(Loss)
Change
in
Unrealized
Appreciation
(Depreciation)
Real
Asset
Income
Futures
contracts
Interest
rate
$
912,873
$
2,273,244
Six
Months
Ended
6/30/24
Year
Ended
12/31/23
Global
Infrastructure
Shares
Amount
Shares
Amount
Subscriptions:
Class
A
148,767
$1,617,218
525,565
$5,609,243
Class
A
-
automatic
conversion
of
Class
C
—
—
4
41
Class
C
58,793
619,811
97,360
1,021,699
Class
R6
183,017
1,965,284
514,643
5,478,017
Class
I
3,231,535
34,790,504
6,224,520
65,437,708
Total
subscriptions
3,622,112
38,992,817
7,362,092
77,546,708
Reinvestments
of
distributions:
Class
A
—
—
94,312
1,032,722
Class
C
—
—
10,115
108,932
Class
R6
—
—
110,032
1,202,653
Class
I
—
—
557,446
6,081,725
Total
reinvestments
of
distributions
—
—
771,905
8,426,032
Redemptions:
Class
A
(573,356)
(6,225,251)
(874,642)
(9,283,915)
Class
C
(167,687)
(1,791,458)
(396,389)
(4,109,033)
Class
C
-
automatic
conversion
to
Class
A
—
—
(4)
(41)
Class
R6
(306,607)
(3,334,266)
(1,486,972)
(15,874,734)
Class
I
(3,930,860)
(42,134,961)
(11,138,297)
(117,827,155)
Total
redemptions
(4,978,510)
(53,485,936)
(13,896,304)
(147,094,878)
Net
increase
(decrease)
(1,356,398)
$(14,493,119)
(5,762,307)
$(61,122,138)
Notes
to
Financial
Statements
(Unaudited)
(continued)
Six
Months
Ended
6/30/24
Year
Ended
12/31/23
Global
Real
Estate
Securities
Shares
Amount
Shares
Amount
Subscriptions:
Class
A
149
$2,634
30,853
$549,812
Class
C
—
—
191
3,500
Class
R6
5,658
100,778
4,872
83,930
Class
I
26,379
461,800
38,114
661,964
Total
subscriptions
32,186
565,212
74,030
1,299,206
Reinvestments
of
distributions:
Class
A
600
10,700
961
16,753
Class
C
14
251
36
631
Class
R6
473
8,425
1,073
18,529
Class
I
2,059
36,629
3,866
66,958
Total
reinvestments
of
distributions
3,146
56,005
5,936
102,871
Redemptions:
Class
A
(1,401)
(24,891)
(17,184)
(295,925)
Class
C
(423)
(7,499)
(24)
(410)
Class
R6
(1,864)
(33,419)
(18,109)
(305,652)
Class
I
(6,506)
(114,893)
(25,612)
(427,520)
Total
redemptions
(10,194)
(180,702)
(60,929)
(1,029,507)
Net
increase
(decrease)
25,138
$440,515
19,037
$372,570
Six
Months
Ended
6/30/24
Year
Ended
12/31/23
Real
Asset
Income
Shares
Amount
Shares
Amount
Subscriptions:
Class
A
466,139
$9,538,009
1,334,670
$27,019,808
Class
A
-
automatic
conversion
of
Class
C
—
—
630
12,516
Class
C
29,426
602,208
98,405
1,994,989
Class
R6
158,056
3,247,141
456,343
9,300,298
Class
I
3,857,504
78,807,233
7,149,066
144,528,705
Total
subscriptions
4,511,125
92,194,591
9,039,114
182,856,316
Reinvestments
of
distributions:
Class
A
158,059
3,228,793
355,828
7,171,711
Class
C
52,234
1,067,551
148,955
3,009,909
Class
R6
228,241
4,692,303
435,569
8,825,178
Class
I
803,815
16,421,945
1,859,841
37,485,935
Total
reinvestments
of
distributions
1,242,349
25,410,592
2,800,193
56,492,733
Redemptions:
Class
A
(1,169,773)
(23,904,850)
(2,199,486)
(44,159,148)
Class
C
(678,814)
(13,895,314)
(1,808,288)
(36,319,531)
Class
C
-
automatic
conversion
to
Class
A
—
—
(630)
(12,516)
Class
R6
(90,144)
(1,856,365)
(170,081)
(3,448,937)
Class
I
(6,058,730)
(123,899,327)
(14,836,509)
(297,245,776)
Total
redemptions
(7,997,461)
(163,555,856)
(19,014,994)
(381,185,908)
Net
increase
(decrease)
(2,243,987)
$(45,950,673)
(7,175,687)
$(141,836,859)
7.
Income
Tax
Information
Each
Fund
is
a
separate
taxpayer
for
federal
income
tax
purposes.
Each
Fund
intends
to
distribute
substantially
all
of
its
net
investment
income
and
net
capital
gains
to
shareholders
and
otherwise
comply
with
the
requirements
of
Subchapter
M
of
the
Internal
Revenue
Code
applicable
to
regulated
investment
companies.
Therefore,
no
federal
income
tax
provision
is
required.
Each
Fund
files
income
tax
returns
in
U.S.
federal
and
applicable
state
and
local
jurisdictions.
A
Fund's
federal
income
tax
returns
are
generally
subject
to
examination
for
a
period
of
three
fiscal
years
after
being
filed.
State
and
local
tax
returns
may
be
subject
to
examination
for
an
additional
period
of
time
depending
on
the
jurisdiction.
Management
has
analyzed
each
Fund's
tax
positions
taken
for
all
open
tax
years
and
has
concluded
that
no
provision
for
income
tax
is
required
in
the
Fund's
financial
statements.
As
of
the
end
of
the
reporting
period,
the
aggregate
cost
and
the
net
unrealized
appreciation/(depreciation)
of
all
investments
for
federal
income
tax
purposes
were
as
follows:
For
purposes
of
this
disclosure,
tax
cost
generally
includes
the
cost
of
portfolio
investments
as
well
as
up-front
fees
or
premiums
exchanged
on
derivatives
and
any
amounts
unrealized
for
income
statement
reporting
but
realized
income
and/or
capital
gains
for
tax
reporting,
if
applicable.
As
of
prior
fiscal
period
end,
the
components
of
accumulated
earnings
on
a
tax
basis
were
as
follows:
Six
Months
Ended
6/30/24
Year
Ended
12/31/23
Real
Estate
Securities
Shares
Amount
Shares
Amount
Subscriptions:
Class
A
647,213
$9,340,143
1,419,889
$20,403,679
Class
A
-
automatic
conversion
of
Class
C
—
—
4,440
63,976
Class
C
1,680
23,177
15,724
221,288
Class
R6
2,027,114
30,191,209
3,760,951
54,709,743
Class
I
9,769,709
143,994,475
10,542,229
152,797,471
Total
subscriptions
12,445,716
183,549,004
15,743,233
228,196,157
Reinvestments
of
distributions:
Class
A
89,963
1,312,223
238,711
3,380,701
Class
C
1,799
25,081
6,869
92,843
Class
R6
257,950
3,919,808
660,001
9,740,746
Class
I
454,625
6,793,750
987,406
14,326,826
Total
reinvestments
of
distributions
804,337
12,050,862
1,892,987
27,541,116
Redemptions:
Class
A
(1,271,696)
(18,295,821)
(2,774,390)
(39,514,456)
Class
C
(74,008)
(1,017,558)
(237,620)
(3,230,087)
Class
C
-
automatic
conversion
to
Class
A
—
—
(4,648)
(63,976)
Class
R6
(5,511,089)
(82,917,855)
(5,368,488)
(79,243,474)
Class
I
(6,079,544)
(89,618,960)
(18,095,173)
(258,931,561)
Total
redemptions
(12,936,337)
(191,850,194)
(26,480,319)
(380,983,554)
Net
increase
(decrease)
313,716
$3,749,672
(8,844,099)
$(125,246,281)
Fund
Tax
Cost
Gross
Unrealized
Appreciation
Gross
Unrealized
(Depreciation)
Net
Unrealized
Appreciation
(Depreciation)
Global
Infrastructure
$
381,776,325
$
97,921,043
$
(17,451,248)
$
80,469,795
Global
Real
Estate
Securities
39,774,686
5,104,671
(3,453,510)
1,651,161
Real
Asset
Income
1,046,197,681
51,737,196
(71,216,608)
(19,479,412)
Real
Estate
Securities
753,495,358
254,406,951
(42,448,324)
211,958,627
Fund
Undistributed
Ordinary
Income
Undistributed
Long-Term
Capital
Gains
Unrealized
Appreciation
(Depreciation)
Capital
Loss
Carryforwards
Late-Year
Loss
Deferrals
Other
Book-to-Tax
Differences
Total
Global
Infrastructure
$
—
$
—
$
87,295,844
$
(2,499,897)
$
—
$
(47,608)
$
84,748,339
Global
Real
Estate
Securities
115,670
—
3,873,171
(4,203,708)
—
—
(214,867)
Real
Asset
Income
897,716
—
(6,267,772)
(280,675,483)
—
(92,818)
(286,138,357)
Real
Estate
Securities
—
5,005,442
256,854,025
—
—
(337,646)
261,521,821
Notes
to
Financial
Statements
(Unaudited)
(continued)
As
of
prior
fiscal
period
end,
the
Funds
had
capital
loss
carryforwards,
which
will
not
expire:
8.
Management
Fees
and
Other
Transactions
with
Affiliates
Management
Fees:
Each
Fund’s
management
fee
compensates
the
Adviser
for
the
overall
investment
advisory
and
administrative
services
and
general
office
facilities.
The
Sub-Adviser
is
compensated
for
its
services
to
the
Funds
from
the
management
fees
paid
to
the
Adviser.
Each
Fund’s
management
fee
consists
of
two
components
–
a
fund-level
fee,
based
only
on
the
amount
of
assets
within
each
individual
Fund,
and
a
complex-level
fee,
based
on
the
aggregate
amount
of
all
eligible
fund
assets
managed
by
the
Adviser.
This
pricing
structure
enables
each
Fund’s
shareholders
to
benefit
from
growth
in
the
assets
within
their
respective
Fund
as
well
as
from
growth
in
the
amount
of
complex-wide
assets
managed
by
the
Adviser.
The
annual
fund-level
fee,
payable
monthly,
for
each
Fund
is
calculated
according
to
the
following
schedules:
*
For
the
period
January
1,
2024
through
April
30,
2024.
Effective
May
1,
2024,
the
annual
fund-level
fee,
payable
monthly,
for
Real
Estate
Securities
is
calculated
according
the
following
schedule:
Fund
Short-Term
Long-Term
Total
Global
Infrastructure
$
2,499,897
$
—
$
2,499,897
Global
Real
Estate
Securities
1,838,788
2,364,920
4,203,708
Real
Asset
Income
168,153,759
112,521,724
280,675,483
Real
Estate
Securities
—
—
—
Average
Daily
Net
Assets
Global
Infrastructure
Global
Real
Estate
Securities
Real
Estate
Securities*
For
the
first
$125
million
0.7500
%
0.7500
%
0.7000
%
For
the
next
$125
million
0.7375
0.7375
0.6875
For
the
next
$250
million
0.7250
0.7250
0.6750
For
the
next
$500
million
0.7125
0.7125
0.6625
For
the
next
$1
billion
0.7000
0.7000
0.6500
For
the
next
$3
billion
0.6750
0.6750
0.6250
For
the
next
$2.5
billion
0.6500
0.6500
0.6000
For
the
next
$2.5
billion
0.6375
0.6375
0.5875
For
net
assets
over
$10
billion
0.6250
0.6250
0.5750
Average
Daily
Net
Assets
Real
Asset
Income
For
the
first
$125
million
0.6000
%
For
the
next
$125
million
0.5875
For
the
next
$250
million
0.5750
For
the
next
$500
million
0.5625
For
the
next
$1
billion
0.5500
For
the
next
$3
billion
0.5250
For
the
next
$5
billion
0.5000
For
net
assets
over
$10
billion
0.4875
Average
Daily
Net
Assets
Real
Estate
Securities
For
the
first
$125
million
0.6500
%
For
the
next
$125
million
0.6375
For
the
next
$250
million
0.6250
For
the
next
$500
million
0.6125
For
the
next
$1
billion
0.6000
For
the
next
$3
billion
0.5750
For
the
next
$2.5
billion
0.5500
For
the
next
$2.5
billion
0.5375
For
net
assets
over
$10
billion
0.5250
For
the
period
January
1,
2024
through
April
30,
2024,
the
annual
complex-level
fee,
payable
monthly,
for
each
Fund
was
determined
by
taking
the
complex-
level
fee
rate,
which
is
based
on
the
aggregate
amount
of
“eligible
assets”
of
all
Nuveen
funds
as
set
forth
in
the
schedule
below,
and
(except
for
Global
Real
Estate
Securities
and
Real
Asset
Income)
making,
as
appropriate,
an
upward
adjustment
to
that
rate
based
upon
the
percentage
of
the
particular
fund’s
assets
that
are
not
“eligible
assets.”
The
complex-level
fee
schedule
for
each
Fund
was
as
follows:
*
The
complex-level
fee
is
calculated
based
upon
the
aggregate
daily
“eligible
assets”
of
all
Nuveen
open-end
and
closed-end
funds.
Eligible
assets
do
not
include
assets
attributable
to
investments
in
other
Nuveen
funds
or
assets
in
excess
of
a
determined
amount
(originally
$2
billion)
added
to
the
Nuveen
fund
complex
in
connection
with
the
Adviser’s
assumption
of
the
management
of
the
former
First
American
Funds
effective
January
1,
2011,
but
do
include
certain
assets
of
certain
Nuveen
funds
that
were
reorganized
into
funds
advised
by
an
affiliate
of
the
Adviser
during
the
2019
calendar
year.
Eligible
assets
include
closed-end
fund
assets
managed
by
the
Adviser
that
are
attributable
to
certain
types
of
leverage.
For
these
purposes,
leverage
includes
the
closed-end
funds’
use
of
preferred
stock
and
borrowings
and
certain
investments
in
the
residual
interest
certificates
(also
called
inverse
floating
rate
securities)
in
tender
option
bond
(TOB)
trusts,
including
the
portion
of
assets
held
by
a
TOB
trust
that
has
been
effectively
financed
by
the
trust’s
issuance
of
floating
rate
securities,
subject
to
an
agreement
by
the
Adviser
as
to
certain
funds
to
limit
the
amount
of
such
assets
for
determining
eligible
assets
in
certain
circumstances.
Effective
May
1,
2024
the
annual
complex-level
fee,
payable
monthly,
for
each
Fund
is
calculated
according
to
the
following
schedule:
*
The
complex-level
fee
is
calculated
based
upon
the
aggregate
daily
“eligible
assets”
of
all
Nuveen-branded
closed-end
funds
and
Nuveen
branded
open-end
funds
(“Nuveen
Mutual
Funds”).
Except
as
described
below,
eligible
assets
include
the
assets
of
all
Nuveen-branded
closed-end
funds
and
Nuveen
Mutual
Funds
organized
in
the
United
States.
Eligible
assets
do
not
include
the
net
assets
of:
Nuveen
fund-of-funds,
Nuveen
money
market
funds,
Nuveen
index
funds,
Nuveen
Large
Cap
Responsible
Equity
Fund
or
Nuveen
Life
Large
Cap
Responsible
Equity
Fund.
In
addition,
eligible
assets
include
a
fixed
percentage
of
the
aggregate
net
assets
of
the
active
equity
and
fixed
income
Nuveen
Mutual
Funds
advised
by
the
Adviser’s
affiliate,
Teachers
Advisors,
LLC
(except
those
identified
above).
The
fixed
percentage
will
increase
annually
until
May
1,
2033,
at
which
time
eligible
assets
will
include
all
of
the
aggregate
net
assets
of
the
active
equity
and
fixed
income
Nuveen
Mutual
Funds
advised
by
Teachers
Advisors,
LLC
(except
those
identified
above).
Eligible
assets
include
closed-end
fund
assets
managed
by
the
Adviser
that
are
attributable
to
financial
leverage.
For
these
purposes,
financial
leverage
includes
the
closed-end
funds’
use
of
preferred
stock
and
borrowings
and
certain
investments
in
the
residual
interest
certificates
(also
called
inverse
floating
rate
securities)
in
tender
option
bond
(TOB)
trusts,
including
the
portion
of
assets
held
by
a
TOB
trust
that
has
been
effectively
financed
by
the
trust’s
issuance
of
floating
rate
securities,
subject
to
an
agreement
by
the
Adviser
as
to
certain
funds
to
limit
the
amount
of
such
assets
for
determining
eligible
assets
in
certain
circumstances.
As
of
June
30,
2024,
the
complex-level
fee
rate
for
each
Fund
was
as
follows:
The
Adviser
has
agreed
to
waive
fees
and/or
reimburse
expenses
(“Expense
Cap”)
of
the
Funds
so
that
the
total
annual
Fund
operating
expenses
(excluding
12b-1
distribution
and/or
service
fees,
interest
expenses,
taxes,
acquired
fund
fees
and
expenses,
fees
incurred
in
acquiring
and
disposing
of
portfolio
securities
and
extraordinary
expenses)
do
not
exceed
the
average
daily
net
assets
of
any
class
of
Fund
shares
in
the
amounts
and
for
the
Complex-Level
Eligible
Asset
Breakpoint
Level*
Effective
Complex-Level
Fee
Rate
at
Breakpoint
Level
$55
billion
0.2000
%
$56
billion
0.1996
$57
billion
0.1989
$60
billion
0.1961
$63
billion
0.1931
$66
billion
0.1900
$71
billion
0.1851
$76
billion
0.1806
$80
billion
0.1773
$91
billion
0.1691
$125
billion
0.1599
$200
billion
0.1505
$250
billion
0.1469
$300
billion
0.1445
Complex-Level
Asset
Breakpoint
Level*
Complex-Level
Fee
For
the
first
$124.3
billion
0.1600
%
For
the
next
$75.7
billion
0.1350
For
the
next
$200
billion
0.1325
For
eligible
assets
over
$400
billion
0.1300
Fund
Complex-Level
Fee
Global
Infrastructure
0
.1574%
Global
Real
Estate
Securities
0
.1574%
Real
Asset
Income
0
.1574%
Real
Estate
Securities
0
.1574%
Notes
to
Financial
Statements
(Unaudited)
(continued)
time
period
stated
in
the
following
table.
However,
because
Class
R6
Shares
are
not
subject
to
sub-transfer
agent
and
similar
fees,
the
total
annual
fund
operating
expenses
for
the
Class
R6
Shares
will
not
be
less
than
the
expense
limitation.
The
expense
limitation
expiring
July
31,
2026,
may
be
terminated
or
modified
prior
to
that
date
only
with
the
approval
of
the
Board.
Distribution
and
Service
Fees:
Each
Fund
has
adopted
a
distribution
and
service
plan
under
rule
12b-1
under
the
1940
Act.
Class
A
Shares
incur
a
0.25%
annual
12b-1
service
fee.
Class
C
Shares
incur
a
0.75%
annual
12b-1
distribution
fee
and
a
0.25%
annual
12b-1
service
fee.
Class
R6
Shares
and
Class
I
Shares
are
not
subject
to
12b-1
distribution
or
service
fees.
The
fees
under
this
plan
compensate
Nuveen
Securities,
LLC,
(the
“Distributor”),
a
wholly-owned
subsidiary
of
Nuveen,
for
services
provided
and
expenses
incurred
in
distributing
shares
of
the
Funds
and
establishing
and
maintaining
shareholder
accounts.
Other
Transactions
with
Affiliates:
The
Funds
receive
voluntary
compensation
from
the
Adviser
in
amounts
that
approximate
the
cost
of
research
services
obtained
from
broker-dealers
and
research
providers
if
the
Adviser
had
purchased
the
research
services
directly.
This
income
received
by
the
Funds
is
recognized
in
"Affiliated
income"
on
the
Statement
of
Operations
and
any
amounts
due
to
the Funds
at
the
end
of
the
reporting
period
is
recognized
in
"Reimbursement
from
Adviser"
on
the
Statement
of
Assets
and Liabilities. During
the
current
fiscal
period,
the
values
of
voluntary
compensation
were
as
follows:
During
the
current
fiscal
period,
the
Distributor,
collected
sales
charges
on
purchases
of
Class
A
Shares,
the
majority
of
which
were
paid
out
as
concessions
to
financial
intermediaries
as
follows:
The
Distributor
also
received
12b-1
service
fees
on
Class
A
Shares,
substantially
all
of
which
were
paid
to
compensate
financial
intermediaries
for
providing
services
to
shareholders
relating
to
their
investments.
During
the
current
fiscal
period,
the
Distributor
compensated
financial
intermediaries
directly
with
commission
advances
at
the
time
of
purchase
as
follows:
To
compensate
for
commissions
advanced
to
financial
intermediaries,
all
12b-1
service
and
distribution
fees
collected
on
Class
C
Shares
during
the
first
year
following
a
purchase
are
retained
by
the
Distributor.
During
the
current
fiscal
period,
the
Distributor
retained
such
12b-1
fees
as
follows:
Fund
Temporary
Expense
Cap
Temporary
Expense
Cap
Expiration
Date
Global
Infrastructure
1.00%
July
31,
2026
Global
Real
Estate
Securities
1.09
July
31,
2026
Real
Asset
Income
0.95
July
31,
2026
Real
Estate
Securities
0.97
July
31,
2026
Fund
Amount
Global
Infrastructure
$
258,630
Global
Real
Estate
Securities
26,491
Real
Asset
Income
439,404
Real
Estate
Securities
790,580
Fund
Sales
Charges
Collected
Paid
to
Financial
Intermediaries
Global
Infrastructure
$
12,769
$
11,171
Global
Real
Estate
Securities
—
—
Real
Asset
Income
9,899
8,982
Real
Estate
Securities
703
611
Fund
Commission
Advances
Global
Infrastructure
$
3,421
Global
Real
Estate
Securities
—
Real
Asset
Income
6,520
Real
Estate
Securities
171
The
remaining
12b-1
fees
charged
to
each
Fund
were
paid
to
compensate
financial
intermediaries
for
providing
services
to
shareholders
relating
to
their
investments.
The
Distributor
also
collected
and
retained
CDSC
on
share
redemptions
during
the
current
fiscal
period,
as
follows:
Affiliate
Owned
Shares:
As
of
the
end
of
the
reporting
period,
the
percentage
of
Fund
shares
owned
by
TIAA
and/or
TIAA
affiliates
are
as
follows:
9.
Borrowing
Arrangements
Committed
Line
of
Credit:
The
Funds,
along
with
certain
other
funds
managed
by
the
Adviser
(“Participating
Funds”),
have
established
a
364-day,
$2.700
billion
standby
credit
facility
with
a
group
of
lenders,
under
which
the
Participating
Funds
may
borrow
for
temporary
purposes
(other
than
on-
going
leveraging
for
investment
purposes).
Each
Participating
Fund
is
allocated
a
designated
proportion
of
the
facility’s
capacity
(and
its
associated
costs,
as
described
below)
based
upon
a
multi-factor
assessment
of
the
likelihood
and
frequency
of
its
need
to
draw
on
the
facility,
the
size
of
the
Fund
and
its
anticipated
draws,
and
the
potential
importance
of
such
draws
to
the
operations
and
well-being
of
the
Fund,
relative
to
those
of
the
other
Funds.
A
Fund
may
effect
draws
on
the
facility
in
excess
of
its
designated
capacity
if
and
to
the
extent
that
other
Participating
Funds
have
undrawn
capacity.
The
credit
facility
expires
in
June
2025
unless
extended
or
renewed.
The
credit
facility
has
the
following
terms:
0.15%
per
annum
on
unused
commitment
amounts
and
a
drawn
interest
rate
equal
to
the
higher
of
(a)
OBFR
(Overnight
Bank
Funding
Rate)
plus
1.20%
per
annum
or
(b)
the
Fed
Funds
Effective
Rate
plus
1.20%
per
annum
on
amounts
borrowed.
Interest
expense
incurred
by
the
Participating
Funds,
when
applicable,
is
recognized
as
a
component
of
“Interest
expense”
on
the
Statement
of
Operations.
Participating
Funds
paid
administration,
legal
and
arrangement
fees,
which
are
recognized
as
a
component
of
“Interest
expense”
on
the
Statement
of
Operations,
and
along
with
commitment
fees,
have
been
allocated
among
such
Participating
Funds
based
upon
the
relative
proportions
of
the
facility’s
aggregate
capacity
reserved
for
them
and
other
factors
deemed
relevant
by
the
Adviser
and
the
Board
of
each
Participating
Fund.
During
the
current
fiscal
period,
the
Funds
did
not
utilize
this
facility.
Fund
12b-1
Fees
Retained
Global
Infrastructure
$
2,554
Global
Real
Estate
Securities
5
Real
Asset
Income
9,801
Real
Estate
Securities
1,157
Fund
CDSC
Retained
Global
Infrastructure
$
3,310
Global
Real
Estate
Securities
—
Real
Asset
Income
17
Real
Estate
Securities
1
Underlying
Fund
TIAA
Total
Global
Infrastructure
–%
–%
Global
Real
Estate
Securities
91
91
Real
Asset
Income
Real
Estate
Securities
–
–
| Item 8. | Changes in and Disagreements with Accountants for Open-End Management Investment Companies. |
Not applicable.
| Item 9. | Proxy Disclosures for Open-End Management Investment Companies. |
Not applicable.
| Item 10. | Remuneration Paid to Directors, Officers, and Others of Open-End Management Investment Companies. |
Remuneration paid to directors, officers and others is included in the Statement of Operations under the line items “Trustee Fees” and “Management Fees” as part of the financial statements filed under Item 7 of this Form N-CSR.
Item 11. Statement Regarding Basis for Approval of Investment Advisory Contract
Nuveen Global Infrastructure Fund
Nuveen Global Real Estate Securities Fund
Nuveen Real Asset Income Fund
Nuveen Real Estate Securities Fund
The Approval Process
At meetings held on April 18 and 19, 2024 (the “Meeting”), the Board of Trustees of Nuveen Investment Trust V and the Board of Directors of Nuveen Investment Funds, Inc. (collectively, the “Board” and each Trustee or Director, as applicable, a “Board Member”) approved, for each applicable fund listed above (each a “Fund”), the renewal of the investment management agreement (each an “Investment Management Agreement”) with Nuveen Fund Advisors, LLC (“NFAL”; NFAL is an “Adviser”) pursuant to which NFAL serves as investment adviser to such Fund. Similarly, for each Fund, the Board approved the renewal of the sub-advisory agreement (each a “Sub-Advisory Agreement”) with Nuveen Asset Management, LLC (the “Sub-Adviser”) pursuant to which the Sub-Adviser serves as the sub-adviser to such Fund. The Board Members are not “interested persons” (as defined under the Investment Company Act of 1940 (the “1940 Act”)) and, therefore, the Board is deemed to be comprised of all disinterested Board Members. References to the Board and the Board Members are interchangeable. Below is a summary of the annual review process the Board undertook related to its most recent renewal of each Investment Management Agreement and Sub-Advisory Agreement on behalf of the applicable Fund.
In accordance with applicable law, following up to an initial two-year period, the Board considers the renewal of each Investment Management Agreement and Sub-Advisory Agreement on behalf of the applicable Fund on an annual basis. The Investment Management Agreements and Sub-Advisory Agreements are collectively referred to as the “Advisory Agreements,” and NFAL and the Sub-Adviser are collectively, the “Fund Advisers” and each a “Fund Adviser.” In addition, the fund complex consists of the group of funds advised by NFAL (collectively referred to as the “Nuveen funds”) and the group of funds advised by Teachers Advisors, LLC (“TAL” and such funds are collectively, the “TC funds”). For clarity, NFAL serves as Adviser to the Nuveen funds, including the Funds, and TAL serves as “Adviser” to the TC funds. The Board Members considered that the prior separate boards of the TC funds and Nuveen funds were consolidated effective in January 2024. Accordingly, at the Meeting, the Board Members considered the review of the advisory agreements for the Nuveen funds as well as reviewed the investment management agreements for the TC funds. Depending on the appropriate context, references to “the Adviser” may be to NFAL with respect to the Nuveen funds and/or TAL with respect to the TC funds.
The Board Members considered the review of the advisory agreements of the Nuveen funds and the TC funds to be an ongoing process. The Board Members therefore employed the accumulated information, knowledge and experience they had gained during their tenure on the respective board of the TC funds or Nuveen funds (as the case may be) governing the applicable funds and working with the respective investment advisers and sub-advisers, as applicable, in their review of the advisory agreements for the fund complex.
During the course of the year prior to the Meeting, the Board and/or its committees received a wide variety of materials that covered a range of topics relevant to the Board’s annual consideration of the renewal of the advisory agreements, including reports on fund investment results over various periods; product initiatives for various funds; fund expenses; compliance, regulatory and risk management matters; trading practices, including soft dollar arrangements (as applicable); the liquidity and derivatives risk management programs; management of distributions; valuation of securities; payments to financial intermediaries, including 12b-1 expenses (as applicable); securities lending (as applicable); and overall market and regulatory developments. The Board also met periodically with and/or received presentations by key investment professionals managing a fund’s portfolio. In particular, at the Board meeting held on February 27-29, 2024 (the “February Meeting”), the Board and/or its Investment Committee received the annual performance review of the funds as described in further detail below. The presentations, discussions and meetings throughout the year also provide a means for the Board to evaluate and consider the level, breadth and quality of services provided by the Adviser and sub-advisers, as applicable, and how such services have changed over time in light of new or modified regulatory requirements, changes to market conditions or other factors.
In connection with its annual consideration of the advisory agreements, the Board, through its independent legal counsel, requested and received extensive materials and information prepared specifically for its review of the advisory agreements. The materials provided at the Meeting and/or prior meetings covered a wide range of matters including, but not limited to, a description of the nature, extent and quality of services provided by the Fund Advisers; the consolidation of the Nuveen fund family and TC fund family; a review of product actions advanced in 2023 for the benefit of particular funds and/or the fund complex; a review of each sub-adviser, if applicable, and/or applicable investment team; an analysis of fund performance with a focus on funds considered to have met certain challenged performance measurements; an analysis of the fees and expense ratios of the funds with a focus on funds considered to have certain expense characteristics; a list of management fee and, if applicable, sub-advisory fee schedules; a review of temporary and permanent expense caps and fee waivers for open-end funds (as applicable); a description of portfolio manager compensation; a description of the profitability and/or financial data of Nuveen, TAL and the sub-advisers; and a description of indirect benefits received by the Adviser and the sub-advisers as a result of their relationships with the funds, as applicable. The Board also considered information provided by Broadridge Financial Solutions, Inc. (“Broadridge”), an independent provider of investment company data, comparing fee and expense
Item 11. Statement Regarding Basis for Approval of Investment Advisory Contract (continued)
levels of each respective fund to those of a peer universe and, with respect to open-end funds, also to a peer group of funds selected by Broadridge, subject to certain exceptions.
The information prepared specifically for the annual review supplemented the information provided to the Board and its committees and the evaluations of the funds by the Board and its committees during the year. The Board’s review of the advisory agreements for the fund complex is based on all the information provided to the Board and its committees over time. The performance, fee and expense data and other information provided by a Fund Adviser, Broadridge or other service providers were not independently verified by the Board Members.
As part of their review, the Board Members and independent legal counsel met by videoconference in executive session on April 10, 2024 (the “April Executive Session”) to review and discuss materials provided in connection with their annual review of the advisory agreements for the fund complex. After reviewing this information, the Board Members requested, directly or through independent legal counsel, additional information, and the Board subsequently reviewed and discussed the responses to these follow-up questions and requests.
The Board Members were advised by independent legal counsel during the annual review process as well as throughout the year, including meeting in executive sessions with such counsel at which no representatives of management were present. In connection with their annual review, the Board Members also received a memorandum from independent legal counsel outlining their fiduciary duties and legal standards in reviewing the Advisory Agreements, including guidance from court cases evaluating advisory fees.
The Board’s decisions to renew each Advisory Agreement were not based on a single identified factor, but rather each decision reflected the comprehensive consideration of all the information provided to the Board and its committees throughout the year as well as the materials prepared specifically in connection with the annual review process. The contractual arrangements may reflect the results of prior year(s) of review, negotiation and information provided in connection with the Board’s annual review of the funds’ advisory arrangements and oversight of the funds. Each Board Member may have attributed different levels of importance to the various factors and information considered in connection with the annual review process and may have placed different emphasis on the relevant information year to year in light of, among other things, changing market and economic conditions. A summary of the principal factors and information, but not all the factors, the Board considered in deciding to renew the Advisory Agreements is set forth below.
A. Nature, Extent and Quality of Services
In evaluating the renewal of the Advisory Agreements, the Board Members received and considered information regarding the nature, extent and quality of the applicable Fund Adviser’s services provided to each respective Fund with particular focus on the services and enhancements or changes to such services provided during the last year. The Board Members considered the Investment Management Agreements and the Sub-Advisory Agreements separately in the course of their review. With this approach, they considered the roles of NFAL and the Sub-Adviser in providing services to the Funds.
The Board considered that the Adviser provides a wide array of management, oversight and other services to manage and operate the applicable funds. The Board considered the Adviser’s and its affiliates’ dedication of resources, time, people and capital as well as continual program of improvement and innovation aimed at enhancing the funds and fund complex for investors and meeting the needs of an increasingly complex regulatory environment. In particular, over the past several years, the Board considered the significant resources, both financial and personnel, the Adviser and its affiliates have committed in working to consolidate the Nuveen fund family and TC fund family under one centralized umbrella. The Board considered that the organizational changes in bringing together Nuveen, its affiliates and TIAA’s (as defined below) asset management businesses, consolidating the Nuveen and TC fund families and other initiatives were anticipated to provide various benefits for the funds through, among other things, enhanced operating efficiencies, centralized investment leadership and a centralized shared resources and support model. As part of these efforts, the boards of the TC funds and Nuveen funds were consolidated effective in January 2024. In addition, in conjunction with these consolidation efforts, the Board approved at the Meeting changes to fee and breakpoint structures (as applicable) that could provide cost savings to participating funds, as described in further detail below.
The Board also reviewed information regarding other product actions undertaken or continued by management in the 2023 calendar year in seeking to improve the effectiveness of the organization, the product line-up as well as particular funds through, among other things, continuing to review and optimize the product line and gaining efficiencies through mergers and liquidations; reviewing and updating investment policies and benchmarks; implementing fee waivers and/or expense cap changes for certain funds; evaluating and adjusting portfolio management teams as appropriate for various funds; and developing policy positions on a broad range of regulatory proposals that may impact the funds and communicating with lawmakers and other regulatory authorities to help ensure these positions are considered. In its review, the Board considered that the funds operated in a highly regulated industry and the scope and complexity of the services and resources that the Adviser and its affiliates must provide to manage and operate the applicable funds have expanded over the years as a result of, among other things, regulatory, market and other developments, such as the adoption of the tailored shareholder report or the revised fund name rule.
In considering the breadth and quality of services the Adviser and its various teams provide, the Board considered that the Adviser provides investment advisory services. With respect to the Nuveen funds, such funds utilize sub-advisers to manage the portfolios of the funds subject to the supervision of NFAL. Accordingly, the Board considered that NFAL and its affiliates, among other things, oversee and review the performance of the respective sub-adviser and its investment team(s); evaluate Nuveen fund performance and market conditions; evaluate investment strategies and recommend changes thereto; set and manage distributions consistent with the respective Nuveen fund’s product design; oversee trade execution and, as
applicable, securities lending; evaluate investment risks; and manage valuation matters. The Board further considered that over the course of the 2023 calendar year, the Nuveen global public product team which supports the funds in the fund complex and their shareholders assessed the investment personnel across the investment leadership teams which resulted in additions or other modifications to the portfolio management teams of various funds. The Board also reviewed a description of the compensation structure applicable to certain portfolio managers.
In addition to the above investment advisory services, the Board further considered the extensive compliance, regulatory, administrative and other services the Adviser and its various teams or affiliates provide to manage and operate the applicable funds. Given the highly regulated industry in which the funds operate, the Board considered the breadth of the Adviser’s compliance program and related policies and procedures. The Board reviewed various initiatives the Adviser’s compliance team undertook or continued in 2023, in part, to address new regulatory requirements, support international business growth and product development, enhance international trading capabilities, enhance monitoring capabilities in light of the new regulatory requirements and guidance and maintain a comprehensive training program. The Board further considered, among other things, that other non-advisory services provided included, among other things, board support and reporting; establishing and reviewing the services provided by other fund service providers (such as a fund’s custodian, accountant, and transfer agent); risk management, including reviews of the liquidity risk management and derivatives risk management programs; legal support services; regulatory advocacy; and cybersecurity, business continuity and disaster recovery planning and testing.
Aside from the services provided, the Board considered the financial resources of the Adviser and/or its affiliates and their willingness to make investments in the technology, personnel and infrastructure to support the funds, including to enhance global talent, middle office systems, software and international and internal capabilities. The Board considered the access provided by the Adviser and its affiliates to a seed capital budget to support new or existing funds and/or facilitate changes for a respective fund. The Board considered the benefits to shareholders of investing in a fund that is a part of a large fund complex with a variety of investment disciplines, capabilities, expertise and resources available to navigate and support the funds including during stressed times. The Board considered the overall reputation and capabilities of the Adviser and its affiliates and the Adviser’s continuing commitment to provide high quality services.
In its review, the Board also considered the significant risks borne by the Adviser and its affiliates in connection with their services to the applicable funds, including entrepreneurial risks in sponsoring and supporting new funds and smaller funds and ongoing risks with managing the funds, such as investment, operational, reputational, regulatory, compliance and litigation risks.
With respect to the Funds, the Board considered the division of responsibilities between NFAL and the Sub-Adviser and considered that the Sub-Adviser and its investment personnel generally are responsible for the management of each Fund’s portfolio under the oversight of NFAL and the Board. The Board considered an analysis of the Sub-Adviser provided by NFAL which included, among other things, a summary of changes in the leadership teams and/or portfolio manager teams; the performance of the Nuveen funds sub-advised by the Sub-Adviser over various periods of time; and data reflecting product changes (if any) taken with respect to certain Nuveen funds. The Board considered that NFAL recommended the renewal of the Sub-Advisory Agreements.
Based on its review, the Board determined, in the exercise of its reasonable business judgment, that it was satisfied with the nature, extent and quality of services provided to the respective Funds under each applicable Advisory Agreement.
B. The Investment Performance of the Funds and Fund Advisers
In evaluating the quality of the services provided by the Fund Advisers, the Board also considered a variety of investment performance data of the Funds. In this regard, the Board and/or its Investment Committee reviewed, among other things, performance of the Funds over the quarter, one-, three- and five-year periods ending December 31, 2023 and March 31, 2024. For those Funds with multiple share classes, the performance data was based on Class I shares; however, the performance of other share classes was substantially similar as those other share classes invest in the same portfolio of securities and differences in performance among the classes would be principally attributed to the variations in the expense structures of the share classes. The Board performed its annual review of fund performance at its February Meeting and an additional review at the April Executive Session and also reviewed and discussed performance data at its other regularly scheduled quarterly meetings throughout the year. The Board therefore took into account the performance data, presentations and discussions (written and oral) that were provided at the Meeting and in prior meetings over time in evaluating fund performance, including management’s analysis of a fund’s performance with particular focus on funds that met certain challenged performance measurements as determined pursuant to a methodology approved by the Board or additional measurements as determined by management’s investment analysts. As various Nuveen funds have modified their portfolio teams and/or made significant changes to their portfolio strategies over time, the Board reviewed, among other things, certain tracking performance data over specific periods comparing performance before and after such changes.
The Board considered that performance data reflects performance over a specified period which may differ significantly depending on the ending dates selected, particularly during periods of market volatility. Further, the Board considered that shareholders may evaluate performance based on their own respective holding periods which may differ from the performance periods reviewed by the Board and lead to differing results.
In its evaluation, the Board reviewed fund performance results from different perspectives. In general, subject to certain exceptions, the Board reviewed both absolute and relative fund performance over the various time periods and considered performance results in light of a fund’s investment objective(s), strategies and risks. With respect to the relative performance, the Board considered fund performance in comparison to the performance of peer funds (the “Performance Peer Group”),
Item 11. Statement Regarding Basis for Approval of Investment Advisory Contract (continued)
subject to certain exceptions, and recognized and/or customized benchmarks (i.e., generally benchmarks derived from multiple recognized benchmarks). In reviewing such comparative performance, the Board was cognizant of the inherent limitations of such data which can make meaningful performance comparisons generally difficult. As an illustration, differences in the composition of the Performance Peer Group, the investment objective(s), strategies, dates of fund inception and other characteristics of the peers in the Performance Peer Group, the level, type and cost of leverage (if any) of the peers, and the varying sizes of peers all may contribute to differences in the performance results of a Performance Peer Group compared to the applicable fund. With respect to relative performance of a fund compared to a benchmark index, differences, among other things, in the investment objective(s) and strategies of a fund and the benchmark (particularly an actively managed fund that does not directly follow an index) as well as the costs of operating a fund would necessarily contribute to differences in performance results and limit the value of the comparative performance information. To assist the Board in its review of the comparability of the relative performance, management generally has ranked the relevancy of the Performance Peer Groups to the Funds as low, medium or high. In its review of relative performance, the Board considered a Fund’s performance relative to its Performance Peer Group, among other things, by evaluating its quartile ranking with the 1st quartile representing the top performing funds within the Performance Peer Group and the 4th quartile representing the lowest performing funds.
The Board evaluated performance in light of various relevant factors which may include, among other things, general market conditions, issuer-specific information, asset class information, leverage and fund cash flows. The Board considered that long-term performance could be impacted by even one period of significant outperformance or underperformance and that a single investment theme could disproportionately affect performance. Further, the Board considered that market and economic conditions may significantly impact a fund’s performance, particularly over shorter periods, and such performance may be more reflective of such economic or market events and not necessarily reflective of management skill. Although the Board reviews short-, intermediate- and longer-term performance data, the Board considered that longer periods of performance may reflect full market cycles.
In their review from year to year, the Board Members consider and may place different emphasis on the relevant information in light of changing circumstances in market and economic conditions. In evaluating performance, the Board focused particular attention on funds with less favorable performance records. However, depending on the facts and circumstances, including any differences between the respective fund and its benchmark and/or Performance Peer Group, the Board may be satisfied with a fund’s performance notwithstanding that its performance may be below that of its benchmark and/or peer group for certain periods. With respect to any funds for which the Board has identified performance issues, the Board seeks to monitor such funds more closely until performance improves, discuss with the Adviser the reasons for such results, consider whether any steps are necessary or appropriate to address such issues, discuss and evaluate the potential consequences of such steps and review the results of any steps undertaken.
The performance determinations with respect to each Fund are summarized below.
• For Nuveen Global Infrastructure Fund, the Board considered that the Fund outperformed its benchmark and ranked in the first quartile of its Performance Peer Group for the one-, three- and five-year periods ended December 31, 2023. In addition, the Fund outperformed its benchmark for the one-, three- and five-year periods ended March 31, 2024 and ranked in the second quartile of its Performance Peer Group for the one- and five-year periods and first quartile for the three-year period ended March 31, 2024. On the basis of the Board’s ongoing review of investment performance and all relevant factors, including the relative market conditions during certain reporting periods, the Fund’s investment objective(s) and management’s discussion of performance, the Board concluded that the Fund’s performance supported renewal of the Advisory Agreements.
• For Nuveen Global Real Estate Securities Fund, the Board considered that the Fund outperformed its benchmark for the one-, three- and five-year periods ended December 31, 2023 and March 31, 2024. The Fund also ranked in the second quartile of its Performance Peer Group for the one-year period and first quartile for the three- and five-year periods ended December 31, 2023. In addition, the Fund ranked in the third quartile of its Performance Peer Group for the one-year period and first quartile for the three- and five-year periods ended March 31, 2024. On the basis of the Board’s ongoing review of investment performance and all relevant factors, including the relative market conditions during certain reporting periods, the Fund’s investment objective(s) and management’s discussion of performance, the Board concluded that the Fund’s performance supported renewal of the Advisory Agreements.
• For Nuveen Real Asset Income Fund, the Board considered that although the Fund’s performance was below the performance of its blended benchmark for the one- and five-year periods ended December 31, 2023, the Fund outperformed its blended benchmark for the three-year period ended December 31, 2023. Further, although the Fund ranked in the fourth quartile of its Performance Peer Group for the three- and five-year periods ended December 31, 2023, the Fund ranked in the first quartile of its Performance Peer Group for the one-year period ended December 31, 2023. In addition, although the Fund’s performance was below the performance of its blended benchmark for the one-
and five-year periods ended March 31, 2024, the Fund outperformed its blended benchmark for the three-year period ended March 31, 2024. Further, although the Fund ranked in the fourth quartile of its Performance Peer Group for the three- and five-year periods ended March 31, 2024, the Fund ranked in the second quartile of its Performance Peer Group for the one-year period ended March 31, 2024. In its review, the Board considered that the Performance Peer Group was classified as low for relevancy. On the basis of the Board’s ongoing review of investment performance and all relevant factors, including the relative market conditions during certain reporting periods, the Fund’s investment objective(s) and management’s discussion of performance, the Board concluded that the Fund’s performance supported renewal of the Advisory Agreements.
• For Nuveen Real Estate Securities Fund, the Board considered that the Fund’s performance was below the performance of its blended benchmark for the one-, three- and five-year periods ended December 31, 2023 and March 31, 2024. The Fund, however, ranked in the third quartile of its Performance Peer Group for the one- and five-year periods ended December 31, 2023 and second quartile for the three-year period ended December 31, 2023. In addition, although the Fund ranked in the fourth quartile of its Performance Peer Group for the one-year period ended March 31, 2024, the Fund ranked in the second quartile for the three-year period and third quartile for the five-year period ended March 31, 2024. On the basis of the Board’s ongoing review of investment performance and all relevant factors, including the relative market conditions during certain reporting periods, the Fund’s investment objective(s) and management’s discussion of performance, the Board concluded that the Fund’s performance supported renewal of the Advisory Agreements.
C. Fees, Expenses and Profitability
1. Fees and Expenses
As part of its annual review, the Board generally reviewed, among other things, the contractual management fee and the net/actual management fee (i.e., the management fee after taking into consideration fee waivers and/or expense reimbursements, if any) paid by a Fund to the Adviser in light of the nature, extent and quality of the services provided. The Board also reviewed information about other expenses and the total operating expense ratio of each Fund (after any fee waivers and/or expense reimbursements). More specifically, the Board Members reviewed, among other things, each Fund’s management fee rates and net total expense ratio in relation to similar data for a comparable universe of funds (the “Expense Universe”) and for a more focused subset of comparable funds (the “Expense Group”) established by Broadridge (subject to certain exceptions). The Board Members reviewed the methodology Broadridge employed to establish its Expense Universe and Expense Group (as applicable) and considered that differences between the applicable fund and its respective Expense Universe and/or Expense Group, as well as changes to the composition of the Expense Universe and/or Expense Group from year to year, may limit some of the value of the comparative data. The Board Members also considered that it can be difficult to compare management fees among funds as there are variations in the services that are included for the fees paid. The Board Members took these limitations and differences into account when reviewing comparative peer data.
The Board Members also considered a Fund’s operating expense ratio as it more directly reflected a shareholder’s total costs in investing in the respective fund. In their review, the Board Members considered, in particular, each fund with a net total expense ratio meeting certain expense or fee criteria when compared to its Expense Universe and Expense Group (if any) and an analysis as to the factors contributing to each such fund’s relative net total expense ratio.
The Board Members also considered, in relevant part, a Fund’s management fee and net total expense ratio in light of the Fund’s performance history, including reviewing certain funds identified by management and/or the Board as having a higher net total expense ratio or management fee compared to their respective peers coupled with experiencing periods of challenged performance and considering the reasons for such comparative positions.
In their evaluation of the fee arrangements for the Funds, the Board Members also reviewed the management fee schedules and the expense reimbursements and/or fee waivers agreed to by the Adviser for the respective fund (if any). In its review, the Board considered that the management fees of the Nuveen funds were generally comprised of two components, a fund-level component and a complex-level component, each with its own breakpoint schedule, subject to certain exceptions. As indicated above, the Board approved a revised fee schedule which would reduce and streamline the asset thresholds necessary to meet breakpoints in the complex-level fee component. The Board considered that management anticipated approximately $50 million in savings for Nuveen fund shareholders as a result of the revised fee schedule as well as additional estimated savings over time. The Board further considered management’s representation that there will be no increase to any Nuveen fund’s respective advisory agreement fee rate as a result of the revised complex-level fee schedule.
In its review, the Board considered that across the Nuveen fund and TC fund complex, management estimated that fund-level breakpoints resulted in approximately $82.5 million in reduced fees overall in 2023 and expense caps and reimbursements generated approximately an additional $91 million in savings to shareholders. In addition, the Board considered that management determined that the Nuveen funds achieved additional fee reductions of approximately $49 million due to the complex-wide management fee structure in 2023.
Item 11. Statement Regarding Basis for Approval of Investment Advisory Contract (continued)
With respect to the Sub-Adviser, the Board also considered, among other things, the sub-advisory fee schedule paid to the Sub-Adviser in light of the sub-advisory services provided to the respective Fund. In its review, the Board considered that the compensation paid to the Sub-Adviser is the responsibility of NFAL, not the Funds.
The Board’s considerations regarding the comparative fee data for each of the Funds are set forth below. With respect to the quartile rankings noted below, the first quartile represents the range of funds with the lowest management fee rate or net total expense ratio, as applicable, and the fourth quartile represents the range of funds with the highest management fee rate or net total expense ratio, as applicable. The Board considered that Broadridge only calculates quartiles if a minimum number of peers is available and therefore quartile rankings may not be available for certain Expense Groups and/or Expense Universes.
• For Nuveen Global Infrastructure Fund, the Fund’s contractual management fee rate, actual management fee rate and net total expense ratio each ranked in the third quartile of its Expense Group. In addition, although the Fund’s actual management fee rate ranked in the fourth quartile of its Expense Universe, the Fund’s contractual management fee rate and net total expense ratio ranked in the third quartile and second quartile of its Expense Universe, respectively. Further, although the Fund’s actual management fee rate was above the Expense Group median, the Fund’s net total expense ratio was generally in-line with the Expense Group median.
• For Nuveen Global Real Estate Securities Fund, the Fund’s contractual management fee rate, actual management fee rate and net total expense ratio ranked in the third quartile, second quartile and third quartile of its Expense Group, respectively. In addition, the Fund’s contractual management fee rate, actual management fee rate and net total expense ratio ranked in the third quartile, first quartile and third quartile of its Expense Universe, respectively. Further, although the Fund’s net total expense ratio was slightly above (within 5 basis points of) the Expense Group median, the Fund’s actual management fee rate was below the Expense Group median.
• For Nuveen Real Asset Income Fund, although the Fund’s net total expense ratio ranked in the fourth quartile of its Expense Group, the Fund’s contractual management fee rate and actual management fee rate ranked in the first quartile and third quartile of its Expense Group, respectively. In addition, the Fund’s contractual management fee rate, actual management fee rate and net total expense ratio ranked in the second quartile, third quartile and third quartile of its Expense Universe, respectively. Further, although the Fund’s net total expense ratio was above the Expense Group median, the Fund’s actual management fee rate was generally in-line with the Expense Group median.
• For Nuveen Real Estate Securities Fund, the Fund’s contractual management fee rate, actual management fee rate and net total expense ratio each ranked in the third quartile of its Expense Group and Expense Universe, respectively. In addition, although the Fund’s net total expense ratio was above the Expense Group median, the Fund’s actual management fee rate was slightly above (within 5 basis points of) the Expense Group median.
Based on its review of the information provided, the Board determined that each Fund’s management fees (as applicable) to a Fund Adviser were reasonable in light of the nature, extent and quality of services provided to the Fund.
2. Comparisons with the Fees of Other Clients
In evaluating the appropriateness of fees, the Board also considered that the Adviser, affiliated sub-advisers and/or their affiliate(s) provide investment management services to other types of clients which may include: separately managed accounts, retail managed accounts, foreign funds (UCITS), other investment companies (as sub-advisers), limited partnerships and collective investment trusts. The Board reviewed the equal weighted average fee or other fee data for the other types of clients managed in a similar manner to certain of the Nuveen funds and TC funds. The Board considered the Adviser’s rationale for the differences in the management fee rates of the funds compared to the management fee rates charged to these other types of clients. In this regard, the Board considered that differences, including but not limited to, the amount, type and level of services provided by the Adviser to the funds compared to that provided to other clients as well as differences in investment policies; regulatory, disclosure and governance requirements; servicing relationships with vendors; the manner of managing such assets; product structure; investor profiles; and account sizes all may contribute to variations in relative fee rates. Further, differences in the client base, governing bodies, distribution, jurisdiction and operational complexities also would contribute to variations in management fees assessed the funds compared to foreign fund clients. In addition, differences in the level of advisory services required for passively managed funds also contribute to differences in the management fee levels of such funds compared to actively managed funds. As a general matter, higher fee levels reflect higher levels of service provided by the Adviser, increased investment management complexity, greater product management requirements, and higher levels of business risk or some combination of these factors. The Board considered the wide range of services in addition to investment management that the Adviser had provided to the funds compared to other types of clients as well as the increased entrepreneurial, legal and regulatory risks that the Adviser incurs in sponsoring and managing the funds. The Board further considered that a sub-adviser’s fee is essentially for portfolio management services and therefore more comparable to the fees it receives for retail wrap accounts and other external sub-advisory mandates. The
Board concluded that the varying levels of fees were reasonable given, among other things, the more extensive services, regulatory requirements and legal liabilities, and the entrepreneurial, legal and regulatory risks incurred in sponsoring and advising a registered investment company compared to that required in advising other types of clients.
3. Profitability of Fund Advisers
In their review, the Board Members considered various profitability data relating to the Fund Advisers’ services to the Nuveen funds.
With respect to the Nuveen funds, the Board Members reviewed the estimated profitability information of Nuveen as a result of its advisory services to the Nuveen funds overall as well as profitability data of certain other asset management firms. Such profitability information included, among other things, gross and net revenue margins (excluding distribution) of Nuveen Investments, Inc. (“Nuveen Investments”) for services to the Nuveen funds on a pre-tax and after-tax basis for the 2023 and 2022 calendar years as well as the revenues earned (less
any expense reimbursements/fee waivers) and expenses incurred by Nuveen Investments for its advisory activities to the Nuveen funds (excluding distribution) for the 2023 and 2022 calendar years. The Board Members also considered the rationale for the change in Nuveen’s profitability from 2022 to 2023. In addition, the Board reviewed the revenues, expenses and operating margin (pre- and after-tax) NFAL derived from its exchange-traded fund product line for the 2023 and 2022 calendar years.
In developing the profitability data, the Board Members considered the subjective nature of calculating profitability as the information is not audited and is necessarily dependent on cost allocation methodologies to allocate expenses throughout the complex and among the various advisory products. Given there is no single universally recognized expense allocation methodology and that other reasonable and valid allocation methodologies could be employed and could lead to significantly different results, the Board reviewed, among other things, a description of the cost allocation methodologies employed to develop the financial information, a summary of the refinements Nuveen had made to the methodology that had occurred over the years from 2010 through 2021 to provide Nuveen’s profitability analysis, and a historical expense analysis of Nuveen Investments’ revenues, expenses and pre-tax net revenue margins derived from its advisory services to the Nuveen funds (excluding distribution) for the calendar years from 2017 through 2023. The Board of the Nuveen funds had also appointed two Board Members to serve as the Board’s liaisons to meet with representatives of NFAL and review the development of the profitability data and to report to the full Board.
In addition, the Board considered certain comparative operating margin data. In this regard, the Board reviewed the operating margins of Nuveen Investments compared to the adjusted operating margins of a peer group of asset management firms with publicly available data and the most comparable assets under management (based on asset size and asset composition) to Nuveen. The Board considered that the operating margins of the peers were adjusted generally to address that certain services provided by the peers were not provided by Nuveen. The Board also reviewed, among other things, the net revenue margins (pre-tax) of Nuveen Investments on a company-wide basis and the net revenue margins (pre-tax) of Nuveen Investments derived from its services to the Nuveen funds only (including and excluding distribution) compared to the adjusted operating margins of the peer group for each calendar year from 2014 to 2023. In their review of the comparative data, the Board Members considered the limitations of the comparative data given that peer data is not generally public and the calculation of profitability is subjective and affected by numerous factors (such as types of funds a peer manages, its business mix, its cost of capital, the numerous assumptions underlying the methodology used to allocate expenses and other factors) that can have a significant impact on the results.
Aside from the profitability data, the Board considered that NFAL and TAL are affiliates of Teachers Insurance and Annuity Association of America (“TIAA”). NFAL is a subsidiary of Nuveen, LLC, the investment management arm of TIAA, and TAL is an indirect wholly owned subsidiary of TIAA. Accordingly, the Board also reviewed a balance sheet for TIAA reflecting its assets, liabilities and capital and contingency reserves for the 2023 and 2022 calendar years to consider the financial strength of TIAA. The Board considered the benefit of an investment adviser and its parent with significant resources, particularly during periods of market volatility. The Board also considered the reinvestments the Adviser, its parent and/or other affiliates made into their business through, among other things, the investment of seed capital in certain funds, initiatives in international expansion, investments in infrastructure and continued investments in enhancements to technological capabilities.
The Board Members considered the profitability of the Sub-Adviser from its relationships with the respective Nuveen funds. In this regard, the Board Members reviewed, among other things, the Sub-Adviser’s revenues, expenses and net revenue margins (pre- and after-tax) for its advisory activities to the respective Nuveen funds for the calendar years ended December 31, 2023 and December 31, 2022. The Board Members also reviewed a profitability analysis reflecting the revenues, expenses and revenue margin (pre- and after-tax) grouped by similar types of funds (such as municipal, taxable fixed income, equity, real assets and index/asset allocation) for the Sub-Adviser for the calendar years ending December 31, 2023 and December 31, 2022.
In evaluating the reasonableness of the compensation, the Board Members also considered the indirect benefits NFAL or the Sub-Adviser received that were directly attributable to the management of the applicable funds as discussed in further detail below. Based on its review, the Board was satisfied that each Fund Adviser’s level of profitability from its relationship with each Nuveen fund was not unreasonable over various time frames in light of the nature, extent and quality of services provided.
D. Economies of Scale and Whether Fee Levels Reflect These Economies of Scale
Item 11. Statement Regarding Basis for Approval of Investment Advisory Contract (continued)
The Board considered whether there have been economies of scale with respect to the management of the funds in the fund complex, including the Funds, whether these economies of scale have been appropriately shared with such funds and whether there is potential for realization of further economies of scale. Although the Board considered that economies of scale are difficult to measure with any precision and the rates at which certain expenses are incurred may not decline with a rise in assets, the Board considered that there are various methods that may be employed to help share the benefits of economies of scale, including, among other things, through the use of breakpoints in the management fee schedule, fee waivers and/or expense limitations, the pricing of funds at scale at inception and investments in the Adviser’s business which can enhance the services provided to the applicable funds for the fees paid. The Board considered that the Adviser has generally employed one or more of these various methods among the applicable funds.
In this regard, the Board considered, as noted above, that the management fee of NFAL generally was comprised of a fund-level component and a complex-level component each with its own breakpoint schedule, subject to certain exceptions. With this structure, the Board considered that the complex-level breakpoint schedule was designed to deliver the benefits of economies of scale to shareholders when the assets of eligible funds in the complex pass certain thresholds even if the assets of a particular fund are unchanged or have declined, and the fund-level breakpoint schedules were designed to share economies of scale with shareholders if the particular fund grows. The Board reviewed the fund-level and complex-level fee schedules. As summarized above, the Board approved a new complex-level breakpoint schedule which would simplify and reduce the complex-level fee rates at various thresholds and expanded the eligible funds whose assets would be included in calculating the complex-level fee, effective May 1, 2024. Among other things, the assets of certain TC funds advised by TAL would be phased into the calculation of the complex-wide assets in determining the complex-level fee over a ten-year period. The Board considered the cost savings and additional potential sharing of economies of scale as a result of the reduced complex-level breakpoint schedule and the additional assets from more eligible funds in calculating the assets of the complex for determining the complex-level fee component. The Board reviewed the projected shareholder savings derived from such modifications over a ten-year period from 2024 to 2033. The Board considered management’s representation that there will be no increase to any fund’s respective advisory agreement fee rate.
In addition to the fund-level and complex-level fee schedules (if applicable), the Board Members considered the temporary and/or permanent expense caps (if any) applicable to a Fund. The Board considered that such waivers and reimbursements applicable to the respective funds are another means for potential economies of scale to be shared with shareholders of such funds and can provide a protection from an increase in expenses if the assets of the applicable funds decline.
The Board Members also considered the continued reinvestment in Nuveen/TIAA’s business to enhance its capabilities and services to the benefit of its various clients. The Board understood that many of these investments were not specific to individual funds, but rather incurred across a variety of products and services pursuant to which the family of funds as a whole may benefit. The Board further considered that the Adviser and its affiliates have provided certain additional services, including, but not limited to, services required by new regulations and regulatory interpretations, without raising advisory fees to the funds, and this was also a means of sharing economies of scale with the funds and their shareholders. The Board considered the Adviser’s and/or its affiliates’ ongoing efforts to streamline the product line-up, among other things, to create more scaled funds which may help improve both expense and trading economies.
Based on its review, the Board was satisfied that the current fee arrangements together with the reinvestment in management’s business appropriately shared any economies of scale with shareholders.
E. Indirect Benefits
The Board Members received and considered information regarding various indirect benefits the respective Fund Adviser or its affiliates may receive as a result of their relationship with the funds in the fund complex, including the Funds. These benefits included, among other things, economies of scale to the extent the Adviser or its affiliates share investment resources and/or personnel with other clients of the Adviser. The funds may also be used as investment options for other products or businesses offered by the Adviser and/or its affiliates, such as variable products, fund of funds and 529 education savings plans, and affiliates of the Adviser may serve as sub-advisers to various funds in which case all advisory and sub-advisory fees generated by such funds stay within Nuveen.
Further, the funds may pay the Adviser and/or its affiliates for other services, such as distribution. In this regard, the Board Members considered that an affiliate of the Adviser serves as principal underwriter providing distribution and/or shareholder services to the open-end funds for which it may be compensated. The Board Members also considered that certain share classes of the open-end funds (subject to certain exceptions) pay 12b-1 fees, some of which may be retained by the Adviser’s affiliate. In addition, the Board Members considered that the Adviser and Sub-Adviser may utilize soft dollar brokerage arrangements attributable to the respective funds to obtain research and other services for any or all of their clients, although the Board Members also considered reimbursements of such costs by the Adviser and/or Sub-Adviser.
The Adviser and its affiliates may also benefit from the advisory relationships with the funds in the fund complex to the extent this relationship results in potential investors viewing the TIAA group of companies as a leading retirement plan provider in the academic and nonprofit market and a single source for all their financial service needs. The Adviser and/or its affiliates may further benefit to the extent that they have pricing or other information regarding vendors the funds utilize in establishing arrangements with such vendors for other products.
Based on its review, the Board concluded that any indirect benefits received by a Fund Adviser as a result of its relationship with the Funds were reasonable in light of the services provided.
F. Other Considerations
The Board Members did not identify any single factor discussed previously as all-important or controlling. The Board Members concluded that the terms of each Advisory Agreement were reasonable, that the respective Fund Adviser’s fees were reasonable in light of the services provided to each Fund and that the Advisory Agreements be renewed for an additional one-year period.
| Item 12. | Disclosure of Proxy Voting Policies and Procedures for Closed-End Management Investment Companies. |
Not applicable to open-end investment companies.
| Item 13. | Portfolio Managers of Closed-End Management Investment Companies. |
Not applicable to open-end investment companies.
| Item 14. | Purchases of Equity Securities by Closed-End Management Investment Company and Affiliated Purchasers. |
Not applicable to open-end investment companies.
| Item 15. | Submission of Matters to a Vote of Security Holders. |
There have been no material changes to the procedures by which shareholders may recommend nominees to the registrant’s Board of Trustees implemented after the registrant last provided disclosure in response to this Item.
| Item 16. | Controls and Procedures. |
| (a) | The registrant’s principal executive and principal financial officers, or persons performing similar functions, have concluded that the registrant’s disclosure controls and procedures (as defined in Rule 30a-3(c) under the Investment Company Act of 1940, as amended (the “1940 Act”) (17 CFR 270.30a-3(c))) are effective, as of a date within 90 days of the filing date of this report that includes the disclosure required by this paragraph, based on their evaluation of the controls and procedures required by Rule 30a-3(b) under the 1940 Act (17 CFR 270.30a-3(b)) and Rules 13a-15(b) or 15d-15(b) under the Securities Exchange Act of 1934, as amended (the “Exchange Act”) (17 CFR 240.13a-15(b) or 240.15d-15(b)). |
| (b) | There were no changes in the registrant’s internal control over financial reporting (as defined in Rule 30a-3(d) under the 1940 Act (17 CFR 270.30a-3(d)) that occurred during the period covered by this report that has materially affected, or is reasonably likely to materially affect, the registrant’s internal control over financial reporting. |
| Item 17. | Disclosure of Securities Lending Activities for Closed-End Management Investment Companies. |
| (a) | Not applicable to open-end investment companies. |
| (b) | Not applicable to open-end investment companies. |
| Item 18. | Recovery of Erroneously Awarded Compensation. |
| (a)(1) | Not applicable to this filing. |
| (a)(2) | Not applicable to this filing. |
SIGNATURES
Pursuant to the requirements of the Securities Exchange Act of 1934 and the Investment Company Act of 1940, the registrant has duly caused this report to be signed on its behalf by the undersigned, thereunto duly authorized.
Nuveen Investment Trust V
| | | | | | |
| Date: September 5, 2024 | | | | | | By: /s/ Jordan M. Farris |
| | | | | | Jordan M. Farris |
| | | | | | Chief Administrative Officer |
Pursuant to the requirements of the Securities Exchange Act of 1934 and the Investment Company Act of 1940, this report has been signed below by the following persons on behalf of the registrant and in the capacities and on the dates indicated.
| | | | | | |
| Date: September 5, 2024 | | | | | | By: /s/ Jordan M. Farris |
| | | | | | Jordan M. Farris |
| | | | | | Chief Administrative Officer (principal executive officer) |
| | | |
| Date: September 5, 2024 | | | | | | By: /s/ E. Scott Wickerham |
| | | | | | E. Scott Wickerham |
| | | | | | Vice President and Controller (principal financial officer) |