Investor presentation TRISTATE CAPITAL HOLDINGS, INC. (NASDAQ: TSC) Fourth quarter ended December 31, 2018
Important Information About this presentation Financial information and data: Unless noted otherwise herein, income statement data is for the trailing twelve-months ended December 31, 2018, compared to the same TTM period the year prior; and balance sheet data is as of December 31, 2018, compared to one year prior. Forward looking statements: This presentation may contain “forward-looking” statements. Such forward-looking statements are subject to risks that could cause actual results or outcomes to differ materially from those currently anticipated. TriState Capital has no duty to, and does not intend to, update or revise forward-looking statements after the date on which they are made. For further information about the factors that could affect TriState Capital’s future results, please see the company’s most recent annual and quarterly reports filed on Form 10-K and Form 10-Q. Non-GAAP measures: To the extent non-GAAP financial measures are presented herein, comparable GAAP measures and reconciliations can be found in TriState Capital’s most recent quarterly financial results news release. 2 Investor presentation
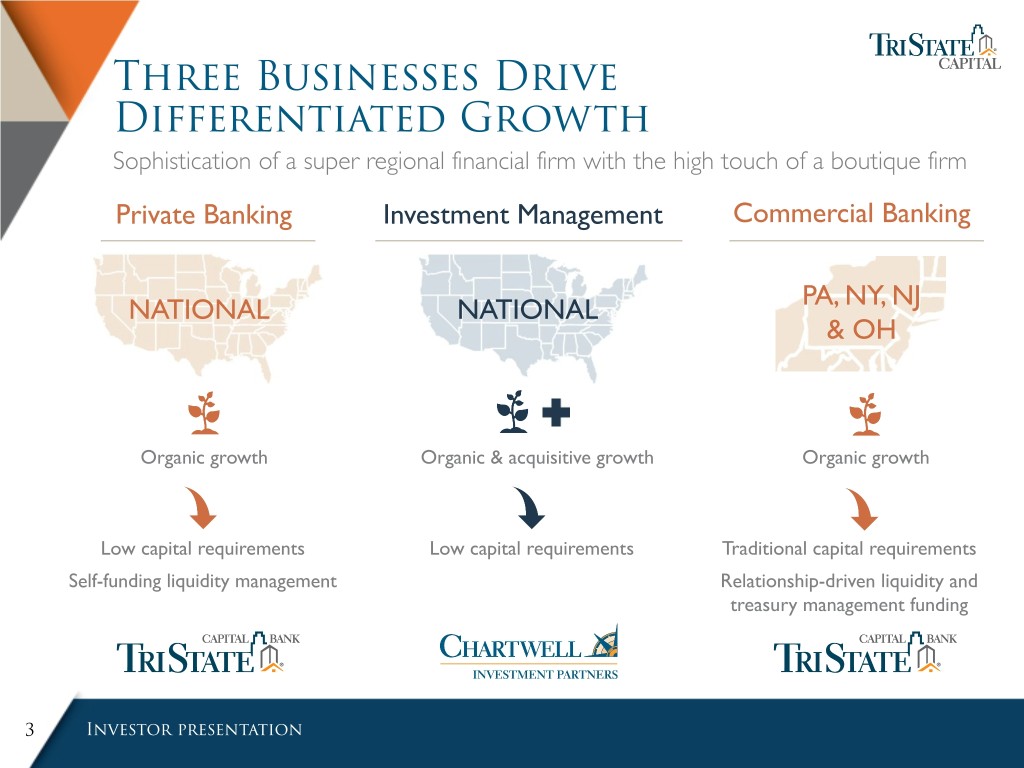
Three Businesses Drive Differentiated Growth Sophistication of a super regional financial firm with the high touch of a boutique firm Private Banking Investment Management Commercial Banking NATIONAL NATIONAL PA, NY, NJ & OH Organic growth Organic & acquisitive growth Organic growth Low capital requirements Low capital requirements Traditional capital requirements Self-funding liquidity management Relationship-driven liquidity and treasury management funding 3 Investor presentation
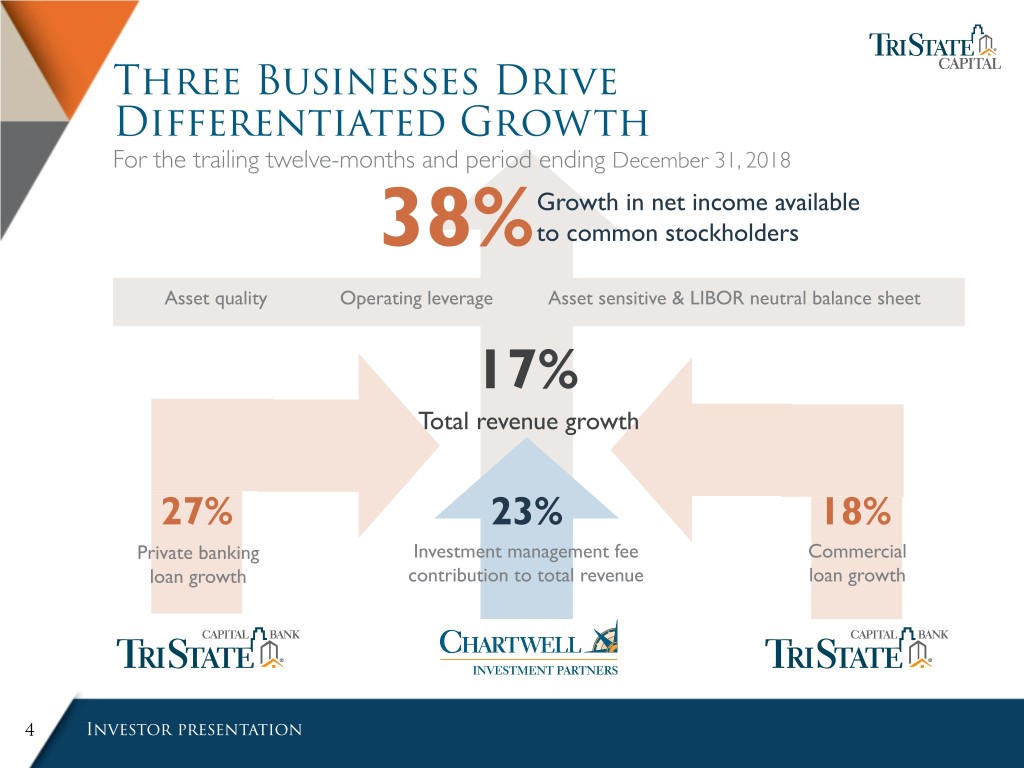
Three Businesses Drive Differentiated Growth For the trailing twelve-months and period ending December 31, 2018 Growth in net income available 38% to common stockholders Asset quality Operating leverage Asset sensitive & LIBOR neutral balance sheet 17% Total revenue growth 27% 23% 18% Private banking Investment management fee Commercial loan growth contribution to total revenue loan growth 4 Investor presentation
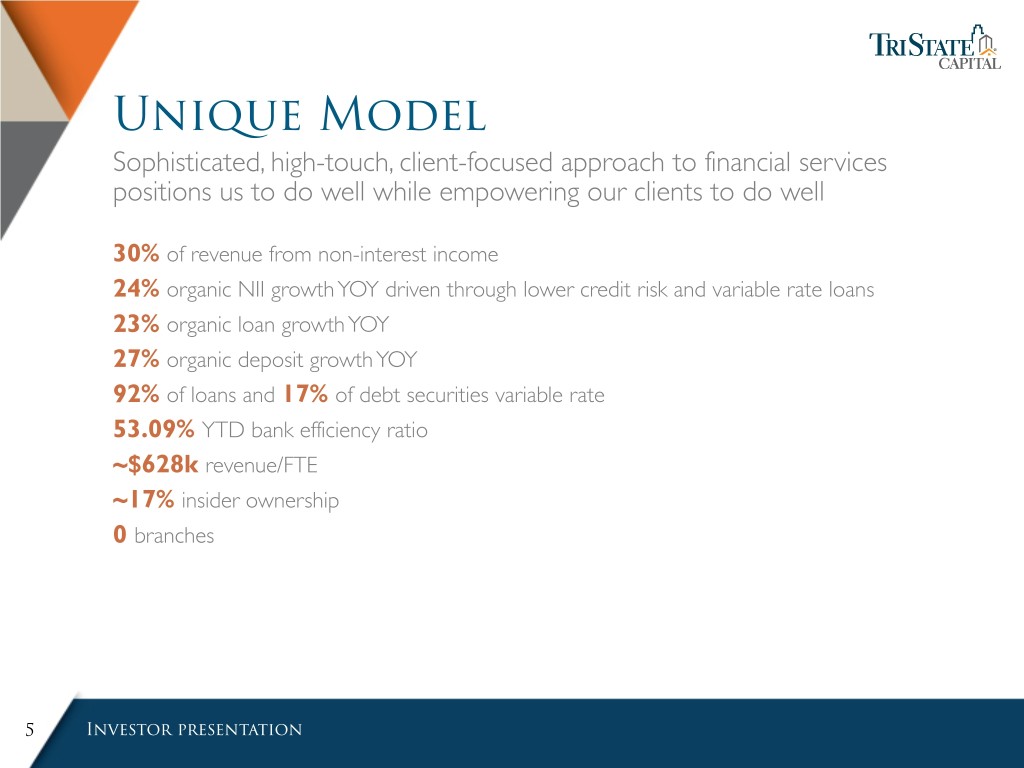
Unique Model Sophisticated, high-touch, client-focused approach to financial services positions us to do well while empowering our clients to do well 30% of revenue from non-interest income 24% organic NII growth YOY driven through lower credit risk and variable rate loans 23% organic loan growth YOY 27% organic deposit growth YOY 92% of loans and 17% of debt securities variable rate 53.09% YTD bank efficiency ratio ~$628k revenue/FTE ~17% insider ownership 0 branches 5 Investor presentation
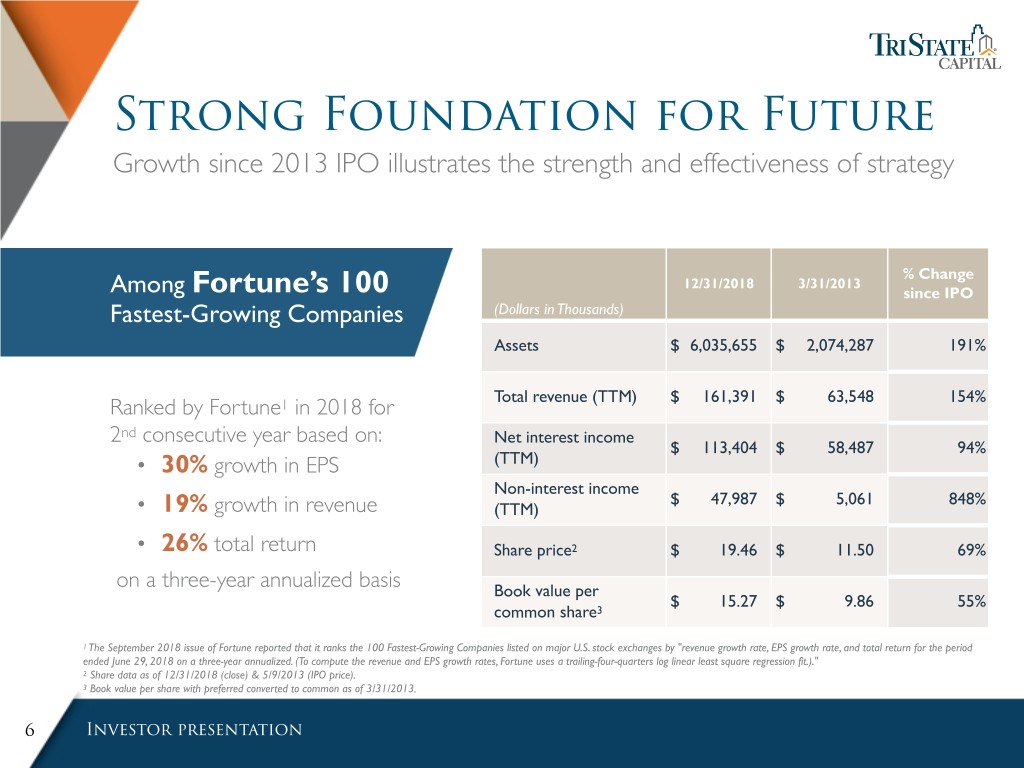
Strong Foundation for Future Growth since 2013 IPO illustrates the strength and effectiveness of strategy % Change 12/31/2018 3/31/2013 Among Fortune’s 100 since IPO Fastest-Growing Companies (Dollars in Thousands) Assets $ 6,035,655 $ 2,074,287 191% Total revenue (TTM) $ 161,391 $ 63,548 154% Ranked by Fortune1 in 2018 for 2nd consecutive year based on: Net interest income $ 113,404 $ 58,487 94% • 30% growth in EPS (TTM) Non-interest income $ 47,987 $ 5,061 848% • 19% growth in revenue (TTM) • 26% total return Share price2 $ 19.46 $ 11.50 69% on a three-year annualized basis Book value per $ 15.27 $ 9.86 55% common share3 1 The September 2018 issue of Fortune reported that it ranks the 100 Fastest-Growing Companies listed on major U.S. stock exchanges by "revenue growth rate, EPS growth rate, and total return for the period ended June 29, 2018 on a three-year annualized. (To compute the revenue and EPS growth rates, Fortune uses a trailing-four-quarters log linear least square regression fit.)." 2 Share data as of 12/31/2018 (close) & 5/9/2013 (IPO price). 3 Book value per share with preferred converted to common as of 3/31/2013. 6 Investor presentation
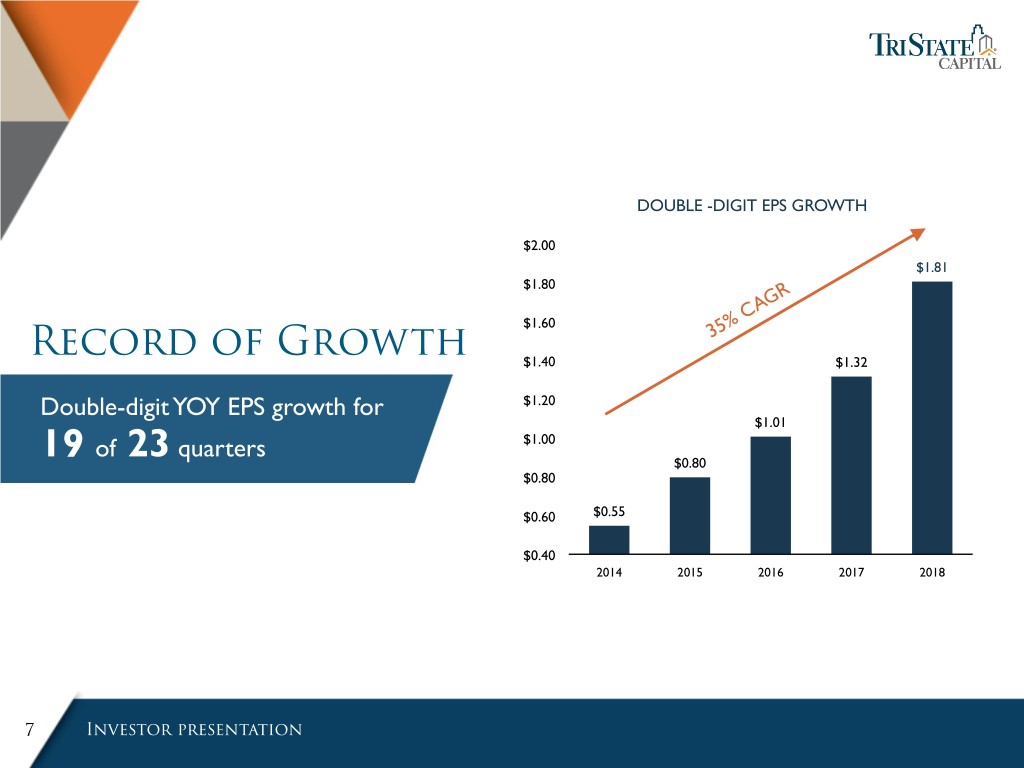
DOUBLE -DIGIT EPS GROWTH $2.00 $1.81 $1.80 $1.60 CAGR 35% Record of Growth $1.40 $1.32 Double-digit YOY EPS growth for $1.20 $1.01 of quarters $1.00 19 23 $0.80 $0.80 $0.60 $0.55 $0.40 2014 2015 2016 2017 2018 7 Investor presentation
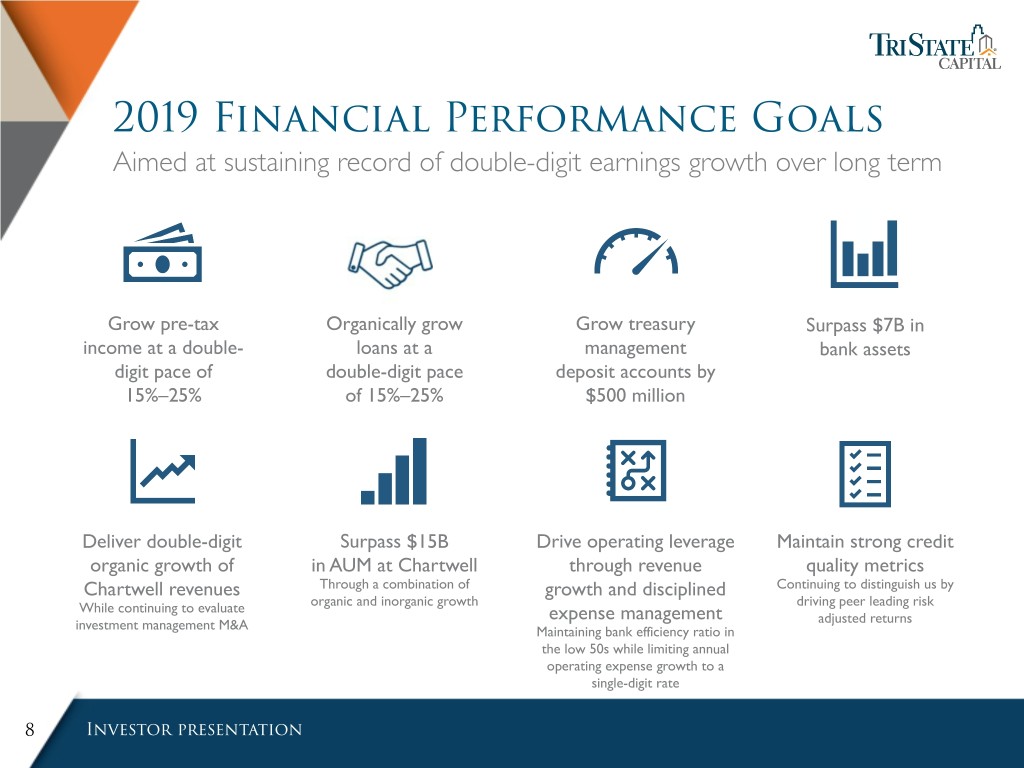
2019 Financial Performance Goals Aimed at sustaining record of double-digit earnings growth over long term Grow pre-tax Organically grow Grow treasury Surpass $7B in income at a double- loans at a management bank assets digit pace of double-digit pace deposit accounts by 15%–25% of 15%–25% $500 million Deliver double-digit Surpass $15B Drive operating leverage Maintain strong credit organic growth of in AUM at Chartwell through revenue quality metrics Chartwell revenues Through a combination of growth and disciplined Continuing to distinguish us by While continuing to evaluate organic and inorganic growth driving peer leading risk expense management adjusted returns investment management M&A Maintaining bank efficiency ratio in the low 50s while limiting annual operating expense growth to a single-digit rate 8 Investor presentation

Private Banking TriState Capital’s fastest-growing channel for lending PRIVATE BANKING LOANS Private banking loans are over- collateralized by marketable securities, $3.5 cash value life insurance policies or cash, all monitored utilizing the bank’s $3.0 $2.870 proprietary technology CAGR $2.5 31% • No loss history to date on $2.266 these loans $2.0 s n $1.736 o i l l i Favorable regulatory capital treatment B $1.5 given reduced risk weighting enhances $1.345 capital efficiency $0.989 $1.0 Marketable securities collateral consist of $0.5 liquid and primarily well-diversified portfolios $0.0 2014 2015 2016 2017 2018 9 Investor presentation
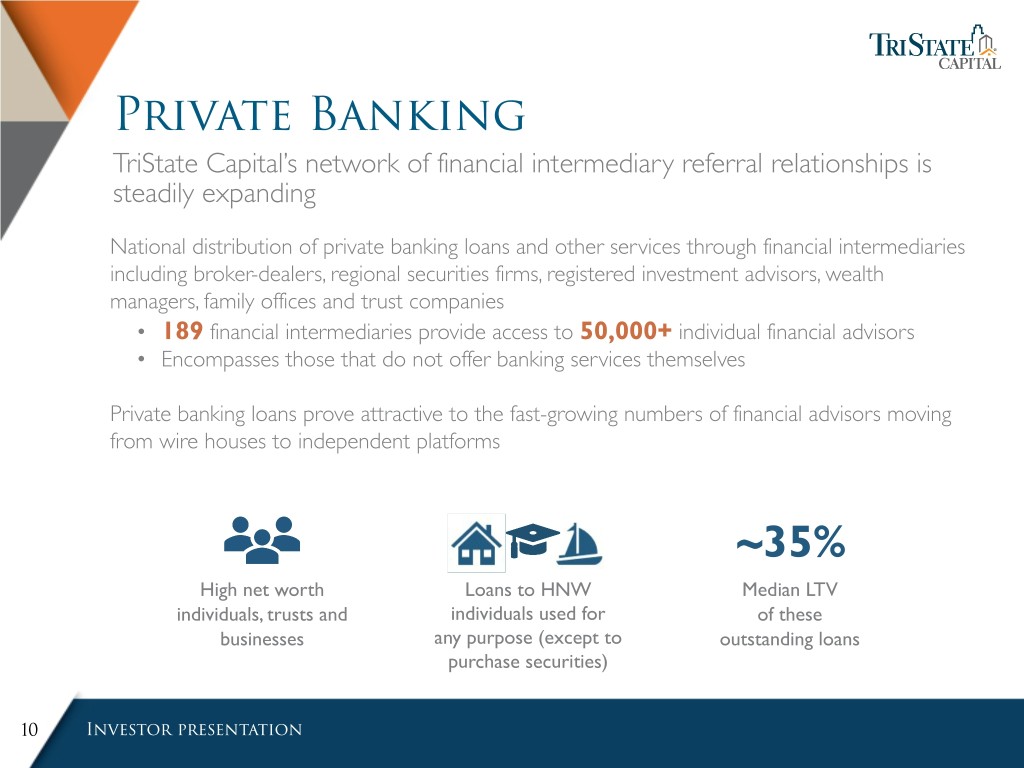
Private Banking TriState Capital’s network of financial intermediary referral relationships is steadily expanding National distribution of private banking loans and other services through financial intermediaries including broker-dealers, regional securities firms, registered investment advisors, wealth managers, family offices and trust companies • 189 financial intermediaries provide access to 50,000+ individual financial advisors • Encompasses those that do not offer banking services themselves Private banking loans prove attractive to the fast-growing numbers of financial advisors moving from wire houses to independent platforms ~35% High net worth Loans to HNW Median LTV individuals, trusts and individuals used for of these businesses any purpose (except to outstanding loans purchase securities) 10 Investor presentation
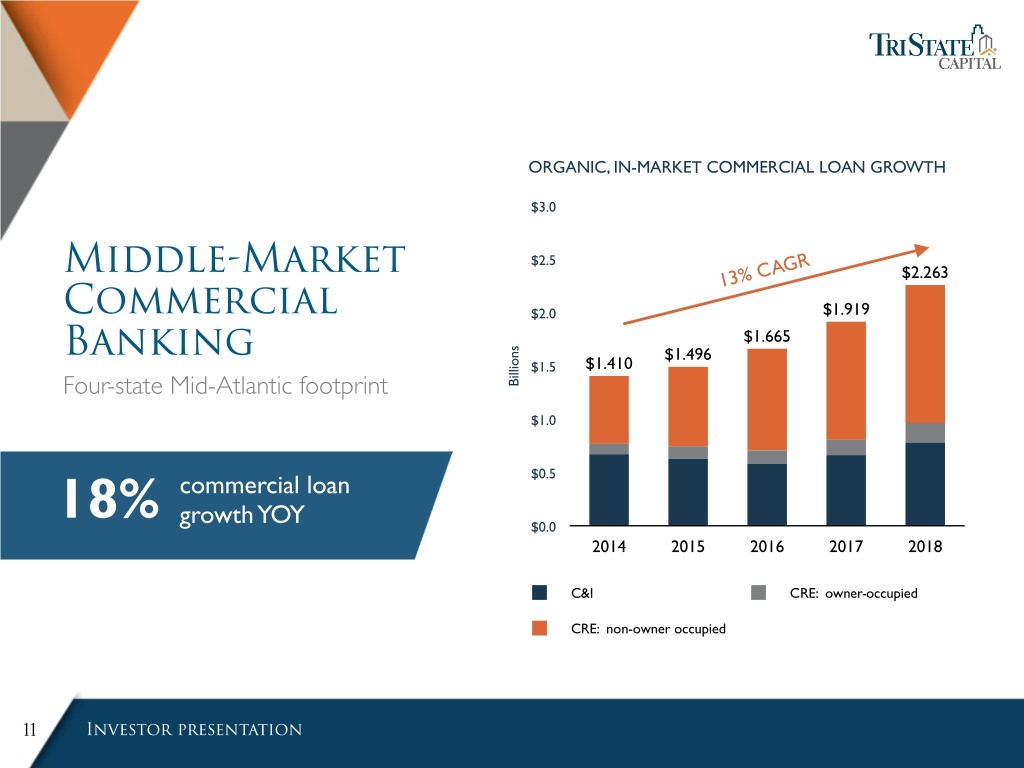
ORGANIC, IN-MARKET COMMERCIAL LOAN GROWTH $3.0 Middle-Market $2.5 13% CAGR $2.263 Commercial $2.0 $1.919 $1.665 s Banking n $1.496 o i l $1.5 $1.410 l i Four-state Mid-Atlantic footprint B $1.0 commercial loan $0.5 18% growth YOY $0.0 2014 2015 2016 2017 2018 C&I CRE: owner-occupied CRE: non-owner occupied 11 Investor presentation
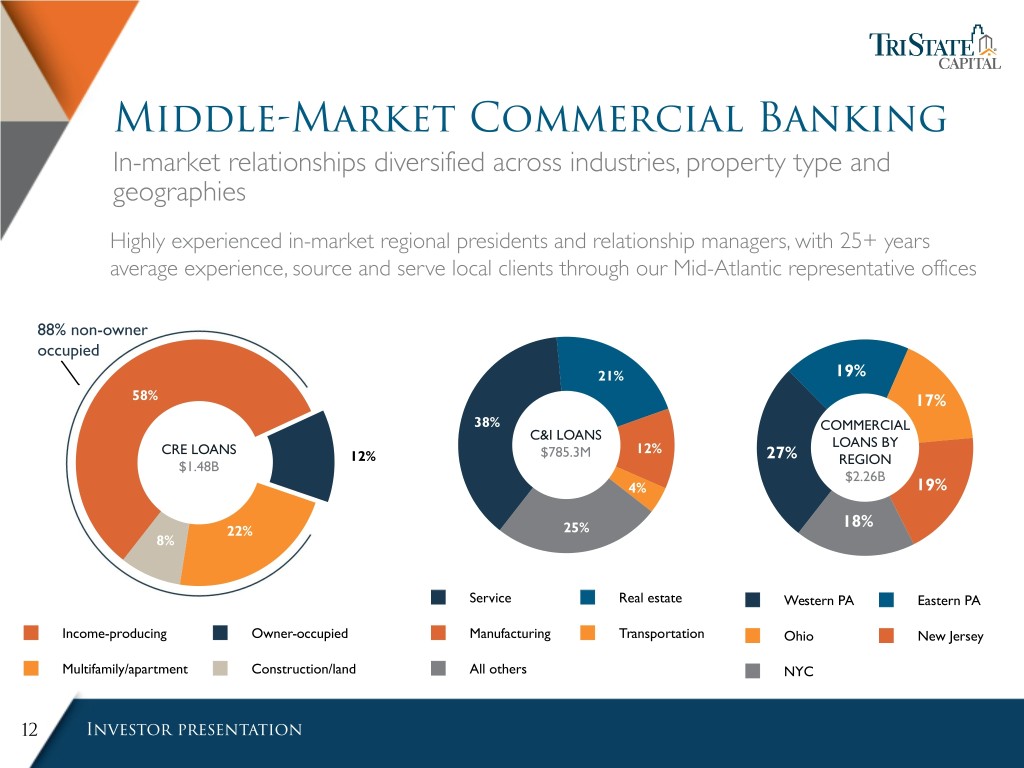
Middle-Market Commercial Banking In-market relationships diversified across industries, property type and geographies Highly experienced in-market regional presidents and relationship managers, with 25+ years average experience, source and serve local clients through our Mid-Atlantic representative offices 88% non-owner occupied 21% 19% 58% 17% 38% COMMERCIAL C&I LOANS 12% LOANS BY CRE LOANS 12% $785.3M 27% $1.48B REGION $2.26B 4% 19% 18% 22% 25% 8% Service Real estate Western PA Eastern PA Income-producing Owner-occupied Manufacturing Transportation Ohio New Jersey Multifamily/apartment Construction/land All others NYC 12 Investor presentation
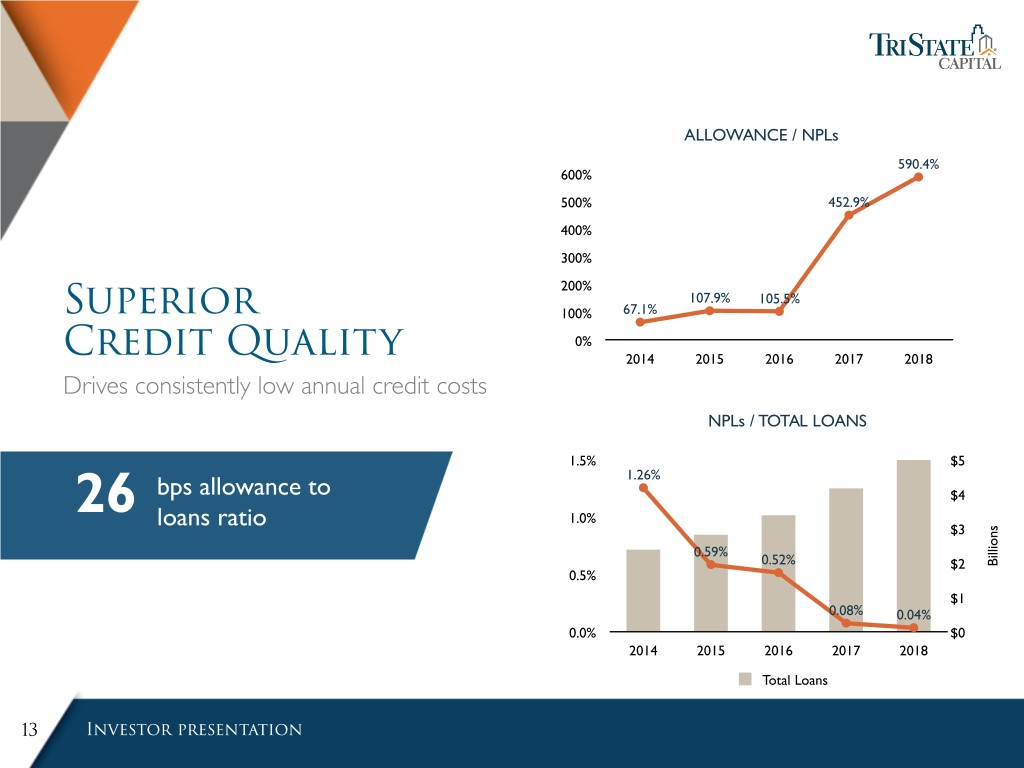
ALLOWANCE / NPLs 590.4% 600% 500% 452.9% 400% 300% 200% 107.9% 105.5% Superior 100% 67.1% 0% Credit Quality 2014 2015 2016 2017 2018 Drives consistently low annual credit costs NPLs / TOTAL LOANS 1.5% $5 bps allowance to 1.26% 26 $4 1.0% loans ratio $3 s n o i l l 0.59% i 0.52% $2 B 0.5% $1 0.08% 0.04% 0.0% $0 2014 2015 2016 2017 2018 Total Loans 13 Investor presentation
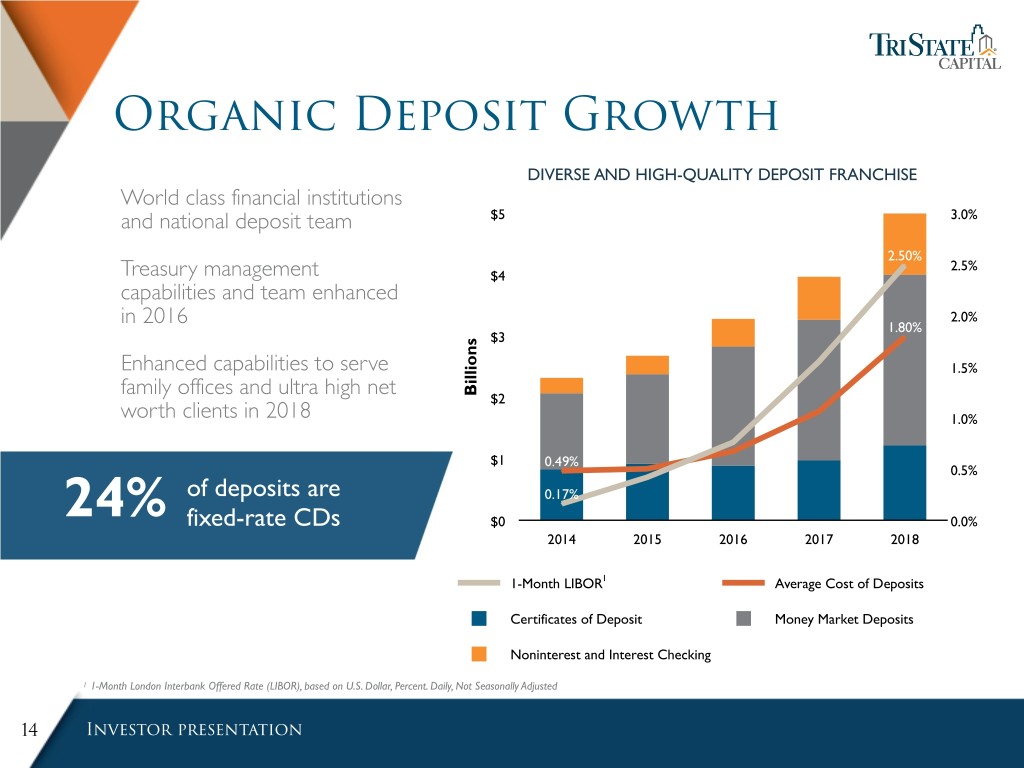
Organic Deposit Growth DIVERSE AND HIGH-QUALITY DEPOSIT FRANCHISE World class financial institutions and national deposit team $5 3.0% 2.50% 2.5% Treasury management $4 capabilities and team enhanced 2.0% in 2016 1.80% $3 s n o i Enhanced capabilities to serve l 1.5% l i family offices and ultra high net B $2 worth clients in 2018 1.0% $1 0.49% 0.5% of deposits are 0.17% 24% fixed-rate CDs $0 0.0% 2014 2015 2016 2017 2018 1-Month LIBOR1 Average Cost of Deposits Certificates of Deposit Money Market Deposits Noninterest and Interest Checking 1 1-Month London Interbank Offered Rate (LIBOR), based on U.S. Dollar, Percent. Daily, Not Seasonally Adjusted 14 Investor presentation

Treasury Management a Strategic Priority Investments in best-in-class technology and talent beginning in 2016 are paying off for our clients and our business • Doubled treasury management deposits over last 18 months • 12 dedicated professionals across regional footprint • Sophisticated and high touch service combined with transparent fee structures driving growth with existing clients and rapid expansion of new clients • ~500 clients and growing, including deposit-only clients with essential need for treasury management services 15 Investor presentation
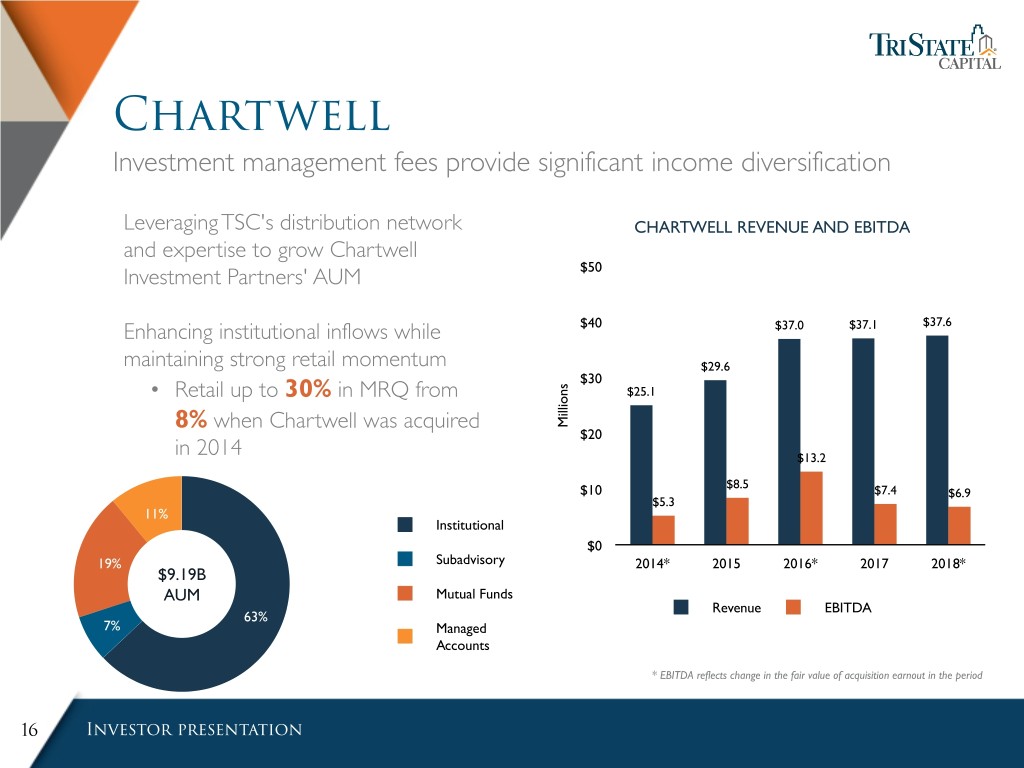
Chartwell Investment management fees provide significant income diversification Leveraging TSC's distribution network CHARTWELL REVENUE AND EBITDA and expertise to grow Chartwell Investment Partners' AUM $50 Enhancing institutional inflows while $40 $37.0 $37.1 $37.6 maintaining strong retail momentum $29.6 $30 s • Retail up to 30% in MRQ from n $25.1 o i l l i 8% when Chartwell was acquired M $20 in 2014 $13.2 $8.5 $10 $7.4 $6.9 $5.3 11% Institutional $0 19% Subadvisory 2014* 2015 2016* 2017 2018* $9.19B AUM Mutual Funds Revenue EBITDA 63% 7% Managed Accounts * EBITDA reflects change in the fair value of acquisition earnout in the period 16 Investor presentation
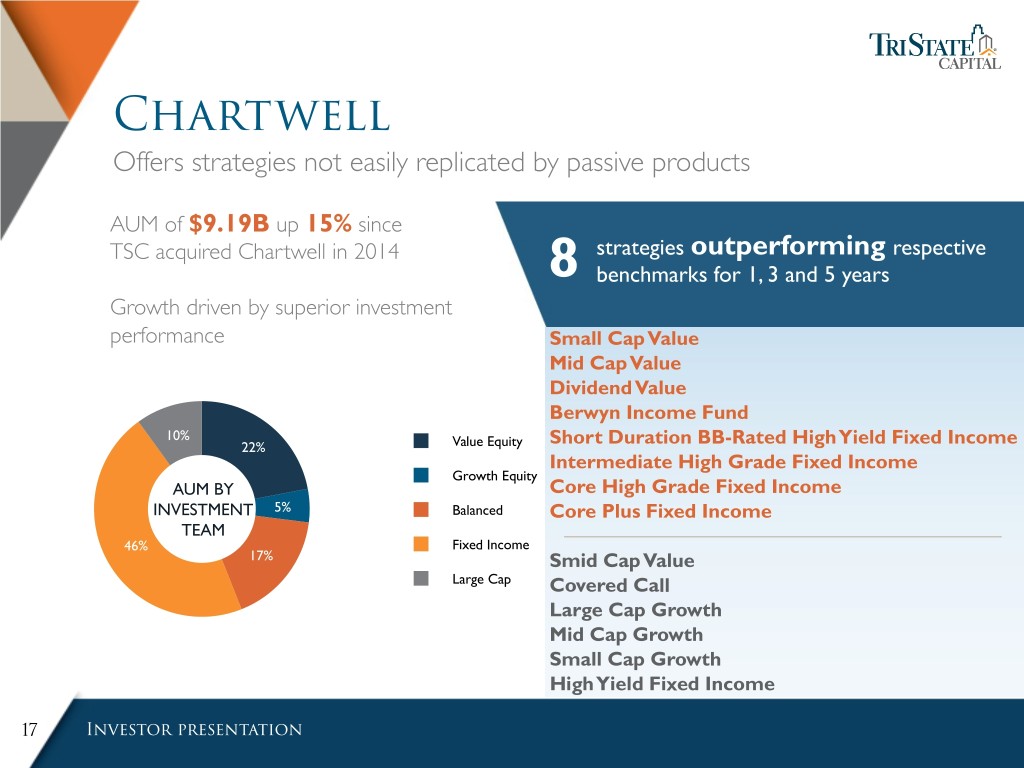
Chartwell Offers strategies not easily replicated by passive products AUM of $9.19B up 15% since TSC acquired Chartwell in 2014 strategies outperforming respective 8 benchmarks for 1, 3 and 5 years Growth driven by superior investment performance Small Cap Value Mid Cap Value Dividend Value Berwyn Income Fund 10% 22% Value Equity Short Duration BB-Rated High Yield Fixed Income Intermediate High Grade Fixed Income Growth Equity AUM BY Core High Grade Fixed Income INVESTMENT 5% Balanced Core Plus Fixed Income TEAM 46% Fixed Income 17% Smid Cap Value Large Cap Covered Call Large Cap Growth Mid Cap Growth Small Cap Growth High Yield Fixed Income 17 Investor presentation
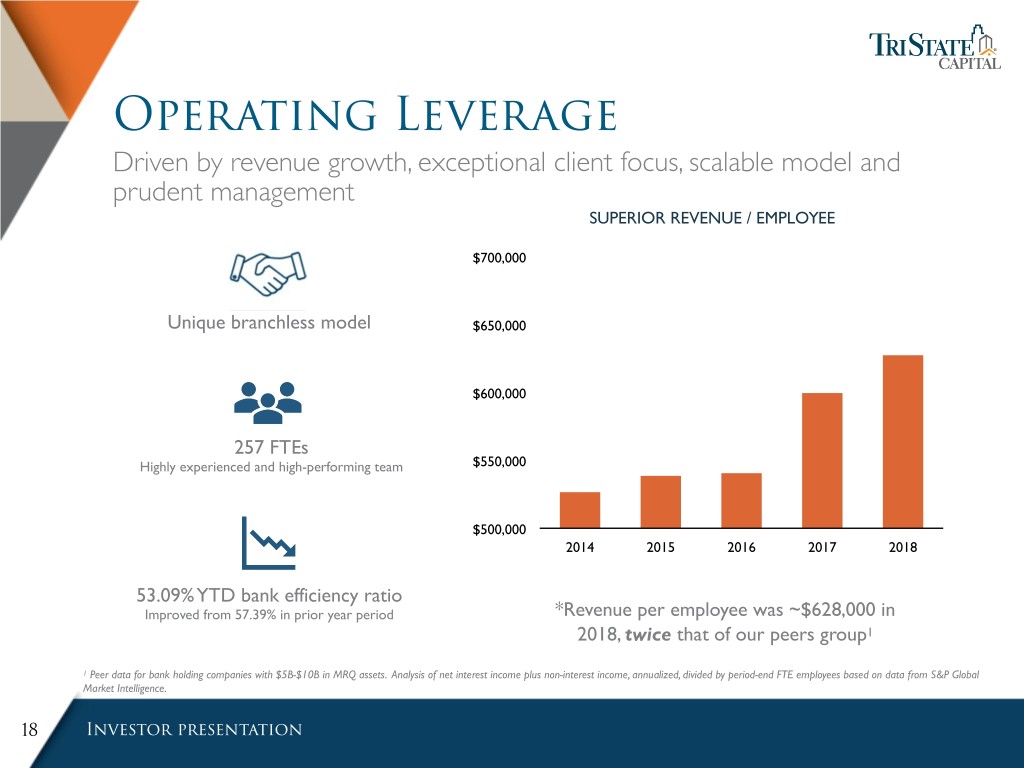
Operating Leverage Driven by revenue growth, exceptional client focus, scalable model and prudent management SUPERIOR REVENUE / EMPLOYEE $700,000 Unique branchless model $650,000 $600,000 257 FTEs Highly experienced and high-performing team $550,000 $500,000 2014 2015 2016 2017 2018 53.09% YTD bank efficiency ratio Improved from 57.39% in prior year period *Revenue per employee was ~$628,000 in 2018, twice that of our peers group1 1 Peer data for bank holding companies with $5B-$10B in MRQ assets. Analysis of net interest income plus non-interest income, annualized, divided by period-end FTE employees based on data from S&P Global Market Intelligence. 18 Investor presentation
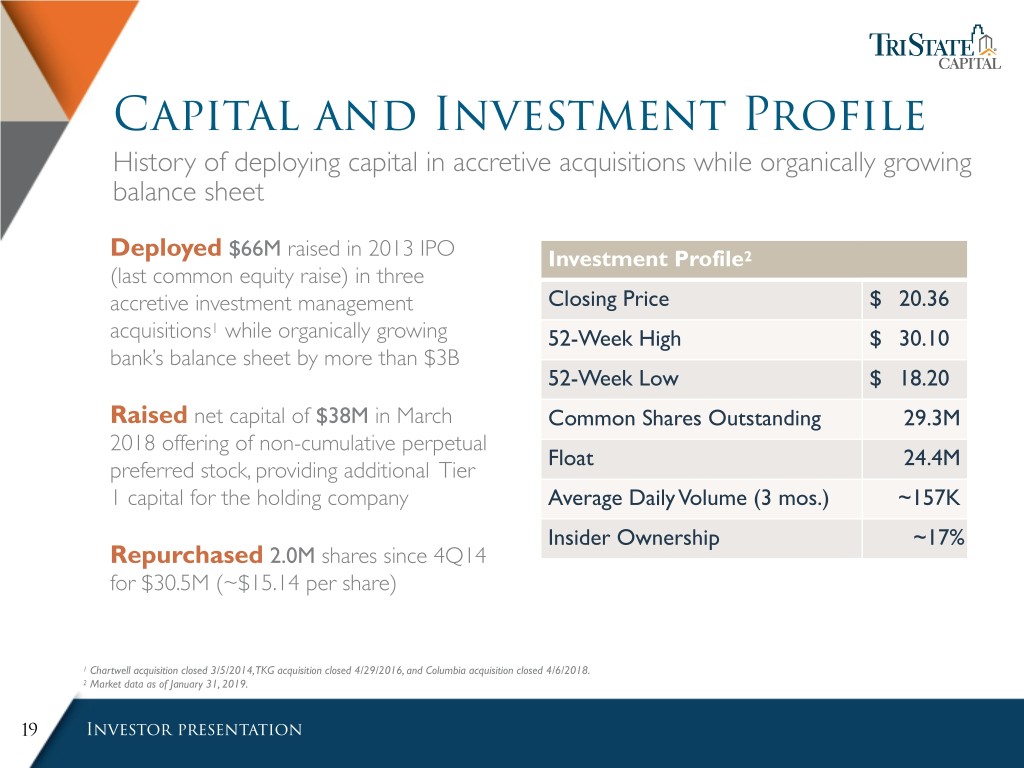
Capital and Investment Profile History of deploying capital in accretive acquisitions while organically growing balance sheet Deployed $66M raised in 2013 IPO Investment Profile2 (last common equity raise) in three accretive investment management Closing Price $ 20.36 acquisitions1 while organically growing 52-Week High $ 30.10 bank’s balance sheet by more than $3B 52-Week Low $ 18.20 Raised net capital of $38M in March Common Shares Outstanding 29.3M 2018 offering of non-cumulative perpetual Float 24.4M preferred stock, providing additional Tier 1 capital for the holding company Average Daily Volume (3 mos.) ~157K Insider Ownership ~17% Repurchased 2.0M shares since 4Q14 for $30.5M (~$15.14 per share) 1 Chartwell acquisition closed 3/5/2014, TKG acquisition closed 4/29/2016, and Columbia acquisition closed 4/6/2018. 2 Market data as of January 31, 2019. 19 Investor presentation
appendix 20 Investor presentation
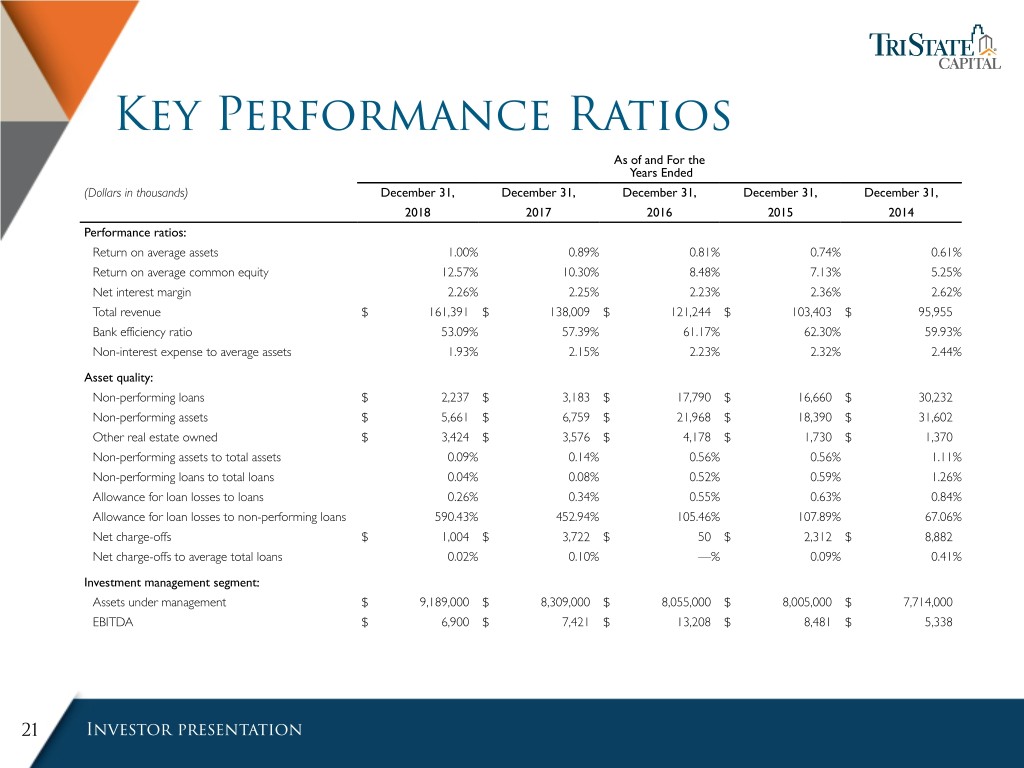
Key Performance Ratios As of and For the Years Ended (Dollars in thousands) December 31, December 31, December 31, December 31, December 31, 2018 2017 2016 2015 2014 Performance ratios: Return on average assets 1.00% 0.89% 0.81% 0.74% 0.61% Return on average common equity 12.57% 10.30% 8.48% 7.13% 5.25% Net interest margin 2.26% 2.25% 2.23% 2.36% 2.62% Total revenue $ 161,391 $ 138,009 $ 121,244 $ 103,403 $ 95,955 Bank efficiency ratio 53.09% 57.39% 61.17% 62.30% 59.93% Non-interest expense to average assets 1.93% 2.15% 2.23% 2.32% 2.44% Asset quality: Non-performing loans $ 2,237 $ 3,183 $ 17,790 $ 16,660 $ 30,232 Non-performing assets $ 5,661 $ 6,759 $ 21,968 $ 18,390 $ 31,602 Other real estate owned $ 3,424 $ 3,576 $ 4,178 $ 1,730 $ 1,370 Non-performing assets to total assets 0.09% 0.14% 0.56% 0.56% 1.11% Non-performing loans to total loans 0.04% 0.08% 0.52% 0.59% 1.26% Allowance for loan losses to loans 0.26% 0.34% 0.55% 0.63% 0.84% Allowance for loan losses to non-performing loans 590.43% 452.94% 105.46% 107.89% 67.06% Net charge-offs $ 1,004 $ 3,722 $ 50 $ 2,312 $ 8,882 Net charge-offs to average total loans 0.02% 0.10% —% 0.09% 0.41% Investment management segment: Assets under management $ 9,189,000 $ 8,309,000 $ 8,055,000 $ 8,005,000 $ 7,714,000 EBITDA $ 6,900 $ 7,421 $ 13,208 $ 8,481 $ 5,338 21 Investor presentation
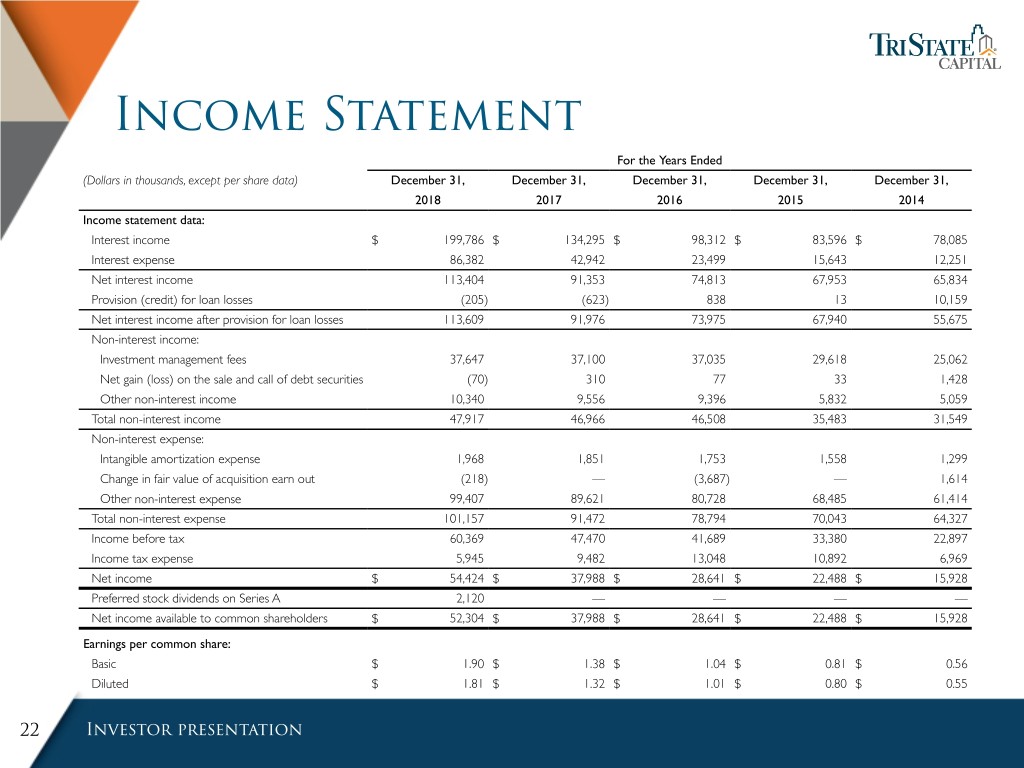
Income Statement For the Years Ended (Dollars in thousands, except per share data) December 31, December 31, December 31, December 31, December 31, 2018 2017 2016 2015 2014 Income statement data: Interest income $ 199,786 $ 134,295 $ 98,312 $ 83,596 $ 78,085 Interest expense 86,382 42,942 23,499 15,643 12,251 Net interest income 113,404 91,353 74,813 67,953 65,834 Provision (credit) for loan losses (205) (623) 838 13 10,159 Net interest income after provision for loan losses 113,609 91,976 73,975 67,940 55,675 Non-interest income: Investment management fees 37,647 37,100 37,035 29,618 25,062 Net gain (loss) on the sale and call of debt securities (70) 310 77 33 1,428 Other non-interest income 10,340 9,556 9,396 5,832 5,059 Total non-interest income 47,917 46,966 46,508 35,483 31,549 Non-interest expense: Intangible amortization expense 1,968 1,851 1,753 1,558 1,299 Change in fair value of acquisition earn out (218) — (3,687) — 1,614 Other non-interest expense 99,407 89,621 80,728 68,485 61,414 Total non-interest expense 101,157 91,472 78,794 70,043 64,327 Income before tax 60,369 47,470 41,689 33,380 22,897 Income tax expense 5,945 9,482 13,048 10,892 6,969 Net income $ 54,424 $ 37,988 $ 28,641 $ 22,488 $ 15,928 Preferred stock dividends on Series A 2,120 — — — — Net income available to common shareholders $ 52,304 $ 37,988 $ 28,641 $ 22,488 $ 15,928 Earnings per common share: Basic $ 1.90 $ 1.38 $ 1.04 $ 0.81 $ 0.56 Diluted $ 1.81 $ 1.32 $ 1.01 $ 0.80 $ 0.55 22 Investor presentation
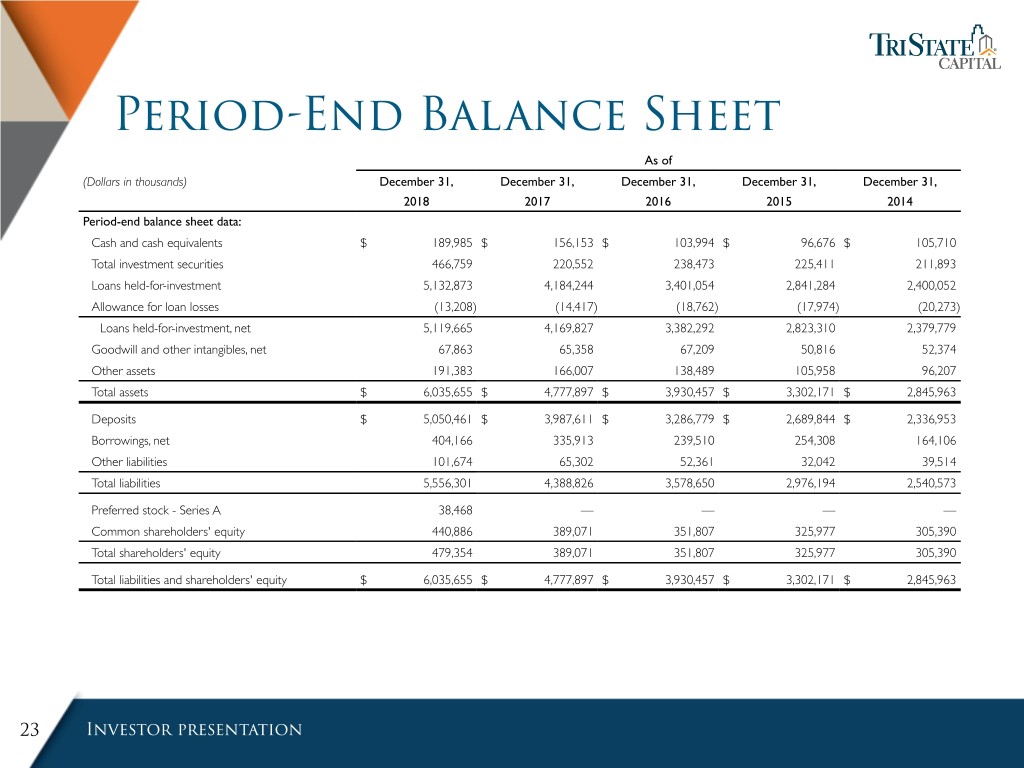
Period-End Balance Sheet As of (Dollars in thousands) December 31, December 31, December 31, December 31, December 31, 2018 2017 2016 2015 2014 Period-end balance sheet data: Cash and cash equivalents $ 189,985 $ 156,153 $ 103,994 $ 96,676 $ 105,710 Total investment securities 466,759 220,552 238,473 225,411 211,893 Loans held-for-investment 5,132,873 4,184,244 3,401,054 2,841,284 2,400,052 Allowance for loan losses (13,208) (14,417) (18,762) (17,974) (20,273) Loans held-for-investment, net 5,119,665 4,169,827 3,382,292 2,823,310 2,379,779 Goodwill and other intangibles, net 67,863 65,358 67,209 50,816 52,374 Other assets 191,383 166,007 138,489 105,958 96,207 Total assets $ 6,035,655 $ 4,777,897 $ 3,930,457 $ 3,302,171 $ 2,845,963 Deposits $ 5,050,461 $ 3,987,611 $ 3,286,779 $ 2,689,844 $ 2,336,953 Borrowings, net 404,166 335,913 239,510 254,308 164,106 Other liabilities 101,674 65,302 52,361 32,042 39,514 Total liabilities 5,556,301 4,388,826 3,578,650 2,976,194 2,540,573 Preferred stock - Series A 38,468 — — — — Common shareholders' equity 440,886 389,071 351,807 325,977 305,390 Total shareholders' equity 479,354 389,071 351,807 325,977 305,390 Total liabilities and shareholders' equity $ 6,035,655 $ 4,777,897 $ 3,930,457 $ 3,302,171 $ 2,845,963 23 Investor presentation
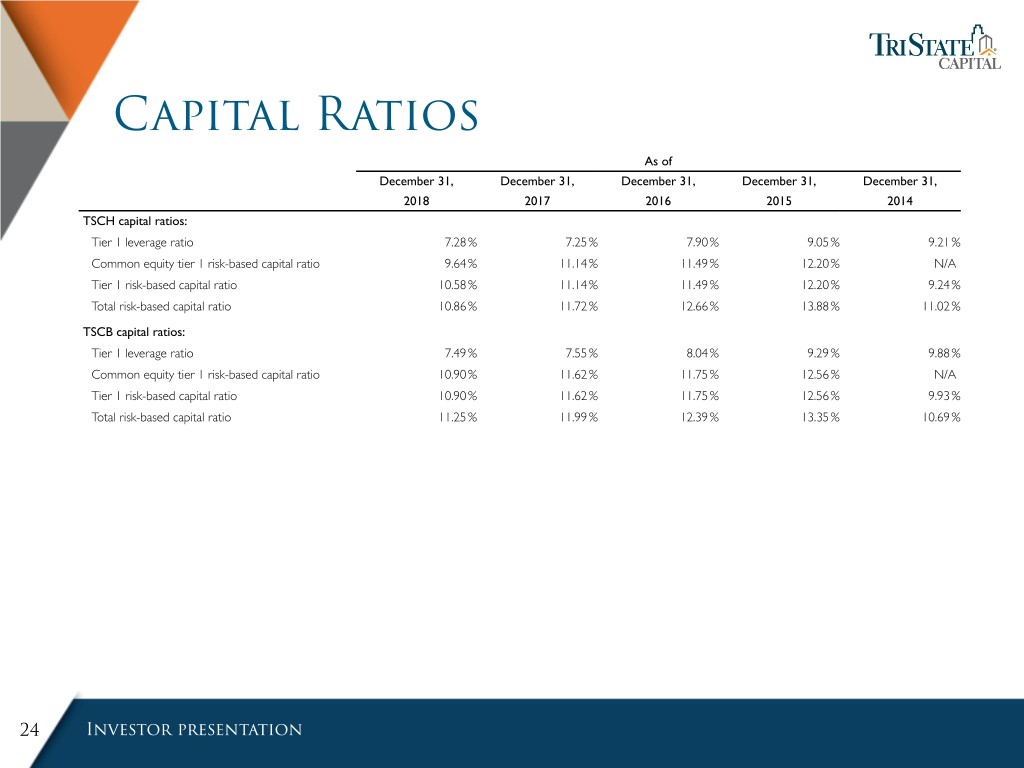
Capital Ratios As of December 31, December 31, December 31, December 31, December 31, 2018 2017 2016 2015 2014 TSCH capital ratios: Tier 1 leverage ratio 7.28 % 7.25 % 7.90 % 9.05 % 9.21 % Common equity tier 1 risk-based capital ratio 9.64 % 11.14 % 11.49 % 12.20 % N/A Tier 1 risk-based capital ratio 10.58 % 11.14 % 11.49 % 12.20 % 9.24 % Total risk-based capital ratio 10.86 % 11.72 % 12.66 % 13.88 % 11.02 % TSCB capital ratios: Tier 1 leverage ratio 7.49 % 7.55 % 8.04 % 9.29 % 9.88 % Common equity tier 1 risk-based capital ratio 10.90 % 11.62 % 11.75 % 12.56 % N/A Tier 1 risk-based capital ratio 10.90 % 11.62 % 11.75 % 12.56 % 9.93 % Total risk-based capital ratio 11.25 % 11.99 % 12.39 % 13.35 % 10.69 % 24 Investor presentation
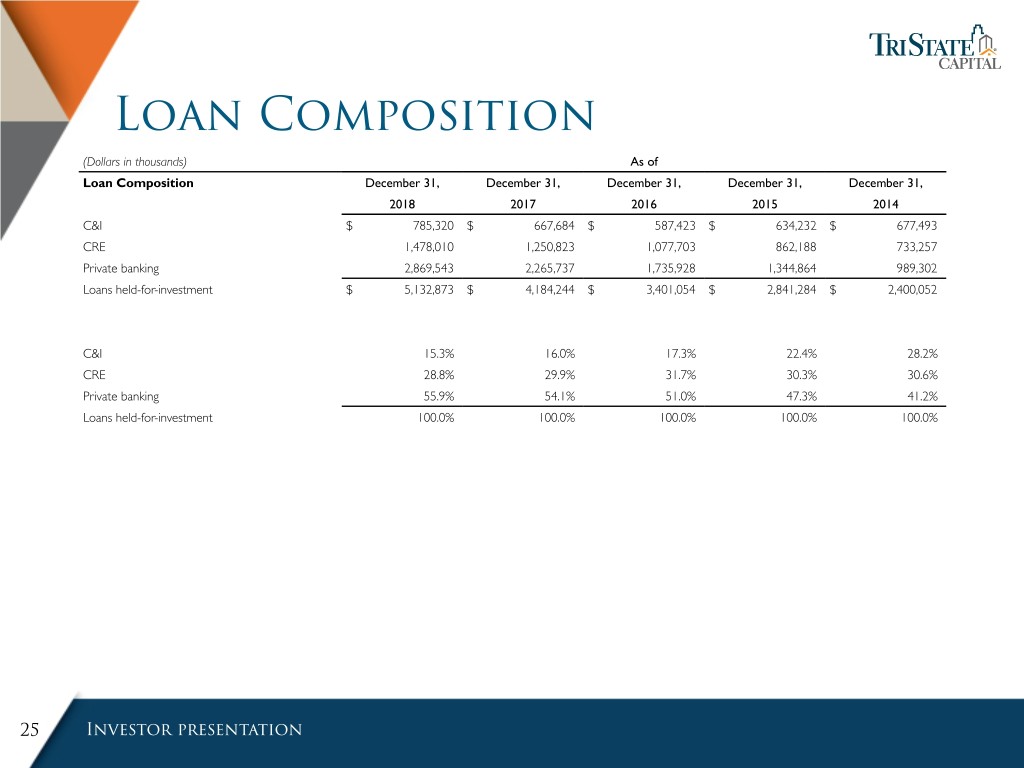
Loan Composition (Dollars in thousands) As of Loan Composition December 31, December 31, December 31, December 31, December 31, 2018 2017 2016 2015 2014 C&I $ 785,320 $ 667,684 $ 587,423 $ 634,232 $ 677,493 CRE 1,478,010 1,250,823 1,077,703 862,188 733,257 Private banking 2,869,543 2,265,737 1,735,928 1,344,864 989,302 Loans held-for-investment $ 5,132,873 $ 4,184,244 $ 3,401,054 $ 2,841,284 $ 2,400,052 C&I 15.3% 16.0% 17.3% 22.4% 28.2% CRE 28.8% 29.9% 31.7% 30.3% 30.6% Private banking 55.9% 54.1% 51.0% 47.3% 41.2% Loans held-for-investment 100.0% 100.0% 100.0% 100.0% 100.0% 25 Investor presentation
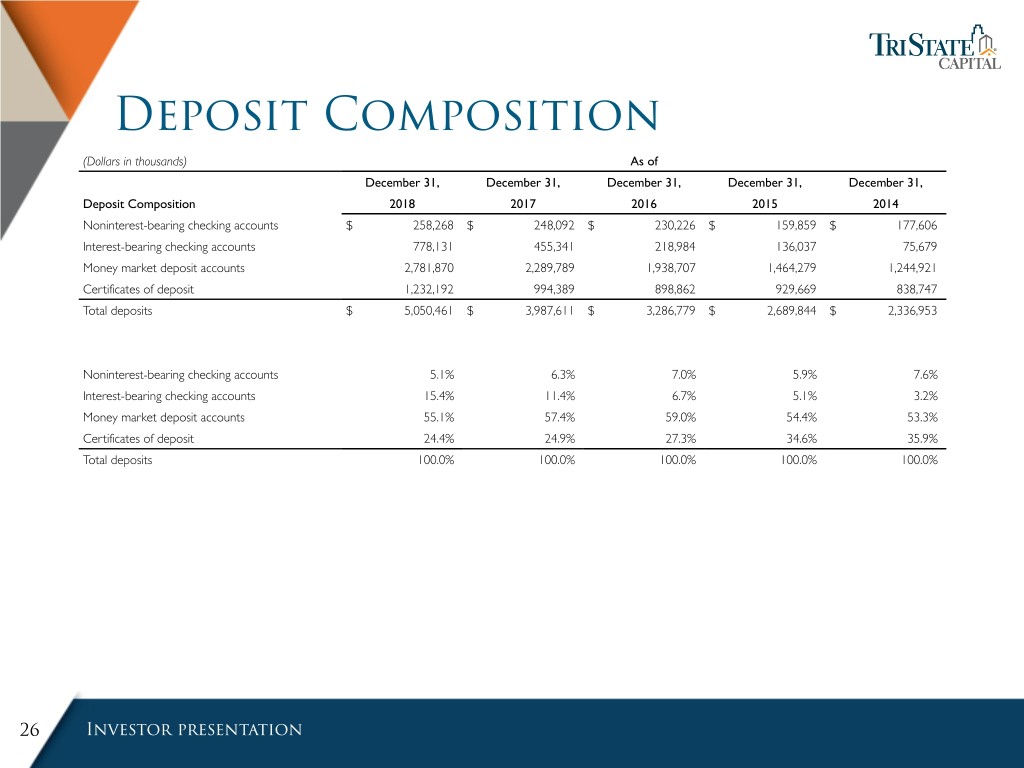
Deposit Composition (Dollars in thousands) As of December 31, December 31, December 31, December 31, December 31, Deposit Composition 2018 2017 2016 2015 2014 Noninterest-bearing checking accounts $ 258,268 $ 248,092 $ 230,226 $ 159,859 $ 177,606 Interest-bearing checking accounts 778,131 455,341 218,984 136,037 75,679 Money market deposit accounts 2,781,870 2,289,789 1,938,707 1,464,279 1,244,921 Certificates of deposit 1,232,192 994,389 898,862 929,669 838,747 Total deposits $ 5,050,461 $ 3,987,611 $ 3,286,779 $ 2,689,844 $ 2,336,953 Noninterest-bearing checking accounts 5.1% 6.3% 7.0% 5.9% 7.6% Interest-bearing checking accounts 15.4% 11.4% 6.7% 5.1% 3.2% Money market deposit accounts 55.1% 57.4% 59.0% 54.4% 53.3% Certificates of deposit 24.4% 24.9% 27.3% 34.6% 35.9% Total deposits 100.0% 100.0% 100.0% 100.0% 100.0% 26 Investor presentation
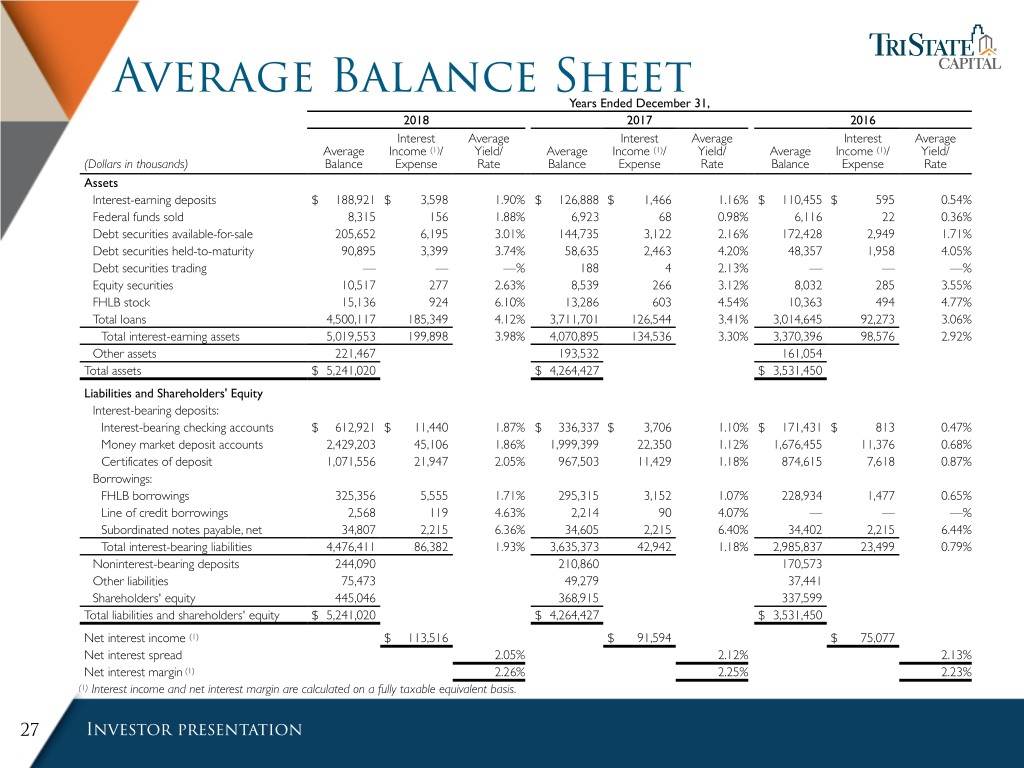
Average Balance Sheet Years Ended December 31, 2018 2017 2016 Interest Average Interest Average Interest Average Average Income (1)/ Yield/ Average Income (1)/ Yield/ Average Income (1)/ Yield/ (Dollars in thousands) Balance Expense Rate Balance Expense Rate Balance Expense Rate Assets Interest-earning deposits $ 188,921 $ 3,598 1.90% $ 126,888 $ 1,466 1.16% $ 110,455 $ 595 0.54% Federal funds sold 8,315 156 1.88% 6,923 68 0.98% 6,116 22 0.36% Debt securities available-for-sale 205,652 6,195 3.01% 144,735 3,122 2.16% 172,428 2,949 1.71% Debt securities held-to-maturity 90,895 3,399 3.74% 58,635 2,463 4.20% 48,357 1,958 4.05% Debt securities trading — — —% 188 4 2.13% — — —% Equity securities 10,517 277 2.63% 8,539 266 3.12% 8,032 285 3.55% FHLB stock 15,136 924 6.10% 13,286 603 4.54% 10,363 494 4.77% Total loans 4,500,117 185,349 4.12% 3,711,701 126,544 3.41% 3,014,645 92,273 3.06% Total interest-earning assets 5,019,553 199,898 3.98% 4,070,895 134,536 3.30% 3,370,396 98,576 2.92% Other assets 221,467 193,532 161,054 Total assets $ 5,241,020 $ 4,264,427 $ 3,531,450 Liabilities and Shareholders' Equity Interest-bearing deposits: Interest-bearing checking accounts $ 612,921 $ 11,440 1.87% $ 336,337 $ 3,706 1.10% $ 171,431 $ 813 0.47% Money market deposit accounts 2,429,203 45,106 1.86% 1,999,399 22,350 1.12% 1,676,455 11,376 0.68% Certificates of deposit 1,071,556 21,947 2.05% 967,503 11,429 1.18% 874,615 7,618 0.87% Borrowings: FHLB borrowings 325,356 5,555 1.71% 295,315 3,152 1.07% 228,934 1,477 0.65% Line of credit borrowings 2,568 119 4.63% 2,214 90 4.07% — — —% Subordinated notes payable, net 34,807 2,215 6.36% 34,605 2,215 6.40% 34,402 2,215 6.44% Total interest-bearing liabilities 4,476,411 86,382 1.93% 3,635,373 42,942 1.18% 2,985,837 23,499 0.79% Noninterest-bearing deposits 244,090 210,860 170,573 Other liabilities 75,473 49,279 37,441 Shareholders' equity 445,046 368,915 337,599 Total liabilities and shareholders' equity $ 5,241,020 $ 4,264,427 $ 3,531,450 Net interest income (1) $ 113,516 $ 91,594 $ 75,077 Net interest spread 2.05% 2.12% 2.13% Net interest margin (1) 2.26% 2.25% 2.23% (1) Interest income and net interest margin are calculated on a fully taxable equivalent basis. 27 Investor presentation
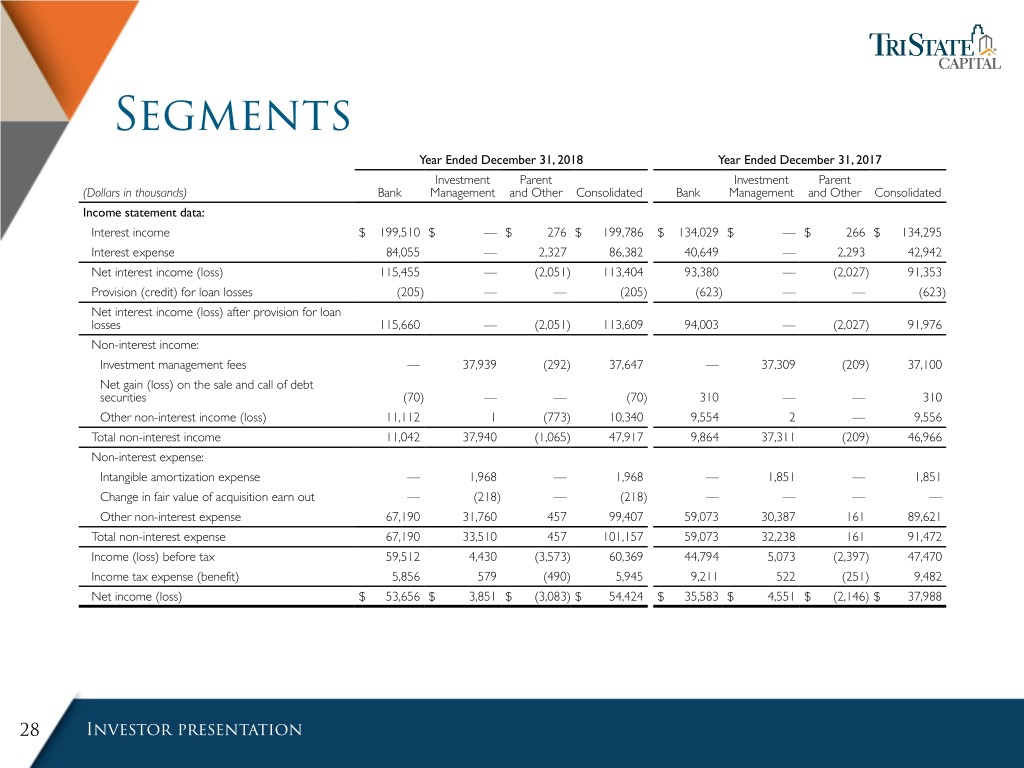
Segments Year Ended December 31, 2018 Year Ended December 31, 2017 Investment Parent Investment Parent (Dollars in thousands) Bank Management and Other Consolidated Bank Management and Other Consolidated Income statement data: Interest income $ 199,510 $ — $ 276 $ 199,786 $ 134,029 $ — $ 266 $ 134,295 Interest expense 84,055 — 2,327 86,382 40,649 — 2,293 42,942 Net interest income (loss) 115,455 — (2,051) 113,404 93,380 — (2,027) 91,353 Provision (credit) for loan losses (205) — — (205) (623) — — (623) Net interest income (loss) after provision for loan losses 115,660 — (2,051) 113,609 94,003 — (2,027) 91,976 Non-interest income: Investment management fees — 37,939 (292) 37,647 — 37,309 (209) 37,100 Net gain (loss) on the sale and call of debt securities (70) — — (70) 310 — — 310 Other non-interest income (loss) 11,112 1 (773) 10,340 9,554 2 — 9,556 Total non-interest income 11,042 37,940 (1,065) 47,917 9,864 37,311 (209) 46,966 Non-interest expense: Intangible amortization expense — 1,968 — 1,968 — 1,851 — 1,851 Change in fair value of acquisition earn out — (218) — (218) — — — — Other non-interest expense 67,190 31,760 457 99,407 59,073 30,387 161 89,621 Total non-interest expense 67,190 33,510 457 101,157 59,073 32,238 161 91,472 Income (loss) before tax 59,512 4,430 (3,573) 60,369 44,794 5,073 (2,397) 47,470 Income tax expense (benefit) 5,856 579 (490) 5,945 9,211 522 (251) 9,482 Net income (loss) $ 53,656 $ 3,851 $ (3,083) $ 54,424 $ 35,583 $ 4,551 $ (2,146) $ 37,988 28 Investor presentation
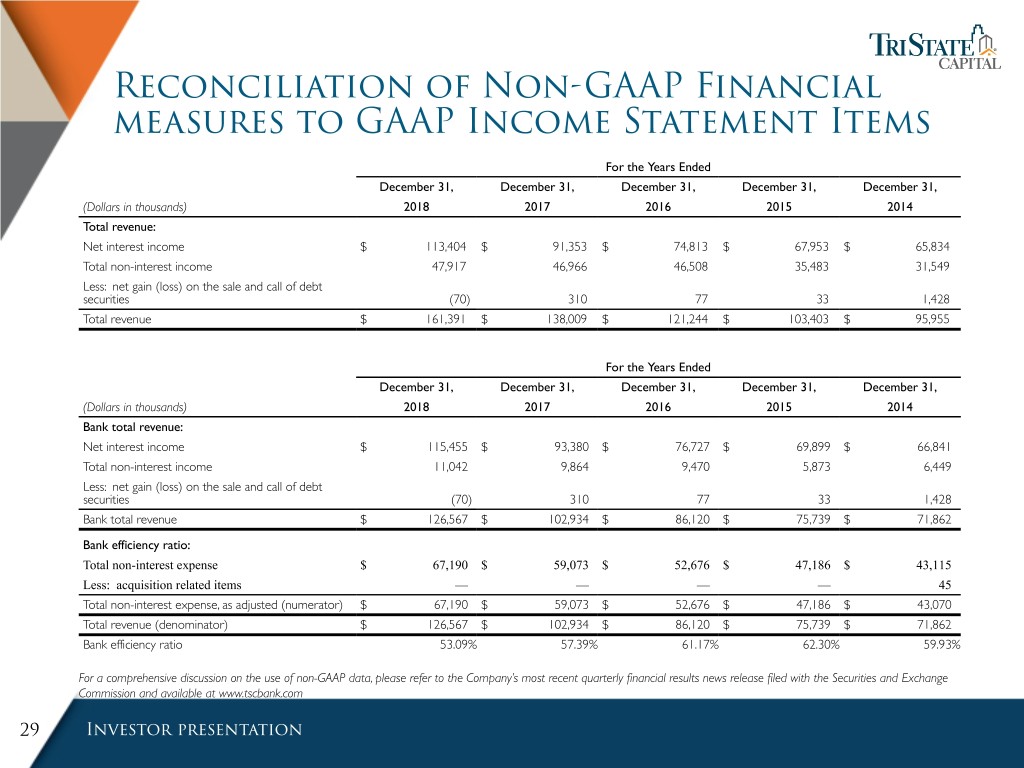
Reconciliation of Non-GAAP Financial measures to GAAP Income Statement Items For the Years Ended December 31, December 31, December 31, December 31, December 31, (Dollars in thousands) 2018 2017 2016 2015 2014 Total revenue: Net interest income $ 113,404 $ 91,353 $ 74,813 $ 67,953 $ 65,834 Total non-interest income 47,917 46,966 46,508 35,483 31,549 Less: net gain (loss) on the sale and call of debt securities (70) 310 77 33 1,428 Total revenue $ 161,391 $ 138,009 $ 121,244 $ 103,403 $ 95,955 For the Years Ended December 31, December 31, December 31, December 31, December 31, (Dollars in thousands) 2018 2017 2016 2015 2014 Bank total revenue: Net interest income $ 115,455 $ 93,380 $ 76,727 $ 69,899 $ 66,841 Total non-interest income 11,042 9,864 9,470 5,873 6,449 Less: net gain (loss) on the sale and call of debt securities (70) 310 77 33 1,428 Bank total revenue $ 126,567 $ 102,934 $ 86,120 $ 75,739 $ 71,862 Bank efficiency ratio: Total non-interest expense $ 67,190 $ 59,073 $ 52,676 $ 47,186 $ 43,115 Less: acquisition related items — — — — 45 Total non-interest expense, as adjusted (numerator) $ 67,190 $ 59,073 $ 52,676 $ 47,186 $ 43,070 Total revenue (denominator) $ 126,567 $ 102,934 $ 86,120 $ 75,739 $ 71,862 Bank efficiency ratio 53.09% 57.39% 61.17% 62.30% 59.93% For a comprehensive discussion on the use of non-GAAP data, please refer to the Company’s most recent quarterly financial results news release filed with the Securities and Exchange Commission and available at www.tscbank.com 29 Investor presentation
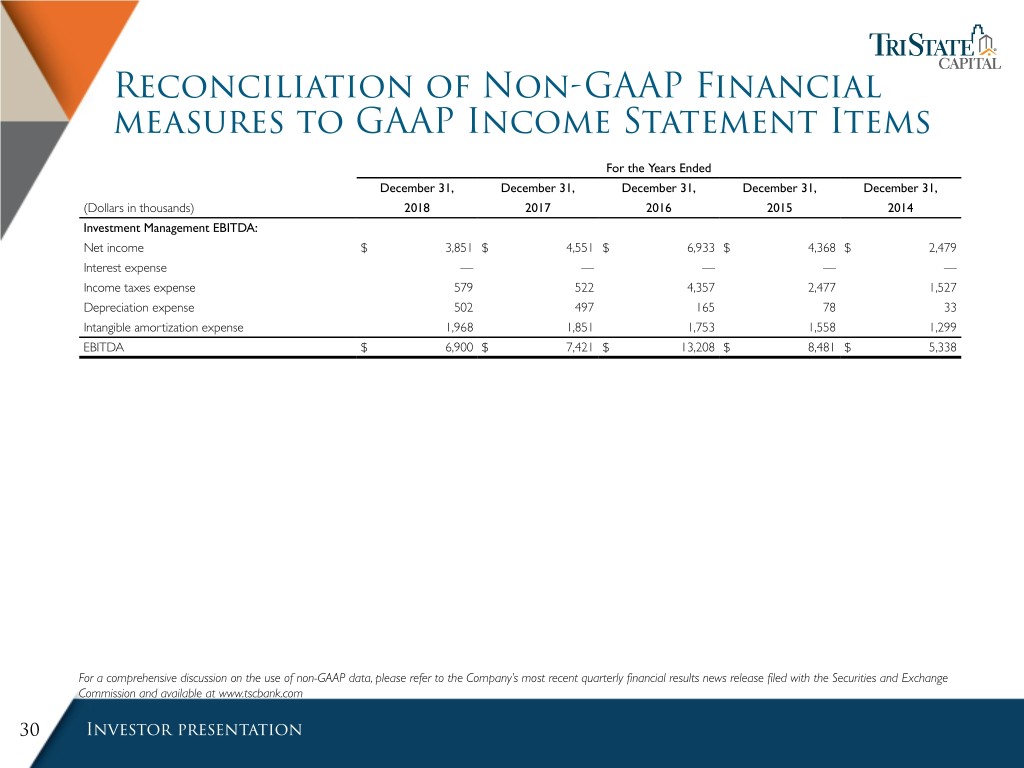
Reconciliation of Non-GAAP Financial measures to GAAP Income Statement Items For the Years Ended December 31, December 31, December 31, December 31, December 31, (Dollars in thousands) 2018 2017 2016 2015 2014 Investment Management EBITDA: Net income $ 3,851 $ 4,551 $ 6,933 $ 4,368 $ 2,479 Interest expense — — — — — Income taxes expense 579 522 4,357 2,477 1,527 Depreciation expense 502 497 165 78 33 Intangible amortization expense 1,968 1,851 1,753 1,558 1,299 EBITDA $ 6,900 $ 7,421 $ 13,208 $ 8,481 $ 5,338 For a comprehensive discussion on the use of non-GAAP data, please refer to the Company’s most recent quarterly financial results news release filed with the Securities and Exchange Commission and available at www.tscbank.com 30 Investor presentation
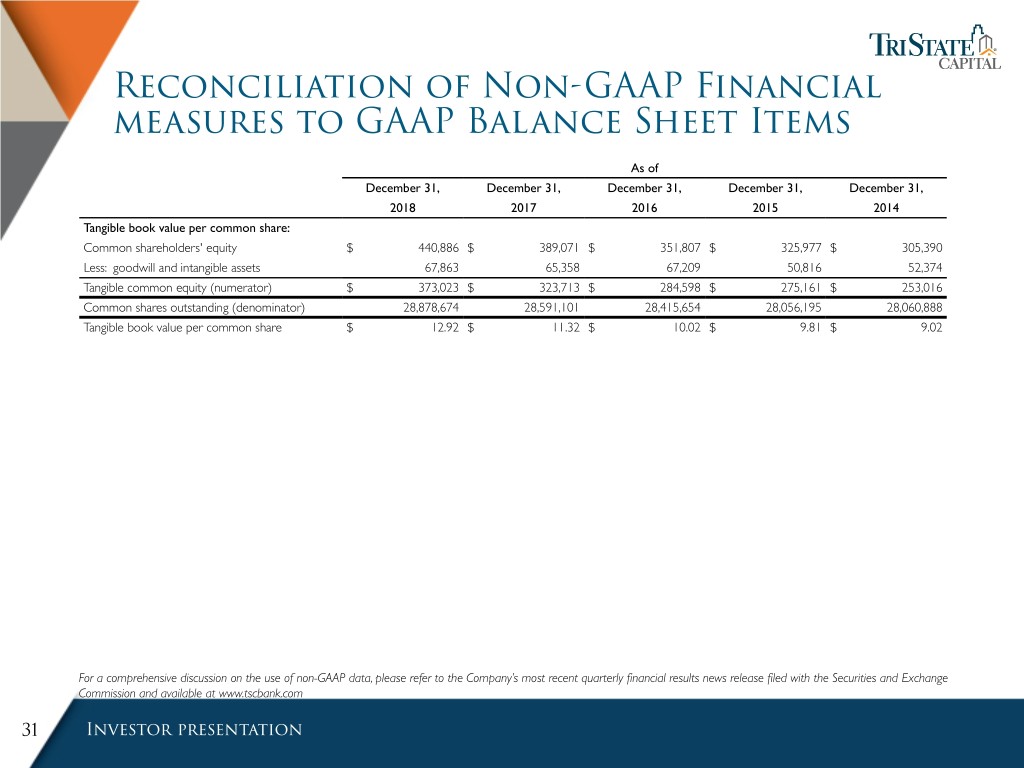
Reconciliation of Non-GAAP Financial measures to GAAP Balance Sheet Items As of December 31, December 31, December 31, December 31, December 31, 2018 2017 2016 2015 2014 Tangible book value per common share: Common shareholders' equity $ 440,886 $ 389,071 $ 351,807 $ 325,977 $ 305,390 Less: goodwill and intangible assets 67,863 65,358 67,209 50,816 52,374 Tangible common equity (numerator) $ 373,023 $ 323,713 $ 284,598 $ 275,161 $ 253,016 Common shares outstanding (denominator) 28,878,674 28,591,101 28,415,654 28,056,195 28,060,888 Tangible book value per common share $ 12.92 $ 11.32 $ 10.02 $ 9.81 $ 9.02 For a comprehensive discussion on the use of non-GAAP data, please refer to the Company’s most recent quarterly financial results news release filed with the Securities and Exchange Commission and available at www.tscbank.com 31 Investor presentation


