UNITED STATES
SECURITIES AND EXCHANGE COMMISSION
Washington, D.C. 20549
Form 10-K
| x | ANNUAL REPORT PURSUANT TO SECTION 13 OR 15(d) OF THE SECURITIES EXCHANGE ACT OF 1934 |
For the Fiscal Year Ended December 31, 2007
or
| ¨ | TRANSITION REPORT PURSUANT TO SECTION 13 OR 15(d) OF THE SECURITIES EXCHANGE ACT OF 1934 |
For the Transition Period from to
Commission File Number: 001-33355
BigBand Networks, Inc.
(Exact name of registrant as specified in its charter)
| | |
| Delaware | | 04-3444278 |
(State or other jurisdiction of incorporation or organization) | | (I.R.S. Employer Identification Number) |
475 Broadway Street
Redwood City, California 94063
(Address of principal executive offices and zip code)
(650) 995-5000
(Registrant’s telephone number, including area code)
Securities registered pursuant to Section 12(b) of the Act:
| | |
Title of each class | | Name of each exchange on which registered |
| Common Stock, $0.001 par value | | The NASDAQ Global Market |
Securities registered pursuant to Section 12(g) of the Act:
None.
Indicate by check mark if the registrant is a well-known seasoned issuer, as defined in Rule 405 of the Securities Act. Yes ¨ No x
Indicate by check mark if the registrant is not required to file reports pursuant to Section 13 or Section 15(d) of the Act. Yes ¨ No x
Indicate by check mark whether the registrant (1) has filed all reports required to be filed by Section 13 or 15(d) of the Securities Exchange Act of 1934 during the preceding 12 months (or for such shorter period that the registrant was required to file such reports), and (2) has been subject to such filing requirements for the past 90 days. Yes x No ¨
Indicate by check mark if disclosure of delinquent filers pursuant to Item 405 of Regulation S-K is not contained herein, and will not be contained, to the best of the registrant’s knowledge, in definitive proxy or information statements incorporated by reference in Part III of this Form 10-K or any amendment to this Form 10-K. ¨
Indicate by check mark whether the registrant is a large accelerated filer, an accelerated filer, or a non-accelerated filer, or a smaller reporting company. See definition of “accelerated filer and large accelerated filer” in Rule 12b-2 of the Exchange Act. (Check one):
Large accelerated filer ¨ Accelerated filer ¨ Non-accelerated filer x Smaller Reporting Company ¨
Indicate by check mark whether the registrant is a shell company (as defined in Rule 12b-2 of the Exchange Act). Yes ¨ No x
The aggregate market value of the voting stock held by non-affiliates of the issuer as of the last business day of the Registrant’s most recently completed second fiscal quarter (June 30, 2007) was approximately $386 million. The number of shares outstanding of the issuer’s common stock as of March 1, 2008 was 62,673,281.
DOCUMENTS INCORPORATED BY REFERENCE
None.
BIGBAND NETWORKS, INC.
FORM 10-K
For the fiscal year ended December 31, 2007
TABLE OF CONTENTS
2
SPECIAL NOTE REGARDING FORWARD-LOOKING STATEMENTS
This report on Form 10-K (“Form 10-K”) includes forward looking statements. All statements other than statements of historical facts contained in this Form 10-K, including statements regarding our future results of operations and financial position, business strategy and plans and our objectives for future operations, are forward-looking statements. The words “believe,” “may,” “will,” “estimate,” “continue,” “anticipate,” “intend,” “expect” and similar expressions are intended to identify forward looking statements. We have based these forward looking statements largely on our current expectations and projections about future events and financial trends that we believe may affect our financial condition, results of operations, business strategy, short term and long term business operations and objectives, and financial needs. These forward looking statements are subject to a number of risks, uncertainties and assumptions, including those described in “Risk Factors.” In light of these risks, uncertainties and assumptions, the forward looking events and circumstances discussed in this Form 10-K may not occur and actual results could differ materially and adversely from those anticipated or implied in the forward looking statements.
Moreover, we operate in a very competitive and rapidly changing environment. New risks emerge from time to time. It is not possible for our management to predict all risks, nor can we assess the impact of all factors on our business or the extent to which any factor, or combination of factors, may cause actual results to differ materially from those contained in any forward-looking statements we may make. Before investing in our common stock, investors should be aware that the occurrence of the risks, uncertainties and events described in the section entitled “Risk Factors” and elsewhere in this Form 10-K could have a material adverse effect on our business, results of operations and financial condition.
You should not rely upon forward-looking statements as predictions of future events. Although we believe that the expectations reflected in the forward-looking statements are reasonable, we cannot guarantee that the future results, levels of activity, performance or events and circumstances reflected in the forward-looking statements will be achieved or occur. Moreover, neither we nor any other person assumes responsibility for the accuracy and completeness of the forward-looking statements. We undertake no obligation to update publicly any forward-looking statements for any reason after the date of this Form 10-K to conform these statements to actual results or to changes in our expectations.
This Form 10-K also contains statistical data and estimates, including those relating to market size and growth rates of the markets in which we participate, that we obtained from industry publications and reports generated by American Advertising Federation, In-Stat, IDC, Kagan Research LLC, Yankee Group Research Inc. and ZenithOptimedia Group. These publications typically indicate that they have obtained their information from sources they believe to be reliable, but do not guarantee the accuracy and completeness of their information. Although we have assessed the information in the publications and found it to be reasonable and believe the publications are reliable, we have not independently verified their data.
You should read this Form 10-K and the documents that we reference in this Form 10-K and have filed with the SEC with the understanding that our actual future results, levels of activity, performance and events and circumstances may be materially different from what we expect.
3
PART I
Item 1. Business
Overview
We develop, market and sell network-based platforms that enable cable operators and telephone companies, collectively service providers, to offer video services across coaxial, fiber and copper networks. We were incorporated in December 1998. Since that time, we have developed significant expertise in rich media processing, communications networking and bandwidth management. We have delivered what we believe to be the first successful commercial deployments of switched digital video technology, an application that substantially increases the volume of content that a service provider can offer. More specifically, our customers are using this technology to expand high-definition television (HDTV) services. In addition, we believe we were the first to implement what has become the industry’s de facto network architecture for digital simulcast, an application that facilitates the insertion of advertising and the transmission of video in a digital format across a network while still providing service to analog subscribers. Our product applications of Digital Simulcast, TelcoTV and Switched Digital Video are a combination of our modular software and programmable hardware platforms. We outsource the manufacturing of our products. We have sold our product applications to more than 200 customers globally. We sell our product applications domestically to customers through a direct sales model, and internationally, through a combination of direct sales to service providers and sales through independent resellers. Our customers include Cablevision, Charter, Comcast, Cox, Time Warner Cable and Verizon, which are six of the ten largest service providers in the United States.
Industry Background
Cable operators and telephone companies derive most of their revenue from consumer subscriptions for video, voice or data services and from advertising. To attract and retain subscribers, service providers are increasingly bundling video, voice and data services, often called a “triple-play” offering. Video has the most stringent bandwidth requirements, is the most technically demanding and provides the richest user experience of the three. Video consumes up to ten times the bandwidth and is approximately 1,000 times more sensitive to packet error, loss and delay when compared with typical voice and data services. Video also offers the greatest revenue per subscriber of the triple-play services. As of December 2006, Yankee Group Research, an independent industry research group, estimates that, on average, consumers spend $68 per month for digital video services compared to $47 for voice and $33 for data services. As a result, video presents the greatest opportunities and greatest challenges in delivering the triple-play bundle.
Competitive Dynamics Changing Video, Voice and Data Networks
The competition for video subscriptions has been increasing over time, and this competition has fueled recurring cycles of network investment as service providers seek to capture increasing revenues from subscribers by offering additional services. Satellite broadcasters, starting in 1994, began offering improved digital video services. They started to capture video subscribers from cable operators. In response, cable operators upgraded their coaxial networks to provide comparable digital video services. Kagan Research LLC, an independent research firm, estimates that cable operators have invested over $100 billion building networks that increased their capacity to offer digital video services and were capable of two-way communication.
The competition for control over the delivery of video services to the home has dramatically increased with the recent entrance of the telephone companies into the market in 2005. Historically, telephone companies built networks to offer voice services, while cable operators built networks for broadcast television. The two did not directly compete with one another. In recent years, additional regulatory, technological and competitive factors have enabled service providers to compete directly and aggressively in each others’ markets. Initial competition among cable operators and telephone companies began with both offering high-speed data services. Then, cable operators used their two-way broadcast networks to offer VoIP services. Similarly, telephone companies have started upgrading their networks, which were originally built for voice and later upgraded to enable the delivery
4
of high-bandwidth video services and higher speed data services. The ability of telephone companies to offer these advanced services that feature video have, in turn, forced cable operators to increase the capacity and performance of their networks to keep pace.
In addition to competing with one another, service providers must react to Internet content aggregators and media companies offering competitive video, voice and advertising services directly to consumers through the Internet. For example, in an effort to increase sales of its iPod devices, Apple Computer offers video content that can be downloaded through the Internet through its iTunes store. Likewise, ABC.com is offering individual television programs and other video content directly to consumers over the Internet, and a number of providers are offering low cost voice services over the Internet. At the same time, online media companies like Google and Yahoo are aggregating or facilitating access to content and increasing the relevance, interactivity and measurability of advertising to attract advertising spending. Competitive activities such as these pose a threat to service providers’ paid subscriber and advertising revenues.
Changing Consumer Demands
Given increasing competition, service providers are attempting to differentiate their offerings by addressing changing consumer behavior and evolving advertiser demands. Consumers are increasingly directing their spending on video services to those providers offering services that more closely match their preferences. In particular, consumers are seeking greater personalization of content, a higher quality experience and greater ease and speed of access to their video services.
| | • | | Personalization. With the proliferation in content, consumers are seeking content that is increasingly customized to their personal interests. This personalized content spans everything from the purchase of downloadable songs to customized video programming, such as VOD and niche channel packages. |
| | • | | Richer Content. Consumers are demanding a higher quality experience, whether online or in their television viewing. As a result, a rapidly growing number of consumers are purchasing HDTVs and high-speed data services to access richer content, such as HD programming, user-generated video clips and interactive online video games. |
| | • | | Ease and Speed of Access. In an increasingly mobile world, consumers desire faster access to content from virtually anywhere using a wide range of devices, such as portable media players, televisions, mobile phones, personal digital assistants and personal computers. |
Consumers have been able to gain greater personalization, richer content and better access to their voice and data services delivered through the Internet using network-based technologies. For video, however, there has been only a limited response to these consumer demands. To offer richer, more personalized content at the speeds consumers expect, and to capture the larger video subscription opportunity, service providers are developing networks with the bandwidth to deliver richer services and the intelligence to tailor video services and direct advertising to individual subscribers.
Advertisers Demand Greater Intelligence in Video-Based Advertising
Traditionally, advertisers attempted to reach consumers through media channels such as broadcast television that distributed the same advertising to wide audiences. The Internet offers advertisers a distribution channel that delivers more relevant ads, while at the same time offering the interactivity required to measure return on ad spending. Advertisers are demanding that video-based advertising networks increase the relevancy, interactivity and measurability of their networks.
| | • | | Relevancy. Advertisers are demanding that their ads be addressed to a relevant audience. For example, they desire to target video advertising to particular geographic zones, and ultimately want to tailor advertising to specific subscribers. |
| | • | | Interactivity. Advertisers want to provide consumers with an easy and immediate way to respond to an advertisement. For example, advertisers would like to provide subscribers with the ability to use a remote control to immediately access additional product information associated with a television advertisement. |
5
| | • | | Measurability. Advertisers are seeking ad distribution networks that allow them to measure the effectiveness of their ad spending and are willing to pay more for video advertisements that result in a higher consumer response rate. |
A survey of advertising executives conducted by the industry group, American Advertising Federation, indicated that 97% of respondents intend to shift spending away from traditional broadcast and cable TV ads to online video ads, with nearly 43% planning to shift at least 20% of their spending by 2010. To encourage advertisers to direct more spending toward television advertisements, service providers must be able to deliver relevant advertisements and measure the effectiveness of marketing campaigns for advertisers. The current video networks of service providers are limited in their ability to provide the intelligence necessary for the relevancy, interactivity and measurability required to meet the expanding demands of advertisers.
Intelligent, High-Bandwidth Video Networks are Needed
Current service provider networks are not equipped for increasingly rich and interactive video content. Cable operators originally built their networks for the one-way broadcast of analog video content. In response to competition by satellite providers, they upgraded their networks to digital, but these networks still lack the capacity to deliver the rich content and interactivity increasingly required by consumers and advertisers. Telephone companies originally constructed low-bandwidth networks that were capable of delivering highly interactive voice services, but these networks lack the bandwidth necessary to deliver rich video services. However, with increasing competition for traditional voice services and the revenue opportunities and network requirements of video, these telephone companies need networks with the bandwidth and interactivity that enable advanced video services that meet the demands of consumers and advertisers. Cable operators and telephone companies therefore must develop intelligent, high-bandwidth video networks for their consumer and advertiser customers.
Delivering high-quality, personalized video services and relevant video-based advertising has strained service providers’ existing network infrastructures and requires service providers to overcome the following challenges:
| | • | | Bandwidth Limitations Posed by Video. Service providers’ fixed-bandwidth networks are not equipped for the volume and richness of content being demanded by subscribers. For example, a typical HDTV video stream requires 19.4 Mbps of continuous bandwidth, which is up to ten times the bandwidth required by a standard definition video stream and substantially greater than the 10 Mbps limit of most copper-based network data connections. To meet the demand for more and richer content such as HDTV, service providers must either undertake a costly capital expansion of their network infrastructures or use their existing infrastructure more efficiently. |
| | • | | Difficulty of Delivering a High-Quality Video Experience. Service provider networks are inherently prone to packet loss, error and delay. This problem is exacerbated as the richness and volume of the content being delivered across the network increases. Importantly, HDTV is approximately 1,000 times more sensitive to packet loss, error and delay than voice and data services. To ensure a consistently high-quality subscriber viewing experience, service providers must find solutions that maintain the integrity of the video streams as these streams move across their networks. |
| | • | | Lack of Customized Video Programming. Existing network infrastructures lack the intelligence to allow service providers to understand and react to subscriber television viewing behavior. As a result, service providers lack the ability to deliver video programming packages tailored to the interests of specific subscribers or groups of subscribers. Service providers require network infrastructure that will enable them to understand subscriber viewing behavior and, based on that assessment, allow them to deliver new video channels and programming packages to specific subscribers or groups of subscribers. |
| | • | | Requirement for More Relevant Video Advertising. Advertisers are demanding that their ads be addressed to a relevant audience. To satisfy this demand, service providers need the capability to deliver video advertising to particular geographic segments and demographic groups, and ultimately, to |
6
| | tailor advertising to specific subscribers. In most broadcast implementations, service providers lack the media processing capabilities to distinguish one subscriber from another and the capacity to insert tailored advertising into a continuous video stream without degrading service quality. Service providers are seeking solutions that will enable the seamless insertion of relevant advertisements into video streams. |
| | • | | High Cost of Infrastructure Investment. Service providers have invested heavily to establish their existing network infrastructures, including the deployment of a significant amount of cable set-top boxes. Service providers must either make significant investments to upgrade or replace their existing infrastructure, or find ways to extend the useful life of their installed equipment. Service providers generally prefer network-based capital investments since these costs can be allocated across many subscribers without costly replacement of existing set-top boxes. |
| | • | | Need to Rapidly Deliver Advanced Services. Historically, service providers have needed to make very large capital expenditures to purchase replacement network equipment to support next-generation services. With the increasing pace of change, service providers require platforms with the flexibility to rapidly deploy advanced video and data services while minimizing lengthy and capital-intensive network upgrades. |
Although service providers face a common challenge—how to rapidly and economically offer an increasing amount of video content, deliver a more compelling user experience, and deliver more relevant programming and advertising to their subscribers—the technical and bandwidth challenges associated with delivering video services creates a need for platforms designed for reliable and cost-effective video delivery.
The BigBand Solution
We develop, market and sell network-based platforms that enable service providers to offer video services across coaxial, fiber and copper networks. Our software and hardware product applications are used to offer video services commercially to tens of millions of subscribers, 24 hours a day, seven days a week and have been successfully deployed by leading service providers worldwide, including six of the ten largest service providers in the United States.
We combine rich media processing, modular software and high-speed switching and routing with carrier-class hardware configurations into product applications designed to address specific service provider needs. Our product applications enable service providers to deliver high-quality video services and offer more effective video advertising. Our key product applications include Digital Simulcast, TelcoTV and Switched Digital Video.
Our solution offers the following key benefits:
| | • | | Intelligent Bandwidth Management. Using our product applications, service providers can address their increasing bandwidth needs. For example, we offer what we believe to be the most widely deployed switched digital video application commercially available today. Our Switched Digital Video product application only transmits channels to subscribers when the subscribers in a service group are in the process of watching those channels, instead of broadcasting all channels to all subscribers all the time. This enables service providers to achieve 50% or greater savings in bandwidth usage for digital subscribers, allowing service providers to offer additional services (such as HDTV channels) without altering the subscriber viewing experience. |
| | • | | High-Quality Video Experience. Our product applications allow service providers to minimize the likelihood of video quality errors by detecting potential video quality degradation in real-time and correcting such degradation before the video stream is delivered to subscribers. Our core suite of video processing software modules are designed to enhance the richness of the viewing experience by optimizing the delivery of video streams, while our program level redundancy functionality adds the switching capability to automatically provision an alternative video stream should the quality of the primary stream begin to degrade. |
7
| | • | | Enhanced Video Personalization. Using our product applications, service providers can interact with their subscribers down to the individual channel change and, as a result, can more accurately tailor programming packages to the interests of their subscribers. For example, our Switched Digital Video product application enables service providers to satisfy consumer demand for increasingly personalized content by expanding the number of channels that can be offered because selected channels are only delivered when the channel is requested by a subscriber in the service group. Using this application, one of our customers was able to offer additional channel packages tailored to demographic groups. |
| | • | | Ability to Deliver Relevant Video Advertising. Our product applications allow service providers to insert advertising tailored to specific subscriber groups. For example, using our Digital Simulcast application, service providers can simultaneously insert different ads into multiple copies of the same program and forward them to specific geographic zones. This allows service providers to attract advertisers interested in reaching niche markets. |
| | • | | Optimize Return on Existing Infrastructure Investment. Our network-based product applications allow service providers to manage service quality from the network, rather than deploying costly personnel and equipment at the customer premises. Because our product applications are deployed at the network level, service providers can leverage their infrastructure investment across many subscribers and avoid the hardware and service costs associated with an upgrade of equipment in the homes of subscribers. |
| | • | | Platform Flexibility. Our product applications feature a fully programmable hardware and modular software architecture. Our field-upgradable hardware is designed to meet service provider platform flexibility requirements and to minimize the need to replace existing hardware. For example, one customer initially purchased our equipment for basic media processing functionality and was subsequently able to further enhance this same hardware platform within a matter of hours to deliver our advanced Digital Simulcast product application simply by licensing an additional software application from us. |
Strategy
Our objective is to be the leading provider of network-based products that enable the delivery of high-bandwidth, high-quality video services and more effective video advertising. Key elements of our strategy include the following:
| | • | | Further Technology Leadership Position. Over the past nine years, we have developed media processing and video systems design expertise. We used this expertise to deliver the most-widely deployed switched digital video product commercially available today. We will continue leveraging our expertise to deliver products that focus on optimizing network infrastructure and enabling delivery of a high-quality user experience. |
| | • | | Leverage Modular Architecture to Accelerate New Product Introduction. We have created a series of media processing software modules that, when combined with our programmable hardware and switching fabric, serve as the foundation for a range of network-based product applications. The competition between cable operators and telephone companies is accelerating the rate of change in their networks, and we believe our software modules will serve as the foundation for rapidly delivering solutions that address our customers’ bandwidth and service delivery needs. |
| | • | | Expand Footprint Within Existing Customer Base. We have customer relationships with a number of service providers both in the United States and internationally, including six of the ten largest service providers in the United States. We believe these customer relationships give us a strong advantage in understanding our customers’ network challenges and delivering timely solutions. We will continue to work closely with our customers on the designs of their network architectures and emerging services, expand our relationships with these customers to deploy more of our existing applications, and develop and deliver new applications to address their network challenges. |
| | • | | Expand Customer Base Regardless of Access Technology. Service providers deploy video services to subscribers across networks based on coaxial, fiber and copper. We have successfully deployed our product |
8
| | applications across these access technologies. We are currently providing Verizon with a solution that allows both digital and analog transmission of video over fiber-optic lines. Other telephone companies deploying video services over existing DSL lines leverage our media processing expertise to provide such video services. Still others use our product applications to carry services over coaxial cable. We intend to leverage our media processing expertise to penetrate new customers worldwide, regardless of the type of access networks they use. |
| | • | | Broaden Advanced Advertising Capabilities. We currently enable service providers to insert video advertisements targeted to subscribers in specific geographic zones. We intend to collaborate with our customers to continue developing and deploying next-generation advertising solutions. |
Product Applications
We deliver product applications that provide rich media processing and high-speed switching, which enable service providers to offer advanced video services to subscribers and advertisers. Our product applications are a combination of our video hardware platforms and key software modules that run inside our carrier-class hardware platforms and deliver the application-specific functions. We combine our carrier-class hardware platforms and modular media processing software to deliver the following product applications:
Digital Simulcast. We were first to implement what we believe has become the industry’s de facto network architecture for digital simulcast. Historically, video content was broadcast only in analog form. Analog video presents a number of limitations to service providers, including deterioration of video quality, higher cost to insert relevant advertising in the video stream, and the cost of converting analog to digital for certain digital devices in the home, such as digital video recorders.
Our Digital Simulcast product application enables service providers to create a digital version of analog inputs and deliver both analog and digital video streams to subscribers. This gives service providers a cost-efficient way of migrating subscribers from analog to digital video, which uses lower cost all-digital set-top boxes, while still supporting a large installed base of analog set-top boxes and televisions. In addition, using our Digital Simulcast product application, service providers can overcome the video quality limitations inherent in the transport of analog over long distances and the low-quality conversion from analog to digital in consumer digital devices. They also can reduce their investment in costly equipment used to transport analog signals and achieve operational efficiency by using a converged digital network. Finally, our Digital Simulcast application allows service providers to insert advertisements into the digital video stream and deliver those ads either in digital or analog form to subscribers. This offers our customers incremental revenue opportunities through the ability to insert advertisements into the digital stream targeted to specific geographic zones.
We deliver our Digital Simulcast product application by combining our Broadband Multimedia-Service Router hardware platform, which we refer to as our BMR, with our core media processing modules with advanced splicing capability.
TelcoTV. Telephone companies use our BMR to provide a very high-quality viewing experience, while still benefiting from the use of digital video transport throughout their networks. We enable telephone companies to leverage their existing Synchronous Optical Network, or SONET, infrastructure, which was originally designed for voice communications, to transport video content throughout the network. This provides significant cost savings as telephone companies are not required to build a dedicated video transport network. They deploy our video application in network locations called video serving offices, or VSOs, that provide service directly to consumers. This product application leverages the same key technologies that were previously deployed in many of the largest cable operator networks in the world. Our TelcoTV product application integrates our core media processing modules with our BMR with built-in radio frequency, or RF, modulation, analog decoding and local content insertion. Our platforms have been engineered to comply with the Level-3 Network Equipment Building System standard, or NEBS, which is a set of telecommunications industry safety and environmental design guidelines for equipment in central offices.
9
Switched Digital Video. We believe we were the first company to develop and commercially deploy a switched digital video application. Traditionally, service providers broadcast all channels to all subscribers at all times. Our Switched Digital Video application enables service providers to transmit video channels to subscribers only when the subscribers in a smaller subset of subscribers within a network, called a service group, are in the process of watching those channels. Depending on the number of subscribers and the amount of duplicate channels within a service group, our Switched Digital Video product application typically allows service providers to achieve up to 50% bandwidth savings in the delivery of digital video content and use the reclaimed bandwidth to offer additional content. This reclaimed bandwidth can be used to deliver niche video packages, more HDTV channels, high-speed data service and/or voice service. Service providers often use our Switched Digital Video product application as a means to free up the bandwidth to implement digital simulcast. The diagram below illustrates how bandwidth can be reclaimed using our Switched Digital Video product application, which broadcasts only those channels that are being watched within a service group.

In addition, our Switched Digital Video product application gives our service providers real-time access to the actual viewing habits of their subscriber groups, information that is increasingly valuable as they and their advertisers seek to tailor advertising or personalized channel services to specific subscriber groups and individual subscribers.
We deliver our Switched Digital Video product application by combining our core media processing modules with our BMR, Switched Digital Video Session Server and Broadband Multimedia-Service Edge hardware platform, which we refer to as our BME, or Broadband Edge QAM or BEQ.
Platforms and Technologies
Our intelligent, network-based product applications are built on an architecture that combines modular software with extensible video and data hardware platforms. Our modular software architecture enables us to more quickly and cost effectively develop new features and products. Our hardware platforms offer field-upgradeable hardware, high-speed switching and routing with general-purpose processing capabilities in a chassis-based design. This hardware and software approach provides our customers with rich media processing capabilities in a carrier-class hardware configuration that can be extended across multiple network locations and, as needed, to accommodate more services and more subscribers. Our hardware platforms and modular software consist of:
Hardware and Management Software Platforms
Broadband Multimedia-Service Router (BMR). Our Broadband Multimedia-Service Router is our hardware platform that is designed for the real-time processing and switching of video. The BMR platform is a protocol-neutral architecture that processes and switches MPEG, IP and Ethernet packets. We accelerate our software media processing functionality through digital signal processors and field programmable gate arrays, which also allow the BMR to be upgraded or reconfigured over time and from remote locations. The BMR has a chassis-based design that provides carrier-class reliability and flexibility to expand functionality and capacity as network requirements evolve by adding new network cards. The BMR supports the transmission of digital and analog signals using radio frequency, or RF, interfaces to the physical cable network through QAM, quadrature phase shift keying and analog RF.
10
Broadband Multimedia-Service Edge (BME). The Broadband Multimedia-Service Edge is our hardware platform that is optimized to communicate directly with subscriber set-top boxes and cable modems from the edge of the service provider’s network. Our BME provides media processing and switching of video services, such as VOD and Switched Digital Video. This allows service providers to utilize Gigabit Ethernet transport to the edge of their network, without the need to upgrade CPE. The BME provides high reliability while terminating 24 QAM channels, which gives our customers a space-efficient and cost-effective system that can scale as capacity needs dictate.
BigBand Broadband Edge QAM (BEQ). Our Broadband Edge QAM platforms are used to convert digital video and data streams into quadrature amplitude modulated (QAM) RF carriers that transport video and data across cable networks to subscriber set top boxes and cable modems. The services that are transported can include Switched Digital Video, Video on Demand, Broadcast Video and DOCSIS High Speed Data. Our QAM platforms are modular and employ digital signal processors, FPGAs and our own proprietary RF technology and algorithms. They are noted for their high signal quality, installed density and thermal efficiency.
BigBand Session and Resource Manager. Our Session and Resource Manager is an application server platform for real-time control and management of video and data traffic traversing the network. Our Switched Digital Video Session Server, or SBSS, manages customer transactions down to the channel change level to allow service providers to dynamically switch the broadcast content being requested in a service group. With the knowledge of the customer transactions, the SBSS can switch and load-balance broadcast channels across the BMEs in the network.
Software Modules
We have created a set of individual software modules that define the attributes and functionality of our product applications. We design these modules with well-defined software interfaces to facilitate software development and maintenance, enabling faster response to service provider needs and the delivery of new features. Our software architecture also allows these modules to be combined with one another in various configurations. Selected modular software components are described below:
| | • | | RateShaping. Our RateShaping module combines digital signal processing and statistical multiplexing using complex algorithms to enable more video streams to be transported using the same amount of bandwidth. With RateShaping, we conserve bandwidth by intelligently allocating bandwidth to programs that require more, while reducing bandwidth to programs that require less. The diagram below depicts how our RateShaping module can take variable-rate video streams and adjust them to conform to a fixed amount of bandwidth capacity. |

11
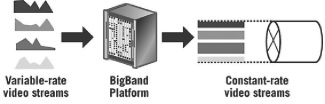
| | • | | RateClamping. The amount of bandwidth required to deliver a digital video program varies based on the complexity of the picture being transmitted within that program. For applications where a constant bit rate is desired, such as Switched Digital Video, RateClamping converts variable input feeds into constant bit rate streams, with the output bandwidth determined according to the service provider’s priorities. RateClamping is frequently utilized to deliver services such as VOD, Switched Digital Video and network-based digital video recorders. The diagram below depicts how our RateClamping module can convert variable-rate video streams into constant-rate video streams. |
| | • | | Splicing. Our Splicing functionality allows an alternate program, usually an advertisement, to be seamlessly inserted into an existing video stream. Using our Splicing functionality, service providers can perform hundreds of concurrent splices of different ads to multiple advertising zones, targeting different neighborhoods, in a single BMR. Our Splicing functionality is integral to our Digital Simulcast solution. |
| | • | | Video over Ethernet. Using our Video over Ethernet functionality, service providers can process and transmit digital video streams over IP inputs and outputs, which is less expensive than legacy video- specific interfaces, such as Asynchronous Serial Interface, or ASI. Ethernet, however, can cause latency problems in the network, which are particularly problematic in the delivery of video programming. Our Video over Ethernet functionality corrects the inherent timing effects introduced by Ethernet as it arrives in the BMR and encapsulates video into IP packets on video outputs. |
| | • | | Encryption. Our Encryption module scrambles the video stream and interfaces with a standards-based conditional access system to allow operators to secure their video content and restrict usage to only authorized subscribers. |
| | • | | Program-level Redundancy. Our Redundancy module inspects a video stream at the individual program level to detect errors and switches to the back-up source program without interrupting other programs on the same transport stream. By contrast, other competitive redundancy solutions do not detect problems with individual programs, which can result in a lower quality viewer experience. |
| | • | | Metadata Processing. Our applications process metadata such as the name of the program, plot summary and actors. This allows the service provider to actively control the type and amount of metadata that is provided to the subscriber’s television, thus enabling the service provider to populate program guide content and provide enhanced interactive TV functions. |
| | • | | Switched Video Analysis. Switched Video Analysis (SVA), a companion module to Switched Digital Video, is a viewership and performance analysis application that gathers viewership metrics to allow cable operators to make informed decisions about programming expansion—specifically where to “switch” programming and where to “broadcast” it—and network utilization. SVA is also designed to help operators determine when and where to roll out new programming and monitor unanticipated changes in viewership or network performance that can impact program delivery. |
12
Customers
We sell our products to cable operators and telephone companies worldwide. In the United States, our products are deployed by six of the ten largest service providers. The following is a list of our significant customers in 2007:
| | | | |
Bright House Networks | | Cox | | Multikabel |
Cableone | | Delta | | Suddenlink |
Cablevision | | Guangdong Tongke | | Time Warner Cable |
CAIW | | Kabel Baden-Wurttemberg | | Verizon |
Comcast | | LiWest | | Wide Open West |
A substantial majority of our sales have been to relatively few customers. However, our large customers have changed over time. Sales to our five largest customers represented 75%, 79% and 69% of our net revenues in the years ended December 31, 2007, 2006 and 2005, respectively. In 2007, Cox, Time Warner Cable and Verizon each represented 10% or more of our net revenue. In 2006, Comcast, Cox, Time Warner Cable and Verizon each represented 10% or more of our net revenues. In 2005, Adelphia, Cox and Time Warner Cable each represented 10% or more of our net revenues. Although we are attempting to broaden our customer base by penetrating new markets and expanding internationally, we expect continuing customer concentration due to the significant capital costs of constructing service provider networks and industry consolidation. We expect that in future periods a limited number of large customers will continue to comprise a large percentage of our revenues.
Sales to customers outside of the United States represented approximately $29.7 million of net revenues for the year ended December 31, 2007, $19.2 million of net revenues for the year ended December 31, 2006, and $16.8 million of net revenues for the year ended December 31, 2005.
Backlog
We schedule production of our products based upon our backlog, open contracts, informal commitments from customers and sales projections. Our backlog consists of firm purchase orders by customers for delivery within the next six months. As of December 31, 2007, we had backlog of $11.5 million, compared with backlog of $36.2 million as of December 31, 2006. Anticipated orders from customers may fail to materialize and delivery schedules may be deferred or canceled for a number of reasons, including reductions in capital spending by service providers or changes in specific customer requirements. Because of the complexity of our customer acceptance and revenue recognition criteria, in addition to backlog, we have significant deferred revenues. As a result, our backlog alone is not necessarily indicative of revenues for any succeeding period.
Sales and Marketing
We sell our products in the United States primarily through our direct sales force and internationally through a combination of direct sales to service providers and sales through independent resellers. Our direct sales force, distributors and resellers are supported by our highly trained technical staff, which includes application engineers who work closely with service providers to develop technical proposals and design systems to optimize performance and economic benefits to potential customers. Our sales offices outside of the United States are located in Germany, China, Hong Kong and Korea. International resellers are generally responsible for importing our products and providing certain installation, technical support and other services to customers in their territory.
Our marketing organization develops strategies for product lines and market segments, and, in conjunction with our sales force, identifies the evolving technical and application needs of customers so that our product development resources can be deployed to meet anticipated product requirements. Our marketing organization is also responsible for setting price levels, forecasting demand and generally supporting the sales force, particularly at major accounts. We have many programs in place to heighten industry awareness of our company and our products, including participation in technical conferences, industry initiatives, publication of articles in industry journals and exhibitions at trade-shows.
13
Customer Service and Technical Support
We offer our customers a range of support offerings, including program management, training, installation and post-sales technical support. As a part of our pre-sales effort, our engineers design the implementation of our products in our customers’ environments to meet their performance and interoperability requirements. We also offer training classes to assist them in the management of our product applications.
Our technical support organization, with personnel in the United States, Europe and Asia, offers support 24 hours a day, seven days a week. For our direct customers, we offer tiered customer support programs depending upon the service needs of our customers’ deployments. Using our standard support package, our customers receive telephone support and access to online technical information. Under our enhanced support package, in addition to the standard support offerings, our customers are entitled to software product upgrades and maintenance releases, advanced return materials authorization and on-site support, if necessary. Support contracts typically have a one-year term. For end customers purchasing through resellers, primary product support is provided by our resellers, with escalation support provided by us.
Research and Development
We focus our research and development efforts on developing new products and systems, and adding new features to existing products and systems. Our development strategy is to identify features, products and systems for both software and hardware that are, or are expected to be, needed by our customers. Our success in designing, developing, manufacturing and selling new or enhanced products will depend on a variety of factors, including the identification of market demand for new products, product selection, timely implementation of product design and development, product performance, effective manufacturing and assembly processes and sales and marketing. Because these research and development efforts are complex, we may not be able to successfully develop new products, and any new products developed by us may not achieve market acceptance.
Research and development expense in the year ended December 31, 2007 was $51.9 million, in the year ended December 31, 2006 was $37.2 million and in the year ended December 31, 2005 was $30.7 million.
Intellectual Property
As of December 31, 2007, we held 28 issued U.S. patents, 19 of which relate to our video products and nine of which relate to our CMTS products. Additionally, we had 62 U.S. patent applications pending, 52 of which relate to our video products and ten of which relate to our CMTS products. Our issued patents will expire between 2019 and 2024. Although we attempt to protect our intellectual property rights through patents, trademarks, copyrights, licensing arrangements, trade secrets and other measures, there is a risk that any patent, trademark, copyright or other intellectual property rights owned by us may be invalidated, circumvented or challenged; that these intellectual property rights may not provide competitive advantages to us; and that any of our pending or future patent applications may not be issued with the scope of the claims sought by us, if at all. Others may develop technologies that are similar or superior to our technology, duplicate our technology or design around the patents that we own. In addition, effective patent, copyright and trade secret protection may be unavailable or limited in certain foreign countries in which we do business or may do business in the future.
We generally enter into confidentiality or license agreements with our employees, consultants, vendors and customers, and generally limit access to and distribution of our proprietary information. Nevertheless, we cannot assure you that the steps taken by us will prevent misappropriation of our technology. In addition, from time to time, legal action by us may be necessary to enforce our patents and other intellectual property rights, to protect our trade secrets, to determine the validity and scope of the proprietary rights of others or to defend against claims of infringement or invalidity. Such litigation could result in substantial costs and diversion of resources and could negatively affect our business, operating results and financial condition.
From time to time, it may be necessary for us to enter into technology development or licensing agreements with third parties. Although many companies are often willing to enter into such technology development or licensing agreements, we may not be able to negotiate these agreements on terms acceptable to us, or at all. Our
14
failure to enter into technology development or licensing agreements, when necessary, could limit our ability to develop and market new products and could cause our business to suffer.
Our industry is characterized by the existence of a large number of patents and frequent claims and related litigation regarding patent and other intellectual property rights. In particular, leading companies in the networking industry have extensive patent portfolios. From time to time, third parties, including certain of these leading companies, have asserted and may assert exclusive patent, copyright, trademark and other intellectual property rights against us or our customers. Although these third parties may offer a license to their technology, the terms of any offered license may not be acceptable and the failure to obtain a license or the costs associated with any license could cause our business, operating results or financial condition to be materially adversely affected.
Manufacturing and Suppliers
We outsource the manufacturing of our products. Flextronics Corporation and Benchmark Electronics, Inc. each serve as a sole contract manufacturer for our video products, depending on the product line. ACT served as a sole contract manufacturer for our CMTS platform. Once our products are manufactured, they are sent to our facility in Westborough, Massachusetts, where we perform final assembly and quality-control testing. We believe that outsourcing our manufacturing enables us to conserve capital, better adjust manufacturing volumes to meet changes in demand and more quickly deliver products.
We submit purchase orders to our contract manufacturers that describe the type and quantities of our products to be manufactured, the delivery date and other delivery terms. Flextronics does not have a written contractual obligation to accept any purchase order that we submit.
We and our contract manufacturers purchase many of our components from a sole supplier or a limited group of suppliers. For example, we depend on Vecima Networks for decoding video components. We do not have a written agreement with many of these component suppliers, and we do not require our contract manufacturers to have written agreements with these component manufacturers. As a result, we may not be able to obtain an adequate supply of components on a timely basis. Our reliance on sole or limited suppliers involves several risks, including a potential inability to obtain an adequate supply of required components and reduced control over pricing, quality and timely delivery of components. We monitor the supply of the component parts and the availability of alternative sources. If our supply of any key component is disrupted, we may be unable to deliver our products to our customers on a timely basis, which could result in lost or delayed revenues, injury to our reputation, increased manufacturing costs and exposure to claims by our customers. Even if alternate suppliers are available, we may have difficulty identifying them in a timely manner, we may incur significant additional expense in changing suppliers, and we may experience difficulties or delays in the manufacturing of our products.
Our manufacturing operations consist primarily of supply chain managers, new product introduction and test engineering personnel. Our manufacturing organization designs, develops and implements complex test processes to help ensure the quality and reliability of our products. The manufacturing of our products is a complex process, and we may experience production problems or manufacturing delays in the future. Any difficulties we experience in managing relationships with our contract manufacturers, or any interruption in our own or our contract manufacturers operations, could impede our ability to meet our customers’ requirements and harm our business, operating results and financial condition.
Competition
The markets for our products are extremely competitive and are characterized by rapid technological change. The principal competitive factors in our markets include the following:
| | • | | product performance, features, interoperability and reliability; |
| | • | | technological expertise; |
15
| | • | | relationships with service providers; |
| | • | | price of products and services and cost of ownership; |
| | • | | sales and distribution capabilities; |
| | • | | customer service and support; |
| | • | | compliance with industry standards and certifications; |
| | • | | size and financial stability of operations; |
| | • | | breadth of product line; |
| | • | | intellectual property portfolio; |
| | • | | ability to scale manufacturing; and |
| | • | | ability to interoperate with other vendors. |
We believe we compete principally on the performance, features, interoperability and reliability of our products and our technological expertise. Several companies, including companies that are significantly larger and more established, such as Cisco Systems and Motorola, also compete in these markets. Many of these larger competitors have substantially broader product offerings and bundle their products or incorporate functionality into existing products in a manner that discourages users from purchasing our products or that may require us to add incremental features and functionality to differentiate our products or lower our prices. Furthermore, many of our competitors have greater financial, technical, marketing, distribution, customer support and other resources, as well as better name recognition and access to customers than we do.
Conditions in our markets could change rapidly and significantly as a result of technological advancements or continuing market consolidation. The development and market acceptance of alternative technologies could decrease the demand for our products or render them obsolete. Our competitors may introduce products that are less costly, provide superior performance or achieve greater market acceptance than our products. In addition, these larger competitors often have broader product lines and market focus, are in a better position to withstand any significant reduction in capital spending by customers in these markets, and will therefore not be as susceptible to downturns in a particular market. These competitive pressures are likely to continue to adversely impact our business. We may not be able to compete successfully in the future, and competition may harm our business.
We believe standards bodies may commoditize the markets in which we compete and would require that we add incremental features and functions to differentiate our products. If the product design or technology of our competitors were to become an industry standard, our business could be seriously harmed.
Employees
As of December 31, 2007, we employed a total of 518 people, including 175 in sales, service and marketing, 246 in research and development, 37 in manufacturing operations and 60 in a general and administrative capacity. As of such date, we had 278 employees in the United States, 197 in Israel and 43 in other foreign countries. We also engage a number of temporary employees and consultants. None of our employees is represented by a labor union with respect to his or her employment with us. We have not experienced any work stoppages, and we consider our relations with our employees to be good. Our future success will depend upon our ability to attract and retain qualified personnel. Competition for qualified personnel remains strong, and we may not be successful in retaining our key employees or attracting skilled personnel.
Additional Information
We file registration statements, periodic and current reports, proxy statements, and other materials with the Securities and Exchange Commission (“SEC”). You may read and copy any materials we file with the SEC at the SEC’s Office of Public Reference at 100 F Street, NE, Washington, D.C. 20549. You may obtain information on
16
the operation of the Public Reference Room by calling the SEC at 1-800-SEC-0330. The SEC maintains a web site at www.sec.gov that contains reports, proxy and information statements and other information regarding issuers that file electronically with the SEC, including our filings. Other than the information expressly set forth in this Form 10-K, the information contained or referred to on our website is not part of this annual report. We make available, free of charge, through the investor relations section of our website (www.bigbandnet.com), our annual reports on Form 10-K, quarterly reports on Form 10-Q and current reports on Form 8-K, and any amendments to those reports filed pursuant to Section 13(a) or 15(d) of the Securities Exchange Act of 1934, as amended, as soon as reasonably practicable after they are electronically filed with or furnished to the SEC. The contents of our website are not incorporated into, or otherwise to be regarded as part of this Form 10-K.
Item 1A. Risk Factors
Investments in the equity securities of publicly traded companies involve significant risks. Our business, prospects, financial condition or operating results could be materially adversely affected by any of these risks, as well as other risks not currently known to us or that we currently consider immaterial. The trading price of our common stock could decline due to any of these risks, and you may lose all or part of your investment. In assessing the risks described below, you should also refer to the other information contained in this report on Form 10-K, including our consolidated financial statements and the related notes, before deciding to purchase any shares of our common stock.
We depend on the adoption of advanced technologies by cable operators and telephone companies for substantially all of our net revenues, and any decrease or delay in capital spending for these advanced technologies would harm our operating results, financial condition and cash flows.
Substantially all of our sales are dependent upon the adoption of advanced technologies by cable operators and telephone companies, and we expect these sales to continue to constitute a significant majority of our sales for the foreseeable future. Demand for our products will depend on the magnitude and timing of capital spending by service providers on advanced technologies for constructing and upgrading their network infrastructure, and a reduction or delay in this spending could have a material adverse effect on our business.
The capital spending patterns of our existing and potential customers are dependent on a variety of factors, including:
| | • | | available capital and access to financing; |
| | • | | overall consumer demand for video, voice and data services and the acceptance of newly introduced services; |
| | • | | competitive pressures, including pricing pressures; |
| | • | | the impact of industry consolidation; |
| | • | | the strategic focus of our customers and potential customers; |
| | • | | technology adoption cycles and network architectures of service providers, and evolving industry standards that may impact them; |
| | • | | the status of federal, local and foreign government regulation of telecommunications and television broadcasting, and regulatory approvals that our customers need to obtain; |
| | • | | discretionary customer spending patterns; |
| | • | | bankruptcies and financial restructurings within the industry; and |
| | • | | general economic conditions. |
Any slowdown or delay in the capital spending by service providers as a result of any of the above factors would likely have a significant impact on our quarterly revenue and profitability levels.
17
Our operating results are likely to fluctuate significantly and may fail to meet or exceed the expectations of securities analysts or investors or our guidance, causing our stock price to decline.
Our operating results have fluctuated in the past and are likely to continue to fluctuate, on an annual and a quarterly basis, as a result of a number of factors, many of which are outside of our control. These factors include:
| | • | | the level and timing of capital spending of our customers, both in the United States and in international markets; |
| | • | | the timing, mix and amount of orders, especially from significant customers; |
| | • | | changes in market demand for our products; |
| | • | | our ability to secure significant orders from telephone companies; |
| | • | | our mix of products sold; |
| | • | | the mix of software and hardware products sold; |
| | • | | our unpredictable and lengthy sales cycles, which typically range from nine to eighteen months; |
| | • | | the timing of revenue recognition on sales arrangements, which may include multiple deliverables; |
| | • | | new product introductions by our competitors; |
| | • | | market acceptance of new or existing products offered by us or our customers; |
| | • | | competitive market conditions, including pricing actions by our competitors; |
| | • | | our ability to complete complex development of our software and hardware on a timely basis; |
| | • | | our ability to design, install and receive customer acceptance of our products; |
| | • | | unexpected changes in our operating expense; |
| | • | | the potential loss of key manufacturer and supplier relationships; |
| | • | | the cost and availability of components used in our products; |
| | • | | changes in domestic and international regulatory environments; and |
| | • | | the impact of new accounting rules. |
We establish our expenditure levels for product development and other operating expense based on projected sales levels, and our expenses are relatively fixed in the short term. Accordingly, variations in the timing of our sales can cause significant fluctuations in operating results. For example, our revenues declined in the six months ended December 31, 2007 compared to the six months ended June 30, 2007 resulting in a significant operating loss in the six months ended December 31, 2007. As a result of all these factors, our operating results in one or more future periods may fail to meet or exceed the expectations of securities analysts or investors or our guidance, which would likely cause the trading price of our common stock to decline substantially.
The markets in which we operate are intensely competitive, and many of our competitors are larger, more established and better capitalized than we are.
The markets for selling network-based hardware and software products to service providers are extremely competitive and have been characterized by rapid technological change. We compete broadly with system suppliers including Harmonic, Motorola, Scientific Atlanta (a division of Cisco Systems), SeaChange International, Tandberg Television (a division of Ericsson), Terayon Communication Systems (a division of Motorola) and a number of smaller companies. We may not be able to compete successfully in the future, which may harm our business.
18
Many of our competitors are substantially larger and have greater financial, technical, marketing and other resources than us. Given their capital resources, many of these large organizations are in a better position to withstand any significant reduction in capital spending by customers in these markets. They often have broader product lines and market focus and are not as susceptible to downturns in a particular market. In addition, many of our competitors have been in operation much longer than we have and therefore have more long-standing and established relationships with domestic and foreign service providers. If any of our competitors’ products or technologies were to become the industry standard, our business would also be seriously harmed. If our competitors are successful in bringing their products to market earlier, or if their products are more technologically capable than ours, then our sales could be materially adversely affected.
Recently, we have seen rapid consolidation among our competitors, such as Cisco’s acquisition of Scientific Atlanta, purchases of VOD solutions by each of Cisco, Harmonic and Motorola, and Motorola’s acquisition of Terayon. In addition, some of our competitors have entered into strategic relationships with one another to offer a more comprehensive solution than would be available individually. We expect this trend to continue as companies attempt to strengthen or maintain their market positions in the evolving industry for video. Many of the companies driving this consolidation trend have significantly greater financial, technical and other resources than we do, and are much better positioned than we are to offer complementary products and technologies. These combined companies may offer more compelling product offerings and be able to offer greater pricing flexibility, making it more difficult for us to compete while sustaining acceptable gross margins. Finally, continued industry consolidation may impact customers’ perceptions of the viability of smaller companies, which may affect their willingness to purchase products from us. These competitive pressures could harm our business, operating results and financial condition.
In the event that certain of our competitors integrate products performing functions similar to our products into their existing network infrastructure offerings, our existing and potential customers may decide against using our products in their networks, which would harm our business.
Other providers of network-based hardware and software products are offering or announcing functionality aimed at solving similar problems addressed by our products. For example, several vendors have recently announced their intention to develop a switched digital video product application. The inclusion of, or the announcement of the intent to include, functionality perceived to be similar to our product offerings in our competitors’ products that have been accepted as necessary components of network architecture may have an adverse effect on our ability to market and sell our products. Furthermore, even if the functionality offered by other network infrastructure providers is more limited than our products, a significant number of customers may elect to accept such limited functionality in lieu of adding components from a different vendor. Many of our existing and potential customers have invested substantial personnel and financial resources to design and operate their networks and have mature relationships with other providers of network infrastructure products, which may make them reluctant to add new components to their networks, particularly from new vendors. In addition, our customers’ other vendors with a broader product offering may be able to offer pricing or other concessions that we are not able to match because we currently offer a more modest suite of products and have fewer resources. If our existing or potential customers are reluctant to add network infrastructure from new vendors or otherwise decide to work with their existing vendors, our business, operating results and financial condition will be adversely affected.
We anticipate that our gross margins will fluctuate with changes in our product mix and expected decreases in the average selling prices of our products, which may adversely impact our operating results.
Our industry has historically experienced a decrease in average selling prices. We anticipate that the average selling prices of our products will decrease in the future in response to competitive pricing pressures, increased sales discounts and new product introductions by our competitors. We may experience substantial decreases in future operating results due to the decrease of our average selling prices. To maintain our gross margin levels, we must develop and introduce on a timely basis new products and product enhancements as well as continually reduce our product costs. Our failure to do so would likely cause our revenue and gross margins to decline, which
19
could have a material adverse effect on our operating results and cause the price of our common stock to decline. We also anticipate that our gross margins will fluctuate from period to period as a result of the mix of products we sell in any given period, with our video products generally yielding higher gross margins than our data products. If our sales of these lower margin products significantly expand in future quarterly periods, our overall gross margin levels and operating results would be adversely impacted.
Our anticipated growth will depend significantly on our ability to deliver products that help enable telephone companies to provide video services. If the projected growth in demand for video services from telephone companies does not materialize or if these service providers find alternative methods of delivering video services, future sales of our video products will suffer.
Prior to 2006, our sales were principally to cable operators. In 2006 and 2007, however, we generated significant revenues from telephone companies. Our future growth, if any, is dependent on our ability to sell video products to telephone companies that are increasingly reliant on the delivery of video services to their customers. Although a number of our existing products are being deployed in these networks, we will need to devote considerable resources to obtain orders, qualify our products and hire knowledgeable personnel to address telephone company customers, each of which will require significant time and financial commitment. These efforts may not be successful in the near future, or at all. If technological advancements allow these telephone companies to provide video services without upgrading their current system infrastructure or that allow them a more cost-effective method of delivering video services than our products, projected sales of our video products will suffer. Even if these providers choose our video products, they may not be successful in marketing video services to their customers, in which case additional sales of our products would likely be reduced.
Selling successfully to the telephone company market will be a significant challenge for us. Several of our largest competitors have mature customer relationships with many of the largest telephone companies, while we have limited recent experience with sales and marketing efforts designed to reach these potential customers. In addition, telephone companies face specific network architecture and legacy technology issues that we have only limited expertise in addressing. If we fail to penetrate the telephone company market successfully, our growth in revenues and operating results would be correspondingly limited.
Our customer base has become increasingly concentrated, and there are a limited number of potential customers for our products. The loss of any of our key customers would likely reduce our revenues significantly.
Historically, a large portion of our sales have been to a limited number of customers. In the year ended December 31, 2007, our top five customers accounted for 75% of our net revenues compared to 79% in the year ended December 31, 2006. In the year ended December 31, 2007, Cox, Time Warner Cable, and Verizon each represented 10% or more of our net revenues. We believe that for the foreseeable future our net revenues will be concentrated in a relatively small number of large customers.
We anticipate that a large portion of our revenues will continue to depend on sales to a limited number of customers, and we do not have contracts or other agreements that guarantee continued sales to these or any other customers. In addition, as the consolidation of ownership of cable operators and telephone companies continues, we may lose existing customers and have access to a shrinking pool of potential customers. We expect to see continuing industry consolidation and customer concentration due to the significant capital costs of constructing video, voice and data networks and for other reasons. For example, Adelphia, formerly the fifth largest cable company in the United States, was sold in 2006 to Comcast and Time Warner Cable, the two largest U.S. cable operators. Further business combinations may occur in our customer base which will result in increased purchasing leverage by these customers over us. This may reduce the selling prices of our products and services and as a result may harm our business and financial results. Many of our customers desire to have two sources for the products we sell to them. As a result, our future revenue opportunities could be limited, and our profitability could be adversely impacted. The loss of, or reduction in orders from, any of our key customers would significantly reduce our revenues and have a material adverse impact on our business, operating results and financial condition.
20
The timing of a significant portion of our net revenues is dependent on complex systems integration.
We derive a significant portion of our net revenues from sales that include the network design, installation and integration of equipment, including equipment acquired from third parties to be integrated with our products to the specifications of our customers. We base our revenue forecasts on the estimated timing to complete the network design, installation and integration of our customer projects and customer acceptance of those products. The systems of our customers are both diverse and complex, and our ability to configure, test and integrate our systems with other elements of our customers’ networks is dependent upon technologies provided to our customers by third parties. As a result, the timing of our revenue related to the implementation of our product applications in these complex networks is difficult to predict and could result in lower than expected revenue in any particular quarter. Similarly, our ability to deploy our equipment in a timely fashion can be subject to a number of other risks, including the availability of skilled engineering and technical personnel, the availability of equipment produced by third parties and our customers’ need to obtain regulatory approvals.
If revenues forecasted for a particular period are not realized in such period due to the lengthy, complex and unpredictable sales cycles of our products, our operating results for that or subsequent periods will be harmed.
The sales cycles of our products are typically lengthy, complex and unpredictable and usually involve:
| | • | | a significant technical evaluation period; |
| | • | | a significant commitment of capital and other resources by service providers; |
| | • | | substantial time required to engineer the deployment of new technologies for new video and voice services; |
| | • | | substantial testing and acceptance of new technologies that affect key operations; and |
| | • | | substantial test marketing of new services with subscribers. |
For these and other reasons, our sales cycles generally have been between nine and eighteen months, but can last longer. If orders forecasted for a specific customer for a particular quarter do not occur in that quarter, our operating results for that quarter could be substantially lower than anticipated. Our quarterly and annual results may fluctuate significantly due to revenue recognition policies and the timing of the receipt of orders.
We have been unable to achieve sustained profitability, which could adversely affect the price of our stock.
To date, we have experienced significant operating losses. We were not profitable in the three months and year ended December 31, 2007 and do not expect to be profitable in the three months ending March 31, 2008. If we fail to achieve sustained profitability in the future, it would adversely impact our long-term business and we may not meet the expectations of the investment community in the future, which could have a material adverse impact on our stock price.
We may not accurately anticipate the timing of the market needs for our products and develop such products at the appropriate times, which could harm our operating results and financial condition.
Accurately forecasting and meeting our customers’ requirements is critical to the success of our business. Forecasting to meet customers’ needs is particularly difficult in connection with newer products and products under development. Our ability to meet customer demand depends on our ability to configure our product applications to the complex architectures that our customers have developed, the availability of components and other materials and the ability of our contract manufacturers to scale their production of our products. Our ability to meet customer requirements depends on our ability to obtain sufficient volumes of these components and materials in a timely fashion. If we fail to meet customers’ supply expectations, our net revenues will be adversely affected, and we will likely lose business. In addition, our priorities for future product development are
21
based on our expectations of how the market for video, voice and data services will continue to develop in the United States and in international markets. If the market for such services develops more rapidly than we anticipate, then our product development efforts may be behind, which may result in our being unable to recoup our capital spent on product development as a result of a missed market opportunity. Conversely, if the market develops more slowly than we anticipate, we may find that we have expended significant capital on product development prior to our being able to generate any revenues for those products. If we are unable to accurately time our product introductions to meet market demand, it could have a material adverse impact on our operating results and financial condition.
In addition, if actual orders are materially lower than the indications we receive from our customers, our ability to manage inventory and expenses will also be harmed. If we enter into purchase commitments to acquire components and materials, or expend resources to manufacture products, and those products are not purchased by our customers when expected, our business and operating results could suffer.
We need to develop and introduce new and enhanced products in a timely manner to remain competitive, and our product development efforts require substantial research and development expense.
The markets in which we compete are characterized by continuing technological advancement, changes in customer requirements and evolving industry standards. To compete successfully, we must design, develop, manufacture and sell new or enhanced products that provide increasingly higher levels of performance and reliability and meet the cost expectations of our customers. Our product development efforts require substantial research and development expense. Research and development expense in the year ended December 31, 2007 was $51.9 million and in the year ended December 31, 2006 was $37.2 million. There can be no assurance that we will achieve an acceptable return on our research and development efforts.
Likewise, new technologies, standards and formats are being adopted by our customers. While we are in the process of developing products based on many of these new formats in order to remain competitive, we do not have such products at this time and cannot be certain when, if at all, we will have products in support of such new formats.
Our future growth depends on market acceptance of several emerging video services, on the adoption of new network architectures and technologies and on several other industry trends.
Future demand for our products will depend significantly on the growing market acceptance of several emerging video services; HDTV; addressable advertising; and video delivered over telephone company networks.
The effective delivery of these services will depend on service providers developing and building new network architectures to deliver them. If the introduction or adoption of these services or the deployment of these networks is not as widespread or as rapid as we or our customers expect, our revenue growth will be limited.
Furthermore, we expect the extent and nature of regulatory attitudes towards issues such as competition among service providers, access by third parties to networks of other service providers and new services to impact our customers’ purchasing decisions. If service providers do not pursue the opportunity to offer integrated video services as aggressively as we expect, our revenue growth would be limited.
The retirement of our CMTS platform and related reduction in force could disrupt the operation of our business, distract management attention from revenue-generating efforts, increase our expenses, harm our reputation and result in a decline in employee morale.
Our organization has changed rapidly and further organizational changes may be required to address our strategic objectives. Our organization has changed through the retirement of our CMTS platform and a related reduction in headcount. The retirement may make our revenues from this product difficult to predict, as well as subject us to customer relationship risks, which could harm our business.
22
We also have eliminated approximately one hundred positions globally and plan to implement additional cost cutting measures. On October 30, 2007, we announced the re-focusing of our business on our core video product line and the retirement of our CMTS platform. These changes have placed a significant strain on our management, personnel, systems and resources. If we are unable to manage these organizational changes effectively, including effectively implementing cost cutting measures, we may not be able to take advantage of market opportunities, develop new products, enhance our technological capabilities, satisfy customer requirements, execute on our business plan or respond to competitive pressures. We cannot assure you that we will be able to achieve planned cost cutting measures in a timely manner or at all, or that our cost cutting measures, as planned, will be effective. If cost cutting measures are not effectively implemented, we may experience unanticipated effects form these measures causing harm to our business and customer relationships.
We need to develop additional distribution channels to market and sell our products.
Our video products have been traditionally sold directly to large cable operators with recent sales directly to telephone companies. To date, we have not focused on smaller service providers and have had only limited access to service providers in certain international markets, including Asia and Europe. Although we intend to establish strategic relationships with leading distributors worldwide in an attempt to reach new customers, we may not succeed in establishing these relationships. Even if we do establish these relationships, the distributors may not succeed in marketing our products to their customers. Some of our competitors have established long-standing relationships with cable operators and telephone companies that may limit our and our distributors’ ability to sell our products to those customers. Even if we were to sell our products to those customers, it would likely not be based on long-term commitments, and those customers would be able to terminate their relationships with us at any time without significant penalties.
We depend on a limited number of third parties to manufacture, assemble and supply our products.
We obtain many components and modules necessary for the manufacture or integration of our products from a sole supplier or a limited group of suppliers, with whom we do not always have long-term agreements in place. Our reliance on sole or limited suppliers involves several risks, including the inability to obtain an adequate supply of required components or modules and reduced control over pricing, quality and timely delivery of components. Our ability to deliver our products on a timely basis to our customers would be materially adversely impacted if we needed to find alternative replacements for the chipsets, central processing units or power supplies that we use in our products. Significant time and effort would be required to locate new vendors for these alternative components, if alternatives are even available to us. In addition, the lead times associated with certain components are lengthy and preclude rapid changes in quantity requirements and delivery schedules.
In addition, increased demand by third parties for the components we use in our products may lead to decreased availability and higher prices for those components, since we carry little inventory of our products and product components. As a result, we may not be able to secure sufficient components at reasonable prices or of acceptable quality to build products in a timely manner, which would impact our ability to deliver products to our customers, and our business, operating results and financial condition would be adversely affected.
We currently rely exclusively on Flextronics or Benchmark, depending on the product, to assemble our products, manage our supply chain and negotiate component costs for our video products. Our reliance on these contract manufacturers reduces our control over the assembly process, exposing us to risks, including reduced control over quality assurance, production costs and product supply. If we fail to manage our relationships with these contract manufacturers effectively, or if these contract manufacturers experience delays, disruptions, capacity constraints or quality control problems in their operations, our ability to ship products to our customers could be impaired and our competitive position and reputation could be harmed. If contract manufacturers are unable to negotiate with their suppliers for reduced component costs, our operating results would be harmed. If we are required to change contract manufacturers, we may lose net revenues, incur increased costs and damage our customer relationships. Qualifying a new contract manufacturer and commencing volume production are expensive and time-consuming.
23
We must manage the expected growth in our business effectively even if our infrastructure, management and resources might be strained.
We experienced rapid growth in our business until 2007. In 2007, we experienced a significant revenue decline in the latter half of the year. A return to growth, if any, will likely place a significant strain on our resources. For example, we may need to hire additional development and customer support personnel. In addition, we may need to expand and otherwise improve our internal systems, including our management information systems, customer relationship and support systems, and operating, administrative and financial systems and controls. These efforts may require us to make significant capital expenditures or incur significant expenses, and divert the attention of management, sales, support and finance personnel from our core business operations, which may adversely affect our financial performance in future periods. Moreover, to the extent we grow in the future it will result in increased responsibilities of management personnel. Managing this growth will require substantial resources that we may not have or otherwise be able to obtain.
Our products must interoperate with many software applications and hardware found in our customers’ networks. If we are unable to ensure that our products interoperate properly, our business would be harmed.
Our products must interoperate with our customers’ existing networks, which often have varied and complex specifications, utilize multiple protocol standards, software applications and products from multiple vendors, and contain multiple generations of products that have been added over time. As a result, we must continually ensure that our products interoperate properly with these existing networks. To meet these requirements, we must undertake development efforts that require substantial capital investment and the devotion of substantial employee resources. We may not accomplish these development efforts quickly or cost-effectively, if at all. For example, our products currently interoperate with set-top boxes marketed by vendors such as Scientific Atlanta and Motorola and with VOD servers marketed by SeaChange and C-COR. If we fail to maintain compatibility with these set-top boxes, VOD servers or other software or equipment found in our customers’ existing networks, we may face substantially reduced demand for our products, which would adversely affect our business, operating results and financial condition.
We have entered into interoperability arrangements with a number of equipment and software vendors for the use or integration of their technology with our products. In these cases, the arrangements give us access to and enable interoperability with various products in the digital video market that we do not otherwise offer. If these relationships fail, we will have to devote substantially more resources to the development of alternative products and the support of our products, and our efforts may not be as effective as the combined solutions with our current partners. In many cases, these parties are either companies with which we compete directly in other areas, such as Motorola, or companies that have extensive relationships with our existing and potential customers and may have influence over the purchasing decisions of these customers. A number of our competitors have stronger relationships with some of our existing and potential partners and, as a result, our ability to have successful partnering arrangements with these companies may be harmed. Our failure to establish or maintain key relationships with third party equipment and software vendors may harm our ability to successfully sell and market our products. We are currently investing, and plan to continue to invest, significant resources to develop these relationships. Our operating results could be adversely affected if these efforts do not generate the revenues necessary to offset this investment.
In addition, if we find errors in the existing software or defects in the hardware used in our customers’ networks or problematic network configurations or settings, as we have in the past, we may have to modify our software or hardware so that our products will interoperate with our customers’ networks. This could cause longer installation times for our products and could cause order cancellations, either of which would adversely affect our business, operating results and financial condition.
Our failure to adequately protect our intellectual property and proprietary rights may adversely affect us.
We hold numerous issued U.S. patents and have a number of patent applications pending in the United States and foreign jurisdictions. Although we attempt to protect our intellectual property rights through patents,
24
trademarks, copyrights, licensing arrangements, maintaining certain technology as trade secrets and other measures, we cannot assure you that any patent, trademark, copyright or other intellectual property rights owned by us will not be invalidated, circumvented or challenged, that such intellectual property rights will provide competitive advantages to us or that any of our pending or future patent applications will be issued with the scope of the claims sought by us, if at all. Despite our efforts, other competitors may be able to develop technologies that are similar or superior to our technology, duplicate our technology or design around the patents that we own. In addition, effective patent, copyright and trade secret protection may be unavailable or limited in certain foreign countries in which we do business or may do business in the future.
The steps that we have taken may not be able to prevent misappropriation of our technology. In addition, we may take legal action to enforce our patents and other intellectual property rights, protect our trade secrets, determine the validity and scope of the proprietary rights of others, or to defend against claims of infringement or invalidity. For example, on June 5, 2007, we filed a lawsuit in federal court against Imagine Communications, Inc., alleging patent infringement. This and other potential intellectual property litigation could result in substantial costs and diversion of resources and could negatively affect our business, operating results and financial condition.
In order to successfully develop and market certain of our planned products, we may be required to enter into technology development or licensing agreements with third parties. Although companies may be willing to enter into technology development or licensing agreements, such agreements may not be negotiated on terms acceptable to us, or at all. Our failure to enter into technology development or licensing agreements, when necessary, could limit our ability to develop and market new products and could cause our business to suffer.
Our use of open source and third-party software could impose limitations on our ability to commercialize our products.
We incorporate open source software into our products, including certain open source code which is governed by the GNU General Public License, Lesser GNU General Public License and Common Development and Distribution License. The terms of many open source licenses have not been interpreted by U.S. courts, and there is a risk that these licenses could be construed in a manner that could impose unanticipated conditions or restrictions on our ability to commercialize our products. In such event, we could be required to seek licenses from third parties in order to continue offering our products, make generally available, in source code form, proprietary code that links to certain open source modules, re-engineer our products, discontinue the sale of our products if re-engineering could not be accomplished on a cost-effective and timely basis, or become subject to other consequences, any of which could adversely affect our business, operating results and financial condition.
We may also find that we need to incorporate certain proprietary third-party technologies, including software programs, into our products in the future. However, licenses to relevant third-party technology may not be available to us on commercially reasonable terms, if at all. Therefore, we could face delays in product releases until alternative technology can be identified, licensed or developed, and integrated into our current products. These delays, if they occur, could materially adversely affect our business, operating results and financial condition.
We may face intellectual property infringement claims from third parties.
Our industry is characterized by the existence of an extensive number of patents and frequent claims and related litigation regarding patent and other intellectual property rights. From time to time, third parties have asserted and may assert patent, copyright, trademark and other intellectual property rights against us or our customers. Our suppliers and customers may have similar claims asserted against them. We have agreed to indemnify some of our suppliers and customers for alleged patent infringement. The scope of this indemnity varies, but, in some instances, includes indemnification for damages and expenses including reasonable attorneys’ fees. Any future litigation, regardless of its outcome, could result in substantial expense and significant
25
diversion of the efforts of our management and technical personnel. An adverse determination in any such proceeding could subject us to significant liabilities, temporary or permanent injunctions or require us to seek licenses from third parties or pay royalties that may be substantial. Furthermore, necessary licenses may not be available on satisfactory terms, or at all.
Our business is subject to the risks of warranty returns, product liability and product defects.
Products like ours are very complex and can frequently contain undetected errors or failures, especially when first introduced or when new versions are released. Despite testing, errors may occur. Product errors could affect the performance of our products, delay the development or release of new products or new versions of products, adversely affect our reputation and our customers’ willingness to buy products from us and adversely affect market acceptance or perception of our products. Any such errors or delays in releasing new products or new versions of products or allegations of unsatisfactory performance could cause us to lose revenue or market share, increase our service costs, cause us to incur substantial costs in redesigning the products, subject us to liability for damages and divert our resources from other tasks, any one of which could materially adversely affect our business, results of operations and financial condition. Our products must successfully interoperate with products from other vendors. As a result, when problems occur in a network, it may be difficult to identify the sources of these problems. The occurrence of hardware and software errors, whether or not caused by our products, could result in the delay or loss of market acceptance of our products, and therefore delay our ability to recognize revenue from sales, and any necessary revisions may cause us to incur significant expenses. The occurrence of any such problems could harm our business, operating results and financial condition.
Although we have limitation of liability provisions in our standard terms and conditions of sale, they may not fully or effectively protect us from claims as a result of federal, state or local laws or ordinances or unfavorable judicial decisions in the United States or other countries. The sale and support of our products also entails the risk of product liability claims. We maintain insurance to protect against certain claims associated with the use of our products, but our insurance coverage may not adequately cover any claim asserted against us. In addition, even claims that ultimately are unsuccessful could result in our expenditure of funds in litigation and divert management’s time and other resources.
Our ability to sell our products is highly dependent on the quality of our support and services offerings, and our failure to offer high-quality support and services would have a material adverse effect on our sales and results of operations.
Once our products are deployed within our customers’ networks, our customers depend on our support organization to resolve any issues relating to our products. If we or our channel partners do not effectively assist our customers in deploying our products, succeed in helping our customers quickly resolve post-deployment issues and provide effective ongoing support, our ability to sell our products to existing customers would be adversely affected and our reputation with potential customers could be harmed. In addition, as we expand our operations internationally, our support organization will face additional challenges including those associated with delivering support, training and documentation in languages other than English. Our failure to maintain high-quality support and services would have a material adverse effect on our business, operating results and financial condition.
Competition for qualified personnel, particularly management and research and development personnel, is intense. In order to manage our expected growth, we must be successful in attracting and retaining qualified personnel.
Our future success will depend on the ability of our management to operate effectively, both individually and as a group. We are dependent on our ability to retain and motivate high caliber personnel, in addition to attracting new personnel. In the recent past, we have experienced some senior-level departures. For example, our chief financial officer left us at the end of November 2007, and this management position remained vacant for four months. In addition, we have experienced an increase in voluntary attrition since our initial public offering.
26
The loss of any of our other senior management or other key product development or sales and marketing personnel, or our inability to timely and adequately fill vacant positions could adversely affect our future business, operating results and financial condition. In addition, a large number of our research and product development personnel have broad expertise in video algorithms, radio frequency and digital video standards that is vitally important in our product development efforts. If we were to lose a significant number of these research and development employees, our ability to develop successful new products would be harmed, and our revenues and operating results would likely suffer as a result. Competition for qualified management, technical and other personnel can be intense, and we may not be successful in attracting and retaining such personnel. While our employees are required to sign standard agreements concerning confidentiality and ownership of inventions, we generally do not have employment contracts or non-competition agreements with our personnel. The loss of the services of any of our key personnel, the inability to attract or retain qualified personnel in the future or delays in hiring required personnel, particularly senior management and engineers and other technical personnel, could negatively affect our business, operating results and financial condition.
Our expansion into international markets may not succeed.
International sales represented $29.7 million of our net revenues for the year ended December 31, 2007 and $19.2 million of our net revenues for the year ended December 31, 2006. As part of our restructuring efforts announced on October 30, 2007, we substantially reduced the number of personnel dedicated to sales outside the United States. Our international sales will depend upon developing indirect sales channels in Europe and Asia through distributor and reseller arrangements with third parties. However, we may not be able to successfully enter into additional reseller and/or distribution agreements and/or may not be able to successfully manage our product sales channels. In addition, many of our resellers also sell products from other vendors that compete with our products and may choose to focus on products of those vendors. Additionally, our ability to utilize an indirect sales model in these international markets will depend on our ability to qualify and train those resellers to perform product installations and to provide customer support. If we fail to develop and cultivate relationships with significant resellers, or if these resellers are not successful in their sales efforts whether because they are unable to provide support or otherwise, we maybe unable to grow or sustain our revenue in international markets.
Our future growth will require further expansion of our international operations in Europe, Asia and other markets. We recently established a small research and development presence in China and an outsourced research and development presence in the Ukraine. Managing research and development operations in numerous locations requires substantial management oversight. If we are unable to expand our international operations successfully and in a timely manner, our business, operating results and financial condition may be harmed. Such expansion may be more difficult or take longer than we anticipate, and we may not be able to successfully market, sell, deliver and support our products internationally.
Our international operations, the international operations of our contract manufacturers and our outsourced development contractors, and our efforts to increase sales in international markets, are subject to a number of risks, including:
| | • | | inflation and fluctuations in currency exchange rates, especially the Israeli New Shekel; |
| | • | | political and economic instability; |
| | • | | unpredictable changes in foreign government regulations and telecommunications standards; |
| | • | | legal and cultural differences in the conduct of business; |
| | • | | import and export license requirements, tariffs, taxes and other trade barriers; |
| | • | | difficulty in collecting accounts receivable; |
| | • | | potentially adverse tax consequences; |
| | • | | the burden of complying with a wide variety of foreign laws, treaties and technical standards; |
| | • | | difficulty in protecting our intellectual property; |
27
| | • | | acts of war or terrorism and insurrections; |
| | • | | difficulty in staffing and managing foreign operations; and |
| | • | | changes in economic policies by foreign governments. |
The effects of any of the risks described above could reduce our future revenues from our international operations.
Regional instability in Israel may adversely affect business conditions and may disrupt our operations and negatively affect our operating results.
A substantial portion of our research and development operations and our contract manufacturing occurs in Israel. As of December 31, 2007, we had 197 full-time employees located in Israel. In addition, we have additional capabilities at this facility consisting of customer service, marketing and general and administrative employees. Accordingly, we are directly influenced by the political, economic and military conditions affecting Israel, and any major hostilities, such as the hostilities in Lebanon in 2006, involving Israel or the interruption or curtailment of trade between Israel and its trading partners could significantly harm our business. The September 2001 terrorist attacks, the ongoing U.S. war on terrorism and the terrorist attacks and hostilities within Israel have heightened the risks of conducting business in Israel. In addition, Israel and companies doing business with Israel have, in the past, been the subject of an economic boycott. Israel has also been and is subject to civil unrest and terrorist activity, with varying levels of severity, since September 2000. Security and political conditions may have an adverse impact on our business in the future. Hostilities involving Israel or the interruption or curtailment of trade between Israel and its trading partners could adversely affect our operations and make it more difficult for us to recruit qualified personnel in Israel.
In addition, most of our employees in Israel are obligated to perform annual reserve duty in the Israel Defense Forces and several were called for active military duty in connection with the hostilities in Lebanon in mid-2006. Should hostilities in the region escalate again, some of our employees would likely be called to active military duty, possibly resulting in interruptions in our sales and development efforts and other impacts on our business and operations, which we cannot currently assess.
We may engage in future acquisitions that dilute the ownership interests of our stockholders, cause us to incur debt or assume contingent liabilities.
As part of our business strategy, from time to time, we review potential acquisitions of other businesses, and we expect to acquire businesses, products, or technologies in the future. In the event of any future acquisitions, we could:
| | • | | issue equity securities which would dilute current stockholders’ percentage ownership; |
| | • | | incur substantial debt; |
| | • | | assume contingent liabilities; or |
| | • | | expend significant cash. |
These actions could harm our business, operating results and financial condition, or the price of our common stock. Moreover, even if we do obtain benefits from acquisitions in the form of increased sales and earnings, there may be a delay between the time when the expenses associated with an acquisition are incurred and the time when we recognize such benefits. This is particularly relevant in cases where it is necessary to integrate new types of technology into our existing portfolio and where new types of products may be targeted for potential customers with which we do not have pre-existing relationships. Acquisitions and investment activities also entail numerous risks, including:
| | • | | difficulties in the assimilation of acquired operations, technologies and/or products; |
| | • | | unanticipated costs associated with the acquisition transaction; |
28
| | • | | the diversion of management’s attention from other business; |
| | • | | adverse effects on existing business relationships with suppliers and customers; |
| | • | | risks associated with entering markets in which we have no or limited prior experience; |
| | • | | the potential loss of key employees of acquired businesses; |
| | • | | difficulties in the assimilation of different corporate cultures and practices; and |
| | • | | substantial charges for the amortization of certain purchased intangible assets, deferred stock compensation or |
We may not be able to successfully integrate any businesses, products, technologies or personnel that we might acquire in the future, and our failure to do so could have a material adverse effect on our business, operating results and financial condition.
We are subject to securities class action lawsuits.
Since October 3, 2007, a series of purported shareholder class action lawsuits were filed in the United States District Court for the Northern District of California against us, certain of our officers and directors, and the underwriters of our initial public offering. One such suit was subsequently dismissed. In December 2007, a similar complaint was filed in the Superior Court for the City and County of San Francisco and subsequently removed by the defendants to the United States District Court. The lawsuits allege that our officers and directors made false or misleading statements to investors in connection with our initial public offering and thereafter, and that our registration statement and prospectus contained false or misleading statements regarding our business prospects. The plaintiffs purport to represent anyone who purchased our common stock in the initial public offering, or purchased our common stock between March 14 and September 27, 2007. The lawsuits assert causes of action for violations of Sections 11, 12(a)(2) and 15 of the Securities Act of 1933, and Sections 10(b) and 20(a) of the Securities Exchange Act of 1934. In February 2008, the lawsuits were consolidated and a lead plaintiff was appointed by the Court. We anticipate that the lead plaintiff will file a consolidated complaint and that the defendants will respond to the consolidated complaint during the first half of 2008. As a component of these lawsuits, we have the obligation to indemnify the underwriters for expenses related to the suit, including the cost of one counsel for the underwriters.
On December 11, 2007, a shareholder derivative lawsuit was filed against certain of our officers and directors in the Superior Court for the County of San Mateo, California. The company is named as a nominal defendant. The complaint alleges that the defendants violated their fiduciary duties in connection with our disclosures in connection with our initial public offering and thereafter, in particular by allegedly issuing false and misleading statements in our registration statement and prospectus regarding our business prospects. The lawsuit is in its earliest stages, and to date defendants have not responded to the complaint.
While we have directors and officers liability insurance that should defray the costs associated with defending these lawsuits, this litigation, regardless of its outcome, will result in substantial expense and significant diversion of the time and efforts of our management. In addition, it may damage our reputation with customers and investors. An adverse determination in any such proceeding could subject us to significant liabilities, as well as damage our reputation.
Economic downturns may impact our customers, and the resulting revenue shortfall may harm our operating results.
Many economists are predicting an economic downturn in 2008. An economic downturn could impact the demand for our products. Economic weakness or recession could result in our customers experiencing financial difficulties and/or electing to constrain spending on network expansion, which in turn could result in decreased
29
revenues and earnings for us. Such a result also could have a negative impact on our ability to forecast and manage the amount of components purchased from our suppliers. Economic downturn also may impair our investments. Economic uncertainty generally would make it difficult to forecast operating results, and future investment decisions that depend on those results. In the event of economic downturn, the foregoing negative impact on our customers, and on our ability to manage our business, could have a material adverse effect on our results of operations and stock price.
Negative conditions in the global credit markets may impair the value or reduce the liquidity of a portion of our investment portfolio.
As of December 31, 2007, we had $55.2 million in cash and cash equivalents and $99.4 million in investments in marketable debt securities. We have historically invested these amounts in government agency debt securities, corporate debt securities, commercial paper, auction rate securities, money market funds and taxable municipal debt securities meeting certain criteria. While we held $11.7 million of auction rate securities as of December 31, 2007, we currently hold no mortgaged-backed or auction rate securities. However, certain of our investments are subject to general credit, liquidity, market and interest rate risks, which may be exacerbated by U.S. sub-prime mortgage defaults that have affected various sectors of the financial markets and caused global credit and liquidity issues. In the future, these market risks associated with our investment portfolio may harm our results of operations, liquidity and financial condition.
We are subject to import/export controls that could subject us to liability or impair our ability to compete in international markets.
Our products are subject to U.S. export controls and may be exported outside the United States only with the required level of export license or through an export license exception, in most cases because we incorporate encryption technology into our products. In addition, various countries regulate the import of certain encryption technology and have enacted laws that could limit our ability to distribute our products or could limit our customers’ ability to implement our products in those countries. Changes in our products or changes in export and import regulations may create delays in the introduction of our products in international markets, prevent our customers with international operations from deploying our products throughout their global systems or, in some cases, prevent the export or import of our products to certain countries altogether. Any change in export or import regulations or related legislation, shift in approach to the enforcement or scope of existing regulations, or change in the countries, persons or technologies targeted by such regulations, could result in decreased use of our products by, or in our decreased ability to export or sell our products to, existing or potential customers internationally.
In addition, we may be subject to customs duties and export quotas, which could have a significant impact on our revenue and profitability. While we have not encountered significant difficulties in connection with the sales of our products in international markets, the future imposition of significant increases in the level of customs duties or export quotas could have a material adverse effect on our business.
If we fail to comply with environmental regulatory requirements, our future revenues could be adversely affected.
We face increasing complexity in our product design and procurement operations as we adjust to new and upcoming requirements relating to the materials composition of many of our products. The European Union, or EU, has adopted certain directives to facilitate the recycling of electrical and electronic equipment sold in the EU, including the Restriction on the Use of Certain Hazardous Substances in Electrical and Electronic Equipment directive that restricts the use of lead, mercury and certain other substances in electrical and electronic products placed on the market in the EU after July 1, 2006. In connection with our compliance with these environmental laws and regulations, we have incurred substantial costs, including research and development costs, and costs associated with assuring the supply of compliant components from our suppliers. Similar laws and regulations have been proposed or may be enacted in other regions, including in the United States, China and Japan. Other environmental
30
regulations may require us to reengineer our products to utilize components that are compatible with these regulations, and this reengineering and component substitution may result in additional costs to us or disrupt our operations or logistics.
New privacy laws and regulations or changing interpretations of existing laws and regulations could harm our business.
Governments in the United States and other countries have adopted laws and regulations regarding privacy and advertising that could impact important aspects of our business. In particular, governments are considering new limitations or requirements with respect to our customers’ collection, use, storage and disclosure of personal information for marketing purposes. Any legislation enacted or regulation issued could dampen the growth and acceptance of addressable advertising which is enabled by our products. If the use of our products to increase advertising revenue is limited or becomes unlawful, our business, results of operations and financial condition would be harmed.
We are exposed to fluctuations in currency exchange rates, which could negatively affect our financial results and cash flows.
Because a substantial portion of our employee base and one of our contract manufacturers are located in Israel, we are exposed to fluctuations in currency exchange rates between the U.S. dollar and the New Israeli Shekel. These fluctuations could have a material adverse impact on our financial results and cash flows.
A decrease in the value of the U.S. dollar relative to the Israeli New Shekel could increase the cost of operating expenses and procurement of raw materials to the extent we must purchase components denominated in the Israeli New Shekel. For example, from January 1, 2007 to December 31, 2007, the U.S. dollar declined 9% relative to the Israeli New Shekel. A weakened dollar could also increase the real cost to us of our expenses in countries outside the United States.
Currently, we hedge a portion of our anticipated future expenses denominated in the Israeli New Shekel, as well as those currency exposures associated with certain assets and liabilities denominated in currencies other than the U.S. dollar. The hedging activities undertaken by us are intended to partially offset the impact of currency fluctuations. If our attempts to hedge against these risks are not successful, our net income could be adversely impacted.
If we do not adequately manage and evolve our financial reporting and managerial systems and processes, our operating results and financial condition may be harmed.
Our ability to successfully implement our business plan and comply with regulations applicable to being a public reporting company requires an effective planning and management process. We expect that we will need to continue to improve existing, and implement new, operational and financial systems, procedures and controls to manage our business effectively in the future. Any delay in the implementation of, or disruption in the transition to, new or enhanced systems, procedures or controls, could harm our ability to accurately forecast sales demand, manage our supply chain and record and report financial and management information on a timely and accurate basis. In addition, the successful enhancement of our operational and financial systems, procedures and controls will result in higher general and administrative costs in future periods, and may adversely impact our operating results and financial condition.
In connection with our implementation, in the third quarter of 2006, of more stringent controls related to contracts for providing customer support, we discovered that certain end users in China maintained that they were entitled to Company-provided support, while our contracts with these customers did not provide for customer support. In response, the Audit Committee of our Board of Directors conducted an independent investigation of the matter, employing independent counsel and an independent accounting firm. The investigation, which was completed in December 2006, found numerous instances in which resellers of our product applications in China, with the understanding and approval of our China personnel, agreed to provide
31
technical support, extended warranty terms and potentially other undefined terms without proper documentation and without communicating these arrangements to our legal and finance departments. As a result, we were required to defer revenues as of December 31, 2006 from some customers in China, which were subsequently recognized as revenues in 2007 upon satisfactory meeting of the criteria of revenue recognition.
Our independent registered public accountants have identified and reported to us material weaknesses in our internal controls for the years ended December 31, 2004 and 2005, that, if not properly remediated, could result in material misstatements in our financial statements in future periods and impair our ability to comply with the accounting and reporting requirements applicable to public companies.
In 2004 and 2005, in connection with the audits of our consolidated financial statements, our independent registered public accounting firm identified material weaknesses in our internal control over financial reporting under the standards established by the American Institute of Certified Public Accountants. Our independent registered public accounting firm has indicated that the material weaknesses in our revenue recognition process and financial statement closing process resulted from having insufficient procedures in place and an insufficient number of qualified resources in our finance department with the required proficiency to apply our accounting policies in accordance with U.S. generally accepted accounting principles, or GAAP. Our independent registered public accounting firm was not, however, engaged to audit the effectiveness of our internal control over financial reporting. If such an evaluation had been performed or when we are required to perform such an evaluation, additional material weaknesses, significant deficiencies and other control deficiencies may have been or may be identified. Ensuring that we have adequate internal financial and accounting controls and procedures in place to help produce accurate financial statements on a timely basis is a costly and time-consuming effort that needs to be evaluated frequently. We will incur increased costs and demands upon management as a result of complying with the laws and regulations affecting public companies, which could adversely affect our operating results.
Because of these material weaknesses, there is heightened risk that a material misstatement of our annual or quarterly financial statements will not be prevented or detected. While we have completed our remediation efforts to address these material weaknesses, we cannot assure you that these remediation efforts have been entirely successful or that similar material weaknesses will not recur. As a newly public company, we are required to comply with the requirements of Section 404 of the Sarbanes-Oxley Act of 2002 as of December 31, 2008 and subsequent fiscal years. If we fail to maintain proper and effective internal controls in future periods, it could adversely affect our operating results, financial condition and our ability to run our business effectively and could cause investors to lose confidence in our financial reporting.
Accounting regulations related to equity compensation could adversely affect our earnings and our ability to attract and retain key personnel.
Since our inception, we have used stock options as a fundamental component of our employee compensation packages. We believe that our stock option plans are an essential tool to link the long-term interests of our stockholders and employees and serve to motivate management to make decisions that will, in the long run, give the best returns to stockholders. The Financial Accounting Standards Board has instituted changes to GAAP that require us to record a charge to earnings for employee stock option grants and employee stock purchase plan rights. In addition, NASDAQ Global Market, or NASDAQ, regulations requiring stockholder approval for all stock option plans could make it more difficult for us to grant options to employees in the future. To the extent that these or other new regulations make it more difficult or expensive to grant options to employees, we may incur increased compensation costs, change our equity compensation strategy or find it difficult to attract, retain and motivate employees, each of which could materially and adversely affect our business, operating results and financial condition.
32
Our business is subject to the risks of earthquakes, fire, floods and other natural catastrophic events, and to interruption by manmade problems such as computer viruses or terrorism.
Our corporate headquarters are located in the San Francisco Bay area, a region known for seismic activity. A significant natural disaster, such as an earthquake, fire or a flood, could have a material adverse impact on our business, operating results and financial condition. In addition, our servers are vulnerable to computer viruses, break-ins and similar disruptions from unauthorized tampering with our computer systems. In addition, acts of terrorism or war could cause disruptions in our or our customers’ business or the economy as a whole. To the extent that such disruptions result in delays or cancellations of customer orders, or the deployment of our products, our business, operating results and financial condition would be adversely affected.
Item 1B. Unresolved Staff Comments
None.
Item 2. Properties
Our corporate headquarters are located at 475 Broadway Street, Redwood City, California. These offices consist of approximately 22,336 square feet. The lease for this property expires in December 2008.
In addition to our headquarters, we lease approximately 87,319 square feet of office space in Westborough, Massachusetts under a lease that expires in March 2012 and approximately 70,826 square feet of office space in Tel Aviv, Israel that expires in February 2013. We also lease sales and support offices in Dusseldorf, Germany; Hong Kong, Shenzhen, Shanghai and Beijing, China; and Seoul, Korea.
We believe that our existing properties are in good condition and are sufficient and suitable for the conduct of our business. As our existing leases expire and as we continue to expand our operations, we believe that suitable space will be available on commercially reasonable terms.
Item 3. Legal Proceedings
A review of our current litigation is disclosed in the notes to our condensed consolidated financial statements. See “Notes to Condensed Consolidated Financial Statements, Note 6—Commitments and Contingencies.”
Item 4. Submission of Matters to a Vote of Security Holders
None.
33
PART II
Item 5. Market for Registrant’s Common Equity, Related Stockholder Matters and Issuer Purchases of Equity Securities
Market Information for Common Stock
Our common stock has been quoted on the Nasdaq Global Market under the symbol “BBND” since our initial public offering on March 20, 2007. Prior to that time, there was no public market for our common stock.
The following table sets forth for the indicated periods the high and low sales prices of our common stock as reported by the Nasdaq Global Market.
| | | | | | |
| | | High | | Low |
First quarter | | $ | 18.19 | | $ | 16.66 |
Second quarter | | $ | 21.43 | | $ | 13.11 |
Third quarter | | $ | 15.55 | | $ | 6.40 |
Fourth quarter | | $ | 6.66 | | $ | 5.14 |
Dividend Policy
We have never paid any cash dividends on our common stock. Our board of directors currently intends to retain any future earnings to support operations and to finance the growth and development of our business and does not intend to pay cash dividends on our common stock for the foreseeable future. Any future determination related to our dividend policy will be made at the discretion of our board.
Stockholders
As of March 1, 2008, there were 138 registered stockholders of record of our common stock.
Use of Proceeds from Sales of Registered Securities
On March 14, 2007, our registration statement (No. 333-139652) on Form S-1 was declared effective in connection with our initial public offering, pursuant to which we registered an aggregate of 12,305,000 shares of our common stock, of which we sold 7,500,000 shares and certain selling stockholders sold 4,805,000 shares, including the underwriters’ over-allotment, at a price to the public of $13.00 per share. The offering closed on March 20, 2007, and, as a result, we received net proceeds of approximately $87.8 million (after underwriters’ discounts and commissions of approximately $6.8 million and additional offering-related costs of approximately $2.9 million), and the selling stockholders received net proceeds of approximately $58.1 million (after underwriters’ discounts and commissions of approximately $4.4 million). The co-managing underwriters of the offering were Morgan Stanley & Co. Incorporated and Merrill Lynch, Pierce, Fenner & Smith Incorporated.
No payments for such expenses were made directly or indirectly to (i) any of our officers or directors or their associates, (ii) any persons owning 10% or more of any class of our equity securities, or (iii) any of our affiliates. We did not receive any proceeds from the sale of shares in the initial public offering by the selling stockholders. In March 2007 and April 2007, we used $14.0 million of the net proceeds to repay the outstanding balances under the revolving line of credit and the term loan with Silicon Valley Bank. We have invested the remaining net proceeds for working capital, capital expenditures and other general corporate purposes. In the future, we may also use a portion of our net proceeds to fund acquisitions of complementary businesses, products or technologies. However, we do not have agreements or commitments for any specific acquisitions at this time. Pending the uses described above, we have invested the net proceeds in a variety of short-term, interest-bearing, investment grade securities. There has been no material change in the planned use of proceeds from our initial public offering from that described in the final prospectus filed by us with the SEC pursuant to Rule 424(b) on March 15, 2007.
34
Recent Sales of Unregistered Securities
None.
Issuer Purchases of Equity Securities
None.
35
Item 6. Selected Financial Data
BigBand Networks, Inc. Selected Financial Data
| | | | | | | | | | | | | | | | | | | | |
| | | Years Ended December 31, | |
| | | 2007 | | | 2006 | | | 2005 | | | 2004 | | | 2003 | |
Consolidated Statements of Opterations Data: | | | | | | | | | | | | | | | | | | | | |
Net revenues | | | | | | | | | | | | | | | | | | | | |
Products | | $ | 144,715 | | | $ | 154,013 | | | $ | 85,966 | | | $ | 31,536 | | | $ | 20,014 | |
Services | | | 31,795 | | | | 22,611 | | | | 12,013 | | | | 3,936 | | | | 1,566 | |
| | | | | | | | | | | | | | | | | | | | |
Total net revenues | | | 176,510 | | | | 176,624 | | | | 97,979 | | | | 35,472 | | | | 21,580 | |
Cost of net revenues | | | | | | | | | | | | | | | | | | | | |
Products | | | 76,260 | | | | 74,152 | | | | 55,933 | | | | 21,300 | | | | 8,597 | |
Services | | | 13,414 | | | | 9,245 | | | | 3,900 | | | | 2,221 | | | | 1,027 | |
| | | | | | | | | | | | | | | | | | | | |
Total cost of net revenues | | | 89,674 | | | | 83,397 | | | | 59,833 | | | | 23,521 | | | | 9,624 | |
Gross profit | | | | | | | | | | | | | | | | | | | | |
Products | | | 68,455 | | | | 79,861 | | | | 30,033 | | | | 10,236 | | | | 11,417 | |
Services | | | 18,381 | | | | 13,366 | | | | 8,113 | | | | 1,715 | | | | 539 | |
| | | | | | | | | | | | | | | | | | | | |
Total gross profit | | | 86,836 | | | | 93,227 | | | | 38,146 | | | | 11,951 | | | | 11,956 | |
| | | | | | | | | | | | | | | | | | | | |
Operating expenses | | | | | | | | | | | | | | | | | | | | |
Research and development | | | 51,862 | | | | 37,194 | | | | 30,701 | | | | 21,582 | | | | 9,519 | |
Sales and marketing | | | 39,868 | | | | 29,523 | | | | 22,729 | | | | 15,891 | | | | 10,376 | |
General and administrative | | | 16,286 | | | | 13,176 | | | | 6,984 | | | | 5,782 | | | | 3,095 | |
Restructuring Charges | | | 2,998 | | | | — | | | | — | | | | — | | | | — | |
Amortization of intangible assets | | | 572 | | | | 572 | | | | 573 | | | | 286 | | | | — | |
In process research and development | | | — | | | | — | | | | — | | | | 966 | | | | — | |
| | | | | | | | | | | | | | | | | | | | |
Total operating expenses | | | 111,586 | | | | 80,465 | | | | 60,987 | | | | 44,507 | | | | 22,990 | |
| | | | | | | | | | | | | | | | | | | | |
Operating income (loss) | | | (24,750 | ) | | | 12,762 | | | | (22,841 | ) | | | (32,556 | ) | | | (11,034 | ) |
Other income (expense), net | | | 608 | | | | (1,360 | ) | | | (1,696 | ) | | | (957 | ) | | | (673 | ) |
| | | | | | | | | | | | | | | | | | | | |
Net income (loss) before provision for income taxes and cumulative effect of change in accounting principle | | | (24,142 | ) | | | 11,402 | | | | (24,537 | ) | | | (33,513 | ) | | | (11,707 | ) |
Provision for income taxes | | | 1,225 | | | | 2,525 | | | | 325 | | | | 250 | | | | — | |
| | | | | | | | | | | | | | | | | | | | |
Net income (loss) before cumulative effect of change in accounting principle | | | (25,367 | ) | | | 8,877 | | | | (24,862 | ) | | | (33,763 | ) | | | (11,707 | ) |
Cumulative effect of change in accounting principle | | | — | | | | — | | | | (633 | ) | | | — | | | | — | |
| | | | | | | | | | | | | | | | | | | | |
Net income (loss) | | $ | (25,367 | ) | | $ | 8,877 | | | $ | (25,495 | ) | | $ | (33,763 | ) | | $ | (11,707 | ) |
| | | | | | | | | | | | | | | | | | | | |
Net income (loss) per common share: | | | | | | | | | | | | | | | | | | | | |
Basic | | $ | (0.52 | ) | | $ | 0.78 | | | $ | (2.36 | ) | | $ | (4.20 | ) | | $ | (2.01 | ) |
| | | | | | | | | | | | | | | | | | | | |
Diluted | | $ | (0.52 | ) | | $ | 0.16 | | | $ | (2.36 | ) | | $ | (4.20 | ) | | $ | (2.01 | ) |
| | | | | | | | | | | | | | | | | | | | |
Shares used in computing net income (loss) per common share: | | | | | | | | | | | | | | | | | | | | |
Basic | | | 49,041 | | | | 11,433 | | | | 10,794 | | | | 8,032 | | | | 5,832 | |
| | | | | | | | | | | | | | | | | | | | |
Diluted | | | 49,041 | | | | 57,053 | | | | 10,794 | | | | 8,032 | | | | 5,832 | |
| | | | | | | | | | | | | | | | | | | | |
| | | | | |
| | | 2007 | | | 2006 | | | 2005 | | | 2004 | | | 2003 | |
Consolidated Balance Sheets Data: | | | | | | | | | | | | | | | | | | | | |
Cash, cash equivalents and marketable securities | | $ | 154,520 | | | $ | 65,474 | | | $ | 24,287 | | | $ | 23,796 | | | $ | 14,290 | |
Working capital | | | 109,296 | | | | 25,056 | | | | 5,812 | | | | 27,606 | | | | 16,188 | |
Total assets | | | 218,586 | | | | 129,050 | | | | 76,816 | | | | 80,052 | | | | 30,862 | |
Current and long-term debt | | | — | | | | 14,536 | | | | 11,418 | | | | 12,094 | | | | 4,662 | |
Preferred stock warrant liabilities | | | — | | | | 3,152 | | | | 1,642 | | | | — | | | | — | |
Redeemable convertible preferred stock | | | — | | | | 117,307 | | | | 117,307 | | | | 118,204 | | | | 75,060 | |
Common stock and additional paid-in capital | | | 248,201 | | | | 17,075 | | | | 14,990 | | | | 14,049 | | | | 1,535 | |
Total stockholders’ equity (deficit) | | $ | 111,586 | | | $ | (95,614 | ) | | $ | (107,819 | ) | | $ | (83,926 | ) | | $ | (59,388 | ) |
36
Item 7. Management’s Discussion and Analysis of Financial Condition and Results of Operations
The following discussion of our financial condition and results of operations should be read together with the consolidated financial statements and related notes that are included elsewhere in this prospectus. This discussion contains forward-looking statements, which are based upon current expectations that involve risks and uncertainties. Our actual results may differ materially from those anticipated in these forward-looking statements as a result of various factors, including those set forth under “Risk Factors” or in other parts of this prospectus.
Overview
Our company was founded in December 1998, and through 2001 we were engaged principally in research and development. We first generated meaningful product revenues in 2002, principally from our initial media processing platform designed for video. Since 2003, we have expanded our customer base to include six of the ten largest service providers in the United States, including Cablevision, Comcast, Charter, Cox, Time Warner Cable and Verizon. From 2003 through 2005, we experienced significant revenue growth that was derived primarily from cable operators. Beginning in 2005, we commenced sales efforts to telephone companies and began recognizing significant revenues from one of these companies in 2006. In 2007, we initiated a restructuring plan to retire our CMTS platform and realign our business.
Our net revenues are influenced by a variety of factors, including the level and timing of capital spending of our customers, and the annual budgetary cycles of, and the timing and amount of orders from, significant customers. The selling prices of our products vary based upon the particular customer implementation, which impacts the relative mix of software, hardware and services associated with the sale.
Our sales cycle for an initial customer purchase typically ranges from nine to eighteen months, but can be longer. This process generally involves several stages before we can recognize revenues on the sale of our products. As a provider of advanced technologies, we seek to actively participate with our existing and potential customers in the evaluation of their technology needs and network architectures, including the development of initial designs and prototypes. Following these activities, we typically respond to a service provider’s request for proposal, configure our products to work within our customer’s network architecture, and test our products first in laboratory testing and then in field environments to ensure interoperability with existing products in the service provider’s network. Following testing, our revenue recognition depends on satisfying complex customer acceptance criteria specified in our contract with the customer and our customer’s schedule for roll-out of the product. Completion of several of these stages is substantially outside of our control, which causes our revenue patterns from a given customer to vary widely from period to period. After initial deployment of our products, subsequent purchases of our products typically have a more compressed sales cycle.
Due to the nature of the cable and telecommunications industries, we sell our products to a limited number of large customers, which have varied over time. For the years ended December 31, 2007, 2006 and 2005, we derived approximately 75%, 79% and 69% of our net revenues from our top five customers, respectively. In 2007, Cox, Time Warner Cable and Verizon each represented 10% or more of our net revenues. In 2006, Comcast, Cox, Time Warner Cable and Verizon each represented 10% or more of our net revenues. We believe that for the foreseeable future our net revenues will be highly concentrated in a relatively small number of large customers. The loss of one or more of our large customers, or the cancellation or deferral of purchases by one or more of these customers, would have a material adverse impact on our revenues and operating results.
We sell our products and services to customers in the United States through our direct sales force. We sell to customers internationally through a combination of direct sales and resellers. In the year ended December 31, 2007, approximately 83% of our net revenues were to customers in the United States and 17% were to customers outside the United States. Domestic sales for 2006 accounted for 89% of our net revenues while sales to customers outside of the United States accounted for 11% of our net revenues.
Net Revenues. We derive our net revenues from sales of, and services for, video and data products. Our product revenues are comprised of a combination of software licenses and hardware. Our primary video products
37
include Digital Simulcast, TelcoTV and Switched Digital Video. Our data products include High-Speed Data and Voice-over-IP. Our services include ongoing customer support and maintenance, product installation and training. Our customer support and maintenance is available in a tiered offering at either a standard or enhanced level. The substantial majority of our customers have purchased our enhanced level of customer support and maintenance. The accounting for our net revenues is complex and, as discussed below, we account for revenues in accordance with Statement of Position, or SOP 97-2,Software Revenue Recognition.
Cost of Net Revenues. Our cost of product revenues consists primarily of payments for components and product assembly, costs of product testing, provisions taken for excess and obsolete inventory and for warranty obligations and manufacturing overhead. Cost of services revenues is primarily comprised of personnel costs in providing technical support, costs incurred to support deployment and installation within our customers’ networks and training costs.
Gross Margin. Our gross profit as a percentage of net revenues, or gross margin, has been and will continue to be affected by a variety of factors, including the mix of software and hardware sold, the mix of revenue between our video products, the average selling prices of our products, and the mix of revenue between products and services. We achieve a higher gross margin on the software content of our products compared to the hardware content. In general, we expect the average selling prices of our products to decline over time, but we seek to maintain our overall gross margins by introducing new products with higher margins, selling software enhancements to existing products, achieving price reductions for components and improving product design to reduce costs. Our gross margins for products are also influenced by the specific terms of our contracts, which may vary significantly from customer to customer based on the type of products sold, the overall size of the customer’s order, and the architecture of the customer network, which can influence the amount and complexity of design, integration and installation services. With the discontinuation of the CMTS platform, we expect margins to slightly benefit going forward, as our data product margins were lower.
Operating Expense. Our operating expense consists of research and development, sales and marketing, general and administrative, restructuring charges and amortization of intangible assets. Personnel related costs are the most significant component of operating expense. In 2008, we expect overall operating expense to increase modestly over 2007. We grew from 330 employees at December 31, 2004 to 518 at December 31, 2007. Following our restructuring (which reduced our headcount by nearly 100 people), we expect headcount to increase only modestly in the near-term, but expect outsourced research and development support to increase significantly throughout 2008.
Research and development expense is the largest component of our operating expense and consists primarily of personnel costs, independent contractor costs, prototype expenses and other allocated facilities and information technology expense. The majority of our research and development staff is focused on software development. All research and development costs are expensed as incurred. Our development teams are located in Westborough, Massachusetts, Tel Aviv, Israel, Redwood City, California and Shenzhen, Peoples’ Republic of China. We expect our research and development expense to increase modestly in absolute dollars in the near-term periods.
Sales and marketing expense relates primarily to compensation and associated costs for marketing and sales personnel, sales commissions, promotional and other marketing expenses, travel, trade-show expenses, depreciation expenses for demonstration equipment used for trade-shows and allocated facilities and information technology expense. Marketing programs are intended to generate net revenues from new and existing customers and are expensed as incurred. We expect sales and marketing expense to remain relatively flat in absolute dollars in the near-term periods.
General and administrative expense consists primarily of compensation and associated costs for general and administrative personnel, professional fees and allocated facilities and information technology expenses. Professional services consist of outside legal, accounting and information technology and other consulting costs. We expect that general and administrative expense will increase modestly in absolute dollars as we incur legal fees related to a lawsuit filed against Imagine Communications, Inc. alleging patent infringement and legal fees
38
related to class action litigation filed against the company. We will also continue to incur additional costs related to being a public company, including the costs of financial reporting, Sarbanes-Oxley Act compliance and director and officer liability insurance.
On October 29, 2007, the Audit Committee of our board of directors authorized a restructuring plan providing for the retirement of the Company’s cable modem termination system (CMTS) platform along with an approximate 15% company-wide reduction in force. As a result, the Company recorded a restructuring provision of approximately $3.0 million, which consisted primarily of severance costs, lease termination costs and other associated costs. We expect charges arising from this plan to be insignificant in future periods.
Overall, our restructuring plan to improve efficiency and operating results is expected to generate annual cost savings of approximately $7 million—$8 million related to lower salaries, benefits arrangements and lease costs related to the data business, which savings will be largely offset by anticipated increases in operating expenses in support of the growth of our video business.
2007 Significant Events
| | • | | On March 20, 2007, we completed the initial public offering of our common stock. From the sale of 7.5 million shares at an offering price of $13.00 per share, we received net proceeds of approximately $87.8 million. |
| | • | | For the year ended December 31, 2007, revenues were $176.5 million, which was below our internal forecast for the second half of 2007. Our top five customers accounted for 75% of our net revenues compared to 79% in the year ago period. In 2007, Cox, Time Warner Cable and Verizon each represented 10% or more of our net revenues. |
| | • | | For the year ended December 31, 2007, gross margin was 49.2% compared to 52.8% in the year ended December 31, 2006. The decrease was primarily due to a $5.0 million inventory charge related to the CMTS platform. |
| | • | | For the year ended December 31, 2007, net loss was $25.4 million. The net loss for fiscal year 2007 included a non-cash charge of $5.0 million related to the fair value of convertible preferred stock warrants, stock-based compensation expense of $11.6 million, $5.8 million in fixed assets and inventory charges associated with the retirement of the CMTS platform and $3.0 million in restructuring charges. |
Critical Accounting Policies and Estimates
Our consolidated financial statements have been prepared in accordance with GAAP. The preparation of our consolidated financial statements requires our management to make estimates, assumptions, and judgments that affect the reported amounts of assets and liabilities and disclosure of contingent assets and liabilities at the date of the financial statements, and the reported amounts of revenues and expenses during the applicable periods. Management bases its estimates, assumptions, and judgments on historical experience and on various other factors that are believed to be reasonable under the circumstances. Different assumptions and judgments would change the estimates used in the preparation of our consolidated financial statements, which, in turn, could change the results from those reported. Our management evaluates its estimates, assumptions and judgments on an ongoing basis.
The critical accounting policies requiring estimates, assumptions, and judgments that we believe have the most significant impact on our consolidated financial statements are described below.
Revenue Recognition
We derive net revenues from sales of our products and services. Product revenues consists of sales of our hardware and software products. Shipping charges, which have been insignificant to date, are included in product revenues, and the related shipping costs are included in cost of product revenues. Service revenues consists of customer support and maintenance, program management and training activities.
39
Software is essential to the functionality of our products. We provide software updates that we choose to develop, which we refer to as unspecified software updates, and enhancements related to our products through support service contracts. As a result, we account for revenue in accordance with Statement of Position,Software Revenue Recognition as amended by SOP 98-9, Modification of SOP 97-2, Software Revenue Recognition, With Respect to Certain Transactions, or SOP 97-2, for all transactions involving the sale of software.
We recognize product revenues when all of the following have occurred: (1) we have entered into an arrangement with a customer; (2) delivery has occurred; (3) customer payment is deemed fixed or determinable and free of contingencies and significant uncertainties; and (4) collection is probable. Pricing is considered fixed or determinable at the execution of a customer arrangement, based on specific products and quantities to be delivered at specified prices. We assess the ability to collect from our customers based on a number of factors, including credit-worthiness and any past transaction history of the customer. In the limited circumstances where we may have a customer not deemed creditworthy, we will defer all revenues from the arrangement until payment is received and all other revenue recognition criteria have been met.
Product revenues consist of hardware and a perpetual license to our software. Product revenues are generally recognized upon transfer of title to the customer assuming all other revenue recognition criteria are met, except for customers that require contractually negotiated acceptance of our products, in which case we recognize revenues at the earlier of receipt of acceptance from the customer or when the rejection period lapses. Substantially all of our contracts, including those with resellers, do not include rights of return. To the extent that our agreements contain such terms, we recognize revenue when the amount of future returns can be reasonably estimated in accordance with the guidance under Statement of Financial Accounting Standards No. 48 (as amended),Revenue Recognition When Right of Return Exists. Returns to date have been insignificant. Our resellers generally do not maintain any inventory and only receive products from us when an end-user customer has committed to the purchase.
Most of our products are sold in combination with customer support and maintenance services, which consist of software updates and product support. Software updates provide customers with rights to unspecified software updates that we choose to develop and to maintenance releases and patches released during the term of the support period. Product support services include telephone support, remote diagnostics, email and web access, access to on-site technical support personnel and repair or replacement of hardware in the event of damage or failure during the term of the support period. Net revenues for support services are recognized on a straight-line basis over the service contract term, which is generally one year. Installation services and training services, when provided, are also recognized in service revenues when performed.
We use the residual method, as allowed by SOP 98-9,Modification of SOP 97-2, Software Revenue Recognition, With Respect to Certain Transactions, to recognize revenue when a product agreement includes one or more elements to be delivered at a future date and vendor specific objective evidence, or VSOE, of the fair value of all undelivered elements exists. Under the residual method, the fair value of the undelivered elements is deferred and any remaining amount provided for under the contract is recognized. When the undelivered element is customer support and maintenance, that portion of the revenue is recognized ratably over the term of the customer support arrangement, and the remaining revenue associated with the arrangement is recognized when all the other criteria of SOP 97-2 are satisfied. We have established VSOE of the fair value of our customer support and maintenance and other services based upon the normal pricing and discounting practices for those services when sold separately and based on the prices at which our customers have renewed their customer support and maintenance arrangements. If evidence of the fair value of one or more undelivered elements does not exist, all revenues are deferred and recognized when delivery of those elements occurs or when fair value can be established. For example, in situations where we sell a product which includes a commitment for delivery of a future specified software feature or functionality, we defer revenue recognition for the entire arrangement until the specified software feature or functionality is delivered. In those instances where the only undelivered element is for customer support and there is no evidence of fair value for this support, the product and customer support revenue are deferred and revenue is recognized ratably over the support period.
40
Valuation of Inventories
Inventories are stated at the lower of cost or market. Cost is determined on the first-in, first-out method. We provide for excess and obsolete inventories after evaluation of historical sales and usage, current economic trends, market conditions, product rationalization, forecasted sales, product lifecycle and current inventory levels. Provisions for excess and obsolete inventory are recorded as cost of net product revenues. This evaluation requires us to make estimates regarding future events in an industry where rapid technological changes are prevalent. It is possible that increases in inventory write-downs may be required in the future if there is a decline in market conditions or if changes in expected product lifecycles occur. If market conditions improve or product lifecycles extend, we may have greater success in selling inventory that had previously been written down. In either event, the actual value of our inventory may be higher or lower and recognition of such difference will affect our cost of net revenues in a future period, which could materially affect our operating results and financial position.
Warranty Liabilities
We warrant our products against defects in materials and workmanship. Generally, we warrant our products for one year. For our largest telephone company customer, we warrant our products for five years. A provision for estimated future costs related to warranty activities is recorded as a component of cost of net product revenues when the product revenues are recognized based upon our historical product failure rates and historical costs incurred in correcting product failures. The recorded amount is adjusted from time to time for specifically identified warranty exposures. Where we have experienced higher product failure rates and costs of correcting product failures change, or our estimates relating to specifically identified warranty exposures changed, we have recorded additional warranty reserves and may be required to do so in future periods. If our estimated reserves differ from our actual warranty costs based on historical experience, we may reverse a portion of or increase such provisions in future periods. In the event we change our warranty reserve estimates, the resulting charge against future cost of sales or reversal of previously recorded charges may materially affect our gross margins and operating results.
Stock-Based Compensation
We grant options to purchase our common stock to our employees, directors and to non-employees under our equity incentive plan. Eligible employees can also purchase shares of our common stock under our employee stock purchase plan at the lower of: i) 85% of the fair market value on the first day of a six-month offering period; or (ii) 85% of the fair market value on the last date of the six-month offering period.
Prior to January 1, 2006, we accounted for employee stock options using the intrinsic value method in accordance with Accounting Principles Board, Opinion No. 25, Accounting for Stock Issued to Employees , or APB 25, and Financial Accounting Standards Board Interpretation, or FIN 44, Accounting for Certain Transactions Involving Stock Compensation, an Interpretation of APB No. 25, and had adopted the disclosure only provisions of Statement of Financial Accounting Standards, or SFAS, No. 123, Accounting for Stock-Based Compensation (SFAS 123) and SFAS No. 148, Accounting for Stock-Based Compensation—Transition and Disclosure (SFAS 148) using the minimum value method.
In accordance with APB 25, stock-based compensation expense, which is a non-cash charge, resulted from stock option grants at exercise prices that, for financial reporting purposes, were deemed to be below the estimated fair value of the underlying common stock on the date of grant. During the years ended December 31, 2007, 2006 and 2005, we amortized $0.9 million, $1.1 million, and $1.1 million of deferred compensation expense, net of reversals, respectively. As of December 31, 2007 we have a remaining balance of $0.2 million that will be amortized in future periods, net of reversals.
Effective January 1, 2006, we adopted the fair value recognition provisions of SFAS No. 123(R), Share-Based Payment , using the prospective transition method, which requires us to apply the provisions of SFAS 123(R) to new awards granted, and to awards modified, repurchased or cancelled, after the effective date. Under this transition
41
method, stock-based compensation expense recognized beginning January 1, 2006 is based on a combination of the following: (a) the grant-date fair value of stock option awards and employee stock purchase plan shares granted or modified after January 1, 2006; and (b) the amortization of deferred stock-based compensation related to stock option awards granted prior to January 1, 2006, which was calculated using the intrinsic value method as previously permitted under APB 25.
Under SFAS 123(R), we estimated the fair value of stock options granted using a Black-Scholes option-pricing formula and a single option award approach. This model utilizes the estimated fair value of common stock and requires that, at the date of grant, we use the expected term of the option, the expected volatility of the price of our common stock, risk free interest rates and expected dividend yield of our common stock. This fair value is then amortized on a straight-line basis over the requisite service periods of the awards, which is generally the vesting period. Options typically vest with respect to 25% of the shares one year after the options’ vesting commencement date and the remainder ratably on a monthly basis over the following three years. Employee stock purchase plan shares vest over six months, and include two purchase dates per year. Actual results may differ substantially from these estimates. In valuing share-based awards under SFAS 123(R), significant judgment is required in determining the expected volatility of our common stock and the expected term individuals will hold their share-based awards prior to exercising. Expected volatility of the stock is based on our peer group in the industry in which we do business because we do not have sufficient historical volatility data for our own stock. The expected term of options granted represents the period of time that options granted are expected to be outstanding and was calculated using the simplified method permitted by the SEC Staff Accounting Bulletin No., 107. In the future, as we gain historical data for volatility in our own stock and the actual term employees hold our options, expected volatility and expected term may change which could substantially change the grant-date fair value of future awards of stock options and ultimately the expense we record.
As of December 31, 2007, the total compensation cost related to stock-based awards granted under SFAS 123R to employees and directors but not yet amortized was approximately $38.2 million, net of estimated forfeitures. These costs, adjusted for changes in estimated forfeiture rates from time to time, will be amortized over the next four years. Stock-based compensation expense for awards granted to employees and directors for the years ended December 31, 2007 and 2006 was approximately $11.3 million and $2.5 million, respectively.
We account for stock compensation arrangements with non-employees in accordance with SFAS 123 and Emerging Issues Task Force, or EITF, No. 96-18, Accounting for Equity Instruments That Are Issued to Other Than Employees for Acquiring, or in Conjunction with Selling, Goods or Services , using a fair value approach. For stock options granted to non-employees, the fair value of the stock options is estimated using a Black-Scholes valuation model. In 2007 we granted 31,250 options and 1,875 restricted shares to non employees and recognized stock based compensation expense of $0.3 million in 2007 associated with these awards.
Allowances for Doubtful Accounts
We make judgments as to our ability to collect outstanding accounts receivable and provide allowances for the applicable portion of accounts receivable when collection becomes doubtful. We provide allowances based upon a specific review of all significant outstanding invoices, analysis of our historical collection experience and current economic trends. If the historical data used to calculate the allowance for doubtful accounts does not reflect our future ability to collect outstanding accounts receivable, additional provisions for doubtful accounts may be needed and our future results of operations could be materially affected. Our allowance for doubtful accounts was approximately $142,000 and $152,000 at December 31, 2007 and 2006, respectively.
Impairment of Intangible Assets and Other Long-lived Assets
We assess impairment of long-lived assets for recoverability when events or changes in circumstances indicate that their carrying amount may not be recoverable. Circumstances which could trigger a review include, but are not limited to: significant decreases in the market price of the asset; significant adverse changes in the business climate or legal factors; accumulation of costs significantly in excess of the amount originally expected
42
for the acquisition or construction of the asset; current period cash flow or operating losses combined with a history of losses or a forecast of continuing losses associated with the use of the asset; or current expectation that the asset will more likely than not be sold or disposed of significantly before the end of its estimated useful life.
Recoverability is assessed based on the sum of the undiscounted cash flows expected to result from the use and the eventual disposal of the asset. An impairment loss is recognized in the consolidated statements of operations when the carrying amount is not recoverable and exceeds fair value, which is determined on a discounted cash flow basis.
We make estimates and judgments about future undiscounted cash flows and fair value. Although our cash flow forecasts are based on assumptions that are consistent with our plans, there is significant exercise of judgment involved in determining the cash flows attributable to a long-lived asset over its estimated remaining useful life. Our estimates of anticipated future cash flows could be reduced significantly in the future. As a result, the carrying amount of our long-lived assets could be reduced through impairment charges in the future. Changes in estimated future cash flows could also result in a shortening of estimated useful life of long-lived assets including intangibles for depreciation and amortization purposes.
Accounting for Income Taxes
As part of the process of preparing our consolidated financial statements we are required to estimate our taxes in each of the jurisdictions in which we operate. We estimate actual current tax exposure together with assessing temporary differences resulting from differing treatment of items, such as accruals and allowances not currently deductible for tax purposes. These differences result in deferred tax assets and liabilities, which are included in our consolidated balance sheets. In general, deferred tax assets represent future tax benefits to be received when certain expenses previously recognized in our consolidated statements of operations become deductible expenses under applicable income tax laws or loss or credit carry forwards are utilized. Accordingly, realization of our deferred tax assets is dependent on future taxable income against which these deductions, losses, and credits can be utilized. We must assess the likelihood that our deferred tax assets will be recovered from future taxable income and to the extent we believe that recovery is not likely, we must establish a valuation allowance.
Management judgment is required in determining our provision for income taxes, our deferred tax assets and liabilities, and any valuation allowance recorded against our net deferred tax assets. As of December 31, 2007, we recorded a full valuation allowance against our deferred tax assets arising from U.S. operations since, based on the available evidence, we believed at that time it was more likely than not that we would not be able to utilize all of these deferred tax assets in the future. We intend to maintain the full valuation allowances against our U.S. deferred tax assets until sufficient evidence exists to support the reversal of the valuation allowances. We make estimates and judgments about our future taxable income that are based on assumptions that are consistent with our plans and estimates. Should the actual amounts differ from our estimates, the amount of our valuation allowance could be materially impacted.
Effective January 1, 2007, we adopted Financial Interpretation No. 48,Accounting for Uncertainty in Income Taxes-an interpretation of FASB Statement No. 109 (“FIN 48”). FIN 48 contains a two-step approach to recognizing and measuring uncertain tax positions accounted for in accordance with SFAS No. 109, “Accounting for Income Taxes.” The first step is to evaluate the tax position for recognition by determining if the weight of available evidence indicates that it is more likely than not that the position will be sustained on audit, including resolution of related appeals or litigation processes, if any. The second step is to measure the tax benefit as the largest amount that is more than 50% likely of being realized upon settlement. Management judgment is required to perform the evaluation and measurement process. Although we believe we have adequately reserved for our uncertain tax positions, no assurance can be given that the final tax outcome of these matters will not be different. To the extent that the final tax outcome of these matters is different than the amounts recorded, such differences will impact the provision for income taxes in the period in which such determination is made. The Company’s policy to include interest and penalties related to unrecognized tax benefits within the Company’s
43
provision from income taxes did not change. The Company’s only major tax jurisdictions are the United States and Israel. The tax years 1998 through 2007 remain open and subject to examination by the appropriate governmental agencies in the U.S. and the tax years 2004 through 2007 remain open and subject to examination by the appropriate governmental agencies in Israel. The Company’s total amount of unrecognized tax benefits as of December 31, 2007 was $1.4 million.
Results of Operations
The following table shows the percentage relationships of the listed items from our consolidated statements of operations, as a percentage of total net revenues for the periods indicated:
| | | | | | | | | |
| | | Years Ended December 31, | |
| | | 2007 | | | 2006 | | | 2005 | |
Consolidated Statements of Operations Data: | | | | | | | | | |
Net revenues | | | | | | | | | |
Products | | 82.0 | % | | 87.2 | % | | 87.7 | % |
Services | | 18.0 | % | | 12.8 | % | | 12.3 | % |
| | | | | | | | | |
Total net revenues | | 100.0 | % | | 100.0 | % | | 100.0 | % |
| | | | | | | | | |
Cost of net revenues | | | | | | | | | |
Products | | 43.2 | % | | 42.0 | % | | 57.1 | % |
Services | | 7.6 | % | | 5.2 | % | | 4.0 | % |
| | | | | | | | | |
Total cost of net revenues | | 50.8 | % | | 47.2 | % | | 61.1 | % |
| | | | | | | | | |
Total gross profit | | 49.2 | % | | 52.8 | % | | 38.9 | % |
| | | | | | | | | |
Operating expense | | | | | | | | | |
Research and development | | 29.4 | % | | 21.1 | % | | 31.3 | % |
Sales and marketing | | 22.6 | % | | 16.7 | % | | 23.2 | % |
General and administrative | | 9.2 | % | | 7.5 | % | | 7.1 | % |
Restructuring charges | | 1.7 | % | | 0.0 | % | | 0.0 | % |
Amortization of intangible assets | | 0.3 | % | | 0.3 | % | | 0.6 | % |
| | | | | | | | | |
Total operating expense | | 63.2 | % | | 45.6 | % | | 62.2 | % |
| | | | | | | | | |
Operating income (loss) | | (14.0 | )% | | 7.2 | % | | (23.3 | ) |
Interest income | | 3.9 | % | | 0.9 | % | | 0.6 | % |
Interest expense | | (0.4 | )% | | (1.0 | )% | | (1.7 | )% |
Other expense, net | | (3.2 | )% | | (0.7 | )% | | (0.7 | )% |
| | | | | | | | | |
Net income (loss) before provision for income taxes and cumulative effect of change in accounting principle | | (13.7 | )% | | 6.4 | % | | (25.1 | )% |
Provision for income taxes | | 0.7 | % | | 1.4 | % | | 0.3 | % |
| | | | | | | | | |
Net income (loss) before cumulative effect of change in accounting principle | | (14.4 | )% | | 5.0 | % | | (25.4 | )% |
Cumulative effect of change in accounting principle | | 0.0 | % | | 0.0 | % | | (0.6 | )% |
| | | | | | | | | |
Net income (loss) | | (14.4 | )% | | 5.0 | % | | (26.0 | )% |
| | | | | | | | | |
Years Ended December 31, 2007 and 2006
Net Revenues. Net revenues for 2007 were $176.5 million compared to $176.6 million for 2006, or a decrease of $0.1 million. Revenues from our top five customers comprised 75% and 79% of net revenues for 2007 and 2006, respectively. During 2007, revenues from customers in the United States comprised 83% of net revenues compared to 2006, in which customers in the United States comprised 89% of net revenues. The increase in 2007 revenues from customers outside the United States was partly a result of approximately $5.3 million in revenues recognized from customers in China that were previously deferred.
44
Products revenues for 2007 were $144.7 million compared to $154.0 million for 2006, a decrease of $9.3 million, or 6.0%. This decrease was primarily due to an $8.4 million decrease in revenues from our Data products with revenue from the Video products staying relatively flat. The decrease in Data product revenues was due to the unsuccessful transition to the new modular CMTS product application, which caused delays in revenue recognition, and the retirement of the CMTS platform under the plan approved by the Audit Committee of the Board of Directors in October 2007.
Services revenues for 2007 were $31.8 million compared to $22.6 million for 2006, an increase of $9.2 million, or 40.6%. This increase was primarily due to an increase in service revenues related to additional orders for product and licenses along with increases in maintenance renewals and service revenues related to prior year installations for our Telco customers.
Gross Profit/Gross Margin. Gross profit for 2007 was $86.8 million compared to $93.2 million for 2006, a decrease of $6.4 million, or 3.6%. Gross margin decreased to 49.2% in 2007 compared to 52.8% in 2006 principally as a result of lower product gross margins and, to a lesser extent, as a result of reduced services gross margins.
Products gross margin for 2007 was 47.3% compared to 51.9% for 2006. This decrease was primarily related to a $5.0 million inventory charge related to the discontinuation of the CMTS platform along with higher manufacturing overhead charges arising from increased head count. Product gross margin in 2007 also included a $0.6 million increase in stock compensation expense compared to 2006.
Services gross margin for 2007 was 57.8% compared to 59.1% for 2006. The decrease in 2007 was primarily related to an increase in services organization headcount to support the customer installed base, which was not offset by the same increase in services revenue. To a lesser extent, the lower services margins was the result of installation and training revenues (which has relatively lower gross margins than customer support revenue) representing a larger portion of services revenues. Services gross margin included a $0.6 million increase in stock compensation expense compared to 2006.
Research and Development. Research and development expense was $51.9 million for 2007, or 29.4% of net revenues, compared to $37.2 million in the comparable period of 2006, or 21.1% of net revenues. The $14.7 million increase was primarily due to increased compensation costs of $9.3 million attributable to an increase in employee headcount to support new product offerings. To a lesser extent, research and development expense increased as a result of an increase in depreciation expense of $1.3 million and an increase in travel expense of $0.5 million. This increase in compensation expense includes an increase of $2.8 million in stock-based compensation.
Sales and Marketing. Sales and marketing expense was $39.9 million, or 22.6% of net revenues, for 2007 compared to $29.5 million, or 16.7% of net revenues, during 2006. The $10.4 million increase was primarily due to increased compensation costs of $8.1 million from additional employee headcount for which we incurred increased commissions and salaries. In addition, 2007 travel-related cost increased by $1.0 million along with a $0.6 million increase in marketing related activities due to increased employee headcount. This increase in compensation expense includes an increase of $3.5 million in stock-based compensation.
General and Administrative. General and administrative expense was $16.3 million, or 9.2% of net revenues, for 2007 compared to $13.2 million, or 7.5% of net revenues, during 2006. The $3.1 million increase was primarily due to increased compensation costs of $3.7 million attributable to an increase in employee headcount, including additional accounting and finance personnel. To a lesser extent, general and administrative expense increased as a result of an increase of $1.2 million in legal fees related to patent infringement and class action litigation, and a $0.5 million increase in insurance costs attributable to being a public company. These additional 2007 costs were offset by a $1.1 million decrease in spending related to our preparation for becoming a public company, including consulting costs associated with Sarbanes-Oxley compliance and improvement to our ERP systems. This increase in compensation expense includes an increase of $1.5 million in stock-based compensation.
45
Restructuring Charges. In October 2007 we restructured our business and decreased company-wide headcount by approximately 15% and to retire our CMTS platform. This resulted in a restructuring charge of approximately $3.0 million. Severance payments and related charges of approximately $2.2 million consisted primarily of salary, expected payroll taxes, and medical benefits for terminated employees. Lease termination costs of $0.7 million are related to the closure of five offices along with $0.1 million in other expenses. We do not anticipate 2008 net revenues to be significantly impacted due to the restructuring plan, however, we expect gross margins to improve slightly in 2008, as the CMTS platform historically earned lower gross margins.
Other Expense, Net. Other expense, net includes interest income, interest expense and other expenses. It increased $2.0 million to an income of $0.6 million in 2007 from an expense of $1.4 million in 2006. Other expense, net in 2007 included approximately $5.0 million in charges for fair value adjustments of our preferred stock warrants under FSP 150-5. Interest income increased by $5.4 million to $6.9 million from $1.5 million for 2006 as a result of interest earned on investment in marketable securities from the proceeds received from our initial public offering. The proceeds were also used in 2007 to repay outstanding borrowings, which resulted in decreased interest expense of $1.1 million from 2006.
Provision for Income Taxes. We incurred U.S. operating losses in all years from inception through 2007, except in 2006. Because of net operating loss carryforwards in the United States, the provision for income taxes of $1.2 million and $2.5 million for 2007 and 2006, respectively, were primarily related to provisions for foreign income taxes. As of December 31, 2007, we had net operating loss carryforwards for federal and state income tax purposes of $90.8 million and $45.1 million, respectively. As of December 31, 2007, the portion of the federal and state operating loss carryforwards, which relates to stock option benefits is approximately $8.8 million which will be recorded in equity when those losses reduce income taxes payable. We also had federal research and development tax credit carryforwards of approximately $2.3 million and state research and development tax credit carryforwards of approximately $1.0 million. Realization of deferred tax assets is dependent upon future earnings, if any, the timing and amount of which is uncertain. Accordingly, the net deferred tax assets arising from U.S. operations have been fully offset by a valuation allowance. If not utilized, the federal net operating loss and tax credit carryforwards will expire between 2019 and 2027, and the state net operating loss and tax credit carryforward will expire in different years depending on the specific state, ranging from 2009 to indefinite. Utilization of these net operating losses and credit carryforwards will likely be subject to an annual limitation due to the provisions of Section 382 of the Internal Revenue Code.
Years Ended December 31, 2006 and 2005
Net Revenues. Net revenues for 2006 were $176.6 million compared to $98.0 million for 2005, an increase of $78.6 million, or 80.3%. Revenues from our top five customers comprised 79% and 69% of net revenues for 2006 and 2005, respectively. During 2006, revenues from customers in the United States comprised 89% of net revenues, compared to 2005, in which customers in the United States comprised 83% of net revenues.
Products revenues for 2006 were $154.0 million compared to $86.0 million for 2005, an increase of $68.0 million, or 79.2%. This increase was primarily due to a $87.6 million increase in revenues from our video products, partially offset by a $19.6 million decrease in revenues from our data products. The $87.6 million increase in video products was attributable to the first recognition of significant net revenues from our TelcoTV product and significant growth in revenues from our Switched Digital Video product. The decrease in revenues from data products was almost entirely due to $18.8 million of revenues recognized in 2005 following satisfaction of customer acceptance criteria for product shipped to a single customer in 2004.
Services revenues for 2006 was $22.6 million compared to $12.0 million for 2005, an increase of $10.6 million, or 88.2%. This $10.6 million increase was primarily due to an increase in customer support and maintenance revenues earned on a larger installed base of products.
Gross Profit/Gross Margin. Gross profit for 2006 was $93.2 million compared to $38.1 million for 2005, an increase of $55.1 million, or 144.4%. Gross margin increased to 52.8% in 2006 compared to 38.9% in 2005.
46
Products gross margin for 2006 was 51.9% compared to 34.9% for 2005. This increase was due to a shift in product mix in 2006 towards video products, which have relatively higher gross margins. Gross margin in 2005 was adversely impacted by the sale of inventory acquired in the BAS transaction. Under purchase accounting, the carrying value of this inventory was increased by $4.7 million to its fair market value at the time of acquisition. The sale of a portion of this inventory reduced products gross margin by $3.5 million, or 4.1% of products revenues, in 2005. In addition, gross margins in 2005 decreased as a result of a physical inventory write-down of $1.8 million and a specific warranty provision of $1.5 million recorded for the expected cost of repairing defective subcomponents.
Services gross margin for 2006 was 59.1% compared to 67.5% for 2005. In 2005, our business grew more rapidly than our level of support personnel could support at the time. This resulted in relatively high margins with respect to services during 2005. In 2006, we made a planned increase to our services personnel headcount to support not only the increase in customer installed base in 2005, but also the anticipated increase in our installed base from our future business. This resulted in a relative decline in gross margins in 2006.
Research and Development. Research and development expense was $37.2 million for 2006, or 21.1% of net revenues, compared to $30.7 million in the comparable period of 2005, or 31.3% of net revenues. The $6.5 million increase was primarily due to increased compensation costs of $4.7 million attributable to an increase in employee headcount and $1.4 million attributable to increased sub-contractor expenses. Research and development expense included stock-based compensation expense of $1.0 million and $0.5 million during 2006 and 2005, respectively.
Sales and Marketing. Sales and marketing expense was $29.5 million, or 16.7% of net revenues, for 2006 compared to $22.7 million, or 23.2% of net revenues, during 2005. The $6.8 million increase was primarily due to increased compensation costs of $4.6 million resulting from increased commissions and salaries, as well as increased headcount in support of our overall growth. In addition, travel and entertainment cost increased by $0.9 million. Sales and marketing expense included stock-based compensation expense of $0.6 million and $0.3 million during 2006 and 2005, respectively.
General and Administrative. General and administrative expense was $13.2 million, or 7.5% of net revenues, for 2006 compared to $7.0 million, or 7.1% of net revenues, during 2005. The $6.2 million increase was primarily due to increased compensation costs of $2.5 million attributable to an increase in employee headcount, including additional accounting and finance personnel, an increase of $2.6 million in spending related to our preparation for becoming a public company, including consulting costs associated with Sarbanes-Oxley compliance and improvement to our ERP systems, and $0.8 million in costs associated with our audit committee’s independent investigation of the accounting for revenue in our China operations. General and administrative expense included stock-based compensation expense of $0.5 million and $0.2 million during 2006 and 2005, respectively.
Other Expense, Net. Other expense, net includes interest income, interest expense and other expense, net and was $1.4 million in 2006, compared to $1.7 million in 2005. Other expense, net consisted primarily of expenses associated with changes in the fair value of our outstanding preferred stock warrants, interest expense and interest income. The change in other expense, net was primarily due to the adoption of FSP 150-5 on July 1, 2005, which resulted in a $1.5 million expense arising from the increase in value of preferred stock warrants during the 2006 period. This compares to a $0.1 million expense from the increase in value of preferred stock warrants during 2005. These increases were partially offset by $0.6 million of remaining proceeds received upon satisfaction of an escrow condition on the sale of an investment obtained in conjunction with our BAS acquisition.
Provision for Income Taxes. We incurred U.S. operating losses in all years from inception through 2005. Because of net operating loss carryforwards in the United States, the provision for income taxes of $2.5 million and $0.3 million for 2006 and 2005, respectively, were primarily related to provisions for foreign income taxes. For the year ended December 31, 2006, $1.3 million of the provision for income taxes was related to the conclusion of a tax audit in Israel. The resolution of the audit resulted in amounts being due which were in excess
47
of the amounts estimated and in excess of amounts previously recorded. The $1.3 million includes the effects for the years ended December 31, 1999 through 2003 that were covered by the tax audit and the expected effect for the years ended December 31, 2004 through 2006 based on the outcome of the tax audit. As of December 31, 2006, we had net operating loss carryforwards for federal and state income tax purposes of $93.8 million and $46.0 million, respectively. We also had federal research and development tax credit carryforwards of approximately $2.4 million and state research and development tax credit carryforwards of approximately $2.3 million. Realization of deferred tax assets is dependent upon future earnings, if any, the timing and amount of which is uncertain. Accordingly, the net deferred tax assets arising from U.S. operations have been fully offset by a valuation allowance. If not utilized, the federal net operating loss and tax credit carryforwards will expire between 2019 and 2026, and the state net operating loss and tax credit carryforward will expire between 2008 and 2026. Utilization of these net operating losses and credit carryforwards will likely be subject to an annual limitation due to the provisions of Section 382 of the Internal Revenue Code.
Liquidity and Capital Resources
Prior to our IPO in March 2007, we funded our operations primarily through the private sales of our convertible preferred stock and collections from our customers and, to a lesser extent, borrowings under our credit facility and term loan. In March 2007, we completed our IPO which provided us with aggregate net proceeds of $87.8 million. As of December 31, 2007, our cash, cash equivalents and marketable securities totalled $154.5 million.
Operating Activities
Our operating activities generated cash in the amount of $20.9 million for the year ended December 31, 2007. This cash from operating activities was a result of a net loss of $25.4 million, offset by non-cash expenses of $11.6 million in stock-based compensation expense, and $9.8 million in depreciation and amortization expense. This loss was further offset by changes in operating assets and liabilities, primarily the increase in deferred revenues of $16.7 million and a decrease in accounts receivable of $6.1 million due to the timing of shipments and collections from customers.
Our operating activities generated cash in the amount of $48.8 million for the year ended December 31, 2006, primarily due to net income of $8.9 million, a decrease in inventory of $14.4 million and an increase in deferred revenues of $21.8 million, an increase in accrued and other liabilities of $7.3 million, and an increase in accounts payable of $6.3 million. These changes resulted primarily from the significant growth in our business, the timing of shipments and payments to vendors, our efforts to manage and monitor inventory balances and the increase in deferred revenue due to the timing of revenue recognition under our revenue recognition policy. The 2006 decrease in inventory compared to 2005 resulted from a more significant emphasis on efficiently managing our inventory levels through working with our suppliers. These changes were partially offset by an increase in trade receivables of $19.3 million due to the growth in our business. We also had non-cash charges of $10.6 million, comprised primarily of $6.1 million in depreciation on property and equipment, $2.5 million in stock-based compensation expense and $1.5 million related to the increase in fair value of preferred stock warrants during the period.
Our operating activities generated cash in the amount of $1.4 million in the year ended December 31, 2005, primarily due to an increase in deferred revenues of $18.7 million and an increase in other accrued liabilities of $2.7 million. These changes resulted primarily from the growth in our business, the timing of shipments and the satisfaction of revenue recognition criteria under our revenue recognition policy. Operating cash flow was also favorably affected by a decrease in trade receivables of $6.1 million due to the timing of collections. These changes were largely offset by a loss of $25.5 million, an increase in inventory of $7.7 million, an increase in prepaid and other current assets of $1.3 million and a decrease in accounts payable of $1.5 million due to the timing of payments to vendors. We also had non-cash charges of $9.0 million, comprised primarily of $5.9 million in depreciation on property and equipment, $1.1 million in stock-based compensation expense and $0.7 million related to the increase in value of preferred stock warrants during the period.
48
Investing Activities
Our investing activities used cash of $85.0 million in the year ended December 31, 2007, primarily from net purchases of marketable securities of $72.2 million and the purchase of property and equipment of $12.3 million primarily to support our new product offerings. These capital expenditures consisted primarily of computer and test equipment and software purchases. As of December 31, 2007, we had invested $11.7 million in auction rate securities, which were all AAA rated at that time by one or more of the major credit rating agencies and collateralized by student loans with a significant portion of such collateral being guaranteed by the U.S. government through its education loan programs. At the time of each auction rate security’s periodic auction reset, we generally can determine whether to reinvest in the security. We did not reinvest in any of these auction rate securities and as of January 17, 2008, we held no investments in auction rate securities.
Our investing activities used cash of $30.2 million in the year ended December 31, 2006, primarily from net purchases of marketable securities of $20.0 million and the purchase of property and equipment of $10.9 million to support the business. These capital expenditures consisted primarily of computer and test equipment and software purchases.
Our investing activities used cash of $7.7 million in the year ended December 31, 2005, primarily from net purchases of marketable securities of $6.9 million and the purchase of property and equipment of $6.0 million. These capital expenditures consisted primarily of computer and test equipment and software purchases. These uses of funds for investing activities were partially offset by $5.3 million in proceeds from the sale of an investment acquired in connection with the BAS acquisition in 2004.
Financing Activities
Our financing activities provided cash of $80.7 million in the year ended December 31, 2007, primarily from our IPO which provided us with aggregate net proceeds of $87.8 million, proceeds of $5.7 million from the issuance of common stock from the exercise of options and employee stock purchase plans, and proceeds of $1.8 million received from the exercise of warrants to purchase common stock. These increases were partially offset by the repayment of loans and capital leases of $14.5 million.
Our financing activities provided cash of $2.7 million in the year ended December 31, 2006, primarily from a net increase in borrowings of $2.8 million, and proceeds of $0.8 million received from the exercise of options to purchase our common stock, offset by $0.7 million of payment of costs to professional service providers associated with our initial public offering.
Our financing activities used cash of $0.2 million in the year ended December 31, 2005, primarily from repayments of loans and payments against capital lease obligations of $0.7 million, offset by proceeds of $0.5 million received from the exercise of options to purchase our common stock.
We believe that our existing cash, cash equivalents and marketable securities will be sufficient to meet our anticipated cash needs for at least the next year. Our future capital requirements will depend on many factors including our rate of revenue growth, the timing and extent of spending to support development efforts, the expansion of sales and marketing activities, the timing of introductions of new products and enhancements to existing products, the costs to ensure access of adequate manufacturing capacity and the continuing market acceptance of our products. In the event that additional financing is required from outside sources, we may not be able to raise it on terms acceptable to us or at all. If we are unable to raise additional capital when desired, our business, operating results and financial condition would be harmed.
Contractual Obligations and Commitments
The following summarizes our contractual obligations at December 31, 2007:
| | | | | | | | | | | | | | | |
| | | Payments Due by Period (in thousands) |
| | | Total | | Less Than
1 Year | | 2 -3 Years | | 4 -5 Years | | Thereafter |
Operating lease obligations | | $ | 12,911 | | $ | 3,161 | | $ | 5,333 | | $ | 4,296 | | $ | 121 |
49
Off-Balance Sheet Arrangements
As of December 31, 2007, we have no off-balance sheet arrangements as defined in Item 303(a)(4) of the Securities and Exchange Commission’s Regulation S-K.
Effects of Inflation
Our monetary assets, consisting primarily of cash, marketable securities and receivables, are not affected by inflation because they are short-term and in the case of cash are immaterial. Our non-monetary assets, consisting primarily of inventory, intangible assets, goodwill and prepaid expenses and other assets, are not affected significantly by inflation. We believe that the impact of inflation on replacement costs of equipment, furniture and leasehold improvements will not materially affect our operations. However, the rate of inflation affects our cost of goods sold and expenses, such as those for employee compensation, which may not be readily recoverable in the price of products and services offered by us.
Recent Accounting Pronouncements
See Note 2 of the Notes to Consolidated Financial Statements included in this annual report for recent accounting pronouncements that could have an effect on us.
Item 7A. Quantitative and Qualitative Disclosure About Market Risk
Interest Rate Sensitivity
The primary objectives of our investment activity are to preserve principal, provide liquidity and maximize income without significantly increasing risk. Some of the securities we invest in are subject to market risk. This means that a change in prevailing interest rates may cause the principal amount of the investment to fluctuate. To minimize this risk, we maintain our portfolio of cash equivalents and short-term investments in a variety of securities, including commercial paper, money market funds, government and non-government debt securities and certificates of deposit. The risk associated with fluctuating interest rates is limited to our investment portfolio. A 10% decrease in interest rates in 2007, would result in a decrease in our interest income of $0.7 million. As of December 31, 2007, our investments were in commercial paper, corporate notes and bonds, auction rate securities, money market funds and U.S. government and agency securities.
Foreign Currency Risk
Our sales contracts are primarily denominated in United States dollars and therefore the majority of our net revenues are not subject to foreign currency risk. Our operating expense and cash flows are subject to fluctuations due to changes in foreign currency exchange rates, particularly changes in the Euro and New Israeli Shekel. Exchange rate fluctuations have historically had relatively little impact on our operating results and cash flows. In the year ended December 31, 2007, the exchange rate fluctuation between the United States dollar and the Israeli New Shekel increased our operating expenses by approximately $0.8 million without hedging and $0.7 million with hedging. To protect against reductions in value and the volatility of future cash flows caused by changes in currency exchange rates, during August 2007 we established foreign currency risk management programs to hedge both balance sheet items and future forecasted expenses. Currency forward contracts and currency options are generally utilized in these hedging programs. Our hedging programs are intended to reduce, but will not always entirely eliminate, the impact of currency exchange rate movements. We considered the historical trends in currency exchange rates and determined that it was reasonably possible that adverse changes in exchange rates of 20% for all currencies could be experienced in the near term. Such adverse changes, without any hedging, would have resulted in an adverse impact on income before taxes of approximately $8.0 million in the year ended December 31, 2007.
50
Item 8. Financial Statements and Supplementary Data
Index to Consolidated Financial Statements
The following financial statements are filed as part of this Annual Report:
51
Report of Independent Registered
Public Accounting Firm
The Board of Directors and Stockholders of
BigBand Networks, Inc.
We have audited the accompanying consolidated balance sheets of BigBand Networks, Inc. as of December 31, 2007 and 2006, and the related consolidated statements of operations, redeemable convertible preferred stock and stockholders’ equity (deficit) and cash flows for each of the three years in the period ended December 31, 2007. These financial statements are the responsibility of the Company’s management. Our responsibility is to express an opinion on these financial statements based on our audits.
We conducted our audits in accordance with the standards of the Public Company Accounting Oversight Board (United States). Those standards require that we plan and perform the audit to obtain reasonable assurance about whether the financial statements are free of material misstatement. We were not engaged to perform an audit of the Company’s internal control over financial reporting. Our audits included consideration of internal control over financial reporting as a basis for designing audit procedures that are appropriate in the circumstances, but not for the purpose of expressing an opinion on the effectiveness of the Company’s internal control over financial reporting. Accordingly, we express no such opinion. An audit also includes examining, on a test basis, evidence supporting the amounts and disclosures in the financial statements, and assessing the accounting principles used and significant estimates made by management, as well as evaluating the overall financial statements presentation. We believe that our audits provide a reasonable basis for our opinion.
In our opinion, the financial statements referred to above present fairly, in all material respects, the consolidated financial position of BigBand Networks, Inc. as of December 31, 2007 and 2006, and the consolidated results of its operations and its cash flows for each of the three years in the period ended December 31, 2007, in conformity with U.S. generally accepted accounting principles.
As discussed in Note 3 to the consolidated financial statements, under the headings Stock-Based Compensation, Accounting for Income Taxes and Preferred Stock Warrants, the Company adopted Financial Accounting Standards Board (FASB) Interpretation No. 48, “Accounting for Uncertainty in Income Taxes, an interpretation of FASB Statement No. 109”, effective January 1, 2007, Statement of Financial Accounting Standards No. 123(R), “Share-Based Payments”, effective January 1, 2006, and FASB Staff Position 150-5 (FSP150-5), “Issuer’s Accounting under Statement No. 150 for Freestanding Warrants and Other similar Instruments on Shares that are Redeemable,” during the year ended December 31, 2005.
/s/ ERNST & YOUNG LLP
Palo Alto, California
March 10, 2008
52
BIGBAND NETWORKS, INC.
CONSOLIDATED BALANCE SHEETS
(In thousands, except per share data)
| | | | | | | | |
| | | As of December 31, | |
| | | 2007 | | | 2006 | |
ASSETS | | | | | | | | |
Current assets: | | | | | | | | |
Cash and cash equivalents | | $ | 55,162 | | | $ | 38,570 | |
Marketable securities | | | 99,358 | | | | 26,904 | |
Trade receivables, net of allowance for doubtful accounts of $142 and $152 at December 31, 2007 and 2006, respectively | | | 27,855 | | | | 33,988 | |
Inventories | | | 6,832 | | | | 7,153 | |
Prepaid expenses and other current assets | | | 4,012 | | | | 2,511 | |
| | | | | | | | |
Total current assets | | | 193,219 | | | | 109,126 | |
Property and equipment, net | | | 17,432 | | | | 12,788 | |
Intangible assets, net | | | 734 | | | | 1,306 | |
Goodwill | | | 1,656 | | | | 1,656 | |
Other non-current assets | | | 5,545 | | | | 4,174 | |
| | | | | | | | |
Total assets | | $ | 218,586 | | | $ | 129,050 | |
| | | | | | | | |
LIABILITIES, REDEEMABLE CONVERTIBLE PREFERRED STOCK AND STOCKHOLDERS’ EQUITY (DEFICIT) | | | | | | | | |
Current liabilities: | | | | | | | | |
Accounts payable | | $ | 13,811 | | | $ | 15,109 | |
Current portion of line of credit and loans payable | | | — | | | | 5,937 | |
Preferred stock warrant liabilities | | | — | | | | 3,152 | |
Accrued compensation and related benefits | | | 6,475 | | | | 7,354 | |
Current portion of deferred revenues, net | | | 48,256 | | | | 39,553 | |
Accrued warranty | | | 3,502 | | | | 3,241 | |
Other current liabilities | | | 11,879 | | | | 9,724 | |
| | | | | | | | |
Total current liabilities | | | 83,923 | | | | 84,070 | |
Deferred revenues, net, less current portion | | | 19,032 | | | | 11,049 | |
Loans payable, less current portion | | | — | | | | 8,599 | |
Accrued warranty, less current portion | | | 857 | | | | 895 | |
Accrued long-term severance pay fund | | | 3,188 | | | | 2,744 | |
Commitments and contingencies (Note 6) | | | | | | | | |
Redeemable convertible preferred stock, $0.01 par value; 5,000 and 128,266 authorized at December 31, 2007 and 2006, respectively; 0 and 29,439, issued and outstanding at December 31, 2007 and 2006, respectively; aggregate liquidation value of $0 and $117,668 at December 31, 2007 and 2006, respectively | | | — | | | | 117,307 | |
Stockholders’ equity (deficit): | | | | | | | | |
Common stock, $0.001 par value, 250,000 and 335,000 shares authorized at December 31, 2007 and 2006 | | | | | | | | |
Class A voting: 250,000 and 300,000 shares designated at December 31, 2007 and 2006; 61,907 and 8,241 shares issued and outstanding at December 31, 2007 and 2006 | | | 62 | | | | 8 | |
Class B nonvoting: zero and 35,000 shares designated at December 31, 2007 and 2006; zero and 3,619 shares issued and outstanding at December 31, 2007 and 2006 | | | — | | | | 4 | |
Additional paid-in capital | | | 248,139 | | | | 17,063 | |
Deferred stock-based compensation | | | (203 | ) | | | (1,405 | ) |
Accumulated other comprehensive income | | | 248 | | | | 9 | |
Accumulated deficit | | | (136,660 | ) | | | (111,293 | ) |
| | | | | | | | |
Total stockholders’ equity (deficit) | | | 111,586 | | | | (95,614 | ) |
| | | | | | | | |
Total liabilities, redeemable convertible preferred stock and stockholders’ equity (deficit) | | $ | 218,586 | | | $ | 129,050 | |
| | | | | | | | |
See accompanying notes.
53
BIGBAND NETWORKS, INC.
CONSOLIDATED STATEMENTS OF OPERATIONS
(In thousands, except per share data)
| | | | | | | | | | | | |
| | | Years ended December 31, | |
| | | 2007 | | | 2006 | | | 2005 | |
Net revenues | | | | | | | | | | | | |
Products | | $ | 144,715 | | | $ | 154,013 | | | $ | 85,966 | |
Services | | | 31,795 | | | | 22,611 | | | | 12,013 | |
| | | | | | | | | | | | |
Total net revenues | | | 176,510 | | | | 176,624 | | | | 97,979 | |
Cost of net revenues | | | | | | | | | | | | |
Products | | | 76,260 | | | | 74,152 | | | | 55,933 | |
Services | | | 13,414 | | | | 9,245 | | | | 3,900 | |
| | | | | | | | | | | | |
Total cost of net revenues | | | 89,674 | | | | 83,397 | | | | 59,833 | |
| | | | | | | | | | | | |
Gross profit | | | 86,836 | | | | 93,227 | | | | 38,146 | |
| | | | | | | | | | | | |
Operating expenses | | | | | | | | | | | | |
Research and development | | | 51,862 | | | | 37,194 | | | | 30,701 | |
Sales and marketing | | | 39,868 | | | | 29,523 | | | | 22,729 | |
General and administrative | | | 16,286 | | | | 13,176 | | | | 6,984 | |
Restructuring charges | | | 2,998 | | | | — | | | | — | |
Amortization of intangible assets | | | 572 | | | | 572 | | | | 573 | |
| | | | | | | | | | | | |
Total operating expenses | | | 111,586 | | | | 80,465 | | | | 60,987 | |
| | | | | | | | | | | | |
Operating income (loss) | | | (24,750 | ) | | | 12,762 | | | | (22,841 | ) |
Interest income | | | 6,863 | | | | 1,526 | | | | 628 | |
Interest expense | | | (648 | ) | | | (1,699 | ) | | | (1,672 | ) |
Other expense, net | | | (5,607 | ) | | | (1,187 | ) | | | (652 | ) |
| | | | | | | | | | | | |
Net income (loss) before provision for income taxes and cumulative effect of change in accounting principle | | | (24,142 | ) | | | 11,402 | | | | (24,537 | ) |
Provision for income tax | | | 1,225 | | | | 2,525 | | | | 325 | |
| | | | | | | | | | | | |
Net income (loss) before cumulative effect of change in accounting principle | | | (25,367 | ) | | | 8,877 | | | | (24,862 | ) |
Cumulative effect of change in accounting principle | | | — | | | | — | | | | (633 | ) |
| | | | | | | | | | | | |
Net income (loss) | | $ | (25,367 | ) | | $ | 8,877 | | | $ | (25,495 | ) |
| | | | | | | | | | | | |
Net income (loss) per common share: | | | | | | | | | | | | |
Basic | | $ | (0.52 | ) | | $ | 0.78 | | | $ | (2.36 | ) |
| | | | | | | | | | | | |
Diluted | | $ | (0.52 | ) | | $ | 0.16 | | | $ | (2.36 | ) |
| | | | | | | | | | | | |
Weighted average shares used in computing net income (loss) per common share: | | | | | | | | | | | | |
Basic | | | 49,041 | | | | 11,433 | | | | 10,794 | |
| | | | | | | | | | | | |
Diluted | | | 49,041 | | | | 57,053 | | | | 10,794 | |
| | | | | | | | | | | | |
See accompanying notes.
54
BIGBAND NETWORKS, INC.
CONSOLIDATED STATEMENTS OF REDEEMABLE CONVERTIBLE PREFERRED STOCK AND STOCKHOLDERS’ EQUITY (DEFICIT)
(In thousands)
| | | | | | | | | | | | | | | | | | | | | | | | | | | | | | | | | | | | | | | |
| | | Redeemable
Convertible
Preferred Stock | | | Common Stock | | | Additional
Paid in
Capital | | | Deferred
Stock-based
Compensation | | | Accumulated
Other
Comprehensive
Income (Loss) | | | Accumulated
Deficit | | | Stockholders’
Equity | |
| | | | Class A | | Class B | | | | | | |
| | | Shares | | | Amount | | | Shares | | Amount | | Shares | | | Amount | | | | | | |
Balance as of December 31, 2004 | | 29,439 | | | $ | 118,204 | | | 6,889 | | $ | 7 | | 3,619 | | | $ | 4 | | | $ | 14,038 | | | $ | (3,300 | ) | | $ | — | | | $ | (94,675 | ) | | $ | (83,926 | ) |
Stock-based compensation | | — | | | | — | | | — | | | — | | — | | | | — | | | | 424 | | | | (424 | ) | | | — | | | | — | | | | — | |
Amortization of deferred stock-based compensation | | — | | | | — | | | — | | | — | | — | | | | — | | | | — | | | | 1,103 | | | | — | | | | — | | | | 1,103 | |
Proceeds from exercise of class A common stock options | | — | | | | — | | | 644 | | | 1 | | — | | | | — | | | | 516 | | | | — | | | | — | | | | — | | | | 517 | |
Reclassification of warrants to liabilities | | — | | | | (897 | ) | | — | | | — | | — | | | | — | | | | — | | | | — | | | | — | | | | — | | | | — | |
Comprehensive loss: | | | | | | | | | | | | | | | | | | | | | | | | | | | | | | | | | | | | | | | |
Unrealized loss on marketable securities | | — | | | | — | | | — | | | — | | — | | | | — | | | | — | | | | — | | | | (18 | ) | | | — | | | | (18 | ) |
Net loss | | — | | | | — | | | — | | | — | | — | | | | — | | | | — | | | | — | | | | — | | | | (25,495 | ) | | | (25,495 | ) |
| | | | | | | | | | | | | | | | | | | | | | | | | | | | | | | | | | | | | | | |
Total comprehensive loss | | — | | | | — | | | — | | | — | | — | | | | — | | | | — | | | | — | | | | — | | | | — | | | | (25,513 | ) |
| | | | | | | | | | | | | | | | | | | | | | | | | | | | | | | | | | | | | | | |
Balance as of December 31, 2005 | | 29,439 | | | | 117,307 | | | 7,533 | | | 8 | | 3,619 | | | | 4 | | | | 14,978 | | | | (2,621 | ) | | | (18 | ) | | | (120,170 | ) | | | (107,819 | ) |
Stock options issued to non-employees | | — | | | | — | | | — | | | — | | — | | | | — | | | | 26 | | | | — | | | | — | | | | — | | | | 26 | |
Stock-based compensation | | — | | | | — | | | — | | | — | | — | | | | — | | | | 1,422 | | | | — | | | | — | | | | — | | | | 1,422 | |
Amortization of deferred stock-based compensation, net of reversals | | — | | | | — | | | — | | | — | | — | | | | — | | | | (114 | ) | | | 1,216 | | | | — | | | | — | | | | 1,102 | |
Proceeds from exercise of class A common stock options | | — | | | | — | | | 708 | | | — | | — | | | | — | | | | 751 | | | | — | | | | — | | | | — | | | | 751 | |
Comprehensive income: | | | | | | | | | | | | | | | | | | | | | | | | | | | | | | | | | | | | | | — | |
Unrealized gain on marketable securities | | — | | | | — | | | — | | | — | | — | | | | — | | | | — | | | | — | | | | 27 | | | | — | | | | 27 | |
Net income | | — | | | | — | | | — | | | — | | — | | | | — | | | | — | | | | — | | | | — | | | | 8,877 | | | | 8,877 | |
| | | | | | | | | | | | | | | | | | | | | | | | | | | | | | | | | | | | | | | |
Total comprehensive income | | | | | | | | | | | | | | | | | | | | | | | | | | | | | | | | | | | | | | 8,904 | |
| | | | | | | | | | | | | | | | | | | | | | | | | | | | | | | | | | | | | | | |
Balance as of December 31, 2006 | | 29,439 | | | | 117,307 | | | 8,241 | | | 8 | | 3,619 | | | | 4 | | | | 17,063 | | | | (1,405 | ) | | | 9 | | | | (111,293 | ) | | | (95,614 | ) |
Conversion of class B common stock in class A common Stock | | — | | | | — | | | 3,619 | | | 4 | | (3,619 | ) | | | (4 | ) | | | — | | | | — | | | | — | | | | — | | | | — | |
Conversion of preferred stock into class A common stock | | (29,439 | ) | | | (117,307 | ) | | 37,762 | | | 38 | | — | | | | — | | | | 117,269 | | | | | | | | | | | | | | | | 117,307 | |
Proceeds from initial public offering, net of expenses | | — | | | | — | | | 7,500 | | | 8 | | — | | | | — | | | | 87,761 | | | | — | | | | — | | | | — | | | | 87,769 | |
Reclassification of preferred stock warrant liabilities to APIC upon IPO | | — | | | | — | | | — | | | — | | — | | | | — | | | | 8,125 | | | | — | | | | — | | | | — | | | | 8,125 | |
Proceeds from exercise of common stock options | | — | | | | — | | | 4,056 | | | 4 | | — | | | | — | | | | 4,684 | | | | — | | | | — | | | | — | | | | 4,688 | |
Proceeds from issuance of common stock under employee stock purchase plan | | — | | | | — | | | 213 | | | — | | — | | | | — | | | | 1,089 | | | | — | | | | — | | | | — | | | | 1,089 | |
Tax benefit from stock options | | — | | | | — | | | — | | | — | | — | | | | — | | | | 25 | | | | — | | | | — | | | | — | | | | 25 | |
Stock-based compensation | | — | | | | — | | | 12 | | | — | | — | | | | — | | | | 10,408 | | | | — | | | | — | | | | — | | | | 10,408 | |
Net exercise for payment of tax liability for employee | | — | | | | — | | | — | | | — | | — | | | | — | | | | (113 | ) | | | — | | | | — | | | | — | | | | (113 | ) |
Amortization of deferred stock-based compensation, net of reversals | | — | | | | — | | | — | | | — | | — | | | | — | | | | (335 | ) | | | 1,202 | | | | — | | | | — | | | | 867 | |
Stock-based compensation related to non-employees in exchange for services | | — | | | | — | | | 2 | | | — | | — | | | | — | | | | 341 | | | | — | | | | — | | | | — | | | | 341 | |
Exercise of warrants | | — | | | | — | | | 502 | | | — | | — | | | | — | | | | 1,822 | | | | — | | | | — | | | | — | | | | 1,822 | |
| | | | | | | | | | | | | | | | | | | | | | — | | | | | | | | | | | | | | | | | |
Comprehensive loss: | | | | | | | | | | | | | | | | | | | | | | | | | | | | | | | | | | | | | | | |
Net unrealized gains on cash flow hedges | | — | | | | — | | | — | | | — | | — | | | | — | | | | — | | | | — | | | | 42 | | | | — | | | | 42 | |
Net unrealized gain on marketable securities | | — | | | | — | | | — | | | — | | — | | | | — | | | | — | | | | — | | | | 194 | | | | — | | | | 194 | |
Net realized gain on cash flow hedges | | | | | | | | | — | | | — | | — | | | | — | | | | — | | | | — | | | | 3 | | | | | | | | 3 | |
Net loss | | — | | | | — | | | — | | | — | | — | | | | — | | | | — | | | | — | | | | — | | | | (25,367 | ) | | | (25,367 | ) |
| | | | | | | | | | | | | | | | | | | | | | | | | | | | | | | | | | | | | | | |
Total comprehensive loss | | | | | | | | | | | | | | | | | | | | | | | | | | | | | | | | | | | | | | (25,128 | ) |
| | | | | | | | | | | | | | | | | | | | | | | | | | | | | | | | | | | | | | | |
Balance as of December 31, 2007 | | — | | | $ | — | | | 61,907 | | $ | 62 | | — | | | $ | — | | | $ | 248,139 | | | $ | (203 | ) | | $ | 248 | | | $ | (136,660 | ) | | $ | 111,586 | |
| | | | | | | | | | | | | | | | | | | | | | | | | | | | | | | | | | | | | | | |
See accompanying notes.
55
BIGBAND NETWORKS, INC.
CONSOLIDATED STATEMENTS OF CASH FLOWS
(In thousands)
| | | | | | | | | | | | |
| | | Years ended December 31, | |
| | | 2007 | | | 2006 | | | 2005 | |
Cash Flows from Operating activities | | | | | | | | | | | | |
Net income (loss) | | $ | (25,367 | ) | | $ | 8,877 | | | $ | (25,495 | ) |
Adjustments to reconcile net income (loss) to cash provided by operating activities: | | | | | | | | | | | | |
Depreciation of property and equipment | | | 9,771 | | | | 6,148 | | | | 5,915 | |
Amortization of intangible assets | | | 572 | | | | 572 | | | | 573 | |
Gain on sale of investment | | | — | | | | (592 | ) | | | — | |
Amortization of debt issuance costs | | | — | | | | 379 | | | | 517 | |
Loss on disposal of property and equipment | | | 165 | | | | 78 | | | | 133 | |
Revaluation of warrant liabilities | | | 4,974 | | | | 1,510 | | | | 744 | |
Stock-based compensation to non-employees | | | 341 | | | | 26 | | | | — | |
Stock-based compensation to employees | | | 10,408 | | | | 1,422 | | | | — | |
Amortization of deferred stock-based compensation | | | 867 | | | | 1,102 | | | | 1,103 | |
Change in operating assets and liabilities: | | | | | | | | | | | | |
Decrease (increase) in trade receivables | | | 6,133 | | | | (19,280 | ) | | | 6,103 | |
Decrease (increase) in trade receivables-related party | | | — | | | | 1,106 | | | | (146 | ) |
Decrease (increase) in inventories | | | 321 | | | | 14,371 | | | | (7,661 | ) |
Increase in prepaids and other current assets | | | (1,501 | ) | | | (541 | ) | | | (1,251 | ) |
Decrease (increase) in other noncurrent assets | | | (867 | ) | | | (1,024 | ) | | | 318 | |
Increase (decrease) in accounts payable | | | (1,286 | ) | | | 6,292 | | | | (1,491 | ) |
Increase (decrease) in accounts payable-related party | | | — | | | | (1,531 | ) | | | 394 | |
Increase in long-term severance pay fund | | | 444 | | | | 761 | | | | 294 | |
Increase (decrease) in accrued and other liabilities | | | (799 | ) | | | 7,282 | | | | 2,714 | |
Increase in deferred revenues | | | 16,686 | | | | 21,808 | | | | 18,678 | |
| | | | | | | | | | | | |
Net cash provided by operating activities | | | 20,862 | | | | 48,766 | | | | 1,442 | |
| | | |
Cash Flows from Investing activities | | | | | | | | | | | | |
Purchases of marketable securities | | | (170,460 | ) | | | (46,925 | ) | | | (15,399 | ) |
Proceeds from maturities of marketable securities | | | 78,445 | | | | 26,969 | | | | 8,460 | |
Proceeds from sale of marketable securities | | | 19,800 | | | | — | | | | — | |
Proceeds from sale of other investment | | | — | | | | 592 | | | | 5,259 | |
Purchase of property and equipment | | | (12,320 | ) | | | (10,943 | ) | | | (5,980 | ) |
Proceeds from sale of property and equipment | | | 40 | | | | — | | | | — | |
Decrease (increase) in restricted cash | | | (505 | ) | | | 87 | | | | (42 | ) |
| | | | | | | | | | | | |
Net cash used in investing activities | | | (85,000 | ) | | | (30,220 | ) | | | (7,702 | ) |
| | | |
Cash Flows from Financing activities | | | | | | | | | | | | |
Proceeds from loans | | | — | | | | 16,800 | | | | — | |
Principal payments on loans | | | (14,494 | ) | | | (14,012 | ) | | | (247 | ) |
Principal payments on capital lease obligations | | | (56 | ) | | | (210 | ) | | | (440 | ) |
Payments in preparation for an initial public offering of the Company’s common stock | | | — | | | | (671 | ) | | | — | |
Proceeds from exercise of warrants to purchase common stock | | | 1,822 | | | | — | | | | — | |
Proceeds from exercise of common stock options, net of tax liability, for employee plans | | | 4,575 | | | | 751 | | | | 517 | |
Proceeds from issuance of common stock under employee stock plans | | | 1,089 | | | | — | | | | — | |
Proceeds from initial public offering, net of expenses | | | 87,769 | | | | — | | | | — | |
Tax benefit from stock options | | | 25 | | | | — | | | | — | |
| | | | | | | | | | | | |
Net cash provided by (used in) financing activities | | | 80,730 | | | | 2,658 | | | | (170 | ) |
| | | |
Net increase (decrease) in cash and cash equivalents | | | 16,592 | | | | 21,204 | | | | (6,430 | ) |
Cash and cash equivalents at beginning of year | | | 38,570 | | | | 17,366 | | | | 23,796 | |
| | | | | | | | | | | | |
Cash and cash equivalents at end of year | | $ | 55,162 | | | $ | 38,570 | | | $ | 17,366 | |
| | | | | | | | | | | | |
Schedule of non-cash transactions | | | | | | | | | | | | |
Equipment acquired under loan agreement | | $ | — | | | $ | 480 | | | | — | |
| | | | | | | | | | | | |
Accrued leasehold improvements | | $ | 2,300 | | | | — | | | | — | |
| | | | | | | | | | | | |
Supplemental disclosure of cash flow information | | | | | | | | | | | | |
Interest paid | | $ | 514 | | | $ | 1,398 | | | $ | 1,038 | |
| | | | | | | | | | | | |
Income taxes paid | | $ | 3,945 | | | $ | 360 | | | $ | 4 | |
| | | | | | | | | | | | |
See accompanying notes.
56
BIGBAND NETWORKS, INC.
NOTES TO CONSOLIDATED FINANCIAL STATEMENTS
1. Description of Business
BigBand Networks, Inc. (BigBand or the Company), headquartered in Redwood City, California, was incorporated on December 3, 1998, under the laws of the state of Delaware and commenced operations in January 1999. BigBand develops, markets and sells network-based hardware and software platforms that enable cable operators and telecommunications providers to deploy advanced video, voice and data services and more effective video advertising.
Initial Public Offering
On March 20, 2007, the Company completed an initial public offering of its common stock in which the Company sold and issued 7,500,000 shares of its common stock and selling stockholders sold 4,805,000 shares of the Company’s common stock, in each case at a public offering price of $13.00 per share. The Company raised a total of $97.5 million in gross proceeds from the IPO, or approximately $87.8 million in net proceeds after deducting underwriting discounts and commissions of $6.8 million and other offering costs of approximately $2.9 million.
2. Significant Accounting Policies
Principles of Consolidation
The consolidated financial statements include accounts of the Company and its wholly owned subsidiaries. All significant intercompany balances and transactions have been eliminated.
Use of Estimates
The preparation of financial statements in conformity with U.S. generally accepted accounting principles requires management to make estimates and assumptions that affect the amounts reported in the consolidated financial statements and accompanying notes. Management uses estimates and judgments in determining recognition of revenues, valuation of inventories, valuation of stock-based awards, provision for warranty claims, the allowance for doubtful accounts, restructuring costs, valuation of goodwill and other purchased intangible assets and long-lived assets. Management bases its estimates and assumptions on methodologies it believes to be reasonable. Actual results could differ from those estimates, and such differences could affect the results of operations reported in future periods.
Reclassifications
Certain prior-year balances have been reclassified to conform to current financial statement presentation. These reclassifications had no impact on previously reported results of operations or stockholders’ equity.
Revenue Recognition
The Company’s software and hardware are sold as solutions and its software is a significant component of the product. The Company provides unspecified software updates and enhancements related to products through support contracts. As a result, the Company accounts for revenues in accordance with Statement of Position (SOP) 97-2, “Software Revenue Recognition,” as amended by SOP 98-9, “Modification of SOP 97-2, Software Revenue Recognition, With Respect to Certain Transactions,” for all transactions involving the sale of products with a significant software component. Revenue is recognized when all of the following have occurred: (1) the Company has entered into an arrangement with a customer; (2) delivery has occurred; (3) customer payment is fixed or determinable and free of contingencies and significant uncertainties; and (4) collection is probable.
57
Product revenues consist of revenues from sales of the Company’s software and hardware. Product sales include a perpetual license to the Company’s software. The Company recognizes product revenues upon shipment to its customers, including channel partner distributors, on non-cancelable contracts and purchase orders when all revenue recognition criteria are met, or, if specified in an agreement, upon receipt of final acceptance of the product, provided all other criteria are met. End users, channel partners, and distributors generally have no rights of return, stock rotation rights, or price protection. Shipping charges billed to customers are included in product revenues and the related shipping costs are included in cost of product revenues.
The Company provides allowances for trade-in credits that are estimated based on the terms of the arrangement and past history and adjusted periodically based on actual experience or future expectation. Allowances for trade-in credits are recorded as a liability or reductions of trade receivables.
Substantially all of the Company’s product sales have been made in combination with support services, which consist of software updates and support. The Company’s customer service agreements (CSA) allow customers to select from plans offering various levels of technical support, unspecified software upgrades and enhancements on an if-and-when-available basis. Revenues for support services are recognized on a straight-line basis over the service contract term, which is typically one year but can extend to five (5) years for our telephone company customers. Revenues from other services, such as standard installation and training, are recognized when services are performed.
The Company uses the residual method to recognize revenues when a customer agreement includes one or more elements to be delivered at a future date and vendor specific objective evidence (VSOE) of the fair value of all undelivered elements exists. Under the residual method, the fair value of the undelivered elements is deferred and the remaining portion of the contract fee is recognized as product revenues. If evidence of the fair value of one or more undelivered elements does not exist, all revenues are deferred and recognized when delivery of those elements occur or when fair value can be established. When the undelivered element is customer support and there is no evidence of fair value for this support, revenue for the entire arrangement is bundled and revenue is recognized ratably over the service period. VSOE of fair value for elements of an arrangement is based upon the normal pricing and discounting practices for those services when sold separately.
Fees are typically considered to be fixed or determinable at the inception of an arrangement based on specific products and quantities to be delivered. In the event payment terms are greater than 180 days, the fees are deemed not to be fixed or determinable and revenues are recognized when the payments become due, provided the remaining criteria for revenue recognition have been met.
Deferred revenues consist primarily of deferred product revenues, net of the associated costs, and deferred service fees. Deferred product revenue generally relates to acceptance provisions that have not been met or partial shipment or when the Company does not have VSOE of fair value on the undelivered items. When deferred revenues are recognized as revenues, the associated deferred costs are also recognized as cost of sales. The Company assesses the ability to collect from its customers based on a number of factors, including credit worthiness of the customer and past transaction history of the customer. If the customer is not deemed credit worthy, all revenues are deferred from the arrangement until payment is received and all other revenue recognition criteria have been met.
Cash and Cash Equivalents
The Company holds its cash and cash equivalents in checking, money market, and investment accounts with high credit quality financial instruments. The Company considers all highly liquid investments with original maturities of three months or less when purchased to be cash equivalents.
Marketable Securities
Marketable securities consist principally of corporate debt securities, commercial paper, auction rate securities, and U.S. agencies with remaining time to maturity of two years or less. Auction rate securities are
58
considered short-term marketable securities due to their reset feature which is seven, twenty eight or thirty five days. The Company considers marketable securities with remaining time to maturity greater than one year and in a consistent loss position for at least nine months to be classified as long-term as it expects to hold them to maturity. The Company considers all other marketable securities with remaining time to maturity less than two years to be short-term marketable securities. The short-term marketable securities are classified in the balance sheet as current assets because they can be readily converted into cash or into securities with a shorter remaining time to maturity and because the Company is not committed to holding the marketable securities until maturity. The Company determines the appropriate classification of its marketable securities at the time of purchase and reevaluates such designations as of each balance sheet date. All marketable securities and cash equivalents in the portfolio are classified as “available-for-sale” and are stated at fair market value, with all the associated unrealized gains and losses, net of taxes, reported as a component of accumulated other comprehensive income (loss). Fair value is based on quoted market rates. The amortized cost of debt securities is adjusted for amortization of premiums and accretion of discounts to maturity. Such amortization and accretion are included in interest income and other expenses, net. Additionally, the Company assesses whether an other-than-temporary impairment loss on its investments has occurred due to declines in fair value or other market conditions. The Company did not consider any declines in fair value of securities held on December 31, 2007 to be other-than-temporary. Realized gains and losses and declines in value judged to be other-than-temporary on available-for-sale securities are included in interest income, net of taxes. The cost of securities sold and any gains and losses on sales are based on the specific identification method.
Fair Value of Financial Instruments
The carrying values of cash and cash equivalents, restricted cash, trade receivables, marketable securities, derivatives used in the Company’s hedging program, accounts payable, and other accrued liabilities approximate their fair value. The carrying values of the Company’s capital lease obligations, loans payable, preferred stock warrant liability, other long-term liabilities approximate their fair value. The fair value of preferred stock warrant liabilities was estimated using the Black-Scholes valuation model.
Concentrations of Credit Risk
Financial instruments that potentially subject the Company to significant concentrations of credit risk consist primarily of cash equivalents, marketable securities, trade receivables, and restricted cash. Cash equivalents, restricted cash, and marketable securities are invested through major banks and financial institutions in the United States and Israel. Such deposits in the United States may be in excess of insured limits and are not insured in Israel. Management believes that the financial institutions that hold the Company’s investments are financially sound and, accordingly, minimal credit risk exists with respect to these investments. The Company’s trade receivables are derived primarily from cable and telecommunications operators located mainly in the United States. Concentrations of credit risk with respect to trade receivables exist to the full extent of amounts presented in the financial statements. The Company performs ongoing credit evaluations of its customers and in certain circumstances may require letters of credit or other collateral. The Company estimates an allowance for doubtful accounts through specific identification of potentially uncollectible accounts based on an analysis of its trade receivables aging. Unless otherwise provided, trade receivables are identified as past due when outstanding more than 30 days from the invoice date. Uncollectible receivables are written off against the allowance for doubtful accounts when all efforts to collect them have been exhausted. Recoveries are recognized when they are received. Actual collection losses may differ from estimates and could be material to the consolidated financial position, results of operations, and cash flows.
59
Customers with trade receivables balances of 10% or greater of the total trade receivables balances as of December 31, 2007 and 2006, and customers representing 10% or greater of net revenues for the years ended December 31, 2007, 2006, and 2005 are as follows:
| | | | | | | | | | | | | | | |
| | | Percentage of Total
Trade Receivables as
of December 31, | | | Percentage of
Net Revenues for the
Periods Ended
December 31, | |
Customers | | 2007 | | | 2006 | | | 2007 | | | 2006 | | | 2005 | |
A | | * | % | | * | % | | * | % | | * | % | | 37 | % |
B | | 19 | | | 11 | | | 11 | | | 13 | | | 20 | |
C | | * | | | * | | | * | | | 10 | | | * | |
D | | 18 | | | 36 | | | 13 | | | 19 | | | 10 | |
E | | * | | | 37 | | | 40 | | | 32 | | | * | |
F | | 22 | | | * | | | * | | | * | | | * | |
| * | Represents less than 10% |
Management makes judgment as to the Company’s ability to collect outstanding receivables when collection becomes doubtful. Provisions are made based upon specific review of the outstanding invoices.
Activity related to allowance for doubtful accounts consisted of the following (in thousands):
| | | | | | | | | | | | | |
| | | Balance at
Beginning of
Year | | Charged to
Costs and
Expenses | | Deductions-
Write-offs | | | Balance at
End of Year |
Year ended | | | | | | | | | | | | | |
December 31, 2007 | | $ | 152 | | $ | 99 | | $ | (109 | ) | | $ | 142 |
December 31, 2006 | | $ | 23 | | $ | 129 | | $ | — | | | $ | 152 |
December 31, 2005 | | $ | 23 | | $ | — | | $ | — | | | $ | 23 |
Inventories
Inventories consist of raw materials, work-in-process, and finished goods and are stated at lower of standard cost or market. Standard costs approximate the first-in, first-out (FIFO) method. The Company regularly monitors inventory quantities on-hand and records write-downs for excess and obsolete inventories based on the Company’s estimate of demand for its products, potential obsolescence of technology, product life cycles, and whether pricing trends or forecasts indicate that the carrying value of inventory exceeds its estimated selling price. These factors are impacted by market and economic conditions, technology changes, and new product introductions and require estimates that may include elements that are uncertain. Actual demand may differ from forecasted demand and may have a material effect on gross margins. If inventory is written down, a new cost basis will be established that can not be increased in future periods.
Property and Equipment, Net
Property and equipment, net are stated at cost, less accumulated depreciation. Depreciation is calculated using the straight-line method and recorded over the estimated useful lives of the assets ranging from 18 months to seven years. Leasehold improvements are amortized using the straight-line method over the shorter of the lease term or estimated useful life of the asset. Repair and maintenance costs are expensed as incurred.
The cost of equipment under capital leases is recorded at the lower of the present value of the minimum lease payments or the fair value of the assets and is amortized on a straight-line basis over the shorter of the term of the related lease or the estimated useful life of the asset. Amortization of assets under capital leases is included with depreciation expense in the accompanying consolidated statements of cash flows.
60
Intangible Assets
Intangible assets consist of patented products, customer relationships, and trade names. Intangible assets are carried at cost less accumulated amortization. Amortization is computed using the straight-line method and recorded over the estimated useful lives of the respective assets of four to five years.
Impairment of Long-Lived Assets
The Company periodically evaluates whether changes have occurred that require revision of the remaining useful life of long-lived assets or would render them not recoverable. If such circumstances arise, the Company compares the carrying amount of the long-lived assets to the estimated future undiscounted cash flows expected to be generated by the long-lived assets. If the estimated aggregate undiscounted cash flows are less than the carrying amount of the long-lived assets, an impairment charge, calculated as the amount by which the carrying amount of the assets exceeds the fair value of the assets, is recorded. The fair value of the long-lived assets is determined based on the estimated discounted cash flows expected to be generated from the long-lived assets. Through December 31, 2007, no impairment losses have been recognized.
Goodwill
Goodwill is tested for impairment on an annual basis and between annual tests in certain circumstances, and written down when impaired. Based on the impairment tests performed, there was no impairment of goodwill during the years ended December 31, 2007 and 2006.
Software Development Costs
Software development costs are capitalized beginning when technological feasibility has been established and ending when a product is available for sale to customers. To date, the period between achieving technological feasibility and when the software is made available for sale to customers has been relatively short and software development costs qualifying for capitalization have not been significant. As such, all software development costs have been expensed as incurred in research and development expense.
Accounting for Income Taxes
Effective January 1, 2007, the Company adopted Financial Accounting Standards Interpretation, or FIN, No. 48, “Accounting for Uncertainty in Income Taxes – an interpretation of FASB Statement No. 109” (FIN 48). FIN 48 prescribes a recognition threshold and measurement attribute for the financial statement recognition and measurement of uncertain tax positions taken or expected to be taken in a company’s income tax return, and also provides guidance on derecognition, classification, interest and penalties, accounting in interim periods, disclosure, and transition. FIN 48 utilizes a two-step approach for evaluating uncertain tax positions accounted for in accordance with SFAS No. 109, “Accounting for Income Taxes” (SFAS No. 109). Step one,Recognition, requires a company to determine if the weight of available evidence indicates that a tax position is more likely than not to be sustained upon audit, including resolution of related appeals or litigation processes, if any. Step two,Measurement, is based on the largest amount of benefit, which is more likely than not to be realized on ultimate settlement. The cumulative effect of adopting FIN 48 on January 1, 2007 is recognized as a change in accounting principle, recorded as an adjustment to the opening balance of retained earnings on the adoption date. As a result of the implementation of FIN 48, the Company recognized no change in the liability for unrecognized tax benefits related to tax positions taken in prior periods, and no corresponding change in retained earnings. Additionally, FIN 48 specifies that tax positions for which the timing of the ultimate resolution is uncertain should be recognized as long-term liabilities. The Company made no reclassifications between current taxes payable and long term taxes payable upon adoption of FIN 48. The Company’s total amount of unrecognized tax benefits as of the January 1, 2007 adoption date and December 31, 2007 was $1.3 million and $1.4 million,
61
respectively. In 2007, changes to the amount of unrecognized tax benefits from U.S. federal and state research and development credits and other tax positions are detailed as follows (in millions):
| | | | |
| | | Unrecognized Tax Benefit | |
Balance at January 1, 2007 | | $ | 1,319 | |
Add: | | | | |
Additions for tax positions of prior years | | | — | |
Additions for tax positions related to 2007 | | | 532 | |
Less: | | | | |
Reductions for tax positions of prior years | | | (446 | ) |
Settlements during the current year | | | — | |
| | | | |
Balance at December 31, 2007 | | $ | 1,405 | |
| | | | |
Also, the Company had no amounts of unrecognized tax benefits that, if recognized, would materially affect its effective tax rate. It is expected that the amount of unrecognized tax benefits will change during the next year; however, the Company does not expect the change to have a material impact on its financial position.
Upon adoption of FIN 48, the Company’s policy to include interest and penalties related to unrecognized tax benefits within the Company’s provision from income taxes did not change. As of December 31, 2007, the Company had no amount accrued for payment of interest and penalties related to unrecognized tax benefits and no amounts as of the adoption date of FIN 48. In 2007 and 2006, the Company recognized no amounts of interest and penalties related to unrecognized tax benefits in its provision for income taxes.
The Company’s only major tax jurisdictions are the United States and Israel. The tax years 1998 through 2006 remain open and subject to examination by the appropriate governmental agencies in the U.S. and the tax years 2004 through 2006 remain open and subject to examination by the appropriate governmental agencies in Israel.
Hedging Instruments
The Company has sales, expenses, assets and liabilities denominated in currencies other than the U.S. dollar and subject to foreign currency risks, primarily related to expenses and liabilities denominated in the New Israeli Shekel. Beginning in 2007, the Company established a foreign currency risk management program to protect against the impact of foreign currency exchange rate movements on the Company’s operating results. The Company does not enter into derivatives for speculative or trading purposes. The Company’s practice is to use foreign currency forward contracts or combinations of purchased and sold foreign currency option contracts to reduce its exposure to foreign currency exchange rate fluctuations. All derivatives, whether designated in hedging relationships or not, are required to be recorded on the balance sheet at fair value. The accounting for changes in the fair value of a derivative depends on the intended use of the derivative and the resulting designation.
The Company also enters into foreign currency forward contracts to reduce the impact of foreign currency fluctuations on assets and liabilities denominated in currencies other than the functional currency of the reporting entity. These forward contracts are not subject to the hedge accounting provisions of SFAS No. 133, Accounting for Derivative Instruments and Hedging Activities, (referred to as SFAS 133) but are carried at fair value with changes in the fair value recorded within other income or expense, net, on the statement of operations in accordance with SFAS No. 52, “Foreign Currency Translation”. These derivative instruments generally have maturities of 90 days or less. Gains and losses on these contracts are intended to offset the impact of foreign exchange rate changes on the underlying foreign currency denominated assets and liabilities, primarily liabilities denominated in New Israeli Shekels, and therefore, do not subject the Company to material balance sheet risk. Any gain or loss from these forward contracts is recognized in other income or expense in the period of change, including any unrealized gains or losses at period end. The unrealized gain on forward contracts that were open at December 31, 2007 was $11,000 and the notional amount was $4.1 million.
62
The Company selectively hedges future expenses denominated in the Israeli New Shekel by purchasing foreign currency forward contracts or combinations of purchased and sold foreign currency option contracts. The exposures are hedged using derivatives designated as cash flow hedges under SFAS No. 133. The effective portion of the derivative’s gain or loss is initially reported as a component of accumulated other comprehensive income (loss) and, upon occurrence of the forecasted transaction, is subsequently reclassified into the consolidated statement of operations line item to which the hedged transaction relates. The ineffective portion of the gain or loss is reported in other income or expense, net immediately. These derivative instruments generally have maturities of 90 days or less. At December 31, 2007, the amount of net unrealized and realized gains on derivatives designated as cash flow hedges and recorded in other comprehensive income is not significant. The notional amount of the purchased currency option contracts, which are combined with sold currency option contracts, is $7.9 million at December 31, 2007.
Israeli Severance Pay Fund
The Company’s wholly owned subsidiary located in Israel is required to fund future severance liabilities determined in accordance with Israeli severance pay laws. Under these laws, employees are entitled upon termination to one month’s salary for each year of employment or portion thereof. The Company records compensation expense to accrue for these costs over the employment period. This liability is funded through the contributions invested by the subsidiary on behalf of the employees. The value of these contributions are recorded in other non-current assets. The provision for severance expenses for the years ended December 31, 2007, 2006, and 2005, amounted to approximately $2.2 million, $1.8 million, and $0.8 million, respectively.
Stock-based Compensation
Prior to January 1, 2006, the Company accounted for employee stock options using the intrinsic value method in accordance with Accounting Principles Board, or APB, Opinion No. 25,Accounting for Stock Issued to Employees, and Financial Accounting Standards Board Interpretation, or FIN, 44,Accounting for Certain Transactions Involving Stock Compensation, an Interpretation of APB No. 25, and had adopted the disclosure only provisions of Statement of Financial Accounting Standards, or SFAS, No. 123,Accounting for Stock-Based Compensation,and SFAS No. 148,Accounting for Stock-Based Compensation — Transition and Disclosure,using the minimum value method.
Effective January 1, 2006, the Company adopted the fair value recognition provisions of SFAS No. 123(R),Share-Based Payment(SFAS 123R). Under SFAS 123R, stock-based awards, including stock options, are recorded at fair value as of the grant date and recognized to expense over the employee’s requisite service period (generally the vesting period), which the Company has elected to amortize on a straight-line basis. The Company adopted the provisions of SFAS 123R using the prospective transition method. Under this transition method, non-vested stock-based awards outstanding as of January 1, 2006 continued to be accounted for under the intrinsic value method.
At December 31, 2007, the Company had one share-based compensation plan, which is described in Note 10. The Company allocated stock-based compensation expense as follows (in thousands):
| | | | | | | | | |
| | | Years ended December 31, |
| | | 2007 | | 2006 | | 2005 |
Cost of net revenues | | $ | 1,534 | | $ | 336 | | $ | 87 |
Research and development | | | 3,837 | | | 1,035 | | | 516 |
Sales and marketing | | | 4,184 | | | 637 | | | 263 |
General and administrative | | | 2,061 | | | 542 | | | 237 |
| | | | | | | | | |
Total Stock-based compensation expense | | $ | 11,616 | | $ | 2,550 | | $ | 1,103 |
| | | | | | | | | |
63
Foreign Currency Translation
The functional currency of the Company’s foreign subsidiaries is the U.S. dollar. Translation adjustments resulting from remeasuring the foreign currency denominated financial statements of subsidiaries into U.S. dollars are included in the Company’s consolidated statements of operations. Translation gains and losses have not been significant to date.
Comprehensive Income (Loss)
SFAS No. 130,Reporting Comprehensive Income, requires components of other comprehensive income to be included as part of total comprehensive income. Components of comprehensive income (loss) include unrealized gains and losses on available-for-sale securities, unrealized gains from derivatives designated as cash flow hedges, and realized gains from derivatives designated as cash flow hedges but not yet reclassified to operating expenses. Comprehensive income (loss) for the years ended December 31, 2007, 2006 and 2005 are as follows (in thousands):
| | | | | | | |
| | | Years ended
December 31, |
| | | 2007 | | | 2006 |
Net income (loss) | | $ | (25,367 | ) | | $ | 8,877 |
Unrealized gain on available-for-sale securities | | | 194 | | | | 27 |
Unrealized gain on derivatives designated as cash flow hedges | | | 3 | | | | — |
Realized gain on derivatives designated as cash flow hedges not yet reclassified to operating expenses | | | 42 | | | | — |
| | | | | | | |
Comprehensive income (loss) | | $ | (25,128 | ) | | $ | 8,904 |
| | | | | | | |
Research and Development
Research and development costs consist primarily of compensation and related costs for personnel, as well as costs related to materials, supplies, and equipment depreciation. All research and development costs are expensed as incurred.
Advertising Costs
All advertising costs are expensed as incurred. Advertising costs, which are included in sales and marketing expenses, were not significant for all periods presented.
Other Income (Expense), Net
For the years ended December 31, 2007, 2006 and 2005, other income (expense), net, included foreign currency losses, proceeds from the sale of preferred stock of an unrelated company, and the expense resulting from fair value adjustments of redeemable convertible preferred stock warrants.
Preferred Stock Warrants
Effective July 1, 2005, the Company adopted the provisions of Financial Accounting Standards Board Staff Position (FSP) No. 150-5,“Issuer’s Accounting under Statement No. 150 for Freestanding Warrants and Other similar Instruments on Shares that are Redeemable” (FSP 150-5), an interpretation of FASB Statement No. 150,“Accounting for Certain Financial Instruments with Characteristics of Both Liabilities and Equity” (SFAS 150). Pursuant to FSP 150-5, freestanding warrants for shares that are either puttable or warrants for shares that are redeemable are classified as liabilities on the consolidated balance sheet at fair value. At the end of each reporting period, changes in fair value during the period are recorded as a component of other expense, net. Prior to July 1, 2005, the Company accounted for warrants for the purchase of preferred stock under EITF Issue
64
No. 96-18,“Accounting for Equity Instruments That Are Issued to Other Than Employees for Acquiring, or in Conjunction with Selling, Goods or Services.”
Upon adoption of FSP 150-5, the Company reclassified the fair value of its warrants to purchase shares of its redeemable convertible preferred stock from equity to a liability and recorded a cumulative effect charge of approximately $0.6 million for the change in accounting principle. The Company recorded additional charges of approximately $0.1 million to reflect the increase in fair value between July 1, 2005 and December 31, 2005. In the years ended December 31, 2007 and 2006, the Company recorded approximately $5.0 million and $1.5 million of charges to other expense, net to reflect the increase in fair value between December 31, 2006 and March 27, 2007 and December 31, 2005 and 2006, respectively. Upon the completion of its initial public offering on March 27, 2007, the warrants to purchase redeemable convertible preferred stock became warrants to purchase the Company’s common stock and accordingly the Company ceased adjusting these warrants for changes in fair value and reclassified their respective liabilities to stockholders’ equity (deficit).
Recently Issued Accounting Standards
In December 2007, the FASB issued SFAS No. 141R,Business Combinations,SFAS No. 141R will require, among other things, the expensing of direct transaction costs, including deal costs and restructuring costs as incurred, acquired IPR&D assets to be capitalized, certain contingent assets and liabilities to be recognized at fair value and earn-out arrangements, including contingent consideration, may be required to be measured at fair value until settled, with changes in fair value recognized each period into earnings. In addition, material adjustments made to the initial acquisition purchase accounting will be required to be recorded back to the acquisition date. This will cause companies to revise previously reported results when reporting comparative financial information in subsequent filings. SFAS No. 141R is effective for the Company on a prospective basis for transactions occurring in 2009 and earlier adoption is not permitted. The Company does not expect SFAS No 141R to have a material impact on the Company’s consolidated financial position, results of operations and cash flows if it enters into material business combinations after the standard’s effective date.
In September 2006, the FASB issued SFAS No. 157, “Fair Value Measurement” (“SFAS 157”), which defines fair value, establishes a framework for measuring fair value in generally accepted accounting principles, and expands disclosures about fair value measurements. The statement does not require any new fair value measurements. SFAS 157 is effective for all financial statements issued for fiscal years beginning after November 15, 2007. The Company is currently evaluating the impact the adoption of SFAS 157 will have on its consolidated results of operations, financial position and cash flows.
3. Basic and Diluted Net Income (Loss) per Share
Basic net income (loss) per common share is computed by dividing the net income (loss) attributed to common stockholders for the period by the weighted average number of common shares outstanding during the period. Diluted net income (loss) per share is computed by dividing the net income (loss) attributed to common stockholders for the period by the weighted average number of common shares, and potentially dilutive common stock equivalents outstanding during the period. Potentially dilutive common stock equivalents include incremental common stock issuable upon the exercise of stock options and warrants to purchase common and redeemable convertible preferred stock, and the conversion of redeemable convertible preferred stock (using the if-converted method) to the extent they are dilutive. Potentially dilutive common stock equivalents that are anti-dilutive are excluded from the calculation of diluted net income (loss) per common share.
65
The following table sets forth the computation of basic and diluted net income (loss) per share for the periods indicated (in thousands, except per share data):
| | | | | | | | | | | |
| | | Years ended December 31, | |
| | | 2007 | | | 2006 | | 2005 | |
| | | |
Numerator: | | | | | | | | | | | |
Net income (loss) before provision for income taxes and cumulative effect of change in accounting principle | | $ | (25,367 | ) | | $ | 8,877 | | $ | (24,862 | ) |
Cumulative effect of change in accounting principle | | | — | | | | — | | | (633 | ) |
| | | | | | | | | | | |
Net income (loss) | | | (25,367 | ) | | | 8,877 | | | (25,495 | ) |
| | | | | | | | | | | |
Denominator: | | | | | | | | | | | |
Weighted average shares used in computing net income (loss) per common share—basic | | | 49,041 | | | | 11,433 | | | 10,794 | |
Add dilutive securities: | | | | | | | | | | | |
Warrants | | | — | | | | 226 | | | — | |
Stock options | | | — | | | | 7,632 | | | — | |
Conversion of redeemable convertible preferred stock | | | — | | | | 37,762 | | | — | |
| | | | | | | | | | | |
Weighted average shares used in computing net income (loss) per common share—diluted | | | 49,041 | | | | 57,053 | | | 10,794 | |
| | | | | | | | | | | |
Net income (loss) per common share—basic | | | | | | | | | | | |
Net income (loss) before cumulative effect of a change in accounting principle | | $ | (0.52 | ) | | $ | 0.78 | | $ | (2.30 | ) |
Cumulative effect of a change in accounting principle | | | — | | | | — | | | (0.06 | ) |
| | | | | | | | | | | |
Net income (loss) | | $ | (0.52 | ) | | $ | 0.78 | | $ | (2.36 | ) |
| | | | | | | | | | | |
Net income (loss) per common share—diluted | | | | | | | | | | | |
Net income (loss) before cumulative effect of a change in accounting principle | | $ | (0.52 | ) | | $ | 0.16 | | $ | (2.30 | ) |
Cumulative effect of a change in accounting principle | | | — | | | | — | | | (0.06 | ) |
| | | | | | | | | | | |
Net income (loss) | | $ | (0.52 | ) | | $ | 0.16 | | $ | (2.36 | ) |
| | | | | | | | | | | |
As of December 31, 2007, 2006 and 2005, the following securities were excluded from the computation of diluted shares outstanding as their effect would have been anti-dilutive due to the Company being in a loss position or due to outstanding options or warrants having exercise prices greater than the average fair market value for the respective periods presented.
Potentially dilutive securities consist of the following (shares in thousands):
| | | | | | |
| | | Years ended December 31, |
| | | 2007 | | 2006 | | 2005 |
Restricted stock units | | 356 | | — | | — |
Stock options outstanding | | 13,851 | | 4,410 | | 11,094 |
Conversion of warrants to purchase redeemable convertible preferred stock | | — | | 160 | | 550 |
Warrants to purchase common stock | | 428 | | 401 | | 401 |
Conversion of redeemable convertible preferred stock | | — | | — | | 37,762 |
4. Restructuring Charges
In October 2007, the Company initiated a restructuring plan to lower annual operating expenses in connection with the retirement of its cable modem termination system platform. This resulted in aggregate net charges of
66
$3.0 million. Severance payments and related charges of approximately $2.2 million consisted primarily of salary and expected payroll taxes and medical benefits. The Company’s plans also included vacating several leased facilities throughout the world, with lease terms expiring through fiscal 2012 with estimated lease payments of $0.7 million, net of sublease income. Severance payments associated with the restructuring plan are expected to be completed in 2008. The payment of costs associated with facility lease obligations are expected to be paid over the remaining term of the related obligations which extend to March, 2012.
| | | | | | | | | | | | | | | | |
| | | Balance
January 1,
2007 | | Charges | | Cash
payments | | | Non-cash
Settlements
and other
Adjustments | | Balance,
December 31,
2007 |
Severance and related expenses | | $ | — | | $ | 2,193 | | $ | (1,462 | ) | | $ | — | | $ | 731 |
Vacated facility costs | | | — | | | 665 | | | (101 | ) | | | 62 | | | 626 |
Other costs | | | — | | | 140 | | | (34 | ) | | | — | | | 106 |
| | | | | | | | | | | | | | | | |
Total | | $ | — | | $ | 2,998 | | $ | (1,597 | ) | | $ | 62 | | $ | 1,463 |
| | | | | | | | | | | | | | | | |
The restructuring charges above have been reflected separately as restructuring charges on the consolidated statement of operations. The balance of restructuring charges as of December 31, 2007 is included in current liabilities.
5. Balance Sheet Data
Marketable Securities
Marketable securities as of December 31, 2007 and December 31, 2006 include the following available-for-sale securities. All securities have contractual maturity dates within two years (in thousands):
| | | | | | | | | | | | | |
| | | As of December 31, 2007 |
| | | Amortized
costs | | Unrealized
gains | | Unrealized
losses | | | Estimated
fair value |
U.S. Agency debt securities | | $ | 14,494 | | $ | 15 | | $ | (2 | ) | | $ | 14,507 |
Corporate debt securities | | | 35,048 | | | 104 | | | (10 | ) | | | 35,142 |
Commercial paper | | | 36,763 | | | 93 | | | (4 | ) | | | 36,852 |
Auction rate securities | | | 11,650 | | | — | | | — | | | | 11,650 |
Municipal debt securities (taxable) | | | 1,200 | | | 7 | | | — | | | | 1,207 |
| | | | | | | | | | | | | |
Total | | $ | 99,155 | | $ | 219 | | $ | (16 | ) | | $ | 99,358 |
| | | | | | | | | | | | | |
| | | | | | | | | | | | |
| | | As of December 31, 2006 |
| | | Amortized
costs | | Unrealized
gains | | Unrealized
losses | | Estimated
fair value |
Corporate debt securities | | $ | 6,599 | | $ | — | | $ | — | | $ | 6,599 |
Commercial paper | | | 15,157 | | | 8 | | | — | | | 15,165 |
Asset-backed certificates | | | 5,139 | | | 1 | | | — | | | 5,140 |
| | | | | | | | | | | | |
Total | | $ | 26,895 | | $ | 9 | | $ | — | | $ | 26,904 |
| | | | | | | | | | | | |
To date, the Company has not recorded any impairment charges on marketable securities related to other-than-temporary declines in market value. The Company recognizes an impairment charge when the decline in the estimated fair value of a marketable security below the amortized cost is determined to be other-than-temporary. The Company considers various factors in determining whether to recognize an impairment charge, including the duration of time and the severity to which the fair value has been less than amortized cost, any adverse changes in the investee’s financial condition and our intent and ability to hold the marketable security for a period of time sufficient to allow for any anticipated recovery in market value.
67
Gross realized losses or gains on the sale of available-for-sale securities were not significant during the years ended December 31, 2007 and 2006.
Inventories
Inventories are comprised of the following (in thousands):
| | | | | | |
| | | As of December 31, |
| | | 2007 | | 2006 |
Raw materials, parts, supplies | | $ | 49 | | $ | 904 |
Work-in-progress | | | 172 | | | 1,059 |
Finished products | | | 6,611 | | | 5,190 |
| | | | | | |
Total | | $ | 6,832 | | $ | 7,153 |
| | | | | | |
Property and Equipment, Net
Property and equipment, net is comprised of the following (in thousands):
| | | | | | | | |
| | | As of December 31, | |
| | | 2007 | | | 2006 | |
Computers, software and related equipment | | $ | 15,489 | | | $ | 11,128 | |
Office furniture and fixtures | | | 1,372 | | | | 836 | |
Engineering and other equipment | | | 24,984 | | | | 19,408 | |
Leasehold improvements | | | 5,991 | | | | 2,049 | |
| | | | | | | | |
| | | 47,836 | | | | 33,421 | |
Less: accumulated depreciation | | | (30,404 | ) | | | (20,633 | ) |
| | | | | | | | |
Total property and equipment, net | | $ | 17,432 | | | $ | 12,788 | |
| | | | | | | | |
In accordance with its policy, the Company reviews the estimated useful lives of its fixed assets on an ongoing basis. In 2007, this review indicated that the actual useful lives of certain fixed assets related to the Company’s cable modem termination system (CMTS) platform were shorter than the previously estimated useful lives used for depreciation purposes in the Company’s financial statements. As a result of the Company’s planned retirement of the CMTS product platform (see Note 4), the Company changed its estimates of the useful lives of these assets to better reflect the estimated periods during which these assets will remain in service. These changes resulted in an additional $0.8 million charge to depreciation expense for the year ended December 31, 2007, and an increase in basic and diluted loss per share of $0.02 for the year ended December 31, 2007.
Intangible Assets
Intangible assets are comprised of the following (in thousands):
| | | | | | | | | | |
| | | Cost | | Accumulated
Amortization | | | Net Book
Value |
As of December 31, 2007: | | | | | | | | | | |
Patented products | | $ | 1,564 | | $ | (1,095 | ) | | $ | 469 |
Customer relationships | | | 670 | | | (468 | ) | | | 202 |
Trade names | | | 503 | | | (440 | ) | | | 63 |
| | | | | | | | | | |
Total | | $ | 2,737 | | $ | (2,003 | ) | | $ | 734 |
| | | | | | | | | | |
68
| | | | | | | | | | |
| | | Cost | | Accumulated
Amortization | | | Net Book
Value |
As of December 31, 2006: | | | | | | | | | | |
Patented products | | $ | 1,564 | | $ | (782 | ) | | $ | 782 |
Customer relationships | | | 670 | | | (335 | ) | | | 335 |
Trade names | | | 503 | | | (314 | ) | | | 189 |
| | | | | | | | | | |
Total | | $ | 2,737 | | $ | (1,431 | ) | | $ | 1,306 |
| | | | | | | | | | |
The estimated future amortization expense of intangible assets as of December 31, 2007, is as follows (in thousands):
| | | |
Years ending December 31, | | | |
2008 | | $ | 510 |
2009 | | | 224 |
| | | |
| | $ | 734 |
| | | |
Goodwill
The carrying value of goodwill was approximately $1.7 million at both December 31, 2007 and 2006. There were no additions or adjustments to goodwill during fiscal years 2007 and 2006.
Other Non-current Assets
Other non-current assets consist of the following (in thousands):
| | | | | | |
| | | As of December 31, |
| | | 2007 | | 2006 |
Severance pay fund | | $ | 2,178 | | $ | 1,771 |
Deferred tax assets | | | 551 | | | 552 |
Restricted cash | | | 751 | | | 245 |
Security deposit | | | 1,692 | | | — |
Other | | | 373 | | | 1,606 |
| | | | | | |
Total | | $ | 5,545 | | $ | 4,174 |
| | | | | | |
Restricted cash consists of a certificate of deposit that is used to secure a standby letter of credit required in connection with an operating lease of the Company and cash used as credit card collateral.
Deferred Revenues, Net
Deferred revenues, net consists of the following (in thousands):
| | | | | | | | |
| | | As of December 31, | |
| | | 2007 | | | 2006 | |
Deferred product revenues, net | | $ | 30,009 | | | $ | 27,335 | |
Deferred service revenues | | | 37,279 | | | | 23,267 | |
| | | | | | | | |
Total deferred revenues, net | | | 67,288 | | | | 50,602 | |
Less deferred revenues, net, current portion | | | (48,256 | ) | | | (39,553 | ) |
| | | | | | | | |
Deferred revenues, net, less current portion | | $ | 19,032 | | | $ | 11,049 | |
| | | | | | | | |
69
Accrued Warranty
The Company provides a warranty for its software and hardware products. Software is warranted to be free of defects generally for a period of 90 days and hardware generally for a period of one to five years from the date of shipment. The Company accrues for potential warranty claims based on the Company’s historical claims experience. The adequacy of the accrual is reviewed on a periodic basis and adjusted, if necessary, based on additional information as it becomes available.
Activity related to the product warranty is as follows (in thousands):
| | | | | | | | |
| | | As of December 31, | |
| | | 2007 | | | 2006 | |
Balance at beginning of year | | $ | 4,136 | | | $ | 3,913 | |
Warranty charged to cost of sales | | | 2,933 | | | | 2,715 | |
Utilization of warranty | | | (1,848 | ) | | | (2,344 | ) |
Other adjustments | | | (862 | ) | | | (148 | ) |
| | | | | | | | |
Total accrued warranty | | | 4,359 | | | | 4,136 | |
Less accrued warranty, current portion | | | (3,502 | ) | | | (3,241 | ) |
| | | | | | | | |
Accrued warranty, less current portion | | $ | 857 | | | $ | 895 | |
| | | | | | | | |
Other Current Liabilities
Other current liabilities consist of the following (in thousands):
| | | | | | |
| | | As of December 31, |
| | | 2007 | | 2006 |
Foreign, franchise, and other income tax liabilities | | $ | 1,886 | | $ | 4,752 |
Sales and use tax payable | | | 1,367 | | | 1,340 |
Customer product trade-in provision | | | 601 | | | 1,071 |
Customer prepayments | | | 2,673 | | | — |
Accrued professional fees | | | 976 | | | 1,261 |
Rent liabilities | | | 1,530 | | | — |
Other | | | 2,846 | | | 1,300 |
| | | | | | |
Total | | $ | 11,879 | | $ | 9,724 |
| | | | | | |
6. Commitments and Contingencies
Commitments
The Company and its subsidiaries operate from leased premises in the United States, Israel, Asia, and Europe with original lease periods expiring in 2007 and 2012. The Company is committed to pay a portion of the buildings’ operating expenses as determined under the lease agreements. The terms of certain lease agreements in Asia have automatic renewal provisions in one year increments. Future minimum lease payments due under the related operating leases with a remaining non-cancelable lease term in excess of one year are as follows (in thousands):
| | | |
Years ending December 31, | | | |
2008 | | $ | 3,161 |
2009 | | | 2,733 |
2010 | | | 2,600 |
2011 | | | 2,569 |
2012 | | | 1,727 |
Thereafter | | | 121 |
| | | |
| | $ | 12,911 |
| | | |
70
The terms of certain lease arrangements have free or escalating rent payment provisions, and when significant, the rent expense is recognized on a straight-line basis over the lease period resulting in a deferred rent liability. Leasehold improvements are amortized over the shorter of their useful life or the contractual lease term. Rent expense under operating leases was approximately $4.0 million, $3.2 million, $3.0 million, for the years ended December 31, 2007, 2006 and 2005, respectively.
Legal Proceedings
Mohanty v. Amir Bassan-Eskenazi, et al., Case No. C 07-5101-SBA and related consolidated cases
Since October 3, 2007, a series of purported shareholder class action lawsuits were filed in the United States District Court for the Northern District of California against the Company, certain of its officers and directors, and the underwriters of the Company’s initial public offering. One such suit was subsequently dismissed. In December 2007, a similar complaint was filed in the Superior Court for the City and County of San Francisco and subsequently removed by the defendants to the United States District Court. The lawsuits allege that the Company’s officers and directors made false or misleading statements to investors in connection with the Company’s initial public offering and thereafter, and that the Company’s registration statement and prospectus contained false or misleading statements regarding the Company’s business prospects. The plaintiffs purport to represent anyone who purchased the Company’s common stock in the initial public offering, or purchased the Company’s common stock between March 14 and September 27, 2007. The lawsuits assert causes of action for violations of Sections 11, 12(a)(2) and 15 of the Securities Act of 1933, and Sections 10(b) and 20(a) of the Securities Exchange Act of 1934. In February 2008, the lawsuits were consolidated and a lead plaintiff was appointed by the Court. The Company anticipates that the lead plaintiff will file a consolidated complaint and that the defendants will respond to the consolidated complaint during the first half of 2008. The lawsuits are still in the preliminary stages, and it is not possible for the Company to quantify the extent of potential liability, if any. As a component of these lawsuits, the Company has the obligation to indemnify the underwriters for expenses related to the suit, including the cost of one counsel for the underwriters.
Ifrah v. Bassan-Eskenazi, et. Al.,Case No. 468401
In December, 2007, a shareholder derivative lawsuit was filed against certain of the Company’s officers and directors in the Superior Court for the County of San Mateo, California. The Company is named as a nominal defendant. The complaint alleges that the defendants violated their fiduciary duties in connection with the Company’s disclosures in connection with the Company’s initial public offering and thereafter, in particular by allegedly issuing false and misleading statements in the Company’s registration statement and prospectus regarding the Company’s business prospects. To date defendants have not responded to the complaint. The lawsuit is in its earliest stages, and it is not possible for the Company to quantify the extent of potential liabilities, if any.
BigBand Networks, Inc. v. Imagine Communications, Inc., Case No. 07-351
On June 5, 2007, the Company filed suit against Imagine Communications, Inc in the U.S. District Court, District of Delaware, alleging infringement of certain U.S. Patents. These patents cover advanced video processing and bandwidth management techniques. The lawsuit seeks injunctive relief, along with damages for willful infringement. The Company is subject to certain counterclaims and legal proceedings related to its lawsuit against Imagine Communications, Inc. The Company intends to defend itself vigorously against such counterclaims. Currently, the Company is unable to estimate the possible loss or range of loss associated with these actions, if any.
Indemnities
From time to time, in its normal course of business, the Company may indemnify other parties with whom it enters into contractual relationships, including customers, lessors, and parties to other transactions with the Company. The Company may agree to hold other parties harmless against specific losses such as those that could arise from a breach of representation or breach of covenant, or third-party infringement claims. It may not be
71
possible to determine the maximum potential amount of liability under such indemnification obligations due to the unique facts and circumstances that are likely to be involved in each particular claim and indemnification provision. Historically, there have been no such indemnification claims.
7. Financing
| | | | | | | |
| | | December 31, | |
| | | 2007 | | 2006 | |
Capital lease | | $ | — | | $ | 56 | |
Line of credit | | | — | | | 4,000 | |
Loans payable | | | — | | | 10,480 | |
| | | | | | | |
| | | — | | | 14,536 | |
Less: current portion | | | — | | | (5,937 | ) |
| | | | | | | |
| | $ | — | | $ | 8,599 | |
| | | | | | | |
In August 2006, the Company signed a loan and security agreement with a third-party financial institution providing for a term loan of $10.0 million and a revolving line of credit of up to $20.0 million. The term loan accrued interest at prime (8.25% at December 31, 2006) plus one quarter of one percent, payable monthly. Non-refundable loan commitment fees incurred at the inception of the loans were being amortized to interest expense over the term of the loan. At December 31, 2006, $10.0 million and $4.0 million were outstanding under the term loan and the revolving line of credit, respectively. During the year ended December 31, 2007, the term loan and the revolving line of credit were fully repaid and the loan and security agreement was terminated.
In December 2006, the Company entered into a license agreement with a vendor for software and related support services. The agreement provided for an initial payment due upon purchase of the license with two installment payments due in December 2007 and 2008. The Company recorded the cost of the software equal to the initial payment and the discounted value of the installment payments based on an imputed interest rate of 8.0%. The present value of the future installment payments at December 31, 2006 was approximately $479,000. This agreement was repaid in full in November 2007.
8. Redeemable Convertible Preferred Stock
On March 20, 2007, the closing date of the Company’s IPO, and pursuant to the amended and restated certificate of incorporation, all outstanding shares of redeemable convertible preferred stock converted into an aggregate of 37,761,548 shares of common stock.
| | | | | | |
Preferred Stock Series | | Conversion
Rate | | Preferred
Stock Shares | | Common
Stock Shares |
A, A-1, and A-2 | | 2-for-1 | | 1,202,826 | | 2,405,652 |
B | | 2-for-1 | | 1,739,220 | | 3,478,440 |
C | | 1.47*-for-1 | | 11,370,745 | | 16,751,543 |
D | | 1-for-1 | | 5,380,201 | | 5,380,201 |
E-1 and E-2 | | 1-for-1 | | 9,745,712 | | 9,745,712 |
| | | | | | |
| | | | 29,438,704 | | 37,761,548 |
| | | | | | |
In connection with the conversion of the shares of redeemable convertible preferred stock, warrants to purchase shares of redeemable convertible preferred stock were converted to warrants to purchase shares of common stock.
72
9. Related-Party Transactions
Beginning in 2002, the Company had an agreement with a member of its Board of Directors to provide the Company strategic advisory services. The Company recorded consulting fees for these services of approximately $90,000 for each of the years ended December 31, 2005 and 2006, which were recorded in general and administrative expenses in the accompanying consolidated statements of operations. This agreement was terminated in December 2006 and no payments were made in 2007 under the agreement.
10. Stockholders’ Equity (Deficit)
In February 2007, the Board of Directors approved a reverse stock split of the Company’s outstanding shares of common stock and preferred stock. On February 15, 2007, subsequent to stockholder approval, the Company filed an amendment to its fourth amended and restated certificate of incorporation effecting a 1-for-4 reverse stock split of all of its class A and B common stock and all redeemable convertible preferred stock. All issued and outstanding shares of common stock, preferred stock, warrants and options for common and preferred stock, and per share amounts, except for per share par value, contained in the consolidated financial statements have been retroactively adjusted to reflect this reverse stock split.
On March 20, 2007, and upon the closing of the Company’s IPO, all outstanding shares of class B common stock automatically converted into 3,618,873 shares of common stock on a 1-for-1 share basis.
Common Stock Warrants
The Company had the following unexercised common stock warrants (in thousands, except per share data):
| | | | | | | | | | | | |
| | | | | December 31, 2007 | | December 31, 2006 |
Class | | Expiration Date | | Exercise
Price per
Share | | Shares
Unexercised | | Exercise
Price per
Share | | Shares
Unexercised |
Class A common | | February 20, 2010 | | $ | 1.79 | | 268 | | $ | — | | — |
Class A common | | June 29, 2011 | | $ | 4.37 | | 160 | | $ | — | | — |
Class B common | | June 29, 2009 | | $ | — | | — | | $ | 4.37 | | 401 |
In 2007, warrants to purchase 502,000 shares of common stock were exercised with total proceeds of approximately $1.8 million paid to the Company.
Stock Options
The Company’s 2007 Equity Incentive Plan (the 2007 Plan) allows the Company to award stock option grants and restricted stock to employees, officers, directors and consultants of the Company. The exercise price of incentive stock options granted under the Plan may not be less than 100% of the fair market value of the Company’s common stock on the date of the grant. The exercise price of nonqualified stock options cannot be less than 100% of the market value on the date of grant. Options granted under the Plan are generally exercisable over a four-year period with 25% of the options vesting after twelve months and the remaining options vesting ratably over the 36 month period thereafter. Options granted under the plan have a maximum term of ten years from the date of grant.
73
Data pertaining to stock option activity under the Plan is as follows (in thousands, except per share and year data):
| | | | | | | | | | |
| | | Number
of Options | | | Weighted Average
Exercise Price | | Weighed Average
Remaining
Contractual Life | | Aggregate
Intrinsic
Value |
Outstanding at December 31, 2004 | | 10,527 | | | $0.88 | | 8.80 | | $ | 8,716 |
Granted | | 1,884 | | | $1.72 | | | | | |
Exercised | | (644 | ) | | $0.80 | | | | | |
Canceled | | (674 | ) | | $0.88 | | | | | |
| | | | | | | | | | |
Outstanding at December 31, 2005 | | 11,093 | | | $1.02 | | 8.14 | | $ | 13,141 |
Granted | | 6,284 | | | $4.39 | | | | | |
Exercised | | (708 | ) | | $1.08 | | | | | |
Canceled | | (649 | ) | | $1.64 | | | | | |
| | | | | | | | | | |
Outstanding at December 31, 2006 | | 16,020 | | | $2.31 | | 8.09 | | $ | 55,194 |
Granted | | 3,846 | | | $7.58 | | | | | |
Exercised | | (4,055 | ) | | $1.15 | | | | | |
Canceled | | (1,960 | ) | | $4.14 | | | | | |
| | | | | | | | | | |
Outstanding at December 31, 2007 | | 13,851 | | | $3.85 | | 7.33 | | $ | 26,651 |
| | | | | | | | | | |
Vested and expected to vest | | 13,249 | | | | | 7.26 | | $ | 26,256 |
| | | | | | | | | | |
The following table summarizes the information about stock options outstanding and exercisable as of December 31, 2007 (shares in thousands):
| | | | | | | | | | | | |
| | | Options Outstanding | | Options Exercisable |
Exercise Price | | Number | | Weighted Average
Remaining
Contractual Life
(Years) | | Weighted
Average
Exercise
Price | | No. Shares
Exercisable | | Weighted
Average
Exercise
Price |
$0.20 - 1.00 | | 4,570 | | 4.98 | | $ | 0.82 | | 4,366 | | $ | 0.81 |
1.32 - 2.60 | | 2,235 | | 7.05 | | $ | 2.05 | | 1,120 | | $ | 2.00 |
5.28 | | 3,033 | | 8.28 | | $ | 5.28 | | 747 | | $ | 5.28 |
5.36 - 7.34 | | 3,386 | | 9.47 | | $ | 6.04 | | 196 | | $ | 5.80 |
9.33 - 18.95 | | 627 | | 9.30 | | $ | 13.58 | | 41 | | $ | 12.62 |
| | | | | | | | | | | | |
| | 13,851 | | 7.33 | | $ | 3.85 | | 6,470 | | $ | 1.76 |
| | | | | | | | | | | | |
The weighted-average grant-date fair value of options granted for the years ended December 31, 2007 and 2006 on a per-share basis were approximately $6.63 and $3.57, respectively. The total intrinsic value of options exercised during the years ended December 31, 2007, 2006, and 2005, was $28.0 million, $1.4 million, and $0.5 million, respectively. The intrinsic value of options exercised is calculated based on the difference between the exercise price and the closing price of the Company’s common stock on the exercise date.
The weighted-average fair value and exercise price of options granted during the year ended December 31, 2007 are as follows:
| | | | | |
Weighted-average fair value: | | | | | |
Options granted below deemed market value | | $ | 8.52 | | |
Options granted equal to market value | | $ | 5.40 | | |
Weighted-average exercise price: | | | | | |
Options granted below deemed market value | | $ | 7.51 | | |
Options granted equal to market value | | $ | 7.62 | | |
74
Stock-Based Compensation
Beginning on January 1, 2006, and upon the adoption of SFAS 123R, the fair value of each new option awarded is estimated on the grant date using the Black-Scholes valuation model using the assumptions noted in the following table:
| | | | |
| | | Years ended December 31, |
| | | 2007 | | 2006 |
Stock Options | | | | |
Expected volatility | | 75-91% | | 91-98% |
Expected term | | 6 years | | 6 years |
Risk-free interest | | 3.89-4.75% | | 4.57-4.96% |
Expected dividends | | — | | — |
| | |
Stock Purchase Plan | | | | |
Expected volatility | | 55-90% | | — |
Expected term | | 0.5-0.6 years | | — |
Risk-free interest | | 3.71-5.12% | | — |
Expected dividends | | — | | — |
The Company’s computation of expected volatility is derived from historical volatilities of comparable companies within the communications equipment industry. The risk-free interest factor is based on the U.S. Treasury yield curve in effect at the time of grant for zero coupon U.S. Treasury notes with maturities approximately equal to each grant’s expected term. The expected term is calculated using the simplified method provided in the Securities Exchange Commission’s Staff Accounting Bulletin No. 107, which takes into consideration the grant’s contractual life and the vesting periods. The Company estimates its forfeiture rate based on an analysis of its actual forfeitures and will continue to evaluate the adequacy of the forfeiture rate based on actual forfeiture experience, analysis of employee turnover behavior, and other factors. Estimates are evaluated each reporting period and adjusted, if necessary, by recognizing the cumulative effect of the change in estimate on compensation costs recognized in prior year periods. Forfeiture rate adjustments have not been significant to date. During the years ended December 31, 2007 and 2006, the Company recorded stock-based compensation under the fair value requirements of SFAS 123R of approximately $10.4 million and $1.4 million, respectively.
As of December 31, 2007, pursuant to SFAS 123R, there was $38.2 million of total unrecognized compensation costs related to non-vested share-based compensation arrangements granted under the Plan. That cost is expected to be recognized over a weighted-average period of 2.98 years.
Restricted Stock Units
The 2007 Plan provides for grants of restricted stock units (RSUs) that generally vest over four years from the date of grant. The RSUs are classified as equity awards because the RSUs are paid only in shares upon vesting. RSU awards are measured at the fair value at the date of grant. In 2007, the Company recorded stock-based compensation expense of $0.8 million.
The following table summarizes the Company’s restricted stock unit activity:
| | | | | | | | | | | |
| | | Restricted
Stock Units | | | Weighted
Average
Grant-Date
Fair Value | | Weighted Average
Remaining
Contractual
Life | | Aggregate
Intrinsic
Value |
Outstanding, December 31, 2006 | | — | | | | | | — | | | |
Granted | | 406 | | | $ | 15.14 | | — | | $ | — |
Cancelled | | (50 | ) | | | | | — | | | |
| | | | | | | | | | | |
Outstanding, December 31, 2007 | | 356 | | | $ | 14.61 | | 2.23 | | $ | 1,832 |
| | | | | | | | | | | |
Vested and expected to vest | | 324 | | | | | | 2.20 | | $ | 1,666 |
| | | | | | | | | | | |
75
Employee Stock Purchase Plan
On January 31, 2007, the Board of Directors approved the 2007 Employee Stock Purchase Plan (ESPP). A total of 1,000,000 shares of common stock were reserved for future issuance under the ESPP, which became effective on March 15, 2007. Under the ESPP, employees may purchase shares of common stock at a price per share that is 85% of the fair market value of the Company’s common stock as of the beginning or the end of each offering period, whichever is lower. The ESPP is compensatory and results in compensation cost accounted for under SFAS 123(R). For the year ended December 31, 2007, the Company recorded stock-based compensation expense associated with its ESPP of $0.7 million.
Shares Reserved
Common stock reserved for future issuance is as follows (in thousands):
| | | | |
| | | December 31, |
| | | 2007 | | 2006 |
Conversion of redeemable convertible preferred stock | | — | | 37,759 |
Conversion of class B common stock | | — | | 3,619 |
Restricted stock units | | 356 | | |
| | |
Warrants to purchase redeemable convertible preferred and common stock | | 428 | | 934 |
ESPP shares reserved for future issuance | | 787 | | — |
Reserved for future ESPP issuances | | | | |
Stock options: | | | | |
Outstanding | | 13,851 | | 16,020 |
Reserved for future grants | | 5,906 | | 2,129 |
| | | | |
Total: | | 21,328 | | 60,461 |
| | | | |
11. Segment Reporting
FASB Statement No. 131, “Disclosures about Segments of an Enterprise and Related Information,” establishes standards for reporting information about operating segments. Operating segments are defined as components of an enterprise for which separate financial information is available and is evaluated regularly by the chief operating decision maker, or decision making group, in deciding how to allocate resources and in assessing performance. The Company’s chief operating decision maker is the Chief Executive Officer (CEO). The CEO reviews financial information presented on a consolidated basis for evaluating financial performance and allocating resources. There are no segment managers who are held accountable for operations below the consolidated financial statement level. Accordingly, the Company reports as a single reporting segment.
Net revenues by geographical region are as follows (in thousands):
| | | | | | | | | |
| | | Years ended December 31, |
| | | 2007 | | 2006 | | 2005 |
United States | | $ | 146,835 | | $ | 157,466 | | $ | 81,175 |
Americas excluding United States | | | 1,393 | | | 4,051 | | | 931 |
Asia | | | 13,670 | | | 3,082 | | | 4,029 |
Europe | | | 14,612 | | | 12,025 | | | 11,844 |
| | | | | | | | | |
| | $ | 176,510 | | $ | 176,624 | | $ | 97,979 |
| | | | | | | | | |
Net revenues are allocated to the geographical region based on the shipping destination of customer orders.
76
Products revenues by product line are as follows (in thousands):
| | | | | | | | | |
| | | Years ended December 31, |
| | | 2007 | | 2006 | | 2005 |
Video | | $ | 121,046 | | $ | 121,937 | | $ | 34,296 |
Data | | | 23,669 | | | 32,076 | | | 51,670 |
| | | | | | | | | |
| | $ | 144,715 | | $ | 154,013 | | $ | 85,966 |
| | | | | | | | | |
Long-lived assets by geographical regions are as follows (in thousands):
| | | | | | |
| | | As of December 31, |
| | | 2007 | | 2006 |
United States | | $ | 9,358 | | $ | 8,148 |
Israel | | | 7,752 | | | 4,519 |
Other | | | 322 | | | 121 |
| | | | | | |
| | $ | 17,432 | | $ | 12,788 |
| | | | | | |
12. Income Taxes
The Company’s net income (loss) before provision for income tax and cumulative effect of change in accounting principle was comprised of the following (in thousands):
| | | | | | | | | | | |
| | | Years ended December 31, | |
| | | 2007 | | | 2006 | | 2005 | |
Domestic | | $ | (25,755 | ) | | $ | 9,868 | | $ | (25,066 | ) |
Foreign | | | 1,613 | | | | 1,534 | | | 529 | |
| | | | | | | | | | | |
Net income (loss) before provision for income tax | | $ | (24,142 | ) | | $ | 11,402 | | $ | (24,537 | ) |
| | | | | | | | | | | |
Provision for income tax consisted of the following (in thousands):
| | | | | | | | | | | |
| | | Years ended December 31, |
| | | 2007 | | | 2006 | | | 2005 |
Current | | | | | | | | | | | |
Federal | | $ | — | | | $ | 376 | | | $ | — |
State | | | (48 | ) | | | 112 | | | | — |
Foreign | | | 1,228 | | | | 2,544 | | | | 259 |
| | | | | | | | | | | |
| | | 1,180 | | | | 3,032 | | | | 259 |
| | | | | | | | | | | |
Deferred | | | | | | | | | | | |
Federal | | | 38 | | | | 39 | | | | 58 |
State | | | 6 | | | | 6 | | | | 8 |
Foreign | | | 1 | | | | (552 | ) | | | — |
| | | | | | | | | | | |
| | | 45 | | | | (507 | ) | | | 66 |
| | | | | | | | | | | |
Total | | $ | 1,225 | | | $ | 2,525 | | | $ | 325 |
| | | | | | | | | | | |
77
Reconciliations of the provisions for income tax at the statutory rate to the Company’s provision for income tax are as follows (in thousands):
| | | | | | | | | | | | |
| | | Years ended December 31, | |
| | | 2007 | | | 2006 | | | 2005 | |
Tax provision (benefit) at federal statutory rate | | $ | (8,450 | ) | | $ | 3,850 | | | $ | (8,588 | ) |
U.S. losses not benefited (net operating loss carryforward utilized) | | | 7,113 | | | | (3,445 | ) | | | 9,507 | |
Foreign operations | | | 618 | | | | 1,370 | | | | 259 | |
State taxes | | | (27 | ) | | | 77 | | | | — | |
Research and development tax credits | | | (1,037 | ) | | | (1,485 | ) | | | (1,194 | ) |
Stock-based compensation | | | 1,127 | | | | 756 | | | | 243 | |
Warrant amortization | | | 1,741 | | | | 842 | | | | — | |
Permanent items | | | 140 | | | | 560 | | | | 98 | |
| | | | | | | | | | | | |
Provision for income taxes | | $ | 1,225 | | | $ | 2,525 | | | $ | 325 | |
| | | | | | | | | | | | |
Significant components of the Company’s net deferred tax assets are as follows (in thousands):
| | | | | | | | |
| | | As of December 31, | |
| | | 2007 | | | 2006 | |
Deferred tax assets: | | | | | | | | |
Reserves and accruals | | $ | 12,818 | | | $ | 6,474 | |
Stock compensation | | | 1,266 | | | | 168 | |
Depreciation and amortization | | | 2,267 | | | | 2,037 | |
Net operating loss carryforwards | | | 30,314 | | | | 33,803 | |
Tax credit carryforwards | | | 3,400 | | | | 4,248 | |
| | | | | | | | |
Total deferred tax assets | | | 50,065 | | | | 46,730 | |
Deferred tax liabilities: | | | | | | | | |
Goodwill | | | (154 | ) | | | (110 | ) |
| | | | | | | | |
Gross deferred taxes | | | 49,911 | | | | 46,620 | |
Valuation allowance | | | (49,514 | ) | | | (46,178 | ) |
| | | | | | | | |
Net deferred tax assets | | $ | 397 | | | $ | 442 | |
| | | | | | | | |
Recognition of deferred tax assets is appropriate when realization of such assets is more likely than not. Based upon the weight of available evidence, which includes the Company’s historical operating performance and the recorded domestic cumulative net losses in all prior fiscal periods, the Company has provided a full valuation allowance against its U.S. deferred tax assets. The Company’s valuation allowance increased by $3.3 million, decreased by $11.5 million and increased by $7.2 million in the years ended December 31, 2007, 2006 and 2005, respectively. As of December 31, 2007, the Company has U.S. federal and state net operating losses of approximately $90.8 million and $45.1 million, respectively. The U.S. federal net operating loss carryforwards will expire at various dates beginning in 2019 through 2027 if not utilized. Most state net operating loss carryforwards will expire at various dates beginning in 2009 through 2027.
As of December 31, 2007, the Company has U.S. tax credit carryforwards, primarily from research and development credits, of approximately $2.3 million for federal and $1.0 million for state. The federal credit will expire at various dates beginning in 2020 through 2027 if unused. The California state research and development credits can be carried forward indefinitely. Other state incentive tax credits will expire at various dates beginning in 2009 through 2011.
Net operating loss carryforwards and credit carryforwards reflected above are likely to be limited due to ownership changes as provided in Section 382 of the Internal Revenue Code and similar state provisions. The
78
Company has not provided for U.S. federal income taxes on all of the non-U.S. subsidiaries’ undistributed earnings as of December 31, 2007, because such earnings are intended to be indefinitely reinvested. Upon distribution of those earnings in the form of dividends or otherwise, the Company would be subject to applicable U.S. federal and state income taxes.
In connection with the Company’s adoption of SFAS No. 123R, the Company uses the ‘with-and-without’ approach described in EITF Topic No. D-32, “Intraperiod Tax Allocation of the Tax Effect of Pretax Income from Continuing Operations,” to determine the recognition and measurement of excess tax benefits. Accordingly, the Company has elected to recognize excess income tax benefits from stock option exercises in additional paid in capital only if an incremental income tax benefit would be realized after considering all other tax attributes presently available to the Company. As of December 31, 2007, the amount of such excess tax benefits from stock options included in net operating losses was $8.8 million. In addition, the Company has elected to account for the indirect effects of stock-based awards on other tax attributes, such as the research and alternative minimum tax credits, through the income statement.
13. 401(k) Savings and Retirement Plan
The Company sponsors a 401(k) Savings and Retirement Plan (Plan) for all employees who meet certain eligibility requirements. Participants may contribute, on a pre-tax basis, between 1 percent and 90 percent of their annual compensation, but not to exceed a maximum contribution amount pursuant to Section 401(k) of the Internal Revenue Code. The Company is not required to contribute, nor has it contributed, to the Plan for any of the periods presented.
14. Selected Quarterly Financial Data (Unaudited)
The following tables summarize the unaudited quarterly financial data for the last two years (in thousands except per share data):
| | | | | | | | | | | | | | | |
| | | Year Ended December 31, 2007 | |
| | | First
Quarter | | | Second
Quarter | | Third
Quarter | | | Fourth
Quarter | |
Total net revenues | | $ | 52,834 | | | $ | 54,463 | | $ | 38,550 | | | $ | 30,663 | |
Gross profit | | | 30,396 | | | | 29,091 | | | 13,697 | | | | 13,652 | |
Net income (loss) | | | (977 | ) | | | 1,655 | | | (12,245 | ) | | | (13,800 | ) |
Net income (loss) per share—basic | | | (0.05 | ) | | | 0.03 | | | (0.21 | ) | | | (0.23 | ) |
Net income (loss) per share—diluted | | | (0.05 | ) | | | 0.02 | | | (0.21 | ) | | | (0.23 | ) |
| | | | | | | | | | | | | | |
| | | Year Ended December 31, 2006 |
| | | First
Quarter | | | Second
Quarter | | | Third
Quarter | | Fourth
Quarter |
Total net revenues | | $ | 32,550 | | | $ | 38,008 | | | $ | 43,064 | | $ | 63,002 |
Gross profit | | | 16,650 | | | | 18,508 | | | | 22,289 | | | 35,780 |
Net income (loss) | | | (1,063 | ) | | | (581 | ) | | | 1,578 | | | 8,943 |
Net income (loss) per share—basic | | | (0.09 | ) | | | (0.05 | ) | | | 0.14 | | | 0.76 |
Net income (loss) per share—diluted | | | (0.09 | ) | | | (0.05 | ) | | | 0.03 | | | 0.15 |
Item 9. Changes In and Disagreements with Accountants on Accounting and Financial Disclosure
None
79
Item 9A. Controls and Procedures
Conclusion Regarding the Effectiveness of Disclosure Controls and Procedures
We maintain disclosure controls and procedures, as such term is defined in SEC Rule 13a-15(e), that are designed to ensure that information required to be disclosed in our reports under the Securities Exchange Act of 1934 is recorded, processed, summarized and reported within the time periods specified in the Securities and Exchange Commission’s rules and forms and that such information is accumulated and communicated to our management, including our Chief Executive Officer and Chief Accounting Officer, as appropriate, to allow for timely decisions regarding required disclosure. In designing and evaluating the disclosure controls and procedures, management recognizes that any controls and procedures, no matter how well designed and operated, can provide only reasonable assurance of achieving the desired control objectives, and management is required to apply its judgment in evaluating the cost-benefit relationship of possible controls and procedures.
As required by SEC Rule 13a-15(b), we carried out an evaluation, under the supervision and with the participation of our management, including our Chief Executive Officer and Chief Accounting Officer, of the effectiveness of the design and operation of our disclosure controls and procedures as of December 31, 2007. Based on the foregoing, our Chief Executive Officer and Chief Accounting Officer concluded that our disclosure controls and procedures were effective at the reasonable assurance level.
Changes in Internal Control over Financial Reporting
There have been no other changes in our internal controls over financial reporting that occurred during the most recent fiscal quarter that have materially affected, or are reasonably likely to materially affect, our internal controls over financial reporting.
Item 9B. Other Information
Our annual meeting of stockholders is currently scheduled to be held on June 10, 2008.
80
PART III
Item 10. Directors, Executive Officers and Corporate Governance
Information relating to directors and officers of BigBand Networks is set forth under the captions entitled “Election of Directors,” “Executive Officers of the Company” and “Section 16(a) Beneficial Ownership Reporting Compliance” in the Company’s Proxy Statement for the 2008 Annual Meeting of Stockholders and is incorporated herein by reference.
BigBand Networks’ Code of Ethics is available on the Company website at www.bigbandnet.com under Investor Relations, Corporate Governance. The website also will disclose whether there have been any amendments or waivers to the Code of Ethics. BigBand Networks will provide copies of these documents, in electronic or paper form, upon request to Investor Relations, free of charge.
The board of directors of BigBand Networks has identified Ken Goldman, the chairman of the Audit Committee, as our audit committee financial expert, as defined by the SEC.
Item 11. Executive Compensation
Information regarding compensation of officers and directors of the Company is set forth under the captions entitled “Executive Compensation,” “Compensation of Directors,” and “Employment Contracts and Termination of Employment and Change-of-Control Arrangements” in the Proxy Statement incorporated herein by reference.
Item 12. Security Ownership of Certain Beneficial Owners and Management and Related Stockholder Matters
Information regarding ownership of BigBand Networks common stock is set forth under the captions entitled “Equity Compensation Plan Information,” “Security Ownership of Management” and “Security Ownership of Principal Stockholders” in the Proxy Statement and is incorporated herein by reference.
Item 13. Certain Relationships and Related Transactions
Information regarding certain relationships and related transactions with BigBand Networks is set forth under the captions entitled “Compensation of Directors” and “Certain Relationships and Related Party Transactions” in the Proxy Statement and is incorporated herein by reference.
Item 14. Principal Accountant Fees and Services
Information regarding principal accountant fees and services is set forth under the caption “Relationship with Independent Registered Public Accounting Firm” in the Proxy Statement and is incorporated herein by reference.
81
PART IV
Item 15. Exhibits and Financial Statement Schedules
| | | | | | | | | | | | |
| | | | | Incorporated by Reference | | |
Exhibit
Number | | Description | | Form | | File
Number | | Exhibit
Number | | Filing Date | | Filed with
this 10-K |
3.1 | | Form of Amended and Restated Certificate of Incorporation of the Registrant | | S-1 | | 333-139652 | | 3.1B | | December 22, 2006 | | |
| | | | | | |
3.2 | | Form of Amended and Restated Bylaws of the Registrant | | S-1 | | 333-139652 | | 3.2B | | December 22, 2006 | | |
| | | | | | |
10.6 | | 2007 Equity Incentive Plan | | S-1/A | | 333-139652 | | 10.6 | | March 8, 2007 | | |
| | | | | | |
10.6A | | Form of Option Agreement (U.S.) | | 10-Q | | 001-33355 | | 10.6A | | August 8, 2007 | | |
| | | | | | |
10.6B | | Form of Option Agreement (Non-U.S.) | | 10-Q | | 001-33355 | | 10.6B | | August 8, 2007 | | |
| | | | | | |
10.6C | | Form of Restricted Stock Unit Agreement (U.S.) | | 10-Q | | 001-33355 | | 10.6C | | August 8, 2007 | | |
| | | | | | |
10.6D | | Form of Restricted Stock Unit Agreement (Non-U.S.) | | 10-Q | | 001-33355 | | 10.6D | | August 8, 2007 | | |
| | | | | | |
10.6E | | 2007 Equity Incentive Plan Sub-Plan for Israeli Employees | | 10-Q | | 001-33355 | | 10.6E | | August 8, 2007 | | |
| | | | | | |
10.6F | | Form of Israeli Sub-Plan Option Agreement | | 10-Q | | 001-33355 | | 10.6F | | August 8, 2007 | | |
| | | | | | |
10.9A | | Amendment to Offer Letter Agreement—Ran Oz | | | | | | | | | | X |
| | | | | | |
10.10 | | Offer Letter Agreement—Maurice Castonguay | | | | | | | | | | X |
| | | | | | |
10.11 | | Offer Letter Agreement—David Heard | | S-1/A | | 333-139652 | | 10.23 | | February 26, 2007 | | |
| | | | | | |
10.11A | | Amendment to Offer Letter Agreement—David Heard | | | | | | | | | | X |
| | | | | | |
10.12A | | Amendment to Offer Letter Agreement—Robert Horton | | | | | | | | | | X |
| | | | | | |
10.13A | | Amendment to Offer Letter Agreement—Jeffrey Lindholm | | | | | | | | | | X |
| | | | | | |
10.21 | | Lease Agreement (Tel Aviv, Israel) | | S-1 | | 333-139652 | | 3.2B | | December 22, 2006 | | |
| | | | | | |
10.21A | | Addendum to Lease Agreement | | 10-Q | | 001-33355 | | 10.21B | | May 9, 2007 | | |
| | | | | | |
10.23 | | Transition Services Agreement—Fred Ball | | 8-K | | 001-33355 | | 10.23 | | October 18, 2007 | | |
| | | | | | |
10.24 | | Lease Agreement (Tel Aviv, Israel) | | 8-K | | 001-33355 | | 99.1 | | July 30, 2007 | | |
| | | | | | |
10.24A | | Amendment to Lease Agreement (Tel Aviv, Israel) | | | | | | | | | | X |
| | | | | | |
21.1 | | Subsidiaries of the Registrant | | | | | | | | | | X |
| | | | | | |
23.1 | | Consent of Independent Registered Public Accounting Firm | | | | | | | | | | X |
| | | | | | |
31.1 | | Certification of Chief Executive Officer pursuant to Section 302 of the Sarbanes-Oxley Act of 2002 | | | | | | | | | | X |
| | | | | | |
31.2 | | Certification of Chief Accounting Officer pursuant to Section 302 of the Sarbanes-Oxley Act of 2002 | | | | | | | | | | X |
| | | | | | |
32.1 | | Certification of Chief Executive Officer and Chief Accounting Officer pursuant to Section 906 of the Sarbanes-Oxley Act of 2002 | | | | | | | | | | X |
82
SIGNATURES
Pursuant to the requirements of Section 13 or 15(d) of the Securities Exchange Act of 1934, as amended, the Registrant has duly caused this report to be signed on our behalf by the undersigned, thereunto duly authorized on the 11th day of March, 2008.
| | |
BIGBAND NETWORKS, INC. |
| |
| By: | | /S/ AMIR BASSAN-ESKENAZI |
| | Amir Bassan-Eskenazi President, Chief Executive Officer and Chairman of the Board |
Pursuant to the requirements of the Securities Exchange Act of 1934, as amended, this report has been signed below on March 11, 2008 by the following persons on behalf of the Registrant and in the capacities indicated.
| | | | |
Signature | | Title | | Date |
| | |
/S/ AMIR BASSAN-ESKENAZI Amir Bassan-Eskenazi | | President, Chief Executive Officer and Chairman of the Board (Principal Executive Officer) | | March 11, 2008 |
| | |
/S/ RAVI NARULA Ravi Narula | | Chief Accounting Officer (Principal Accounting Officer) | | March 11, 2008 |
| | |
/S/ LLOYD CARNEY | | Director | | March 11, 2008 |
| Lloyd Carney | | |
| | |
/S/ DEAN GILBERT | | Director | | March 11, 2008 |
| Dean Gilbert | | |
| | |
/S/ KEN GOLDMAN | | Director | | March 11, 2008 |
| Ken Goldman | | |
| | |
/S/ GAL ISRAELY | | Director | | March 11, 2008 |
| Gal Israely | | |
| | |
/S/ RAN OZ | | Director | | March 11, 2008 |
| Ran Oz | | |
| | |
/S/ BRUCE SACHS | | Director | | March 11, 2008 |
| Bruce Sachs | | |
| | |
/S/ GEOFFREY YANG | | Director | | March 11, 2008 |
| Geoffrey Yang | | |
| | |
/S/ ROBERT SACHS | | Director | | March 11, 2008 |
| Robert Sachs | | |
83
EXHIBIT INDEX
| | | | | | | | | | | | |
| | | | | Incorporated by Reference | | |
Exhibit Number | | Description | | Form | | File
Number | | Exhibit
Number | | Filing Date | | Filed with this 10-K |
3.1 | | Form of Amended and Restated Certificate of Incorporation of the Registrant | | S-1 | | 333-139652 | | 3.1B | | December 22, 2006 | | |
| | | | | | |
3.2 | | Form of Amended and Restated Bylaws of the Registrant | | S-1 | | 333-139652 | | 3.2B | | December 22, 2006 | | |
| | | | | | |
10.6 | | 2007 Equity Incentive Plan | | S-1/A | | 333-139652 | | 10.6 | | March 8, 2007 | | |
| | | | | | |
10.6A | | Form of Option Agreement (U.S.) | | 10-Q | | 001-33355 | | 10.6A | | August 8, 2007 | | |
| | | | | | |
10.6B | | Form of Option Agreement (Non-U.S.) | | 10-Q | | 001-33355 | | 10.6B | | August 8, 2007 | | |
| | | | | | |
10.6C | | Form of Restricted Stock Unit Agreement (U.S.) | | 10-Q | | 001-33355 | | 10.6C | | August 8, 2007 | | |
| | | | | | |
10.6D | | Form of Restricted Stock Unit Agreement (Non-U.S.) | | 10-Q | | 001-33355 | | 10.6D | | August 8, 2007 | | |
| | | | | | |
10.6E | | 2007 Equity Incentive Plan Sub-Plan for Israeli Employees | | 10-Q | | 001-33355 | | 10.6E | | August 8, 2007 | | |
| | | | | | |
10.6F | | Form of Israeli Sub-Plan Option Agreement | | 10-Q | | 001-33355 | | 10.6F | | August 8, 2007 | | |
| | | | | | |
10.9A | | Amendment to Offer Letter Agreement—Ran Oz | | | | | | | | | | X |
| | | | | | |
10.10 | | Offer Letter Agreement—Maurice Castonguay | | | | | | | | | | X |
| | | | | | |
10.11 | | Offer Letter Agreement—David Heard | | S-1/A | | 333-139652 | | 10.23 | | February 26, 2007 | | |
| | | | | | |
10.11A | | Amendment to Offer Letter Agreement—David Heard | | | | | | | | | | X |
| | | | | | |
10.12A | | Amendment to Offer Letter Agreement—Robert Horton | | | | | | | | | | X |
| | | | | | |
10.13A | | Amendment to Offer Letter Agreement —Jeffrey Lindholm | | | | | | | | | | X |
| | | | | | |
10.21 | | Lease Agreement (Tel Aviv, Israel) | | S-1 | | 333-139652 | | 3.2B | | December 22, 2006 | | |
| | | | | | |
10.21A | | Addendum to Lease Agreement | | 10-Q | | 001-33355 | | 10.21B | | May 9, 2007 | | |
| | | | | | |
10.23 | | Transition Services Agreement—Fred Ball | | 8-K | | 001-33355 | | 10.23 | | October 18, 2007 | | |
| | | | | | |
10.24 | | Lease Agreement (Tel Aviv, Israel) | | 8-K | | 001-33355 | | 99.1 | | July 30, 2007 | | |
| | | | | | |
10.24A | | Amendment to Lease Agreement (Tel Aviv, Israel) | | | | | | | | | | X |
| | | | | | |
21.1 | | Subsidiaries of the Registrant | | | | | | | | | | X |
| | | | | | |
23.1 | | Consent of Independent Registered Public Accounting Firm | | | | | | | | | | X |
| | | | | | |
31.1 | | Certification of Chief Executive Officer pursuant to Section 302 of the Sarbanes-Oxley Act of 2002 | | | | | | | | | | X |
| | | | | | |
31.2 | | Certification of Chief Accounting Officer pursuant to Section 302 of the Sarbanes-Oxley Act of 2002 | | | | | | | | | | X |
| | | | | | |
32.1 | | Certification of Chief Executive Officer and Chief Accounting Officer pursuant to Section 906 of the Sarbanes-Oxley Act of 2002 | | | | | | | | | | X |
84