 Investor Conference Call February 10, 2011 Exhibit 99.1 |
 2 Forward-Looking Statements This presentation contains forward-looking statements, which can be identified by the use of such words as estimate, project, believe, intend, anticipate, plan, seek, expect and similar expressions. These forward-looking statements include: Statements of our goals, intentions and expectations; Statements regarding our business plans and prospects and growth and operating strategies; Statements concerning trends in our provision for loan losses and charge-offs; Statements regarding the asset quality of our loan portfolio; and Estimates of our risks and future costs and benefits. These forward-looking statements are subject to significant risks, assumptions and uncertainties, including, among other things, the following important factors that could affect the actual outcome of future events: Significantly increased competition among depository and other financial institutions; Inflation and changes in the interest rate environment that reduce our interest margins or reduce the fair value of financial instruments; General economic conditions, either nationally or in our market areas, including employment prospects and conditions that are worse than expected; Decreased demand for our products and services and lower revenue and earnings because of a recession; Adverse changes and volatility in credit markets; Legislative or regulatory changes that adversely affect our business; Changes in consumer spending, borrowing and savings habits; Changes in accounting policies and practices, as may be adopted by the bank regulatory agencies, the Financial Accounting Standards Board and the Public Company Accounting Oversight Board; Changes in laws or governmental regulations affecting financial institutions, including changes in regulatory costs and capital requirements; The timing and the amount of revenue that we may recognize; Changes in expense trends (including, but not limited to trends affecting non-performing assets, charge offs and provisions for loan losses); Changes in consumer spending, borrowing and spending habits; The impact of the current governmental effort to restructure the U.S. Financial and regulatory system; Inability of third-party providers to perform their obligations to us; Adverse changes and volatility in real estate markets; The strength or weakness of the real estate markets and of the consumer and commercial credit sectors and its impact on the credit quality of our loans and other assets. Because of these and other uncertainties, our actual future results may be materially different from the results indicated by these forward- looking statements. |
 3 Organized in 1997 as the mid-tier stock holding company for Third Federal Savings & Loan Association of Cleveland (“Thrift”), which was founded in 1938 by Ben and Gerome Stefanski Completed first step IPO conversion in April 2007 TFSL (NASDAQ) Financials at 12/31/2010: Total Assets: $11.1B Total Deposits: $ 8.8B Shareholders’ Equity: $ 1.7B Market Capitalization: $ 2.8B As of December 31, 2010, there were 308.4 million shares outstanding, of which 73.7% were held by the Mutual Holding Company Overview of TFS Financial Corporation |
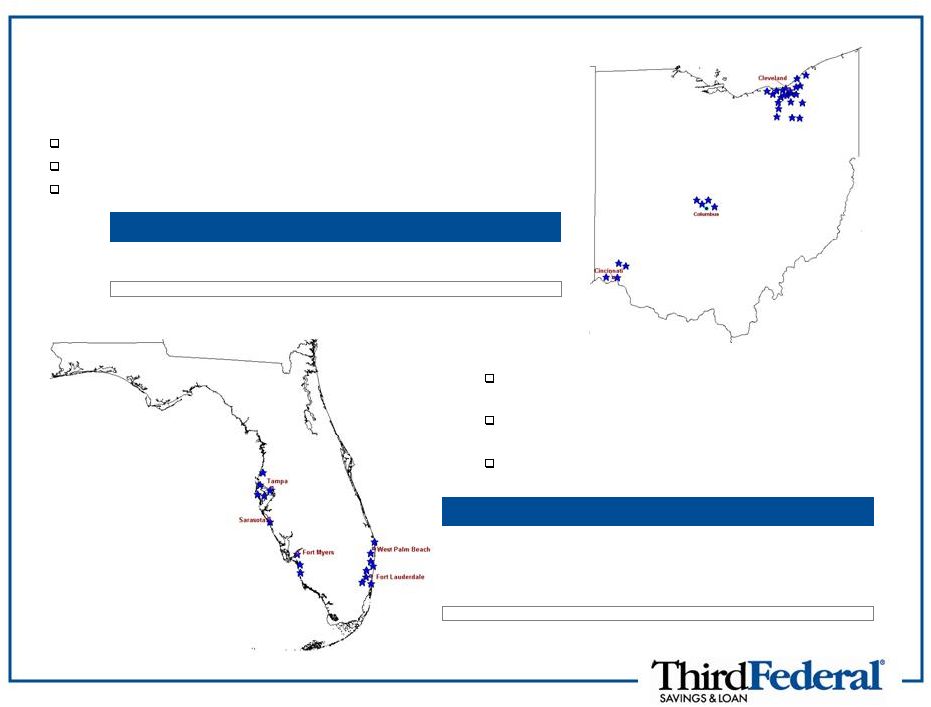 4 Ohio 22 full service branches in Northeast Ohio 4 loan production offices in the Columbus area (Central Ohio) 4 loan production offices in the Cincinnati area (Southwestern Ohio) Markets of Operation Florida Organic, de novo expansion into Florida started in 2000 9 full service branches along the West Coast from New Port Richey to Naples 8 full-service branches along the East Coast from Palm Gardens to Hallandale Source: SNL Financial for market data as of June 30, 2010 Deposits from Company data as of December 31, 2010 Deposits Market Market MSA Branches ($M) Share (%) Rank Tampa-St.Petersburg-Clearwater, FL 5 1,115 2.21 7 Miami-Fort Lauderdale, FL 8 1,089 0.68 26 Cape Coral-Fort Myers, FL 2 256 2.15 13 North Port-Bradenton-Sarasota, FL 1 246 1.47 15 Naples-Marco Island, FL 1 117 1.12 17 Florida Totals 17 2,823 0.69 23 Deposits Market Market MSA Branches ($M) Share (%) Rank Cleveland-Elyria-Mentor, OH 19 5,483 11.51 2 Akron, OH 3 489 4.33 8 Ohio Totals 22 5,972 2.79 9 |
 5 Strategic Overview Our business model is to originate and service first mortgage loans and continue to service existing home equity loans and lines which we fund with core retail deposits Thrift introduced, and is originating, a new adjustable rate mortgage product to act as an interest-rate hedge for the balance sheet First mortgage loans and retail deposits have been generated primarily from the market areas defined by where we have full service branches and loan production offices Only non-commissioned Third Federal associates were used to gather applications, underwrite and process the requests to generate mortgage loans and home equity loans and lines First mortgage originations continue to be made using stringent, conservative lending standards Being a low cost provider is a critical strategic advantage Historically, prudent capital management has supplemented shareholder returns. Repurchased 24.1 million of TFSL stock (approximately 23% of the public float) since the IPO in April 2007 Dividends of $49 million paid to public common shareholders since IPO |
 6 Financial Highlights (Dollars in Thousands) At, or for the year ended, 9/30/10 9/30/09 9/30/08 12/31/10 9/30/10 12/31/09 Balance Sheet Assets ($) 11,076,027 10,598,840 10,786,451 11,064,672 11,076,027 10,727,574 Net Loans ($) 9,181,749 9,219,585 9,208,736 9,704,444 9,181,749 9,250,309 Deposits ($) 8,851,941 8,570,506 8,261,101 8,793,314 8,851,941 8,607,417 Common Equity ($) 1,752,897 1,745,865 1,843,652 1,747,576 1,752,897 1,751,197 Balance Sheet Ratios Loans/ Deposits (%) 103.7 107.6 111.5 110.4 103.7 107.5 TCE / TA (%) 15.8 16.4 17.0 15.7 15.8 16.2 Thrift Only Ratios: Core Capital Ratio (%) 12.1 12.5 12.1 13.5 12.1 12.4 Tier 1 Risk Based Ratio (%) 18.0 17.3 17.3 20.1 18.0 17.4 Total Risk Based Capital Ratio (%) 19.2 18.2 17.6 21.3 19.2 18.3 Profitability Net Interest income ($) 227,506 230,075 219,862 59,686 55,143 57,305 Provision for loan losses ($) (106,000) (115,000) (34,500) (34,500) (35,000) (16,000) Net Interest income after prov for loan losses ($) 121,506 115,075 185,362 25,186 20,143 41,305 Non-interest income ($) 58,638 67,384 47,780 6,819 6,828 11,633 Non-interest expense ($) (161,933) (162,388) (151,447) (42,944) (41,820) (40,099) Income (loss) before income taxes ($) 18,211 20,071 81,695 (10,939) (14,849) 12,839 Income tax benefit (expense) ($) (6,873) (5,676) (27,205) 3,591 4,102 (3,913) Net income (loss) ($) 11,338 14,395 54,490 (7,348) (10,747) 8,926 Net interest margin (%) 2.16 2.20 2.18 2.21 2.10 2.20 Efficiency Ratio (%) 56.6 54.6 56.6 64.6 67.5 58.2 Asset Quality NPAs/ Assets (%) 2.7 2.6 1.7 2.6 2.7 2.6 NCOs/ Avg Loans (%) 0.7 0.7 0.2 0.8 0.9 0.9 Reserves/ Loans (%) 1.4 1.0 0.5 1.5 1.4 1.0 Texas Ratio (NPAs & TDRs / TCE & LLR) (%) 21.0 17.4 10.0 21.0 21.0 18.9 |
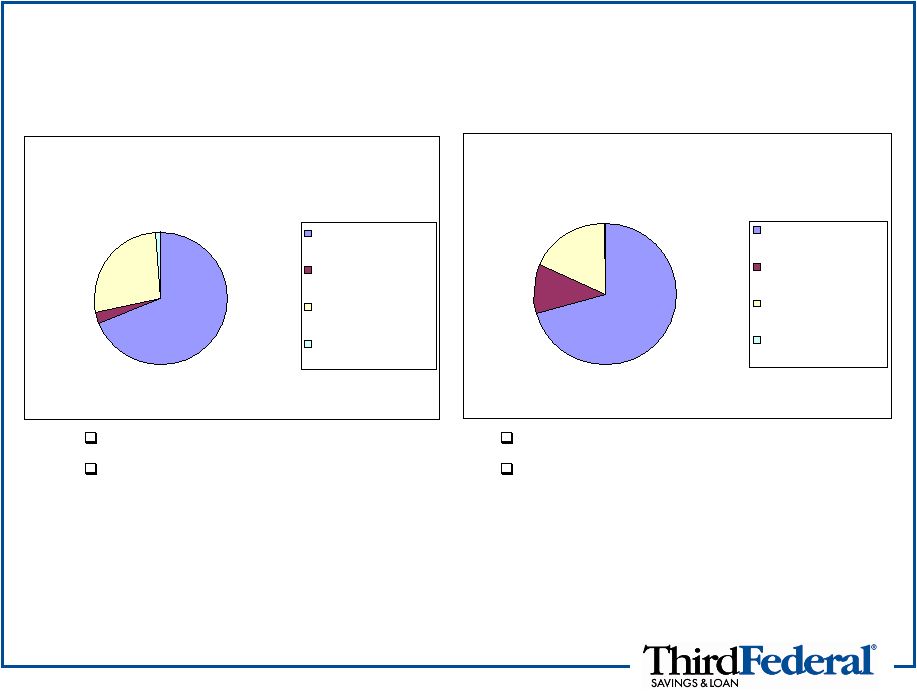 7 Loan and Deposit Balances *About Home Today: An affordable housing program targeted toward low and moderate income home buyers that is designed to teach the essential skills needed for successful homeownership. Most loans supported by PMI. Cumulative loan originations under this program have been less than $20 million over the last three years. 80% of 1-4 family in Ohio Also service $6.2 billion in loans for others No brokered deposits Average branch has $225 million in deposits Gross Loan Balances 12/31/10 68% 3% 28% 1% Residential non-Home Today Residential Home Today Equity loans and lines of credit Other Deposit Data 12/31/10 71% 11% 18% 0% Certificates of Deposit Negotiable Order of Withdrawal Savings Accrued Interest |
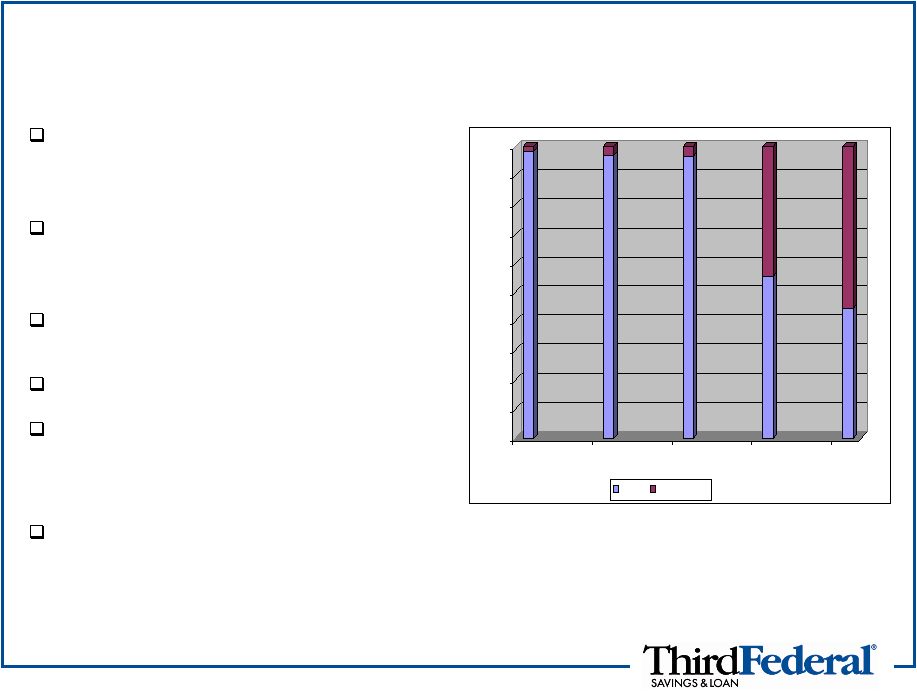
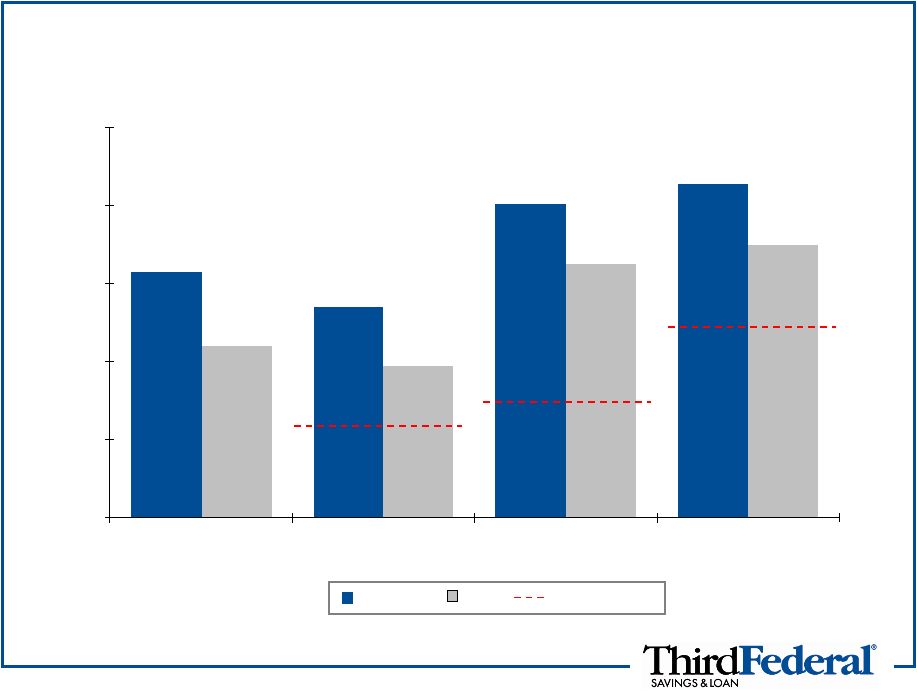 8 Capital Position as of December 31, 2010* 15.72% 13.45% 20.07% 21.32% 10.92% 9.68% 16.20% 17.46% 0.00% 5.00% 10.00% 15.00% 20.00% 25.00% Tangible Common Equity Ratio (TFSL) Core Capital Ratio (Thrift) Tier 1 Risk-based Ratio (Thrift) Total Risk-Based Capital Ratio (Thrift) Well Capitalized Source: SNL Financial Peers include: ISBC, CFFN, BNCL, KRNY, NFBK, WSBF, EBSB and RCKB 6.00% 10.00% 5.00% Peers TFSL/Thrift * Peer data is as of 6/30/10 |
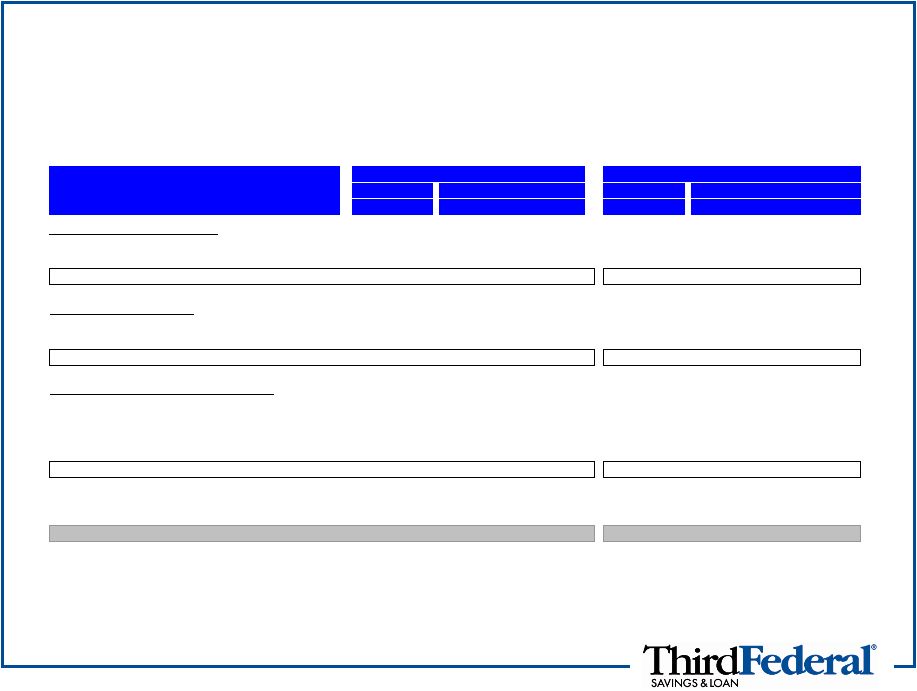 9 Loan Delinquencies and Charge-offs Dollars in millions Loan Charge Offs Balances Quarter-end Quarter-end 12/31/10 12/31/10 9/30/10 9/30/09 12/31/10 9/30/10 9/30/09 Residential non-Home Today Ohio and Kentucky $5,554 1.7% 1.8% 1.8% $2 $5 $5 Florida 1,241 5.1% 5.1% 3.8% 2 7 2 Total $6,795 2.3% 2.5% 2.2% $4 $12 $7 Residential Home Today Ohio and Kentucky $265 34.4% 34.7% 38.3% $2 $5 $4 Florida 11 35.4% 32.1% 30.2% -0- -0- -0- Total $276 34.4% 34.6% 37.9% $2 $5 $4 Home Equity Loans and Lines of Credit Ohio $1,084 2.1% 2.0% 2.5% $2 $7 $6 Florida 778 4.0% 4.1% 4.0% 8 33 35 California 317 2.0% 1.5% 1.8% 1 4 5 Other 558 2.5% 2.4% 2.7% 2 5 5 Total $2,737 2.7% 2.6% 2.9% $13 $49 $51 Other $97 5.4% 3.9% 12.9% - $2 $2 Overall Total $9,906 3.4% 3.5% 3.6% $19 $68 $64 Fiscal Year End Delinquencies Fiscal Year End |
 10 Memorandum of Understanding August 13, 2010, Memorandum of Understanding from the OTS: August, 2010: OTS requests independent assessment of home equity lending portfolio, a plan to reduce concentration limits for home equity loans and lines and enhanced policies and procedures September, 2010: Formal reduction plan submitted to OTS December, 2010: OTS responds with non-objection Ongoing monitoring of plan progress by OTS |
 11 Current Status of Plan: Reduce commitments $1 billion, including $300 million in outstanding balances, from June 30, 2010 balances, by December 31, 2011: Commitments have been reduced $738 million from June 30, 2010 Home equity balances have been reduced $159 million from June 30, 2010 $150 million capital infusion from holding company to Thrift Completed October, 2010 Implement expanded line management, account management and collection processes In various stages of completion Home Equity Lending Reduction Plan |
 12 New Memorandum of Understanding February 7, 2011, Memorandum of Understanding from the OTS, received on behalf of Thrift, mid-tier holding company, and Mutual Holding Company requires: Independent assessment of interest rate and enterprise risk management Third party had already been engaged in September, 2010 to perform study Independent review of management compensation Formal management and director succession plans Non-objection from OTS required for holding company debt, dividends and stock repurchases Revisions to various operational policies Various deadlines through June 30, 2011 August 13, 2010 MOU terminated, but many requirements continue under New MOU |
 13 Cash Dividends and Stock Repurchases TFS Financial must provide the OTS 45 days written notice and obtain the non-objection of the OTS prior to the Company’s intent to declare and pay dividends to its stockholders or repurchase any of its outstanding stock. The Company understands and shares the view of the importance to shareholders of dividends and stock repurchases, however, the Company does not intend to declare or pay a dividend, or to repurchase any of its outstanding common stock until the OTS’ concerns are resolved. |
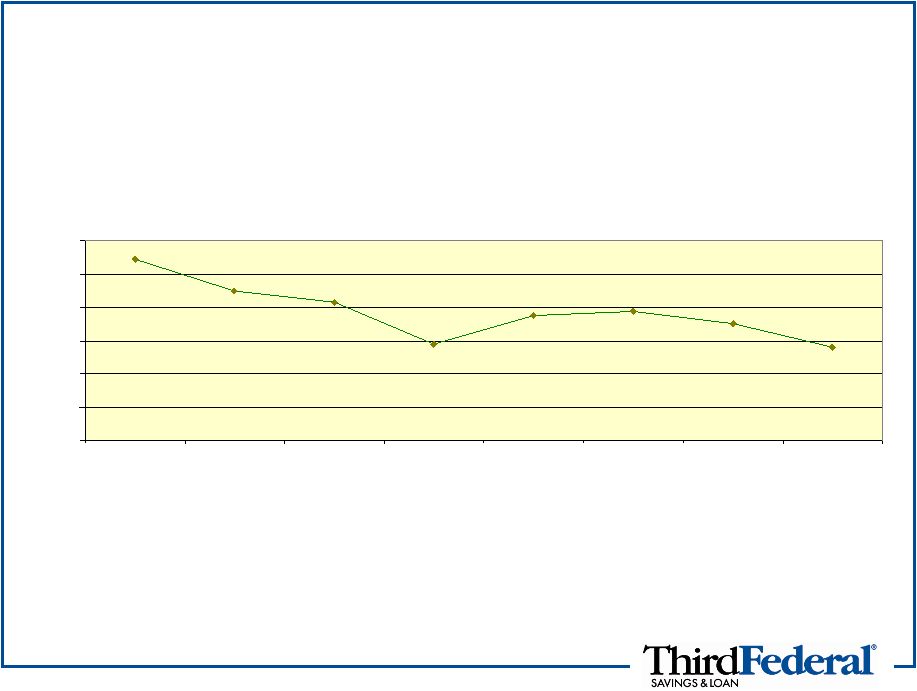
 14 Adjustable Rate Growth As of 12/31/2010 booked more than $900 million in new adjustable mortgages New production has shifted closer to a 50% fixed rate/50% adjustable rate split Average credit score of the ARM production is 775 Average LTV is 65% Total ARMs of $1.4 billion represent approximately 20% of all first mortgages New ARM volume of $900 million has far surpassed home equity reduction of $159 million 0.0% 10.0% 20.0% 30.0% 40.0% 50.0% 60.0% 70.0% 80.0% 90.0% 100.0% Dec-09 Mar-10 Jun-10 Sep-10 Dec-10 Fixed Adjustable |
 15 Summary Working diligently to resolve the New MOU with the OTS Focus on our core competency of originating high credit quality 1-4 family residential mortgages in our banking footprint including continued use of our new adjustable rate mortgage loans TFSL has a strong capital position and flexibility at the holding company Significant progress in achieving our desired reduction in home equity loans and commitments Focused on returning to shareholder-enhancing activities Dividends Share Buybacks |
 Appendix: Home Equity Lines of Credit |
 17 Home Equity Lines of Credit History of Equity Portfolio Exposure Calculations include only capital at Thrift level and excludes additional capital maintained at TFSL Home Equity Portfolio and Open Commitments Relative to Thrift Tier 1 (Core) Plus ALLL 279% 350% 387% 375% 288% 414% 449% 544% 0% 100% 200% 300% 400% 500% 600% September 30, 2004 September 30, 2005 September 30, 2006 September 30, 2007 September 30, 2008 September 30, 2009 September 30, 2010 December 31, 2010 |
 18 * Seriously delinquent: Lines 90 days or more past due, or are reported either in bankruptcy or foreclosure regardless of payment status. Where credit is not available, balances are included in the <600 category Credit Extended is the credit limit on any lines open to draw and the principal balance on loans and lines suspended or in repayment. 0.02% 84% 58% 0% 57% 67% 750 and higher % of total 0.16% 94% 79% 4% 80% 84% 700 and higher % of total 3.12% $1,646 $2,737 $86 $2,652 $4,383 Total 0.02% $647 $323 $0 $323 $970 800-850 0.01% $743 $1,200 $0 $1,200 $1,943 750-799 0.52% $157 $593 $3 $590 $750 700-749 6.88% $68 $411 $28 $383 $479 600-699 25.58% $31 $210 $54 $156 $241 < 600 % Seriously Delinquent Unused Balances Total Balances Seriously Delinquent* Other than Seriously Delinquent Credit Extended Credit Score Home Equity Loans & Lines of Credit Credit Extended, Balances and Delinquencies by Credit Score As of Dec 2010, dollars in millions |
 19 Investor Conference Call February 10, 2011 Investor Questions |