Financial Institutions Group Bison Select Conference ALLAN A. MUTO, EVP/CHIEF FINANCIAL OFFICER PETER A. GRAY, EVP/CHIEF BANKING OFFICER DECEMBER 3, 2019 ESSA Bank & Trust ESSA Investment Services ESSA Asset Management & Trust ESSA Advisory Services Exhibit 99.1
Forward Looking Statements and Safe Harbor Certain statements contained herein are “forward-looking statements” within the meaning of Section 27A of the Securities Act of 1933 and Section 21E of the Securities Exchange Act of 1934. Such forward-looking statements may be identified by reference to a future period or periods, or by the use of forward-looking terminology, such as “may,” “will,” “believe,” “expect,” “estimate,” “anticipate,” “continue,” or similar terms or variations on those terms, or the negative of those terms. Forward-looking statements are subject to numerous risks and uncertainties, including, but not limited to, those related to the economic environment, particularly in the market areas in which the Company operates, competitive products and pricing, fiscal and monetary policies of the U.S. Government, changes in government regulations affecting financial institutions, including compliance costs and capital requirements, changes in prevailing interest rates, acquisitions and the integration of acquired businesses, credit risk management, asset-liability management, the financial and securities markets and the availability of and costs associated with sources of liquidity, and the Risk Factors disclosed in our annual and quarterly reports. The Company wishes to caution readers not to place undue reliance on any such forward-looking statements, which speak only as of the date made. The Company wishes to advise readers that the factors listed above could affect the Company's financial performance and could cause the Company's actual results for future periods to differ materially from any opinions or statements expressed with respect to future periods in any current statements. The Company does not undertake and specifically declines any obligation to publicly release the result of any revisions that may be made to any forward-looking statements to reflect events or circumstances after the date of such statements or to reflect the occurrence of anticipated or unanticipated events.
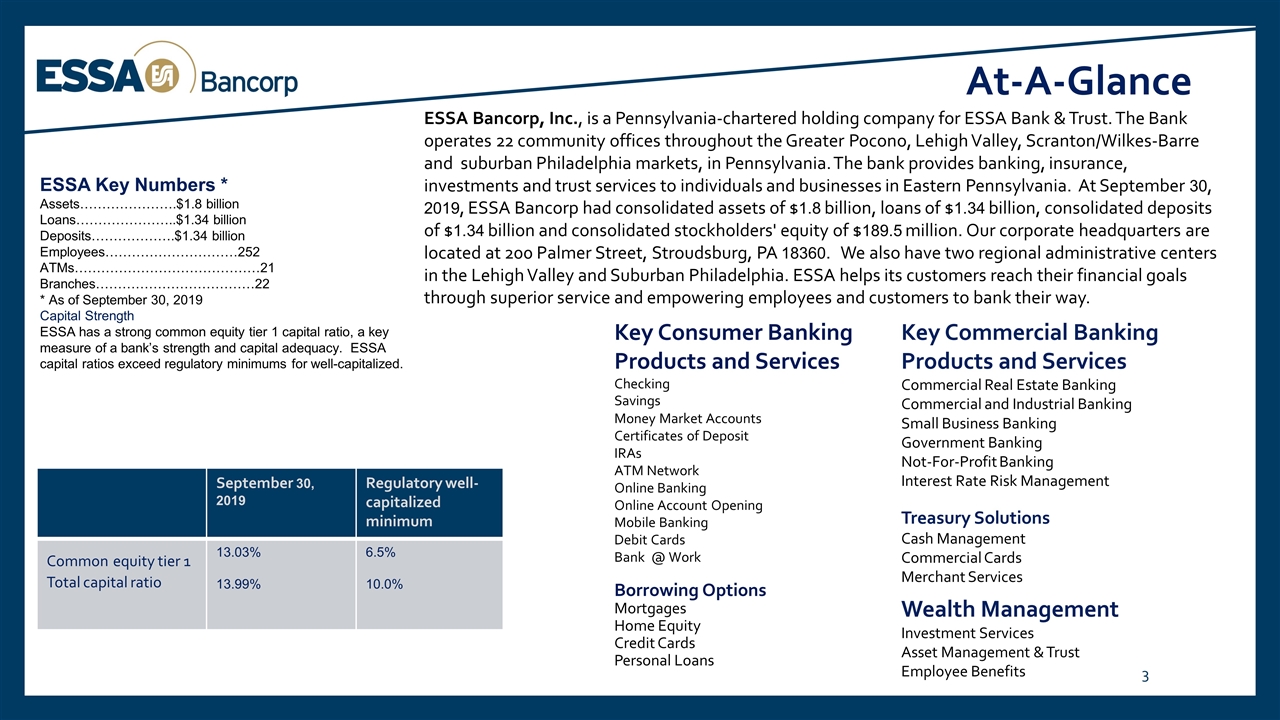
At-A-Glance ESSA Bancorp, Inc., is a Pennsylvania-chartered holding company for ESSA Bank & Trust. The Bank operates 22 community offices throughout the Greater Pocono, Lehigh Valley, Scranton/Wilkes-Barre and suburban Philadelphia markets, in Pennsylvania. The bank provides banking, insurance, investments and trust services to individuals and businesses in Eastern Pennsylvania. At September 30, 2019, ESSA Bancorp had consolidated assets of $1.8 billion, loans of $1.34 billion, consolidated deposits of $1.34 billion and consolidated stockholders' equity of $189.5 million. Our corporate headquarters are located at 200 Palmer Street, Stroudsburg, PA 18360. We also have two regional administrative centers in the Lehigh Valley and Suburban Philadelphia. ESSA helps its customers reach their financial goals through superior service and empowering employees and customers to bank their way. ESSA Key Numbers * Assets………………….$1.8 billion Loans…………………..$1.34 billion Deposits……………….$1.34 billion Employees…………………………252 ATMs……………………………………21 Branches………………………………22 * As of September 30, 2019 Capital Strength ESSA has a strong common equity tier 1 capital ratio, a key measure of a bank’s strength and capital adequacy. ESSA capital ratios exceed regulatory minimums for well-capitalized. Key Commercial Banking Products and Services Commercial Real Estate Banking Commercial and Industrial Banking Small Business Banking Government Banking Not-For-Profit Banking Interest Rate Risk Management Treasury Solutions Cash Management Commercial Cards Merchant Services Wealth Management Investment Services Asset Management & Trust Employee Benefits September 30, 2019 Regulatory well-capitalized minimum Common equity tier 1 Total capital ratio 13.03% 13.99% 6.5% 10.0% Key Consumer Banking Products and Services Checking Savings Money Market Accounts Certificates of Deposit IRAs ATM Network Online Banking Online Account Opening Mobile Banking Debit Cards Bank @ Work Borrowing Options Mortgages Home Equity Credit Cards Personal Loans
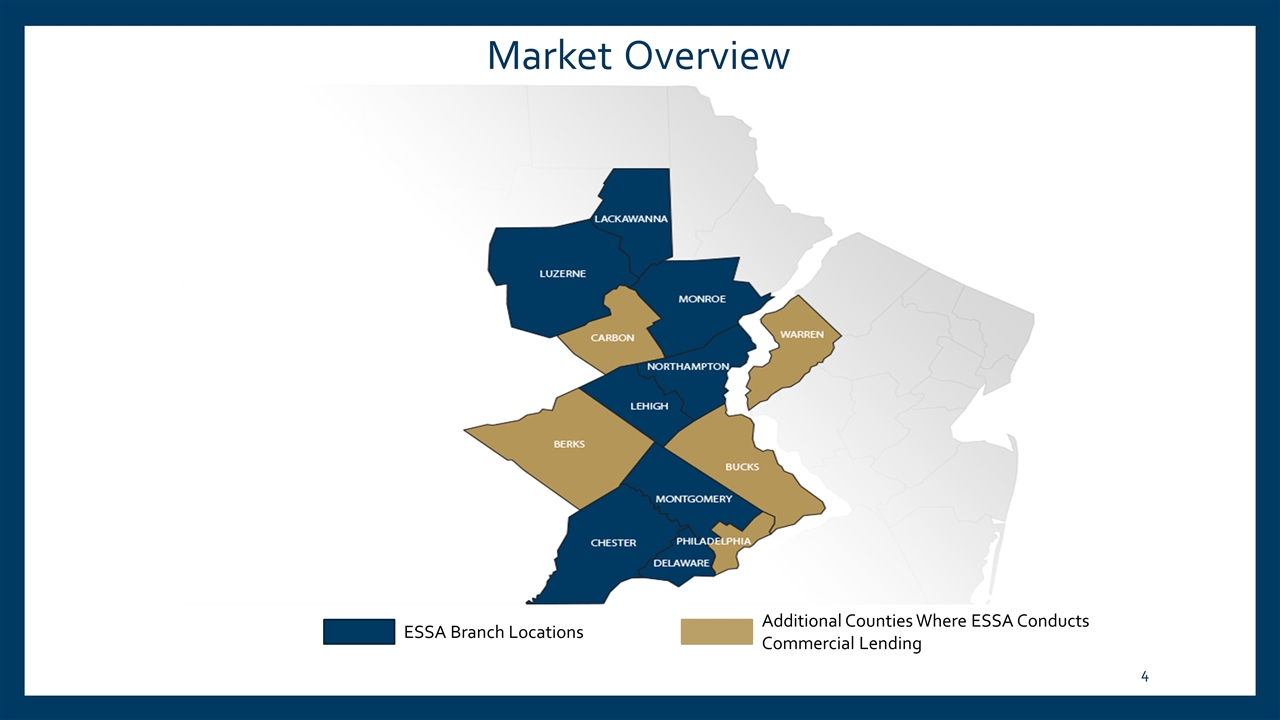
Market Overview ESSA Branch Locations Additional Counties Where ESSA Conducts Commercial Lending
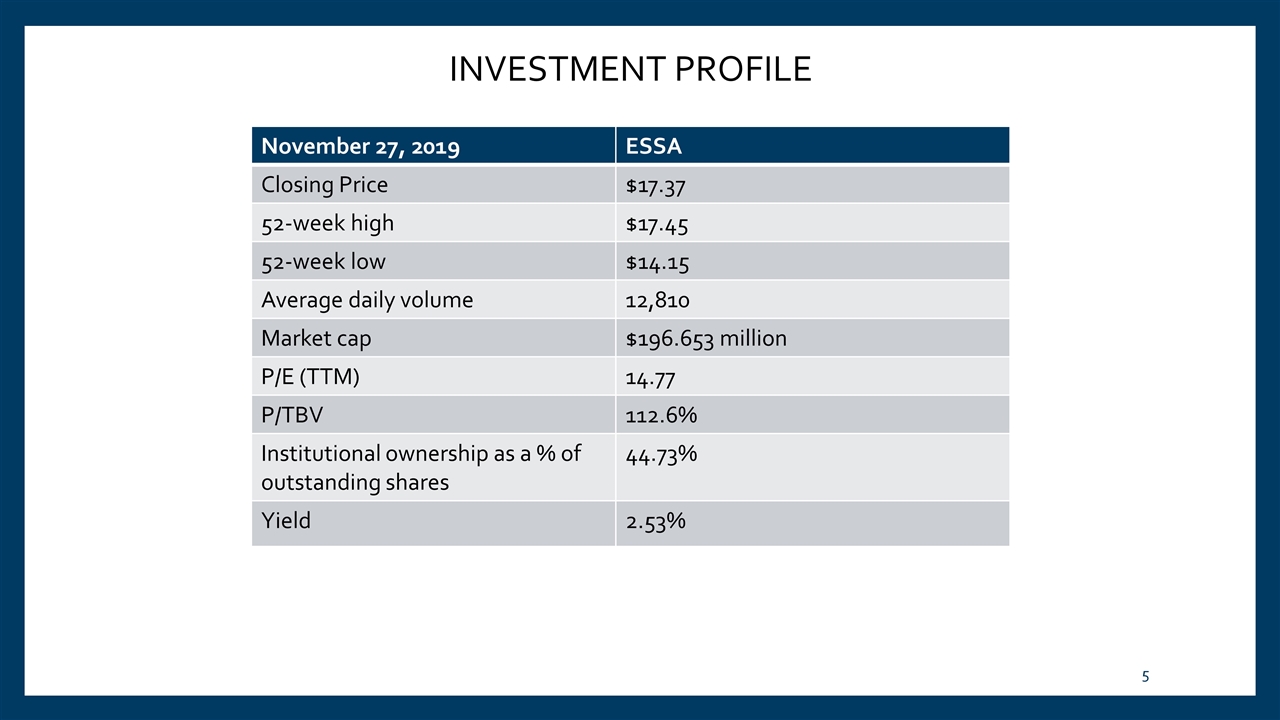
INVESTMENT PROFILE November 27, 2019 ESSA Closing Price $17.37 52-week high $17.45 52-week low $14.15 Average daily volume 12,810 Market cap $196.653 million P/E (TTM) 14.77 P/TBV 112.6% Institutional ownership as a % of outstanding shares 44.73% Yield 2.53%

ESSA BACKGROUND & SITUATION Management has transformed the company from a $771 million thrift in 2007 to a $1.8 billion community bank with a focus on commercial banking. Attracted and invested in new personnel to achieve balance sheet transition. Key strategic initiatives have been implemented to enhance franchise value. Regional delivery model has accelerated commercial loan growth. Taking advantage of market disruption from recent M&A activity to add customers and employees. Growing and improving contribution from non-interest income lines of business. Challenging interest rate environment will continue to be a headwind to enhancing earnings. Interest rate cuts will improve net interest income.
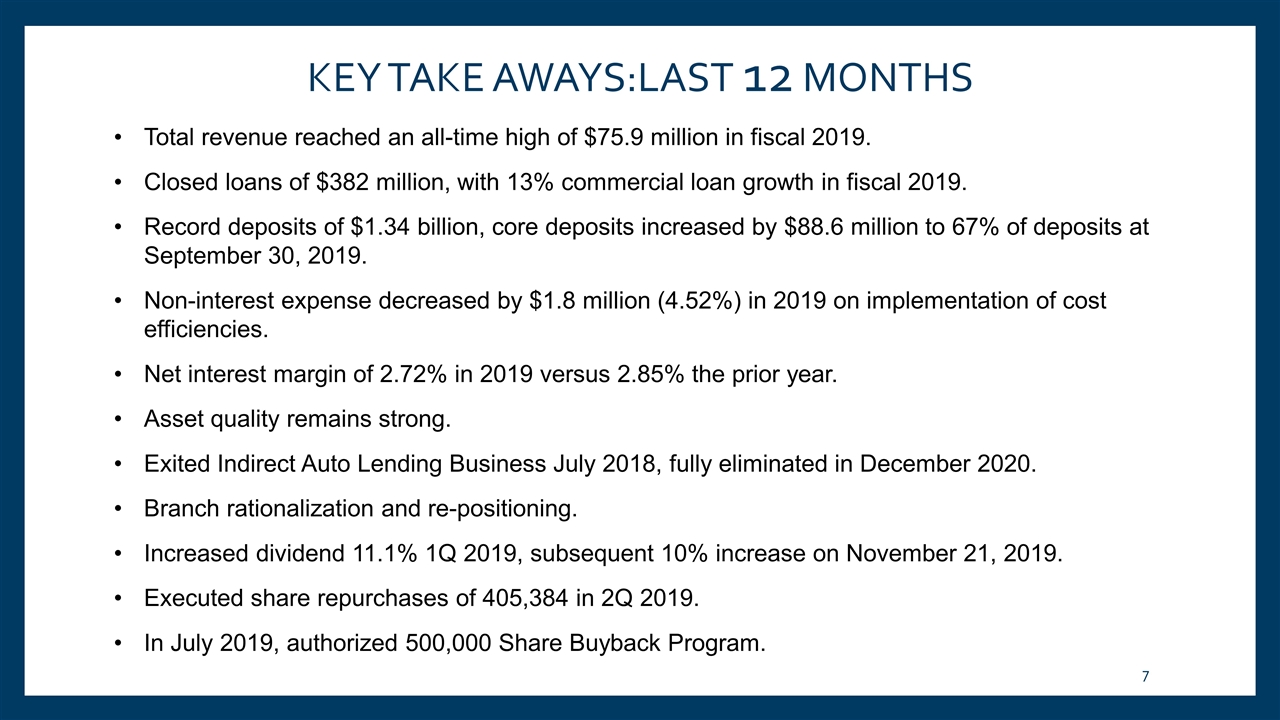
KEY TAKE AWAYS:LAST 12 MONTHS Total revenue reached an all-time high of $75.9 million in fiscal 2019. Closed loans of $382 million, with 13% commercial loan growth in fiscal 2019. Record deposits of $1.34 billion, core deposits increased by $88.6 million to 67% of deposits at September 30, 2019. Non-interest expense decreased by $1.8 million (4.52%) in 2019 on implementation of cost efficiencies. Net interest margin of 2.72% in 2019 versus 2.85% the prior year. Asset quality remains strong. Exited Indirect Auto Lending Business July 2018, fully eliminated in December 2020. Branch rationalization and re-positioning. Increased dividend 11.1% 1Q 2019, subsequent 10% increase on November 21, 2019. Executed share repurchases of 405,384 in 2Q 2019. In July 2019, authorized 500,000 Share Buyback Program.
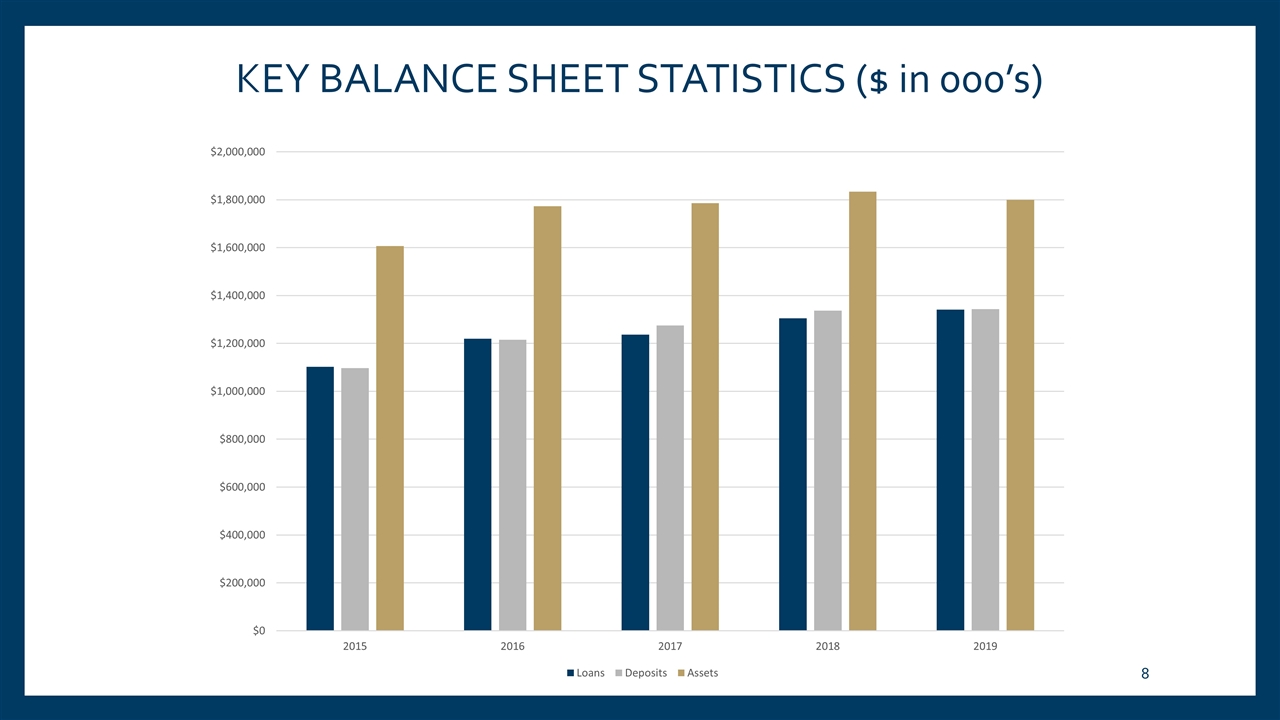
KEY BALANCE SHEET STATISTICS ($ in 000’s)
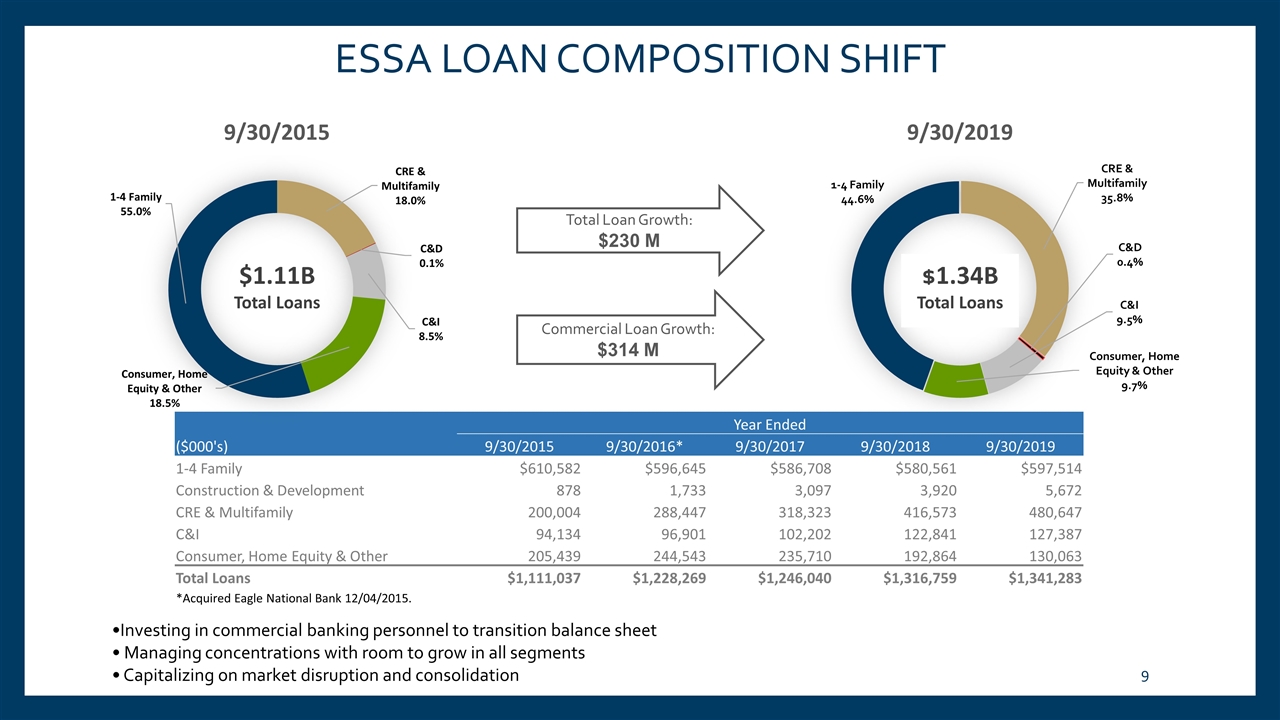
Total Loan Growth: $230 M Commercial Loan Growth: $314 M ESSA LOAN COMPOSITION SHIFT •Investing in commercial banking personnel to transition balance sheet • Managing concentrations with room to grow in all segments • Capitalizing on market disruption and consolidation $1.11B Total Loans $1.34B Total Loans Year Ended ($000's) 9/30/2015 9/30/2016* 9/30/2017 9/30/2018 9/30/2019 1-4 Family $610,582 $596,645 $586,708 $580,561 $597,514 Construction & Development 878 1,733 3,097 3,920 5,672 CRE & Multifamily 200,004 288,447 318,323 416,573 480,647 C&I 94,134 96,901 102,202 122,841 127,387 Consumer, Home Equity & Other 205,439 244,543 235,710 192,864 130,063 Total Loans $1,111,037 $1,228,269 $1,246,040 $1,316,759 $1,341,283 *Acquired Eagle National Bank 12/04/2015.
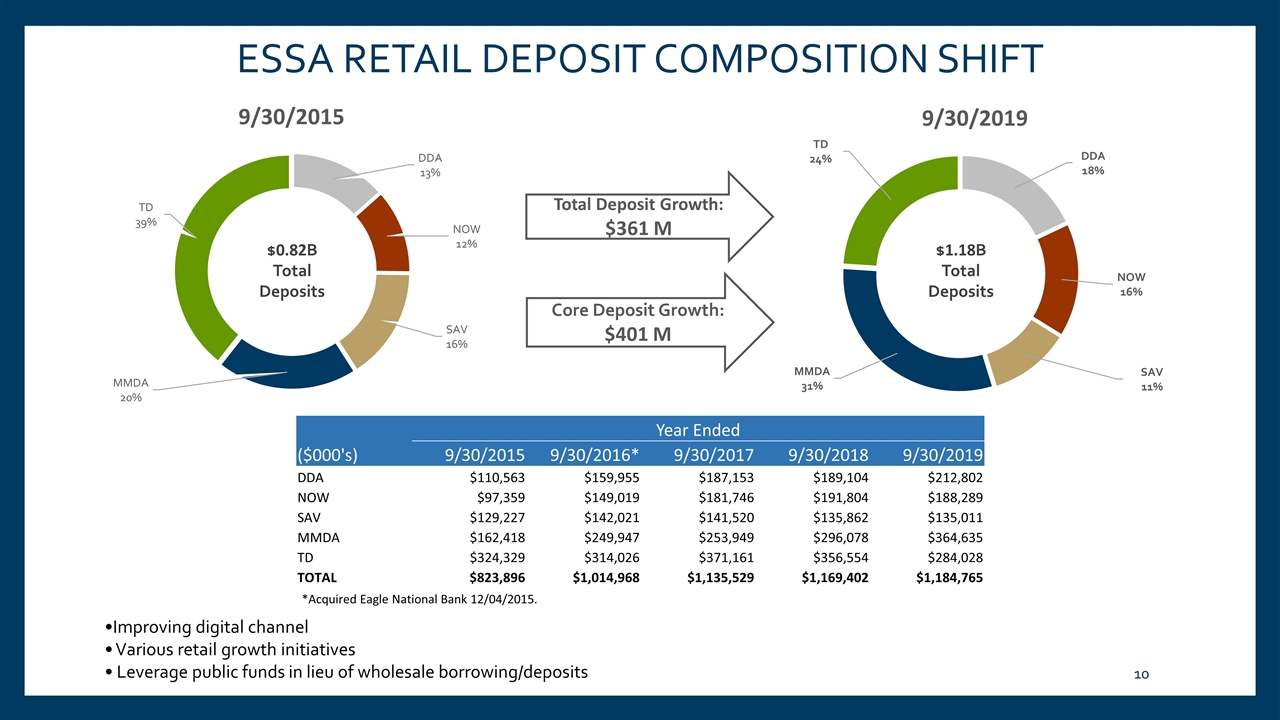
Total Deposit Growth: $361 M Core Deposit Growth: $401 M $1.18B Total Deposits ESSA RETAIL DEPOSIT COMPOSITION SHIFT •Improving digital channel • Various retail growth initiatives • Leverage public funds in lieu of wholesale borrowing/deposits *Acquired Eagle National Bank 12/04/2015. $0.82B Total Deposits Year Ended ($000's) 9/30/2015 9/30/2016* 9/30/2017 9/30/2018 9/30/2019 DDA $110,563 $159,955 $187,153 $189,104 $212,802 NOW $97,359 $149,019 $181,746 $191,804 $188,289 SAV $129,227 $142,021 $141,520 $135,862 $135,011 MMDA $162,418 $249,947 $253,949 $296,078 $364,635 TD $324,329 $314,026 $371,161 $356,554 $284,028 TOTAL $823,896 $1,014,968 $1,135,529 $1,169,402 $1,184,765
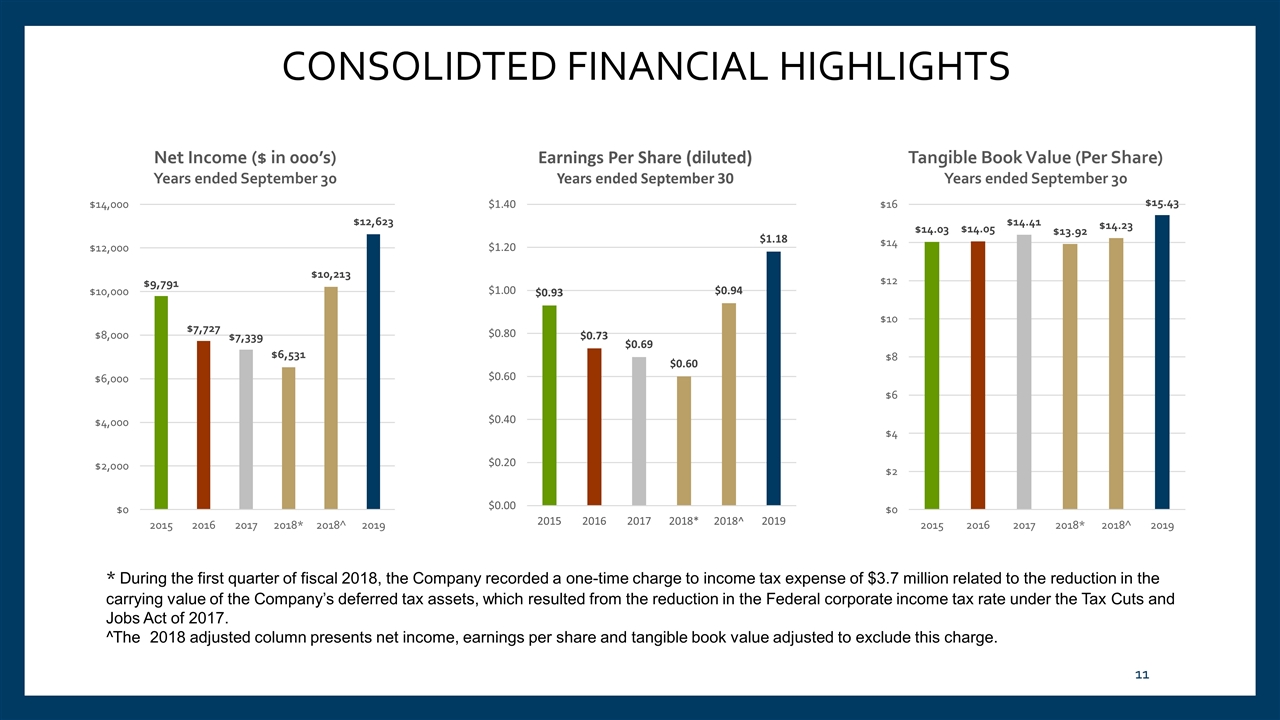
CONSOLIDTED FINANCIAL HIGHLIGHTS * During the first quarter of fiscal 2018, the Company recorded a one-time charge to income tax expense of $3.7 million related to the reduction in the carrying value of the Company’s deferred tax assets, which resulted from the reduction in the Federal corporate income tax rate under the Tax Cuts and Jobs Act of 2017. ^The 2018 adjusted column presents net income, earnings per share and tangible book value adjusted to exclude this charge.
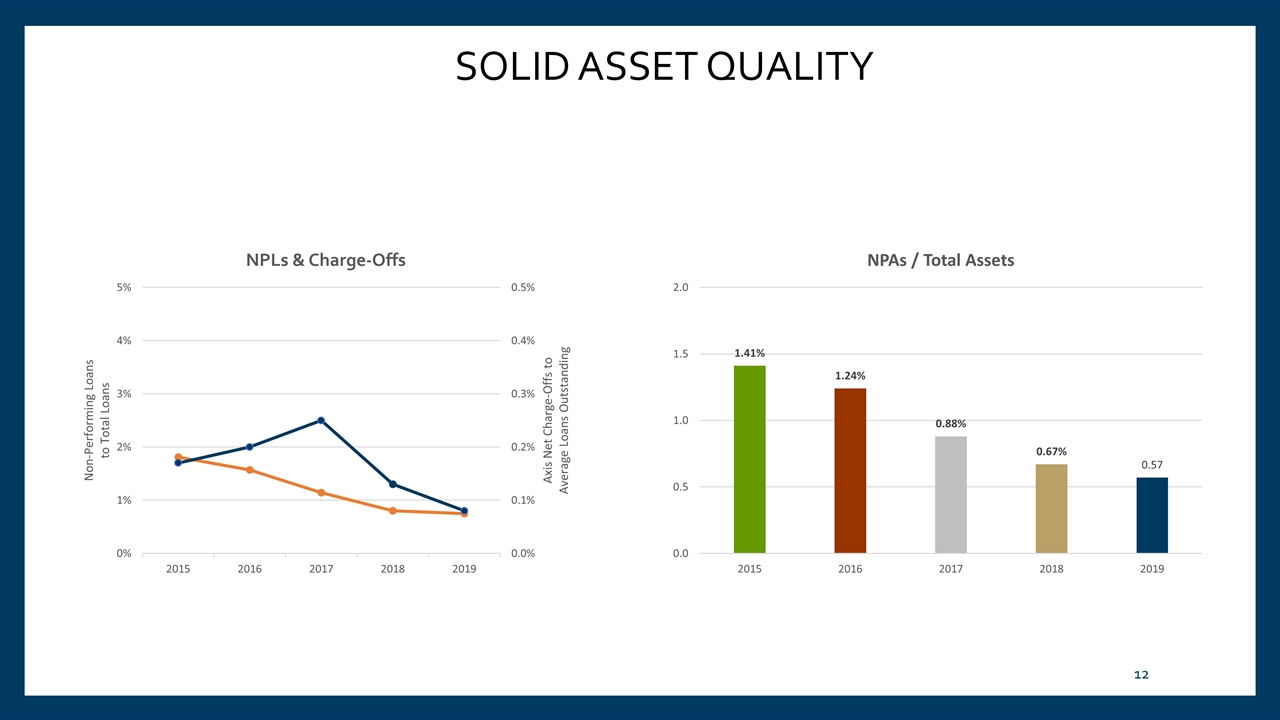
SOLID ASSET QUALITY
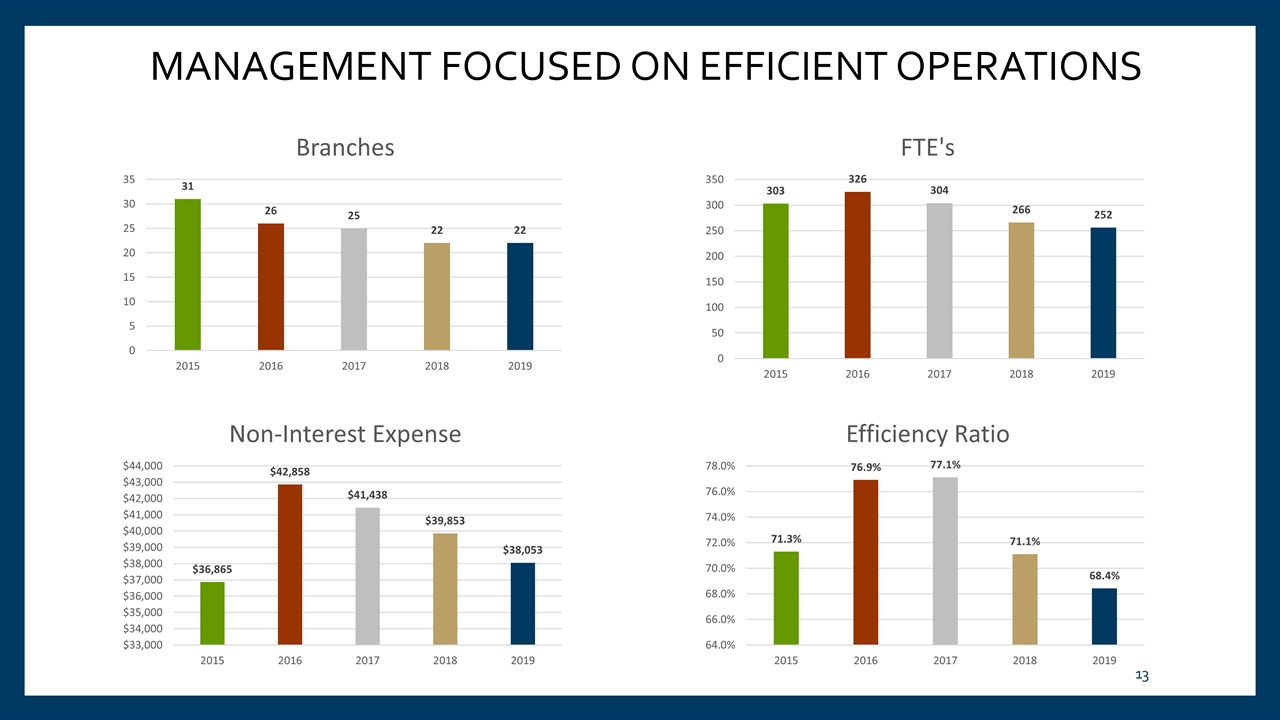
MANAGEMENT FOCUSED ON EFFICIENT OPERATIONS
STRATEGIC OBJECTIVES Continue to transform the balance sheet by changing loan and deposit mix to improve net interest margin. Build digital strategy with Fiserv to improve customer adoption and supplement retail banking model. Implement CRM system to facilitate and enhance sales culture and accountability. Accelerate growth in non-interest income lines of business to strengthen and diversify earnings. Continue disciplined expense management. Expand franchise through selective accretive acquisitions or banking team “lift outs.” Maintain strong enterprise wide risk management appetite.
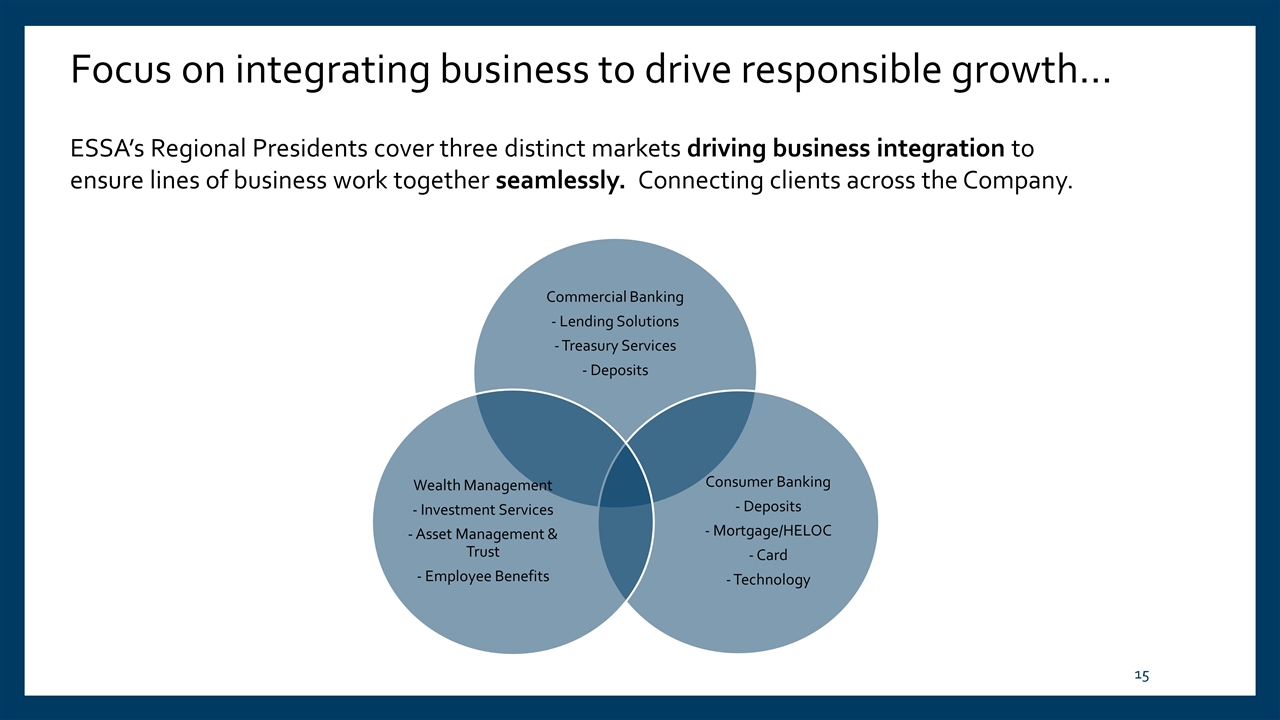
Focus on integrating business to drive responsible growth… ESSA’s Regional Presidents cover three distinct markets driving business integration to ensure lines of business work together seamlessly. Connecting clients across the Company. Commercial Banking - Lending Solutions - Treasury Services - Deposits Consumer Banking - Deposits - Mortgage/HELOC - Card - Technology Wealth Management - Investment Services - Asset Management & Trust - Employee Benefits
ESSA Bank & Trust ESSA Investment Services ESSA Asset Management & Trust ESSA Advisory Services


