Invesco DB US Dollar Index Bullish Fund (UUP)
Filed: 25 Mar 16, 12:00am
Filed Pursuant to Rule 424(b)(3)
Registration Nos. 333-207089
333-207089-01
POWERSHARES DB US DOLLAR INDEX TRUST
POWERSHARES DB US DOLLAR INDEX BULLISH FUND
SUPPLEMENT DATED MARCH 24, 2016 TO
PROSPECTUS DATED SEPTEMBER 23, 2015
This Supplement updates certain information contained in the Prospectus dated September 23, 2015, as supplemented from time-to-time (the “Prospectus”), of PowerShares DB US Dollar Index Trust (the “Trust”) and PowerShares DB US Dollar Index Bullish Fund (the “Fund”). All capitalized terms used in this Supplement have the same meaning as in the Prospectus.
Prospective investors in the Funds should review carefully the contents of both this Supplement and the Prospectus.
* * * * * * * * * * * * * * * * * * *
All information in the Prospectus is restated pursuant to this Supplement, except as updated hereby.
Neither the Securities and Exchange Commission nor any state securities commission
has approved or disapproved of these securities or determined if this Supplement or the related Prospectus is truthful or complete. Any representation to the contrary is a criminal offense.
THE COMMODITY FUTURES TRADING COMMISSION HAS NOT PASSED UPON THE MERITS OF PARTICIPATING IN THIS POOL NOR HAS THE COMMISSION PASSED UPON THE ADEQUACY OR ACCURACY OF THIS DISCLOSURE DOCUMENT.
Invesco PowerShares Capital Management LLC
Managing Owner
P-DBUUP-PRO-1-SUP-1 032416
| I. | The initial 4 paragraphs under the sub-heading “Principals” on page 67 of the Prospectus are hereby deleted and replaced, in their entirety, by the following: |
“The following principals serve in the below capacities on behalf of the Managing Owner:
Name | Age | Position | ||||
Daniel Draper | 47 | Chief Executive Officer, Board of Managers | ||||
Peter Hubbard | 34 | Vice President and Director of Portfolio Management | ||||
David Warren | 58 | Chief Administrative Officer, Board of Managers | ||||
Roderick Ellis | 48 | Principal | ||||
Steven Hill | 51 | Principal Financial and Accounting Officer, Investment Pools | ||||
Christopher Joe | 46 | Chief Compliance Officer | ||||
John Zerr | 53 | Board of Managers | ||||
Invesco North American Holdings Inc. is also a principal of the Managing Owner.
The Managing Owner is managed by a Board of Managers. The Board of Managers is composed of Messrs. Draper, Warren and Zerr.”
| II. | The biography of Andrew Schlossberg set forth on pages 67-68 is hereby deleted, in its entirety. |
| III. | The biographies of Daniel Draper, Peter Hubbard, David Warren, Roderick Ellis, Steven Hill, Christopher Joe and John Zerr set forth on page 68 through 69 of the Prospectus are hereby deleted and replaced, in their entirety, with the following: |
“Daniel Draper (47) has been Chief Executive Officer of the Managing Owner since March 24, 2016. In this role, he has general oversight responsibilities for all of the Managing Owner’s business. Mr. Draper has been a Member of the Board of Managers of the Managing Owner since September 2013. In this role he is responsible for the management of the Managing Owner’s exchange traded fund business with direct functional reporting responsibilities for the Managing Owner’s portfolio management, products, marketing and capital markets teams. In such capacity, Mr. Draper also is responsible for managing the operations of the Invesco Funds. Previously, Mr. Draper was the Global Head of Exchange Traded Funds for Credit Suisse Asset Management, or Credit Suisse, based in London from March 2010 until June 2013, followed by a three month non-compete period pursuant to his employment terms with Credit Suisse. Credit Suisse is an asset management business of Credit Suisse Group, a financial services company. From January 2007 to March 2010, he was the Global Head of Exchange Traded Funds for Lyxor Asset Management in London, an investment management business unit of Societe Generale Corporate & Investment Banking. Mr. Draper was previously registered as a Significant Influence Functions (SIF) person with the UK’s Financial Conduct Authority. He withdrew this status on June 30, 2013 when he left Credit Suisse. Mr. Draper received his MBA from the Kenan-Flagler Business School at the University of North Carolina at Chapel Hill and his BA from the College of William and Mary in Virginia. Mr. Draper is currently registered with FINRA and holds the Series 7, 24 and 63 registrations. Mr. Draper was listed as a principal of the Managing Owner on December 16, 2013.
Peter Hubbard (34) joined the Managing Owner in May 2005 as a portfolio manager and has been Vice President, Director of Portfolio Management since September 2012. In his role, Mr. Hubbard manages a team of 12 portfolio managers. His responsibilities include facilitating all portfolio management processes associated with more than 150 equity and fixed income Invesco Funds listed in the United States, Canada and Europe. He is a graduate of Wheaton College with a B.A. degree in Business & Economics. Mr. Hubbard was listed as a principal and registered as an associated person of the Managing Owner on November 15, 2012 and January 1, 2013, respectively. Mr. Hubbard was registered as a swap associated person of the Managing Owner effective as of September 8, 2015.
2
David Warren (58) is Chief Administrative Officer, Americas, for Invesco Ltd., a global investment management company affiliated with the Managing Owner. He was appointed to this position in January 2007, and also holds the roles of Director, Executive Vice President and Chief Financial Officer of Invesco Canada Ltd., a Canadian investment management subsidiary of Invesco Ltd., since January 2009. He has been a Member of the Board of Managers and Chief Administrative Officer of the Managing Owner since January 2010, as well. In these capacities, Mr. Warren is responsible for general management support, in addition to executing on various strategic initiatives and overseeing the risk management framework for the business units operating within the Americas division of Invesco Ltd. He obtained a Bachelor’s Degree in Commerce from the University of Toronto and is a member of the Chartered Professional Accountants of Canada. Mr. Warren was listed as a principal of the Managing Owner on November 21, 2012.
Roderick Ellis (48) has been a Chief Accounting Officer for Invesco Ltd. since April 2011. In this role, he is responsible for all aspects of Corporate Accounting including group financial reporting, internal controls and group accounting policies. Mr. Ellis is also responsible for group insurance matters. Previously, Mr. Ellis was Global Director of Financial Planning and Analysis, and Treasurer since May 2007. Mr. Ellis earned a B.A. (with honors) in Economics and Social History from the University of Sheffield, UK, in 1988. He is a member of the Institute of Chartered Accountants in England and Wales. Mr. Ellis was listed as a principal of the Managing Owner on November 30, 2012.
Steven Hill (51) has been Principal Financial and Accounting Officer, Investment Pools for the Managing Owner since December 2012, and was Head of Global ETF Operations from September 2011 to December 2012. As Principal Financial and Accounting Officer, Investment Pools, he has financial and administrative oversight responsibilities for, and serves as Principal Financial Officer of, the Invesco Funds, including the Fund. As Head of Global ETF Operations he had management responsibilities with regard to the general operations of the Managing Owner. From October 2010 to August 2011, he was Senior Managing Director and Chief Financial Officer of Destra Capital Management LLC and its subsidiaries, or Destra, an asset management firm, and was responsible for managing financial and administrative activities as well as financial reporting for Destra and investment funds sponsored by Destra. Previously, he was Senior Managing Director of Claymore Securities, Inc., or Claymore, from December 2003 to October 2010, and was responsible for managing financial and administrative oversight for investment funds sponsored by Claymore. Claymore, now known as Guggenheim Funds Distributors, Inc., is a registered broker-dealer that distributes investment funds. Mr. Hill earned a BS in Accounting from North Central College, Naperville, IL. Mr. Hill was listed as a principal of the Managing Owner on February 12, 2015.
Christopher Joe (46) has been Chief Compliance Officer of the Managing Owner since September 1, 2015. In his role as Chief Compliance Officer he is responsible for all aspects of regulatory compliance for the Managing Owner. He has also acted as U.S. Compliance Director for Invesco, Ltd. since November, 2006. Formerly, he served as Chief Compliance Officer of Invesco Investment Advisers, LLC, a registered investment adviser affiliated with the Managing Owner from June, 2010 to March, 2013. He also served as Deputy Chief Compliance Officer of Invesco Adviser, Inc., a registered investment adviser affiliated with the Managing Owner, from November, 2014 to September, 2015. Mr. Joe has also served as a principal of the Managing Owner since September 25, 2015.
John Zerr (53) has been a Member of the Board of Managers of the Managing Owner since September 2006. Mr. Zerr is also Managing Director and General Counsel — US Retail of Invesco Management Group, Inc., a registered investment adviser affiliated with the Managing Owner, since March 2006, where he is responsible for overseeing the US Retail Legal Department for Invesco Ltd. and its affiliated companies. Mr. Zerr has also been a Senior Vice President and Secretary of IDI since March 2006 and June 2006, respectively. He also served as a Director of that entity until February 2010. Mr. Zerr has served as Senior Vice President of Invesco Advisers, Inc., a registered investment adviser affiliated with the Managing Owner, since December 2009. Mr. Zerr serves as a Director, Vice President and Secretary of Invesco Investment Services, Inc., a registered transfer agency since May 2007. Mr. Zerr has served as Director, Senior Vice President,
3
General Counsel and Secretary of a number of other Invesco Ltd. wholly-owned subsidiaries which service or serviced portions of Invesco Ltd.’s US Retail business since May 2007 and since June 2010 with respect to certain Van Kampen entities engaged in the asset management business that were acquired by Invesco Ltd. from Morgan Stanley. In each of the foregoing positions Mr. Zerr is responsible for overseeing legal operations. In such capacity, Mr. Zerr also is responsible for overseeing the legal activities of the Invesco Funds. Mr. Zerr earned a BA degree in economics from Ursinus College. He graduated cum laude with a J.D. from Temple University School of Law. Mr. Zerr was listed as a principal of the Managing Owner on December 6, 2012.”
| IV. | Risk factor 12 under the section “The Risks You Face” on page 21 of the Prospectus is hereby deleted and replaced, in its entirety, by the following: |
(12) Unusually Long Peak-to-Valley Drawdown Periods With Respect To the Index May Be Reflected in Equally Long Peak-to-Valley Drawdown Periods with Respect to the Performance of the Shares.
Although past Index levels are not necessarily indicative of future Index levels, the Index has experienced unusually long peak-to-valley drawdown periods. As of December 31, 2015, the closing level of the Index experienced a peak-to-valley drawdown of (48.06)% during the period from January 1987 – April 2011.
Because it is expected that the Fund’s performance will track the changes in the closing levels of the Index, the Fund would suffer a continuous drawdown during the period that the Index suffers such a drawdown period, and in turn, the value of your Shares will also suffer.
| V. | Risk factor 13 under the section “The Risks You Face” on page 22 of the Prospectus is hereby deleted and replaced, in its entirety, by the following: |
(13) Price Volatility May Possibly Cause the Total Loss of Your Investment.
Futures contracts have a high degree of price variability and are subject to occasional rapid and substantial changes. Consequently, you could lose all or substantially all of your investment in the Fund.
The following table* reflects various measures of volatility** of the Index, as calculated on an excess return basis:
| Volatility | ||||
Volatility Type | Index | |||
Daily volatility over full history | 8.78 | % | ||
Average rolling 3 month daily volatility | 8.45 | % | ||
Monthly return volatility | 8.78 | % | ||
Average annual volatility | 8.60 | % | ||
4
The following table reflects the daily volatility on an annual basis of the Index:
| Daily Volatility | ||||||
| Year | Index | |||||
| 1986*** | 0.00 | % | ||||
| 1987 | 9.44 | % | ||||
| 1988 | 9.62 | % | ||||
| 1989 | 10.22 | % | ||||
| 1990 | 8.77 | % | ||||
| 1991 | 11.53 | % | ||||
| 1992 | 11.70 | % | ||||
| 1993 | 9.44 | % | ||||
| 1994 | 7.83 | % | ||||
| 1995 | 9.78 | % | ||||
| 1996 | 4.99 | % | ||||
| 1997 | 7.59 | % | ||||
| 1998 | 8.06 | % | ||||
| 1999 | 7.59 | % | ||||
| 2000 | 8.77 | % | ||||
| 2001 | 8.70 | % | ||||
| 2002 | 7.49 | % | ||||
| 2003 | 8.44 | % | ||||
| 2004 | 9.52 | % | ||||
| 2005 | 8.10 | % | ||||
| 2006 | 6.95 | % | ||||
| 2007 | 5.21 | % | ||||
| 2008 | 11.94 | % | ||||
| 2009 | 11.09 | % | ||||
| 2010 | 8.84 | % | ||||
| 2011 | 9.47 | % | ||||
| 2012 | 6.67 | % | ||||
| 2013 | 6.70 | % | ||||
| 2014 | 5.23 | % | ||||
| 2015* | 9.61 | % | ||||
*As of December 31, 2015. Past Index levels are not necessarily indicative of future changes, positive or negative, in the Index levels.
**Volatility, for these purposes means the following:
Daily Volatility: The relative rate at which the price of the Index moves up and down, found by calculating the annualized standard deviation of the daily change in price.
Monthly Return Volatility: The relative rate at which the price of the Index moves up and down, found by calculating the annualized standard deviation of the monthly change in price.
Average Annual Volatility: The average of yearly volatilities for a given sample period. The yearly volatility is the relative rate at which the price of the Index moves up and down, found by calculating the annualized standard deviation of the daily change in price for each business day in the given year.
***As of December 31, 1986.
5
| VI. | Page 34 of the Prospectus is hereby deleted and replaced, in its entirety, with the following: |
“PERFORMANCE OF POWERSHARES DB US DOLLAR INDEX BULLISH FUND (TICKER: UUP), A SERIES OF POWERSHARES DB US DOLLAR INDEX TRUST
Name of Pool: PowerShares DB US Dollar Index Bullish Fund
Type of Pool: Public, Exchange-Listed Commodity Pool
Inception of Trading: February 2007
Aggregate Gross Capital Subscriptions as of December 31, 2015: $12,349,601,551
Net Asset Value as of December 31, 2015: $1,133,614,816
Net Asset Value per Share as of December 31, 2015: $25.65
Worst Monthly Drawdown: (4.09)% April 2015
Worst Peak-to-Valley Drawdown: (20.93)% November 2009 – April 2011*
Monthly Rate of Return | 2015(%) | 2014(%) | 2013(%) | 2012(%) | 2011(%) | |||||
January | 4.75 | 1.44 | (0.87) | (1.43) | (1.80) | |||||
February | 0.28 | (2.15) | 3.42 | (0.81) | (1.25) | |||||
March | 2.98 | 0.47 | 1.07 | (0.18) | (1.49) | |||||
April | (4.09) | (0.98) | (1.68) | (0.41) | (3.86) | |||||
May | 2.37 | 1.04 | 1.85 | 5.32 | 2.06 | |||||
June | (1.81) | (0.88) | (0.35) | (2.18) | (0.61) | |||||
July | 1.80 | 2.07 | (2.26) | 1.11 | (0.90) | |||||
August | (1.69) | 1.49 | 0.68 | (1.85) | 0.14 | |||||
September | 0.40 | 3.70 | (2.52) | (1.70) | 5.75 | |||||
October | 0.48 | 1.07 | (0.14) | (0.50) | (3.50) | |||||
November | 3.21 | 1.55 | 0.46 | 0.55 | 2.75 | |||||
December | (1.57) | 2.18 | (0.83) | (0.55) | 1.68 | |||||
Compound Rate of Return | 6.96% | 11.41% | (1.33)% | (2.81)% | (1.45)% |
*The Worst Peak-to-Valley Drawdown from November 2008 – April 2011 includes the effect of the $0.17 per Share distribution made to Shareholders of record as of December 17, 2008.
PAST PERFORMANCE IS NOT NECESSARILY INDICATIVE OF FUTURE RESULTS.
See accompanying Footnotes to Performance Information below.
Footnotes to Performance Information
1. “Aggregate Gross Capital Subscriptions” is the aggregate of all amounts ever contributed to the pool, including investors who subsequently redeemed their investments.
2. “Net Asset Value” is the net asset value of the pool as of December 31, 2015.
3. “Net Asset Value per Share” is the Net Asset Value of the pool divided by the total number of Shares outstanding with respect to the pool as of December 31, 2015.
4. “Worst Monthly Drawdown” is the largest single month loss sustained during the last five years. “Drawdown” as used in this section of the Prospectus means losses experienced by the pool over the specified period and is calculated on a rate of return basis, i.e., dividing net performance by beginning equity. “Drawdown” is measured on the basis of monthly returns only, and does not reflect intra-month figures. “Month” is the month of the Worst Monthly Drawdown.
5. “Worst Peak-to-Valley Drawdown” is the largest percentage decline in the Net Asset Value per Share during the most recent five calendar years (and to the extent applicable, for a period beyond the most recent five calendar years if the starting date of the peak value extends beyond this period). This need not be a continuous decline, but can be a series of positive and negative returns where the negative returns are larger than the positive returns. “Worst Peak-to-Valley Drawdown” represents the greatest percentage decline from any month-end Net Asset Value per Share that occurs without such month-end Net Asset Value per Share being equaled or exceeded as of a subsequent month-end. For example, if the Net
6
Asset Value per Share of the pool declined by $1 in each of January and February, increased by $1 in March and declined again by $2 in April, a “peak-to-valley drawdown” analysis conducted as of the end of April would consider that “drawdown” to be still continuing and to be $3 in amount, whereas if the Net Asset Value per Share had increased by $2 in March, the January-February drawdown would have ended as of the end of February at the $2 level.
6. “Compound Rate of Return” of the pool is calculated by multiplying on a compound basis each of the monthly rates of return set forth in the chart above and not by adding or averaging such monthly rates of return. For periods of less than one year, the results are year-to-date.
THE FUND’S PERFORMANCE INFORMATION FROM INCEPTION UP TO AND INCLUDING FEBRUARY 23, 2015 IS A REFLECTION OF THE PERFORMANCE ASSOCIATED WITH DB COMMODITY SERVICES LLC, WHICH SERVED AS THE PREDECESSOR MANAGING OWNER. ALL THE PERFORMANCE INFORMATION ON AND AFTER FEBRUARY 23, 2015 REFLECTS THE PERFORMANCE ASSOCIATED WITH THE MANAGING OWNER.
| VII. | The second paragraph (and first bullet point) under the sub-heading “Cautionary Statement–Statistical Information” on page 40 of the Prospectus is hereby deleted and replaced, in its entirety, by the following: |
Changes in Closing Levels of the Index during any particular period or market cycle may be volatile.
Worst Peak-to-Valley
| Worst Monthly
| |||
(48.06)%, 1/87-04/11
|
| (6.30 5/09
| )%,
| |
For example, the “Worst Peak-to-Valley Drawdown” of the Index, represents the greatest percentage decline from any month-end Closing Level, without such Closing Level being equaled or exceeded as of a subsequent month-end, which occurred during the above-listed time period.
7
| VIII. | Pages 43-50 of the Prospectus are hereby deleted and replaced, in their entirety, with the following: |
“CLOSING LEVELS TABLE
DEUTSCHE BANK LONG US DOLLAR INDEX (USDX®) FUTURES INDEX – EXCESS RETURN™
| Closing Level | Index Changes | |||||||
| High1 | Low2 | Annual3 | Since Inception4 | |||||
19865 | 100.00 | 100.00 | 0.00 | 0.00 | ||||
1987 | 100.58 | 80.31 | -19.69% | -19.69% | ||||
1988 | 92.74 | 80.91 | 7.06% | -14.02% | ||||
1989 | 98.38 | 85.91 | 0.84% | -13.30% | ||||
1990 | 87.89 | 73.85 | -13.34% | -24.86% | ||||
1991 | 85.99 | 72.11 | -3.76% | -27.69% | ||||
1992 | 77.65 | 65.06 | 3.67% | -25.04% | ||||
1993 | 76.18 | 70.10 | -0.42% | -25.35% | ||||
1994 | 74.47 | 64.27 | -10.56% | -33.23% | ||||
1995 | 67.54 | 60.33 | -5.30% | -36.77% | ||||
1996 | 66.56 | 63.18 | 4.32% | -34.04% | ||||
1997 | 76.53 | 66.13 | 14.46% | -24.50% | ||||
1998 | 78.10 | 70.33 | -4.85% | -28.16% | ||||
1999 | 80.14 | 71.30 | 9.38% | -21.42% | ||||
2000 | 92.51 | 77.39 | 8.85% | -14.47% | ||||
2001 | 94.55 | 84.91 | 6.01% | -9.33% | ||||
2002 | 93.28 | 77.72 | -14.28% | -22.28% | ||||
2003 | 78.64 | 65.14 | -16.19% | -34.86% | ||||
2004 | 68.46 | 59.41 | -8.33% | -40.29% | ||||
2005 | 68.31 | 60.01 | 13.14% | -32.44% | ||||
2006 | 67.50 | 62.03 | -6.67% | -36.95% | ||||
2007 | 64.32 | 57.07 | -7.26% | -41.53% | ||||
2008 | 66.12 | 54.14 | 4.17% | -39.09% | ||||
2009 | 66.14 | 54.18 | -6.85% | -43.26% | ||||
2010 | 63.96 | 54.45 | -0.35% | -43.46% | ||||
2011 | 57.99 | 51.94 | -0.77% | -43.90% | ||||
2012 | 58.07 | 54.40 | -2.08% | -45.06% | ||||
2013 | 58.00 | 54.09 | -0.56% | -45.37% | ||||
2014 | 61.31 | 53.83 | 12.22% | -38.69% | ||||
20156 | 67.80 | 61.31 | 7.75% | -33.94% | ||||
THE FUND TRADES WITH A VIEW TO TRACKING THE
DEUTSCHE BANK LONG US DOLLAR INDEX (USDX®) FUTURES INDEX – EXCESS RETURN™ OVER TIME.
NEITHER THE PAST PERFORMANCE OF THE FUND NOR THE PRIOR INDEX LEVELS AND CHANGES, POSITIVE AND NEGATIVE, SHOULD BE TAKEN AS AN INDICATION OF THE FUND’S FUTURE PERFORMANCE.
Please refer to notes and legends that follow on page 48.
[Remainder of page left blank intentionally.]
8
CLOSING LEVELS TABLE
DEUTSCHE BANK LONG US DOLLAR INDEX (USDX®) FUTURES INDEX – TOTAL RETURN™
| Closing Level | Index Changes | |||||||
| High1 | Low2 | Annual3 | Since Inception4 | |||||
19865 | 100.00 | 100.00 | 0.00 | 0.00 | ||||
1987 | 100.66 | 85.33 | -14.67% | -14.67% | ||||
1988 | 102.65 | 86.02 | 14.80% | -2.04% | ||||
1989 | 116.74 | 97.97 | 9.54% | 7.30% | ||||
1990 | 110.08 | 97.96 | -6.41% | 0.43% | ||||
1991 | 118.38 | 97.40 | 1.66% | 2.09% | ||||
1992 | 110.58 | 94.16 | 7.37% | 9.61% | ||||
1993 | 112.53 | 103.48 | 2.67% | 12.53% | ||||
1994 | 112.42 | 100.14 | -6.62% | 5.09% | ||||
1995 | 106.73 | 96.63 | 0.14% | 5.24% | ||||
1996 | 116.61 | 105.21 | 9.82% | 15.57% | ||||
1997 | 139.28 | 115.91 | 20.51% | 39.28% | ||||
1998 | 148.94 | 134.97 | -0.11% | 39.13% | ||||
1999 | 160.01 | 138.16 | 14.67% | 59.54% | ||||
2000 | 198.12 | 157.20 | 15.48% | 84.23% | ||||
2001 | 208.23 | 183.08 | 9.78% | 102.26% | ||||
2002 | 208.39 | 176.25 | -12.86% | 76.25% | ||||
2003 | 178.34 | 149.23 | -15.33% | 49.23% | ||||
2004 | 157.39 | 138.01 | -7.05% | 38.71% | ||||
2005 | 163.02 | 139.43 | 16.79% | 62.00% | ||||
2006 | 163.23 | 152.48 | -2.09% | 58.62% | ||||
2007 | 162.61 | 149.70 | -3.02% | 53.83% | ||||
2008 | 176.36 | 143.29 | 5.62% | 62.47% | ||||
2009 | 176.48 | 144.72 | -6.71% | 51.56% | ||||
2010 | 170.96 | 145.63 | -0.21% | 51.24% | ||||
2011 | 155.12 | 138.99 | -0.72% | 50.15% | ||||
2012 | 155.47 | 145.66 | -1.99% | 47.15% | ||||
2013 | 155.41 | 144.94 | -0.50% | 46.41% | ||||
2014 | 164.35 | 144.27 | 12.25% | 64.35% | ||||
20156 | 181.77 | 164.35 | 7.81% | 77.18% | ||||
THE FUND DOES NOT TRADE WITH A VIEW TO TRACKING THE
DEUTSCHE BANK LONG US DOLLAR INDEX (USDX®) FUTURES INDEX – TOTAL RETURN™ OVER TIME.
NEITHER THE PAST PERFORMANCE OF THE FUND NOR THE PRIOR INDEX LEVELS AND CHANGES, POSITIVE AND NEGATIVE, SHOULD BE TAKEN AS AN INDICATION OF THE FUND’S FUTURE PERFORMANCE.
Please refer to notes and legends that follow on page 48.
[Remainder of page left blank intentionally.]
9
All Statistics based on data from December 31, 1986 to December 31, 2015
| ||||||||||||||||||||
| Various Statistical Measures | DB Long Future ER7,8 | DB Long Future TR8,9 | Spot Index10 | |||||||||||||||||
Annualized Changes to Index Level11 | -1.42% | 1.99% | -0.17% | |||||||||||||||||
Average rolling 3 month volatility12 | 8.5% | 8.4% | 8.2% | |||||||||||||||||
Sharpe Ratio13 | -0.17 | -0.34 | -0.62 | |||||||||||||||||
% of months with positive change14 | 47% | 52% | 47% | |||||||||||||||||
Average monthly positive change15 | 2.0% | 2.1% | 2.0% | |||||||||||||||||
Average monthly negative change16 | -1.9% | -1.8% | -1.8% | |||||||||||||||||
| Annualized Index Levels17 | DB Long Future ER7,8 | DB Long Future TR8,9 | Spot Index10 | |||||||||||||||||
1 yr | 7.8% | 7.8% | 9.3% | |||||||||||||||||
3 yr | 6.3% | 6.4% | 7.3% | |||||||||||||||||
5 yr | 3.2% | 3.2% | 4.5% | |||||||||||||||||
7 yr | 1.2% | 1.3% | 2.8% | |||||||||||||||||
10 yr | -0.2% | 0.9% | 0.8% | |||||||||||||||||
15 yr | -1.7% | -0.3% | -0.7% | |||||||||||||||||
| Correlation of Monthly Returns (between December 31, 1998 to December 31, 2015)* ,22 | ||||||||||||||||||||
| DB Long Future TR7,8 | S&P 500 TR18 | iBoxx US Treasuries19 | DBLCI TR20 | NAR Existing One Family Home Sales Median Price Index21 | ||||||||||||||||
DB Long Future TR9 | 1.00 | -0.32 | -0.13 | -0.42 | -0.07 | |||||||||||||||
S&P 500 TR18 | 1.00 | -0.30 | 0.30 | 0.04 | ||||||||||||||||
iBoxx US Treasuries19 | 1.00 | -0.10 | -0.15 | |||||||||||||||||
DBLCI TR20 | 1.00 | 0.08 | ||||||||||||||||||
NAR Existing One Family Home Sales Median Price Index21 | 1.00 | |||||||||||||||||||
NEITHER THE PAST PERFORMANCE OF THE FUND NOR THE PRIOR INDEX LEVELS AND CHANGES, POSITIVE AND NEGATIVE, SHOULD BE TAKEN AS AN INDICATION OF THE FUND’S FUTURE PERFORMANCE.
* “Correlation” is a statistical term which describes the degree to which two or more asset classes show a tendency to rise or fall in value together. Diversification of an investment portfolio among asset classes that are not correlated with each other tends to reduce overall volatility and risk in the portfolio as a whole. The hypothetical returns of DB Long Future TR have been compared with the S&P 500 TR, the iBoxx US Treasuries, the DBCLI TR and the NAR Existing One Family Home Sales Median Price Index to permit an investor to compare and contrast the degree of correlation between DB Long Future TR (which is a currency index) and indices which are commonly used to measure the performance of the equity, fixed income, commodity and real estate markets, respectively.
WHILE THE FUND’S OBJECTIVE IS NOT TO GENERATE PROFIT THROUGH ACTIVE PORTFOLIO MANAGEMENT, BUT IS TO TRACK THE INDEX., BECAUSE THE INDEX WAS ESTABLISHED IN AUGUST 2006, CERTAIN INFORMATION RELATING TO THE INDEX CLOSING LEVELS MAY BE CONSIDERED TO BE “HYPOTHETICAL.” HYPOTHETICAL INFORMATION MAY HAVE CERTAIN INHERENT LIMITATIONS, SOME OF WHICH ARE DESCRIBED BELOW.
10
WITH RESPECT TO INDEX DATA, NO REPRESENTATION IS BEING MADE THAT THE INDEX WILL OR IS LIKELY TO ACHIEVE ANNUAL OR CUMULATIVE CLOSING LEVELS CONSISTENT WITH OR SIMILAR TO THOSE SET FORTH HEREIN. SIMILARLY, NO REPRESENTATION IS BEING MADE THAT THE FUND WILL GENERATE PROFITS OR LOSSES SIMILAR TO THE FUND’S PAST PERFORMANCE OR THE HISTORICAL ANNUAL OR CUMULATIVE CHANGES IN THE INDEX CLOSING LEVELS. IN FACT, THERE ARE FREQUENTLY SHARP DIFFERENCES BETWEEN HYPOTHETICAL RESULTS AND THE ACTUAL RESULTS SUBSEQUENTLY ACHIEVED BY INVESTMENT METHODOLOGIES, WHETHER ACTIVE OR PASSIVE.
WITH RESPECT TO INDEX DATA, ONE OF THE LIMITATIONS OF HYPOTHETICAL INFORMATION IS THAT IT IS GENERALLY PREPARED WITH THE BENEFIT OF HINDSIGHT. TO THE EXTENT THAT INFORMATION PRESENTED HEREIN RELATES TO THE PERIOD DECEMBER 1986 THROUGH JULY 2006, THE INDEX CLOSING LEVELS REFLECT THE APPLICATION OF THE INDEX’S METHODOLOGY, AND SELECTION OF DX CONTRACTS, IN HINDSIGHT.
NO HYPOTHETICAL RECORD CAN COMPLETELY ACCOUNT FOR THE IMPACT OF FINANCIAL RISK IN ACTUAL TRADING. FOR EXAMPLE, THERE ARE NUMEROUS FACTORS, INCLUDING THOSE DESCRIBED UNDER “THE RISKS YOU FACE” SET FORTH HEREIN, RELATED TO THE CURRENCIES MARKETS IN GENERAL OR TO THE IMPLEMENTATION OF THE FUND’S EFFORTS TO TRACK THE INDEX OVER TIME WHICH CANNOT BE, AND HAVE NOT BEEN, ACCOUNTED FOR IN THE PREPARATION OF THE INDEX INFORMATION SET FORTH ON THE FOLLOWING PAGES, ALL OF WHICH CAN ADVERSELY AFFECT ACTUAL PERFORMANCE RESULTS FOR THE FUND. FURTHERMORE, THE INDEX INFORMATION DOES NOT INVOLVE FINANCIAL RISK OR ACCOUNT FOR THE IMPACT OF FEES AND COSTS ASSOCIATED WITH THE FUND.
THE MANAGING OWNER AND ITS TRADING PRINCIPALS HAVE LIMITED EXPERIENCE MANAGING THE DAY-TO-DAY OPERATIONS FOR THE FUND AND HAVE ONLY MANAGED AN EXCHANGE-TRADED FUND THAT RELATES TO A BROAD-BASED COMMODITY INDEX FOR A SHORT PERIOD. BECAUSE THERE ARE LIMITED ACTUAL PERFORMANCE RESULTS OF THE MANAGING OWNER THAT ARE COMPARABLE TO THE INDEX CLOSING LEVELS SET FORTH HEREIN, PROSPECTIVE INVESTORS SHOULD BE PARTICULARLY WARY OF PLACING UNDUE RELIANCE ON THE ANNUAL OR CUMULATIVE INDEX RESULTS. FOR THE AVOIDANCE OF DOUBT, NONE OF THE PERFORMANCE RELATED INFORMATION THAT IS COVERED HEREIN UP TO AND EXCLUDING THE CLOSING DATE CAN BE ATTRIBUTED TO THE MANAGING OWNER.
THE PREDECESSOR MANAGING OWNER, AN INDIRECT WHOLLY OWNED SUBSIDIARY OF DEUTSCHE BANK AG, COMMENCED OPERATIONS IN JANUARY 2006. AS THE PREDECESSOR MANAGING OWNER, THE PREDECESSOR MANAGING OWNER AND ITS TRADING PRINCIPALS MANAGED THE DAY-TO-DAY OPERATIONS FOR THE FUND FROM INCEPTION UP TO AND EXCLUDING THE CLOSING DATE. BECAUSE THERE ARE LIMITED ACTUAL TRADING RESULTS TO COMPARE TO THE INDEX CLOSING LEVELS SET FORTH HEREIN, PROSPECTIVE INVESTORS SHOULD BE PARTICULARLY WARY OF PLACING UNDUE RELIANCE ON THE ANNUAL OR CUMULATIVE INDEX RESULTS. IN RESPECT OF ANY PERIOD., FOR THE AVOIDANCE OF DOUBT, NONE OF THE PERFORMANCE RELATED INFORMATION THAT IS COVERED HEREIN ON AND AFTER THE CLOSING DATE CAN BE ATTRIBUTED TO THE PREDECESSOR MANAGING OWNER.
THE FUND’S PERFORMANCE INFORMATION FROM INCEPTION UP TO AND EXCLUDING THE CLOSING DATE IS A REFLECTION OF THE PERFORMANCE ASSOCIATED WITH THE PREDECESSOR MANAGING OWNER. THE MANAGING OWNER HAS SERVED AS MANAGING OWNER OF THE FUND SINCE THE CLOSING DATE, AND THE FUND’S PERFORMANCE INFORMATION SINCE THE CLOSING DATE IS A REFLECTION OF THE PERFORMANCE ASSOCIATED WITH THE MANAGING OWNER. PAST PERFORMANCE OF THE FUND IS NOT NECESSARILY INDICATIVE OF FUTURE PERFORMANCE.
Please refer to notes and legends that follow on page 48.
11
COMPARISON OF VARIOUS US DOLLAR INDICES
(December 31, 1986 – December 31, 2015)
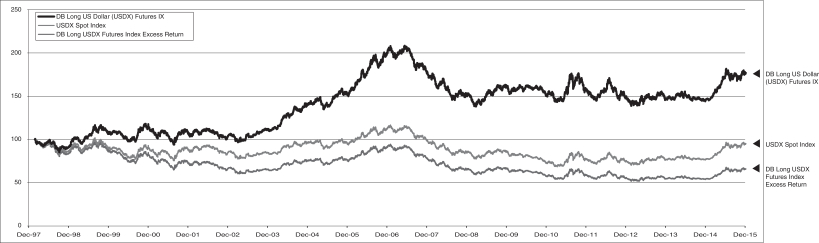
NEITHER THE PAST PERFORMANCE OF THE FUND NOR THE PRIOR INDEX LEVELS AND CHANGES, POSITIVE AND NEGATIVE, SHOULD BE TAKEN AS AN INDICATION OF THE FUND’S FUTURE PERFORMANCE.
Each of the DB Long Future-ER, DB Long Future-TR and Spot Index are indices and do not reflect actual trading or any fees or expenses.
Spot Index is calculated on an excess return basis.
WHILE THE FUND’S OBJECTIVE IS NOT TO GENERATE PROFIT THROUGH ACTIVE PORTFOLIO MANAGEMENT, BUT IS TO TRACK THE INDEX., BECAUSE THE INDEX WAS ESTABLISHED IN AUGUST 2006, CERTAIN INFORMATION RELATING TO THE INDEX CLOSING LEVELS MAY BE CONSIDERED TO BE “HYPOTHETICAL.” HYPOTHETICAL INFORMATION MAY HAVE CERTAIN INHERENT LIMITATIONS, SOME OF WHICH ARE DESCRIBED BELOW.
WITH RESPECT TO INDEX DATA, NO REPRESENTATION IS BEING MADE THAT THE INDEX WILL OR IS LIKELY TO ACHIEVE ANNUAL OR CUMULATIVE CLOSING LEVELS CONSISTENT WITH OR SIMILAR TO THOSE SET FORTH HEREIN. SIMILARLY, NO REPRESENTATION IS BEING MADE THAT THE FUND WILL GENERATE PROFITS OR LOSSES SIMILAR TO THE FUND’S PAST PERFORMANCE OR THE HISTORICAL ANNUAL OR CUMULATIVE CHANGES IN THE INDEX CLOSING LEVELS. IN FACT, THERE ARE FREQUENTLY SHARP DIFFERENCES BETWEEN HYPOTHETICAL RESULTS AND THE ACTUAL RESULTS SUBSEQUENTLY ACHIEVED BY INVESTMENT METHODOLOGIES, WHETHER ACTIVE OR PASSIVE.
WITH RESPECT TO INDEX DATA, ONE OF THE LIMITATIONS OF HYPOTHETICAL INFORMATION IS THAT IT IS GENERALLY PREPARED WITH THE BENEFIT OF HINDSIGHT. TO THE EXTENT THAT INFORMATION PRESENTED HEREIN RELATES TO THE PERIOD DECEMBER 1986 THROUGH JULY 2006, THE INDEX CLOSING LEVELS REFLECT THE APPLICATION OF THE INDEX’S METHODOLOGY, AND SELECTION OF DX CONTRACTS, IN HINDSIGHT.
NO HYPOTHETICAL RECORD CAN COMPLETELY ACCOUNT FOR THE IMPACT OF FINANCIAL RISK IN ACTUAL TRADING. FOR EXAMPLE, THERE ARE NUMEROUS FACTORS, INCLUDING THOSE DESCRIBED UNDER “THE RISKS YOU FACE” SET FORTH HEREIN, RELATED TO THE CURRENCIES MARKETS IN GENERAL OR TO THE IMPLEMENTATION OF THE FUND’S EFFORTS TO TRACK THE INDEX OVER TIME WHICH CANNOT BE, AND HAVE NOT BEEN, ACCOUNTED FOR IN THE PREPARATION OF THE INDEX INFORMATION SET FORTH ON THE FOLLOWING PAGES, ALL OF WHICH CAN ADVERSELY AFFECT ACTUAL PERFORMANCE RESULTS FOR THE FUND. FURTHERMORE, THE INDEX INFORMATION DOES NOT INVOLVE FINANCIAL RISK OR ACCOUNT FOR THE IMPACT OF FEES AND COSTS ASSOCIATED WITH THE FUND.
THE MANAGING OWNER AND ITS TRADING PRINCIPALS HAVE LIMITED EXPERIENCE MANAGING THE DAY-TO-DAY OPERATIONS FOR THE FUND AND HAVE ONLY MANAGED AN EXCHANGE-TRADED FUND THAT RELATES TO A BROAD-BASED COMMODITY INDEX FOR A SHORT PERIOD. BECAUSE THERE ARE LIMITED ACTUAL PERFORMANCE RESULTS OF THE MANAGING OWNER THAT ARE COMPARABLE TO THE INDEX CLOSING LEVELS SET FORTH HEREIN, PROSPECTIVE INVESTORS SHOULD BE PARTICULARLY WARY OF PLACING UNDUE RELIANCE ON THE ANNUAL OR CUMULATIVE INDEX RESULTS. FOR THE AVOIDANCE OF DOUBT, NONE OF THE PERFORMANCE RELATED INFORMATION THAT IS COVERED HEREIN UP TO AND EXCLUDING THE CLOSING DATE CAN BE ATTRIBUTED TO THE MANAGING OWNER.
12
THE PREDECESSOR MANAGING OWNER, AN INDIRECT WHOLLY OWNED SUBSIDIARY OF DEUTSCHE BANK AG, COMMENCED OPERATIONS IN JANUARY 2006. AS THE PREDECESSOR MANAGING OWNER, THE PREDECESSOR MANAGING OWNER AND ITS TRADING PRINCIPALS MANAGED THE DAY-TO-DAY OPERATIONS FOR THE FUND FROM INCEPTION UP TO AND EXCLUDING THE CLOSING DATE. BECAUSE THERE ARE LIMITED ACTUAL TRADING RESULTS TO COMPARE TO THE INDEX CLOSING LEVELS SET FORTH HEREIN, PROSPECTIVE INVESTORS SHOULD BE PARTICULARLY WARY OF PLACING UNDUE RELIANCE ON THE ANNUAL OR CUMULATIVE INDEX RESULTS. IN RESPECT OF ANY PERIOD., FOR THE AVOIDANCE OF DOUBT, NONE OF THE PERFORMANCE RELATED INFORMATION THAT IS COVERED HEREIN ON AND AFTER THE CLOSING DATE CAN BE ATTRIBUTED TO THE PREDECESSOR MANAGING OWNER.
THE FUND’S PERFORMANCE INFORMATION FROM INCEPTION UP TO AND EXCLUDING THE CLOSING DATE IS A REFLECTION OF THE PERFORMANCE ASSOCIATED WITH THE PREDECESSOR MANAGING OWNER. THE MANAGING OWNER HAS SERVED AS MANAGING OWNER OF THE FUND SINCE THE CLOSING DATE, AND THE FUND’S PERFORMANCE INFORMATION SINCE THE CLOSING DATE IS A REFLECTION OF THE PERFORMANCE ASSOCIATED WITH THE MANAGING OWNER. PAST PERFORMANCE OF THE FUND IS NOT NECESSARILY INDICATIVE OF FUTURE PERFORMANCE.
Please refer to notes and legends that follow on page 48.
13
COMPARISON OF ANNUAL RETURNS OF VARIOUS US DOLLAR INDICES
(December 31, 1986 – December 31, 2015)
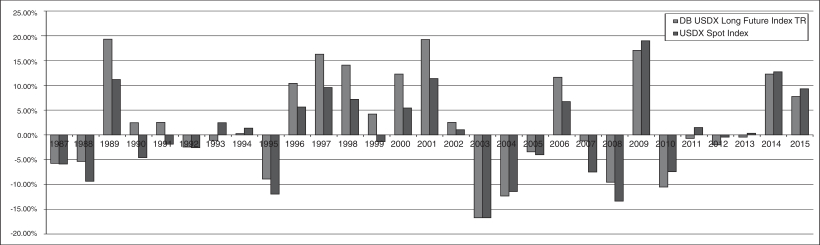
NEITHER THE PAST PERFORMANCE OF THE FUND NOR THE PRIOR INDEX LEVELS AND CHANGES, POSITIVE AND NEGATIVE, SHOULD BE TAKEN AS AN INDICATION OF THE FUND’S FUTURE PERFORMANCE.
Each of the DB Long Future-ER and Spot Index are indices and do not reflect actual trading or any fees or expenses.
Spot Index is calculated on an excess return basis.
WHILE THE FUND’S OBJECTIVE IS NOT TO GENERATE PROFIT THROUGH ACTIVE PORTFOLIO MANAGEMENT, BUT IS TO TRACK THE INDEX., BECAUSE THE INDEX WAS ESTABLISHED IN AUGUST 2006, CERTAIN INFORMATION RELATING TO THE INDEX CLOSING LEVELS MAY BE CONSIDERED TO BE “HYPOTHETICAL.” HYPOTHETICAL INFORMATION MAY HAVE CERTAIN INHERENT LIMITATIONS, SOME OF WHICH ARE DESCRIBED BELOW.
WITH RESPECT TO INDEX DATA, NO REPRESENTATION IS BEING MADE THAT THE INDEX WILL OR IS LIKELY TO ACHIEVE ANNUAL OR CUMULATIVE CLOSING LEVELS CONSISTENT WITH OR SIMILAR TO THOSE SET FORTH HEREIN. SIMILARLY, NO REPRESENTATION IS BEING MADE THAT THE FUND WILL GENERATE PROFITS OR LOSSES SIMILAR TO THE FUND’S PAST PERFORMANCE OR THE HISTORICAL ANNUAL OR CUMULATIVE CHANGES IN THE INDEX CLOSING LEVELS. IN FACT, THERE ARE FREQUENTLY SHARP DIFFERENCES BETWEEN HYPOTHETICAL RESULTS AND THE ACTUAL RESULTS SUBSEQUENTLY ACHIEVED BY INVESTMENT METHODOLOGIES, WHETHER ACTIVE OR PASSIVE.
WITH RESPECT TO INDEX DATA, ONE OF THE LIMITATIONS OF HYPOTHETICAL INFORMATION IS THAT IT IS GENERALLY PREPARED WITH THE BENEFIT OF HINDSIGHT. TO THE EXTENT THAT INFORMATION PRESENTED HEREIN RELATES TO THE PERIOD DECEMBER 1986 THROUGH JULY 2006, THE INDEX CLOSING LEVELS REFLECT THE APPLICATION OF THE INDEX’S METHODOLOGY, AND SELECTION OF DX CONTRACTS, IN HINDSIGHT.
NO HYPOTHETICAL RECORD CAN COMPLETELY ACCOUNT FOR THE IMPACT OF FINANCIAL RISK IN ACTUAL TRADING. FOR EXAMPLE, THERE ARE NUMEROUS FACTORS, INCLUDING THOSE DESCRIBED UNDER “THE RISKS YOU FACE” SET FORTH HEREIN, RELATED TO THE CURRENCIES MARKETS IN GENERAL OR TO THE IMPLEMENTATION OF THE FUND’S EFFORTS TO TRACK THE INDEX OVER TIME WHICH CANNOT BE, AND HAVE NOT BEEN, ACCOUNTED FOR IN THE PREPARATION OF THE INDEX INFORMATION SET FORTH ON THE FOLLOWING PAGES, ALL OF WHICH CAN ADVERSELY AFFECT ACTUAL PERFORMANCE RESULTS FOR THE FUND. FURTHERMORE, THE INDEX INFORMATION DOES NOT INVOLVE FINANCIAL RISK OR ACCOUNT FOR THE IMPACT OF FEES AND COSTS ASSOCIATED WITH THE FUND.
THE MANAGING OWNER AND ITS TRADING PRINCIPALS HAVE LIMITED EXPERIENCE MANAGING THE DAY-TO-DAY OPERATIONS FOR THE FUND AND HAVE ONLY MANAGED AN EXCHANGE-TRADED FUND THAT RELATES TO A BROAD-BASED COMMODITY INDEX FOR A SHORT PERIOD. BECAUSE THERE ARE LIMITED ACTUAL PERFORMANCE RESULTS OF THE MANAGING OWNER THAT ARE COMPARABLE TO THE INDEX CLOSING LEVELS SET FORTH HEREIN, PROSPECTIVE INVESTORS SHOULD BE PARTICULARLY WARY OF PLACING UNDUE RELIANCE ON THE ANNUAL OR CUMULATIVE INDEX RESULTS. FOR THE AVOIDANCE OF DOUBT, NONE OF THE PERFORMANCE RELATED INFORMATION THAT IS COVERED HEREIN UP TO AND EXCLUDING THE CLOSING DATE CAN BE ATTRIBUTED TO THE MANAGING OWNER.
14
THE PREDECESSOR MANAGING OWNER, AN INDIRECT WHOLLY OWNED SUBSIDIARY OF DEUTSCHE BANK AG, COMMENCED OPERATIONS IN JANUARY 2006. AS THE PREDECESSOR MANAGING OWNER, THE PREDECESSOR MANAGING OWNER AND ITS TRADING PRINCIPALS MANAGED THE DAY-TO-DAY OPERATIONS FOR THE FUND FROM INCEPTION UP TO AND EXCLUDING THE CLOSING DATE. BECAUSE THERE ARE LIMITED ACTUAL TRADING RESULTS TO COMPARE TO THE INDEX CLOSING LEVELS SET FORTH HEREIN, PROSPECTIVE INVESTORS SHOULD BE PARTICULARLY WARY OF PLACING UNDUE RELIANCE ON THE ANNUAL OR CUMULATIVE INDEX RESULTS. IN RESPECT OF ANY PERIOD., FOR THE AVOIDANCE OF DOUBT, NONE OF THE PERFORMANCE RELATED INFORMATION THAT IS COVERED HEREIN ON AND AFTER THE CLOSING DATE CAN BE ATTRIBUTED TO THE PREDECESSOR MANAGING OWNER.
THE FUND’S PERFORMANCE INFORMATION FROM INCEPTION UP TO AND EXCLUDING THE CLOSING DATE IS A REFLECTION OF THE PERFORMANCE ASSOCIATED WITH THE PREDECESSOR MANAGING OWNER. THE MANAGING OWNER HAS SERVED AS MANAGING OWNER OF THE FUND SINCE THE CLOSING DATE, AND THE FUND’S PERFORMANCE INFORMATION SINCE THE CLOSING DATE IS A REFLECTION OF THE PERFORMANCE ASSOCIATED WITH THE MANAGING OWNER. PAST PERFORMANCE OF THE FUND IS NOT NECESSARILY INDICATIVE OF FUTURE PERFORMANCE.
Please refer to notes and legends that follow on page 48.
15
NOTES AND LEGENDS:
1. “High” reflects the highest closing level of the Index during the applicable year.
2. “Low” reflects the lowest closing level of the Index during the applicable year.
3. “Annual Index Changes” reflect the change to the Index level on an annual basis as of December 31 of each applicable year.
4. “Index Changes Since Inception” reflects the change of the Index level since inception on a compounded annual basis as of December 31 of each applicable year.
5. Closing levels as of Base Date of December 31, 1986.
6. Closing levels as of December 31, 2015.
7. “DB Long Future ER” is the Deutsche Bank Long US Dollar Index (USDX®) Futures Index — Excess Return™ with respect to the Index. The Deutsche Bank Long US Dollar Index (USDX®) Futures Index™ is calculated on both an excess return basis and total return basis. The DB Long Future ER calculation is not funded and reflects the changes in market value over time, whether positive or negative, of the underlying DX Contracts. The sponsor of the Index, or the Index Sponsor, is Deutsche Bank Securities Inc.
8. If the Fund’s interest income from its holdings of fixed income securities were to exceed the Fund’s fees and expenses, the total return on an investment in the Fund is expected to outperform the DB Long Future ER and underperform the DB Long Future TR (as such term is defined in the following footnote). The only difference between the DB Long Future ER and the DB Long Future TR is that the DB Long Future ER does not include interest income from a hypothetical basket of fixed income securities while the DB Long Future TR does include such a component. The difference in the changes in market value over time, whether positive or negative, in the DB Long Future ER and the DB Long Future TR is attributable entirely to the hypothetical interest income from this hypothetical basket of fixed income securities. If the Fund’s interest income from its holdings of fixed-income securities exceeds the Fund’s fees and expenses, then the amount of such excess is expected to be distributed periodically. The market price of the Shares is expected to track closely the DB Long Future ER. The total return on an investment in the Fund over any period is the sum of the capital appreciation or depreciation of the Shares over the period, plus the amount of any distributions during the period. Consequently, the Fund’s total return is expected to outperform the DB Long Future ER by the amount of the excess, if any, of its interest income over its fees and expenses but, as a result of the Fund’s fees and expenses, the total return on the Fund is expected to underperform the DB Long Future TR. If the Fund’s fees and expenses were to exceed the Fund’s interest income from its holdings of fixed income securities, the Fund would underperform the DB Long Future ER.
9. “DB Long Future TR” is the Deutsche Bank Long US Dollar Index (USDX®) Futures Index — Total Return™ with respect to the Index. The Deutsche Bank Long US Dollar Index (USDX®) Futures Index™ is calculated on both an excess return basis and total return basis. The DB Long Future TR calculation is funded and reflects the changes in market value over time, whether positive or negative, of both the underlying DX Contracts and the interest income from a hypothetical basket of fixed income securities. The sponsor of the Index, or the Index Sponsor, is Deutsche Bank Securities Inc.
10. “Spot Index” is the U.S. Dollar Index (USDX®), which provides a general indication of the international value of the USD by averaging the exchange rates between the USD and the six major world currencies the Spot Index — Euro, Japanese Yen, British Pound, Canadian Dollar, Swedish Krona and Swiss Franc. The USDX® mark is a registered service mark owned by ICE Futures U.S., Inc.
11. “Annualized Changes to Index Level” reflects the changes of the applicable index on an annual basis as of December 31 of each applicable year.
12. “Average rolling 3 month daily volatility.” The daily volatility reflects the relative rate at which the price of the applicable index moves up and down, which is found by calculating the annualized standard deviation of the daily change in price. In turn, an average of this value is calculated on a 3 month rolling basis.
16
13. “Sharpe Ratio” compares the annualized rate of return minus the annualized risk-free rate of return to the annualized variability — often referred to as the “standard deviation” — of the monthly rates of return. A Sharpe Ratio of 1:1 or higher indicates that, according to the measures used in calculating the ratio, the rate of return achieved by a particular strategy has equaled or exceeded the risks assumed by such strategy. The risk-free rate of return that was used in these calculations was assumed to be 4.89%.
14. “% of months with positive change” during the period from inception to December 31, 2015.
15. “Average monthly positive change” during the period from inception to December 31, 2015.
16. “Average monthly negative change” during the period from inception to December 31, 2015.
17. “Annualized Index Levels” reflects the change in the applicable index on an annual basis as of December 31 of each the applicable time period (e.g., 1 year, 3, 5, 7, 10 or 15 years).
18. “S&P 500 TR” is the Standard & Poor’s index calculated on a total return basis. Widely regarded as the benchmark gauge of the U.S. equities market, this index includes a representative sample of 500 leading companies in leading industries of the U.S. economy. Although the S&P 500 focuses on the large-cap segment of the market, with approximately 80% coverage of U.S. equities, it also serves as a proxy for the total market. The total return calculation provides investors with a price-plus-gross cash dividend return. Gross cash dividends are applied on the ex-date of the dividend.
19. “iBoxx US Treasuries” means the Markit iBoxx USD Treasuries index, a sub-index of the Markit iBoxx USD Overall index which covers all USD-denominated investment grade bonds.
20. “DBLCI-TR” is the Deutsche Bank Liquid Commodity Index™ — Total Return. This Index is intended to reflect the changes in notional value in the following commodities: Light, Sweet Crude Oil, Heating Oil, Aluminum, Gold, Corn and Wheat. The notional amounts of each index commodity included in this index are broadly in proportion to historical levels of the world’s production and stocks of the index commodities. The sponsor of the Index, or the Index Sponsor, is Deutsche Bank Securities Inc.
21. “NAR Existing One Family Home Sales Median Price Index” is one component of The National Association Of Realtors® Existing-Home Sales Series, which is the premier measurement of national and regional residential real estate market. On or about the 25th of each month, NAR releases statistics on sales and prices of existing single-family homes for the nation and the four regions. These figures include condos and co-ops, in addition to single-family homes. NAR Existing One Family Home Sales Median Price Index reflects current sales rates, actual totals and median prices by month going back 12 months. Annual totals cover a period of three years, which includes all existing-home sales — single-family, condos and co-ops — rolled into monthly and annual totals.
22. “Correlation of Monthly Returns.” Every investment asset, by definition, has a correlation coefficient of 1.0 with itself; 1.0 indicates 100% positive correlation. Two investments that always move in the opposite direction from each other have a correlation coefficient of-1.0;-1.0 indicates 100% negative correlation. Two investments that perform entirely independently of each other have a correlation coefficient of 0; 0 indicates 100% non-correlation. December 31, 1998 was used as the start date with respect to the underlying data because closing levels with respect to DBLCI-TR was not available prior to December 31, 1998.
WHILE THE FUND’S OBJECTIVE IS NOT TO GENERATE PROFIT THROUGH ACTIVE PORTFOLIO MANAGEMENT, BUT IS TO TRACK THE INDEX., BECAUSE THE INDEX WAS ESTABLISHED IN AUGUST 2006, CERTAIN INFORMATION RELATING TO THE INDEX CLOSING LEVELS MAY BE CONSIDERED TO BE “HYPOTHETICAL.” HYPOTHETICAL INFORMATION MAY HAVE CERTAIN INHERENT LIMITATIONS, SOME OF WHICH ARE DESCRIBED BELOW.
WITH RESPECT TO INDEX DATA, NO REPRESENTATION IS BEING MADE THAT THE INDEX WILL OR IS LIKELY TO ACHIEVE ANNUAL OR CUMULATIVE CLOSING LEVELS CONSISTENT WITH OR SIMILAR TO THOSE SET FORTH HEREIN. SIMILARLY, NO REPRESENTATION IS BEING MADE THAT THE FUND WILL GENERATE PROFITS OR LOSSES SIMILAR TO THE FUND’S PAST PERFORMANCE OR THE HISTORICAL ANNUAL OR CUMULATIVE CHANGES IN THE INDEX CLOSING LEVELS. IN FACT, THERE ARE FREQUENTLY SHARP DIFFERENCES BETWEEN HYPOTHETICAL RESULTS AND THE ACTUAL RESULTS SUBSEQUENTLY ACHIEVED BY INVESTMENT METHODOLOGIES, WHETHER ACTIVE OR PASSIVE.
17
WITH RESPECT TO INDEX DATA, ONE OF THE LIMITATIONS OF HYPOTHETICAL INFORMATION IS THAT IT IS GENERALLY PREPARED WITH THE BENEFIT OF HINDSIGHT. TO THE EXTENT THAT INFORMATION PRESENTED HEREIN RELATES TO THE PERIOD DECEMBER 1986 THROUGH JULY 2006, THE INDEX CLOSING LEVELS REFLECT THE APPLICATION OF THE INDEX’S METHODOLOGY, AND SELECTION OF DX CONTRACTS, IN HINDSIGHT.
NO HYPOTHETICAL RECORD CAN COMPLETELY ACCOUNT FOR THE IMPACT OF FINANCIAL RISK IN ACTUAL TRADING. FOR EXAMPLE, THERE ARE NUMEROUS FACTORS, INCLUDING THOSE DESCRIBED UNDER “THE RISKS YOU FACE” SET FORTH HEREIN, RELATED TO THE CURRENCIES MARKETS IN GENERAL OR TO THE IMPLEMENTATION OF THE FUND’S EFFORTS TO TRACK THE INDEX OVER TIME WHICH CANNOT BE, AND HAVE NOT BEEN, ACCOUNTED FOR IN THE PREPARATION OF THE INDEX INFORMATION SET FORTH ON THE FOLLOWING PAGES, ALL OF WHICH CAN ADVERSELY AFFECT ACTUAL PERFORMANCE RESULTS FOR THE FUND. FURTHERMORE, THE INDEX INFORMATION DOES NOT INVOLVE FINANCIAL RISK OR ACCOUNT FOR THE IMPACT OF FEES AND COSTS ASSOCIATED WITH THE FUND.
THE MANAGING OWNER AND ITS TRADING PRINCIPALS HAVE LIMITED EXPERIENCE MANAGING THE DAY-TO-DAY OPERATIONS FOR THE FUND AND HAVE ONLY MANAGED AN EXCHANGE-TRADED FUND THAT RELATES TO A BROAD-BASED COMMODITY INDEX FOR A SHORT PERIOD. BECAUSE THERE ARE LIMITED ACTUAL PERFORMANCE RESULTS OF THE MANAGING OWNER THAT ARE COMPARABLE TO THE INDEX CLOSING LEVELS SET FORTH HEREIN, PROSPECTIVE INVESTORS SHOULD BE PARTICULARLY WARY OF PLACING UNDUE RELIANCE ON THE ANNUAL OR CUMULATIVE INDEX RESULTS. FOR THE AVOIDANCE OF DOUBT, NONE OF THE PERFORMANCE RELATED INFORMATION THAT IS COVERED HEREIN UP TO AND EXCLUDING THE CLOSING DATE CAN BE ATTRIBUTED TO THE MANAGING OWNER.
THE PREDECESSOR MANAGING OWNER, AN INDIRECT WHOLLY OWNED SUBSIDIARY OF DEUTSCHE BANK AG, COMMENCED OPERATIONS IN JANUARY 2006. AS THE PREDECESSOR MANAGING OWNER, THE PREDECESSOR MANAGING OWNER AND ITS TRADING PRINCIPALS MANAGED THE DAY-TO-DAY OPERATIONS FOR THE FUND FROM INCEPTION UP TO AND EXCLUDING THE CLOSING DATE. BECAUSE THERE ARE LIMITED ACTUAL TRADING RESULTS TO COMPARE TO THE INDEX CLOSING LEVELS SET FORTH HEREIN, PROSPECTIVE INVESTORS SHOULD BE PARTICULARLY WARY OF PLACING UNDUE RELIANCE ON THE ANNUAL OR CUMULATIVE INDEX RESULTS. IN RESPECT OF ANY PERIOD., FOR THE AVOIDANCE OF DOUBT, NONE OF THE PERFORMANCE RELATED INFORMATION THAT IS COVERED HEREIN ON AND AFTER THE CLOSING DATE CAN BE ATTRIBUTED TO THE PREDECESSOR MANAGING OWNER.
THE FUND’S PERFORMANCE INFORMATION FROM INCEPTION UP TO AND EXCLUDING THE CLOSING DATE IS A REFLECTION OF THE PERFORMANCE ASSOCIATED WITH THE PREDECESSOR MANAGING OWNER. THE MANAGING OWNER HAS SERVED AS MANAGING OWNER OF THE FUND SINCE THE CLOSING DATE, AND THE FUND’S PERFORMANCE INFORMATION SINCE THE CLOSING DATE IS A REFLECTION OF THE PERFORMANCE ASSOCIATED WITH THE MANAGING OWNER. PAST PERFORMANCE OF THE FUND IS NOT NECESSARILY INDICATIVE OF FUTURE PERFORMANCE.
PowerShares DB US Dollar Index Bullish Fund (the “Fund”) is not sponsored or endorsed by Deutsche Bank AG, Deutsche Bank Securities Inc. or any subsidiary or affiliate of Deutsche Bank AG or Deutsche Bank Securities Inc. (collectively, “Deutsche Bank”). The Deutsche Bank Long US Dollar Index (USDX®) Futures Index – Excess Return™ (the “DB Index”) is the exclusive property of Deutsche Bank Securities Inc. Neither Deutsche Bank nor any other party involved in, or related to, making or compiling the DB Index makes any representation or warranty, express or implied, concerning the DB Index, the Fund or the advisability of investing in securities generally. Neither Deutsche Bank nor any other party involved in, or related to, making or compiling the DB Index has any obligation to take the needs of Invesco PowerShares Capital Management LLC, the sponsor of the Fund, or its clients into consideration in determining, composing or calculating the DB Index. Neither Deutsche Bank nor any other party involved in, or related to, making or compiling the DB Index is responsible for or has participated in the determination of the timing of, prices at, quantities or valuation of the Fund. Neither Deutsche Bank nor any other party involved in, or related to, making or compiling the DB Index has any obligation or liability in connection with the administration or trading of the Fund.
NEITHER DEUTSCHE BANK NOR ANY OTHER PARTY INVOLVED IN, OR RELATED TO, MAKING OR COMPILING THE DB INDEX, WARRANTS OR GUARANTEES THE ACCURACY AND/OR THE COMPLETENESS OF THE DB INDEX OR ANY DATA INCLUDED THEREIN AND SHALL HAVE NO LIABILITY FOR ANY ERRORS, OMISSIONS, OR INTERRUPTIONS THEREIN. NEITHER DEUTSCHE BANK NOR ANY OTHER PARTY INVOLVED IN, OR RELATED TO, MAKING OR COMPILING THE DB INDEX, MAKES ANY WARRANTY, EXPRESS OR IMPLIED, AS TO RESULTS TO BE OBTAINED BY INVESCO POWERSHARES CAPITAL MANAGEMENT LLC FROM THE USE OF THE DB INDEX OR ANY DATA INCLUDED THEREIN. NEITHER DEUTSCHE BANK NOR ANY OTHER PARTY INVOLVED IN, OR RELATED TO, MAKING OR COMPILING THE DB INDEX, MAKES ANY EXPRESS OR IMPLIED WARRANTIES, AND EXPRESSLY DISCLAIMS ALL WARRANTIES, OF MERCHANTABILITY OR FITNESS FOR A PARTICULAR PURPOSE OR USE WITH RESPECT TO THE DB INDEX OR ANY DATA INCLUDED THEREIN. WITHOUT LIMITING ANY OF THE FOREGOING, IN NO EVENT SHALL DEUTSCHE BANK OR ANY OTHER PARTY INVOLVED IN, OR RELATED TO, MAKING OR COMPILING THE DB INDEX HAVE ANY LIABILITY FOR DIRECT, INDIRECT, PUNITIVE, SPECIAL, CONSEQUENTIAL OR ANY OTHER DAMAGES OR LOSSES (INCLUDING LOST PROFITS), EVEN IF NOTIFIED OF THE POSSIBILITY THEREOF. EXCEPT AS EXPRESSLY PROVIDED TO THE CONTRARY, THERE ARE NO THIRD PARTY BENEFICIARIES OF ANY AGREEMENTS OR ARRANGEMENTS BETWEEN DEUTSCHE BANK AND INVESCO POWERSHARES CAPITAL MANAGEMENT LLC.
18
No purchaser, seller or holder of the shares of this Fund, or any other person or entity, should use or refer to any Deutsche Bank trade name, trademark or service mark to sponsor, endorse, market or promote this Fund without first contacting Deutsche Bank to determine whether Deutsche Bank’s permission is required. Under no circumstances may any person or entity claim any affiliation with Deutsche Bank without the written permission of Deutsche Bank.”
| IX. | The section entitled “Brokerage Agreement” on pages 78-79 of the Prospectus is hereby deleted and replaced, in its entirety, by the following: |
Brokerage Agreement
The Commodity Broker and the Trust (on behalf of the Fund) entered into the Futures and Options Agreement for Institutional Customers with respect to the Fund, or, the Brokerage Agreement. As a result the Commodity Broker:
| • | acts as the clearing broker; |
| • | acts as the carrying broker; and |
| • | acts as the execution broker. |
As clearing broker for the Fund, the Commodity Broker receives orders for trades from the Managing Owner.
Confirmations of all executed trades are given to the Fund by the Commodity Broker. The Brokerage Agreement generally provides that:
| • | all funds, futures and open or cash positions carried for the Fund are held as security for the Fund’s obligations to the Commodity Broker; |
| • | the margins required to initiate or maintain open positions are from time-to-time established by the Commodity Broker and may exceed exchange minimum levels; and |
| • | the Commodity Broker may close out positions, purchase futures or cancel orders at any time it deems necessary for its protection, without the consent of the Trust, on behalf of the Fund. |
Administrative functions provided by the Commodity Broker to the Fund include, but are not limited to, preparing and transmitting daily confirmations of transactions and monthly statements of account, calculating equity balances and margin requirements.
As long as and unless provided for under the Brokerage Agreement between the Commodity Broker and the Trust, on behalf of the Fund, the Commodity Broker will not charge the Fund a fee for any of the services it has agreed to perform, except for the agreed upon brokerage fee.
The Brokerage Agreement is not exclusive. The Brokerage Agreement is terminable by the Trust, on behalf of the Fund, or the Commodity Broker without penalty upon no less than thirty (30) days’ prior written notice (unless otherwise provided in the Brokerage Agreement).
The Fund will indemnify, defend and hold harmless the Commodity Broker and its officers, employees and agents for any fine, penalty, tax, loss, liability or cost, including reasonable attorneys’ fees, incurred by the Commodity Broker or its affiliates that arises out of or is related to the Fund’s failure to comply with applicable law or to perform any obligation required under the Brokerage Agreement. Additionally, the Fund agreed that the Commodity Broker will have no responsibility or liability to the Fund for any costs, losses, judgments or expenses incurred by the Fund as a result of any action or inaction of the Commodity Broker, an exchange or any other party that directly or indirectly results in a transaction clearing, failing to clear, or clearing on a delayed basis.
19