Fund’s fees and expenses, then the amount of such excess is expected to be distributed periodically. The market price of the Shares is expected to closely track the Excess Return Index. The aggregate return on an investment in the Fund over any period is the sum of the capital appreciation or depreciation of the Shares over the period, plus the amount of any distributions during the period. Consequently, the Fund’s aggregate return is expected to outperform the Excess Return Index by the amount of the excess, if any, of the Fund’s Treasury Income, Money Market Income andT-Bill ETF Income over its fees and expenses. As a result of the Fund’s fees and expenses, however, the aggregate return on the Fund is expected to underperform the Total Return Index. If the Fund’s fees and expenses were to exceed the Fund’s Treasury Income, Money Market Income andT-Bill ETF Income, if any, the aggregate return on an investment in the Fund is expected to underperform the Excess Return Index.
FOR THE YEARS ENDED DECEMBER 31, 2018, 2017 AND 2016
Fund Share Price Performance
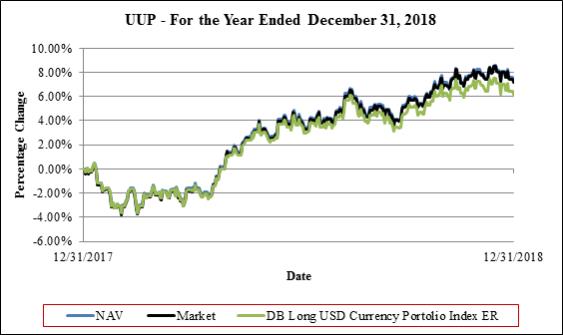
For the year ended December 31, 2018, the NYSE Arca market value of each Share increased 7.09% from $24.04 per Share to $25.47 per Share. The Share price low and high for the year ended December 31, 2018 and related change from the Share price on December 31, 2017 was as follows: Shares traded at a low of $23.13 per Share(-3.79%) on February 1, 2018, and a high of $26.07 per Share (+8.45%) on December 14, 2018. On December 31, 2018, the Fund paid a distribution of $0.27586 for each General Share and Share to holders of record as of December 26, 2018. Therefore, the total return for the Fund, on a market value basis was 7.09%.
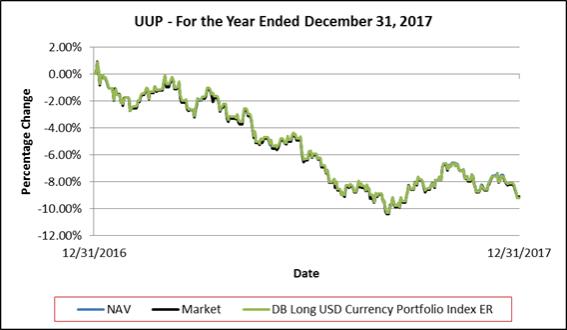
For the year ended December 31, 2017, the NYSE Arca market value of each Share decreased 9.03% from $26.45 per Share to $24.04 per Share. The Share price low and high for the year ended December 31, 2017 and related change from the Share price on December 31, 2016 was as follows: Shares traded at a low of $23.70 per Share(-10.40%) on September 8, 2017, and a high of $26.69 per Share (+0.91%) on January 3, 2017. On December 29, 2017, the Fund paid a distribution of $0.02302 for each General Share and Share to holders of record as of December 19, 2017. Therefore, the total return for the Fund, on a market value basis was-9.03%.
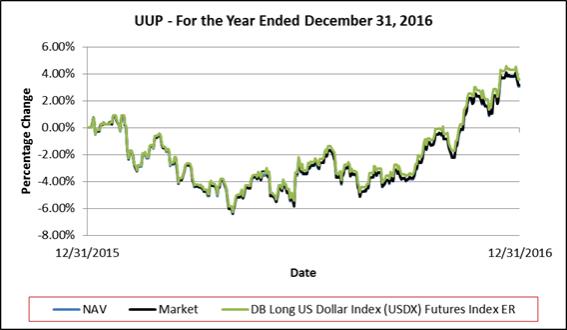
For the year ended December 31, 2016, the NYSE Arca market value of each Share increased 3.16% from $25.64 per Share to $26.45 per Share. The Share price low and high for the year ended December 31, 2016 and related change from the Share price from December 31, 2015 was as follows: Shares traded at a low of $24.01 per Share(-6.36%) on May 2, 2016, and a high of $26.70 per Share (+4.13%) on December 20, 2016. No distributions were paid to Shareholders during the year ended December 31, 2016. Therefore, the total return for the Fund, on a market value basis, was 3.16%.
Fund Share Net Asset Performance
For the year ended December 31, 2018, the NAV of each Share increased 7.31% from $24.00 per Share to $25.48 per Share. Falling currency futures contract prices for long DX Contracts during the year ended December 31, 2018 contributed to an overall 6.18% increase in the level of the Index and an 8.28% increase in the level of the LongIndex-TRTM. On December 31, 2018, the Fund paid a distribution of $0.27586 for each General Share and Share to holders of record as of December 26, 2018. Therefore, the total return for the Fund on a NAV basis was 7.31%.
Net income (loss) for the year ended December 31, 2018 was $38.8 million, resulting from $9.6 million of income, net realized gain (loss) of $29.6 million, net change in unrealized gain (loss) of $3.6 million and operating expenses of $3.9 million.
For the year ended December 31, 2017, the NAV of each Share decreased 9.11% from $26.43 per Share to $24.00 per Share. Falling currency futures contract prices for long DX Contracts during the year ended December 31, 2017 contributed to an overall 9.20% decrease in the level of the Index and to a 8.34% decrease in the level of the LongIndex-TRTM. On December 29, 2017, the Fund paid a distribution of $0.02302 for each General Share and Share to holders of record as of December 19, 2017. Therefore, the total return for the Fund on a NAV basis was-9.11%.
Net income (loss) for the year ended December 31, 2017 was $(61.7) million, resulting from $5.6 million of income, net realized gain (loss) of $(51.9) million, net change in unrealized gain (loss) of $(10.3) million and operating expenses of $5.1 million.
For the year ended December 31, 2016, the NAV of each Share increased 3.04% from $25.65 per Share to $26.43 per Share. Rising currency futures contract prices for long DX contracts during the year ended December 31, 2016 contributed to a 3.91% increase in the level of the LongIndex-TR. No distributions were paid to Shareholders during the year ended December 31, 2016. Therefore, the total return for the Fund on a NAV basis was 3.04%.
Net income (loss) for the year ended December 31, 2016 was $27.6 million, resulting from $2.3 million of income, net realized gain (loss) of $39.0 million, net change in unrealized gain (loss) of $(7.1) million and operating expenses of $6.6 million.
Critical Accounting Policies
The Fund’s critical accounting policies are as follows:
27


