Exhibit 99.2

Investor Presentation FISCAL THIRD QUARTER 2019
Forward-Looking StatementsThis presentation and other written or oral statements made from time to time by representatives of Broadridge Financial Solutions, Inc. ("Broadridge" or the "Company") may contain “forward-looking statements” within the meaning of the Private Securities Litigation Reform Act of 1995. Statements that are not historical in nature, and which may be identified by the use of words such as “expects,” “assumes,” “projects,” “anticipates,” “estimates,” “we believe,” “could be” and other words of similar meaning, are forward-looking statements. In particular, information appearing in the “Fiscal Year 2019 Guidance” section are forward-looking statements. These statements are based on management’s expectations and assumptions and are subject to risks and uncertainties that may cause actual results to differ materially from those expressed. These risks and uncertainties include those risk factors discussed in Part I, “Item 1A. Risk Factors” of our Annual Report on Form 10-K for the fiscal year ended June 30, 2018 (the “2018 Annual Report”), as they may be updated in any future reports filed with the Securities and Exchange Commission. All forward-looking statements speak only as of the date of this presentation and are expressly qualified in their entirety by reference to the factors discussed in the 2018 Annual Report.These risks include: the success of Broadridge in retaining and selling additional services to its existing clients and in obtaining new clients; Broadridge’s reliance on a relatively small number of clients, the continued financial health of those clients, and the continued use by such clients of Broadridge’s services with favorable pricing terms; a material security breach or cybersecurity attack affecting the information of Broadridge's clients; changes in laws and regulations affecting Broadridge’s clients or the services provided by Broadridge; declines in participation and activity in the securities markets; the failure of Broadridge's key service providers to provide the anticipated levels of service; a disaster or other significant slowdown or failure of Broadridge’s systems or error in the performance of Broadridge’s services; overall market and economic conditions and their impact on the securities markets; Broadridge’s failure to keep pace with changes in technology and demands of its clients; Broadridge’s ability to attract and retain key personnel; the impact of new acquisitions and divestitures; and competitive conditions. Broadridge disclaims any obligation to update or revise forward-looking statements that may be made to reflect events or circumstances that arise after the date made or to reflect the occurrence of unanticipated events, other than as required by law. Use of Material Contained HereinThe information contained in this presentation is being provided for your convenience and information only. This information is accurate as of the date of its initial presentation. If you plan to use this information for any purpose, verification of its continued accuracy is your responsibility. Broadridge assumes no duty to update or revise the information contained in this presentation. Revenue Accounting ChangeEffective July 1, 2018, Broadridge adopted Accounting Standards Update No. 2014-09 “Revenue from Contracts with Customers” and its related amendments (the “revenue accounting change”). Results for reporting periods beginning July 1, 2018 reflect the revenue accounting change while prior period amounts have not been adjusted and continue to be reported in accordance with historical accounting guidelines. For additional information related to this change please refer to the appendix of this presentation and information filed in Broadridge’s Quarterly Report on Form 10-Q for the second quarter of fiscal year 2019.
Use of Non-GAAP Financial Measures Explanation and Reconciliation of the Company’s Use of Non-GAAP Financial MeasuresThe Company’s results in this presentation are presented in accordance with U.S. generally accepted accounting principles ("GAAP") except where otherwise noted. In certain circumstances, results have been presented that are not generally accepted accounting principles measures (“Non-GAAP”). These Non-GAAP measures are Adjusted Operating income, Adjusted Operating income margin, Adjusted Net earnings, Adjusted earnings per share, and Free cash flow. These Non-GAAP financial measures should be viewed in addition to, and not as a substitute for, the Company’s reported results.The Company believes its Non-GAAP financial measures help investors understand how management plans, measures and evaluates the Company’s business performance. Management believes that Non-GAAP measures provide consistency in its financial reporting and facilitates investors’ understanding of the Company’s operating results and trends by providing an additional basis for comparison. Management uses these Non-GAAP financial measures to, among other things, evaluate the Company's ongoing operations, for internal planning and forecasting purposes and in the calculation of performance-based compensation. In addition, and as a consequence of the importance of these Non-GAAP financial measures in managing its business, the Company’s Compensation Committee of the Board of Directors incorporates Non-GAAP financial measures in the evaluation process for determining management compensation.Adjusted Operating Income, Adjusted Operating Income Margin, Adjusted Net Earnings and Adjusted Earnings per ShareThese Non-GAAP measures reflect Operating income, Operating income margin, Net earnings, and Diluted earnings per share, as adjusted to exclude the impact of certain costs, expenses, gains and losses and other specified items that management believes are not indicative of our ongoing operating performance. These adjusted measures exclude the impact of: (i) Amortization of Acquired Intangibles and Purchased Intellectual Property, (ii) Acquisition and Integration Costs and (iii) Tax Act items. Amortization of Acquired Intangibles and Purchased Intellectual Property represents non-cash amortization expenses associated with the Company's acquisition activities. Acquisition and Integration Costs represent certain transaction and integration costs associated with the Company’s acquisition activities. Tax Act items represent the net impact of a U.S. federal transition tax on earnings of certain foreign subsidiaries, foreign jurisdiction withholding taxes and certain benefits related to the remeasurement of the Company’s net U.S. federal and state deferred tax liabilities attributable to the Tax Act.The Company excludes Amortization of Acquired Intangibles and Purchased Intellectual Property as well as Acquisition and Integration Costs and Tax Act items from our earnings measures because excluding such information provides us with an understanding of the results from the primary operations of our business and these items do not reflect ordinary operations or earnings. Management believes these adjusted measures may be useful to an investor in evaluating the underlying operating performance of our business.Free Cash FlowIn addition to the Non-GAAP financial measures discussed above, we provide Free cash flow information because we consider Free cash flow to be a liquidity measure that provides useful information to management and investors about the amount of cash generated that could be used for dividends, share repurchases, strategic acquisitions, other investments, as well as debt servicing. Free cash flow is a Non-GAAP financial measure and is defined by the Company as Net cash flows provided by operating activities less Capital expenditures as well as Software purchases and capitalized internal use software.Reconciliations of such Non-GAAP measures to the most directly comparable financial measures presented in accordance with GAAP can be found in the tables that are part of this presentation.
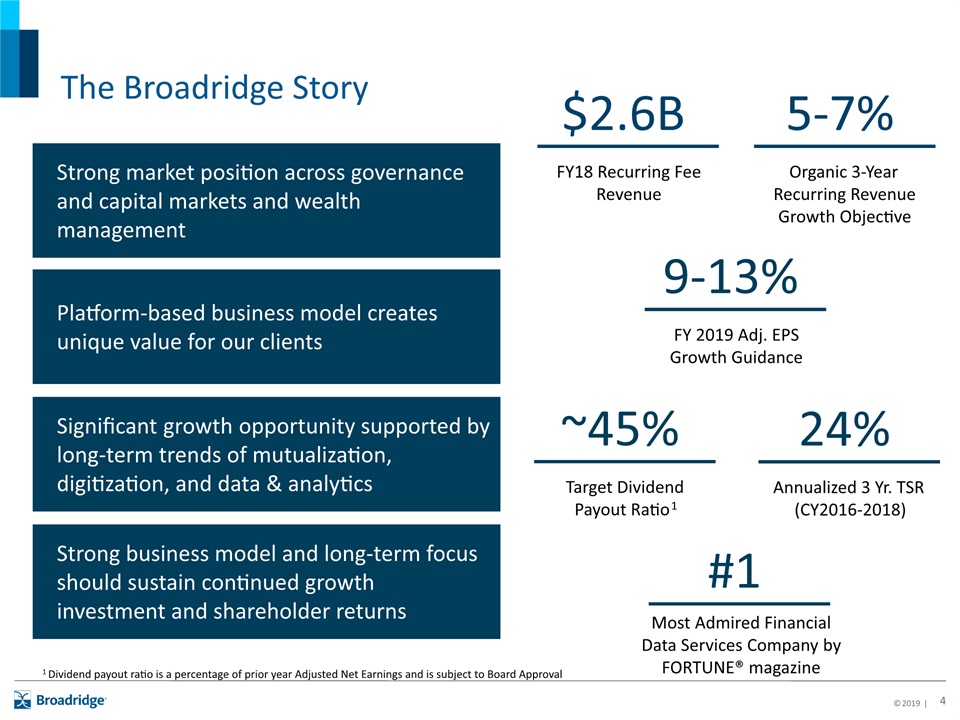
The Broadridge Story Strong market position across governance and capital markets and wealth management Platform-based business model creates unique value for our clients Significant growth opportunity supported by long-term trends of mutualization, digitization, and data & analytics Strong business model and long-term focus should sustain continued growth investment and shareholder returns ~45% Target Dividend Payout Ratio1 $2.6B FY18 Recurring Fee Revenue 5-7% Organic 3-Year Recurring Revenue Growth Objective 9-13% FY 2019 Adj. EPS Growth Guidance 24% Annualized 3 Yr. TSR (CY2016-2018) 1 Dividend payout ratio is a percentage of prior year Adjusted Net Earnings and is subject to Board Approval #1 Most Admired Financial Data Services Company by FORTUNE® magazine
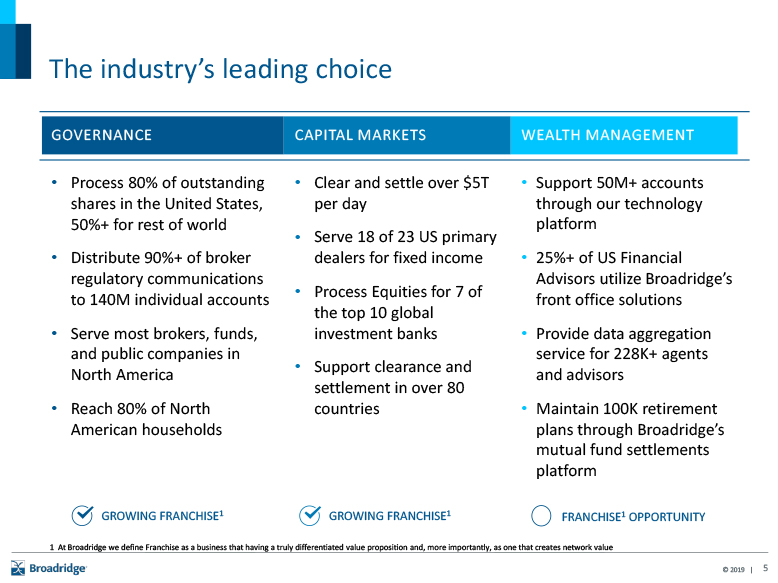
The industry’s leading choice Governance Capital Markets Wealth Management Process 80% of outstanding shares in the United States, 50%+ for rest of worldDistribute 90%+ of broker regulatory communications to 140M individual accounts Serve most brokers, funds, and public companies in North AmericaReach 80% of North American households Clear and settle over $5T per day Serve 18 of 23 US primary dealers for fixed income Process Equities for 7 of the top 10 global investment banksSupport clearance and settlement in over 80 countries Support 50M+ accounts through our technology platform 25%+ of US Financial Advisors utilize Broadridge’s front office solutionsProvide data aggregation service for 228K+ agents and advisorsMaintain 100K retirement plans through Broadridge’s mutual fund settlements platform GROWING FRANCHISE1 GROWING FRANCHISE1 FRANCHISE1 OPPORTUNITY 1 At Broadridge we define Franchise as a business that having a truly differentiated value proposition and, more importantly, as one that creates network value
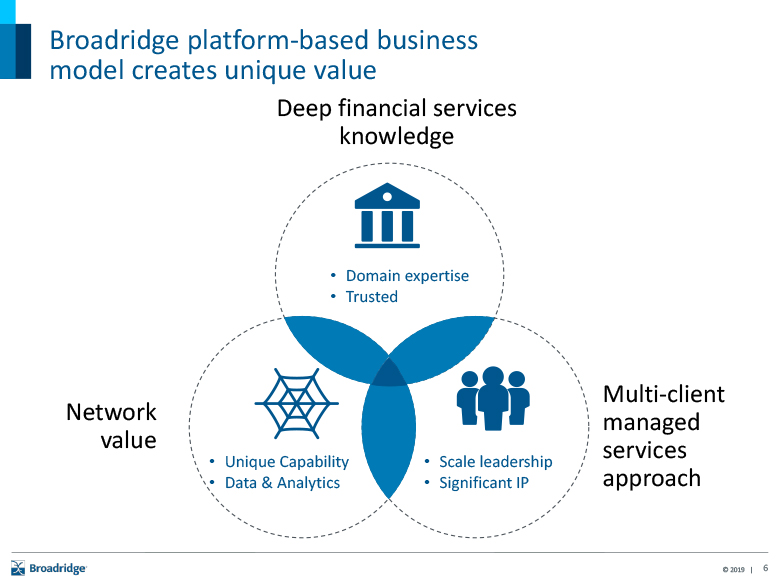
Broadridge platform-based business model creates unique value Network value Deep financial services knowledge Multi-client managed services approach Domain expertiseTrusted Unique CapabilityData & Analytics Scale leadershipSignificant IP

Broadridge’s directly addressable market is $25-40B Key Market Trends GOVERNANCE & COMMUNICATIONS WEALTH MANAGEMENT CAPITAL MARKETS 100% = $25-40B DATA & ANALYTICS DIGITIZATION MUTUALIZATION Large Growth Opportunity
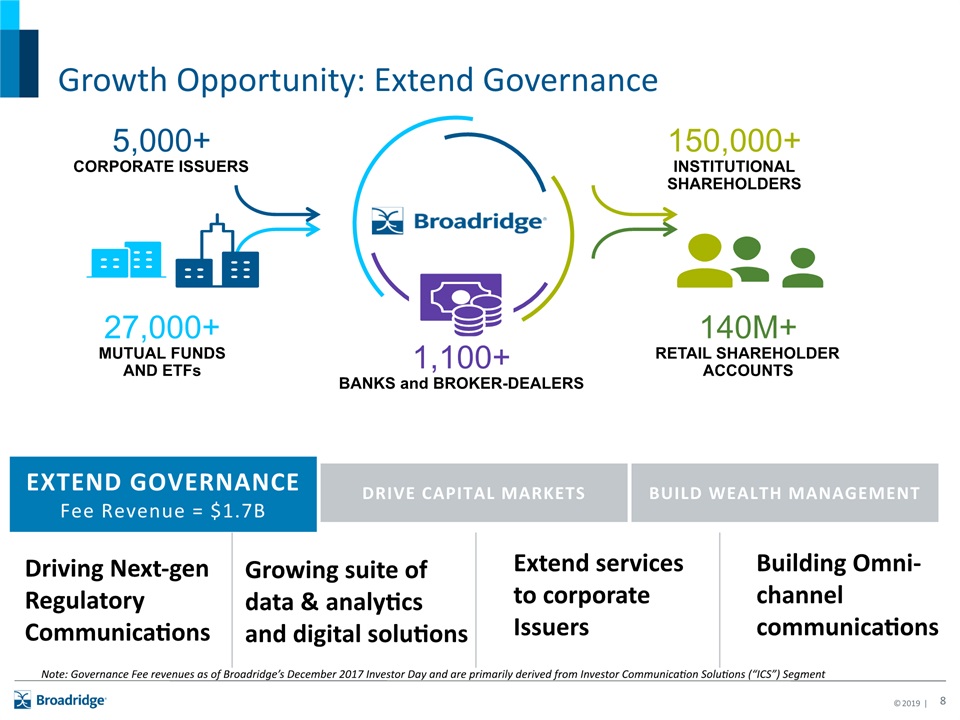
Growth Opportunity: Extend Governance 140M+RETAIL SHAREHOLDER ACCOUNTS 150,000+INSTITUTIONAL SHAREHOLDERS 27,000+ MUTUAL FUNDS AND ETFs 1,100+ BANKS and BROKER-DEALERS 5,000+CORPORATE ISSUERS EXTEND GOVERNANCEFee Revenue = $1.7B BUILD WEALTH MANAGEMENT DRIVE CAPITAL MARKETS Driving Next-gen Regulatory Communications Extend services to corporate Issuers Growing suite of data & analytics and digital solutions Building Omni-channel communications Note: Governance Fee revenues as of Broadridge’s December 2017 Investor Day and are primarily derived from Investor Communication Solutions (“ICS”) Segment
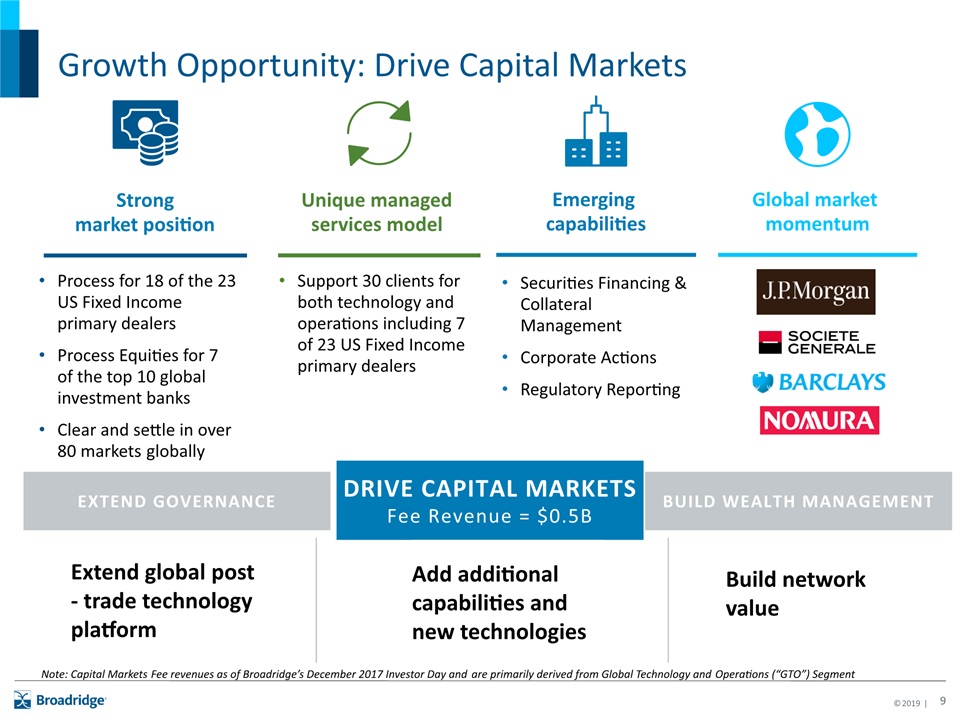
Growth Opportunity: Drive Capital Markets Process for 18 of the 23 US Fixed Income primary dealersProcess Equities for 7 of the top 10 global investment banksClear and settle in over 80 markets globally Strong market position Support 30 clients for both technology and operations including 7 of 23 US Fixed Income primary dealers Unique managed services model Securities Financing & Collateral Management Corporate ActionsRegulatory Reporting Emerging capabilities Global market momentum EXTEND GOVERNANCE BUILD WEALTH MANAGEMENT DRIVE CAPITAL MARKETSFee Revenue = $0.5B Extend global post- trade technology platform Add additional capabilities and new technologies Build network value Note: Capital Markets Fee revenues as of Broadridge’s December 2017 Investor Day and are primarily derived from Global Technology and Operations (“GTO”) Segment
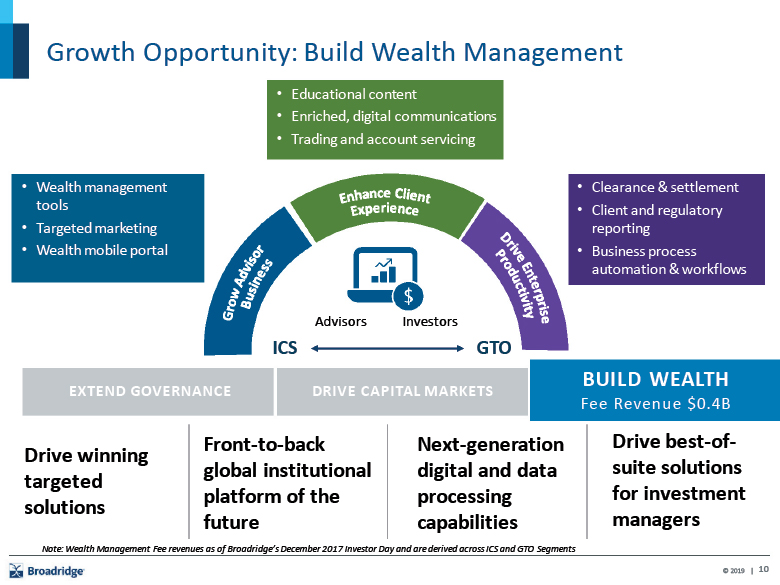
Growth Opportunity: Build Wealth Management Grow AdvisorBusiness Enhance ClientExperience Drive EnterpriseProductivity Advisors Investors Wealth management tools Targeted marketing Wealth mobile portal Educational content Enriched, digital communicationsTrading and account servicing Clearance & settlement Client and regulatory reportingBusiness process automation & workflows EXTEND GOVERNANCE BUILD WEALTHFee Revenue $0.4B DRIVE CAPITAL MARKETS Drive winning targeted solutions Front-to-back global institutional platform of the future Next-generation digital and data processing capabilities Drive best-of-suite solutions for investment managers GTO ICS Note: Wealth Management Fee revenues as of Broadridge’s December 2017 Investor Day and are derived across ICS and GTO Segments
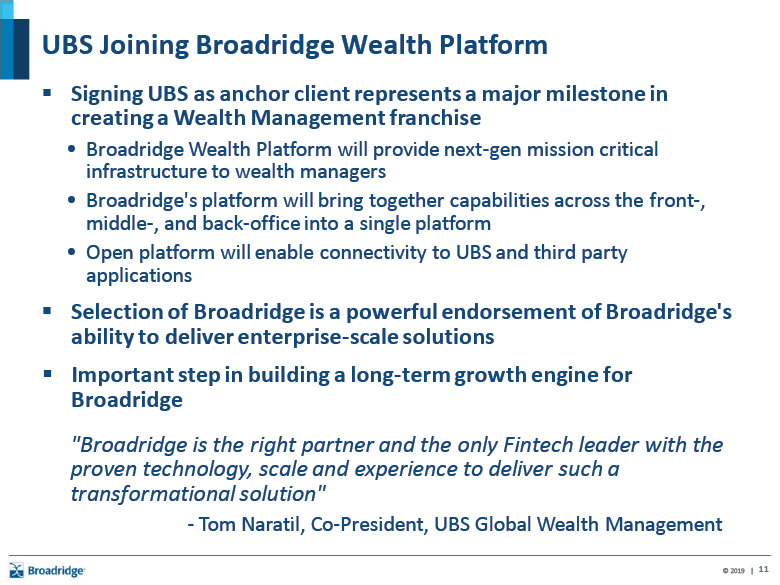
UBS Joining Broadridge Wealth PlatformSigning UBS as anchor client represents a major milestone in creating a Wealth Management franchiseBroadridge Wealth Platform will provide next-gen mission critical infrastructure to wealth managersBroadridge's platform will bring together capabilities across the front-, middle-, and back-office into a single platformOpen platform will enable connectivity to UBS and third party applicationsSelection of Broadridge is a powerful endorsement of Broadridge's ability to deliver enterprise-scale solutions Important step in building a long-term growth engine for Broadridge "Broadridge is the right partner and the only Fintech leader with the proven technology, scale and experience to deliver such a transformational solution" - Tom Naratil, Co-President, UBS Global Wealth Management
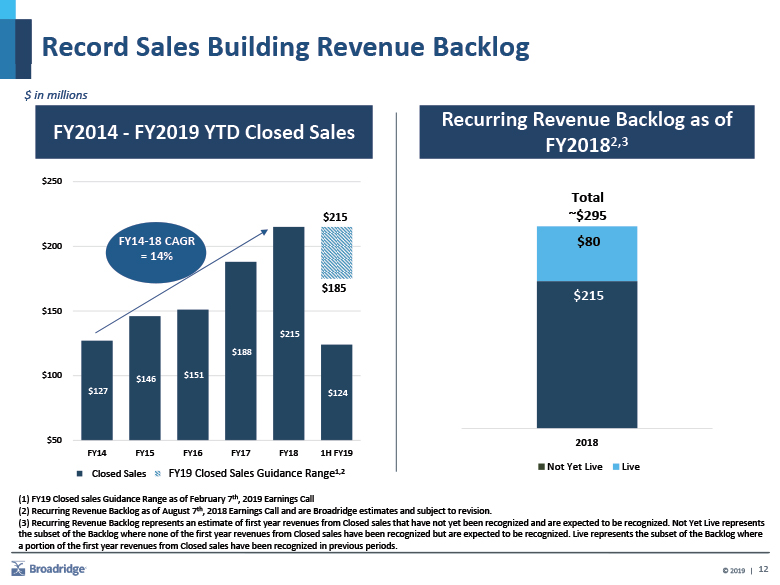
Record Sales Building Revenue Backlog FY2014 - FY2019 YTD Closed Sales Recurring Revenue Backlog as of FY20182,3 (1) FY19 Closed sales Guidance Range as of February 7th, 2019 Earnings Call(2) Recurring Revenue Backlog as of August 7th, 2018 Earnings Call and are Broadridge estimates and subject to revision. (3) Recurring Revenue Backlog represents an estimate of first year revenues from Closed sales that have not yet been recognized and are expected to be recognized. Not Yet Live represents the subset of the Backlog where none of the first year revenues from Closed sales have been recognized but are expected to be recognized. Live represents the subset of the Backlog where a portion of the first year revenues from Closed sales have been recognized in previous periods. $ in millions
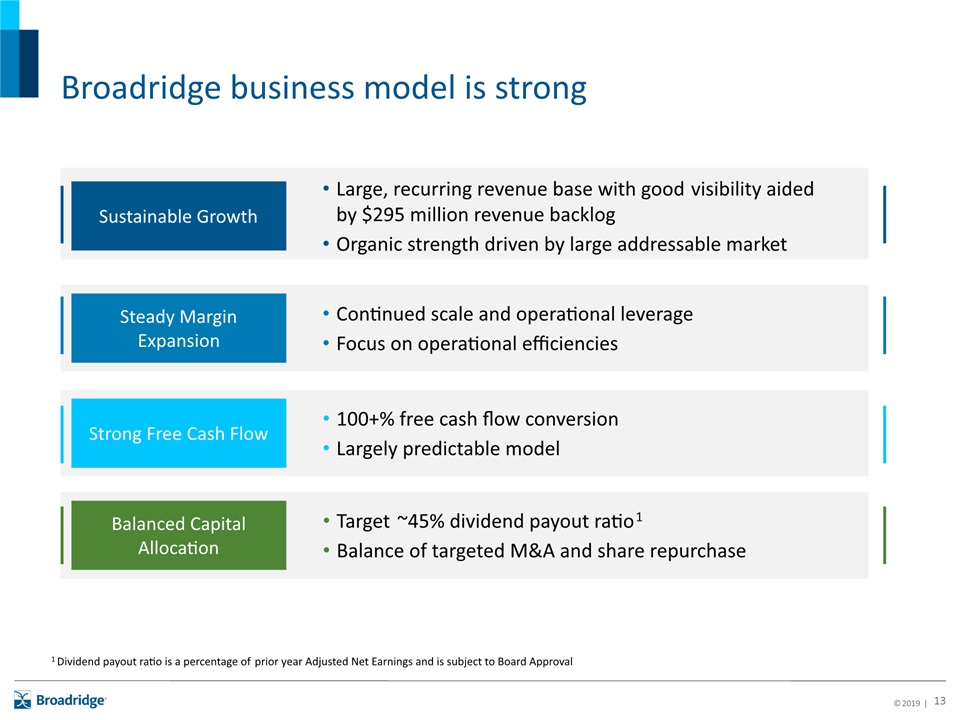
Broadridge business model is strong Sustainable Growth Large, recurring revenue base with good visibility aided by $295 million revenue backlogOrganic strength driven by large addressable market Steady Margin Expansion Continued scale and operational leverageFocus on operational efficiencies Strong Free Cash Flow 100+% free cash flow conversionLargely predictable model Balanced Capital Allocation Target ~45% dividend payout ratio1Balance of targeted M&A and share repurchase 1 Dividend payout ratio is a percentage of prior year Adjusted Net Earnings and is subject to Board Approval
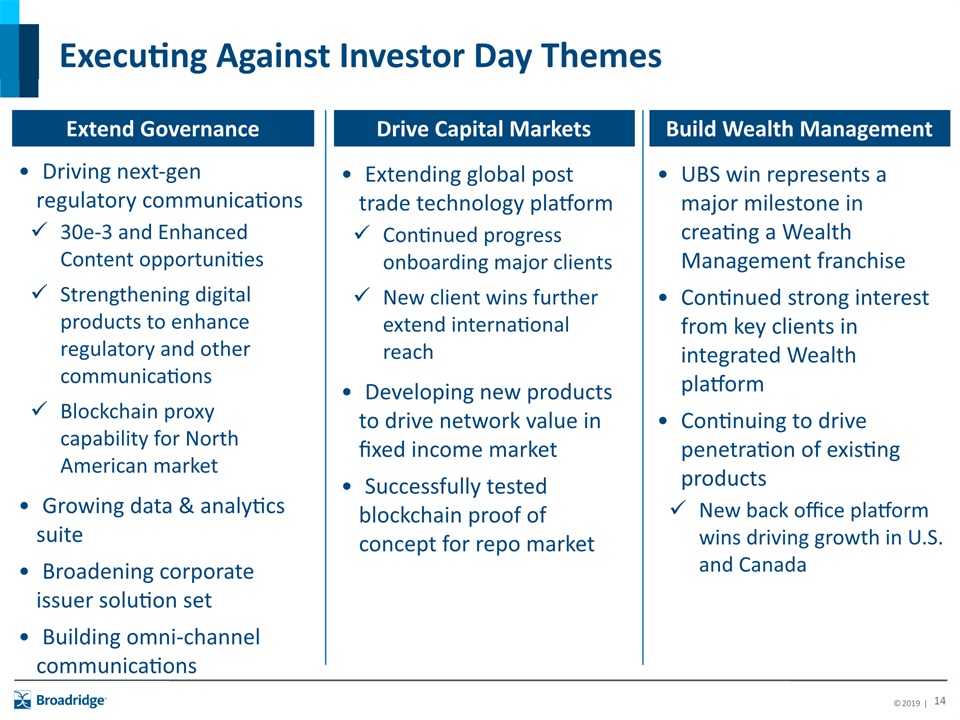
Driving next-gen regulatory communications30e-3 and Enhanced Content opportunitiesStrengthening digital products to enhance regulatory and other communicationsBlockchain proxy capability for North American market Growing data & analytics suiteBroadening corporate issuer solution setBuilding omni-channel communications Extending global post trade technology platform Continued progress onboarding major clientsNew client wins further extend international reachDeveloping new products to drive network value in fixed income marketSuccessfully tested blockchain proof of concept for repo market UBS win represents a major milestone in creating a Wealth Management franchise Continued strong interest from key clients in integrated Wealth platformContinuing to drive penetration of existing products New back office platform wins driving growth in U.S. and Canada Extend Governance Drive Capital Markets Build Wealth Management Executing Against Investor Day Themes
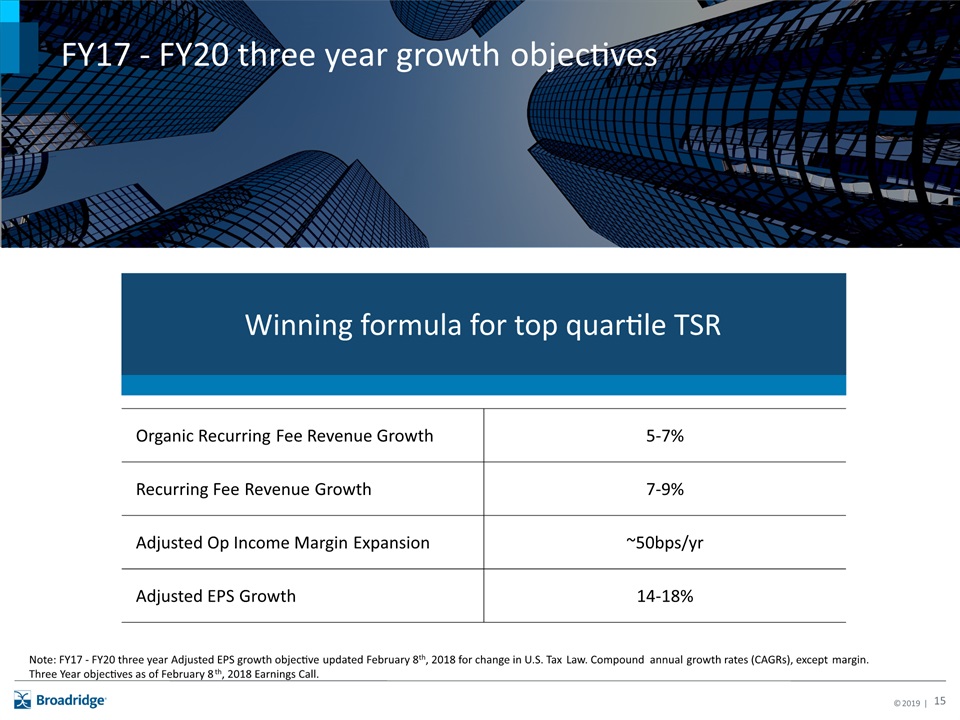
Organic Recurring Fee Revenue Growth 5-7% Recurring Fee Revenue Growth 7-9% Adjusted Op Income Margin Expansion ~50bps/yr Adjusted EPS Growth 14-18% Winning formula for top quartile TSR FY17 - FY20 three year growth objectives Note: FY17 - FY20 three year Adjusted EPS growth objective updated February 8th, 2018 for change in U.S. Tax Law. Compound annual growth rates (CAGRs), except margin. Three Year objectives as of February 8th, 2018 Earnings Call.

Regulatory Update June 2018SEC Approves 30e-3“Notice-and-access” Allows mutual funds to opt-in their shareholders to receive “notice-and-access” beginning in 2021Preference management solution delivered December 2018Financial impact: higher recurring fee revenues, lower distribution revenues, modestly net positive impact on gross profit October 2018Comments on mutual fund interim fees Potential review of approximately $150 million of BR fee revenueBR comment letter laid out strong track record of value ($400M+ annually) delivered. Additional future savings identified.Comments only – no timeframe for decision on fee review, if anyFee reviews generally have been lengthy processes October 2018Comments on modernization of mutual fund communications November 2018Proxy Roundtable SEC asked for comments on how to modernize and improve the design, delivery and content of fund managementOpportunity for BR to showcase capabilities to enhance shareholder engagement while lowering costs through digital and technology capabilities SEC gathered various constituents to talk about all aspects of the proxy voting processSignificant interest in examining voter confirmation capabilities Mutual funds Equity proxy
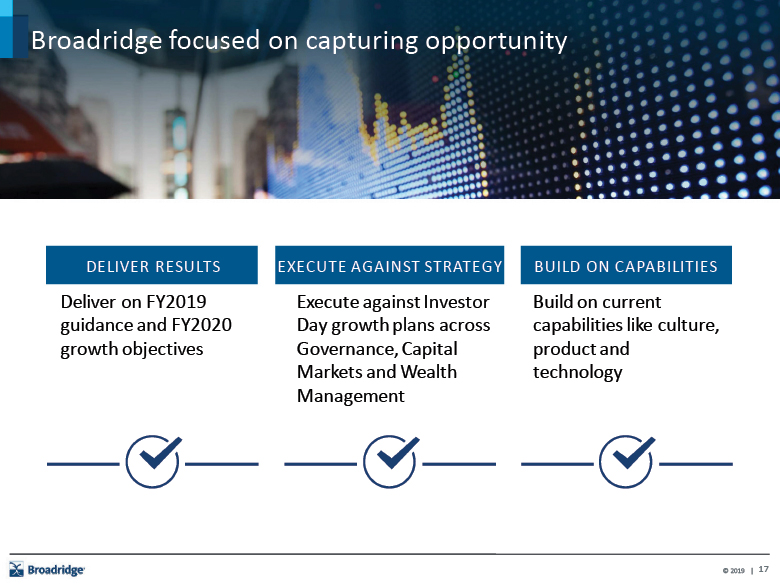
Deliver on FY2019 guidance and FY2020 growth objectives Deliver results Build on current capabilities like culture, product and technology Build on capabilities Execute against Investor Day growth plans across Governance, Capital Markets and Wealth Management Execute against strategy Broadridge focused on capturing opportunity
Fiscal Year 2018 and Second Quarter 2019 Financial Summary as of February 7th 2019 Earnings Call:

Business Update2Q record Closed sales of $106 million in second quarter Year to date Closed sales of $124 million, up 102% Strong Closed sales result even excluding UBS sale Pipeline remains strongICS Recurring fee revenues up 10%25% Recurring fee revenue growth ex-Customer Communications driven by higher mutual fund interims, data-driven services and stock record growthEvent-driven revenues down 51% as expected from near-record second quarter 2018GTO Revenues up 4%Longer implementation times on recent sales wins creating modest lull in growthInvestments underway to support long-term growth outlook
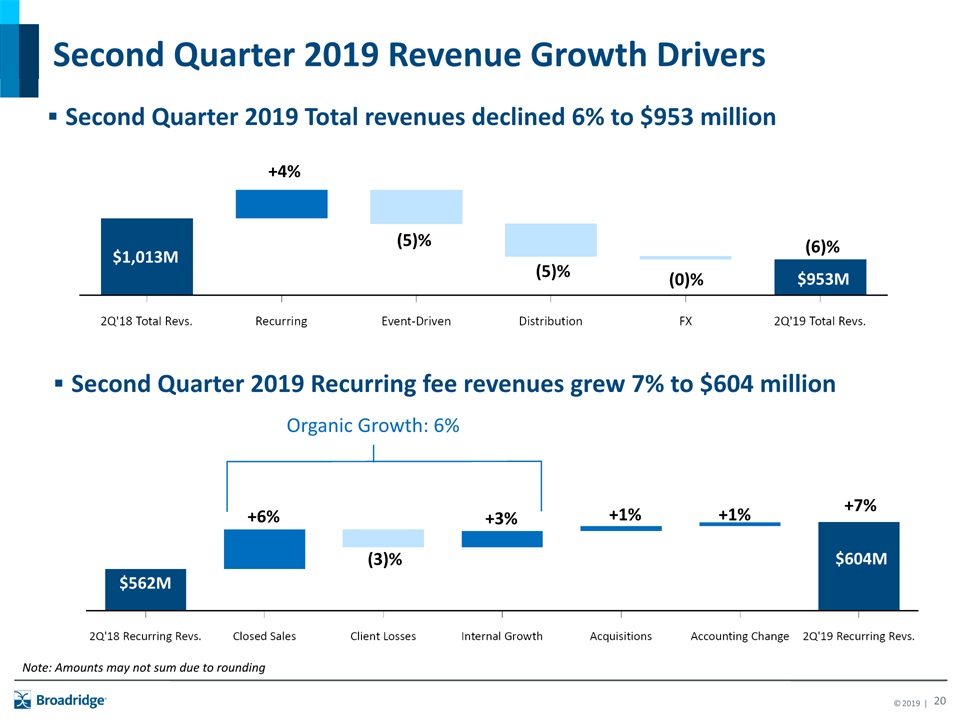
Second Quarter 2019 Revenue Growth Drivers Second Quarter 2019 Recurring fee revenues grew 7% to $604 million Second Quarter 2019 Total revenues declined 6% to $953 million $953M +4% (5)% (5)% (0)% $1,013M $562M $604M +1% +6% (3)% +3% +7% (6)% Note: Amounts may not sum due to rounding Organic Growth: 6% +1%
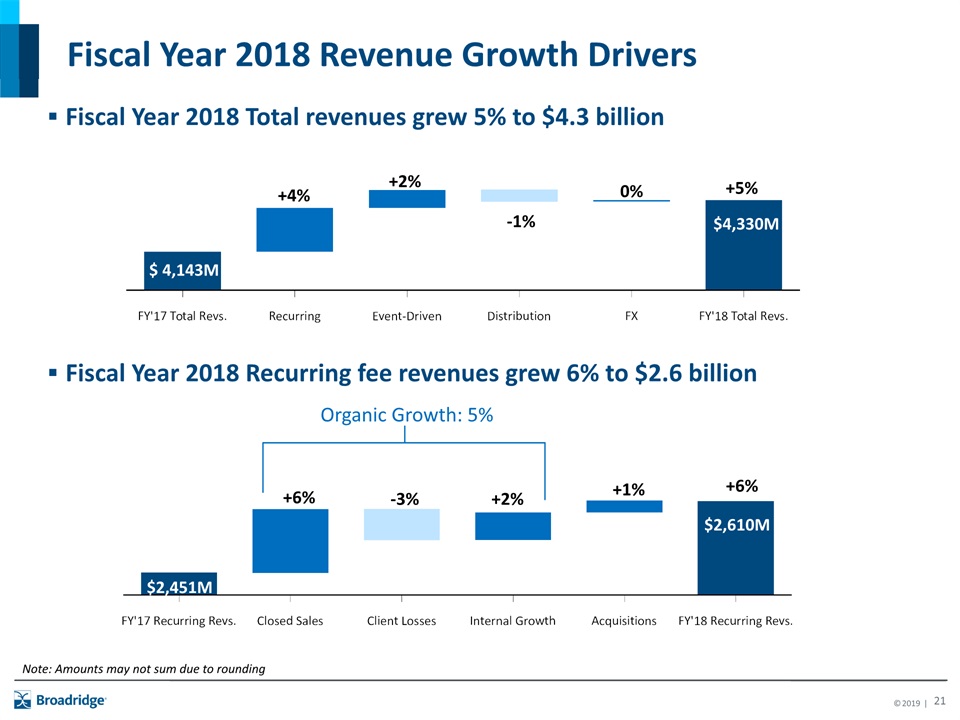
Fiscal Year 2018 Revenue Growth Drivers Fiscal Year 2018 Recurring fee revenues grew 6% to $2.6 billion Fiscal Year 2018 Total revenues grew 5% to $4.3 billion $4,330M +4% +2% -1% 0% $ 4,143M $2,451M $2,610M +6% -3% +2% +1% +6% +5% Note: Amounts may not sum due to rounding Organic Growth: 5%
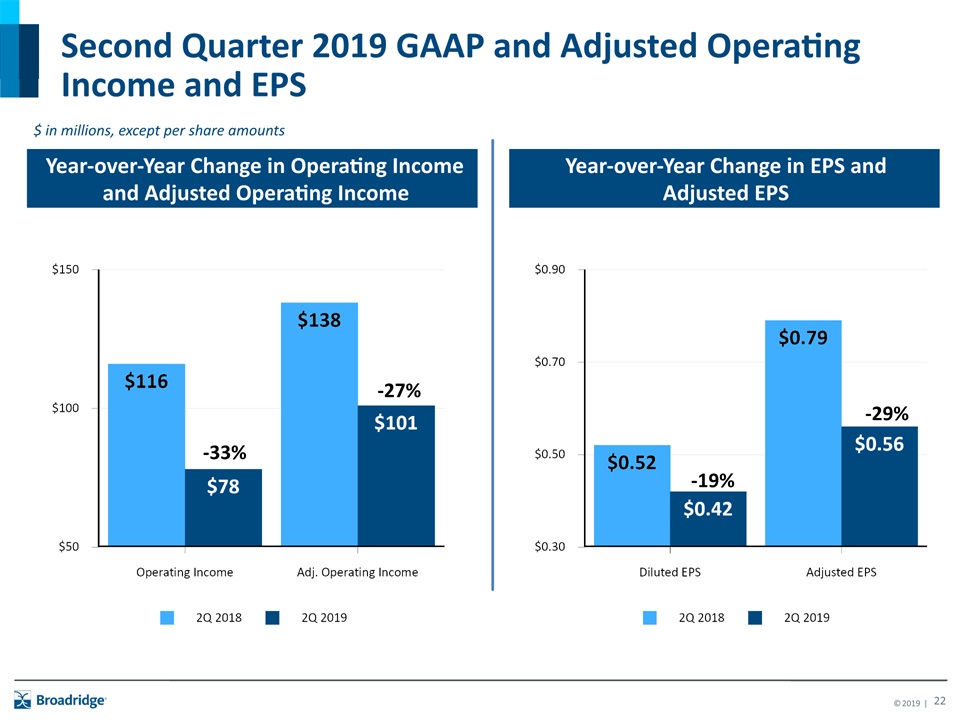
Second Quarter 2019 GAAP and Adjusted Operating Income and EPS $ in millions, except per share amounts Year-over-Year Change in Operating Income and Adjusted Operating Income Year-over-Year Change in EPS and Adjusted EPS -27% -33% -29% -19%
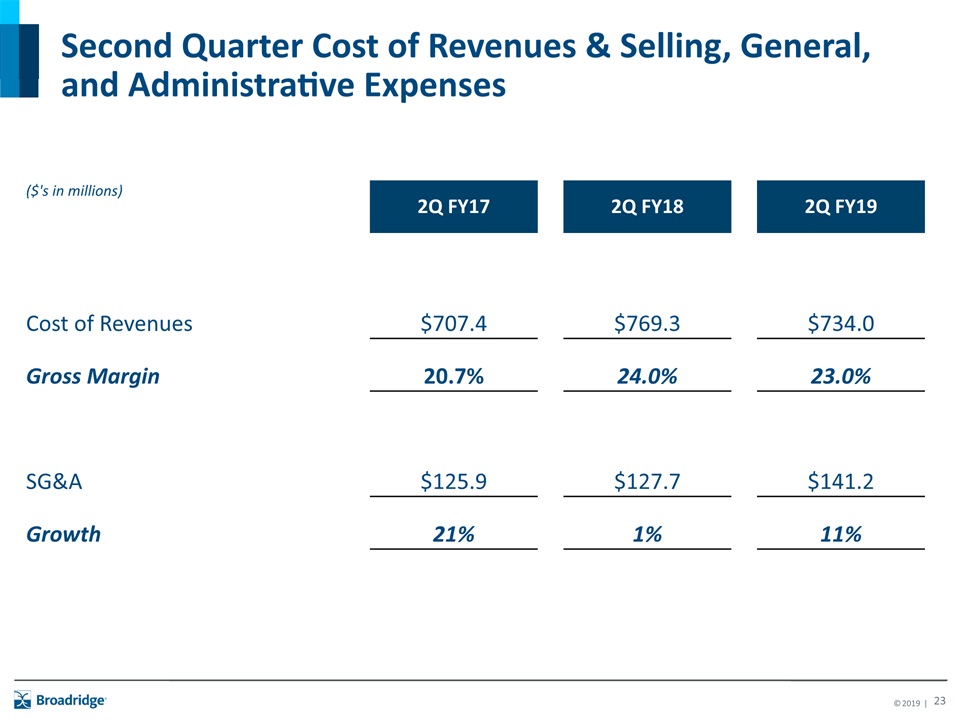
Second Quarter Cost of Revenues & Selling, General, and Administrative Expenses ($'s in millions) 2Q FY17 2Q FY18 2Q FY19 Cost of Revenues $707.4 $769.3 $734.0 Gross Margin 20.7% 24.0% 23.0% SG&A $125.9 $127.7 $141.2 Growth 21% 1% 11%
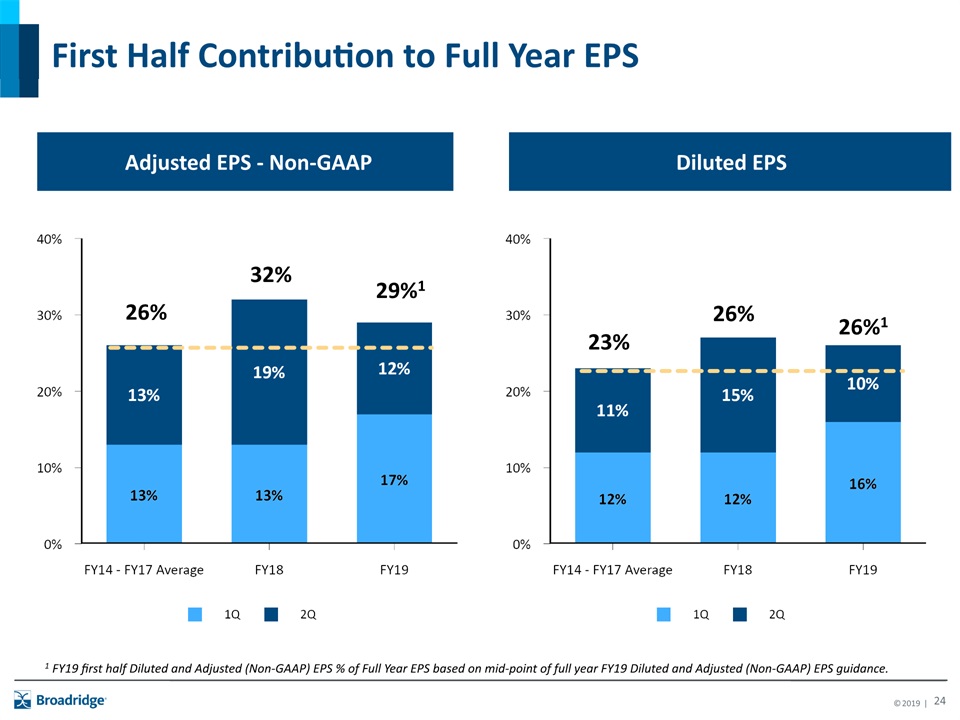
First Half Contribution to Full Year EPS 32% 29%1 26% 1 FY19 first half Diluted and Adjusted (Non-GAAP) EPS % of Full Year EPS based on mid-point of full year FY19 Diluted and Adjusted (Non-GAAP) EPS guidance. Diluted EPS Adjusted EPS - Non-GAAP 26% 26%1 23%
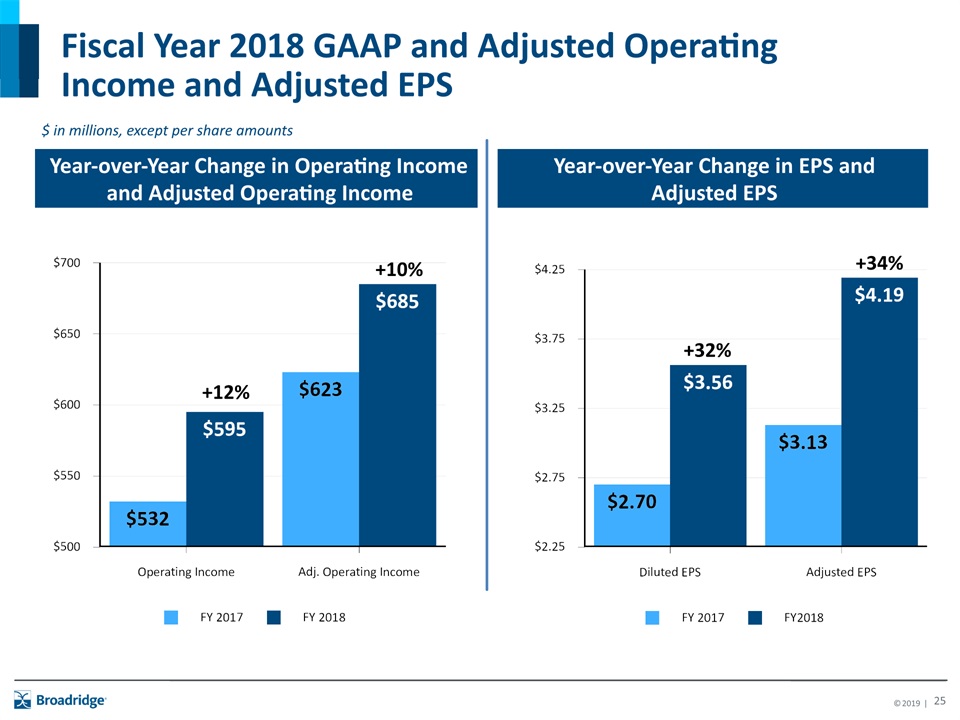
Fiscal Year 2018 GAAP and Adjusted Operating Income and Adjusted EPS $ in millions, except per share amounts Year-over-Year Change in Operating Income and Adjusted Operating Income Year-over-Year Change in EPS and Adjusted EPS +10% +12% +34% +32%
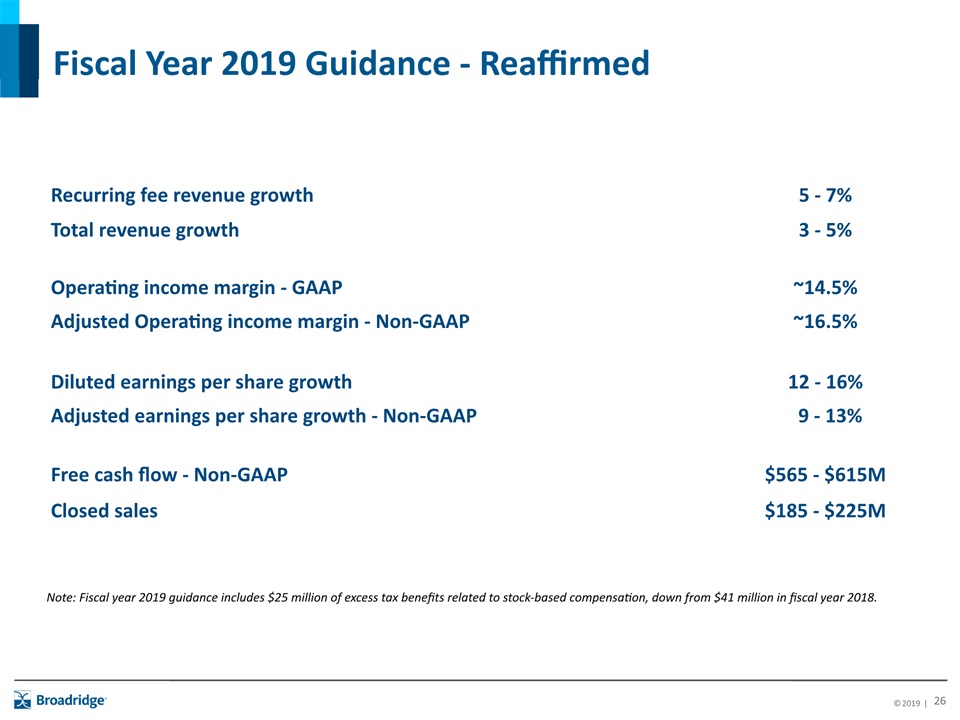
Fiscal Year 2019 Guidance - Reaffirmed Recurring fee revenue growth 5 - 7% Total revenue growth 3 - 5% Operating income margin - GAAP ~14.5% Adjusted Operating income margin - Non-GAAP ~16.5% Diluted earnings per share growth 12 - 16% Adjusted earnings per share growth - Non-GAAP 9 - 13% Free cash flow - Non-GAAP $565 - $615M Closed sales $185 - $225M Note: Fiscal year 2019 guidance includes $25 million of excess tax benefits related to stock-based compensation, down from $41 million in fiscal year 2018.
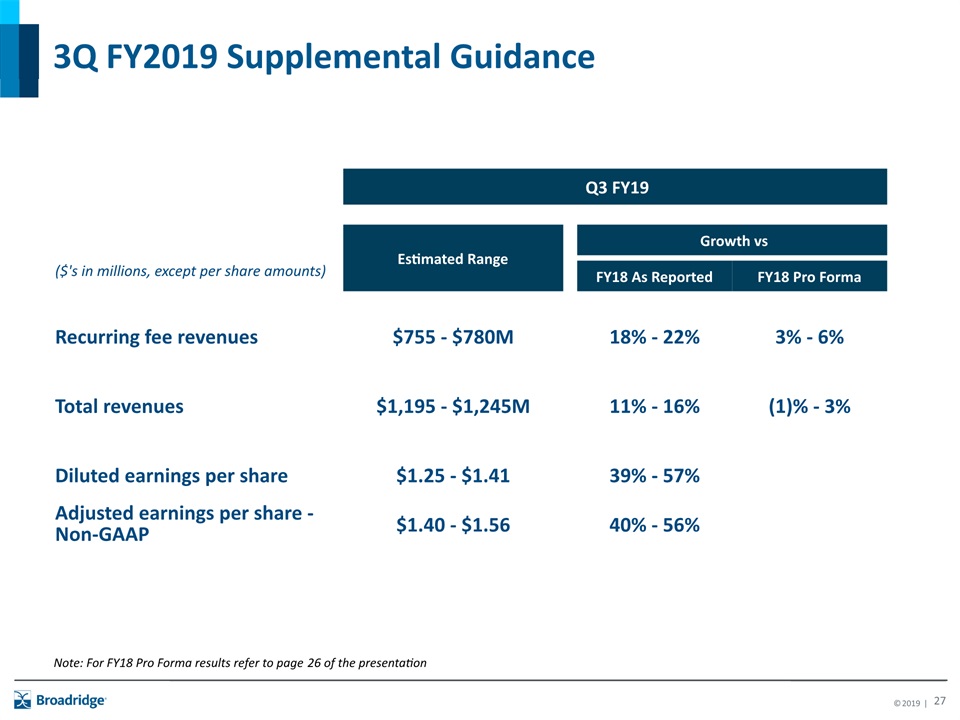
3Q FY2019 Supplemental Guidance Q3 FY19 Estimated Range Growth vs ($'s in millions, except per share amounts) FY18 As Reported FY18 Pro Forma Recurring fee revenues $755 - $780M 18% - 22% 3% - 6% Total revenues $1,195 - $1,245M 11% - 16% (1)% - 3% Diluted earnings per share $1.25 - $1.41 39% - 57% Adjusted earnings per share - Non-GAAP $1.40 - $1.56 40% - 56% Note: For FY18 Pro Forma results refer to page 26 of the presentation
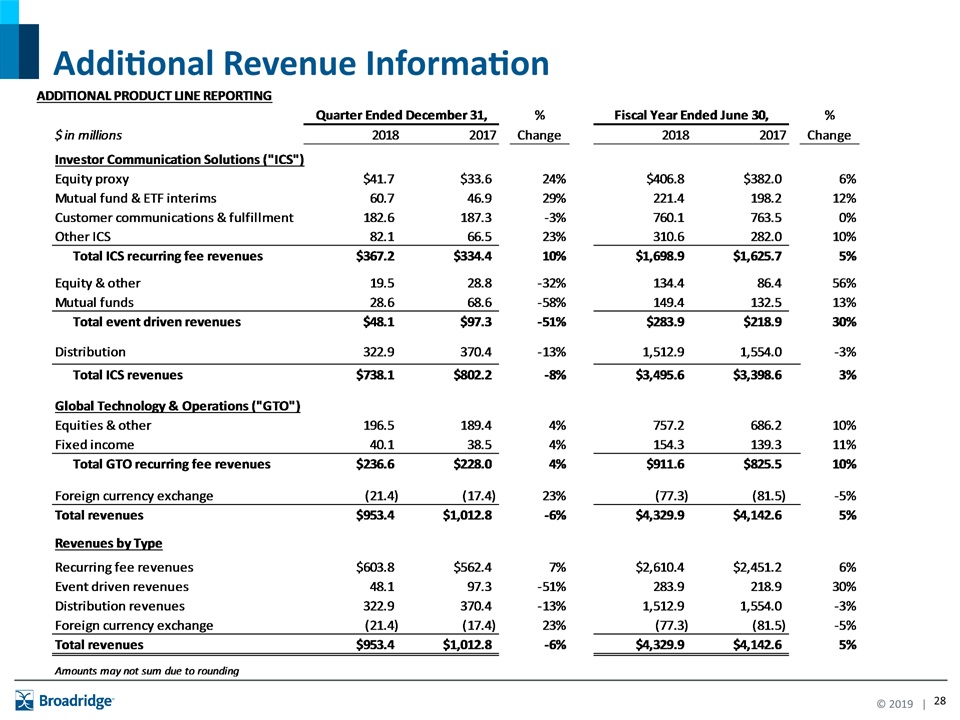
Additional Revenue Information
Appendix
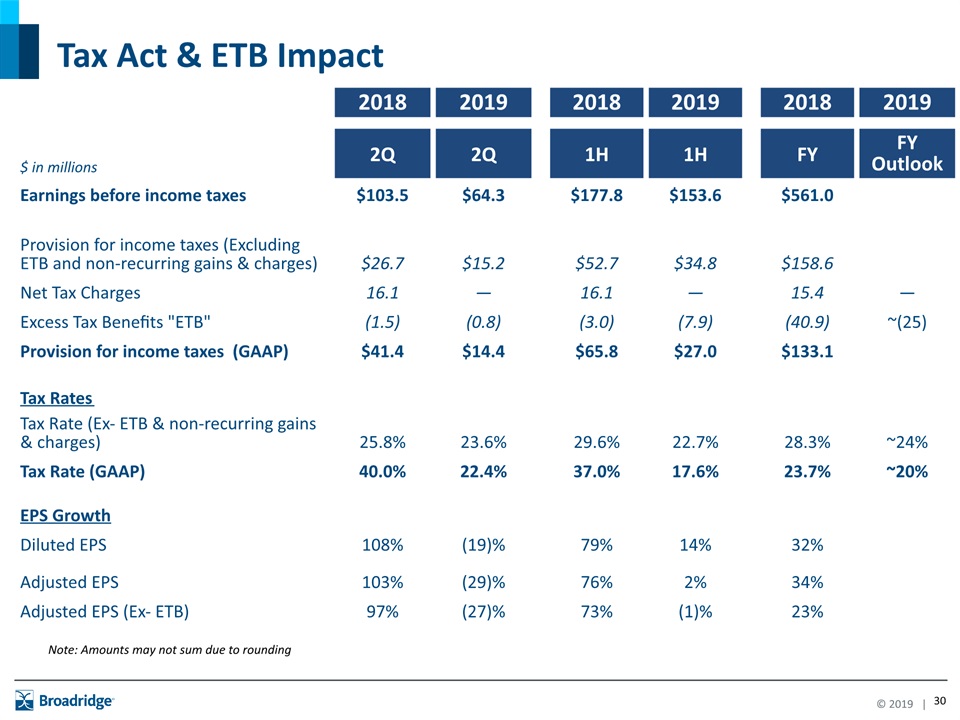
Tax Act & ETB Impact 2018 2019 2018 2019 2018 2019 $ in millions 2Q 2Q 1H 1H FY FY Outlook Earnings before income taxes $103.5 $64.3 $177.8 $153.6 $561.0 Provision for income taxes (Excluding ETB and non-recurring gains & charges) $26.7 $15.2 $52.7 $34.8 $158.6 Net Tax Charges 16.1 — 16.1 — 15.4 — Excess Tax Benefits "ETB" (1.5) (0.8) (3.0) (7.9) (40.9) ~(25) Provision for income taxes (GAAP) $41.4 $14.4 $65.8 $27.0 $133.1 Tax Rates Tax Rate (Ex- ETB & non-recurring gains & charges) 25.8% 23.6% 29.6% 22.7% 28.3% ~24% Tax Rate (GAAP) 40.0% 22.4% 37.0% 17.6% 23.7% ~20% EPS Growth Diluted EPS 108% (19)% 79% 14% 32% Adjusted EPS 103% (29)% 76% 2% 34% Adjusted EPS (Ex- ETB) 97% (27)% 73% (1)% 23% Note: Amounts may not sum due to rounding
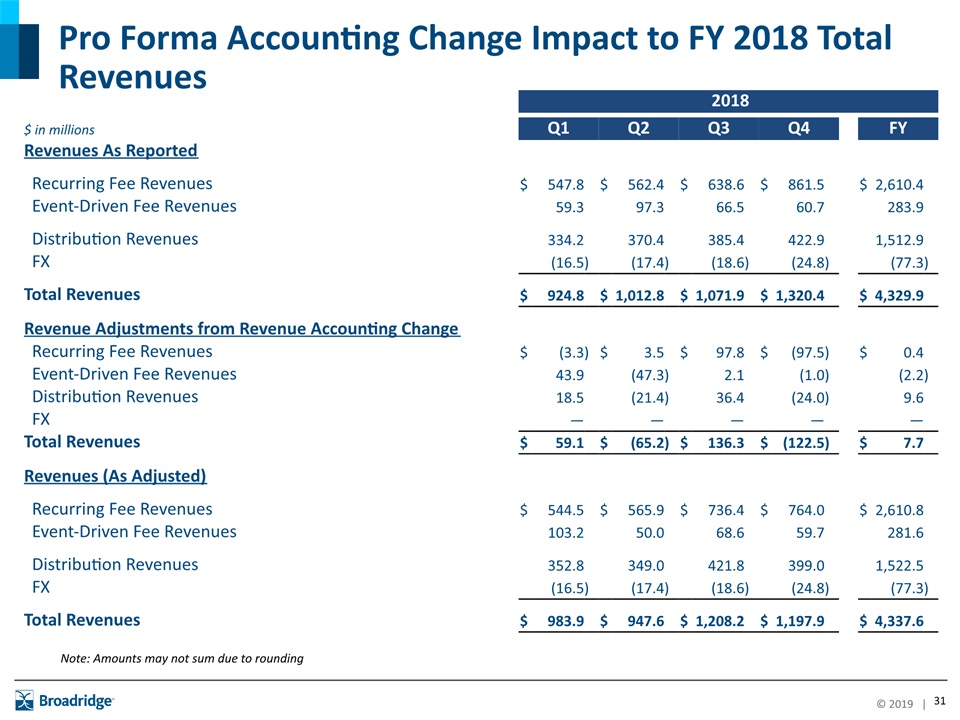
2018 2018 $ in millions Q1 Q1 Q2 Q2 Q3 Q3 Q4 Q4 FY FY Revenues As Reported Recurring Fee Revenues $ 547.8 $ 562.4 $ 638.6 $ 861.5 $ 2,610.4 Event-Driven Fee Revenues 59.3 97.3 66.5 60.7 283.9 Distribution Revenues 334.2 370.4 385.4 422.9 1,512.9 FX (16.5 ) (17.4 ) (18.6 ) (24.8 ) (77.3 ) Total Revenues $ 924.8 $ 1,012.8 $ 1,071.9 $ 1,320.4 $ 4,329.9 Revenue Adjustments from Revenue Accounting Change Recurring Fee Revenues $ (3.3 ) $ 3.5 $ 97.8 $ (97.5 ) $ 0.4 Event-Driven Fee Revenues 43.9 (47.3 ) 2.1 (1.0 ) (2.2 ) Distribution Revenues 18.5 (21.4 ) 36.4 (24.0 ) 9.6 FX — — — — — Total Revenues $ 59.1 $ (65.2 ) $ 136.3 $ (122.5 ) $ 7.7 Revenues (As Adjusted) Recurring Fee Revenues $ 544.5 $ 565.9 $ 736.4 $ 764.0 $ 2,610.8 Event-Driven Fee Revenues 103.2 50.0 68.6 59.7 281.6 Distribution Revenues 352.8 349.0 421.8 399.0 1,522.5 FX (16.5 ) (17.4 ) (18.6 ) (24.8 ) (77.3 ) Total Revenues $ 983.9 $ 947.6 $ 1,208.2 $ 1,197.9 $ 4,337.6 Pro Forma Accounting Change Impact to FY 2018 Total Revenues Note: Amounts may not sum due to rounding
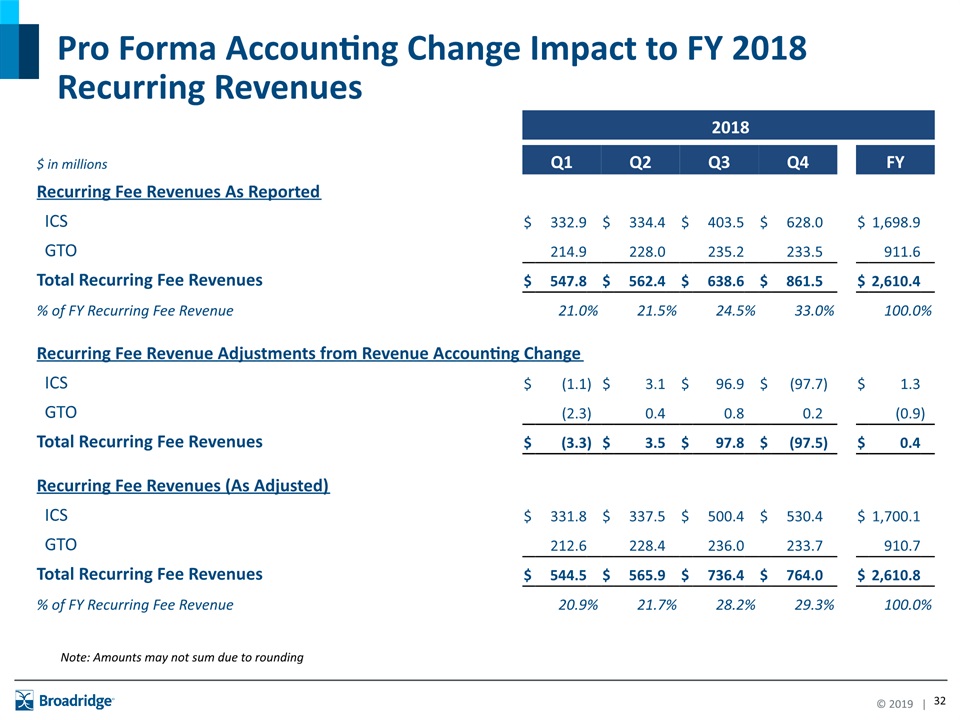
Pro Forma Accounting Change Impact to FY 2018 Recurring Revenues 2018 2018 $ in millions Q1 Q1 Q2 Q2 Q3 Q3 Q4 Q4 FY FY Recurring Fee Revenues As Reported ICS $ 332.9 $ 334.4 $ 403.5 $ 628.0 $ 1,698.9 GTO 214.9 228.0 235.2 233.5 911.6 Total Recurring Fee Revenues $ 547.8 $ 562.4 $ 638.6 $ 861.5 $ 2,610.4 % of FY Recurring Fee Revenue 21.0 % 21.5 % 24.5 % 33.0 % 100.0 % Recurring Fee Revenue Adjustments from Revenue Accounting Change ICS $ (1.1 ) $ 3.1 $ 96.9 $ (97.7 ) $ 1.3 GTO (2.3 ) 0.4 0.8 0.2 (0.9 ) Total Recurring Fee Revenues $ (3.3 ) $ 3.5 $ 97.8 $ (97.5 ) $ 0.4 Recurring Fee Revenues (As Adjusted) ICS $ 331.8 $ 337.5 $ 500.4 $ 530.4 $ 1,700.1 GTO 212.6 228.4 236.0 233.7 910.7 Total Recurring Fee Revenues $ 544.5 $ 565.9 $ 736.4 $ 764.0 $ 2,610.8 % of FY Recurring Fee Revenue 20.9 % 21.7 % 28.2 % 29.3 % 100.0 % Note: Amounts may not sum due to rounding
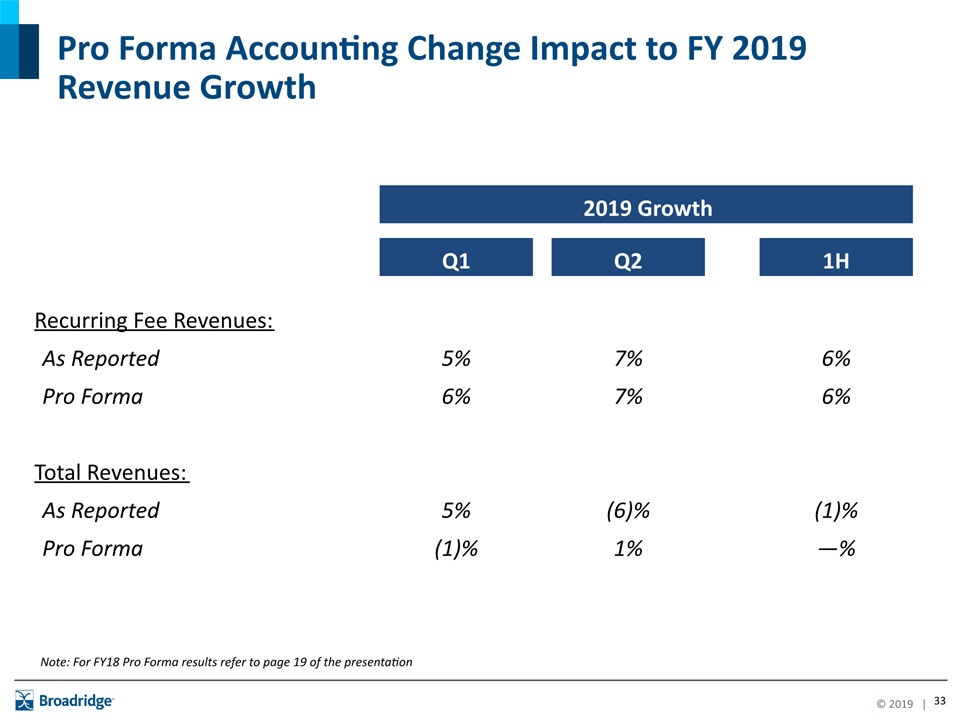
Pro Forma Accounting Change Impact to FY 2019 Revenue Growth 2019 Growth Q1 Q2 1H Recurring Fee Revenues: As Reported 5% 7% 6% Pro Forma 6% 7% 6% Total Revenues: As Reported 5% (6)% (1)% Pro Forma (1)% 1% —% Note: For FY18 Pro Forma results refer to page 19 of the presentation
GAAP Reconciliations
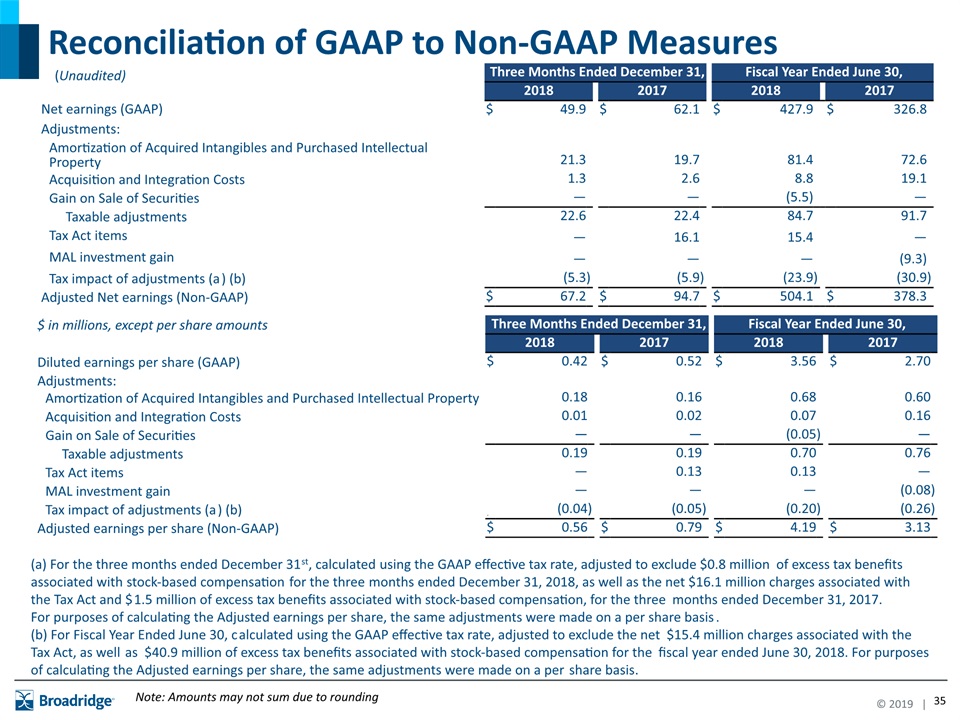
Reconciliation of GAAP to Non-GAAP Measures Note: Amounts may not sum due to rounding Three Months Ended December 31, Three Months Ended December 31, Fiscal Year Ended June 30, Six Months Ended December 31, 2018 2018 2017 2017 2018 2018 2017 2017 Net earnings (GAAP) $ 49.9 $ 62.1 $ 427.9 $ 326.8 Adjustments: Amortization of Acquired Intangibles and Purchased Intellectual Property 21.3 19.7 81.4 72.6 Acquisition and Integration Costs 1.3 2.6 8.8 19.1 Gain on Sale of Securities — — (5.5) — Taxable adjustments 22.6 22.4 84.7 91.7 Tax Act items — 16.1 15.4 — MAL investment gain — — — (9.3) Tax impact of adjustments (a) (b) (5.3 ) (5.9 ) (23.9 ) (30.9 ) Adjusted Net earnings (Non-GAAP) $ 67.2 $ 94.7 $ 504.1 $ 378.3 (Unaudited) $ in millions, except per share amounts Three Months Ended December 31, Three Months Ended December 31, Fiscal Year Ended June 30, Six Months Ended December 31, 2018 2018 2017 2017 2018 2018 2017 2017 Diluted earnings per share (GAAP) $ 0.42 $ 0.52 $ 3.56 $ 2.70 Adjustments: Amortization of Acquired Intangibles and Purchased Intellectual Property 0.18 0.16 0.68 0.60 Acquisition and Integration Costs 0.01 0.02 0.07 0.16 Gain on Sale of Securities — — (0.05 ) — Taxable adjustments 0.19 0.19 0.70 0.76 Tax Act items — 0.13 0.13 — MAL investment gain — — — (0.08 ) Tax impact of adjustments (a) (b) (b) (0.04 ) (0.05 ) (0.20 ) (0.26 ) Adjusted earnings per share (Non-GAAP) $ 0.56 $ 0.79 $ 4.19 $ 3.13 (a) For the three months ended December 31st, calculated using the GAAP effective tax rate, adjusted to exclude $0.8 million of excess tax benefits associated with stock-based compensation for the three months ended December 31, 2018, as well as the net $16.1 million charges associated with the Tax Act and $1.5 million of excess tax benefits associated with stock-based compensation, for the three months ended December 31, 2017.For purposes of calculating the Adjusted earnings per share, the same adjustments were made on a per share basis.(b) For Fiscal Year Ended June 30, calculated using the GAAP effective tax rate, adjusted to exclude the net $15.4 million charges associated with the Tax Act, as well as $40.9 million of excess tax benefits associated with stock-based compensation for the fiscal year ended June 30, 2018. For purposes of calculating the Adjusted earnings per share, the same adjustments were made on a per share basis.
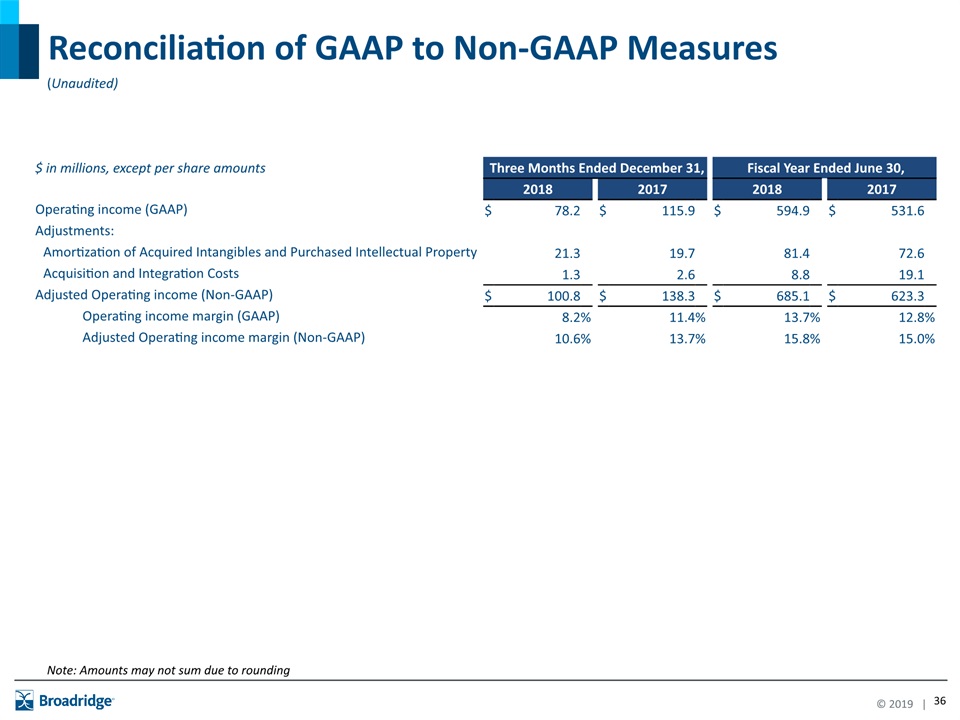
Reconciliation of GAAP to Non-GAAP Measures Note: Amounts may not sum due to rounding (Unaudited) $ in millions, except per share amounts Three Months Ended December 31, Three Months Ended December 31, Fiscal Year Ended June 30, Six Months Ended December 31, 2018 2018 2017 2017 2018 2018 2017 2017 Operating income (GAAP) $ 78.2 $ 115.9 $ 594.9 $ 531.6 Adjustments: Amortization of Acquired Intangibles and Purchased Intellectual Property 21.3 19.7 81.4 72.6 Acquisition and Integration Costs 1.3 2.6 8.8 19.1 Adjusted Operating income (Non-GAAP) $ 100.8 $ 138.3 $ 685.1 $ 623.3 Operating income margin (GAAP) 8.2 % 11.4 % 13.7 % 12.8 % Adjusted Operating income margin (Non-GAAP) 10.6 % 13.7 % 15.8 % 15.0 %
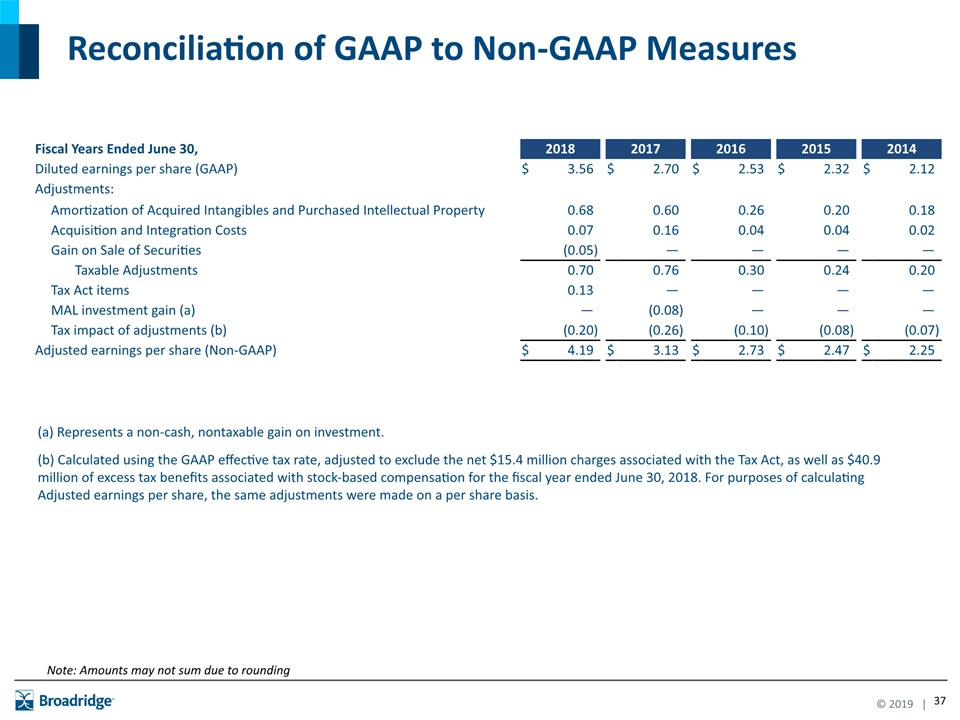
Reconciliation of GAAP to Non-GAAP Measures (b) Calculated using the GAAP effective tax rate, adjusted to exclude the net $15.4 million charges associated with the Tax Act, as well as $40.9 million of excess tax benefits associated with stock-based compensation for the fiscal year ended June 30, 2018. For purposes of calculating Adjusted earnings per share, the same adjustments were made on a per share basis. Fiscal Years Ended June 30, 2018 2018 2017 2017 2016 2016 2015 2015 2014 2014 Diluted earnings per share (GAAP) $ 3.56 $ 2.70 $ 2.53 $ 2.32 $ 2.12 Adjustments: Amortization of Acquired Intangibles and Purchased Intellectual Property 0.68 0.60 0.26 0.20 0.18 Acquisition and Integration Costs 0.07 0.16 0.04 0.04 0.02 Gain on Sale of Securities (0.05 ) — — — — Taxable Adjustments 0.70 0.76 0.30 0.24 0.20 Tax Act items 0.13 — — — — MAL investment gain (a) — (0.08 ) — — — Tax impact of adjustments (b) (0.20 ) (0.26 ) (0.10 ) (0.08 ) (0.07 ) Adjusted earnings per share (Non-GAAP) $ 4.19 $ 3.13 $ 2.73 $ 2.47 $ 2.25 (a) Represents a non-cash, nontaxable gain on investment. Note: Amounts may not sum due to rounding
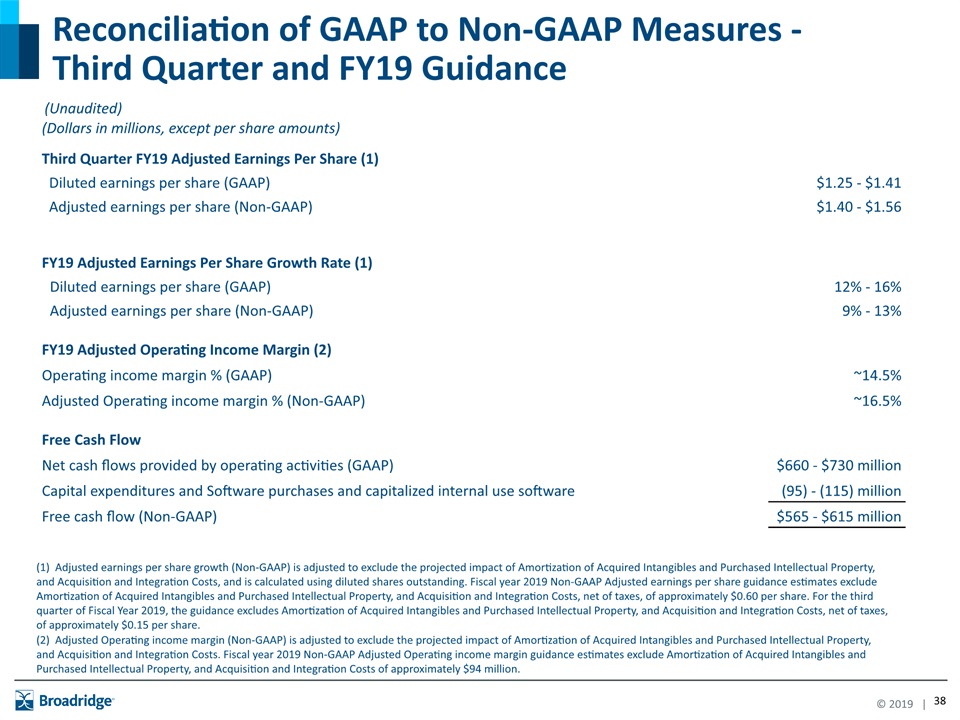
(Dollars in millions, except per share amounts) Third Quarter FY19 Adjusted Earnings Per Share (1) Diluted earnings per share (GAAP) $1.25 - $1.41 Adjusted earnings per share (Non-GAAP) $1.40 - $1.56 FY19 Adjusted Earnings Per Share Growth Rate (1) Diluted earnings per share (GAAP) 12% - 16% Adjusted earnings per share (Non-GAAP) 9% - 13% FY19 Adjusted Operating Income Margin (2) Operating income margin % (GAAP) ~14.5% Adjusted Operating income margin % (Non-GAAP) ~16.5% Free Cash Flow Net cash flows provided by operating activities (GAAP) $660 - $730 million Capital expenditures and Software purchases and capitalized internal use software (95) - (115) million Free cash flow (Non-GAAP) $565 - $615 million (1) Adjusted earnings per share growth (Non-GAAP) is adjusted to exclude the projected impact of Amortization of Acquired Intangibles and Purchased Intellectual Property, and Acquisition and Integration Costs, and is calculated using diluted shares outstanding. Fiscal year 2019 Non-GAAP Adjusted earnings per share guidance estimates exclude Amortization of Acquired Intangibles and Purchased Intellectual Property, and Acquisition and Integration Costs, net of taxes, of approximately $0.60 per share. For the third quarter of Fiscal Year 2019, the guidance excludes Amortization of Acquired Intangibles and Purchased Intellectual Property, and Acquisition and Integration Costs, net of taxes, of approximately $0.15 per share. (2) Adjusted Operating income margin (Non-GAAP) is adjusted to exclude the projected impact of Amortization of Acquired Intangibles and Purchased Intellectual Property, and Acquisition and Integration Costs. Fiscal year 2019 Non-GAAP Adjusted Operating income margin guidance estimates exclude Amortization of Acquired Intangibles and Purchased Intellectual Property, and Acquisition and Integration Costs of approximately $94 million. Reconciliation of GAAP to Non-GAAP Measures - Third Quarter and FY19 Guidance (Unaudited)

Broadridge Investor Relations W. Edings Thibault Investor Relations Tel: 516-472-5129 Email: edings.thibault@broadridge.com