 February 3, 2009 Earnings Webcast & Conference Call Second Quarter Fiscal Year 2009 Broadridge Financial Solutions, Inc. Exhibit 99.2 |
 1 Forward-Looking Statements This presentation and other written or oral statements made from time to time by representatives of Broadridge may contain “forward-looking statements” within the meaning of the Private Securities Litigation Reform Act of 1995. Statements that are not historical in nature, such as our fiscal year 2009 financial guidance, and which may be identified by the use of words like “expects,” “assumes,” “projects,” “anticipates,” “estimates,” “we believe,” “could be” and other words of similar meaning, are forward-looking statements. These statements are based on management’s expectations and assumptions and are subject to risks and uncertainties that may cause actual results to differ materially from those expressed. These risks and uncertainties include those risk factors discussed in Part I, “Item 1A. Risk Factors” of our Annual Report on Form 10-K for the fiscal year ended June 30, 2008 (the “2008 Annual Report”), as they may be updated in any future reports filed with the Securities and Exchange Commission. Any forward-looking statements are qualified in their entirety by reference to the factors discussed in the 2008 Annual Report. These risks include: the success of Broadridge in retaining and selling additional services to its existing clients and in obtaining new clients; the pricing of Broadridge’s products and services; changes in laws affecting the investor communication services provided by Broadridge; changes in laws regulating registered securities clearing firms and broker-dealers; declines in trading volume, market prices, or the liquidity of the securities markets; any material breach of Broadridge security affecting its clients’ customer information; Broadridge’s ability to continue to obtain data center services from its former parent company, Automatic Data Processing, Inc. (“ADP”); any significant slowdown or failure of Broadridge’s systems; changes in technology; availability of skilled technical employees; the impact of new acquisitions and divestitures; competitive conditions; overall market and economic conditions; and any adverse consequences from Broadridge’s spin- off from ADP. Broadridge disclaims any obligation to update any forward-looking statements, whether as a result of new information, future events or otherwise. This presentation may include certain Non-GAAP (generally accepted accounting principles) financial measures in describing Broadridge’s performance. Management believes that such Non-GAAP measures, when presented in conjunction with comparable GAAP measures provide investors a more complete understanding of Broadridge’s underlying operational results. These Non-GAAP measures are indicators that management uses to provide additional meaningful comparisons between current results and prior reported results, and as a basis for planning and forecasting for future periods. These measures should be considered in addition to and not a substitute for the measures of financial performance prepared in accordance with GAAP. The reconciliations of such measures to the comparable GAAP figures are included in this presentation. |
 2 Today’s Agenda Opening Remarks Rich Daly, CEO Second Quarter FY 2009 Results and Dan Sheldon, CFO Cash Flow Fiscal Year 2009 Guidance Summary Rich Daly, CEO Summary Rich Daly, CEO Q&A Rich Daly, CEO Dan Sheldon, CFO Marvin Sims, VP Investor Relations Closing Remarks Rich Daly, CEO |
 3 Opening Remarks Key Topics: • Financial results for the second quarter and reaffirmation of full fiscal year 2009 earnings per share guidance • A review of sales performance • General overview of current market dynamics and impact on Broadridge |
 4 Opening Remarks – Key Topics Second Quarter FY09 Financial Results • Financial performance for the quarter was better than expectations, given the current challenging market conditions • Revenues for Operating Segments continue to grow, driven by recurring revenues • Business fundamentals continue to demonstrate resiliency, as key recurring revenue metrics in the core Investor Communication business remain essentially unaffected by volatile market activity • Reaffirming full fiscal year 2009 diluted EPS guidance Non-GAAP EPS range of $1.45 - $1.55 (excludes one-time gain of $0.04 per share from purchase of senior notes) GAAP EPS range of $1.49 - $1.59 • Anticipating FY09 revenue decline of -3% to flat growth, which is down from our previous growth guidance of flat to 3% growth, primarily due to foreign currency exchange, lower Mutual Fund Proxy and reduced distribution revenue resulting from higher Notice and Access adoption rates • Strong free cash flows of $210M - $250M, solid liquidity given free cash flows and $500M committed revolver with three plus years term remaining, and strong balance sheet with 1-to-1 debt to EBITDA ratio |
 5 Opening Remarks – Key Topics Sales Performance Overview • Closed sales for quarter up 36% and year-to-date up 26% • Recurring closed sales are approximately 80% of total closed sales year-to-date, and up 100% over prior year • Sales pipeline remains strong and is still building momentum • Despite high functionality and efficiency of Broadridge processing platform, complexity of conversions is biggest closing hurdle • Full year closed sales forecast of $160M - $180M still on track |
 6 Opening Remarks – Key Topics General Market Conditions Headwinds: • Headwinds remain in the financial services market and are creating short-term revenue slow down, but should also create long-term opportunities • Expecting less trade volumes and lower Mutual Fund Proxy activity in the second half of fiscal year • Pricing pressures creating increased concessions, but retaining clients with extended contract terms Industry Consolidation Update: • JP Morgan/Bear, Barclays/Lehman and Neuberger Berman contracts completed and putting Broadridge in slightly net positive position • Bank of America and Merrill Lynch acquisition recently completed and we remain in discussions around long-term platform strategy Tailwinds: • Investor Communication Solutions’ core proxy recurring revenue, which is more than 50% of Broadridge revenues, is maintaining its unique historical resiliency to negative market conditions • Broadridge expects to exit this down market with more market share than we entered • Broadridge continuing to make investments in business to leverage long-term opportunities |
 7 Key Highlights: Q2 - Revenue 1% to $459M and YTD 2% to $932M (Operating Segments 2% for Q2 and 3% YTD) • Sales contributed +4% (YTD = +3%) • Losses reduced growth by -1% (YTD = -1%) • Internal Growth contributed +2% (YTD = +2%) • Event-driven activity reduced growth by -2% (YTD = -1%) • Distribution Fees reduced growth by -1% (YTD = flat) • Other/FX reduced growth by -3% (YTD = -1%) Q2 - Pre-tax Margin 40 bps to 10.6% and YTD 10 bps to 11.5% • Q2 and YTD – Better than anticipated performance from trade revenues and one-time gains, offset by previously disclosed grow-over related to timing in Q2 FY2008 build-out of public company infrastructure and investment ramp-up Q2 - Diluted EPS flat at $0.21 and YTD flat at $0.46 • Q2 - Fully diluted shares 0.4M to 141.3M • YTD - Fully diluted shares 1.4M to 141.7M Broadridge Results –Q2 & YTD FY 2009 |
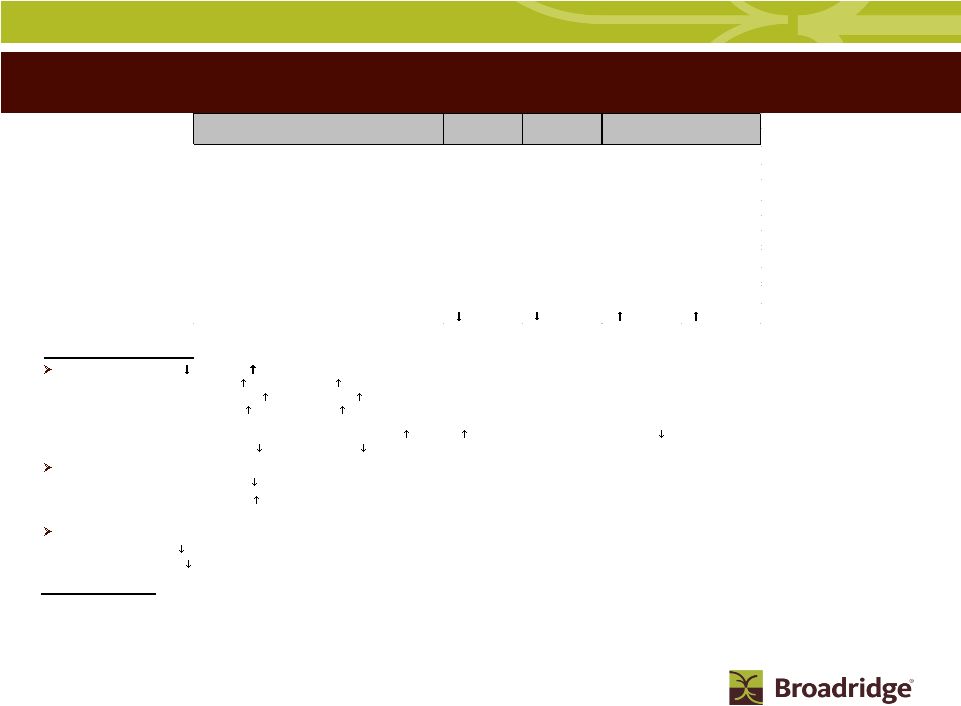 8 Segment Results – Investor Communication Solutions 2Q09 2Q09 YTD FY09 Range ($ in millions) Actual Actual Low High Revenues $296 $609 $1,544 $1,577 Growth Rate -3% 1% -2% 0% Fee Revenues $144 $292 $778 $804 Growth Rate -2% 1% 1% 5% Recurring (RC) 7% 8% 7% 11% Event-driven (ED) -15% -9% -12% -9% Distribution Revenues $152 $317 $767 $773 Growth Rate -3% 1% -5% -4% Margin 6.7% 7.1% 16.5% 17.3% Margin Basis Points (bps) Change 230 bps 240 bps 30 bps 110 bps Q2 FY09 Key Highlights: Fee Revenues Q2 2% ( YTD 1%) • Recurring Fee revenue $6M or 7% (YTD $14M or 8%) • Net New Business $3M or 3% (YTD $5M or 3%) primarily driven by Transaction Reporting and Fulfillment • Internal Growth $3M or 4% (YTD $9M or 5%) driven by Mutual Fund Interim position growth, higher Fulfillment and Transaction Reporting volume, as well as an increase in Notice and Access adoption rates • Mutual Fund Interims position growth 6% (YTD 6%) and Equity Proxy position growth 3% (YTD flat) • Event-driven Fee revenue $8M or -15% (YTD $11M or -9% ) driven by lower Mutual Fund Proxy, slightly offset by higher M&A activity Distribution Revenues • Q2 Distribution Revenue 3% primarily due to lower mail volume, coupled with an increase in Notice and Access adoption rates • YTD Distribution Revenue 1% primarily due to net new business and internal growth, partially offset by Mutual Fund Proxy and impact of increased Notice and Access adoption rates Margin • Q2 Margin 230 bps primarily due to lower revenues and lower product mix • YTD Margin 240 bps primarily due to product mix FY09 Key Drivers: • Recurring Fee revenue Net New Business contributes 2% to 3% • Recurring Fee revenue Internal Growth contributes 3% to 5% • Event-driven revenue contributes -4% to -3%, primarily a decline in Mutual Fund Proxy; M&A activities remain flat |
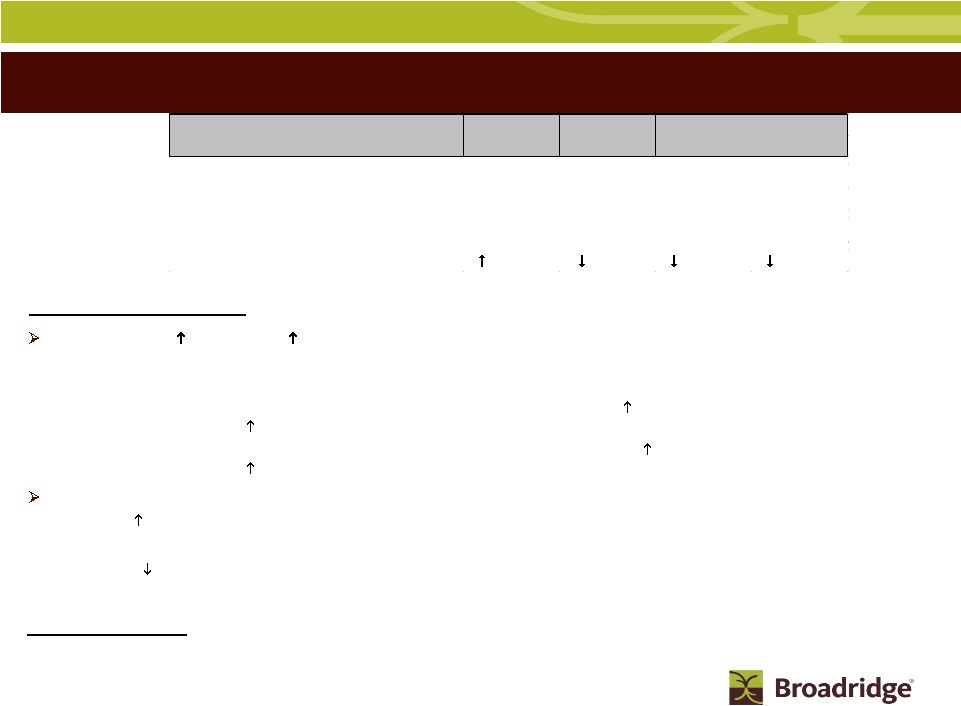 9 : 9 Segment Results – Securities Processing Solutions Q2 FY09 Key Highlights Revenues (Q2 9% and YTD 8%) • Q2 - Net New Business contributed 2% or $3M (Sales of 6% offset by losses of 4%) • YTD - Net New Business contributed 2% or $5M (Sales of 5% offset by losses of 3%) • Q2 - Internal Growth contributed 6% or $8M (Internal growth Equity TPD 10% to 1,693K, driven by retail trades. Fixed-Income TPD 26% to 267K) • YTD - Internal Growth contributed 5% or $14M (Internal growth Equity TPD 7% to 1,597K, driven by retail trades. Fixed-Income TPD 26% to 269K) Margins • Q2 140 bps - Revenue growth net of higher planned investment spending related to new products and lower capitalization of conversion related costs • YTD 90 bps - Contribution from revenue growth more than offset by higher planned investment spending and RBC conversion related resources no longer capitalized and “returning” to expense run rate FY09 Key Drivers: • Net New Business and acquisitions contribute 1% to 2% • Internal Growth contributes 1% to 2% 2Q09 2Q09 YTD FY09 Range ($ in millions) Actual Actual Low High Revenues $139 $273 $527 $535 Growth Rate 9% 8% 2% 4% Margin 28.8% 28.4% 24.6% 25.7% Margin Basis Points (bps) Change 140 bps 90 bps 210 bps 100 bps |
 10 Segment Results – Clearing and Outsourcing Solutions Q2 FY09 Key Highlights: Revenues (Q2 16% and YTD 5%) • Q2 - Net New Business contributed 31% or $8M (Sales of 34% with 5% coming from outsourcing, offset by losses of 3% ) • YTD - Net New Business contributed 18% or $9M (Sales of 22% offset by losses of 4%) • Q2 - Internal Growth 15% or $4M (higher processing fees of $1M, more than offset by lower net interest income due to lower Federal Funds rate and lower margin balances - TPD 22% to 59K TPD) • YTD - Internal Growth 13% or $6M (higher processing fees of $2M, more than offset by lower net interest income due to lower Federal Funds rate and lower margin balances - TPD 14% to 53K) – Federal Funds rate impact for Q2 of $2M and YTD $5M Pre-tax Loss • Q2 - Excluding the negative effect of net interest income, margin increased $4M on revenue increase of $8M (YTD - margin increased $6M on revenue increase of $9M) FY09 Key Drivers: • Net New Business contributes 22% to 23% • Internal Growth contributes -11% (primarily related to impact from lower Federal Funds rate ($8M) and lower margin lending balance) 2Q09 2Q09 YTD FY09 Range ($ in millions) Actual Actual Low High Revenues $29 $52 $106 $108 Growth Rate 16% 5% 11% 12% Pre-tax Loss -$2 -$5 -$7 -$6 |
 11 Segment Results – Other & Foreign Exchange (FX) Q2 & YTD FY09 Key Highlights: Revenues • Q2 FX Revenues decreased to -$5M from +$4M (YTD FX Revenues decreased to -$3M from +$5M) year-over-year due to strengthening of the U.S. dollar Margin • Q2 Net Other Expense and investments in line with expectations • YTD Net Other Expense - Interest expense includes one-time gain of $8M from purchase of $125M principal amount of senior notes FY09 Key Drivers: • FX - strengthening of U.S. dollar will have negative impact on revenues • Interest Expense - no further reduction in long-term debt expected 2Q09 2Q09 YTD FY09 Range ($ in millions) Actual Actual Low High Other Fees Revenues $0 $0 $1 $1 Other Fees Margin $0 $0 $1 $1 FX Revenues -$5 -$3 -$26 -$26 FX P&L Margin -$1 $0 -$6 -$6 Other Interest Expense -$3 $0 -$8 -$8 Corporate Expenses & Investments -$10 -$16 -$29 -$31 FX Transaction Activity $4 $7 $7 $7 |
 12 Fiscal Year 2009 Grow-Over Discussion Second quarter of FY09 tough EPS compare given grow-over items FY08 Grow-Overs ($ in millions) Q1 Q2 Q3 Q4 FY09 Actual Actual Forecast Forecast Other- Corporate/Investments Termination Fees (2) (5) 0 (1) (8) Corporate Build (4) (4) 0 0 (8) Investments (3) (3) (3) 0 (9) Special Stock Option Grants 0 (2) (3) 5 0 Sub-total (9) (14) (6) 4 (25) Segments SPS- Non-Deferred S&P (5) (3) (2) 0 (10) ($14) ($17) ($8) $4 ($35) |
 13 Broadridge Cash Flow – Q2 FY 2009 and FY 2009 Forecast Broadridge Financial Solutions, Inc. Calculation of Free Cash Flow - Non-GAAP Unaudited (In millions) Low High Ridge Clearing All Other Financing Processing Broadridge Calculation of Free Cash Flow (Non-GAAP) : Activities Activities Total Earnings - $ 66 $ 66 $ 207 $ 222 $ Depreciation and amortization - 28 28 55 60 Deferred taxes - (3) (3) (12) (10) Stock-based compensation expense - 16 16 30 35 Gain from purchase of senior notes - (8) (8) - - Other - 2 2 5 5 Subtotal - 101 101 285 312 Working capital changes - 1 1 (10) (5) Securities clearing activities 181 - 181 - - Long-term assets and liabilities changes - (5) (5) (15) (10) Net cash flow provided by (used in) operating activities 181 96 277 260 297 Cash Flows From Investing Activities Capital expenditures - (7) (7) (45) (42) Intangibles - (1) (1) (5) (5) $ $ Free cash flow 181 $ 88 $ 269 $ 210 $ 250 $ Cash Flows From Other Investing and Financing Activities Acquisitions - (15) (15) (15) (15) b Long-term debt repayment - (114) (114) (114) (114) Dividends - (18) (18) (39) (39) Other (4) 7 3 - - Repurchases of Common Stock - (12) (12) (12) (12) Short-term (bank overdrafts) (9) - (9) - - Effect of exchange rate changes on cash and cash equivalents - (3) (3) (3) (3) Net change in cash and cash equivalents 168 (67) 101 27 67 Cash and cash equivalents, at the beginning of year 41 157 198 157 157 Cash and cash equivalents, at the end of period 209 $ 90 $ 299 $ 184 $ 224 $ (a) Excluded from Earnings and Free Cash Flow All Other Processing Activities December 2008 FY09 Range Six Months Ended a b b (b) Guidance does not include effect of any future acquisitions, additional debt or share repurchases |
 14 Broadridge - FY 2009 Financial Guidance Summary Revenue growth of -3% to flat (-1% to 2% fee only) Operating segment revenue growth of flat to 2% (2% to 5% fee only) Earnings before interest and taxes margin of 16.2% - 17.1% Diluted EPS in the range of: GAAP EPS $1.49 - $1.59 Non-GAAP EPS $1.45 - $1.55 (excludes one-time gain of $0.04 per share from purchase of senior notes) Sales forecast for year of $160M - $180M Effective Tax Rate of approximately 39% Free cash flow in the range of $210M - $250M |
 15 Summary Broadridge is weathering the storm as solid second quarter results are better than expectations Majority of Broadridge business model continues to be resilient as key recurring revenue metrics remain stable Navigated the recent financial services industry consolidation well; to- date providing slightly more upside than downside risk Market headwinds are turning good execution into flat or slightly negative revenue growth in the near-term Current regulatory environment generating new longer-term opportunities Well-positioned as a result of our recurring revenue base, great value propositions, strong free cash flows, solid balance sheet and appropriate liquidity |
 16 Q&A There are no slides during this portion of the presentation |
 17 Closing Comments There are no slides during this portion of the presentation |
 18 Appendix Appendix |
 19 Closed Sales-To-Revenue Overview Closed Sales-To-Revenue General Conversion Time Frames FY 09 Closed Sales-to-Revenue Conversion Sales Plan General Time Frames Investor Communication Solutions $90M - $100M Registered Mutual Fund Sales 1 to 6 Months Registered Equity Sales Issuer's Next Annual Meeting Transaction Reporting (1) and Fulfillment Sales 3 to 9 Months Global Proxy Sales 1 to 6 Months Securities Processing Solutions Small Broker-Dealer Firms 3 to 6 Months Mid-sized Broker-Dealer Firms 6 to 9 Months Large Broker-Dealer Firms 9 to18+ Months Clearing and Outsourcing Solutions $70M - $80M Clearing Small Broker-Dealer Firms 3 Months Mid-sized Broker-Dealer Firms 3 to 6 Months Outsourcing Mid-sized Broker-Dealer Firms 6 to 9 Months Large Broker-Dealer Firms 9 to18+ Months (1) Transaction Reporting sales are comprised of statement, confirm and 1099 business Segment Sales Categories |
 20 Segments – FY 2009 Financial Guidance Summary Investor Communication: Revenues -2% to Flat Margins 16.5% - 17.3% Sales $90M - $100M Securities Processing: Revenues 2% - 4% Margins 24.6% - 25.7% Clearing and Outsourcing: Revenues 11% - 12% Operating losses at $6M - $7M Sales Plan $70M - $80M for the combined Securities Processing and Clearing and Outsourcing business segments |
 21 Use of Materials Contained Herein The information contained in this presentation is being provided for your convenience and information only. This information is accurate as of the date of its initial presentation. If you plan to use this information for any purpose, verification of its continued accuracy is your responsibility. Broadridge assumes no duty to update or revise the information contained in this presentation. You may reproduce information contained in this presentation provided you do not alter, edit, or delete any of the content and provided you identify the source of the information as Broadridge Financial Solutions, Inc., which owns the copyright. |