 © 2010 Broadridge Financial Solutions, Inc. Broadridge and the Broadridge logo are registered trademarks of Broadridge Financial Solutions, Inc. November 4, 2010 Earnings Webcast & Conference Call First Quarter Fiscal Year 2011 Broadridge Financial Solutions, Inc. Exhibit 99.2 |
 1 Forward-Looking Statements This presentation and other written or oral statements made from time to time by representatives of Broadridge may contain “forward-looking statements” within the meaning of the Private Securities Litigation Reform Act of 1995. Statements that are not historical in nature, such as our fiscal year 2011 financial guidance, and which may be identified by the use of words like “expects,” “assumes,” “projects,” “anticipates,” “estimates,” “we believe,” “could be” and other words of similar meaning, are forward-looking statements. These statements are based on management’s expectations and assumptions and are subject to risks and uncertainties that may cause actual results to differ materially from those expressed. These risks and uncertainties include those risk factors discussed in Part I, “Item 1A. Risk Factors” of our Annual Report on Form 10-K for the fiscal year ended June 30, 2010 (the “2010 Annual Report”), as they may be updated in any future reports filed with the Securities and Exchange Commission. Any forward-looking statements are qualified in their entirety by reference to the factors discussed in the 2010 Annual Report. These risks include: the success of Broadridge in retaining and selling additional services to its existing clients and in obtaining new clients; the pricing of Broadridge’s products and services; changes in laws and regulations affecting the investor communication services provided by Broadridge; declines in participation and activity in the securities markets; overall market and economic conditions and their impact on the securities markets; any material breach of Broadridge security affecting its clients’ customer information; the failure of Broadridge’s outsourced data center services provider to provide the anticipated levels of service; any significant slowdown or failure of Broadridge’s systems or error in the performance of Broadridge’s services; Broadridge’s failure to keep pace with changes in technology and demands of its clients; Broadridge’s ability to attract and retain key personnel; the impact of new acquisitions and divestitures; and competitive conditions. Broadridge disclaims any obligation to update any forward-looking statements, whether as a result of new information, future events or otherwise. This presentation may include certain Non-GAAP (generally accepted accounting principles) financial measures in describing Broadridge’s performance. Management believes that such Non-GAAP measures, when presented in conjunction with comparable GAAP measures provide investors a more complete understanding of Broadridge’s underlying operational results. These Non-GAAP measures are indicators that management uses to provide additional meaningful comparisons between current results and prior reported results, and as a basis for planning and forecasting for future periods. These measures should be considered in addition to and not a substitute for the measures of financial performance prepared in accordance with GAAP. The reconciliations of such measures to the comparable GAAP figures are included in this presentation. |
 2 Today’s Agenda Opening Remarks and Key Topics Rich Daly, CEO First Quarter Fiscal Year 2011 Dan Sheldon, CFO Results and Full Year Guidance Summary and Closing Comments Rich Daly, CEO Q&A Rich Daly, CEO Dan Sheldon, CFO Rick Rodick, VP Investor Relations Closing Remarks Rich Daly, CEO |
 3 Opening Remarks Key Topics: Financial performance Closed sales performance Key strategic initiatives update Regulatory update |
 4 Financial Performance Revenues for the quarter were down 4%, but in line with the low end of our range Driven primarily by lower event-driven revenues, partially offset by revenues from sales less losses (“net new business”) and acquisitions Diluted earnings per share from continuing operations were down from last year, as expected Primarily due to the decline in event-driven revenues, coupled with costs related to strategic initiatives and acquisitions Acquired NewRiver, Inc. in August 2010 NewRiver is a leader in mutual fund electronic investor disclosure solutions Opportunistically repurchased approximately 4.5M Broadridge shares during the first quarter at an average price of $20.91 per share |
 5 Closed Sales Performance Closed sales for the quarter were $24M Recurring revenue sales increased 94% to $17M • SPS sales more than doubled • ICS sales were up almost 30% Event-driven sales were down from last year, as expected Sales pipeline continues to have very good momentum and contains large opportunities for both segments Full year closed sales guidance remains at $160-215M |
 6 Key Strategic Initiatives Update All major strategic initiatives are on track Morgan Stanley Smith Barney (“MSSB”) Progressing significantly into the two-year transition Excellent quality survey scores On track to achieve revenue and profitability goals during fiscal year 2012 Penson/Outsourcing Implementation on track to achieve revenue and breakeven targets in fiscal year 2012 IBM Data center conversion in early stages of implementation Sales opportunities in the sales pipeline related to the business alliance |
 7 Regulatory Update The Securities and Exchange Commission (“SEC”) issued its Concept Release on the U.S. Proxy System on July 14, 2010 Broadridge submitted comments on the following topics (1): Vote accuracy • Accuracy is critical to the U.S. proxy system • Vote accuracy, process integrity and transparency goals have been achieved through Broadridge’s leadership and technology investments Process efficiency • The U.S. proxy system supports the needs of the most efficient and liquid markets in the world • Broadridge’s systems and technologies, which support the street clearance and settlement environment, create significant efficiencies for all constituencies involved in the proxy distribution process Voting participation • Effective participation requires the provision of communications and voting in ways that reflect beneficial shareholder preferences and choices • Broadridge’s system, in which we have invested >$1 billion, accurately and consistently tracks and applies shareholder delivery preferences to all investments in investor accounts creating a consistent scalable process across all issuers • Broadridge has pioneered the client-directed voting solution being considered by the SEC in the Concept Release – another tangible example of how Broadridge’s innovations raise investor participation Broadridge has developed a social network solution that we believe would increase levels of participation, transparency and efficiency beyond what is viewed as attainable today Broadridge has consistently identified ways to improve the proxy system’s accuracy and efficiency First we invest and then we execute (1) For our complete comments, see http://sec.gov/comments/s7-14-10/s71410.shtml or http://www.broadridge.com/comment_letters/ |
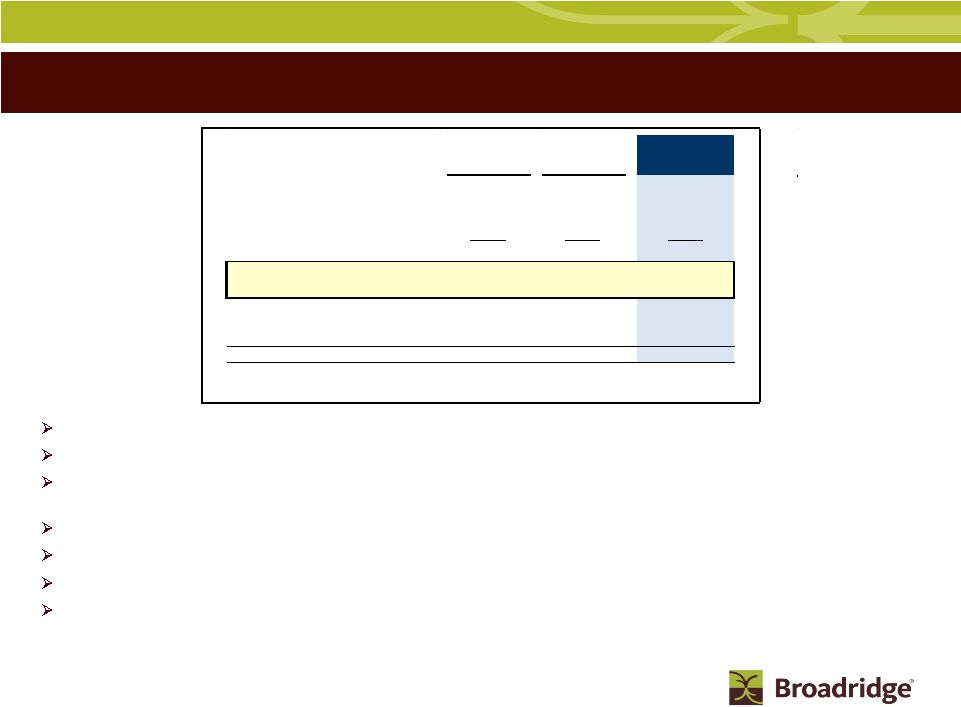 8 Revenue Drivers- Q1 Results and Forecast FY11 (Continuing Operations) Q1 revenues historically have been the lowest quarter and heavily influenced by event-driven activities Revenue contributions from net new business tracking to our expectations Internal growth flat as positive contributions from mutual fund interims and fixed income trade volumes offset by lower equity trade volumes Event-driven down primarily due to fall off in mutual fund proxies Distribution revenues down and tied mostly to event-driven activity Acquisitions represent positive contributions including Penson, City Networks and NewRiver Margins are down for the quarter primarily due to fall off in higher margin event-driven revenues and on-boarding of Penson and MSSB transactions (impact 460 bps of which approximately two-thirds represent event-driven) Actual Actual Forecast 1Q11 FY10 FY11 Total Revenue Growth (4)% 7% 1-4% Sales (Recurring) 4% 4% 3-4% Client Losses (2)% (2)% (1)% Net New Business 2% 2% 2-3% Internal Growth (a) 0% (2)% 0-1% Event-Driven (b) (5)% 4% (5)-(4)% Distribution (5)% 1% 0% Acq/FX/Other 4% 2% 4% EBIT Margins 5.5% 15.9% 14.6-15.2% (a) Internal Growth includes SPS Equity & Fixed Income Trades, ICS Equity & Mutual Fund Stock Record Growth, Transaction Reporting and Time & Materials (b) Event-Driven includes ICS Proxy Contest/Specials, Mutual Fund Proxy and Marketing Communications Fulfillment |
 9 Segment Results & Forecast – Investor Communication Solutions As expected, total revenue was down for the quarter due to lower event-driven activity, predominantly mutual fund proxy Recurring fee revenue for the quarter and full year is on track. Q1 fueled by net new business, primarily MSSB, and acquisitions Sales efforts continue with full year in-line with previous guidance. Focus remains on new services where we seek to generate incremental fee revenue of $40-50M adding 3 points to total revenue growth Client revenue retention rate continues to be greater than 99% Internal growth indicators suggest full year contribution to total revenue to remain flat to slightly positive as stock record growth for both equities and interims was up over prior year NewRiver acquisition expected to contribute 1 point to total revenue growth and $8M of EBIT before $4M of amortization of intangibles and integration expenses Projecting event-driven fee range of $220-230M for the year and will have better gauge as to likelihood of full year range after Q2 Q1 margins impacted by lower event-driven fees, the carryover dilutive impact of the MSSB transaction and on-boarding of NewRiver Revenue/Growth EBIT/Growth (Non-GAAP) Margin/Growth (Non-GAAP) Q1: $280M/ (10)% $6M/ (73)% 2.3%/ (530) bps FY11: $1,641 to 1,682M / (2) to +1% $271 to 284M / (1) to +4% 16.5 to 16.9% / +20 to +60 bps |
 10 10 Q1 revenues in line with expectations. Growth driven by contributions from new sales and acquisitions (Penson and City Networks) offset by carryover impact from Bank of America Merrill Lynch loss (“BAML”) Acquisitions adding 9 points of growth for the quarter and expecting 11 points for the year Net new business starts out slow and expected to begin building in the second half of the year as FY10 and FY11 Q1 sales build in contributions to revenue and loss of BAML begins to have less negative impact Internal revenue growth slightly positive in the quarter as higher non-trade revenues and fixed income volumes were offset by steeper than expected seasonal fall off of equity trade volumes and carryover impact of prior year concessions Q1 and full year margins decline as previously discussed in August call, driven by the expected lower Outsourcing margin (transitional until Penson fully converted) and the slight dilutive impact of the City Networks acquisition in the first year Excluding the Penson transaction and the City Networks acquisition, revenues, EBIT, and margins in Q1 were unchanged from the prior year. We still expect to pick up $14-16M in EBIT from FY11 due to the on- boarding of Penson and outsourcing sales as we move into FY12 Low and high revenue and EBIT ranges primarily impacted by trade volumes Segment Results & Forecast – Securities Processing Solutions Revenue/Growth EBIT/Growth (Non-GAAP) Margin/Growth (Non-GAAP) Q1: $142M / +9% $21M / (18)% 15% / (500) bps FY11: $589 to 615M / +10 to 15% $80 to 96M / (19) to (3)% 13.5 to 15.6%/ (500) to (290) bps |
 11 Broadridge - FY11 Continuing Operations Financial Guidance Summary Revenue growth in the range of 1-4% Closed sales forecast for the year at $160-215M (Recurring $110-150M) Non-GAAP Earnings before interest and taxes margin of 14.6-15.2% Diluted Earnings Per Share: GAAP EPS (continuing operations) in the range of $1.55-1.65 Diluted weighted-average outstanding shares in the range of 128-130M Free cash flow in the range of approximately $170-220M Includes increase in investment implementation cost of ~$45M (Penson/IBM) Reversal of FY10 $30M additional contribution to working capital in FY11 Guidance does not include the effect of any future acquisitions, additional debt and/or share repurchases in excess of the repurchases needed to be within our 128-130M diluted weighted-average outstanding shares guidance |
 12 Summary The business is staying the course in this difficult market and is charting a path to new clients and product opportunities Across our product set we have very good momentum, both in new product generation and successful sales execution Reaffirmed our full year guidance for earnings and closed sales We are uniquely positioned to implement any process changes that the SEC chooses to implement Notice & Access and many other rule changes have historically been positive to neutral for Broadridge Culture matters We have tangible proof of having the most engaged associates in our space The existing business model and management are positioned to execute on Broadridge’s current product set and build or buy additional mission-critical functions as the industry’s #1 trusted business partner Financial strength Paying a meaningful dividend Opportunistically repurchasing shares Low debt leverage ratio Have the flexibility to look for strategic acquisition opportunities that will enhance the business |
 13 Q&A There are no slides during this portion of the presentation |
 14 Closing Comments There are no slides during this portion of the presentation |
 15 Appendix Appendix |
 16 Segment Results & Forecast – Other & Foreign Exchange (FX) FY11: Corporate Expenses and Investments: Full year run-rate in the low $20M range, consisting of corporate expenses, excluding M&A activity, IBM ITO / restructuring expenses FX: Full year low and high ranges assume current rates and forward rates, respectively 1Q11 FY11 Low High Interest Expense $(2)M $(11)M $(11)M Corp. Expenses & Investments $(6)M $(28)M $(35)M FX - P&L - Revenue $0M $7M $11M - EBIT $1M $3M $6M - Transaction Activity $0M $0M $0M |
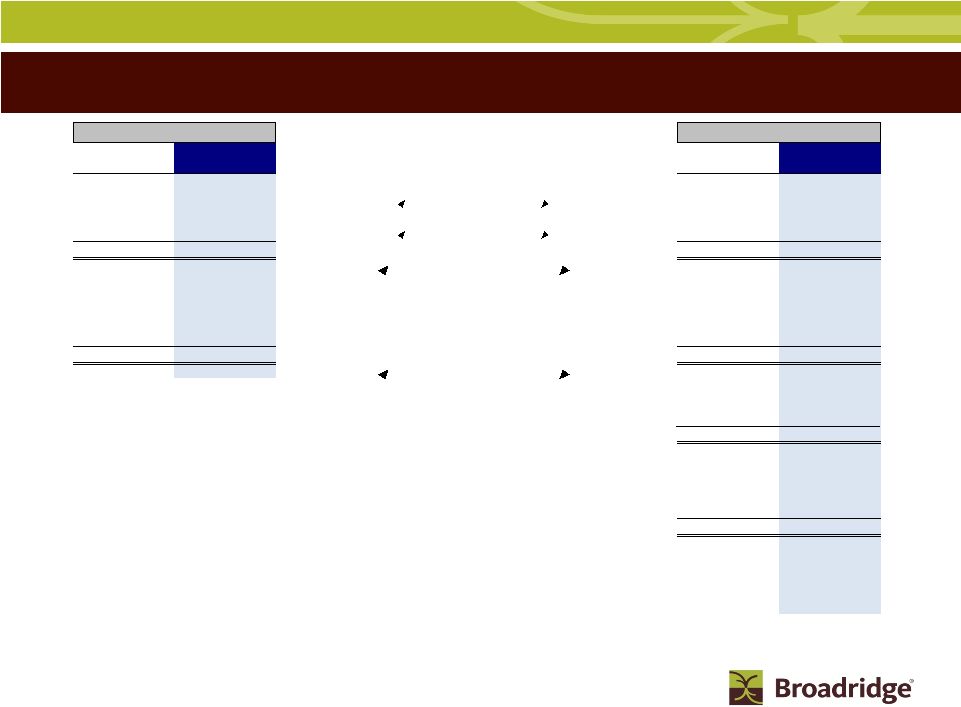 17 Broadridge 1Q from Continuing Operations Revenue ($ in millions) EBIT FY10 FY11 FY10 FY11 Q1 Q1 Q1 Q1 $310 $280 ICS $23 $6 -1% -10% Growth % / Margin % 7.6% 2.3% $130 $142 SPS $26 $21 -7% 9% Growth % / Margin % 19.7% 14.7% $440 $421 Total Segments $49 $27 -3% -4% Growth % / Margin % 11.1% 6.5% $0 $0 Other ($3) ($6) ($2) $0 FX * ($1) $1 $438 $421 Total Broadridge $45 $23 -4% -4% Growth % / Margin % 10.3% 5.5% Interest & Other ($3) ($2) Total EBT $43 $21 Margin % 9.7% 5.0% Income Taxes ($16) ($8) Tax Rate 37.4% 36.4% Total Net Earnings $27 $13 Margin % 6.1% 3.2% Diluted Shares 140 130 Diluted EPS (GAAP) $0.19 $0.10 Diluted EPS Before 1-Times (Non-GAAP) $0.19 $0.10 * Includes impact of FX P&L Margin and FX Transaction Activity |
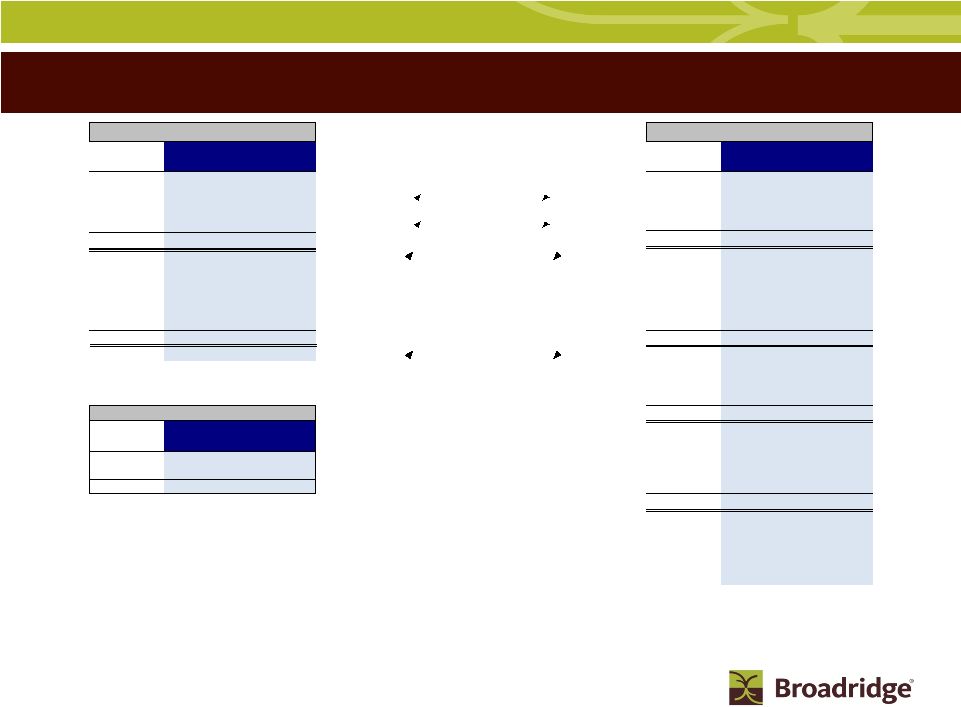 18 Broadridge FY11 Guidance from Continuing Operations Guidance does not take into consideration the effect of any future acquisitions, additional debt and/or share repurchases in excess of the repurchases needed to be within our 128 million to 130 million diluted weighted-average outstanding shares guidance. Revenue ($ in millions) EBIT FY10 FY11 Range FY10 FY11 Range Actual Low High Actual Low High $1,670 $1,641 $1,682 ICS $273 $271 $284 9% -2% 1% Growth % / Margin % 16.3% 16.5% 16.9% $536 $589 $615 SPS $99 $80 $96 -4% 10% 15% Growth % / Margin % 18.5% 13.5% 15.6% $2,205 $2,230 $2,297 Total Segments $372 $351 $380 6% 1% 4% Growth % / Margin % 16.9% 15.7% 16.5% $2 $0 $0 Other ($25) ($28) ($35) $1 $7 $11 FX * $5 $3 $6 $2,209 $2,237 $2,308 Total Broadridge $352 $327 $350 7% 1% 4% Growth % / Margin % 15.9% 14.6% 15.2% Interest & Other ($10) ($11) ($11) Total EBT $342 $316 $339 FY11 Range Margin % 15.5% 14.1% 14.7% Segments Low High ICS $85 $115 Income Taxes ($117) ($114) ($127) SPS $75 $100 Tax Rate (a) 34.2% 36.2% 37.5% Total $160 $215 Total Net Earnings $225 $201 $212 Margin % 10.2% 9.0% 9.2% Diluted Shares 139 130 128 Diluted EPS (GAAP) $1.62 $1.55 $1.65 Diluted EPS Before 1-Times (Non-GAAP) (b) $1.56 $1.55 $1.65 * Includes impact of FX P&L Margin and FX Transaction Activity Closed Sales (a) FY10 Full Year Tax Rate of 34.2% is attributable to the release of a valuation allowance on a deferred tax asset relating to tax loss carryforwards of approximately $8M. Excluding the year-to-date benefit the FY10 Full Year tax rate would be 36.5% (b) FY10 Full Year Diluted EPS Before 1-Times (Non-GAAP) excludes the release of a valuation allowance on a deferred tax asset relating to tax loss carryforwards of approximately $8M (gain reflected in Income Taxes). $0.06 impact to EPS. |
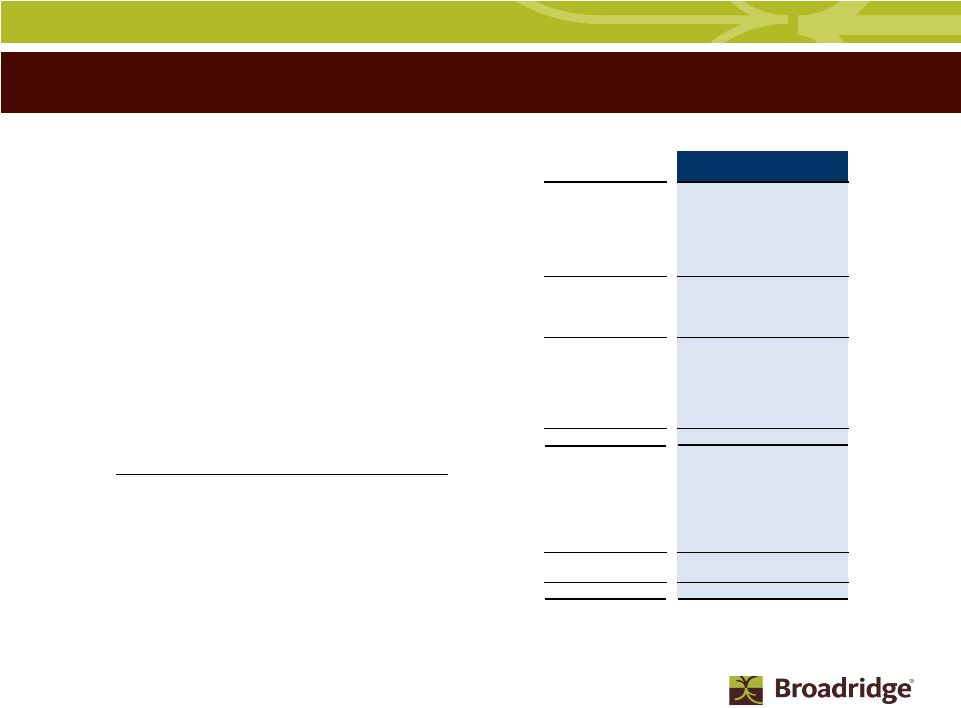 19 Cash Flow – 1Q11 Results and FY11 Forecast Unaudited (In millions) Three Months Ended September 2010 Low High Free Cash Flow (Non-GAAP) : Net earnings from continuing operations per GAAP 13 $ 201 $ 212 $ Depreciation and amortization (includes other LT assets) 16 65 75 Stock-based compensation expense 6 30 30 Other - (5) 5 Subtotal 35 291 322 Working capital changes (62) (30) (25) Long-term assets and liabilities changes 2 (30) (20) Net cash flow (used in) provided by continuing operating activities (25) 231 277 Cash Flows From Investing Activities IBM / ITO data center investment - (20) (15) Capital expenditures and purchases of intangibles (7) (45) (40) Free cash flow (32) $ 166 $ 222 $ Cash Flows From Other Investing and Financing Activities Acquisitions (77) (77) (77) Stock repurchases net of options proceeds (111) (111) (176) Long-term debt repayment - - - Dividends paid (19) (76) (76) Other (includes Disc Ops) 7 9 9 Net change in cash and cash equivalents (232) (89) (98) Cash and cash equivalents, at the beginning of year 413 413 413 Cash and cash equivalents, at the end of period 181 $ 324 $ 315 $ FY11 Range (a) (a) Guidance does not take into consideration the effect of any future acquisitions, additional debt and/or share repurchases in excess of the repurchases needed to be within our 128 million to 130 million diluted weighted-average outstanding shares guidance. |
 20 Closed Sales to Revenue Contribution Closed Sales Stats: Recurring • Both ICS and SPS trending toward longer revenue recognition cycle • Larger strategic deals could take 12- 24 months to convert Event-Driven • Majority usually recognized during the year the deal closed • Sales are less predictable dependent on size of the client Revenue contribution could be +/-5% each year depending on the complexity of the conversion ($ in millions) Forecast Recurring FY09 FY10 FY11 ICS $55 $80 $35-50 ~ Revenue Contribution Year 55% 35% 10% 50% 40% 10% 35% 40% 25% SPS $40 $40 $75-100 ~ Revenue Contribution Year 25% 50% 25% 10% 50% 40% 5% 45% 50% Event-Driven $45 $55 $50-65 ~ Revenue Contribution Year 70% 10% 20% 80% 10% 10% 60% 20% 20% Total Closed Sales $140 $175 $160-215 ~ Revenue Contribution Year 50% 30% 20% 50% 30% 20% 30% 40% 30% 1-3 1-3 1-3 1-3 |
 21 Reconciliation of Non-GAAP to GAAP Measures Free Cash Flow Reconciliation Three Months Ended ($ in millions) September 2010 Low High Net earnings from continuing operations (GAAP) 13 $ 201 $ 212 $ Depreciation and amortization (includes other LT assets) 16 65 75 Stock-based compensation expense 6 30 30 Other - (5) 5 Subtotal 35 291 322 Working capital changes (62) (30) (25) Long-term assets and liabilities changes 2 (30) (20) Net cash flow (used in) provided by continuing operating activities (25) 231 277 Cash Flows From Investing Activities IBM / ITO data center investment - (20) (15) Capital expenditures and purchases of intangibles (7) (45) (40) Free cash flow (Non-GAAP) (32) $ 166 $ 222 $ FY11 Range EBIT Reconciliation 1Q10 1Q11 FY10 FY11 Range (a) ($ in millions) Actual Actual Actual Low High EBIT (Non-GAAP)* $45 $23 $352 $327 $350 Margin % 10.3% 5.5% 17.0% 14.6% 15.2% Interest & Other ($3) ($2) ($0) ($11) ($11) Total EBT (GAAP) $43 $21 $342 $316 $339 Margin % 9.7% 5.0% 15.5% 14.1% 14.7% EPS Reconciliation Low High Diluted EPS from continuing operations (GAAP) $0.19 $0.10 $1.62 $1.55 $1.65 One-time recognition of a deferred tax asset - - ($0.06) - - Diluted EPS before One-Times (Non-GAAP) $0.19 $0.10 $1.56 $1.55 $1.65 * Includes impact of FX Transaction Activity (a) Guidance does not take into consideration the effect of any future acquisitions, additional debt and/or share repurchases in excess of the repurchases needed to be within our 128 million to 130 million diluted weighted-average outstanding shares guidance. |
  22 FY11 Grow-over MSSB and Penson are expected to be accretive in FY12 and FY13 driven by revenue growth and scale in the business IBM ITO– planning on range of $5- 10M hitting primarily in third and fourth quarters. Including FY11, there will be approximately $25M total expense over two years. IBM ITO is expected to result in approximately $25M annual savings beginning FY13 over the next 10 years City Networks Acquisition - $21M Revenue and EBIT ($2M) in the first year due to the amortization of intangibles and first year deferred revenue GAAP accounting. No negative impact to cash flow FY11 ($ in millions, except for EPS) 1Q11 Actual & FY11 Forecast FY11 Strategic Revenue EBIT Penson $31 ($9) ~ Actual Q1 & Forecast Q2/3/4 Distribution $5/6/9/11 $(4) / (4) /(1) /1 MSSB $23 $3 ~ Actual Q1 & Forecast Q2/3/4 Distribution $10/7/4/2 $(3) /3/2/1 IBM ($8) ~ Actual Q1 & Forecast Q2/3/4 Distribution $0/(2) / (2) /(4) City Networks $21 ($2) ~ Actual Q1 & Forecast Q2/3/4 Distribution $6/5/5/5 $(1) / (1) /(1) /1 Other MF Proxy ($119) ($52) ~ Actual Q1 & Forecast Q2/3/4 Distribution $ (21)/ (97)/ (2) /1 $(11) / (40)/ (1) /0 BAML Client Loss ($13) ($13) ~ Actual Q1 & Forecast Q2/3/4 Distribution $ (5) /(3) / (3)/ (2) $ (5)/ (3) / (3)/ (2) Total Grow-overs ($57) ($80) ~ Actual Q1 & Forecast Q2/3/4 Distribution $ (5)/ (83)/13/18 $(25)/ (47)/ (6) / (2) Impact on EPS ($0.39) ~ Actual Q1 & Forecast Q2/3/4 Distribution $(.12) / (.23) / (.03) /(.01) |
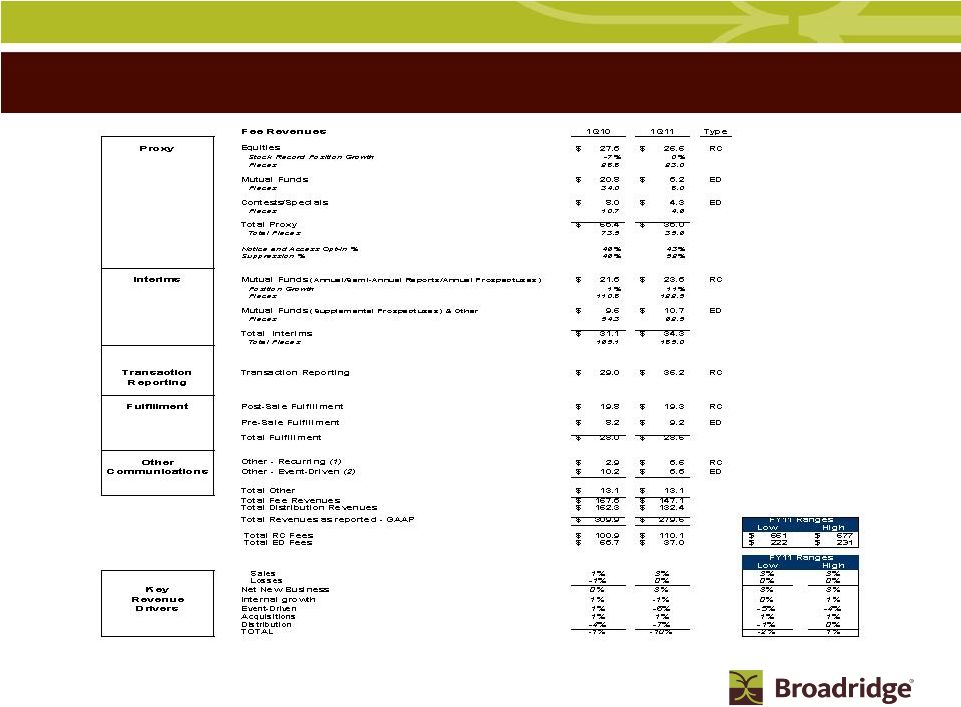 $ in millions RC= Recurring ED= Event-Driven 23 ICS Key Segment Revenue Stats (1) Other Recurring Fee Revenue includes NewRiver, StockTrans, Access Data and Tax Reporting (2) Other event-driven includes 2.2M pieces for 1Q10 and 2.0M for 1Q11, primarily related to corporate actions. Note: Certain prior period amounts have been reclassified to conform with current period presentation |
 24 SPS and Outsourcing Key Segment Revenue Stats $ in millions RC= Recurring ED= Event-Driven 1Q10 1Q11 Type Equity Trades 58.9 $ 55.1 $ RC Internal Trade Volume (1) 1,469 1,423 Internal Trade Growth 0% -3% Trade Volume (Average Trades per Day in '000) (2) 1,485 1,437 Other Equity Services 46.2 $ 51.9 $ RC Total Equity 105.1 $ 107.0 $ Fixed Income Trades (4) 12.3 $ 13.5 $ RC Internal Trade Volume (1) 286 306 Internal Trade Growth -7% 7% Trade Volume (Average Trades per Day in '000) (3) 286 306 Other Fixed Income Services (4) 6.9 $ 7.1 $ RC Total Fixed Income 19.1 $ 20.6 $ Outsourcing 5.9 $ 14.0 $ # of Clients 7 11 Total Net Revenue as reported - GAAP 130.1 $ 141.7 $ FY11 Ranges Low High Sales 4% 4% 5% 6% Losses -4% -5% -4% -4% Net New Business 0% -1% 1% 2% Transaction & Non-transaction -2% 3% 0% 4% Equity Transaction-Based Non-Transaction Fixed Income Transaction-Based Non-Transaction Outsourcing Key Revenue Drivers Concessions -5% -2% -2% -2% Internal growth -7% 1% -2% 2% Acquisitions 0% 9% 11% 11% TOTAL -7% 9% 10% 15% (4) Fixed Income 1Q10 re-stated to reclassify $0.3M mortgage product revenue to other fixed income services. (2) Equity Trade volume adjusted to excludes trades processed under fixed priced contracts. Management believes excluding this trade volume presents a stronger correlation between trade volume and Equity Trade revenue. (1) 1Q10 Internal Trade Volume previously was reported as 1,456 and 249 for Equities and Fixed Income, respectively. These numbers were adjusted to reflect Losses and Sales in order to present consistent business for the purpose of calculating internal trade growth. (3) Prior Year's trade volume re-stated for comparability. |
 Broadridge ICS Definitions 25 |
 26 Use of Materials Contained Herein The information contained in this presentation is being provided for your convenience and information only. This information is accurate as of the date of its initial presentation. If you plan to use this information for any purpose, verification of its continued accuracy is your responsibility. Broadridge assumes no duty to update or revise the information contained in this presentation. You may reproduce information contained in this presentation provided you do not alter, edit, or delete any of the content and provided you identify the source of the information as Broadridge Financial Solutions, Inc., which owns the copyright. Broadridge and the Broadridge logo are registered trademarks of Broadridge Financial Solutions, Inc. |