Exhibit 99.2
|

Exhibit 99.2
Earnings Webcast & Conference Call
First Quarter Fiscal Year 2012
© 2011 Broadridge Financial Solutions, Inc.
Broadridge and the Broadridge logo are registered trademarks of Broadridge Financial Solutions, Inc.
November 3, 2011
|
Forward-Looking Statements and Non-GAAP Measures
This presentation and other written or oral statements made from time to time by representatives of Broadridge may contain “forward-looking statements” within the meaning of the Private Securities Litigation Reform Act of 1995. Statements that are not historical in nature, and which may be identified by the use of words like “expects,” “assumes,” “projects,” “anticipates,” “estimates,” “we believe,” “could be” and other words of similar meaning, are forward-looking statements. In particular, information appearing in the “Fiscal Year 2012 Financial Guidance” section and statements about our future financial performance are forward-looking statements. These statements are based on management’s expectations and assumptions and are subject to risks and uncertainties that may cause actual results to differ materially from those expressed. These risks and uncertainties include those risk factors discussed in Part I, “Item 1A. Risk Factors” of our Annual Report on Form 10-K for the fiscal year ended June 30, 2011 (the “2011 Annual Report”), as they may be updated in any future reports filed with the Securities and Exchange Commission. All forward-looking statements speak only as of the date of this presentation and are expressly qualified in their entirety by reference to the factors discussed in the 2011 Annual Report. These risks include: the success of Broadridge in retaining and selling additional services to its existing clients and in obtaining new clients; Broadridge’s reliance on a relatively small number of clients, the continued financial health of those clients, and the continued use by such clients of Broadridge’s sevices with favorable pricing terms; changes in laws and regulations affecting the investor communication services provided by Broadridge; declines in participation and activity in the securities markets; overall market and economic conditions and their impact on the securities markets; any material breach of Broadridge security affecting its clients’ customer information; the failure of Broadridge’s outsourced data center services provider to provide the anticipated levels of service; any significant slowdown or failure of Broadridge’s systems or error in the performance of Broadridge’s services; Broadridge’s failure to keep pace with changes in technology and demands of its clients; Broadridge’s ability to attract and retain key personnel; the impact of new acquisitions and divestitures; and competitive conditions. Broadridge disclaims any obligation to update or revise forward-looking statements that may be made to reflect events or circumstances that arise after the date made or to reflect the occurrence of unanticipated events, other than as required by law.
This presentation may include certain Non-GAAP (generally accepted accounting principles) financial measures in describing Broadridge’s performance. Management believes that such Non-GAAP measures, when presented in conjunction with comparable GAAP measures provide investors a more complete understanding of Broadridge’s underlying operational results. These Non-GAAP measures are indicators that management uses to provide additional meaningful comparisons between current results and prior reported results, and as a basis for planning and forecasting for future periods. These measures should be considered in addition to and not a substitute for the measures of financial performance prepared in accordance with GAAP. The reconciliations of such measures to the comparable GAAP figures are included in this presentation.
1 |
|
|

Today’s Agenda
Opening Remarks, Financial Highlights and Other Key Topics
First Quarter Fiscal Year 2012 Highlights and Segment Results
Summary Q&A Closing Remarks
Rich Daly, CEO Dan Sheldon, CFO Rich Daly, CEO
Rich Daly, CEO Dan Sheldon, CFO
Rich Daly, CEO
2
|
Opening Remarks
Key Topics:
Financial Highlights
Closed Sales Performance Paladyne Systems Acquisition
Key Activities Update
3
|
Financial Highlights
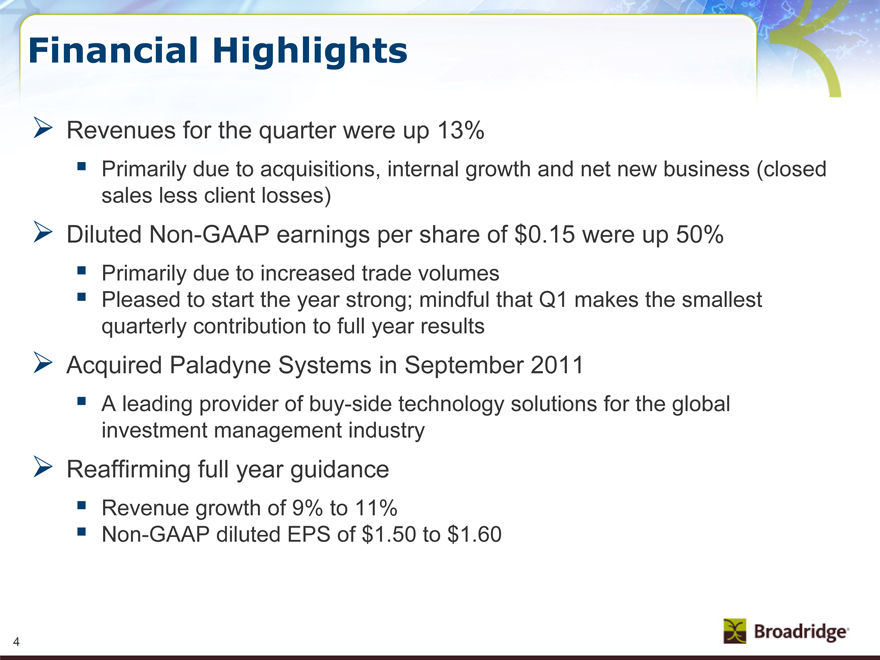
Revenues for the quarter were up 13%
Primarily due to acquisitions, internal growth and net new business (closed sales less client losses) Diluted Non-GAAP earnings per share of $0.15 were up 50% Primarily due to increased trade volumes Pleased to start the year strong; mindful that Q1 makes the smallest quarterly contribution to full year results Acquired Paladyne Systems in September 2011 A leading provider of buy-side technology solutions for the global investment management industry Reaffirming full year guidance
Revenue growth of 9% to 11%
Non-GAAP diluted EPS of $1.50 to $1.60
4
|
Closed Sales Performance
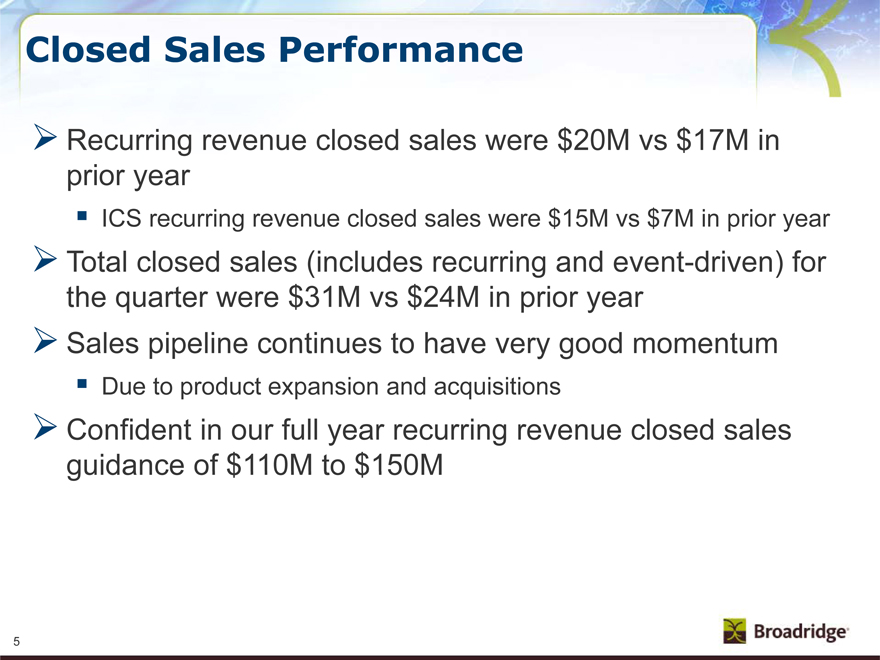
Recurring revenue closed sales were $20M vs $17M in prior year
ICS recurring revenue closed sales were $15M vs $7M in prior year
Total closed sales (includes recurring and event-driven) for the quarter were $31M vs $24M in prior year Sales pipeline continues to have very good momentum
Due to product expansion and acquisitions
Confident in our full year recurring revenue closed sales guidance of $110M to $150M
5
|
Paladyne Systems Acquisition
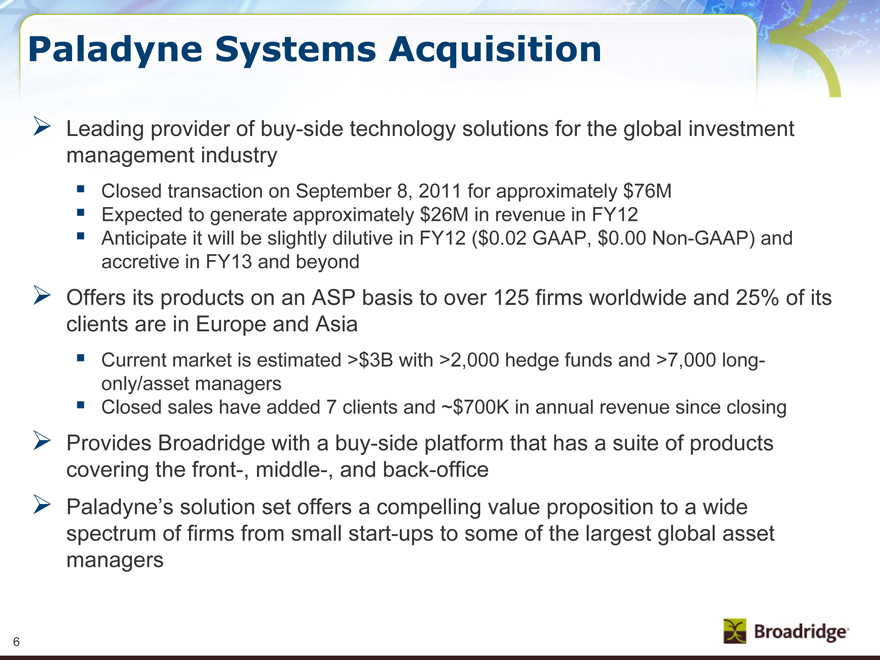
Leading provider of buy-side technology solutions for the global investment management industry
Closed transaction on September 8, 2011 for approximately $76M
Expected to generate approximately $26M in revenue in FY12
Anticipate it will be slightly dilutive in FY12 ($0.02 GAAP, $0.00 Non-GAAP) and accretive in FY13 and beyond Offers its products on an ASP basis to over 125 firms worldwide and 25% of its clients are in Europe and Asia Current market is estimated >$3B with >2,000 hedge funds and >7,000 long-only/asset managers Closed sales have added 7 clients and ~$700K in annual revenue since closing Provides Broadridge with a buy-side platform that has a suite of products covering the front-, middle-, and back-office Paladyne’s solution set offers a compelling value proposition to a wide spectrum of firms from small start-ups to some of the largest global asset managers
6
|
Key Activities Update
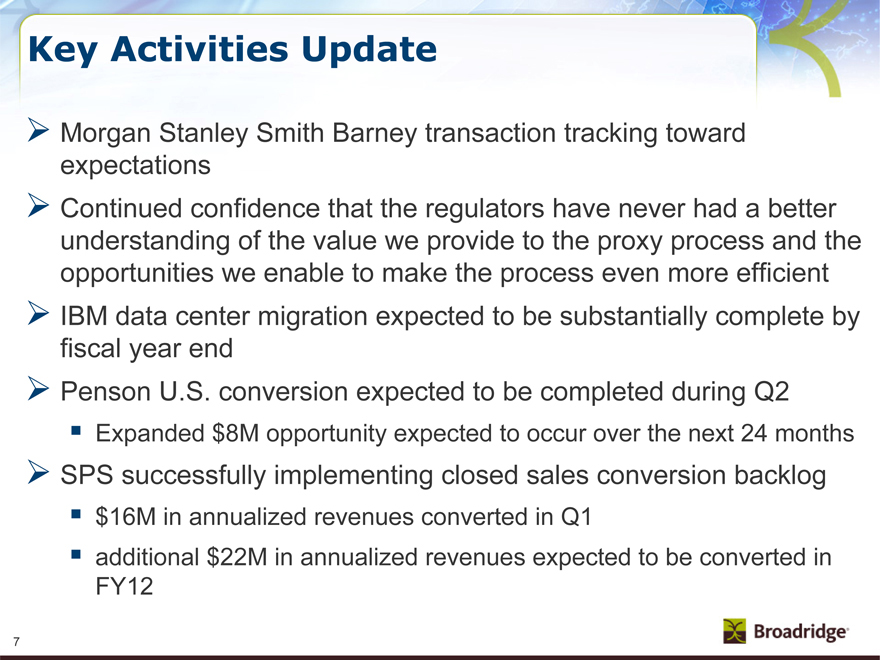
Morgan Stanley Smith Barney transaction tracking toward expectations
Continued confidence that the regulators have never had a better understanding of the value we provide to the proxy process and the opportunities we enable to make the process even more efficient
IBM data center migration expected to be substantially complete by fiscal year-end
Penson U.S. conversion expected to be completed during Q2
Expanded $8M opportunity expected to occur over the next 24 months
SPS successfully implementing closed sales conversion backlog
$16M in annualized revenues converted in Q1
additional $22M in annualized revenues expected to be converted in FY12
7
|
Q1 FY12 Financial Highlights
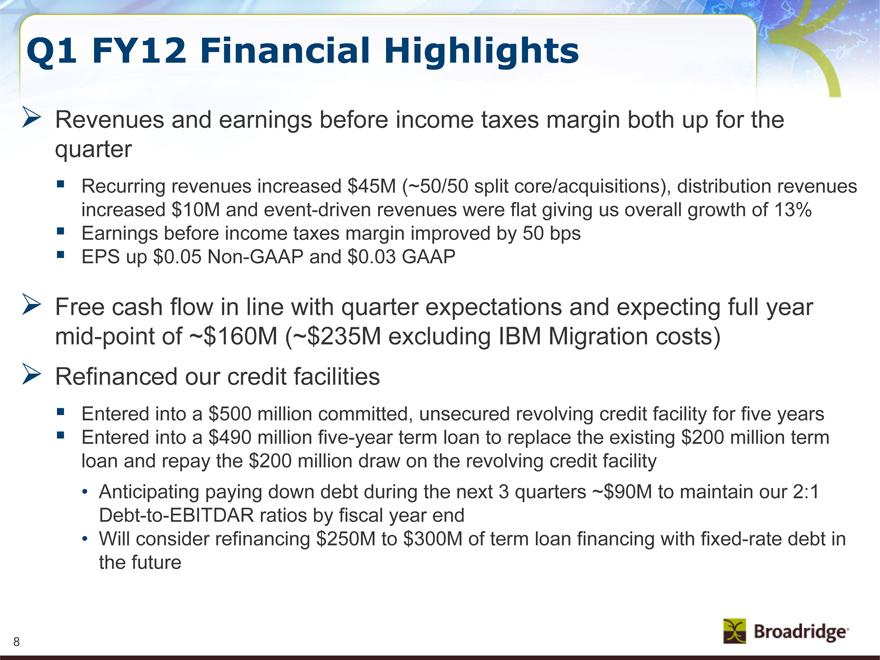
Revenues and earnings before income taxes margin both up for the quarter
Recurring revenues increased $45M (~50/50 split core/acquisitions), distribution revenues increased $10M and event-driven revenues were flat giving us overall growth of 13%
Earnings before income taxes margin improved by 50 bps
EPS up $0.05 Non-GAAP and $0.03 GAAP
Free cash flow in line with quarter expectations and expecting full year mid-point of ~$160M (~$235M excluding IBM Migration costs)
Refinanced our credit facilities
Entered into a $500 million committed, unsecured revolving credit facility for five years
Entered into a $490 million five-year term loan to replace the existing $200 million term loan and repay the $200 million draw on the revolving credit facility
Anticipating paying down debt during the next 3 quarters ~$90M to maintain our 2:1 Debt-to-EBITDAR ratios by fiscal year end
Will consider refinancing $250M to $300M of term loan financing with fixed-rate debt in the future
8
|
Segment Results & Forecast –
Investor Communication Solutions
Revenue/Growth EBIT/Growth (Non-GAAP) Margin/Growth (Non-GAAP)
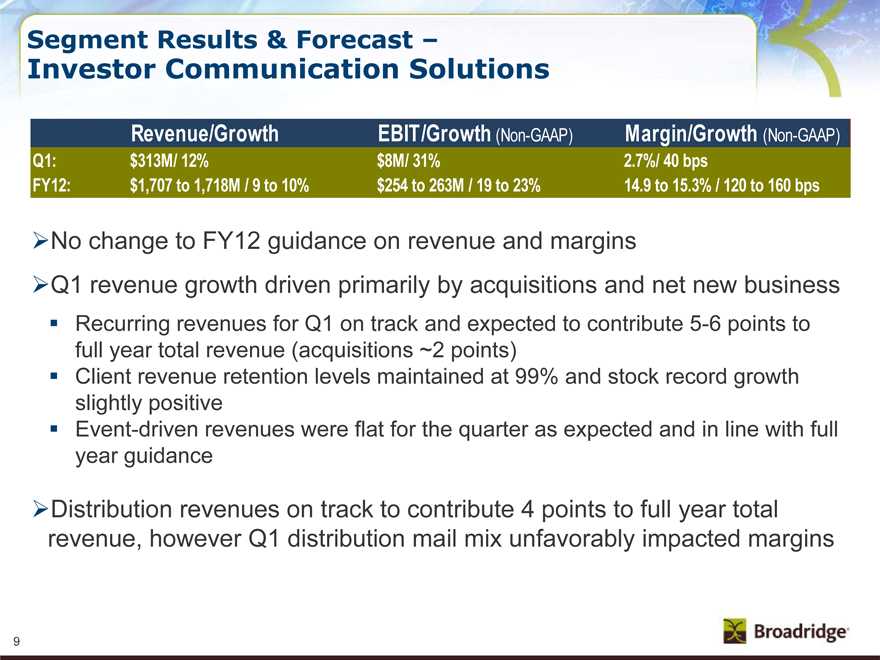
Q1: $313M/ 12% $8M/ 31% 2.7%/ 40 bps
FY12: $1,707 to 1,718M / 9 to 10% $254 to 263M / 19 to 23% 14.9 to 15.3% / 120 to 160 bps
No change to FY12 guidance on revenue and margins
Q1 revenue growth driven primarily by acquisitions and net new business
Recurring revenues for Q1 on track and expected to contribute 5-6 points to full year total revenue (acquisitions ~2 points)
Client revenue retention levels maintained at 99% and stock record growth slightly positive
Event-driven revenues were flat for the quarter as expected and in line with full year guidance
Distribution revenues on track to contribute 4 points to full year total revenue, however Q1 distribution mail mix unfavorably impacted margins
9
|
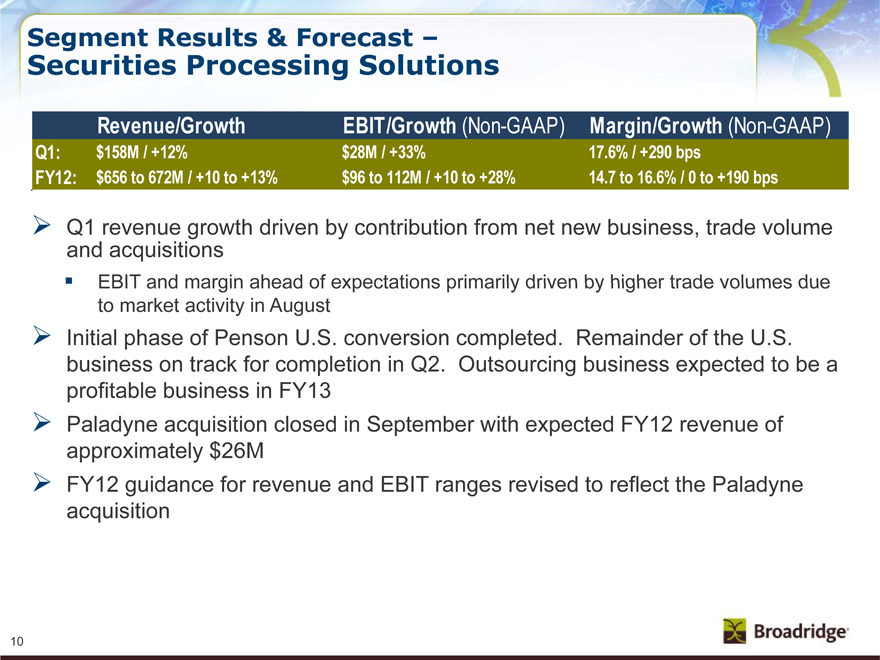
Segment Results & Forecast –
Securities Processing Solutions
Revenue/Growth EBIT/Growth (Non-GAAP) Margin/Growth (Non-GAAP)
Q1: $158M / +12% $28M / +33% 17.6% / +290 bps
FY12: $656 to 672M / +10 to +13% $96 to 112M / +10 to +28% 14.7 to 16.6% / 0 to +190 bps
Q1 revenue growth driven by contribution from net new business, trade volume and acquisitions
EBIT and margin ahead of expectations primarily driven by higher trade volumes due to market activity in August
Initial phase of Penson U.S. conversion completed. Remainder of the U.S. business on track for completion in Q2. Outsourcing business expected to be a profitable business in FY13
Paladyne acquisition closed in September with expected FY12 revenue of approximately $26M
FY12 guidance for revenue and EBIT ranges revised to reflect the Paladyne acquisition
10
|
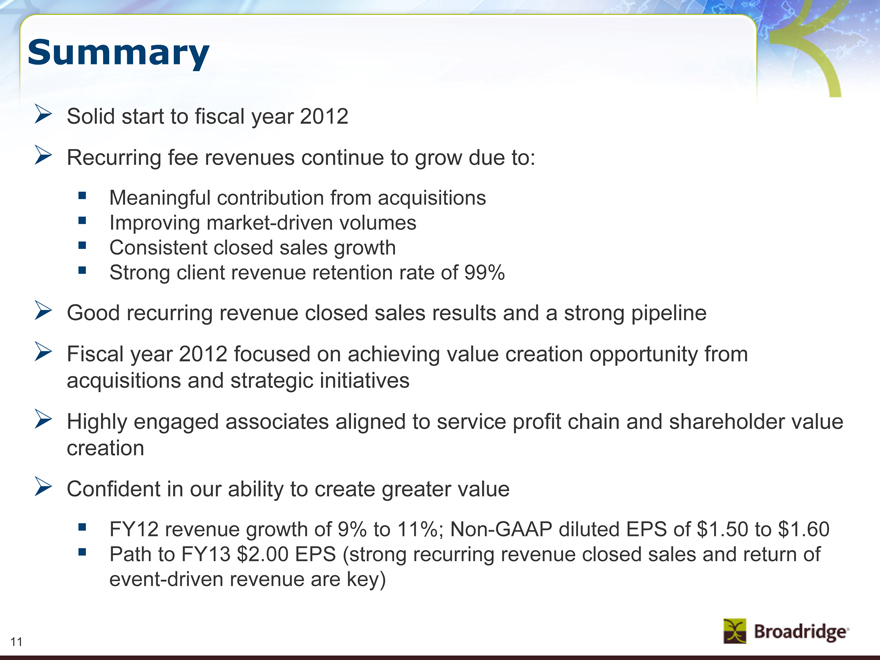
Summary
Solid start to fiscal year 2012
Recurring fee revenues continue to grow due to:
Meaningful contribution from acquisitions
Improving market-driven volumes
Consistent closed sales growth
Strong client revenue retention rate of 99%
Good recurring revenue closed sales results and a strong pipeline
Fiscal year 2012 focused on achieving value creation opportunity from acquisitions and strategic initiatives
Highly engaged associates aligned to service profit chain and shareholder value creation
Confident in our ability to create greater value
FY12 revenue growth of 9% to 11%; Non-GAAP diluted EPS of $1.50 to $1.60
Path to FY13 $2.00 EPS (strong recurring revenue closed sales and return of event-driven revenue are key)
11
|

Q&A
There are no slides during this portion of the presentation
12
|

Closing Comments
There are no slides during this portion of the presentation
13
|

Appendix
14
|
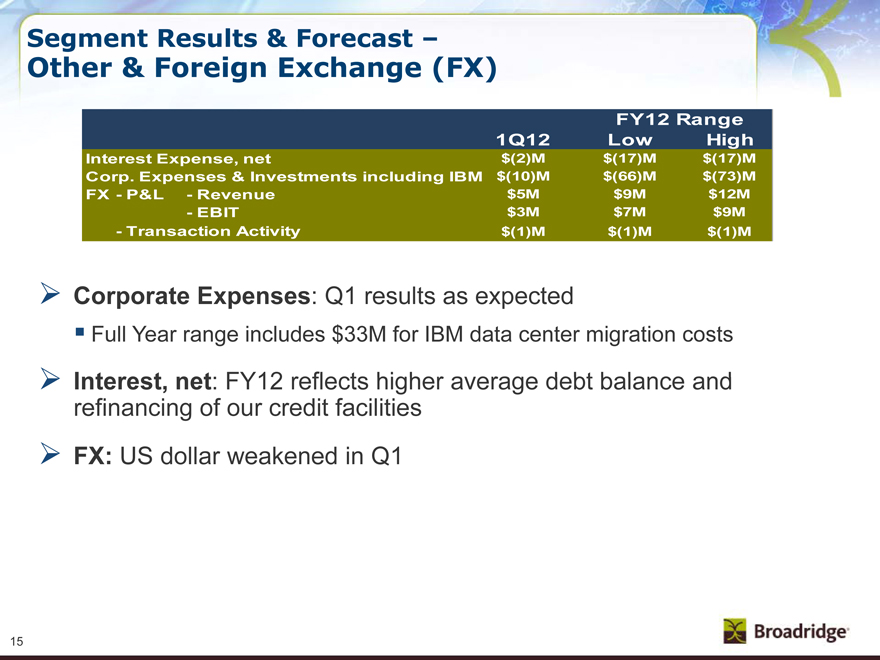
Segment Results & Forecast –
Other & Foreign Exchange (FX)
FY12 Range
1Q12 Low High
Interest Expense, net $(2)M $(17)M $(17)M
Corp. Expenses & Investments including IBM $(10)M $(66)M $(73)M
FX - P&L - Revenue $5M $9M $12M
-EBIT $3M $7M $9M
- Transaction Activity $(1)M $(1)M $(1)M
Corporate Expenses: Q1 results as expected
Full Year range includes $33M for IBM data center migration costs
Interest, net: FY12 reflects higher average debt balance and refinancing of our credit facilities
FX: US dollar weakened in Q1
15
|
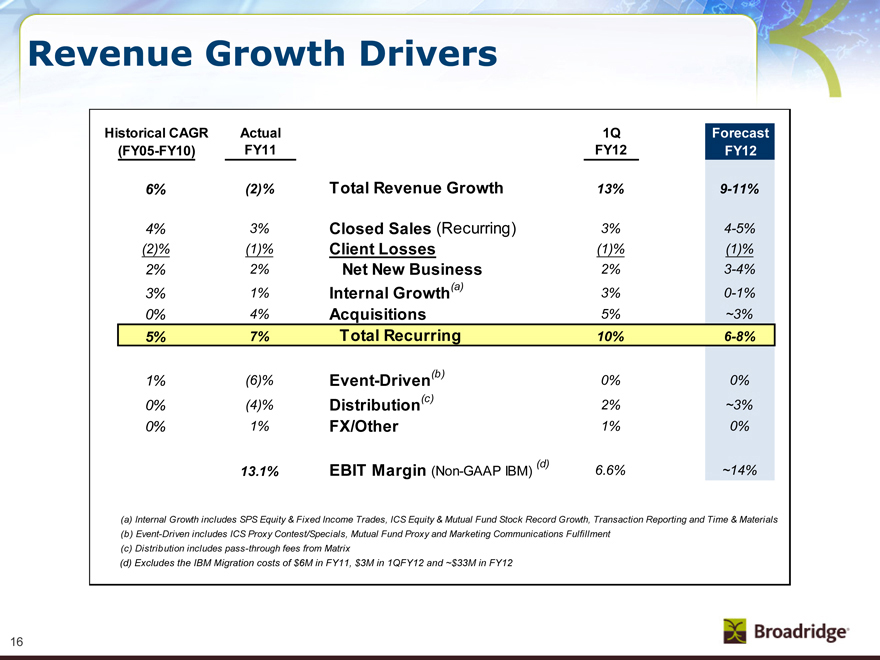
Revenue Growth Drivers
Historical CAGR Actual 1Q Forecast
(FY05-FY10) FY11 FY12 FY12
6% (2)% Total Revenue Growth 13% 9-11%
4% 3% Closed Sales (Recurring) 3% 4-5%
(2)% (1)% Client Losses (1)% (1)%
2% 2% Net New Business 2% 3-4%
3% 1% Internal Growth(a) 3% 0-1%
0% 4% Acquisitions 5% ~3%
5% 7% Total Recurring 10% 6-8%
1% (6)% Event-Driven(b) 0% 0%
0% (4)% Distribution(c) 2% ~3%
0% 1% FX/Other 1% 0%
13.1% EBIT Margin (Non-GAAP IBM) (d) 6.6% ~14%
(a) Internal Growth includes SPS Equity & Fixed Income Trades, ICS Equity & Mutual Fund Stock Record Growth, Transaction Reporting and Time & Materials
(b) Event-Driven includes ICS Proxy Contest/Specials, Mutual Fund Proxy and Marketing Communications Fulfillment (c) Distribution includes pass-through fees from Matrix
(d) Excludes the IBM migration costs of $6M in FY11, $3M in 1Q12 and ~$33M in FY12
16
|
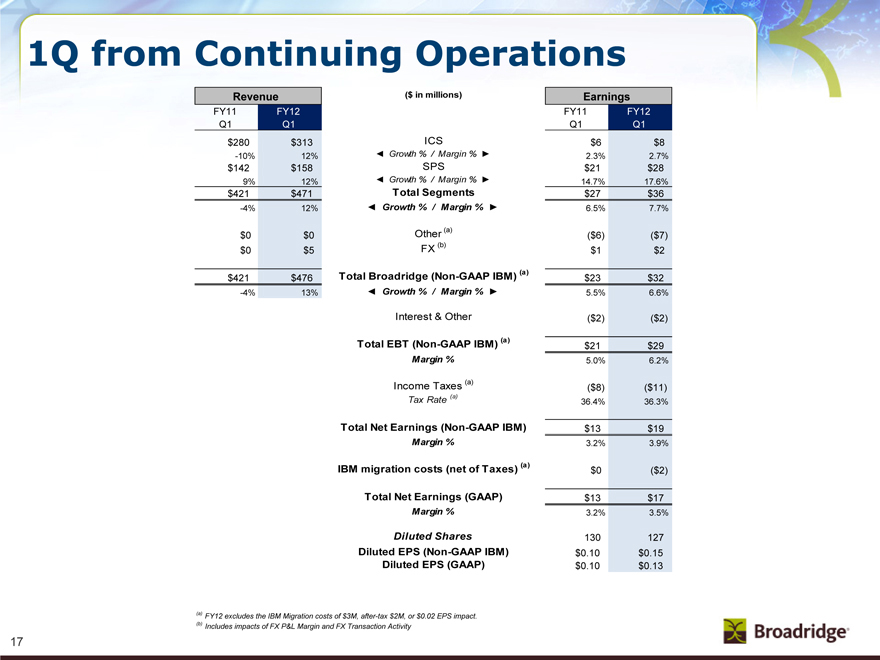
1Q from Continuing Operations
Revenue
FY11 FY12
Q1 Q1
$280 $313
-10% 12%
$142 $158
9% 12%
$421 $471
-4% 12%
$0 $0
$0 $5
$421 $476
-4% 13%
($ in millions)
ICS
Growth % / Margin %
SPS
Growth % / Margin %
Total Segments
Growth % / Margin %
Other (a)
FX (b)
Total Broadridge (Non-GAAP IBM) (a)
Growth % / Margin %
Interest & Other
Total EBT (Non-GAAP IBM) (a)
Margin %
Income Taxes (a)
Tax Rate (a)
Total Net Earnings (Non-GAAP IBM)
Margin %
IBM migration costs (net of Taxes) (a)
Total Net Earnings (GAAP)
Margin %
Diluted Shares
Diluted EPS (Non-GAAP IBM) Diluted EPS (GAAP)
Earnings
FY11 FY12
Q1 Q1
$6 $8
2.3% 2.7%
$21 $28
14.7% 17.6%
$27 $36
6.5% 7.7%
($6) ($7)
$1 $2
$23 $32
5.5% 6.6%
($2) ($2)
$21 $29
5.0% 6.2%
($8) ($11)
36.4% 36.3%
$13 $19
3.2% 3.9%
$0 ($2)
$13 $17
3.2% 3.5%
130 127
$0.10 $0.15
$0.10 $0.13
(a) FY12 excludes the IBM migration costs of $3M, after-tax $2M, or $0.02 EPS impact.
(b) Includes impacts of FX P&L Margin and FX Transaction Activity
17
|
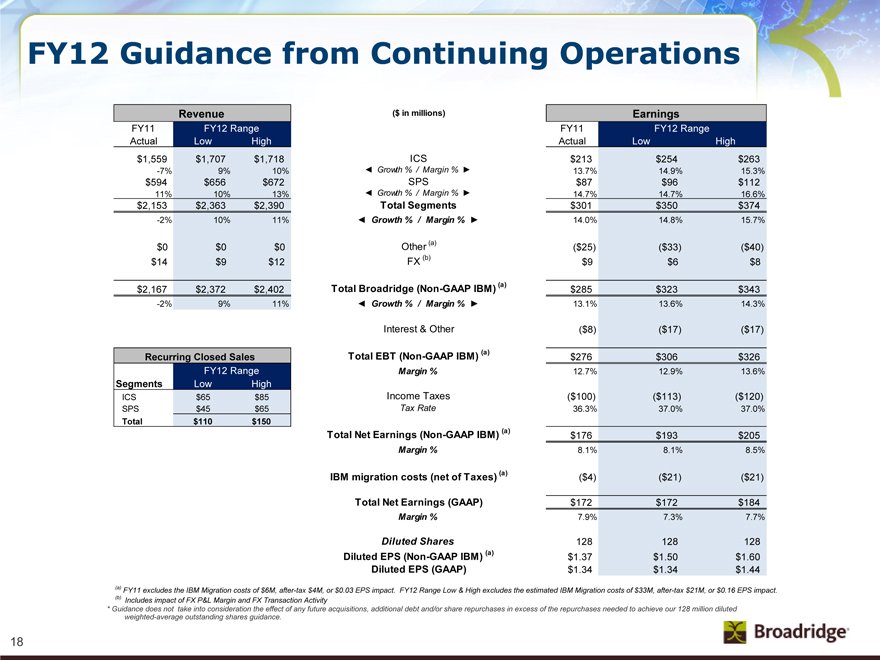
FY12 Guidance from Continuing Operations
Revenue
FY11 FY12 Range
Actual Low High
$1,559 $1,707 $1,718
-7% 9% 10%
$594 $656 $672
11% 10% 13%
$2,153 $2,363 $2,390
-2% 10% 11%
$0 $0 $0
$14 $9 $12
$2,167 $2,372 $2,402
-2% 9% 11%
Recurring Closed Sales
FY12 Range
Segments Low High
ICS $65 $85
SPS $45 $65
Total $110 $150
($ in millions)
ICS
Growth % / Margin %
SPS
Growth % / Margin %
Total Segments
Growth % / Margin %
Other (a)
FX (b)
Total Broadridge (Non-GAAP IBM) (a)
Growth % / Margin %
Interest & Other
Total EBT (Non-GAAP IBM) (a)
Margin %
Income Taxes
Tax Rate
Total Net Earnings (Non-GAAP IBM) (a)
Margin %
IBM migration costs (net of Taxes) (a)
Total Net Earnings (GAAP)
Margin %
Diluted Shares
Diluted EPS (Non-GAAP IBM) (a) Diluted EPS (GAAP)
Earnings
FY11 FY12 Range
Actual Low High
$213 $254 $263
13.7% 14.9% 15.3%
$87 $96 $112
14.7% 14.7% 16.6%
$301 $350 $374
14.0% 14.8% 15.7%
($25) ($33) ($40)
$9 $6 $8
$285 $323 $343
13.1% 13.6% 14.3%
($8) ($17) ($17)
$276 $306 $326
12.7% 12.9% 13.6%
($100) ($113) ($120)
36.3% 37.0% 37.0%
$176 $193 $205
8.1% 8.1% 8.5%
($4) ($21) ($21)
$172 $172 $184
7.9% 7.3% 7.7%
128 128 128
$1.37 $1.50 $1.60
$1.34 $1.34 $1.44
(a) FY11 excludes the IBM Migration costs of $6M, after-tax $4M, or $0.03 EPS impact. FY12 Range Low & High excludes the estimated IBM Migration costs of $33M, after-tax $21M, or $0.16 EPS impact.
(b) Includes impact of FX P&L Margin and FX Transaction Activity
* Guidance does not take into consideration the effect of any future acquisitions, additional debt and/or share repurchases in excess of the repurchases needed to achieve our 128 million diluted weighted-average outstanding shares guidance.
18
|
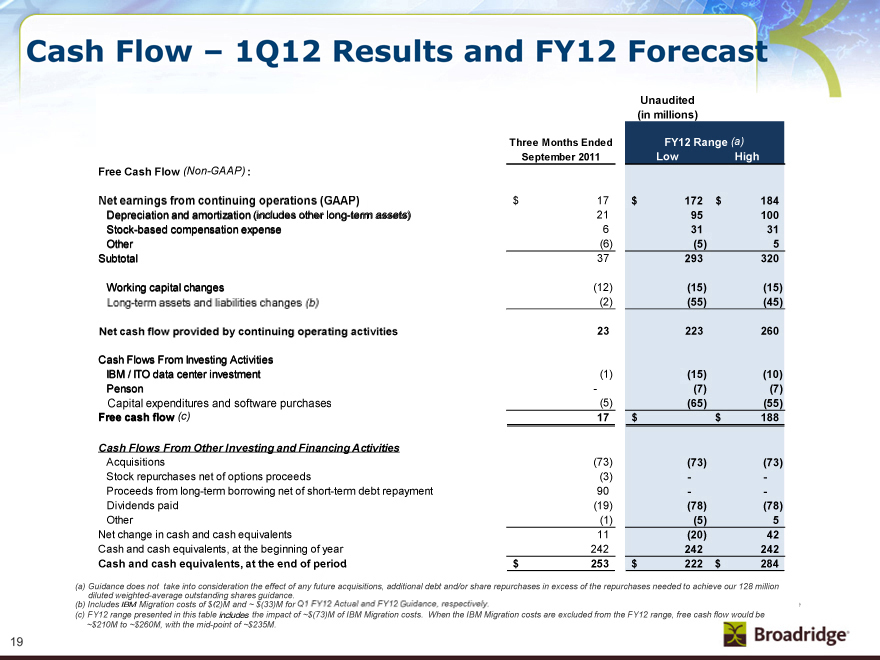
Cash Flow – 1Q12 Results and FY12 Forecast
Unaudited (in millions)
Three Months Ended FY12 Range (a)
September 2011 Low High
Free Cash Flow (Non-GAAP) :
Net earnings from continuing operations (GAAP) $ 17 $ 172 $ 184
Depreciation and amortization (includes other long-term assets) 21 95 100
Stock-based compensation expense 6 31 31
Other (6) (5) 5
Subtotal 37 293 320
Working capital changes (12) (15) (15)
Long-term assets and liabilities changes (b) (2) (55) (45)
Net cash flow provided by continuing operating activities 23 223 260
Cash Flows From Investing Activities
IBM / ITO data center investment (1) (15) (10)
Penson - (7) (7)
Capital expenditures and software purchases (5) (65) (55)
Free cash flow (c) $ 17 $ 136 $ 188
Cash Flows From Other Investing and Financing Activities
Acquisitions (73) (73) (73)
Stock repurchases net of options proceeds (3) - -
Proceeds from long-term borrowing net of short-term debt repayment 90 - -
Dividends paid (19) (78) (78)
Other (1) (5) 5
Net change in cash and cash equivalents 11 (20) 42
Cash and cash equivalents, at the beginning of year 242 242 242
Cash and cash equivalents, at the end of period $ 253 $ 222 $ 284
(a) Guidance does not take into consideration the effect of any future acquisitions, additional debt and/or share repurchases in excess of the repurchases needed to achieve our 128 million diluted weighted-average outstanding shares guidance.
(b) Includes IBM Migration costs of $(2)M and ~$(33)M for Q1 FY12 Actual and FY12 guidance, respectively.
(c) FY12 range presented in this table include the impact of ~$(73)M of IBM Migration costs. When the IBM Migration costs are excluded from the FY12 range, free cash flow would be ~$210M to ~$260M, with the mid-point of ~$235M.
19
|
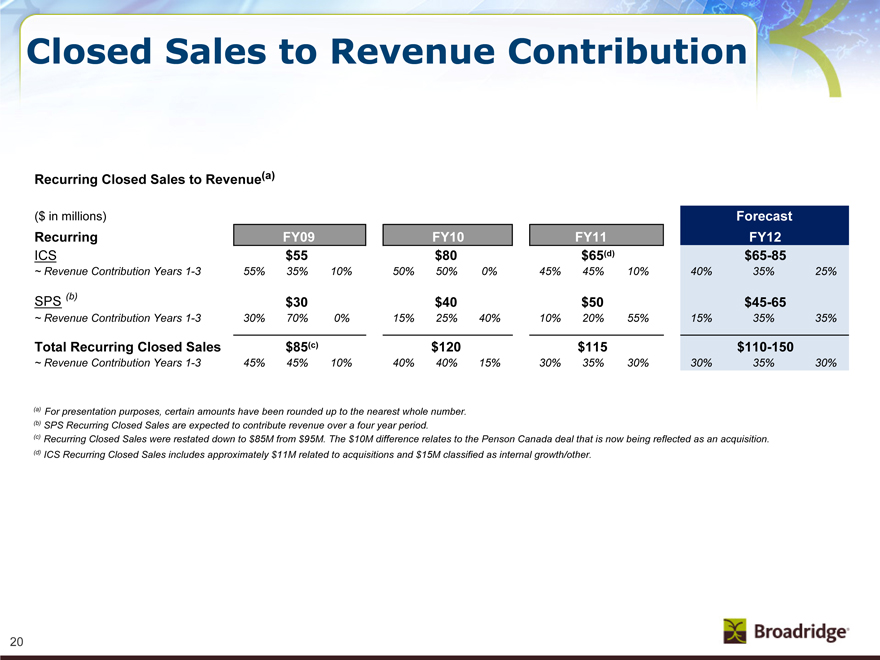
Closed Sales to Revenue Contribution
Recurring Closed Sales to Revenue (a)
($ in millions) Forecast
Recurring FY09 FY10 FY11 FY12
ICS $55 $80 $65(d) $65-85
~ Revenue Contribution Years 1-3 55% 35% 10% 50% 50% 0% 45% 45% 10% 40% 35% 25%
SPS (b) $30 $40 $50 $45-65
~ Revenue Contribution Years 1-3 30% 70% 0% 15% 25% 40% 10% 20% 55% 15% 35% 35%
Total Recurring Closed Sales $85(c) $120 $115 $110-150
~ Revenue Contribution Years 1-3 45% 45% 10% 40% 40% 15% 30% 35% 30% 30% 35% 30%
(a) For presentation purposes, certain amounts have been rounded up to the nearest whole number.
(b) SPS Recurring Closed Sales are expected to contribute revenue over a four year period.
(c) Recurring Closed Sales were restated down to $85M from $95M. The $10M difference relates to the Penson Canada deal that is now being reflected as an acquisition.
(d) ICS Recurring Closed Sales includes approximately $11M related to acquisitions and $15M classified as internal growth/other.
20
|
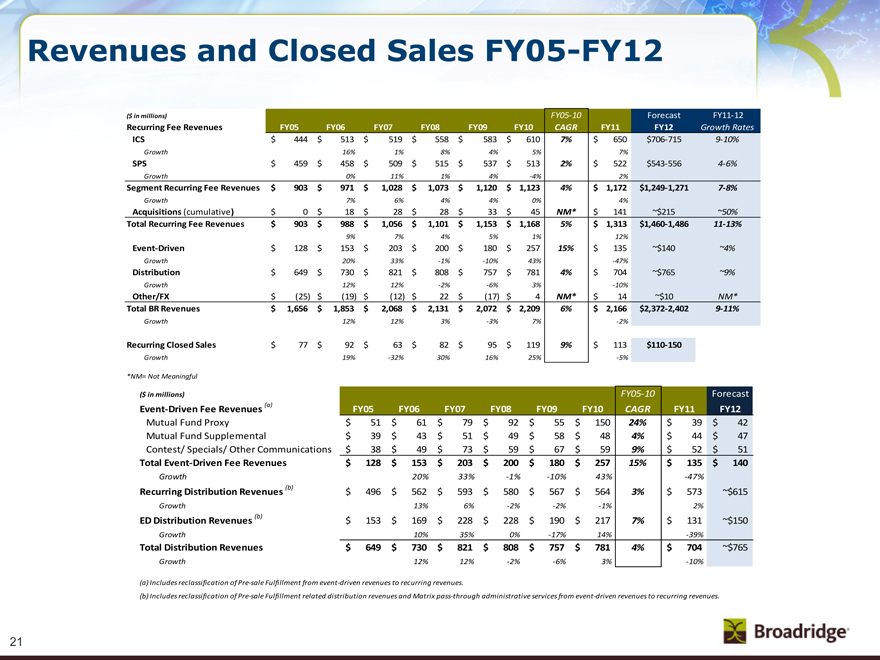
Revenues and Closed Sales FY05-FY12
($ in millions) FY05-10 Forecast FY11-12
Recurring Fee Revenues FY05 FY06 FY07 FY08 FY09 FY10 CAGR FY11 FY12 Growth Rates
ICS $ 444 $ 513 $ 519 $ 558 $ 583 $ 610 7% $ 650 $706-715 9-10%
Growth 16% 1% 8% 4% 5% 7%
SPS $ 459 $ 458 $ 509 $ 515 $ 537 $ 513 2% $ 522 $543-556 4-6%
Growth 0% 11% 1% 4% -4% 2%
Segment Recurring Fee Revenues $ 903 $ 971 $ 1,028 $ 1,073 $ 1,120 $ 1,123 4% $ 1,172 $1,249-1,271 7-8%
Growth 7% 6% 4% 4% 0% 4%
Acquisitions (cumulative) $ 0 $ 18 $ 28 $ 28 $ 33 $ 45 NM* $ 141 ~$215 ~50%
Total Recurring Fee Revenues $ 903 $ 988 $ 1,056 $ 1,101 $ 1,153 $ 1,168 5% $ 1,313 $1,460-1,486 11-13%
9% 7% 4% 5% 1% 12%
Event-Driven $ 128 $ 153 $ 203 $ 200 $ 180 $ 257 15% $ 135 ~$140 ~4%
Growth 20% 33% -1% -10% 43% -47%
Distribution $ 649 $ 730 $ 821 $ 808 $ 757 $ 781 4% $ 704 ~$765 ~9%
Growth 12% 12% -2% -6% 3% -10%
Other/FX $ (25) $ (19) $ (12) $ 22 $ (17) $ 4 NM* $ 14 ~$10 NM*
Total BR Revenues $ 1,656 $ 1,853 $ 2,068 $ 2,131 $ 2,072 $ 2,209 6% $ 2,166 $2,372-2,402 9-11%
Growth 12% 12% 3% -3% 7% -2%
Recurring Closed Sales $ 77 $ 92 $ 63 $ 82 $ 95 $ 119 9% $ 113 $110-150
Growth 19% -32% 30% 16% 25% -5%
*NM= Not Meaningful
($ in millions) FY05-10 Forecast
Event-Driven Fee Revenues (a) FY05 FY06 FY07 FY08 FY09 FY10 CAGR FY11 FY12
Mutual Fund Proxy $ 51 $ 61 $ 79 $ 92 $ 55 $ 150 24% $ 39 $ 42
Mutual Fund Supplemental $ 39 $ 43 $ 51 $ 49 $ 58 $ 48 4% $ 44 $ 47
Contest/ Specials/ Other Communications $ 38 $ 49 $ 73 $ 59 $ 67 $ 59 9% $ 52 $ 51
Total Event-Driven Fee Revenues $ 128 $ 153 $ 203 $ 200 $ 180 $ 257 15% $ 135 $ 140
Growth 20% 33% -1% -10% 43% -47%
Recurring Distribution Revenues (b) $ 496 $ 562 $ 593 $ 580 $ 567 $ 564 3% $ 573 ~$615
Growth 13% 6% -2% -2% -1% 2%
ED Distribution Revenues (b) $ 153 $ 169 $ 228 $ 228 $ 190 $ 217 7% $ 131 ~$150
Growth 10% 35% 0% -17% 14% -39%
Total Distribution Revenues $ 649 $ 730 $ 821 $ 808 $ 757 $ 781 4% $ 704 ~$765
Growth 12% 12% -2% -6% 3% -10%
(a) |
| Includes reclassification of Pre-sale Fulfillment from event-driven revenues to recurring revenues. |
(b) Includes reclassification of Pre-sale Fulfillment related distribution revenues and Matrix pass-through administrative services from event-driven revenues to recurring revenues.
21
|
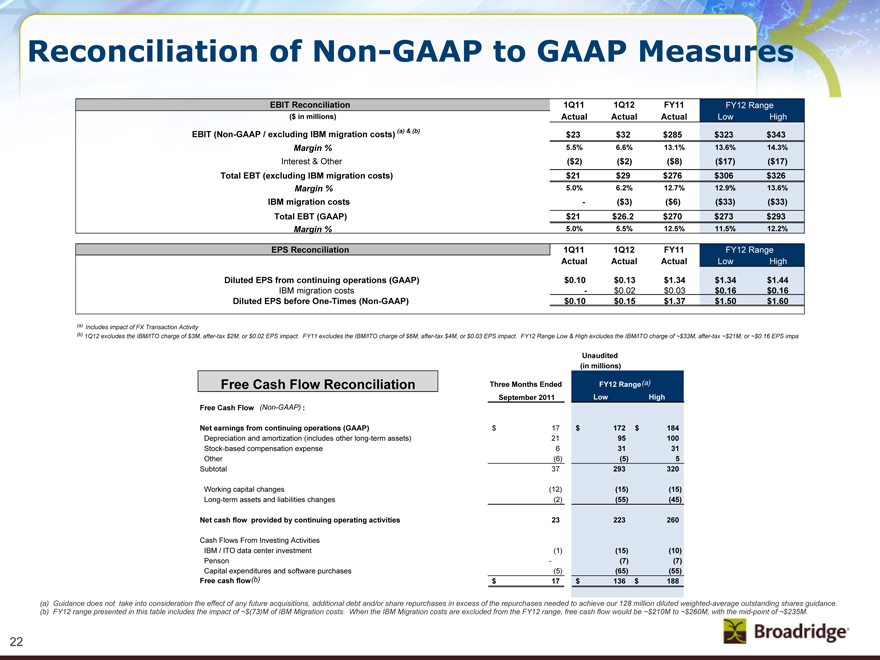
Reconciliation of Non-GAAP to GAAP Measures
EBIT Reconciliation 1Q11 1Q12 FY11 FY12 Range
($ in millions) Actual Actual Actual Low High
EBIT (Non-GAAP / excluding IBM migration costs) (a) & (b) $23 $32 $285 $323 $343
Margin % 5.5% 6.6% 13.1% 13.6% 14.3%
Interest & Other ($2) ($2) ($8) ($17) ($17)
Total EBT (excluding IBM migration costs) $21 $29 $276 $306 $326
Margin % 5.0% 6.2% 12.7% 12.9% 13.6%
IBM migration costs-($3) ($6) ($33) ($33)
Total EBT (GAAP) $21 $26.2 $270 $273 $293
Margin % 5.0% 5.5% 12.5% 11.5% 12.2%
EPS Reconciliation 1Q11 1Q12 FY11 FY12 Range
Actual Actual Actual Low High
Diluted EPS from continuing operations (GAAP) $0.10 $0.13 $1.34 $1.34 $1.44
IBM migration costs-$0.02 $0.03 $0.16 $0.16
Diluted EPS before One-Times (Non-GAAP) $0.10 $0.15 $1.37 $1.50 $1.60
(a) Includes impact of FX Transaction Activity
(b) 1Q12 excludes the IBM/ITO charge of $3M, after-tax $2M, or $0.02 EPS impact. FY11 excludes the IBM/ITO charge of $6M, after-tax $4M, or $0.03 EPS impact. FY12 Range Low & High excludes the IBM/ITO charge of ~$33M, after-tax ~$21M, or ~$0.16 EPS im
Unaudited
(in millions)
Free Cash Flow Reconciliation Three Months Ended FY12 Range (a)
September 2011 Low High
Free Cash Flow (Non-GAAP) :
Net earnings from continuing operations (GAAP) $ 17 $ 172 $ 184
Depreciation and amortization (includes other long-term assets) 21 95 100
Stock-based compensation expense 6 31 31
Other (6) (5) 5
Subtotal 37 293 320
Working capital changes (12) (15) (15)
Long-term assets and liabilities changes (2) (55) (45)
Net cash flow provided by continuing operating activities 23 223 260
Cash Flows From Investing Activities
IBM / ITO data center investment (1) (15) (10)
Penson - (7) (7)
Capital expenditures and software purchases (5) (65) (55)
Free cash flow (b) $ 17 $ 136 $ 188
(a) Guidance does not take into consideration the effect of any future acquisitions, additional debt and/or share repurchases in excess of the repurchases needed to achieve our 128 million diluted weighted-average outstanding shares guidance.
(b) FY12 range presented in this table includes the impact of ~$(73)M of IBM Migration costs. When the IBM Migration costs are excluded from the FY12 range, free cash flow would be ~$210M to ~$260M, with the mid-point of ~$235M.
22
|
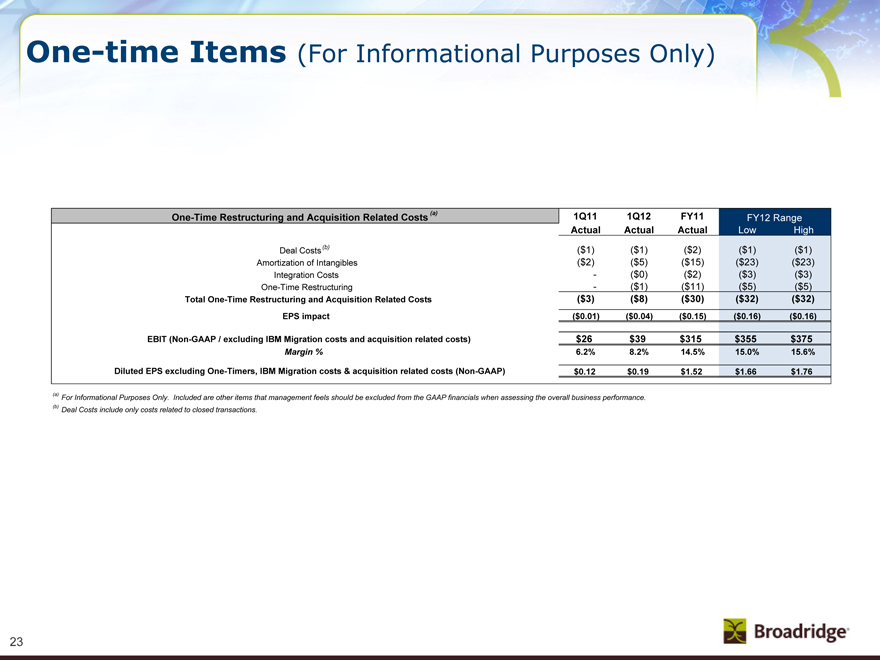
One-time Items (For Informational Purposes Only)
One-Time Restructuring and Acquisition Related Costs (a) 1Q11 1Q12 FY11 FY12 Range
Actual Actual Actual Low High
Deal Costs (b) ($1) ($1) ($2) ($1) ($1)
Amortization of Intangibles ($2) ($5) ($15) ($23) ($23)
Integration Costs -($0) ($2) ($3) ($3)
One-Time Restructuring -($1) ($11) ($5) ($5)
Total One-Time Restructuring and Acquisition Related Costs ($3) ($8) ($30) ($32) ($32)
EPS impact ($0.01) ($0.04) ($0.15) ($0.16) ($0.16)
EBIT (Non-GAAP / excluding IBM Migration costs and acquisition related costs) $26 $39 $315 $355 $375
Margin % 6.2% 8.2% 14.5% 15.0% 15.6%
Diluted EPS excluding One-Timers, IBM Migration costs & acquisition related costs (Non-GAAP) $0.12 $0.19 $1.52 $1.66 $1.76
(a) For Informational Purposes Only. Included are other items that management feels should be excluded from the GAAP financials when assessing the overall business performance. (b) Deal Costs include only costs related to closed transactions.
23
|
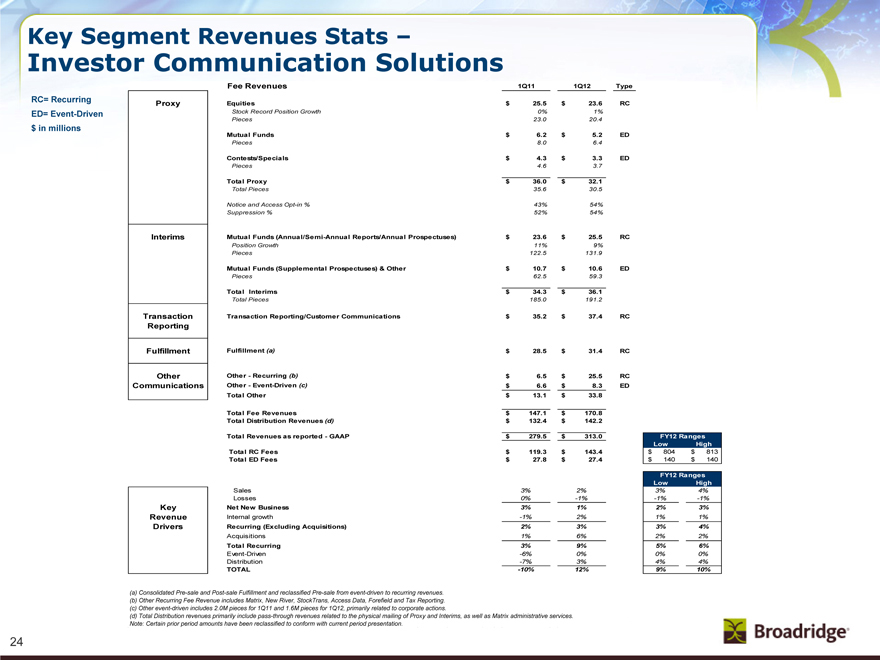
Key Segment Revenues Stats –Investor Communication Solutions
$ in millions RC= Recurring ED= Event-Driven
Proxy
Interims
Transaction Reporting
Fulfillment
Other Communications
Key Revenue Drivers
Fee Revenues 1Q11 1Q12 Type
Equities $ 25.5 $ 23.6 RC
Stock Record Position Growth 0% 1%
Pieces 23.0 20.4
Mutual Funds $ 6.2 $ 5.2 ED
Pieces 8.0 6.4
Contests/Specials $ 4.3 $ 3.3 ED
Pieces 4.6 3.7
Total Proxy $ 36.0 $ 32.1
Total Pieces 35.6 30.5
Notice and Access Opt-in % 43% 54%
Suppression % 52% 54%
Mutual Funds (Annual/Semi-Annual Reports/Annual Prospectuses) $ 23.6 $ 25.5 RC
Position Growth 11% 9%
Pieces 122.5 131.9
Mutual Funds (Supplemental Prospectuses) & Other $ 10.7 $ 10.6 ED
Pieces 62.5 59.3
Total Interims $ 34.3 $ 36.1
Total Pieces 185.0 191.2
Transaction Reporting/Customer Communications $ 35.2 $ 37.4 RC
Fulfillment (a) $ 28.5 $ 31.4 RC
Other-Recurring (b) $ 6.5 $ 25.5 RC
Other-Event-Driven (c) $ 6.6 $ 8.3 ED
Total Other $ 13.1 $ 33.8
Total Fee Revenues $ 147.1 $ 170.8
Total Distribution Revenues (d) $ 132.4 $ 142.2
Total Revenues as reported-GAAP $ 279.5 $ 313.0
Total RC Fees $ 119.3 $ 143.4
Total ED Fees $ 27.8 $ 27.4
Sales 3% 2%
Losses 0% -1%
Net New Business 3% 1%
Internal growth -1% 2%
Recurring (Excluding Acquisitions) 2% 3%
Acquisitions 1% 6%
Total Recurring 3% 9%
Event-Driven -6% 0%
Distribution -7% 3%
TOTAL -10% 12%
FY12 Ranges
Low High
$ 804 $ 813
$ 140 $ 140
FY12 Ranges
Low High
3% 4%
-1% -1%
2% 3%
1% 1%
3% 4%
2% 2%
5% 6%
0% 0%
4% 4%
9% 10%
(a) Consolidated Pre-sale and Post-sale Fulfillment and reclassified Pre-sale from event-driven to recurring revenues.
(b) Other Recurring Fee Revenue includes Matrix, New River, Stocktrans Access Data, Forefield and Tax Reporting.
(c) Other event-driven includes 2.0M pieces for 1Q11 and 1.6M pieces for 1Q12, primarily related to corporate actions.
(d) Total Distribution revenues primarily include pass-through revenues related to the physical mailing of Proxy and Interims, as well as Matrix administrative services. Note: Certain prior period amounts have been reclassified to conform with current period presentation.
24
|
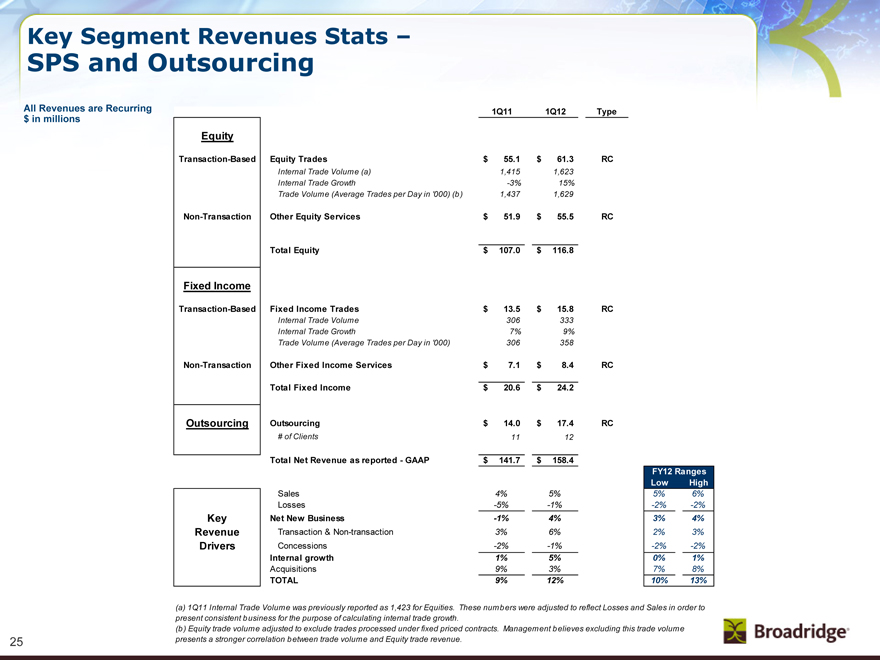
Key Segment Revenues Stats – SPS and Outsourcing
All Revenues are Recurring $ in millions
Equity Transaction-Based Non-Transaction
Fixed Income Transaction-Based Non-Transaction
Outsourcing
Key Revenue Drivers
1Q11 1Q12 Type
Equity Trades $ 55.1 $ 61.3 RC
Internal Trade Volume (a) 1,415 1,623
Internal Trade Growth -3% 15%
Trade Volume (Average Trades per Day in ‘000) (b) 1,437 1,629
Other Equity Services $ 51.9 $ 55.5 RC
Total Equity $ 107.0 $ 116.8
Fixed Income Trades $ 13.5 $ 15.8 RC
Internal Trade Volume 306 333
Internal Trade Growth 7% 9%
Trade Volume (Average Trades per Day in ‘000) 306 358
Other Fixed Income Services $ 7.1 $ 8.4 RC
Total Fixed Income $ 20.6 $ 24.2
Outsourcing $ 14.0 $ 17.4 RC
# of Clients 11 12
Total Net Revenue as reported - GAAP $ 141.7 $ 158.4
Sales 4% 5%
Losses -5% -1%
Net New Business -1% 4%
Transaction & Non-transaction 3% 6%
Concessions -2% -1%
Internal growth 1% 5%
Acquisitions 9% 3%
TOTAL 9% 12%
FY12 Ranges
Low High
5% 6%
-2% -2%
3% 4%
2% 3%
-2% -2%
0% 1%
7% 8%
10% 13%
(a) 1Q11 Internal Trade Volume was previously reported as 1,423 for Equities. These numbers were adjusted to reflect Losses and Sales in order to present consistent business for the purpose of calculating internal trade growth.
(b) Equity trade volume adjusted to exclude trades processed under fixed priced contracts. Management believes excluding this trade volume presents a stronger correlation between trade volume and Equity trade revenue.
25
|
Broadridge ICS Definitions
Proxy
Equities – Refers to the proxy services we provide in connection with annual stockholder meetings for publicly traded corporate issuers. Annual meetings of public companies include shares held in “street name” (meaning that they are held of record by brokers or banks, which in turn hold the shares on behalf of their clients, the ultimate beneficial owners) and shares held in “registered name” (shares registered directly in the names of their owners).
Mutual Funds – Refers to the proxy services we provide for funds, classes or trusts of an investment company. Open-ended mutual funds are not required to have annual meetings. As a result, mutual fund proxy services provided to open-ended mutual funds are driven by a “triggering event.” These triggering events can be a change in directors, fee structures, investment restrictions, or mergers of funds.
Contests – Refers to the proxy services we provide when a separate agenda is put forth by one or more stockholders that is in opposition to the proposals presented by management of the company which is separately distributed and tabulated from the company’s proxy materials.
Specials – Refers to the proxy services we provide in connection with stockholder meetings held outside of the normal annual meeting cycle and are primarily driven by special events (e.g., mergers and acquisitions in which the company being acquired is a public company and needs to solicit the approval of its stockholders).
Interims
Mutual Funds (Annual/Semi-Annual Reports/Annual Prospectuses) – Refers to the services we provide investment companies in connection with information they are required by regulation to distribute periodically to their investors. These reports contain pertinent information such as holdings, fund performance, and other required disclosure.
Mutual Funds (Supplemental Prospectuses) – Refers primarily to information required to be provided by mutual funds to supplement information previously provided in an annual mutual fund prospectus (e.g., change in portfolio managers, closing funds or class of shares to investors, or restating or clarifying items in the original prospectus). The events could occur at any time throughout the year.
Other – Refers to communications provided by corporate issuers and investment companies to investors including newsletters, notices, tax information, marketing materials and other information not required to be distributed by regulation.
Transaction Reporting
Transaction Reporting– Refers primarily to the printing and distribution of account statements, trade confirmations and tax reporting documents to account holders, including electronic delivery and archival services.
Fulfillment
Post-Sale Fulfillment – Refers primarily to the distribution of prospectuses, offering documents, and required regulatory disclosure information to investors in connection with purchases of securities.
Pre-Sale Fulfillment – Refers to the distribution of marketing literature, welcome kits, enrollment kits, and investor information to prospective investors, existing stockholders and other targeted recipients on behalf of broker-dealers, mutual fund companies and 401(k) administrators.
Other Communications
Other – Refers to the services we provide in connection with the distribution of communications material not included in the above definitions such as non-objecting beneficial owner (NOBO) lists, and corporate actions such as mergers, acquisitions, and tender offer transactions.
26