 November 2013 Continued Market Leadership through Execution and Innovation Investor Presentation © 2013 Broadridge Financial Solutions, Inc. Broadridge and the Broadridge logo are registered trademarks of Broadridge Financial Solutions, Inc. Exhibit 99.1 |
 1 Forward-Looking Statements Use of Material Contained Herein Explanation of the Company’s Use of Non-GAAP Financial Measures In certain circumstances, results have been presented that are not generally accepted accounting principles measures (“Non-GAAP”) and should be viewed in addition to, and not as a substitute for, the Company’s reported results. These Non-GAAP measures are indicators that management uses to provide additional meaningful comparisons between current results and prior reported results, and as a basis for planning and forecasting for future periods. In addition, Broadridge believes this Non-GAAP information helps investors understand the effect of these items on reported results and provides a better representation of the Company’s actual performance. Accompanying this presentation is a reconciliation of these Non-GAAP measures to the comparable GAAP measures. The information contained in this presentation is being provided for your convenience and information only. This information is accurate as of the date of its initial presentation. If you plan to use this information for any purpose, verification of its continued accuracy is your responsibility. Broadridge assumes no duty to update or revise the information contained in this presentation. You may reproduce information contained in this presentation provided you do not alter, edit, or delete any of the content and provided you identify the source of the information as Broadridge Financial Solutions, Inc., which owns the copyright. Broadridge and the Broadridge logo are registered trademarks of Broadridge Financial Solutions, Inc. This presentation and other written or oral statements made from time to time by representatives of Broadridge may contain “forward-looking statements” within the meaning of the Private Securities Litigation Reform Act of 1995. Statements that are not historical in nature, and which may be identified by the use of words such as “expects,” “assumes,” “projects,” “anticipates,” “estimates,” “we believe,” “could be” and other words of similar meaning, are forward-looking statements. In particular, information appearing in the “Fiscal Year 2014 Financial Guidance” section are forward-looking statements. These statements are based on management’s expectations and assumptions and are subject to risks and uncertainties that may cause actual results to differ materially from those expressed. These risks and uncertainties include those risk factors discussed in Part I, “Item 1A. Risk Factors” of our Annual Report on Form 10-K for the fiscal year ended June 30, 2013 (the “2013 Annual Report”), as they may be updated in any future reports filed with the Securities and Exchange Commission. All forward-looking statements speak only as of the date of this presentation and are expressly qualified in their entirety by reference to the factors discussed in the 2013 Annual Report. These risks include: the success of Broadridge in retaining and selling additional services to its existing clients and in obtaining new clients; Broadridge’s reliance on a relatively small number of clients, the continued financial health of those clients, and the continued use by such clients of Broadridge’s services with favorable pricing terms; changes in laws and regulations affecting Broadridge’s clients or the investor communication services provided by Broadridge; declines in participation and activity in the securities markets; any material breach of Broadridge security affecting its clients’ customer information; the failure of Broadridge’s outsourced data center services provider to provide the anticipated levels of service; a disaster or other significant slowdown or failure of Broadridge’s systems or error in the performance of Broadridge’s services; overall market and economic conditions and their impact on the securities markets; Broadridge’s failure to keep pace with changes in technology and demands of its clients; Broadridge’s ability to attract and retain key personnel; the impact of new acquisitions and divestitures; and competitive conditions. Broadridge disclaims any obligation to update or revise forward-looking statements that may be made to reflect events or circumstances that arise after the date made or to reflect the occurrence of unanticipated events, other than as required by law. |
 2 Broadridge Overview |
 3 Leading provider of Investor Communications and Technology-Driven Solutions to banks, broker- dealers, mutual funds, and corporate issuers globally We have strong positions in large and attractive markets with lots of room to grow We have a balanced and diverse product portfolio across related businesses: Bank/Broker-Dealer Communications and Issuer Services Mutual Fund and Retirement Solutions Bank/Broker-Dealer Technology and Operations We will grow this portfolio by capitalizing on three disruptive market macro-trends: Digital transformation of Investor Communications - digital technologies that enable lower cost, higher touch interactions Cost Mutualization - tremendous industry drive to standardize duplicative, non-differentiating industry costs Intelligence created from our unique Data - enables us to provide clients unrivaled intelligence and create unique value through our network and data We will do so with a combination of organic growth, partnerships and acquisitions As we move to the next phase of our journey we will target our opportunities across our related businesses as follows… Broadridge’s Strategic Vision and Journey to Drive Top Quartile Stockholder Returns This balanced approach, including a meaningful dividend and opportunistic share repurchases, expected to drive top quartile total stockholder returns |
 4 Bank/Broker-Dealer Communications and Issuer Services We enable the global financial services industry to communicate private and significant information securely and cost effectively Broadridge’s Business Unit Strategy Bank/Broker-Dealer Technology and Operations We are a scalable technology services provider of equity and fixed income processing to North American sell side institutions with a growing international and buy side presence We will leverage the jointly launched post-trade processing platform with Accenture to scale our unique 50- market platform globally while continuing to drive our core solutions and addressing new needs in adjacent markets (e.g. fixed income, buy-side, derivatives) We will lead the adoption of digital and “big data” capabilities to enhance investors’, brokers’ and corporate issuers’ efficiency and decision making and expand our offerings to provide other communications of equal significance Mutual Fund and Retirement Solutions We are a rapidly growing provider of data-driven reporting, trade processing, compliance, 401k, and marketing solutions to the mutual fund, retirement and insurance industries across the entire transaction lifecycle Today Focus of the Journey’s next phase Leading provider of Investor Communications and Technology-Driven Solutions to banks, broker-dealers, mutual funds, and corporate issuers globally ICS-BBDI ICS-Mutual Funds SPS We will add new data-driven capabilities to enable deeper linkages between mutual funds and their broker-dealer distribution partners by fully leveraging our unique network serving the brokerage industry, which continues to lead mutual fund distribution |
 5 We are a Leader in a Number of Large and Attractive Markets Investor Communication Solutions Securities Processing Solutions U.S. and Global Banks/Broker- Dealers Regulatory Communications U.S. Banks/Broker-Dealers Transactional Communications U.S. Corporate Issuer Regulatory Communications U.S. Brokerage Processing U.S. Fixed Income Processing Canadian Brokerage Processing International Brokerage Processing Our leadership positions contribute to our growing recurring fee revenues |
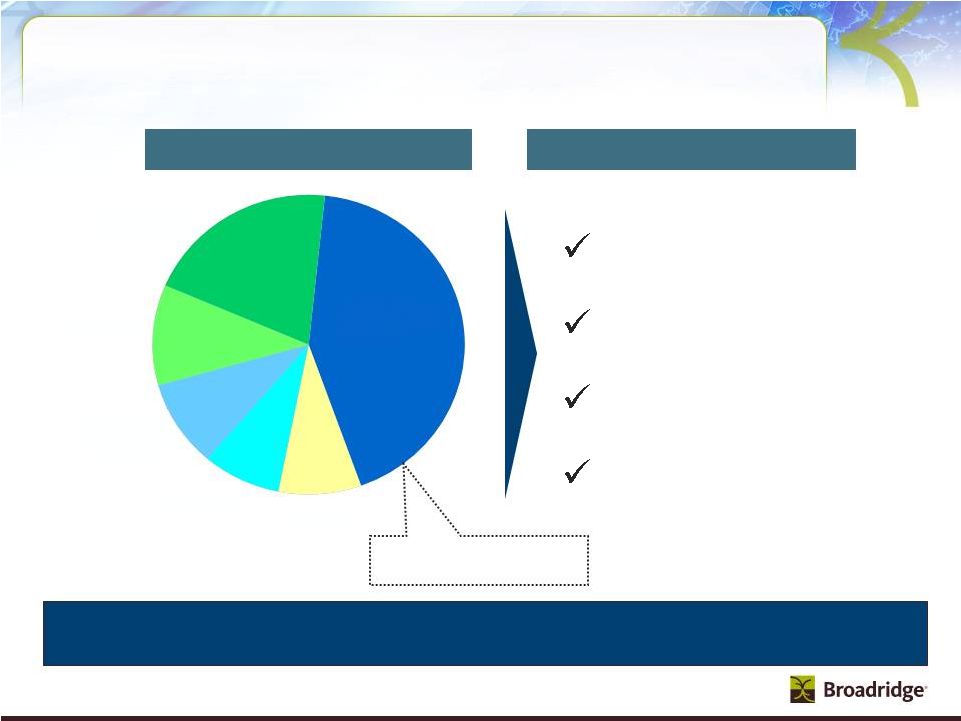
 6 HORIZON 1 Extend and defend existing core businesses Time (years) Throughout our Journey, we will Continue to Enhance our Capabilities to Drive Growth HORIZON 3 FY10 ~ 90% FY14F ~ 70% FY10 ~ 10% FY14F ~ 30% FY10 0% FY14F ~ .1% * Percentage of Recurring Fee Revenue by Growth Horizon from FY10 to FY14 Forecast * * * Disruptive, transformative and longer term businesses Examples: Macro-trends- digital comm., cost mutualization, unique data Adjacencies to build and expand emerging businesses Examples: Tax, asset data, mortgage backed trading systems HORIZON 2 Examples: Equity and mutual fund proxies, equity and fixed income processing |
 7 Investor Communication Solutions (ICS) |
 8 Mutual Fund—Natural adjacencies Transaction reporting Imaging and workflow, etc. Mutual Fund—Core Retirement processing Data aggregation Marketing communications Proxy/solicitation Large and attractive markets – Investor Communications is a $10B+ market BBD—Emerging products Global proxy and communications Tax reporting and outsourcing Security class actions Advisor services Bank/Broker-Dealer (BBD)—Core Regulatory communications (proxy, interims, etc.) Customer communications (transaction statements, etc.) Total addressable market $10B+ fee revenue Issuer Transfer agency Shareholder analytics Investor communications BBD—Natural adjacencies Enterprise archiving On-boarding International tax reclaim $1.3B $0.9B $2.0B $3.0B $1.8B $1.7B Sources: BCG, Bain, Patpatia, Broadridge estimates |
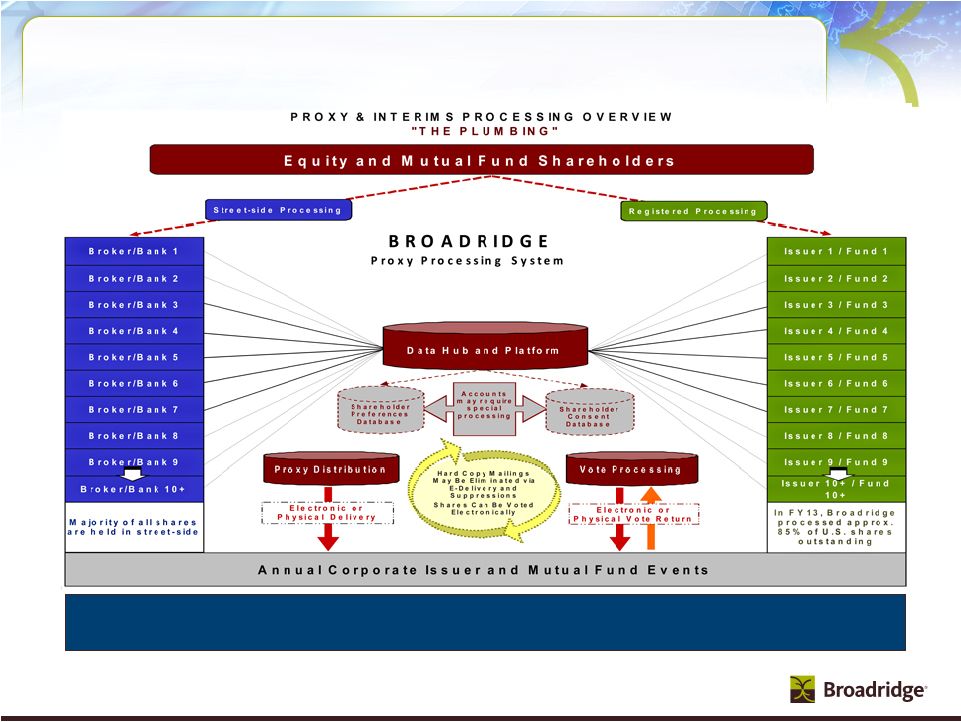 9 ICS Operates a Unique Business Systems Processing Model Proxy and Interim processing system is the “plumbing” supporting the voting process for corporate governance |
 10 Increase in electronic distribution reduces postage revenue and increases profits ICS has a Diversified Revenue Base ICS is highly resilient due to our deep customer relationships with our Bank/Broker-Dealer clients By product Broad client base 1 Financial metrics and statistics are for FY13 ended 6/30/13 Banks Broker-Dealers Mutual Funds Corporate Issuers Other $151M (9%) Fulfillment $143M (8%) Transaction Reporting $165M (9%) Interims $191M (11%) Proxy $356M (20%) 1 Distribution $755M (43%) Primarily Postage |
 11 ICS-Bank/Broker-Dealer Communications What We Do: Regulatory communications – Beneficial proxy and interims for equities – Beneficial mutual fund compliance communications Customer communications – Transaction statements, trade confirmations and other reporting Global and emerging products – Advisor services – Global proxy and communications – Tax reporting and outsourcing – Securities class actions Competitive Advantages: Indispensible data hub with established relationships with majority of BBDs Strong market position and innovative leadership – First/only certified voting results – First e-delivery, phone, web and mobile voting platform Proprietary systems, network and databases – ProxyEdge® – institutional voting and record keeping platform – Preference and consent database Unmatched scale with highest level data security (ISO 27001) |
 12 What We Do: Beneficial proxy service Registered shareholder communications – Registered proxy services – Interim communications Transfer agency (TA) – Stock share registry, ownership transfers and dividend calculation Enhanced issuer solutions – Shareholder analytics – Virtual shareholder meetings – Shareholder Forums – Global proxy services Competitive Advantages: Market Position – only full service provider of shareholder communications to all types of shareholders Unmatched Scale – able to leverage one billion plus shareholder communications annually as well as record-keeping, corporate actions and other shareholder account servicing Unmatched Data – unique dataset of investors and positions allows Issuers to more effectively reach their shareholders Thought Leadership – unmatched expertise to innovate the proxy process and help guide Issuers through a complex regulatory environment ICS-Issuer Services 12 |
 What We Do: Mutual Fund trade processing in the defined contribution/trust space (Matrix) Data aggregation and analytics (Access Data) Marketing/Regulatory communications including content (NewRiver) Registered proxy and solicitation services Competitive Advantages: Long-standing relationships across industry — Serve every mutual fund and majority of banks/broker-dealers Unique data capabilities — Proprietary platform to allow mutual funds to understand their clients — Innovative business applications that address unique industry issues such as compliance and distribution payments — Largest electronic repository for mutual fund regulatory data Industry-leading ICS products with unmatched scale — Leverage to create cost-effective products for mutual funds ICS-Mutual Fund and Retirement Solutions 13 |
 14 Securities Processing Solutions (SPS) |
 15 Sources: Tower Group, Chartis, Aite, IM2, Broadridge internal estimates Technology and Operations spend adds ~$14B to our SPS addressable market Securities and investment firms’ overall technology and operations spend is over $100 billion and growing at 5% $1.2B $2.8B ~$5.0B Adjacent markets Middle-office Buy-side services Derivatives processing Fixed Income market data and analytics ~$5.2B North American BPO Middle- and back-office Data center services Select corporate functions US Brokerage Processing Core equities and fixed income Global Processing Core equities and fixed income Global BPO Reconciliations Total addressable market ~ $14B fee revenue |
 16 Broadridge global processing behind the scenes Broadridge simplifies complex processes |
 Fixed Income (~16%) Transactions, $57M Non-transactions, $50M Equity (~74%) Transactions, $127M Non-transactions, $359M Outsourcing (~10%) $69M Securities Processing North America Market Share Overview 1 1. All market share information is based on management’s estimates and is part of much larger market. No attempt has been made to size such market M A R K E T S H A R E FY13 Product Revenues Equity Processing Client Volume U.S. $ Fixed Income Client Volume Operations Outsourcing Broadridge ~30% Competitors ~20% In-house ~50% Broadridge ~7% Untapped Market ~93% (>$1 Billion) Competitors ~2% In-house ~43% Broadridge ~55% 17 |
 18 SPS’s Client Base is Diversified Across Large Financial Institutions SPS client relationships are stable in volatile markets Top Equity Processing Fixed Income Clients Retail Institutional Processing Apex Clearing Bank of America/Merrill Lynch Barclays Capital Services BMO Nesbitt Burns CIBC World Markets Deutsche Bank E*Trade Group Edward Jones Jefferies & Company JP Morgan Chase Nomura Royal Bank of Canada Scotia Capital Societe Generale UBS Securities Outsourcing Note: The above schedule is an alphabetical listing of the top 15 clients (measured by revenue), which represented approximately 60% of Securities Processing Solutions revenues in FY13 |
 19 SPS-Technology and Operations Competitive Advantages: Best-of-breed processing solutions – Leading global platform – Broad asset class coverage Broad suite of add-on or point solutions – Desk top applications used by brokers and traders – Workflow and reconciliation applications – Data aggregation and warehousing tools Industry-leading global business process outsourcing (BPO) solutions What We Do: Unique global technology platform provides processing access to over 50 countries Breadth of asset classes on single “platform” Flexible business model that can be tailored to unique client needs Trusted brand Leading market position and scale |
 20 Financial Strategy |
 21 Our Financial Strategy is a key part of our value creation strategy Target paying out 40% of net earnings in dividends, but expect no less than 84 cents per share annually (subject to quarterly Board approval) Organic growth with limited financial risk – Avoid significant balance sheet risk – Invest in projects delivering at least 20% IRR Tuck-in acquisitions with clear growth profile and returns – Accretive to growth, margins, and earnings – >20% IRR in conservative business case Long-term investment-grade debt rating – Adjusted Debt/EBITDAR ratio target is 2:1 Excess cash used opportunistically to offset dilution and reduce share count through buybacks 1. Adjusted Debt/EBITDAR ratio calculated as (Debt + 8x Rent Expense) / (EBITDA + Rent Expense) 1 |
 22 Appendix |
 23 Key Financial Drivers 1Q Actual FY14 FY14 FY13 Range Growth Drivers as a % of Recurring Revenues Closed Sales (Recurring) 8% 6% 7-8% Client Losses (2%) (1%) (3%) Net New Business 6% 5% 4-5% Internal Growth (a) 4% (1%) 0 -1% Organic Growth 10% 4% 4-6% Acquisitions 1% 0% 1% Total Recurring Revenue Growth 11% 4% 5-7% Growth Drivers as a % of Total Revenues Recurring Revenue 7% 3% 2 -4% Event-Driven (b) 2% 1% ~0% Distribution (c) 2% 2% ~0% FX/Other (1%) 0% 0% Total Revenue Growth 10% 6% 2 -4% EBIT Margin (Non-GAAP) 13.8% 14.8% 15.8 - 16.4% EPS (Non-GAAP) $0.39 $1.88 $2.00 -2.10 (a) Internal Growth includes SPS Equity & Fixed Income Trades, ICS Equity & Mutual Fund Stock Record Growth, Transaction Reporting and Time & Materials (b) Event-Driven includes ICS Proxy Contest/Specials, Mutual Fund Proxy and Marketing Communications (c) Distribution includes pass-through fees from Matrix |
 24 Broadridge Q1 FY14 |
 25 Broadridge FY14 Guidance |
 26 Cash Flow –Q1 FY14 Results and FY14 Forecast Three Months Ending September 2013 Low High Free Cash Flow Net earnings from operations (GAAP) 44 $ 233 $ 246 $ Depreciation and amortization (includes other LT assets) 23 100 110 Stock-based compensation expense 5 33 35 Other (2) (5) 5 Subtotal 70 361 396 Working capital changes (71) (5) 5 Long-term assets & liabilities changes (4) (50) (40) Net cash flow (used in) provided by operating activities (5) 306 361 Cash Flows From Investing Activities Capital expenditures and software purchases (13) (60) (55) Free cash flow (18) $ 246 $ 306 $ Cash Flows From Other Investing and Financing Activities Acquisitions (38) (38) (38) Stock repurchases net of options proceeds (2) (2) (2) Proceeds from borrowing net of debt repayments (1) (1) (1) Dividends paid (22) (96) (96) Other (2) (5) 5 Net change in cash and cash equivalents (83) 104 174 Cash and cash equivalents, at the beginning of year 266 266 266 Cash and cash equivalents, at the end of period 183 $ 370 $ 440 $ (a) Guidance does not take into consideration the effect of any future acquisitions, additional debt and/or share repurchases. Free Cash Flow - Non-GAAP FY14 Range (a) ($ millions) Unaudited (Non-GAAP): (Non-GAAP) |
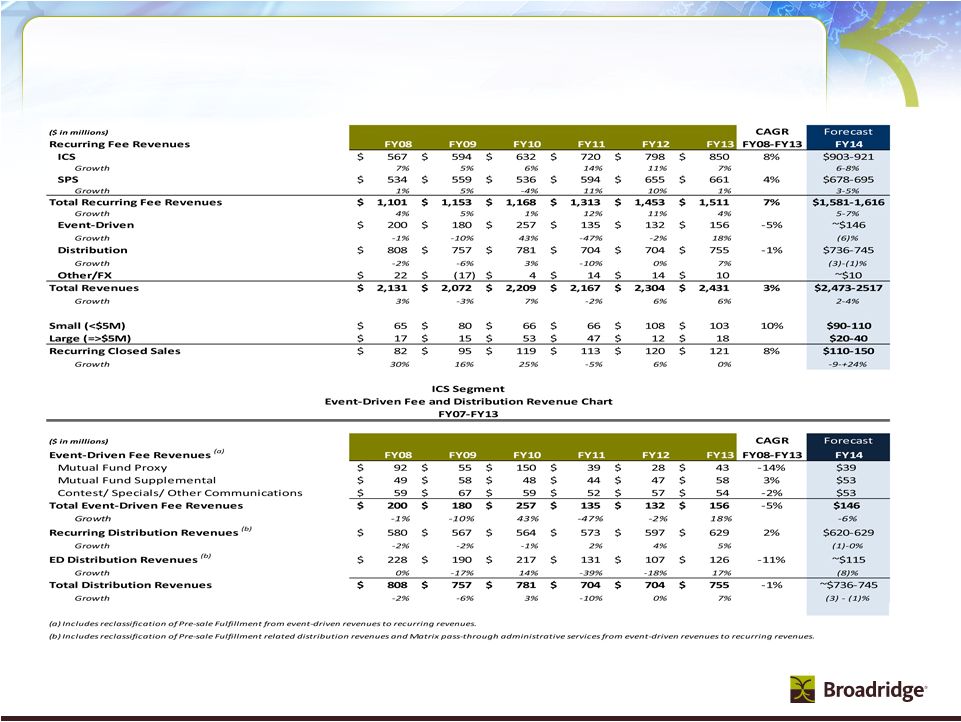 27 Revenues and Closed Sales FY08-FY13 |
 28 Reconciliation of Non-GAAP to GAAP Measures |
 29 ICS Key Segment Revenue Stats RC= Recurring ED= Event-Driven In millions Fee Revenues 1Q13 1Q14 Type Proxy Equities 25.6 $ 26.0 $ RC Stock Record Position Growth -4% 1% Pieces 20.3 21.5 Mutual Funds 6.5 $ 15.8 $ ED Pieces 8.2 20.4 Contests/Specials 3.0 $ 4.2 $ ED Pieces 2.7 4.4 Total Proxy 35.1 $ 46.0 $ Total Pieces 31.2 46.3 Notice and Access Opt-in % 48% 57% Suppression % 56% 57% Interims Mutual Funds (Annual/Semi-Annual Reports/Annual Prospectuses) 31.8 $ 38.8 $ RC Position Growth 9% 12% Pieces 150.7 173.5 Mutual Funds (Supplemental Prospectuses) & Other 14.7 $ 12.2 $ ED Pieces 75.4 71.8 Total Interims 46.5 $ 51.0 $ Total Pieces 226.1 245.3 Transaction Transaction Reporting/Customer Communications 40.6 $ 36.1 $ RC Reporting Fulfillment Fulfillment 33.2 $ 39.9 $ RC Emerging/Acquired Emerging/Acquired (a) 25.8 $ 34.2 $ RC and Other Other (b) 8.1 $ 8.4 $ ED +/-1% RC Fee Change: Total Acquired, Emerging and Other 33.9 $ 42.6 $ Fee 8.5 $ EBIT* $3.4-$5.1 Total Fee Revenues 189.3 $ 215.6 $ Total Distribution Revenues (c) 150.2 $ 160.6 $ Total Revenues as reported - GAAP 339.5 $ 376.2 $ FY14 Ranges Low High Total RC Fees 157.0 $ 175.0 $ 903 $ 921 $ % RC Growth 9% 11% 6% 8% Total ED Fees 32.3 $ 40.6 $ 146 $ 146 $ Low High Sales 7% 6% 6% 7% Key Losses -2% -2% -2% -2% Revenue Net New Business 5% 4% 4% 5% Drivers Internal growth 4% 6% 1% 2% (Recurring) Recurring (Excluding Acquisitions) 9% 10% 5% 7% Acquisitions 0% 1% 1% 1% Total Recurring 9% 11% 6% 8% Low High Revenue Recurring Net (d) 4% 5% 2% 4% Drivers Event-Driven 2% 3% -1% -1% (Total) Distribution 2% 3% 0% 0% TOTAL 8% 11% 1% 3% (a) Emerging and Acquired includes fee revenues from acquisitions (i.e. Access Data, New River, Matrix, Transfer Agency, Forefield, and Bonaire) and the portfolio of emerging products (i.e. Tax Services, Vote Recommendations, and Class Actions). (b) Other includes other event-driven fee revenues such as corporate actions and development. (c) Total Distribution Revenues primarily include pass-through revenues related to the physical mailing of Proxy, Interims, Transaction Reporting, and Fulfillment as well as Matrix administrative services. (d) Recurring, Net includes contribution from Net New Business, Internal Growth, and Acquisitions mix(i.e. proxy or rev from new sales |
 30 SPS Key Segment Revenue Stats RC= Recurring ED= Event-Driven In millions Note: Outsourcing is now included in Other Equity Services 1Q13 1Q14 Type Equity Transaction-Based Equity Trades 30.0 $ 32.4 $ RC Internal Trade Volume 780 891 Internal Trade Growth -19% 14% Trade Volume (Average Trades per Day in '000) 828 908 Non-Transaction Other Equity Services 98.6 107.9 RC Total Equity 128.6 $ 140.4 $ Fixed Income Transaction-Based Fixed Income Trades (a) 13.9 $ 14.7 $ RC Internal Trade Volume 295 299 Internal Trade Growth 0% 1% Trade Volume (Average Trades per Day in '000) 295 302 Non-Transaction Other Fixed Income Services 11.5 $ 13.6 $ RC Total Fixed Income 25.4 $ 28.3 $ Total Net Revenue as reported - GAAP 153.9 $ 168.7 $ FY14 Ranges Low High Sales 3% 11% 9% 10% Losses -1% -3% -4% -4% Key Net New Business 2% 8% 5% 6% Internal growth -8% 2% -2% -1% Acquisitions 3% 0% 0% 0% TOTAL -3% 10% 3% 5% |
 31 Broadridge ICS Definitions Proxy Equities - Refers to the proxy services we provide in connection with annual stockholder meetings for publicly traded corporate issuers. Annual meetings of public companies include shares held in "street name" (meaning that they are held of record by brokers or banks, which in turn hold the shares on behalf of their clients, the ultimate beneficial owners) and shares held in "registered name" (shares registered directly in the names of their owners). Mutual Funds - Refers to the proxy services we provide for funds, classes or trusts of an investment company. Open-ended mutual funds are not required to have annual meetings. As a result, mutual fund proxy services provided to open-ended mutual funds are driven by a "triggering event." These triggering events can be a change in directors, fee structures, investment restrictions, or mergers of funds. Contests - Refers to the proxy services we provide when a separate agenda is put forth by one or more stockholders that is in opposition to the proposals presented by management of the company which is separately distributed and tabulated from the company’s proxy materials. Specials - Refers to the proxy services we provide in connection with stockholder meetings held outside of the normal annual meeting cycle and are primarily driven by special events (e.g., business combinations in which the company being acquired is a public company and needs to solicit the approval of its stockholders). Interims Mutual Funds (Annual/Semi-Annual Reports/Annual Prospectuses) – Refers to the services we provide investment companies in connection with information they are required by regulation to distribute periodically to their investors. These reports contain pertinent information such as holdings, fund performance, and other required disclosure. Mutual Funds (Supplemental Prospectuses) – Refers primarily to information required to be provided by mutual funds to supplement information previously provided in an annual mutual fund prospectus (e.g., change in portfolio managers, closing funds or class of shares to investors, or restating or clarifying items in the original prospectus). The events could occur at any time throughout the year. Other – Refers to communications provided by corporate issuers and investment companies to investors including newsletters, notices, tax information, marketing materials and other information not required to be distributed by regulation. Transaction Reporting Transaction Reporting – Refers primarily to the printing and distribution of account statements, trade confirmations and tax reporting documents to account holders, including electronic delivery and archival services. Fulfillment Post-Sale Fulfillment – Refers primarily to the distribution of prospectuses, offering documents, and required regulatory disclosure information to investors in connection with purchases of securities. Pre-Sale Fulfillment – Refers to the distribution of marketing literature, welcome kits, enrollment kits, and investor information to prospective investors, existing stockholders and other targeted recipients on behalf of broker-dealers, mutual fund companies and 401(k) administrators. Emerging, Acquired and Other Communications Other – Refers primarily to the services we provide in connection with the distribution of communications material not included in the above definitions such as non-objecting beneficial owner (NOBO) lists, and corporate actions such as tender offer transactions. Emerging – Refers to the services provided by our emerging products portfolio (i.e. Tax Services, Vote Recommendations, and Class Actions). Acquired – Refers to the services provided by our acquisitions portfolio (i.e. Access Data, NewRiver, Matrix, Transfer Agency, Forefield, and Bonaire). |