
Raymond James 38th Annual Institutional Investor Conference March 6, 2017 Fiscal Third Quarter 2017
1© 2016 Forward‐Looking Statements This presentation and other written or oral statements made from time to time by representatives of Broadridge Financial Solutions, Inc. ("Broadridge" or the "Company") may contain “forward-looking statements” within the meaning of the Private Securities Litigation Reform Act of 1995. Statements that are not historical in nature, and which may be identified by the use of words such as “expects,” “assumes,” “projects,” “anticipates,” “estimates,” “we believe,” “could be” and other words of similar meaning, are forward-looking statements. In particular, information appearing in the “Fiscal Year 2017 Financial Guidance” section are forward-looking statements. These statements are based on management’s expectations and assumptions and are subject to risks and uncertainties that may cause actual results to differ materially from those expressed. These risks and uncertainties include those risk factors discussed in Part I, “Item 1A. Risk Factors” of our Annual Report on Form 10-K for the fiscal year ended June 30, 2016 (the “2016 Annual Report”), as they may be updated in any future reports filed with the Securities and Exchange Commission. All forward-looking statements speak only as of the date of this presentation and are expressly qualified in their entirety by reference to the factors discussed in the 2016 Annual Report. These risks include: the success of Broadridge in retaining and selling additional services to its existing clients and in obtaining new clients; Broadridge’s reliance on a relatively small number of clients, the continued financial health of those clients, and the continued use by such clients of Broadridge’s services with favorable pricing terms; changes in laws and regulations affecting Broadridge’s clients or the services provided by Broadridge; any material breach of Broadridge security affecting its clients’ customer information; declines in participation and activity in the securities markets; the failure of Broadridge’s outsourced data center services provider to provide the anticipated levels of service; a disaster or other significant slowdown or failure of Broadridge’s systems or error in the performance of Broadridge’s services; overall market and economic conditions and their impact on the securities markets; Broadridge’s failure to keep pace with changes in technology and demands of its clients; Broadridge’s ability to attract and retain key personnel; the impact of new acquisitions and divestitures; and competitive conditions. Broadridge disclaims any obligation to update or revise forward-looking statements that may be made to reflect events or circumstances that arise after the date made or to reflect the occurrence of unanticipated events, other than as required by law.
2© 2016 Use of Non‐GAAP Financial Measures Explanation and Reconciliation of the Company’s Use of Non‐GAAP Financial Measures The Company’s results in this presentation are presented in accordance with U.S. GAAP except where otherwise noted. In certain circumstances, results have been presented that are not generally accepted accounting principles measures (“Non‐GAAP”). These Non‐GAAP measures are Adjusted Operating income, Adjusted Operating income margin, Adjusted Net earnings, Adjusted earnings per share, and Free cash flow. These Non‐GAAP financial measures should be viewed in addition to, and not as a substitute for, the Company’s reported results. The Company believes its Non‐GAAP financial measures help investors understand how management plans, measures and evaluates the Company’s business performance. Management believes that Non‐GAAP measures provide consistency in its financial reporting and facilitates investors’ understanding of the Company’s operating results and trends by providing an additional basis for comparison. Management uses these Non‐GAAP financial measures to, among other things, evaluate the Company's ongoing operations, for internal planning and forecasting purposes and in the calculation of performance‐based compensation. In addition, and as a consequence of the importance of these Non‐GAAP financial measures in managing its business, the Company’s Compensation Committee of the Board of Directors incorporates Non‐GAAP financial measures in the evaluation process for determining management compensation. Adjusted Operating Income, Adjusted Operating Income Margin, Adjusted Net Earnings and Adjusted Earnings per Share These Non‐GAAP measures reflect Operating income, Operating income margin, Net earnings, and Diluted earnings per share, as adjusted to exclude the impact of certain costs, expenses, gains and losses and other specified items that management believes are not indicative of the Company's ongoing operating performance. These adjusted measures exclude the impact of Amortization of Acquired Intangibles and Purchased Intellectual Property, and Acquisition and Integration Costs. Amortization of Acquired Intangibles and Purchased Intellectual Property represents non‐cash expenses associated with the Company's acquisition activities. Acquisition and Integration Costs represent certain transaction and integration costs associated with the Company’s acquisition activities. The Company excludes Amortization of Acquired Intangibles and Purchased Intellectual Property, and Acquisition and Integration Costs from these measures because excluding such information provides the Company with an understanding of the results from the primary operations of its business and these items do not reflect ordinary operations or earnings. Management believes these measures may be useful to an investor in evaluating the underlying operating performance of the Company's business. Free Cash Flow In addition to the Non‐GAAP financial measures discussed above, the Company provides Free cash flow information because it considers Free cash flow to be a liquidity measure that provides useful information to management and investors about the amount of cash generated that could be used for dividends, share repurchases, strategic acquisitions and other discretionary investments. Free cash flow is a Non‐GAAP financial measure and is defined by the Company as Net cash flows provided by operating activities less Capital expenditures and Software purchases and capitalized internal use software. Reconciliations of such Non‐GAAP measures to the most directly comparable financial measures presented in accordance with GAAP can be found in the tables that are part of this presentation. Use of Material Contained Herein The information contained in this presentation is being provided for your convenience and information only. This information is accurate as of the date of its initial presentation. If you plan to use this information for any purpose, verification of its continued accuracy is your responsibility. Broadridge assumes no duty to update or revise the information contained in this presentation.
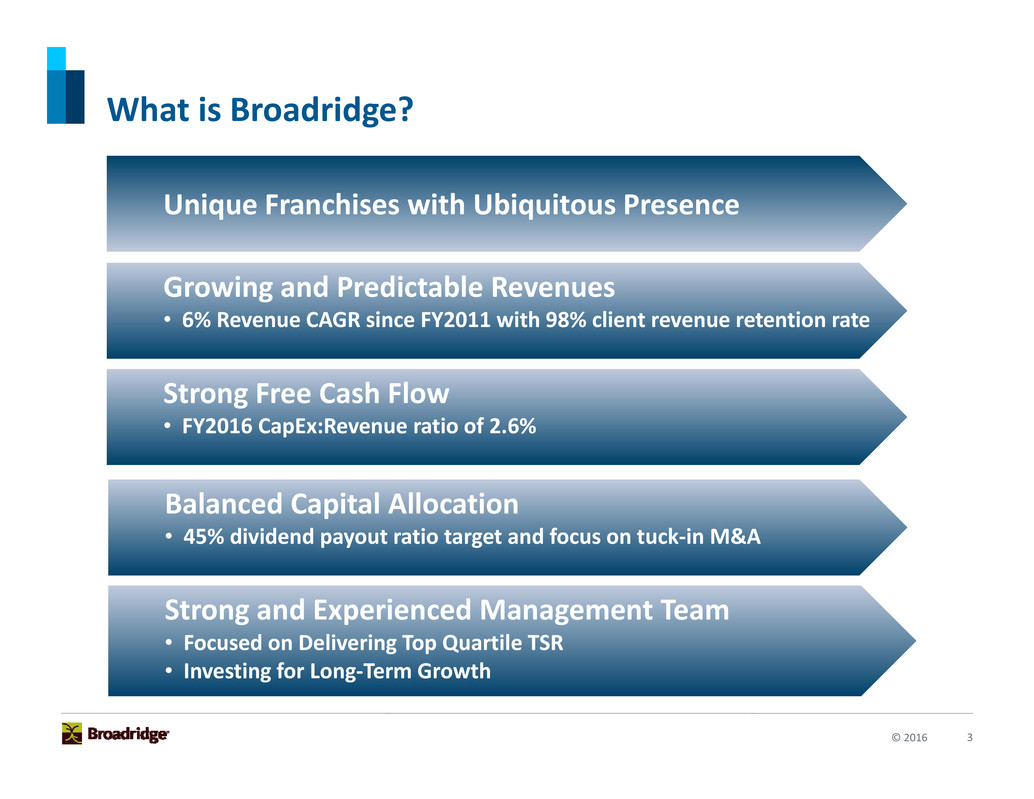
3© 2016 What is Broadridge? Unique Franchises with Ubiquitous Presence Growing and Predictable Revenues • 6% Revenue CAGR since FY2011 with 98% client revenue retention rate Strong Free Cash Flow • FY2016 CapEx:Revenue ratio of 2.6% Balanced Capital Allocation • 45% dividend payout ratio target and focus on tuck‐in M&A Strong and Experienced Management Team • Focused on Delivering Top Quartile TSR • Investing for Long‐Term Growth
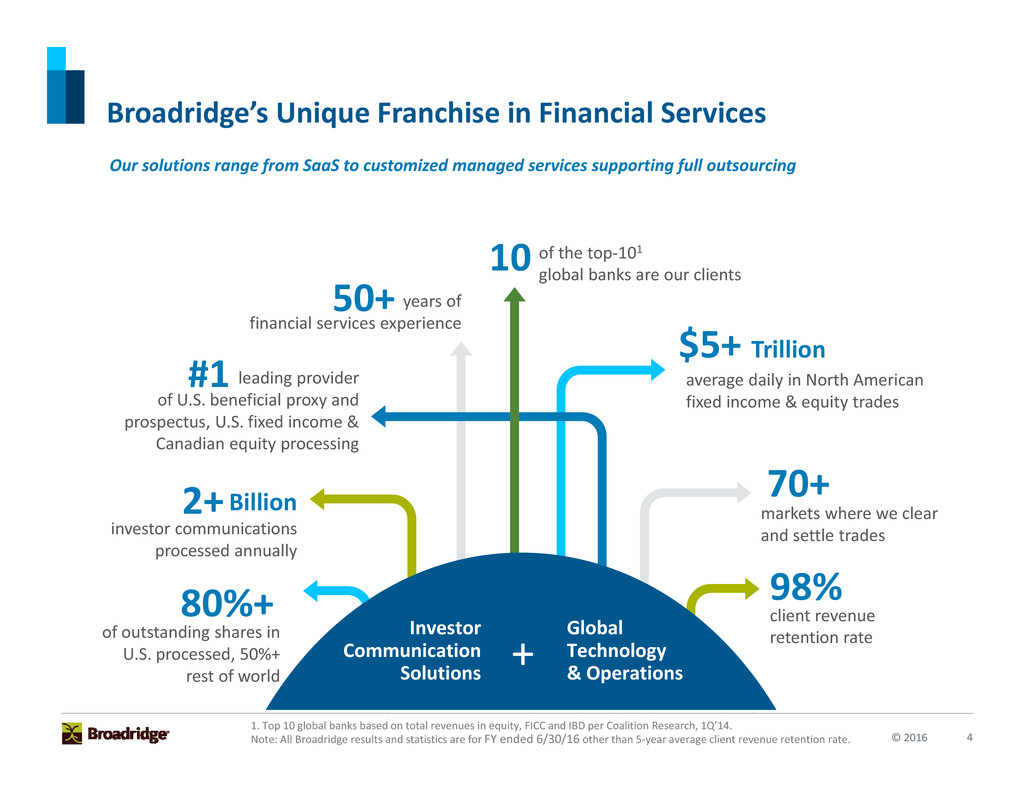
4© 2016 Broadridge’s Unique Franchise in Financial Services 98% client revenue retention rate 50+ years of financial services experience of the top‐101 global banks are our clients10 #1 leading provider of U.S. beneficial proxy and prospectus, U.S. fixed income & Canadian equity processing Billion investor communications processed annually 2+ average daily in North American fixed income & equity trades $5+ Trillion of outstanding shares in U.S. processed, 50%+ rest of world 80%+ markets where we clear and settle trades 70+ Investor Communication Solutions Global Technology & Operations + 1. Top 10 global banks based on total revenues in equity, FICC and IBD per Coalition Research, 1Q’14. Note: All Broadridge results and statistics are for FY ended 6/30/16 other than 5‐year average client revenue retention rate. Our solutions range from SaaS to customized managed services supporting full outsourcing
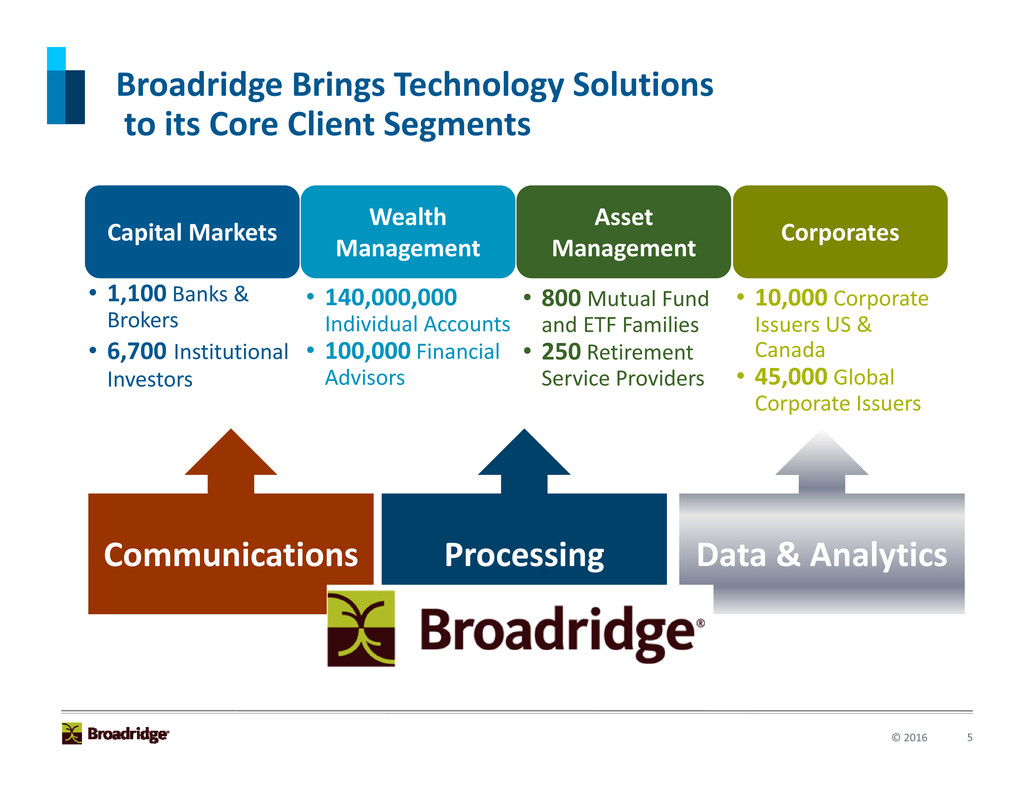
5© 2016 Broadridge Brings Technology Solutions to its Core Client Segments Capital Markets Wealth Management Asset Management Corporates Communications Processing Data & Analytics • 1,100 Banks & Brokers • 6,700 Institutional Investors • 140,000,000 Individual Accounts • 100,000 Financial Advisors • 800 Mutual Fund and ETF Families • 250 Retirement Service Providers • 10,000 Corporate Issuers US & Canada • 45,000 Global Corporate Issuers
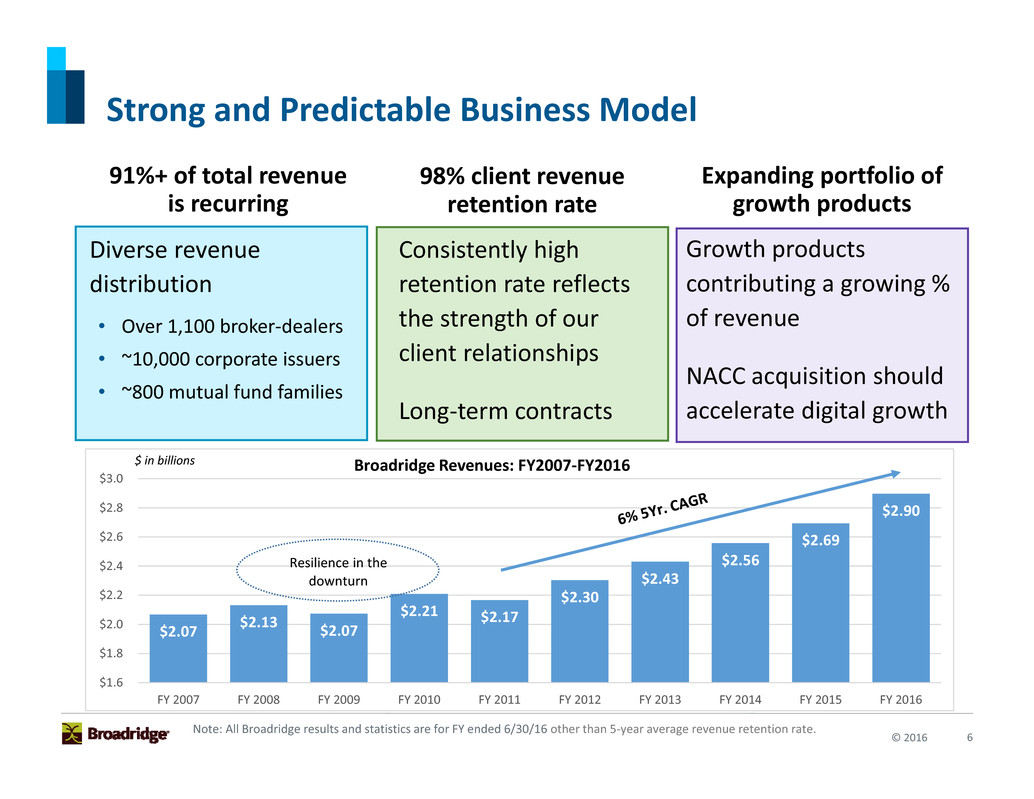
6© 2016 Strong and Predictable Business Model 98% client revenue retention rate Consistently high retention rate reflects the strength of our client relationships Long‐term contracts Expanding portfolio of growth products Growth products contributing a growing % of revenue NACC acquisition should accelerate digital growth 91%+ of total revenue is recurring Diverse revenue distribution • Over 1,100 broker‐dealers • ~10,000 corporate issuers • ~800 mutual fund families Note: All Broadridge results and statistics are for FY ended 6/30/16 other than 5‐year average revenue retention rate. $2.07 $2.13 $2.07 $2.21 $2.17 $2.30 $2.43 $2.56 $2.69 $2.90 $1.6 $1.8 $2.0 $2.2 $2.4 $2.6 $2.8 $3.0 FY 2007 FY 2008 FY 2009 FY 2010 FY 2011 FY 2012 FY 2013 FY 2014 FY 2015 FY 2016 Broadridge Revenues: FY2007‐FY2016$ in billions Resilience in the downturn
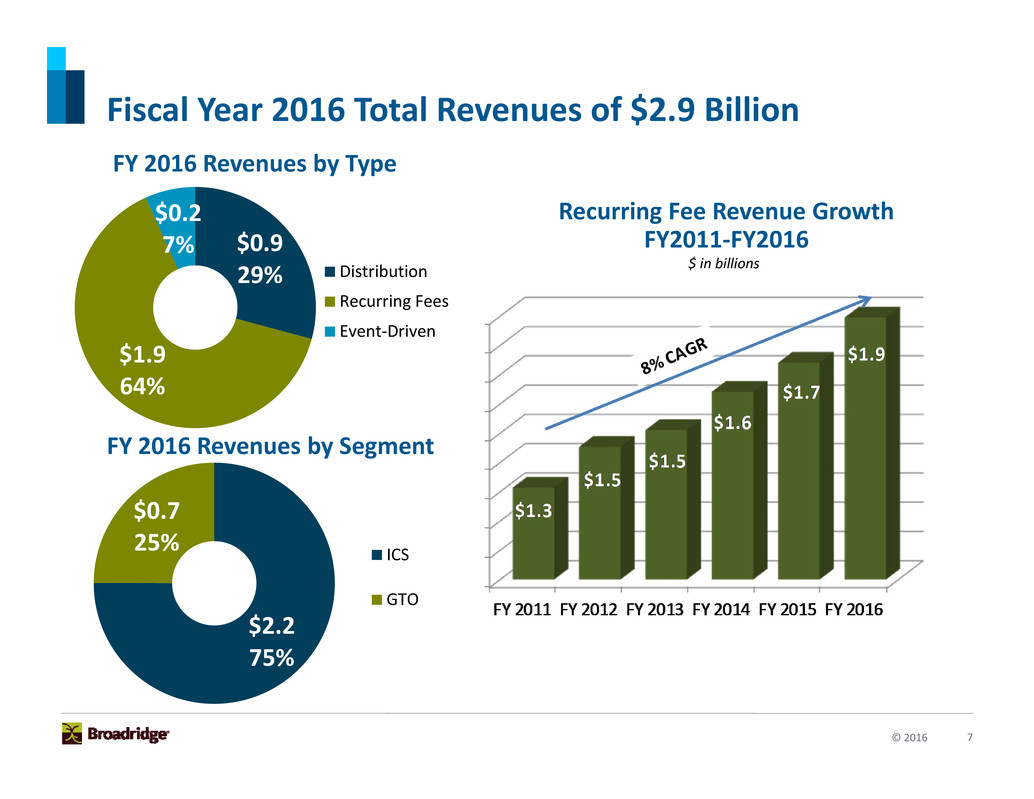
7© 2016 Fiscal Year 2016 Total Revenues of $2.9 Billion FY 2016 Revenues by Type Recurring Fee Revenue Growth FY2011‐FY2016$0.9 29% $1.9 64% $0.2 7% Distribution Recurring Fees Event‐Driven FY 2016 Revenues by Segment $2.2 75% $0.7 25% ICS GTO $ in billions
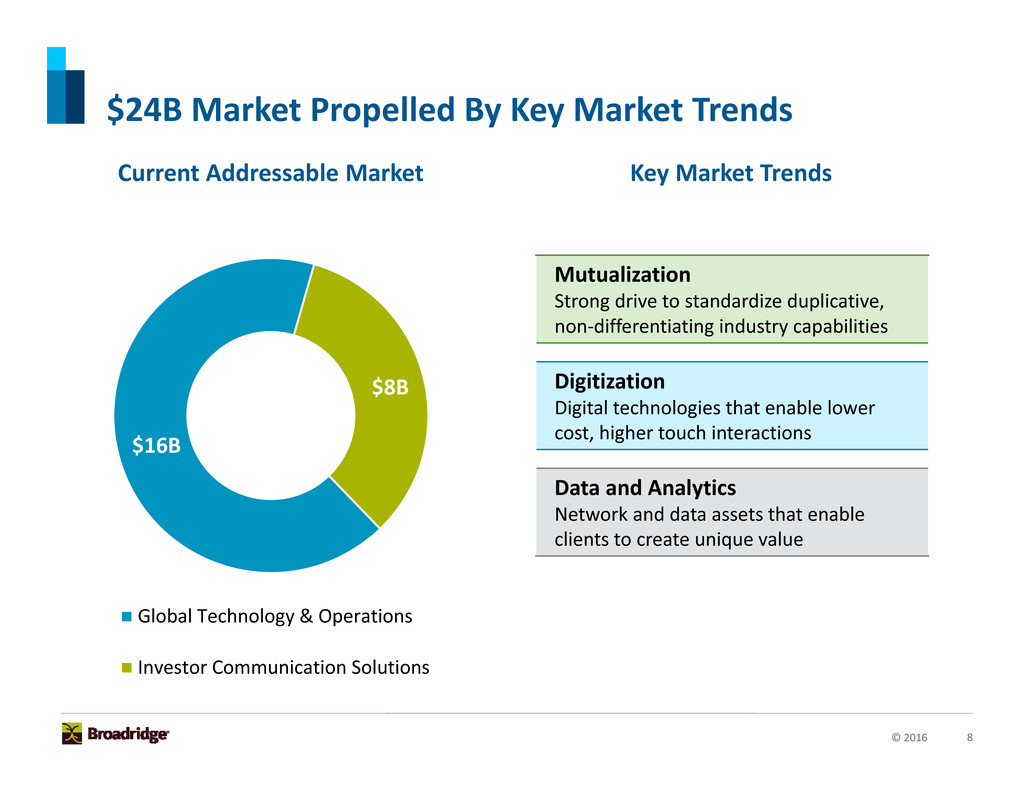
8© 2016 $24B Market Propelled By Key Market Trends Current Addressable Market Key Market Trends $16B $8B Global Technology & Operations Investor Communication Solutions Mutualization Strong drive to standardize duplicative, non‐differentiating industry capabilities Digitization Digital technologies that enable lower cost, higher touch interactions Data and Analytics Network and data assets that enable clients to create unique value
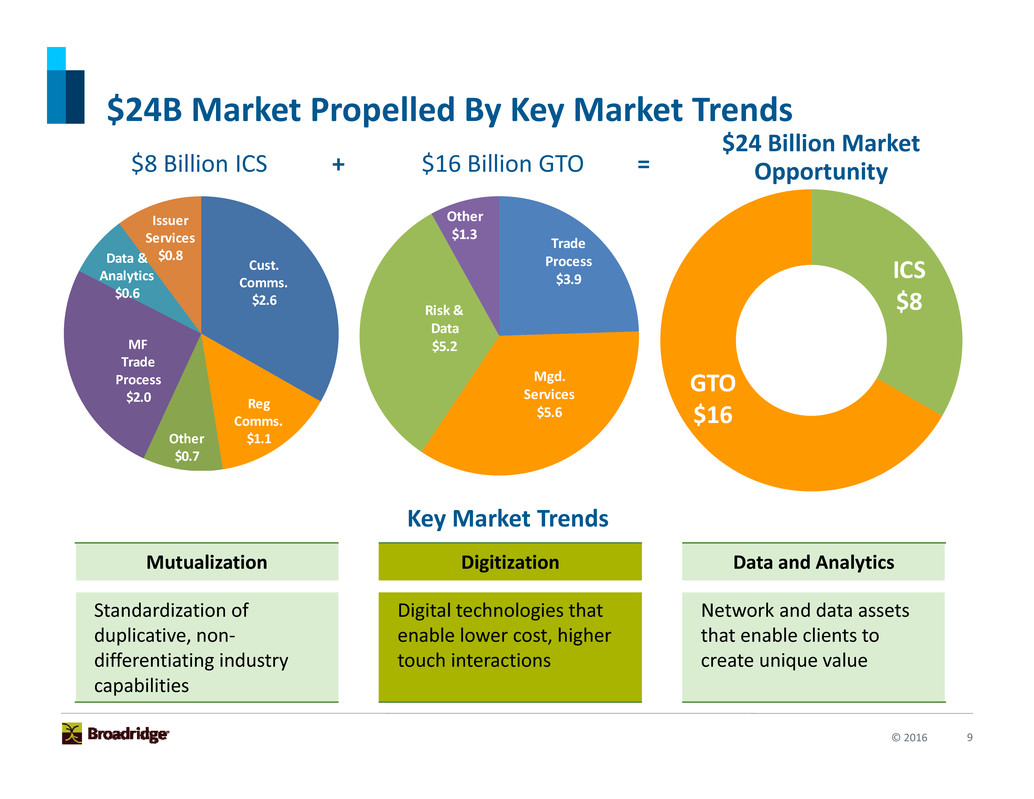
9© 2016 $24B Market Propelled By Key Market Trends Key Market Trends Mutualization Digitization Data and Analytics Standardization of duplicative, non‐ differentiating industry capabilities Digital technologies that enable lower cost, higher touch interactions Network and data assets that enable clients to create unique value $8 Billion ICS + $16 Billion GTO = ICS $8 GTO $16 Trade Process $3.9 Mgd. Services $5.6 Risk & Data $5.2 Other $1.3 Cust. Comms. $2.6 Reg Comms. $1.1 Other $0.7 MF Trade Process $2.0 Data & Analytics $0.6 Issuer Services $0.8 $24 Billion Market Opportunity
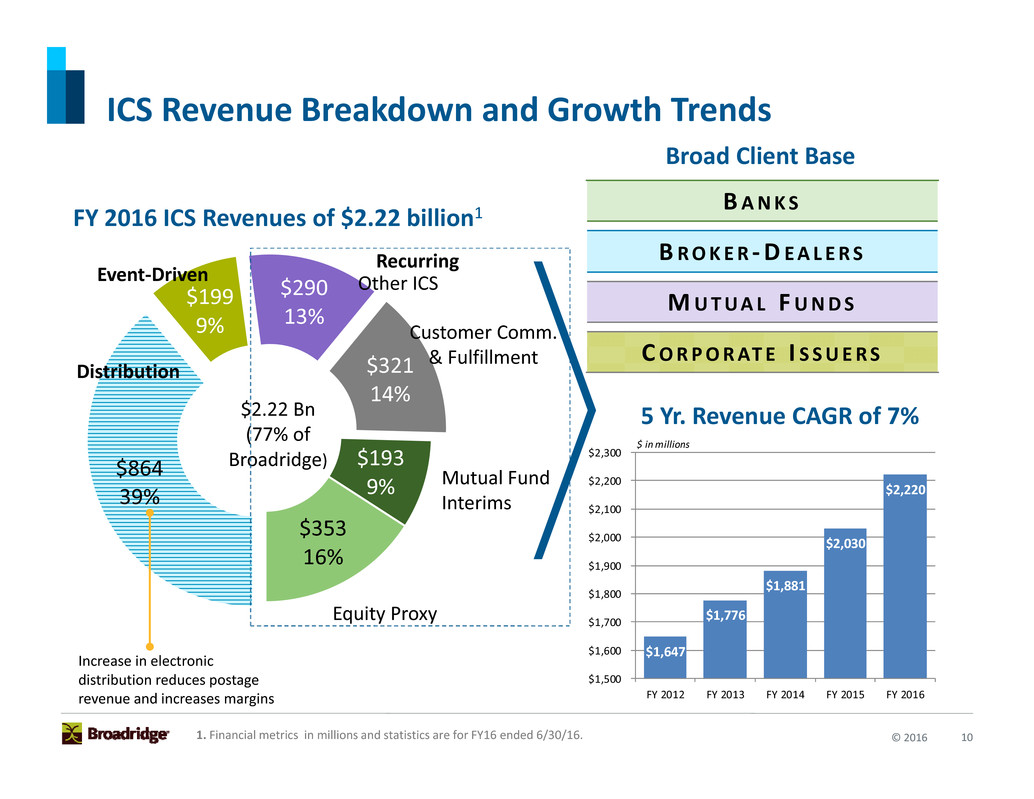
10© 2016 $1,647 $1,776 $1,881 $2,030 $2,220 $1,500 $1,600 $1,700 $1,800 $1,900 $2,000 $2,100 $2,200 $2,300 FY 2012 FY 2013 FY 2014 FY 2015 FY 2016 $ in millions ICS Revenue Breakdown and Growth Trends FY 2016 ICS Revenues of $2.22 billion1 Broad Client Base $864 39% $199 9% $290 13% $321 14% $193 9% $353 16% BANKS B ROKER ‐DEALERS MUTUAL F UNDS CORPORATE I S SUERS Distribution Other ICS Customer Comm. & Fulfillment Mutual Fund Interims Equity Proxy Increase in electronic distribution reduces postage revenue and increases margins 1. Financial metrics in millions and statistics are for FY16 ended 6/30/16. $2.22 Bn (77% of Broadridge) 5 Yr. Revenue CAGR of 7% Event‐Driven Recurring
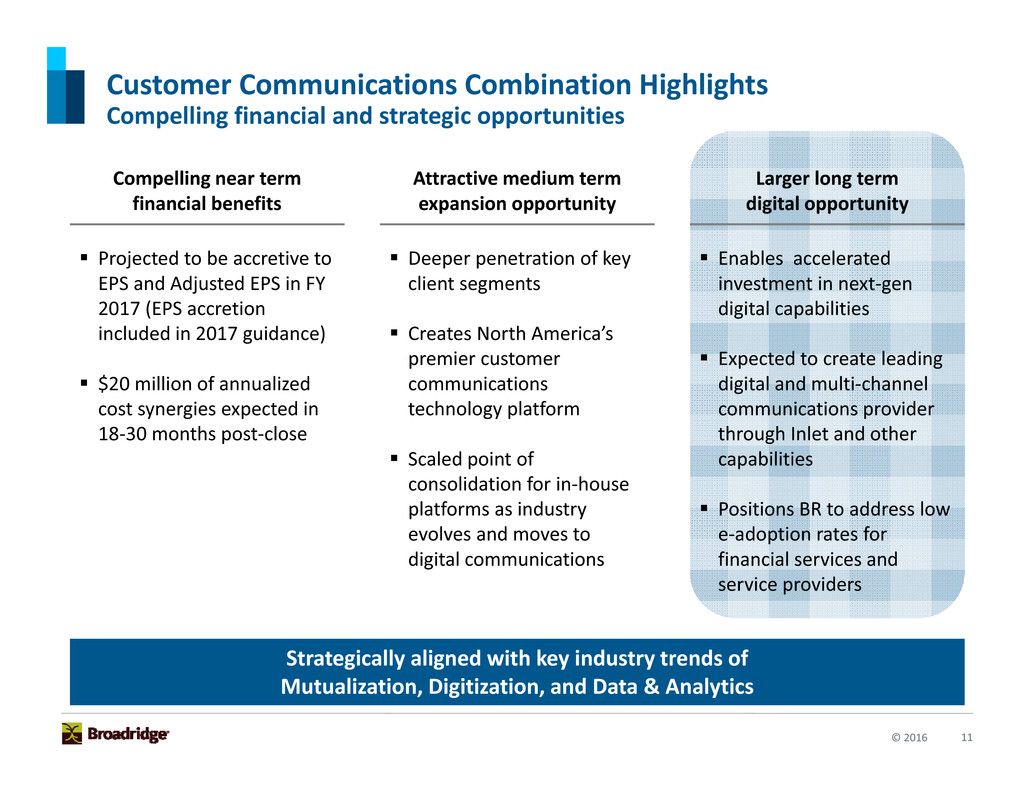
11© 2016 Customer Communications Combination Highlights Compelling financial and strategic opportunities Compelling near term financial benefits Attractive medium term expansion opportunity Larger long term digital opportunity Projected to be accretive to EPS and Adjusted EPS in FY 2017 (EPS accretion included in 2017 guidance) $20 million of annualized cost synergies expected in 18‐30 months post‐close Deeper penetration of key client segments Creates North America’s premier customer communications technology platform Scaled point of consolidation for in‐house platforms as industry evolves and moves to digital communications Enables accelerated investment in next‐gen digital capabilities Expected to create leading digital and multi‐channel communications provider through Inlet and other capabilities Positions BR to address low e‐adoption rates for financial services and service providers Strategically aligned with key industry trends of Mutualization, Digitization, and Data & Analytics
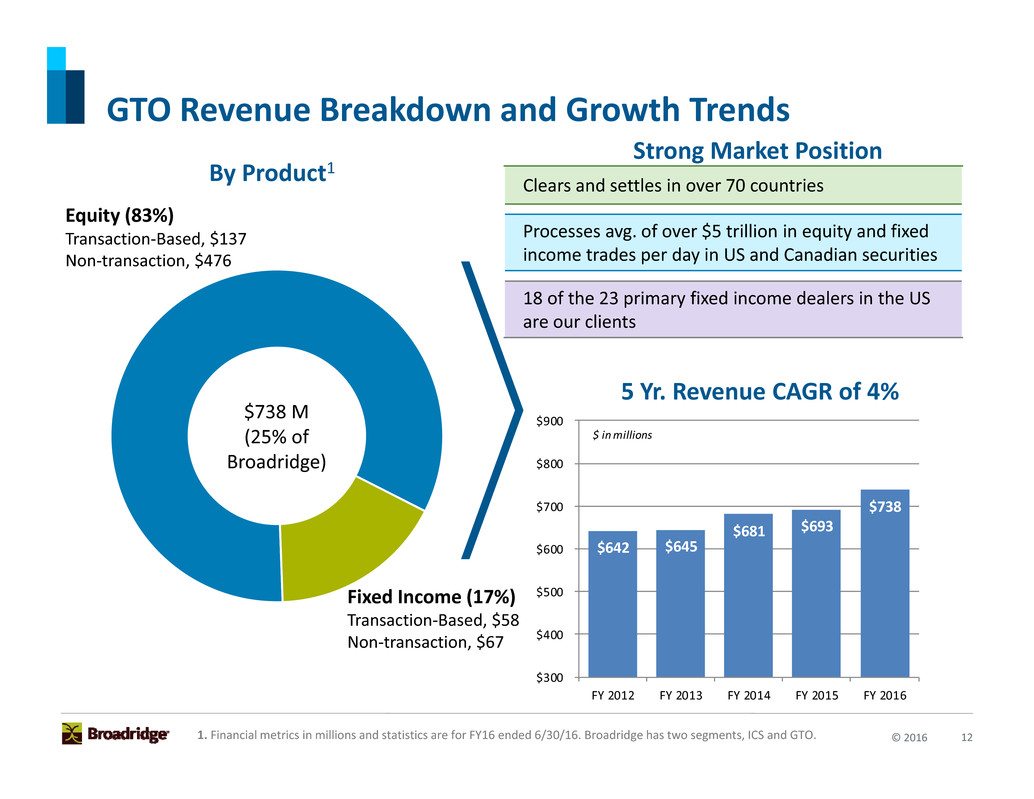
12© 2016 $642 $645 $681 $693 $738 $300 $400 $500 $600 $700 $800 $900 FY 2012 FY 2013 FY 2014 FY 2015 FY 2016 $ in millions GTO Revenue Breakdown and Growth Trends By Product1 Strong Market Position Clears and settles in over 70 countries Processes avg. of over $5 trillion in equity and fixed income trades per day in US and Canadian securities 18 of the 23 primary fixed income dealers in the US are our clients Equity (83%) Transaction‐Based, $137 Non‐transaction, $476 Fixed Income (17%) Transaction‐Based, $58 Non‐transaction, $67 1. Financial metrics in millions and statistics are for FY16 ended 6/30/16. Broadridge has two segments, ICS and GTO. $738 M (25% of Broadridge) 5 Yr. Revenue CAGR of 4%
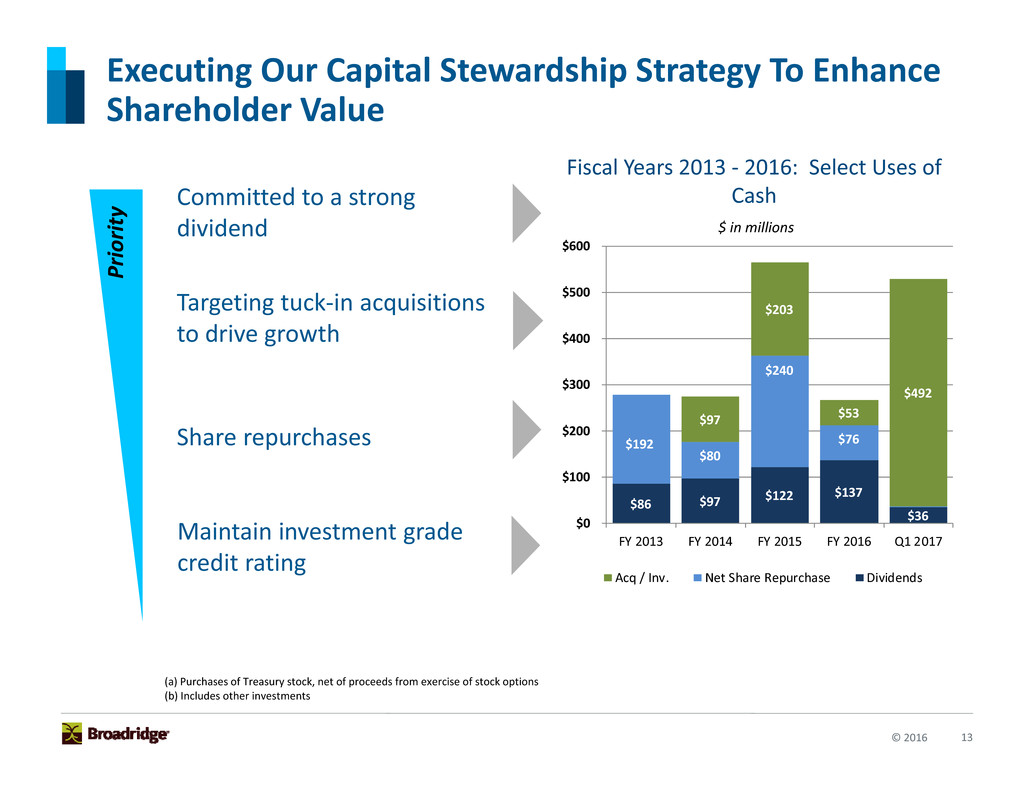
13© 2016 P r i o r i t y Executing Our Capital Stewardship Strategy To Enhance Shareholder Value Committed to a strong dividend Targeting tuck‐in acquisitions to drive growth Share repurchases Maintain investment grade credit rating Fiscal Years 2013 ‐ 2016: Select Uses of Cash (a) Purchases of Treasury stock, net of proceeds from exercise of stock options (b) Includes other investments $86 $97 $122 $137 $36 $192 $80 $240 $76 $97 $203 $53 $492 $0 $100 $200 $300 $400 $500 $600 FY 2013 FY 2014 FY 2015 FY 2016 Q1 2017 Acq / Inv. Net Share Repurchase Dividends $ in millions
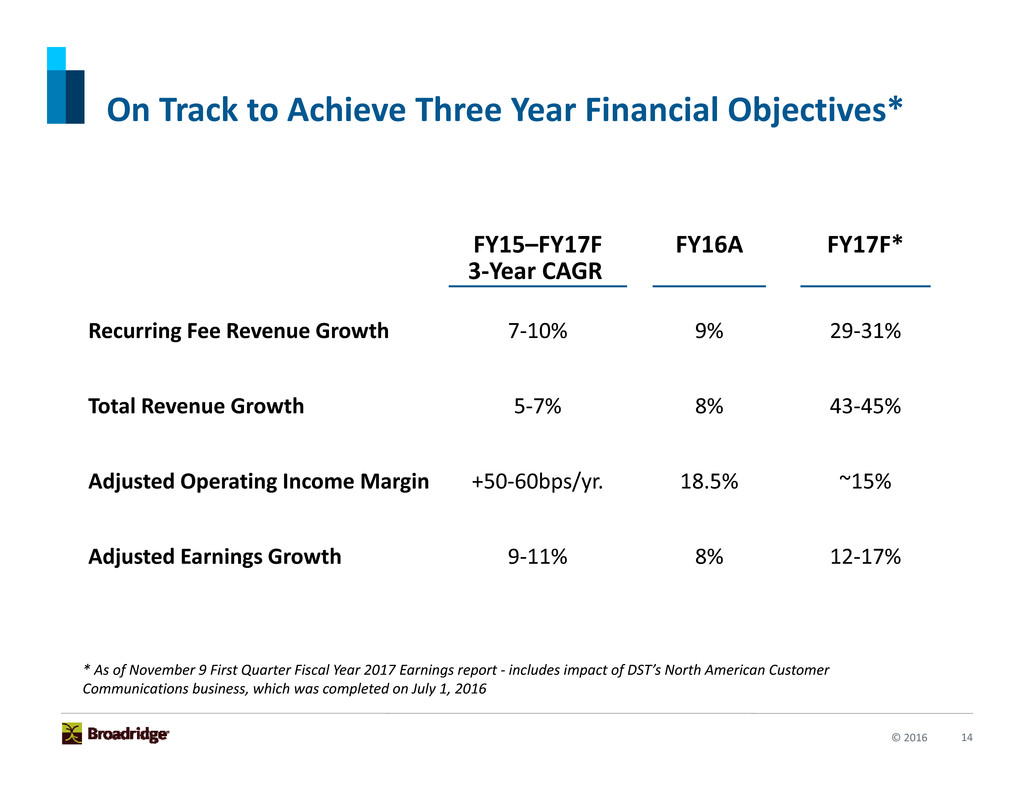
14© 2016 FY15–FY17F FY16A FY17F* Recurring Fee Revenue Growth 7‐10% 9% 29‐31% Total Revenue Growth 5‐7% 8% 43‐45% Adjusted Operating Income Margin +50‐60bps/yr. 18.5% ~15% Adjusted Earnings Growth 9‐11% 8% 12‐17% On Track to Achieve Three Year Financial Objectives* 3‐Year CAGR * As of November 9 First Quarter Fiscal Year 2017 Earnings report ‐ includes impact of DST’s North American Customer Communications business, which was completed on July 1, 2016
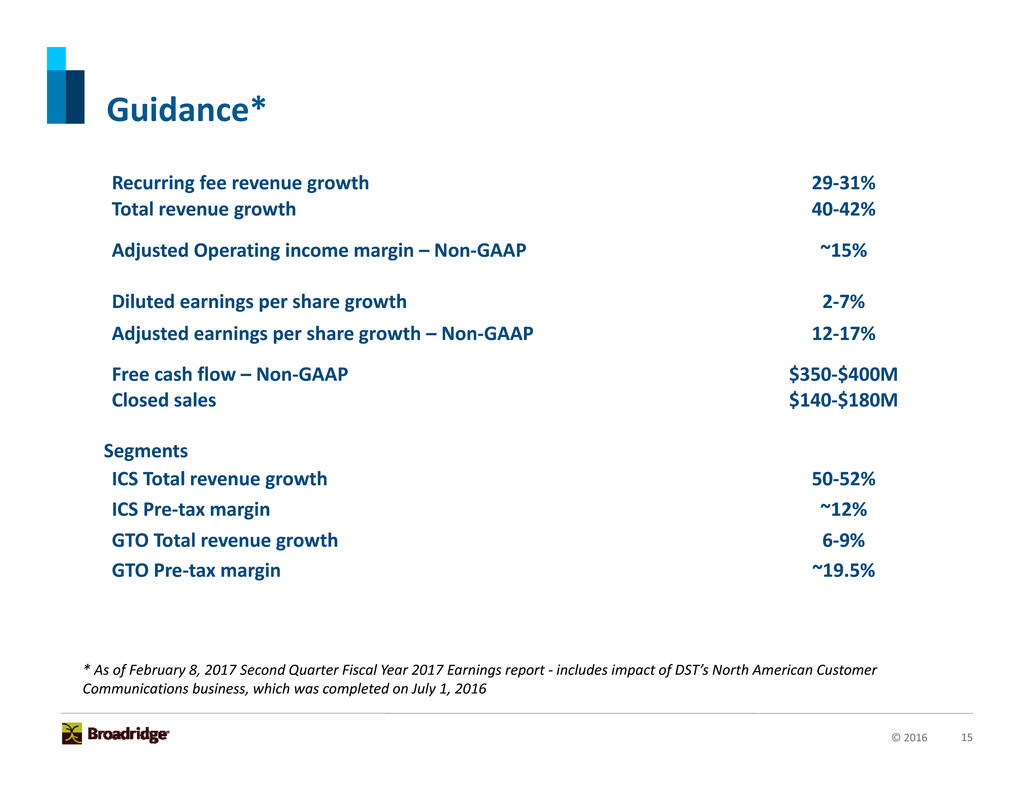
15© 2016 Guidance* * As of February 8, 2017 Second Quarter Fiscal Year 2017 Earnings report ‐ includes impact of DST’s North American Customer Communications business, which was completed on July 1, 2016 Recurring fee revenue growth 29‐31% Total revenue growth 40‐42% Adjusted Operating income margin – Non‐GAAP ~15% Diluted earnings per share growth 2‐7% Adjusted earnings per share growth – Non‐GAAP 12‐17% Free cash flow – Non‐GAAP $350‐$400M Closed sales $140‐$180M Segments ICS Total revenue growth 50‐52% ICS Pre‐tax margin ~12% GTO Total revenue growth 6‐9% GTO Pre‐tax margin ~19.5%
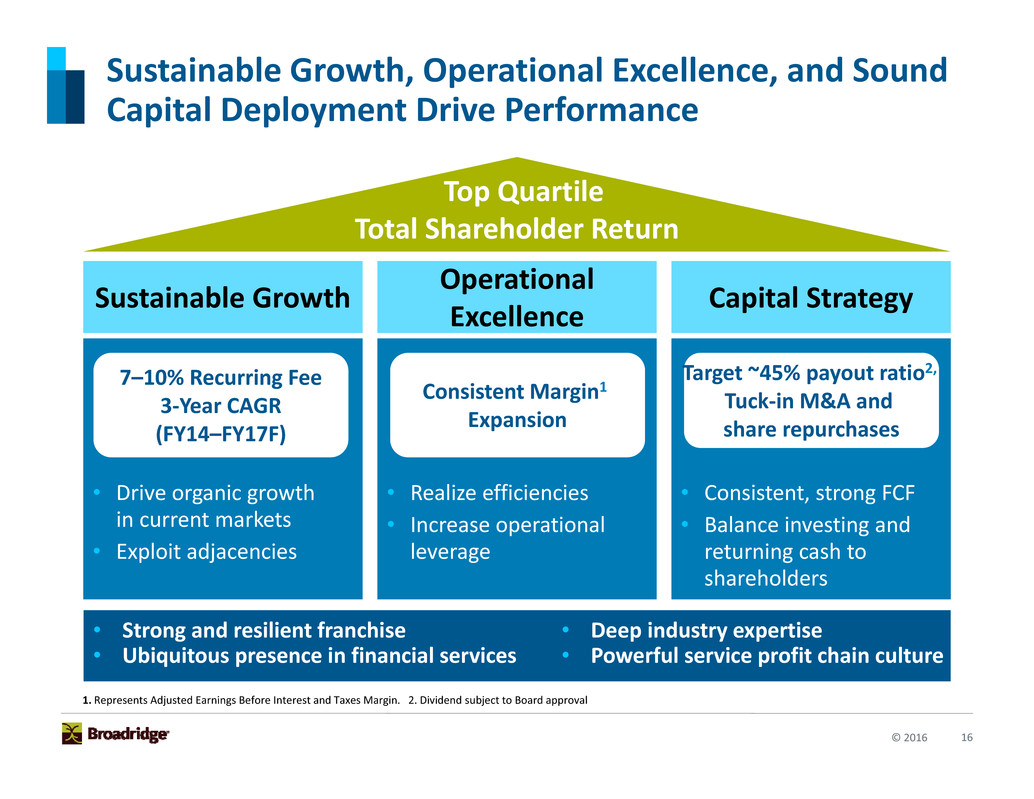
16© 2016 Sustainable Growth, Operational Excellence, and Sound Capital Deployment Drive Performance • Drive organic growth in current markets • Exploit adjacencies 7–10% Recurring Fee 3‐Year CAGR (FY14–FY17F) Sustainable Growth • Realize efficiencies • Increase operational leverage Consistent Margin1 Expansion Operational Excellence • Consistent, strong FCF • Balance investing and returning cash to shareholders Target ~45% payout ratio2, Tuck‐in M&A and share repurchases Capital Strategy Top Quartile Total Shareholder Return • Strong and resilient franchise • Ubiquitous presence in financial services • Deep industry expertise • Powerful service profit chain culture 1. Represents Adjusted Earnings Before Interest and Taxes Margin. 2. Dividend subject to Board approval
Broadridge Second Quarter and First Six Months Fiscal Year 2017 Highlights
18© 2016 Second Quarter 2017 Financial Summary Total revenue growth of 40% and recurring fee revenue growth of 34% o NACC acquisition drove much of the growth o 6% organic growth of recurring revenue Continued growth in Adjusted operating income and Adjusted EPS o Profit growth driven by acquisition of NACC and organic growth in recurring fee revenues partially offset by decline in quarterly event‐driven revenues o Diluted EPS also impacted by integration expenses and higher acquisition‐ related amortization Record Q2 Closed sales up 15%. Closed sales up 18% versus first half of fiscal year 2016 Balanced capital allocation o Closed tuck‐in acquisition of $25 million o $60 million of net share buybacks
19© 2016 Second Quarter 2017 Business Update Broad momentum across both GTO and ICS o Reflects breadth of products and focus on clients Record Closed sales highlights growing recognition of power of Broadridge’s utility solutions o Tier one bank adopts BR’s SaaS equity trade processing platform o Signed another major broker‐dealer for tax services Business environment remains stable o Calendar year 2017 expected to be strong year for mutual fund proxies: timing versus Broadridge fiscal year not yet finalized o Post election trading increase a tailwind o Mutual fund interim record growth remains low by historical standards NACC integration going well o Digital strategy moving forward o On plan to achieve $20 million synergy realization goal
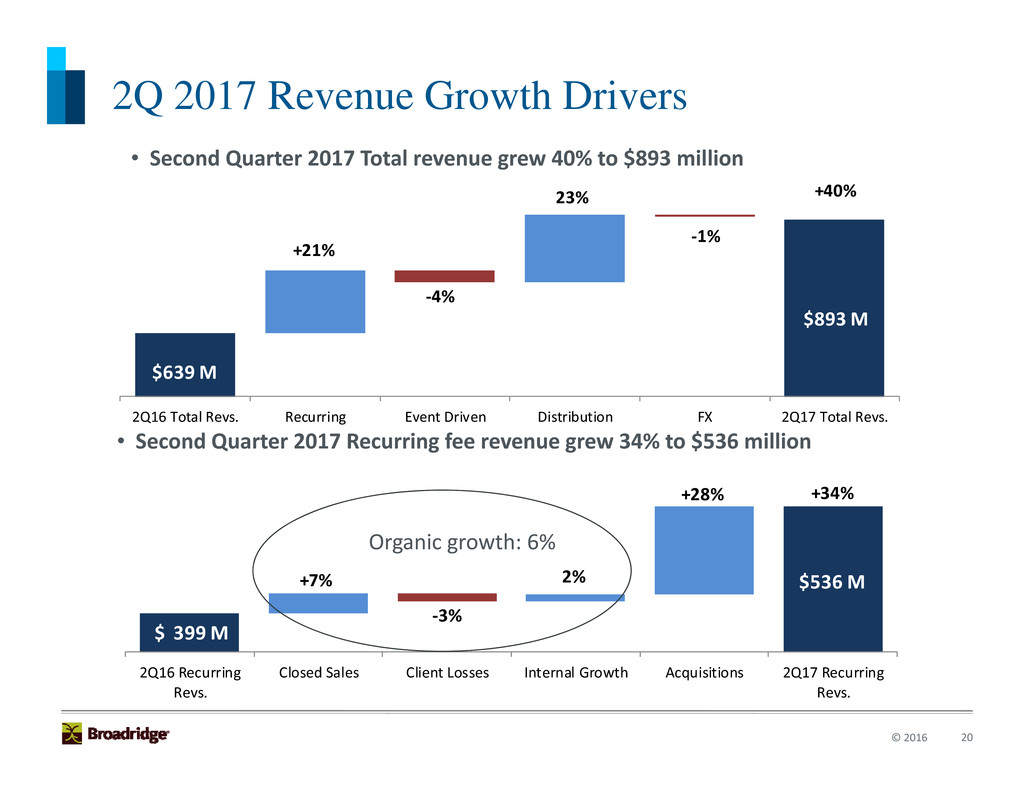
20© 2016 2Q16 Recurring Revs. Closed Sales Client Losses Internal Growth Acquisitions 2Q17 Recurring Revs. $ 399 M $536 M+7% ‐3% 2% +28% +34% 2Q16 Total Revs. Recurring Event Driven Distribution FX 2Q17 Total Revs. $893 M +21% ‐4% 23% $639 M ‐1% +40% 2Q 2017 Revenue Growth Drivers • Second Quarter 2017 Total revenue grew 40% to $893 million • Second Quarter 2017 Recurring fee revenue grew 34% to $536 million Organic growth: 6%
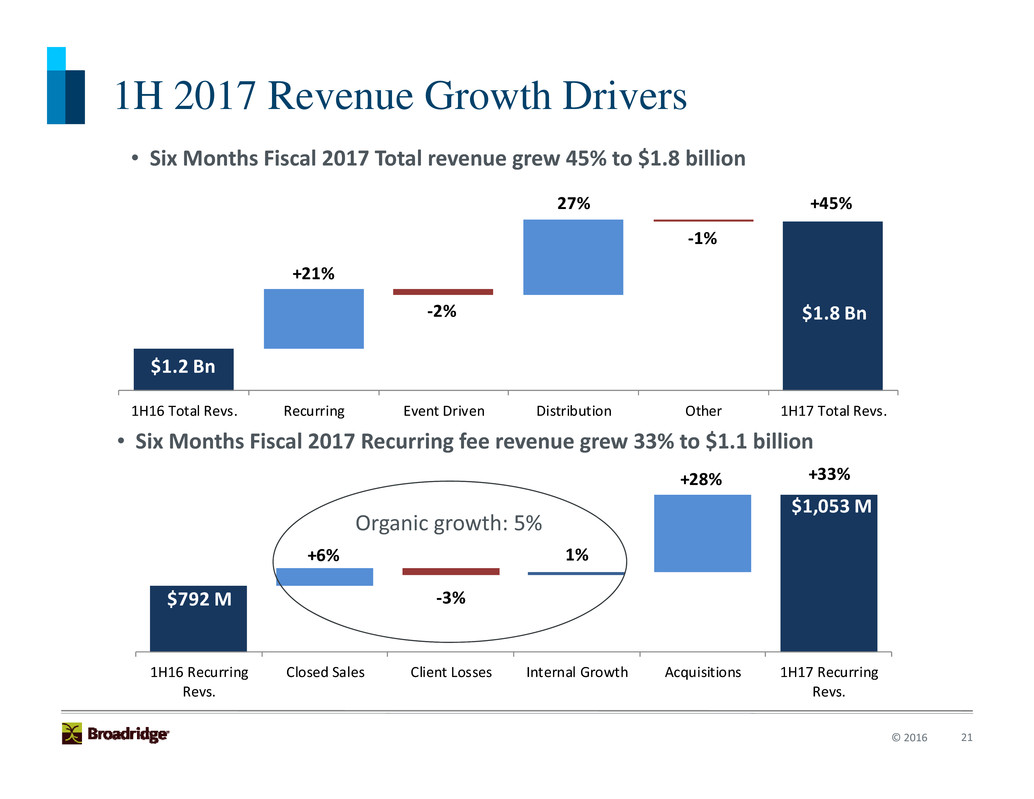
21© 2016 1H16 Recurring Revs. Closed Sales Client Losses Internal Growth Acquisitions 1H17 Recurring Revs. $792 M $1,053 M +6% ‐3% 1% +28% +33% 1H16 Total Revs. Recurring Event Driven Distribution Other 1H17 Total Revs. $1.8 Bn +21% ‐2% 27% $1.2 Bn ‐1% +45% 1H 2017 Revenue Growth Drivers • Six Months Fiscal 2017 Total revenue grew 45% to $1.8 billion • Six Months Fiscal 2017 Recurring fee revenue grew 33% to $1.1 billion Organic growth: 5%
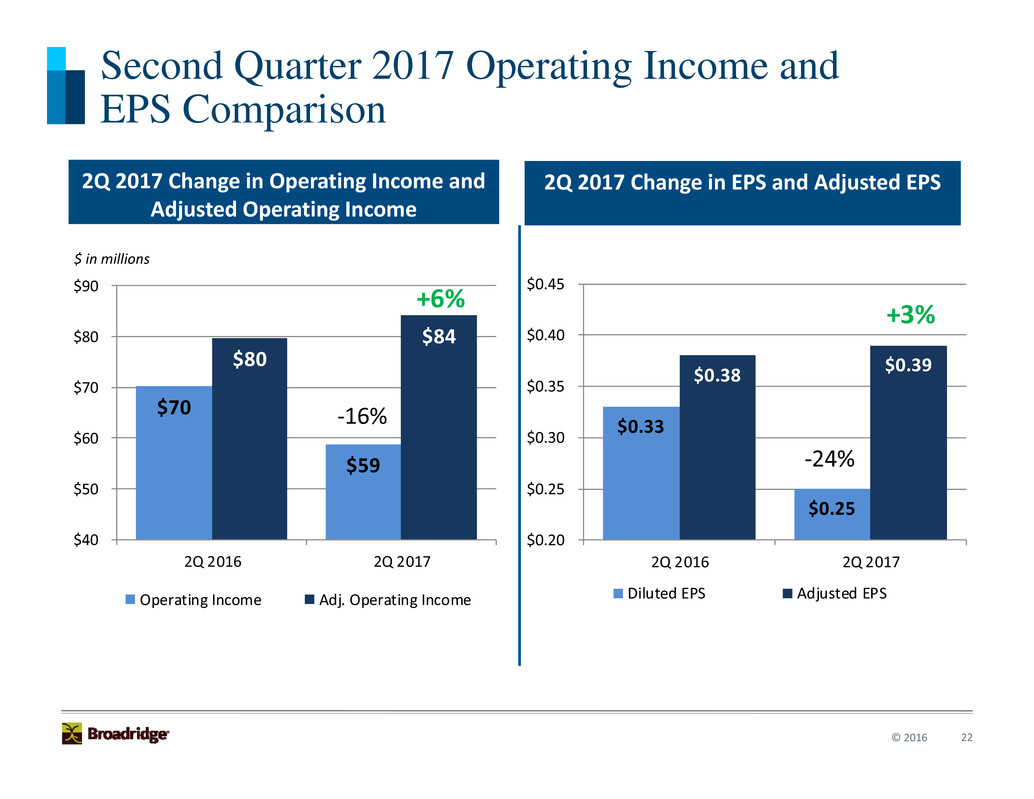
22© 2016 $0.33 $0.25 $0.38 $0.39 $0.20 $0.25 $0.30 $0.35 $0.40 $0.45 2Q 2016 2Q 2017 Diluted EPS Adjusted EPS +3% ‐24% Second Quarter 2017 Operating Income and EPS Comparison $ in millions 2Q 2017 Change in Operating Income and Adjusted Operating Income 2Q 2017 Change in EPS and Adjusted EPS $70 $59 $80 $84 $40 $50 $60 $70 $80 $90 2Q 2016 2Q 2017 Operating Income Adj. Operating Income +6% ‐16%
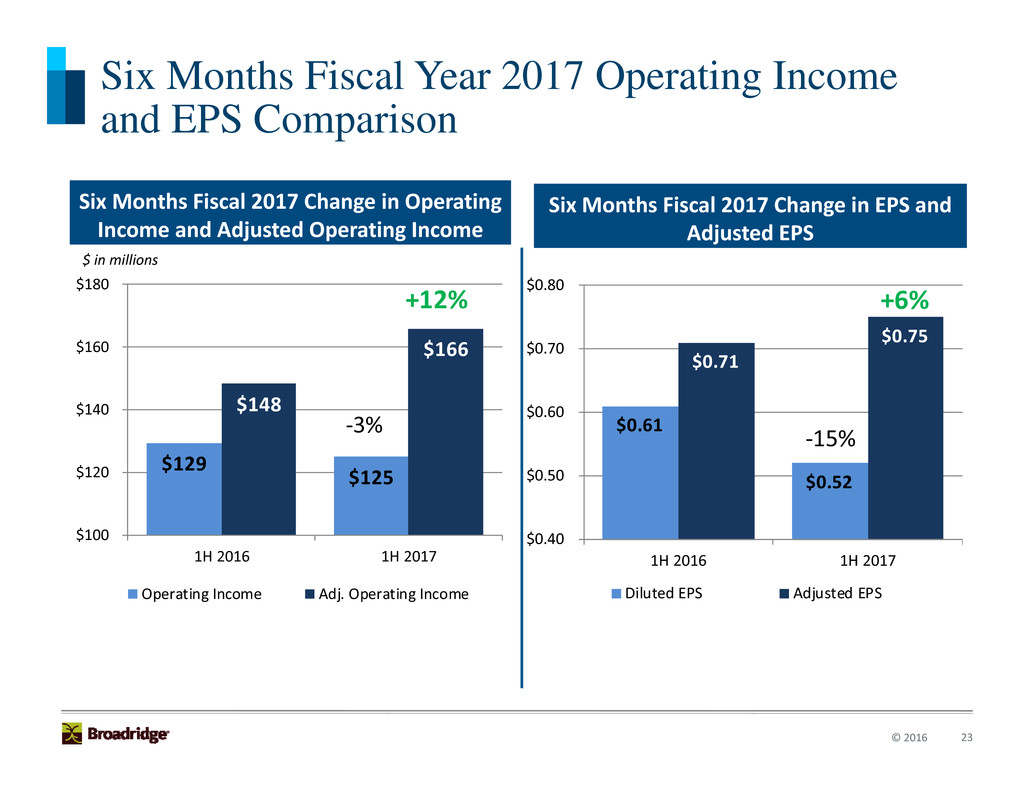
23© 2016 $0.61 $0.52 $0.71 $0.75 $0.40 $0.50 $0.60 $0.70 $0.80 1H 2016 1H 2017 Diluted EPS Adjusted EPS +6% ‐15% Six Months Fiscal Year 2017 Operating Income and EPS Comparison $ in millions Six Months Fiscal 2017 Change in Operating Income and Adjusted Operating Income Six Months Fiscal 2017 Change in EPS and Adjusted EPS $129 $125 $148 $166 $100 $120 $140 $160 $180 1H 2016 1H 2017 Operating Income Adj. Operating Income +12% ‐3%
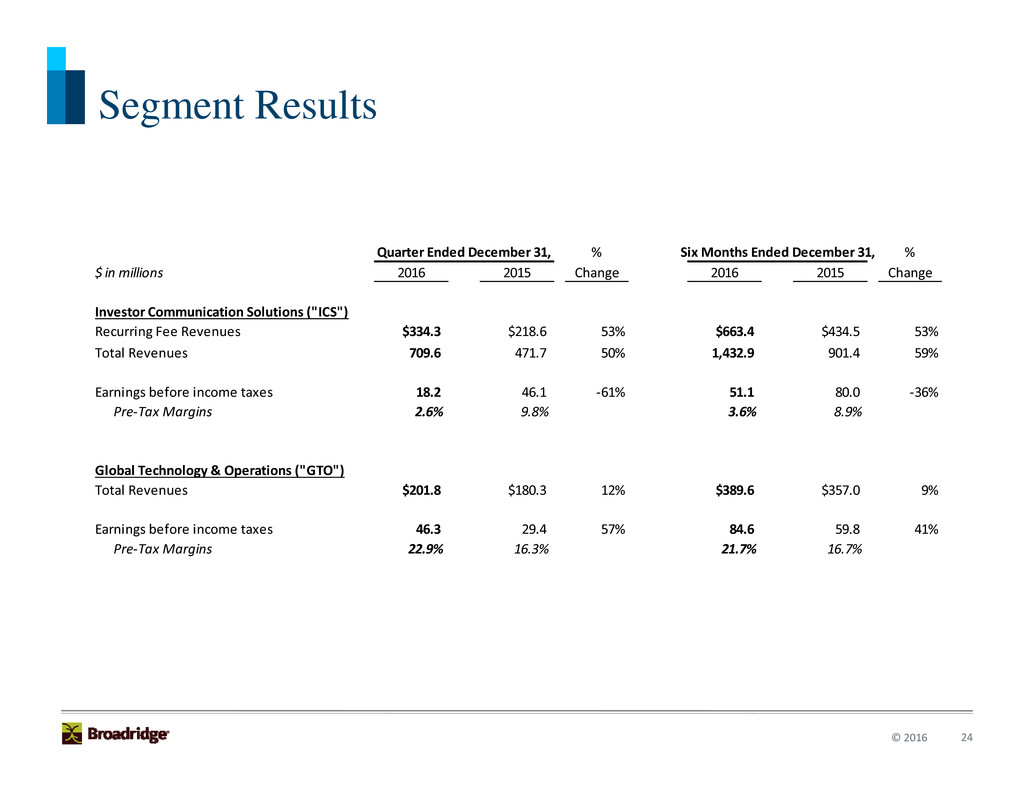
24© 2016 Segment Results Quarter Ended December 31, % Six Months Ended December 31, % $ in millions 2016 2015 Change 2016 2015 Change Investor Communication Solutions ("ICS") Recurring Fee Revenues $334.3 $218.6 53% $663.4 $434.5 53% Total Revenues 709.6 471.7 50% 1,432.9 901.4 59% Earnings before income taxes 18.2 46.1 ‐61% 51.1 80.0 ‐36% Pre‐Tax Margins 2.6% 9.8% 3.6% 8.9% Global Technology & Operations ("GTO") Total Revenues $201.8 $180.3 12% $389.6 $357.0 9% Earnings before income taxes 46.3 29.4 57% 84.6 59.8 41% Pre‐Tax Margins 22.9% 16.3% 21.7% 16.7%
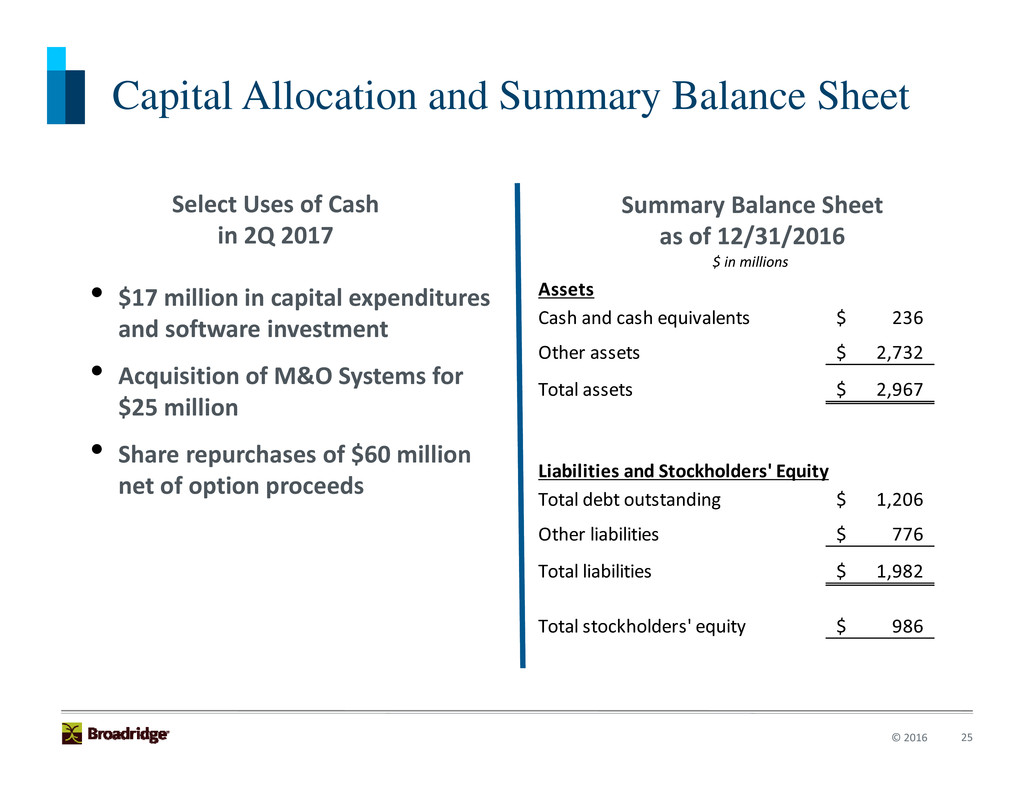
25© 2016 Capital Allocation and Summary Balance Sheet Summary Balance Sheet as of 12/31/2016 Select Uses of Cash in 2Q 2017 • $17 million in capital expenditures and software investment • Acquisition of M&O Systems for $25 million • Share repurchases of $60 million net of option proceeds $ in millions Assets Cash and cash equivalents 236$ Other assets 2,732$ Total assets 2,967$ Liabilities and Stockholders' Equity Total debt outstanding 1,206$ Other liabilities 776$ Total liabilities 1,982$ Total stockholders' equity 986$
Appendix
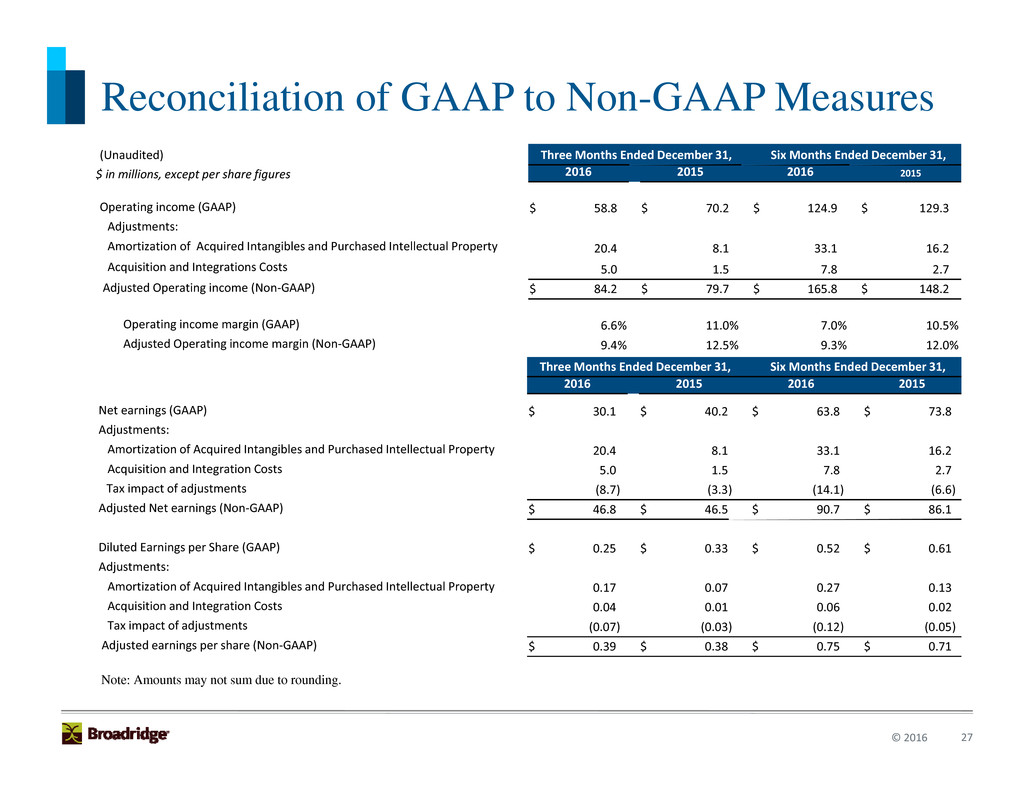
27© 2016 Reconciliation of GAAP to Non-GAAP Measures (Unaudited) Three Months Ended December 31, Six Months Ended December 31, $ in millions, except per share figures 2016 2015 2016 2015 Operating income (GAAP) $ 58.8 $ 70.2 $ 124.9 $ 129.3 Adjustments: Amortization of Acquired Intangibles and Purchased Intellectual Property 20.4 8.1 33.1 16.2 Acquisition and Integrations Costs 5.0 1.5 7.8 2.7 Adjusted Operating income (Non‐GAAP) $ 84.2 $ 79.7 $ 165.8 $ 148.2 Operating income margin (GAAP) 6.6% 11.0% 7.0% 10.5% Adjusted Operating income margin (Non‐GAAP) 9.4% 12.5% 9.3% 12.0% Three Months Ended December 31, Six Months Ended December 31, 2016 2015 2016 2015 Net earnings (GAAP) $ 30.1 $ 40.2 $ 63.8 $ 73.8 Adjustments: Amortization of Acquired Intangibles and Purchased Intellectual Property 20.4 8.1 33.1 16.2 Acquisition and Integration Costs 5.0 1.5 7.8 2.7 Tax impact of adjustments (8.7) (3.3) (14.1) (6.6) Adjusted Net earnings (Non‐GAAP) $ 46.8 $ 46.5 $ 90.7 $ 86.1 Diluted Earnings per Share (GAAP) $ 0.25 $ 0.33 $ 0.52 $ 0.61 Adjustments: Amortization of Acquired Intangibles and Purchased Intellectual Property 0.17 0.07 0.27 0.13 Acquisition and Integration Costs 0.04 0.01 0.06 0.02 Tax impact of adjustments (0.07) (0.03) (0.12) (0.05) Adjusted earnings per share (Non‐GAAP) $ 0.39 $ 0.38 $ 0.75 $ 0.71 Note: Amounts may not sum due to rounding.
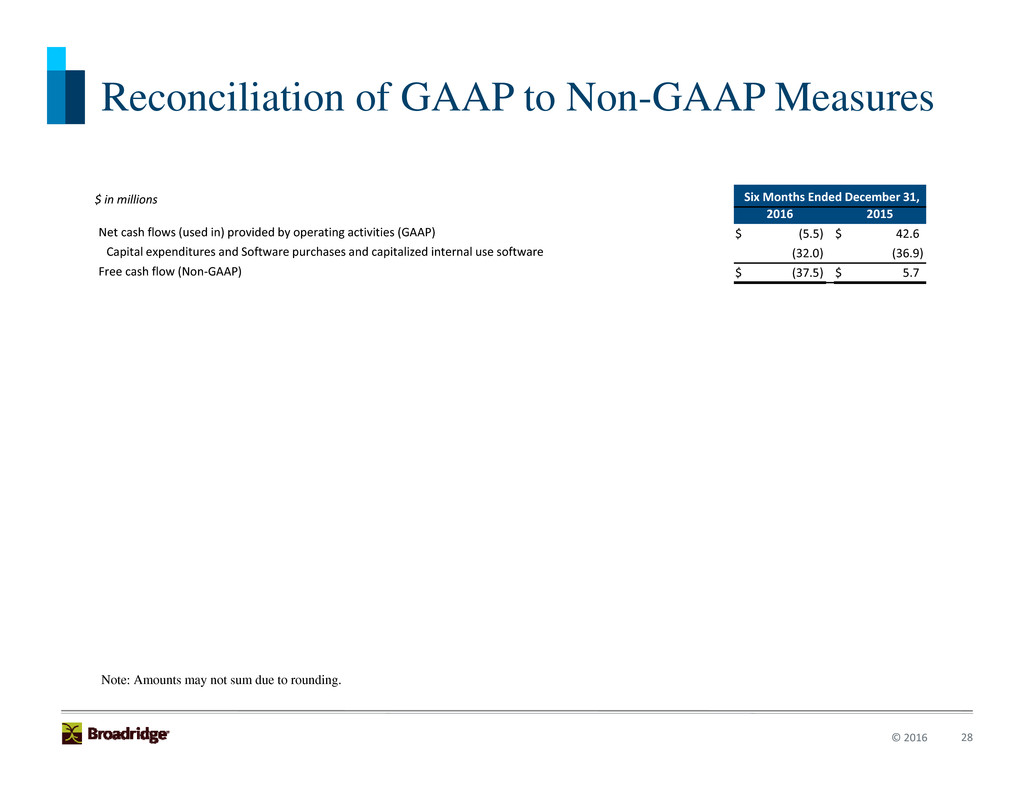
28© 2016 Reconciliation of GAAP to Non-GAAP Measures $ in millions Six Months Ended December 31, 2016 2015 Net cash flows (used in) provided by operating activities (GAAP) $ (5.5) $ 42.6 Capital expenditures and Software purchases and capitalized internal use software (32.0) (36.9) Free cash flow (Non‐GAAP) $ (37.5) $ 5.7 Note: Amounts may not sum due to rounding.
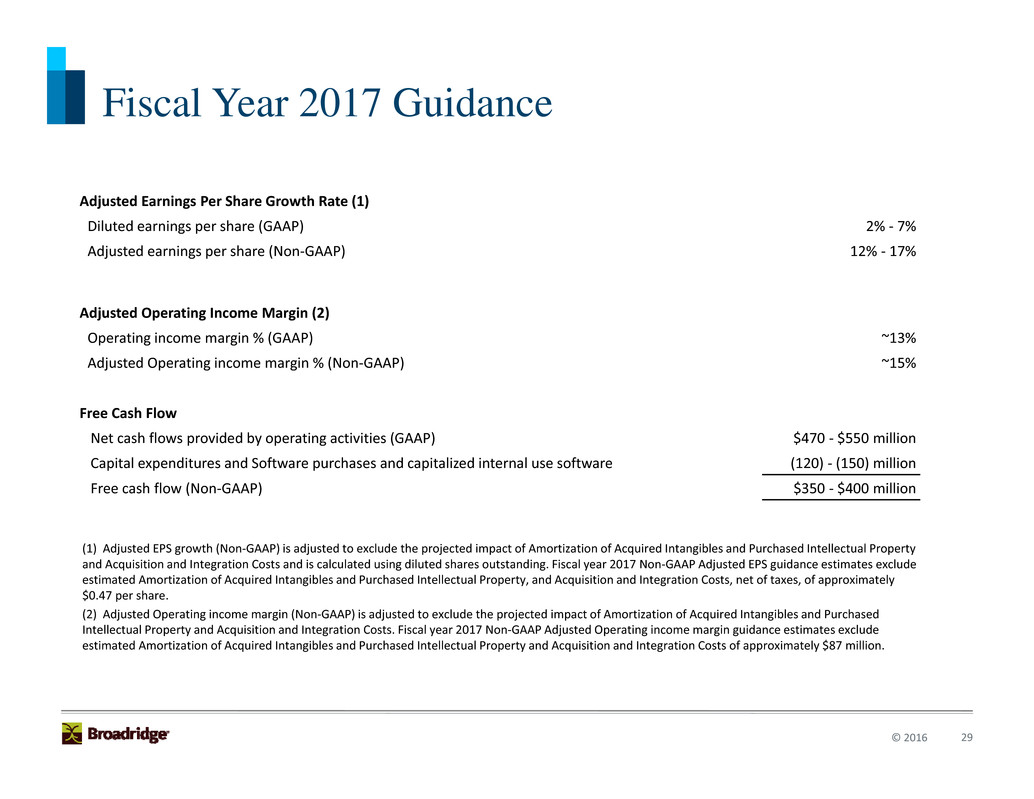
29© 2016 Fiscal Year 2017 Guidance Adjusted Earnings Per Share Growth Rate (1) Diluted earnings per share (GAAP) 2% ‐ 7% Adjusted earnings per share (Non‐GAAP) 12% ‐ 17% Adjusted Operating Income Margin (2) Operating income margin % (GAAP) ~13% Adjusted Operating income margin % (Non‐GAAP) ~15% Free Cash Flow Net cash flows provided by operating activities (GAAP) $470 ‐ $550 million Capital expenditures and Software purchases and capitalized internal use software (120) ‐ (150) million Free cash flow (Non‐GAAP) $350 ‐ $400 million (1) Adjusted EPS growth (Non‐GAAP) is adjusted to exclude the projected impact of Amortization of Acquired Intangibles and Purchased Intellectual Property and Acquisition and Integration Costs and is calculated using diluted shares outstanding. Fiscal year 2017 Non‐GAAP Adjusted EPS guidance estimates exclude estimated Amortization of Acquired Intangibles and Purchased Intellectual Property, and Acquisition and Integration Costs, net of taxes, of approximately $0.47 per share. (2) Adjusted Operating income margin (Non‐GAAP) is adjusted to exclude the projected impact of Amortization of Acquired Intangibles and Purchased Intellectual Property and Acquisition and Integration Costs. Fiscal year 2017 Non‐GAAP Adjusted Operating income margin guidance estimates exclude estimated Amortization of Acquired Intangibles and Purchased Intellectual Property and Acquisition and Integration Costs of approximately $87 million.


