
2017 Investor Day December 5, 2017 EXHIBIT 99.1
Forward-Looking Statements Forward-Looking StatementsThe Broadridge 2017 Investor Day presentations and other written or oral statements made from time to time by representatives of Broadridge Financial Solutions, Inc. ("Broadridge" or the "Company") may contain “forward-looking statements” within the meaning of the Private Securities Litigation Reform Act of 1995. Statements that are not historical in nature, and which may be identified by the use of words such as “expects,” “assumes,” “projects,” “anticipates,” “estimates,” “we believe,” “could be” and other words of similar meaning, are forward-looking statements. In particular, information about our future performance objectives are forward-looking statements. These statements are based on management’s expectations and assumptions and are subject to risks and uncertainties that may cause actual results to differ materially from those expressed. These risks and uncertainties include those risk factors discussed in Part I, “Item 1A. Risk Factors” of our Annual Report on Form 10-K for the fiscal year ended June 30, 2017 (the “2017 Annual Report”), as they may be updated in any future reports filed with the Securities and Exchange Commission. All forward-looking statements speak only as of the date of this presentation and are expressly qualified in their entirety by reference to the factors discussed in the 2017 Annual Report.These risks include: the success of Broadridge in retaining and selling additional services to its existing clients and in obtaining new clients; Broadridge’s reliance on a relatively small number of clients, the continued financial health of those clients, and the continued use by such clients of Broadridge’s services with favorable pricing terms; any material breach of Broadridge security affecting its clients’ customer information; changes in laws and regulations affecting Broadridge’s clients or the services provided by Broadridge; declines in participation and activity in the securities markets; the failure of Broadridge’s outsourced data center services provider to provide the anticipated levels of service; a disaster or other significant slowdown or failure of Broadridge’s systems or error in the performance of Broadridge’s services; overall market and economic conditions and their impact on the securities markets; Broadridge’s failure to keep pace with changes in technology and demands of its clients; Broadridge’s ability to attract and retain key personnel; the impact of new acquisitions and divestitures; and competitive conditions. Broadridge disclaims any obligation to update or revise forward-looking statements that may be made to reflect events or circumstances that arise after the date made or to reflect the occurrence of unanticipated events, other than as required by law. Defined TermsPlease refer to the Company’s 2017 Annual Report for the definitions of terms used in the Broadridge 2017 Investor Day presentations and not defined therein. Use of Material Contained HereinThe information contained in the Broadridge 2017 Investor Day presentations is being provided for your convenience and information only. This information is accurate as of the date of its initial presentation. If you plan to use this information for any purpose, verification of its continued accuracy is your responsibility. Broadridge assumes no duty to update or revise the information contained in the Broadridge 2017 Investor Day presentations.
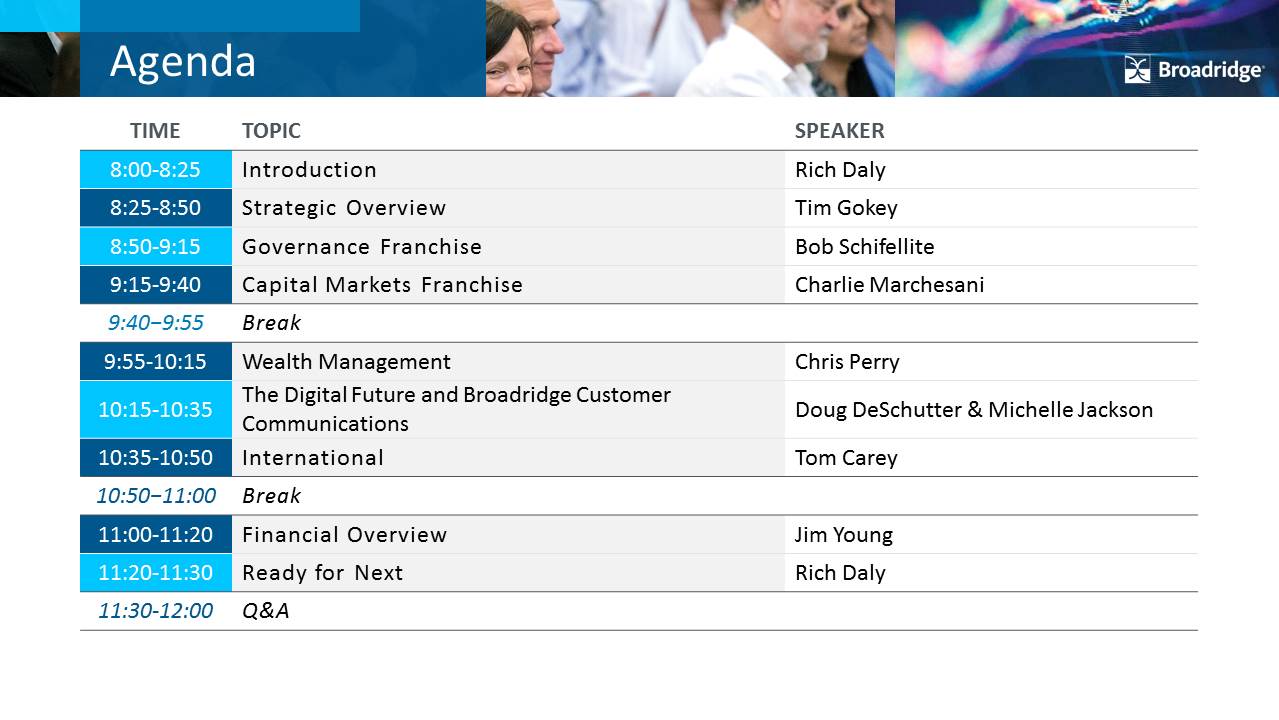
Agenda TIME TOPIC SPEAKER 8:00-8:25 Introduction Rich Daly 8:25-8:50 Strategic Overview Tim Gokey 8:50-9:15 Governance Franchise Bob Schifellite 9:15-9:40 Capital Markets Franchise Charlie Marchesani 9:40−9:55 Break 9:55-10:15 Wealth Management Chris Perry 10:15-10:35 The Digital Future and Broadridge Customer Communications Doug DeSchutter & Michelle Jackson 10:35-10:50 International Tom Carey 10:50−11:00 Break 11:00-11:20 Financial Overview Jim Young 11:20-11:30 Ready for Next Rich Daly 11:30-12:00 Q&A

Ready for Next CASING FORMATSHeadlines:Sentence case; no punctuationSubheads under headlines: Sentence case; with punctuationSubheads in body copy/bullets: Sentence case; no punctuation
Broadridge Investor Day Introduction Rich DalyChief Executive Officer
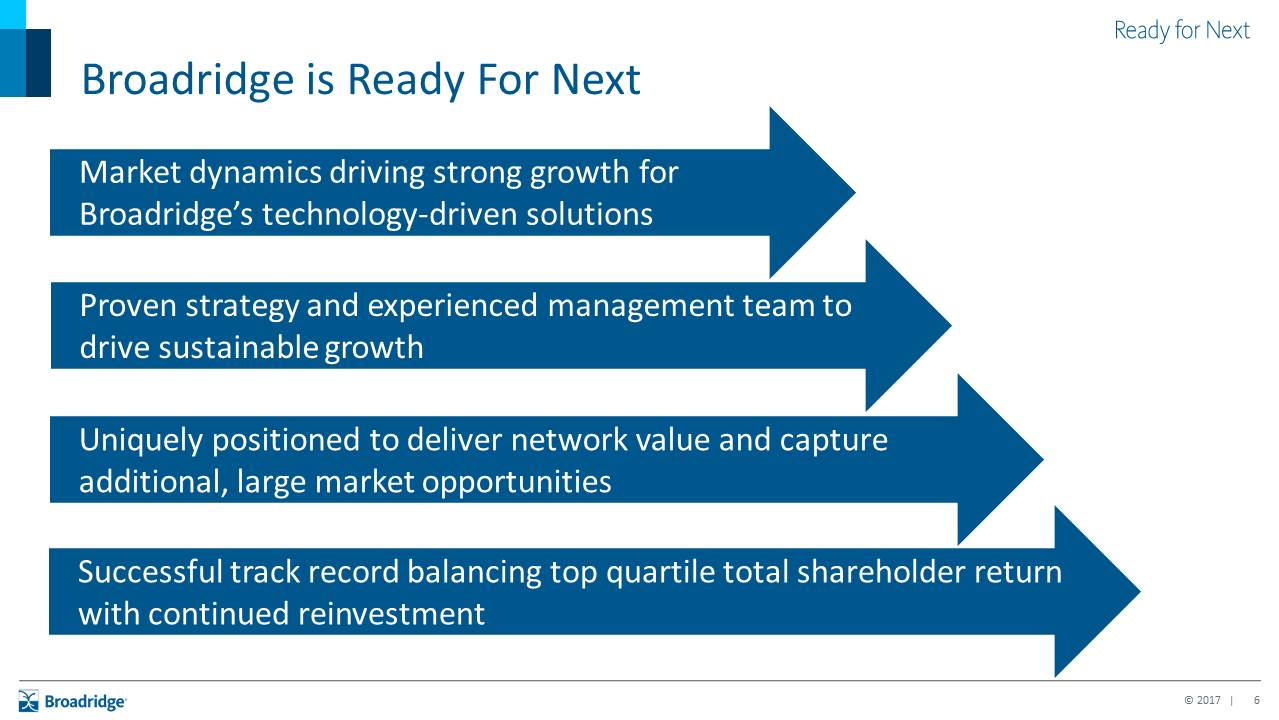
Market dynamics driving strong growth for Broadridge’s technology-driven solutions Broadridge is Ready For Next Proven strategy and experienced management team to drive sustainable growth Uniquely positioned to deliver network value and capture additional, large market opportunities Successful track record balancing top quartile total shareholder return with continued reinvestment
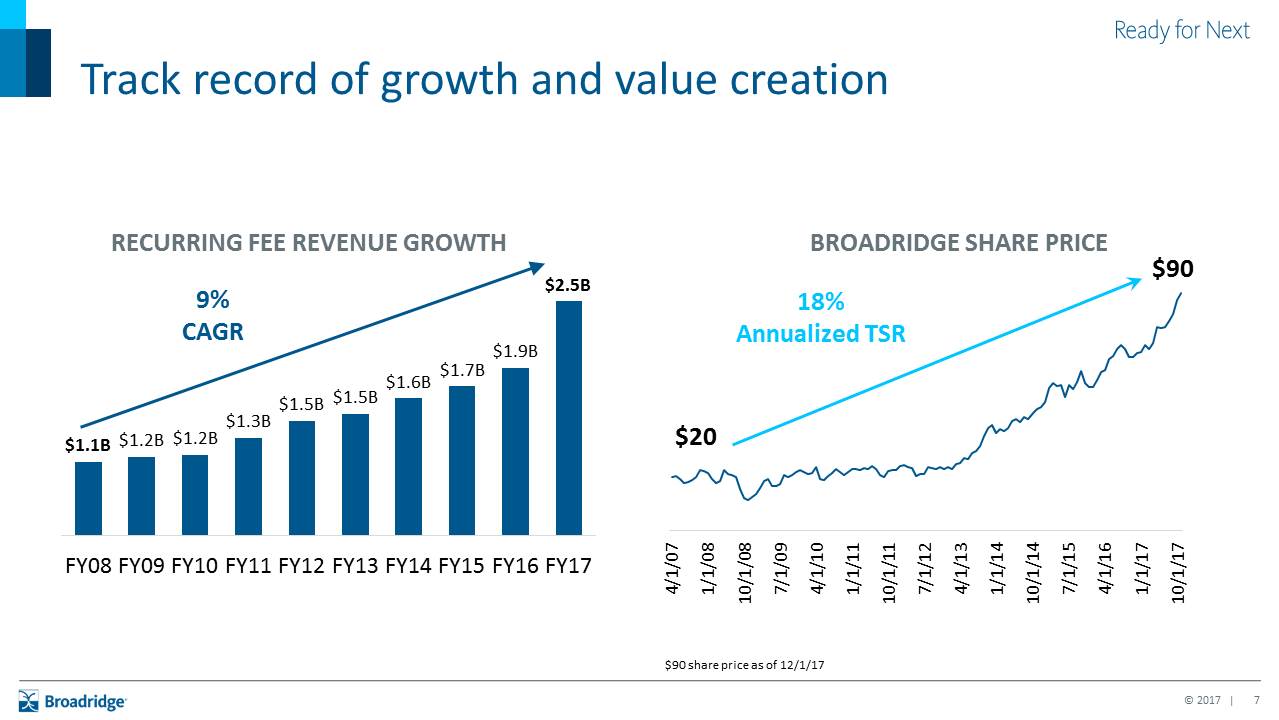
Track record of growth and value creation 9% CAGR RECURRING FEE REVENUE GROWTH BROADRIDGE SHARE PRICE 18%Annualized TSR $90 share price as of 12/1/17
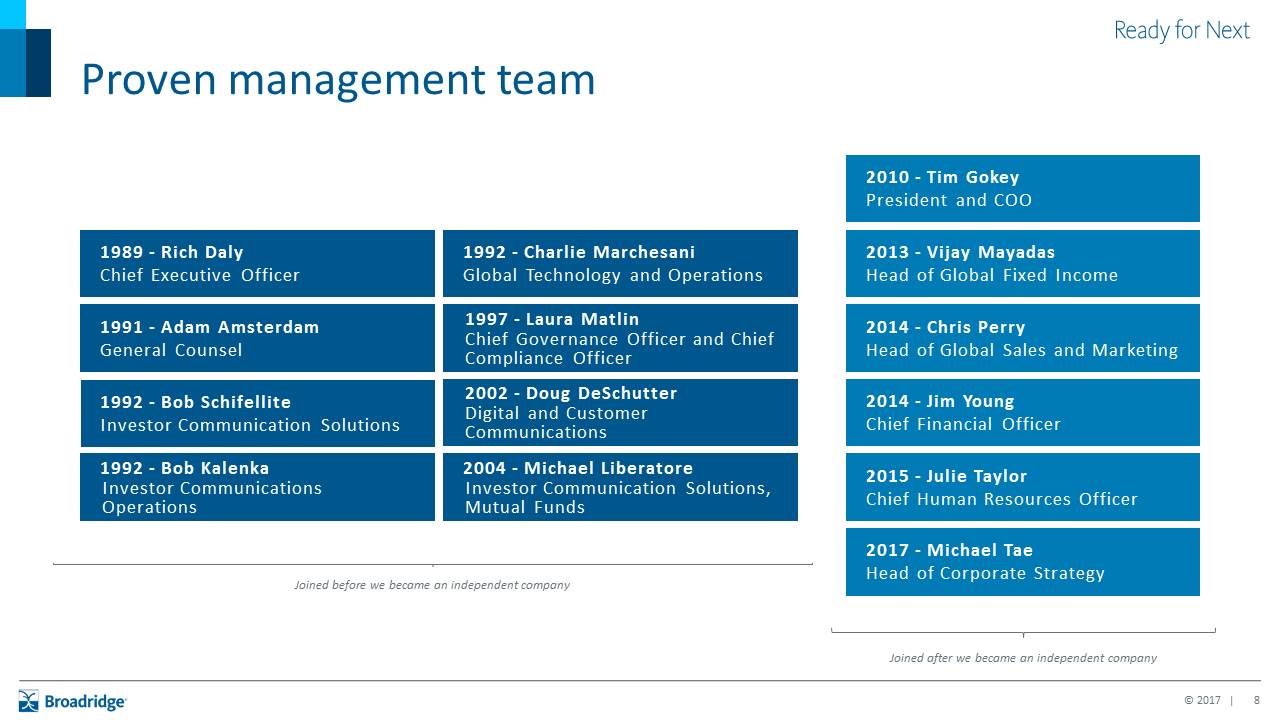
Proven management team 1992 - Bob SchifelliteInvestor Communication Solutions 1992 - Charlie MarchesaniGlobal Technology and Operations 2014 - Chris PerryHead of Global Sales and Marketing 1989 - Rich DalyChief Executive Officer 2010 - Tim GokeyPresident and COO 2014 - Jim YoungChief Financial Officer 2015 - Julie Taylor Chief Human Resources Officer 2002 - Doug DeSchutterDigital and Customer Communications 2013 - Vijay MayadasHead of Global Fixed Income 1997 - Laura MatlinChief Governance Officer and Chief Compliance Officer 1992 - Bob KalenkaInvestor Communications Operations 1991 - Adam AmsterdamGeneral Counsel 2004 - Michael LiberatoreInvestor Communication Solutions, Mutual Funds 2017 - Michael TaeHead of Corporate Strategy Joined before we became an independent company Joined after we became an independent company
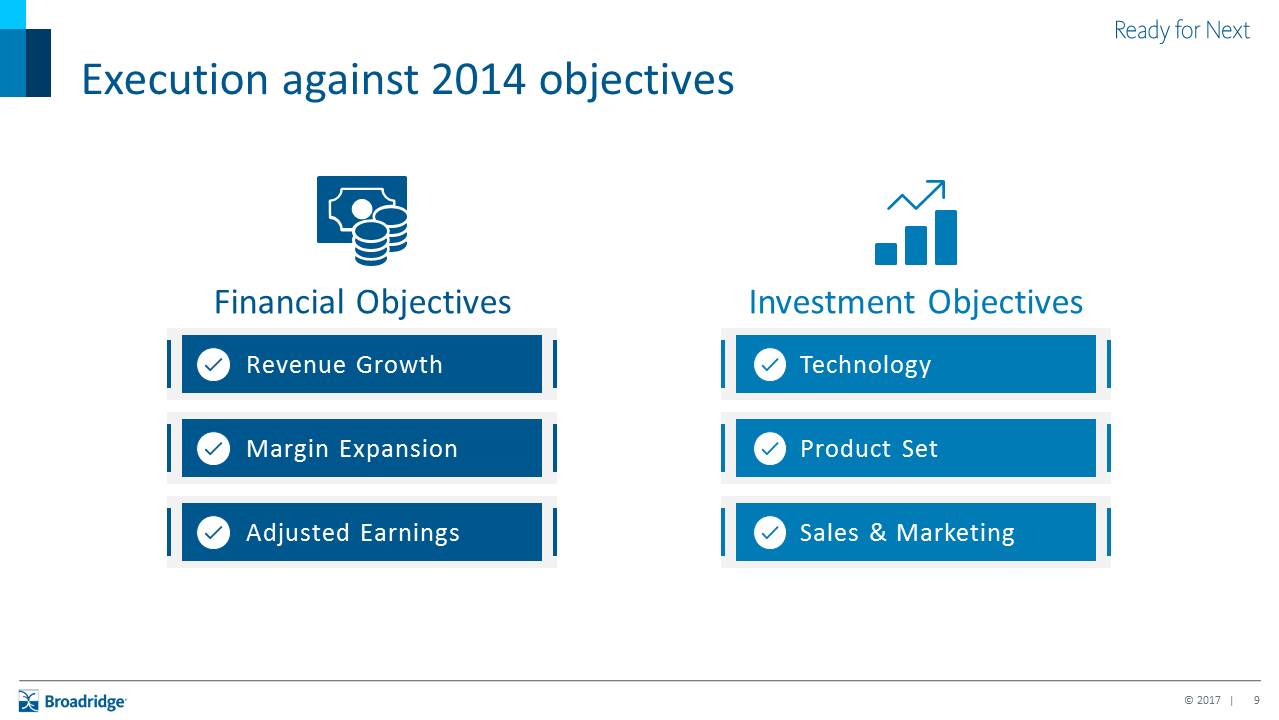
Execution against 2014 objectives Financial Objectives Revenue Growth Margin Expansion Adjusted Earnings Technology Product Set Sales & Marketing Investment Objectives
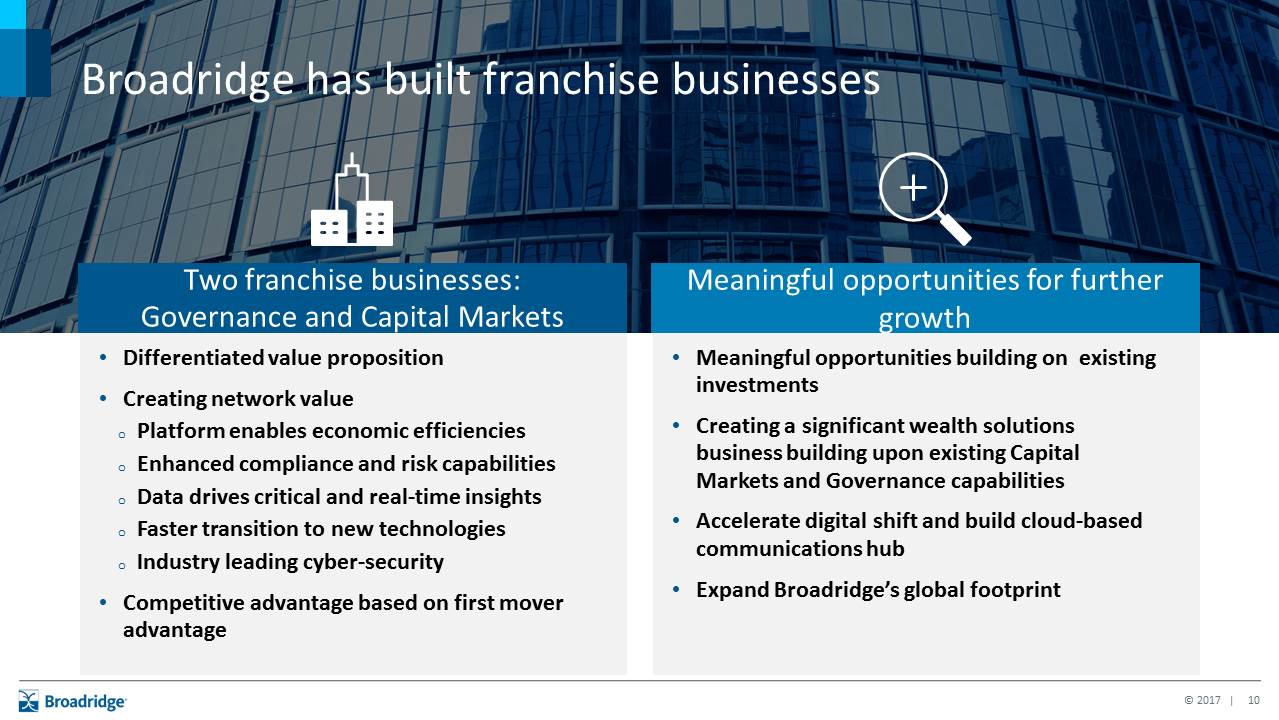
Differentiated value propositionCreating network valuePlatform enables economic efficienciesEnhanced compliance and risk capabilitiesData drives critical and real-time insightsFaster transition to new technologiesIndustry leading cyber-securityCompetitive advantage based on first mover advantage Meaningful opportunities building on existing investmentsCreating a significant wealth solutions business building upon existing Capital Markets and Governance capabilitiesAccelerate digital shift and build cloud-based communications hubExpand Broadridge’s global footprint Access Data Tax Two franchise businesses: Governance and Capital Markets Meaningful opportunities for further growth Broadridge has built franchise businesses
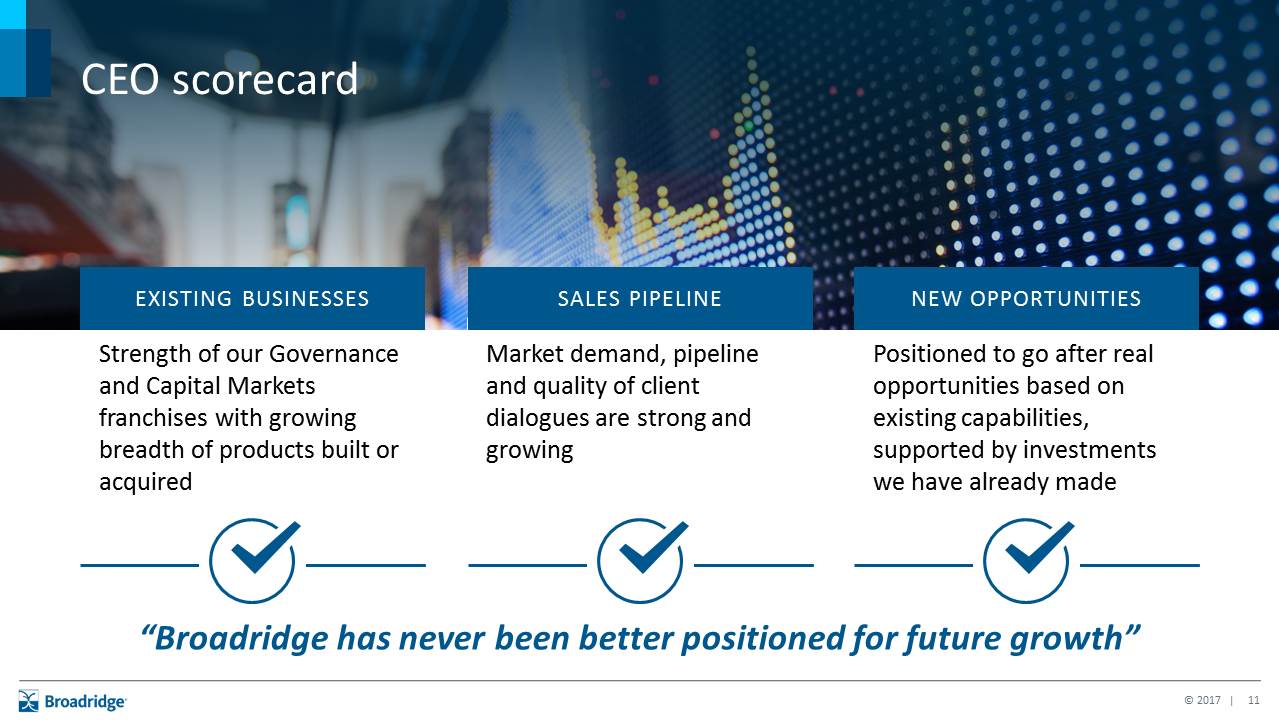
Strength of our Governance and Capital Markets franchises with growing breadth of products built or acquired Existing Businesses Positioned to go after real opportunities based on existing capabilities, supported by investments we have already made New Opportunities Market demand, pipeline and quality of client dialogues are strong and growing Sales Pipeline CEO scorecard “Broadridge has never been better positioned for future growth”
Creating the Next Level of Growth and Return Tim GokeyPresident and Chief Operating Officer
Broadridge has strong and growing global franchises in Governance and Capital Markets with compelling additional opportunity in Wealth Management
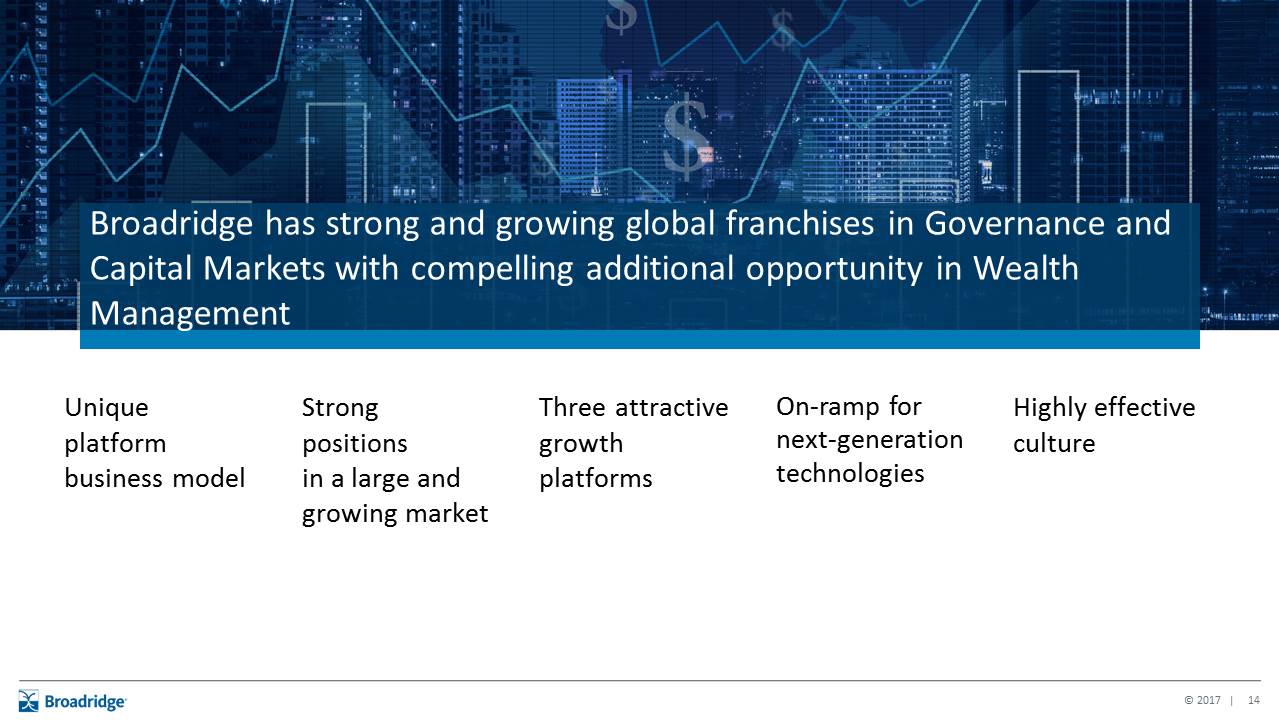
Unique platform business model Strong positions in a large and growing market Three attractive growth platforms On-ramp for next-generation technologies Highly effective culture Broadridge has strong and growing global franchises in Governance and Capital Markets with compelling additional opportunity in Wealth Management

Broadridge platform-based business model creates unique value Network value Deep financial services knowledge Multi-client managed services approach
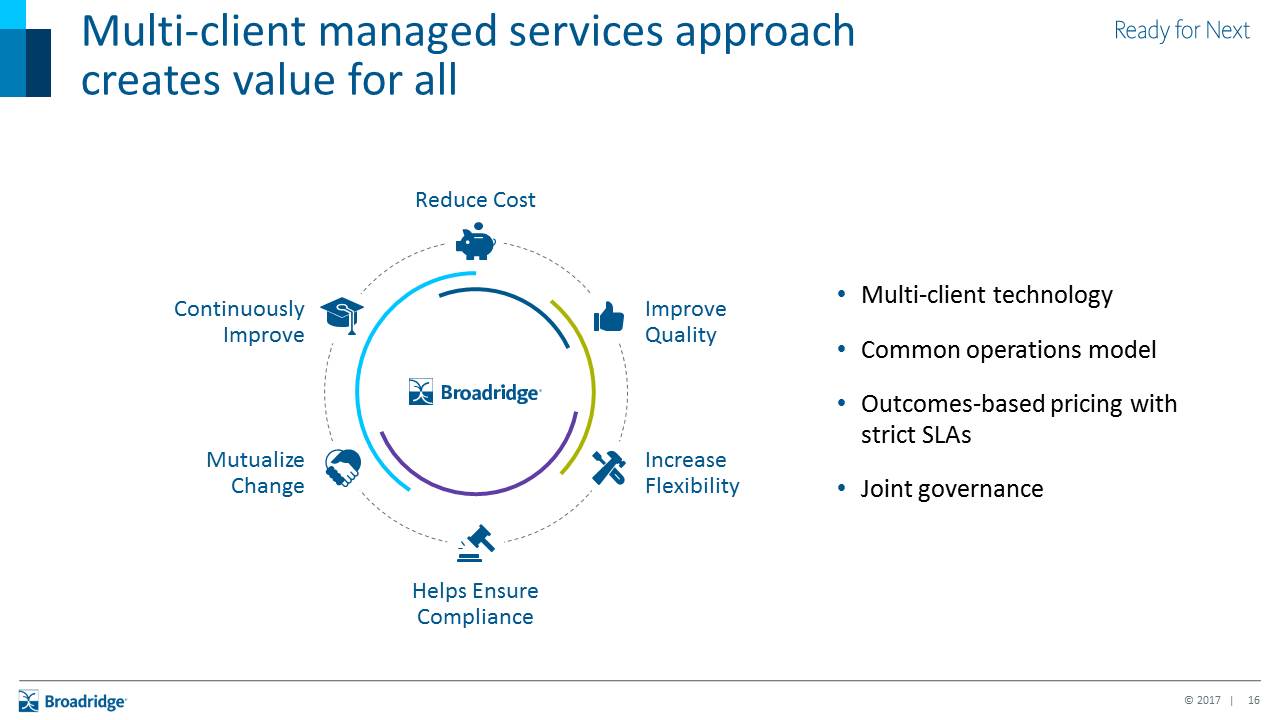
Multi-client managed services approach creates value for all Multi-client technologyCommon operations modelOutcomes-based pricing with strict SLAsJoint governance ImproveQuality IncreaseFlexibility MutualizeChange ContinuouslyImprove Reduce Cost Helps Ensure Compliance
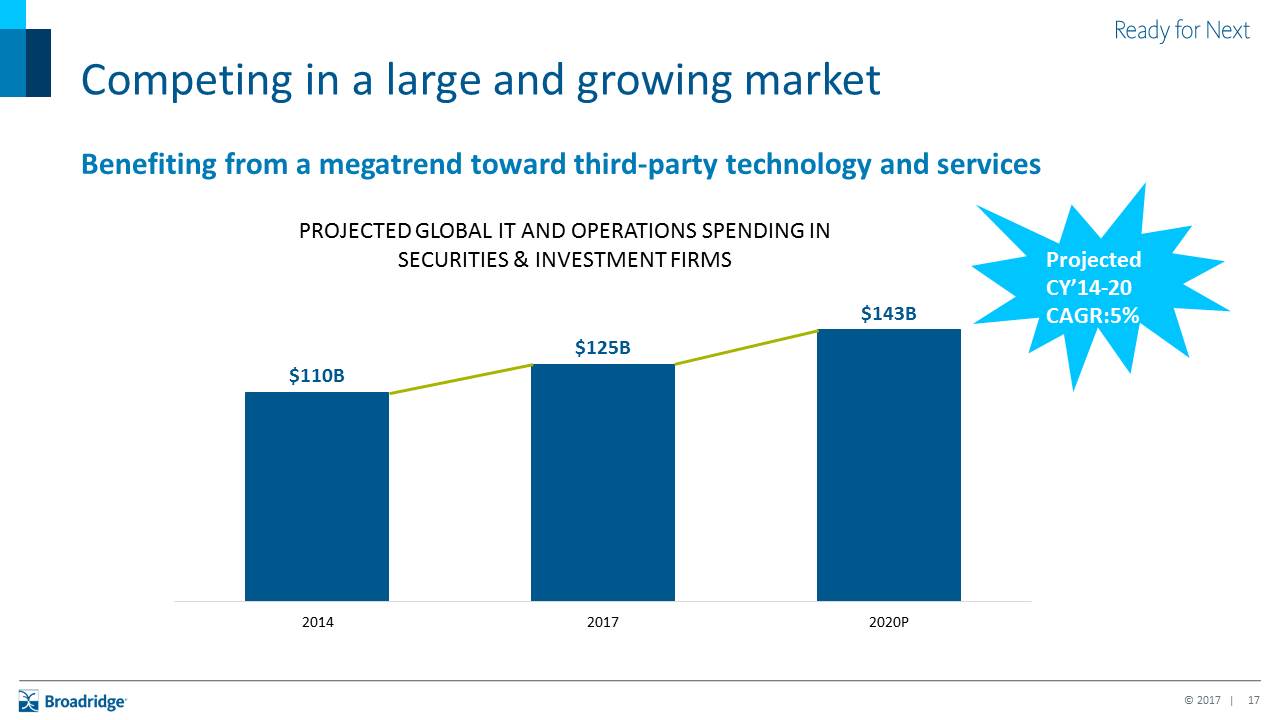
Competing in a large and growing market Benefiting from a megatrend toward third-party technology and services $50B $93B $46B $79B $43B $67B $143B $125B $110B Projected CY’14-20CAGR:5%~
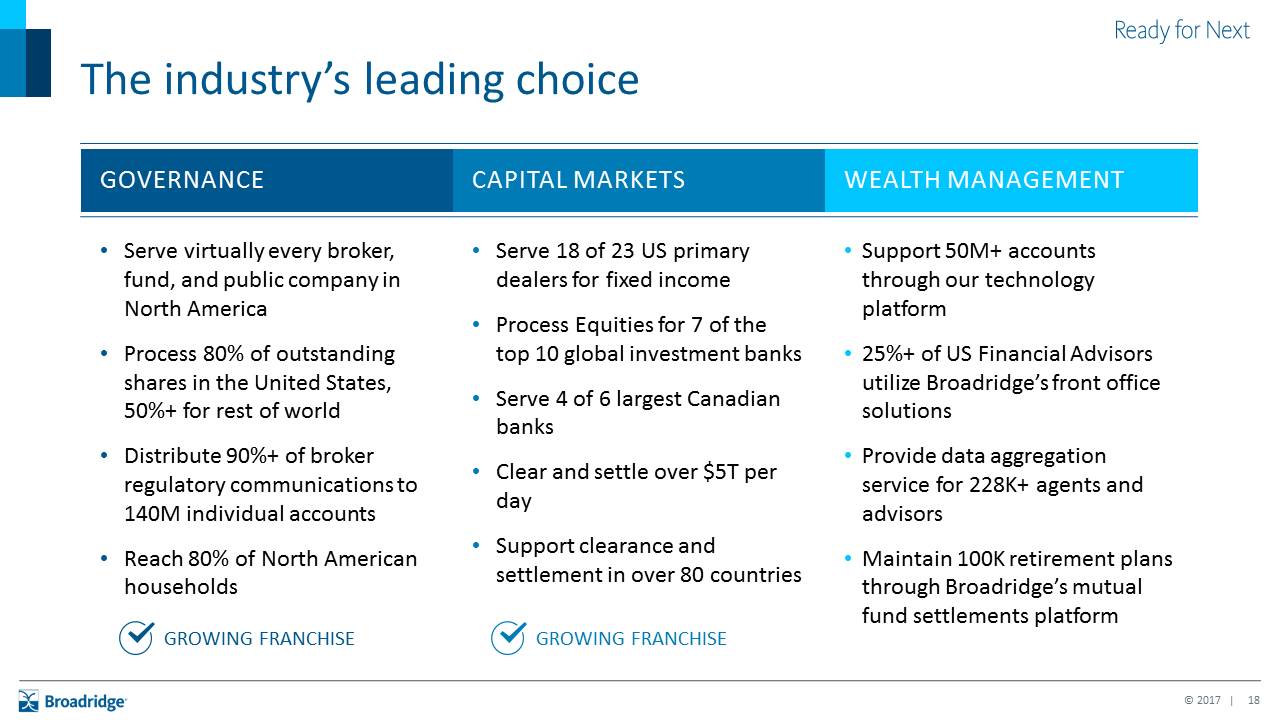
The industry’s leading choice Governance Capital Markets Wealth Management Serve virtually every broker, fund, and public company in North AmericaProcess 80% of outstanding shares in the United States, 50%+ for rest of worldDistribute 90%+ of broker regulatory communications to 140M individual accounts Reach 80% of North American households Serve 18 of 23 US primary dealers for fixed income Process Equities for 7 of the top 10 global investment banksServe 4 of 6 largest Canadian banksClear and settle over $5T per day Support clearance and settlement in over 80 countries Support 50M+ accounts through our technology platform 25%+ of US Financial Advisors utilize Broadridge’s front office solutionsProvide data aggregation service for 228K+ agents and advisorsMaintain 100K retirement plans through Broadridge’s mutual fund settlements platform GROWING FRANCHISE GROWING FRANCHISE

Broadridge’s directly addressable market is $25-40B Large growth opportunity GOVERNANCE & COMMUNICATIONS WEALTH MANAGEMENT CAPITAL MARKETS

Key market trends support long-term growth Mutualization Digitization Data and Analytics Firms continue to search for mutualizationIncreasing demand for global solutionsDriven by new technologyIn the future, driven by network value Rise in preference for digital delivery across multiple channelsSuccesses driven by significantly improved experience Beginning to see increased regulatory acceptance Continuing growth in value of client and market insightsIncreasingly embedded everywhereFuture value to drive artificial intelligence and cognitive solutions
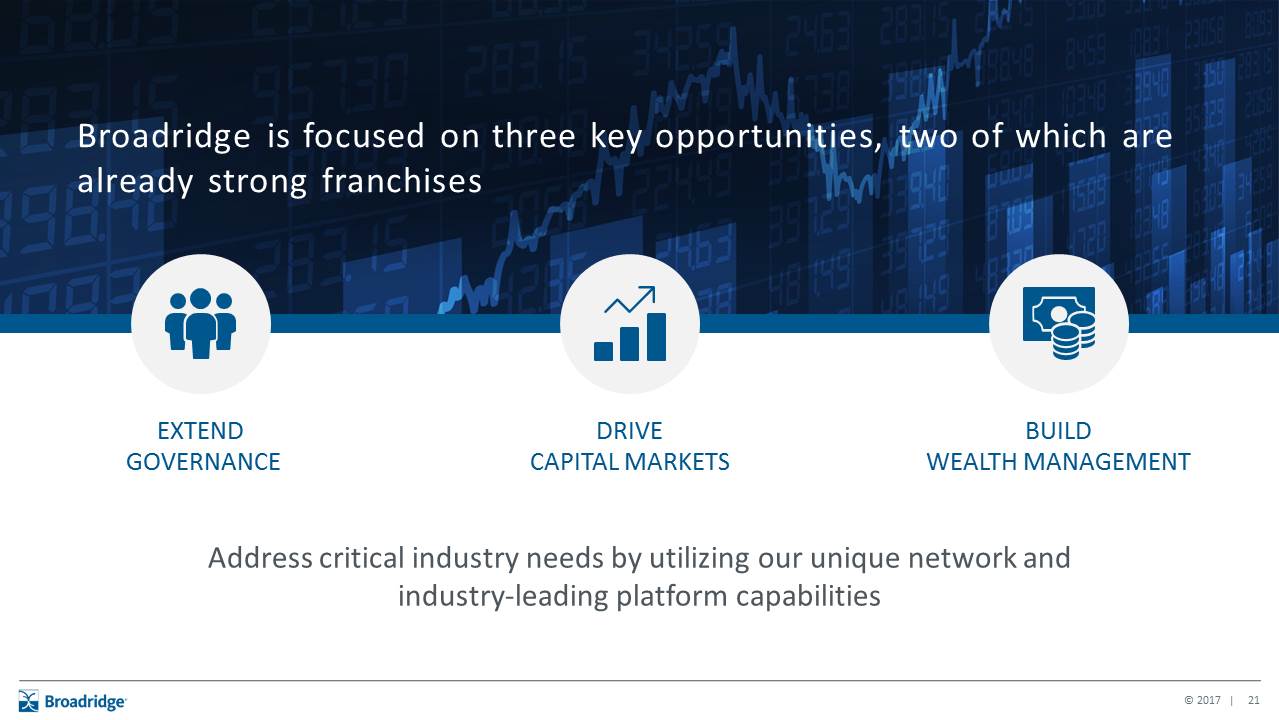
Broadridge is focused on three key opportunities, two of which are already strong franchises Address critical industry needs by utilizing our unique network and industry-leading platform capabilities EXTEND GOVERNANCE DRIVE CAPITAL MARKETS BUILD WEALTH MANAGEMENT

Extend Governance Key OpportunitiesTransform regulatory communicationsDevelop omni-channel communicationsBuild issuer services 140M+RETAIL SHAREHOLDER ACCOUNTS 150,000+INSTITUTIONAL SHAREHOLDERS 24,000+ MUTUAL FUNDS 1,100+ BANKS and BROKER-DEALERS 5,000+CORPORATE ISSUERS

Drive Capital Markets Drive global technology platformExtend with additional solutionsCreate network value Data Fabric with Global Ontology Unified Portal Global Position Manager Global P&L Global Sub-Ledger Managed Services Options Core Components Connectivity Reference Data Netting &Allocation Clearance &Settlement Books &Records Funding/Collateral/Fees AssetServicing Reconciliation Regulatory OperationalRisk Asset Class and Function Coverage Equities Exchange TradedDerivatives Trade & Position Financing Foreign Exchange & Money Markets Fixed Income SOLUTION COMPONENTS
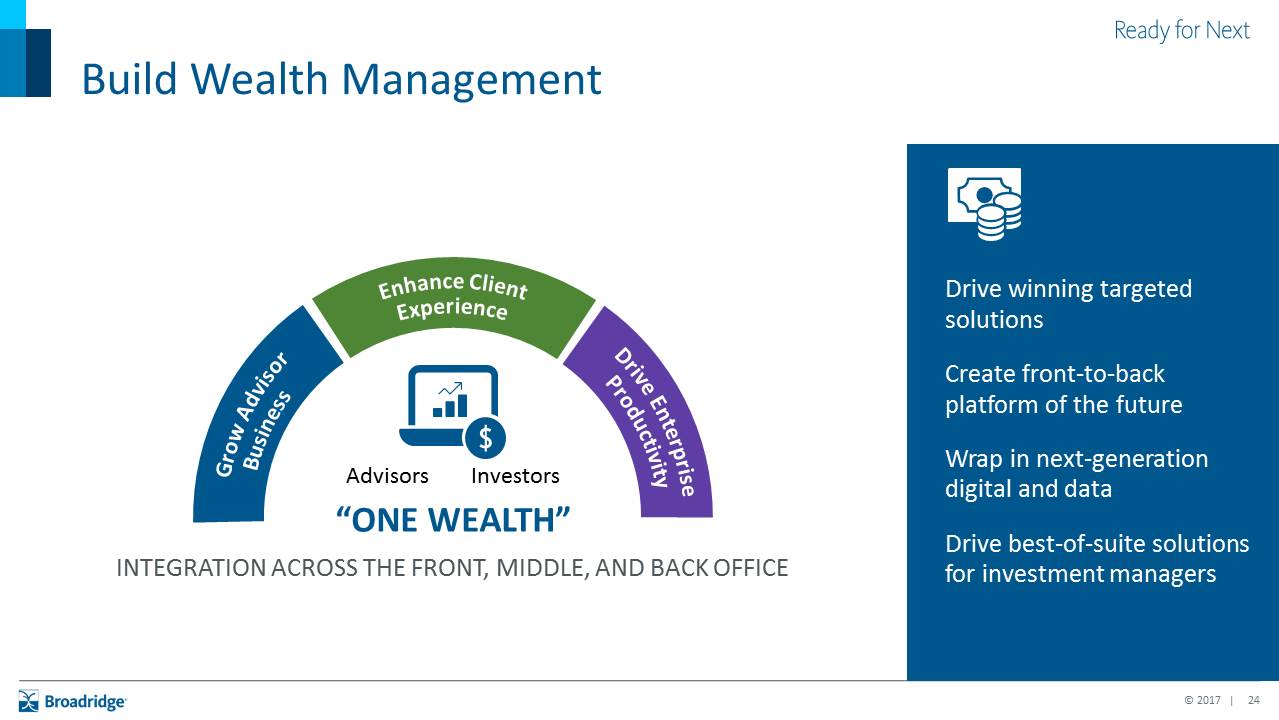
Build Wealth Management Drive winning targeted solutionsCreate front-to-back platform of the futureWrap in next-generation digital and dataDrive best-of-suite solutions for investment managers Grow AdvisorBusiness Enhance ClientExperience Drive EnterpriseProductivity “ONE WEALTH” INTEGRATION ACROSS THE FRONT, MIDDLE, AND BACK OFFICE Advisors Investors
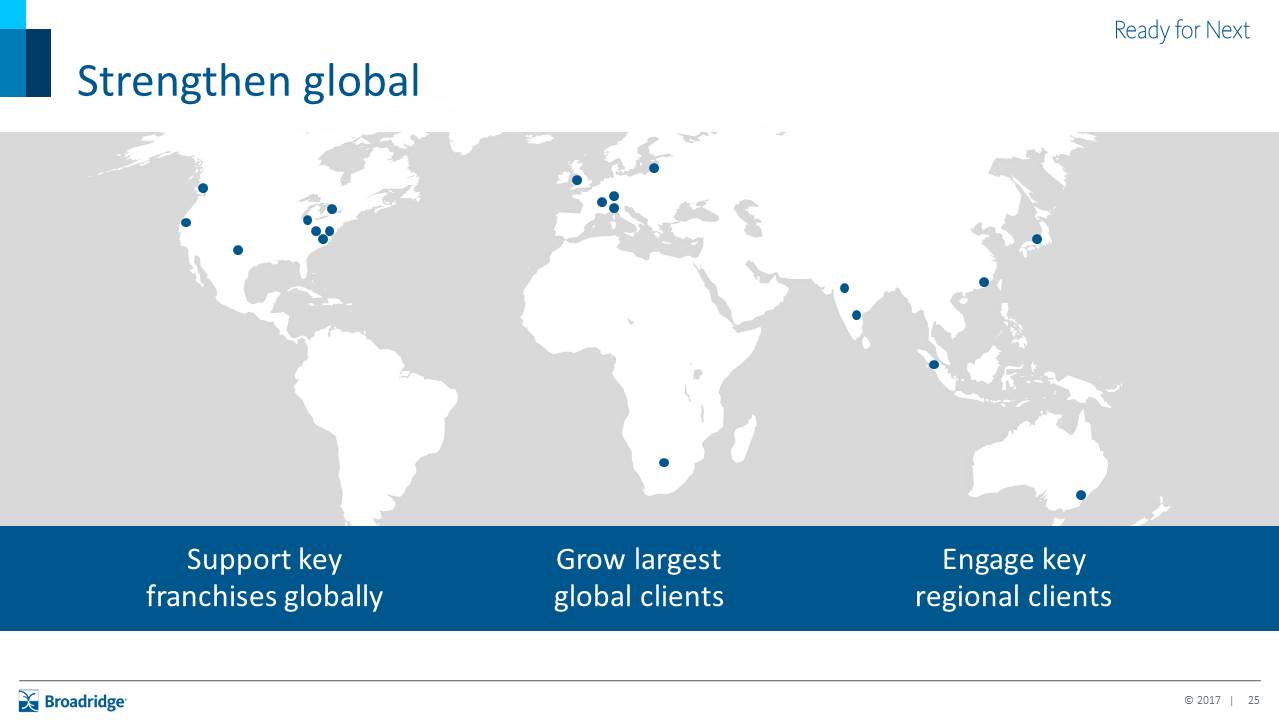
Strengthen global India Hong Kong U.K. Switzerland Germany Czech Republic Japan South Africa Australia Canada United States Russia Singapore Support key franchises globally Grow largestglobal clients Engage key regional clients European sales & support International development & support Swiss datacenter Transaction processing, customer & investor communications Processing support & outsourcing services center Asian sales, IT & support Investor communication center Primary data center, development & support
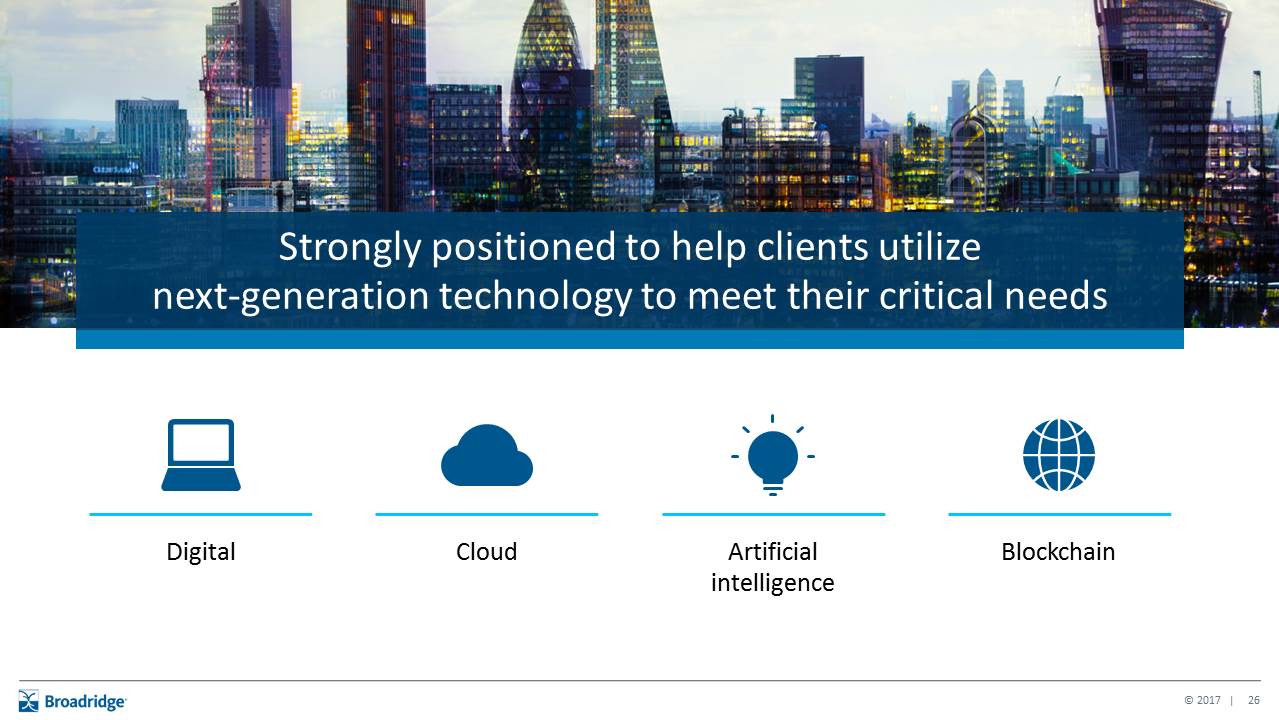
Strongly positioned to help clients utilizenext-generation technology to meet their critical needs Blockchain Artificial intelligence Digital Cloud
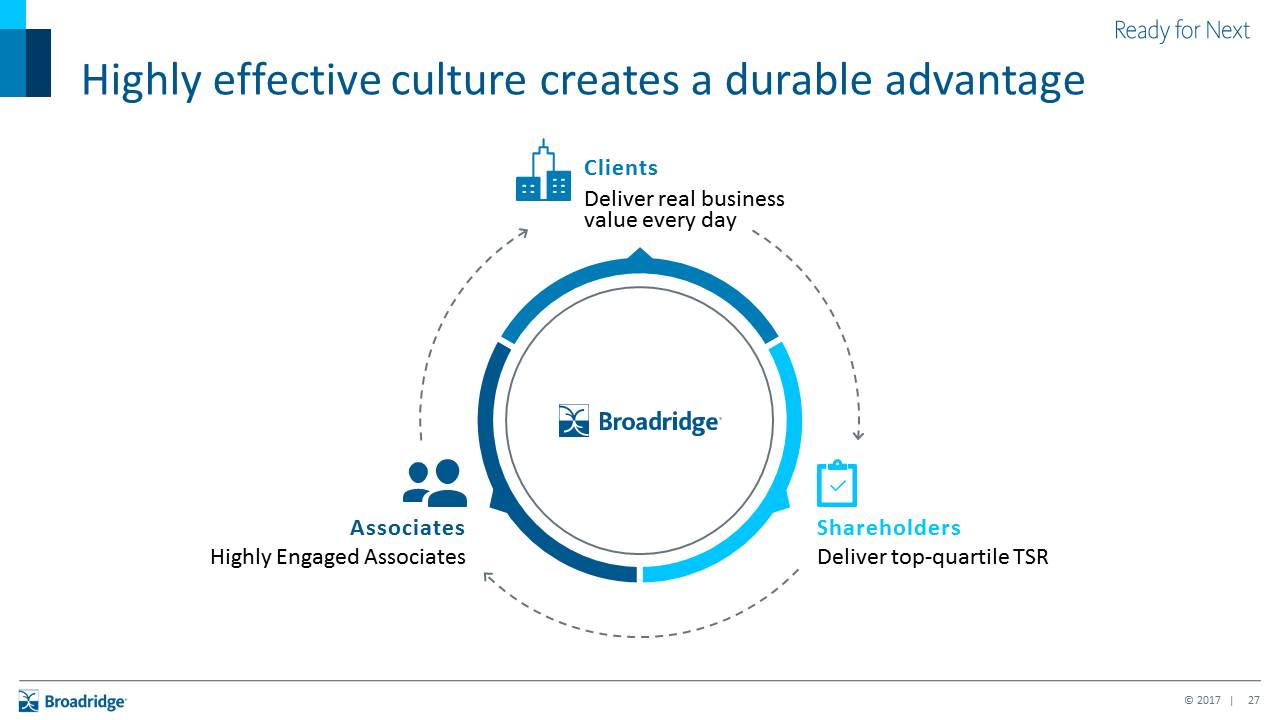
Highly effective culture creates a durable advantage Clients Deliver real business value every day Shareholders Deliver top-quartile TSR Associates Highly Engaged Associates

Why Broadridge? Unique platform business model Strong positions in a large and growing market Three attractive growth platforms On-ramp for next-generation technologies Highly effective culture
Broadridge Governance Franchise Bob SchifellitePresident, Investor Communication Solutions
The Governance franchise is critical to capital markets functioning, has a strong growth trajectory, and can be extended further
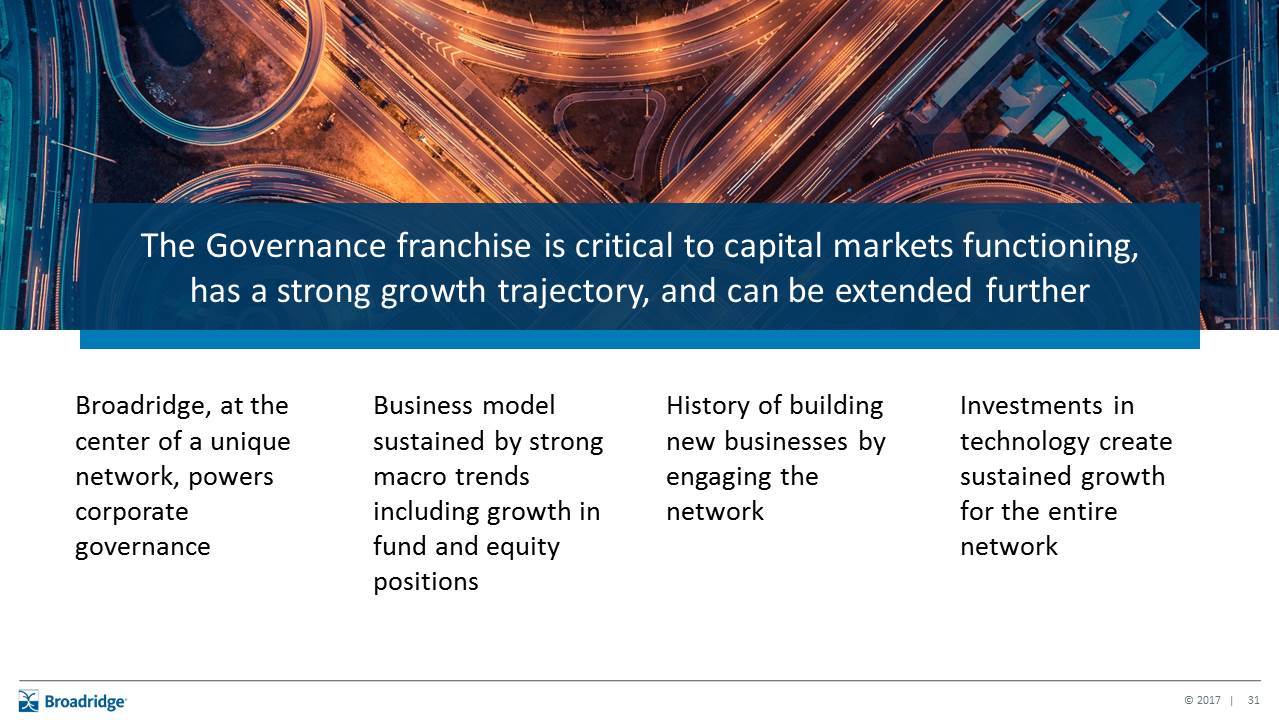
Broadridge, at the center of a unique network, powers corporate governance History of building new businesses by engaging the network Investments in technology create sustained growth for the entire network Business model sustained by strong macro trends including growth in fund and equity positions The Governance franchise is critical to capital markets functioning, has a strong growth trajectory, and can be extended further

MUTUAL FUNDS RETAIL SHAREHOLDERS CORPORATEISSUERS INSTITUTIONAL SHAREHOLDERS 140M+RETAIL SHAREHOLDER ACCOUNTS 150,000+INSTITUTIONAL SHAREHOLDERS 24,000+ MUTUAL FUNDS 5,000+CORPORATEISSUERS BANKS and BROKER-DEALERS 1,100+ BANKS and BROKER-DEALERS Structure of US capital markets creates significant complexity in corporate governance Issuers of Securities Shareholders REGULATORY BODIES

Broadridge, at the center of a unique network, powers corporate governance 140M+RETAIL SHAREHOLDER ACCOUNTS 150,000 +INSTITUTIONAL SHAREHOLDERS 24,000+ MUTUAL FUNDS REGULATORY BODIES Issuers of Securities Shareholders 1,100+ BANKS and BROKER-DEALERS 5,000+CORPORATE ISSUERS
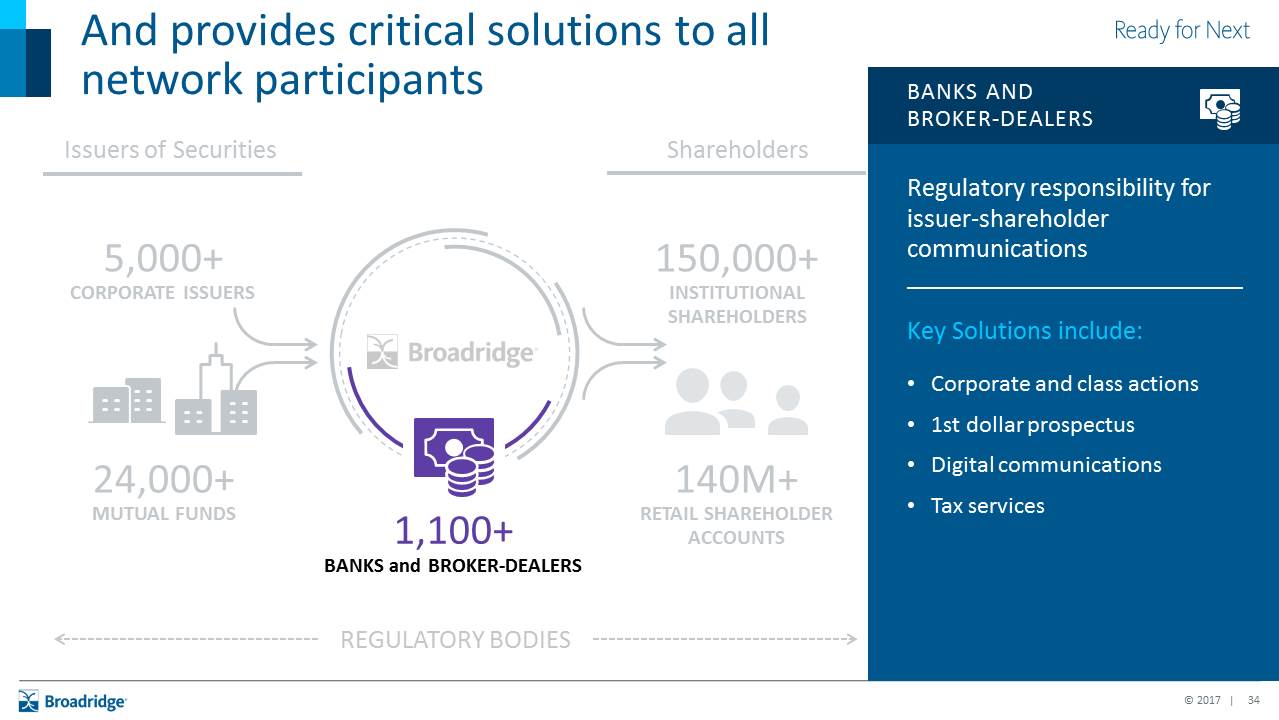
And provides critical solutions to all network participants Regulatory responsibility for issuer-shareholder communications____________________________Key Solutions include:Corporate and class actions1st dollar prospectus Digital communicationsTax services Banks and broker-dealers Issuers of Securities Shareholders 150,000+INSTITUTIONAL SHAREHOLDERS 24,000+ MUTUAL FUNDS 5,000+CORPORATE ISSUERS 140M+RETAIL SHAREHOLDER ACCOUNTS REGULATORY BODIES 1,100+ BANKS and BROKER-DEALERS
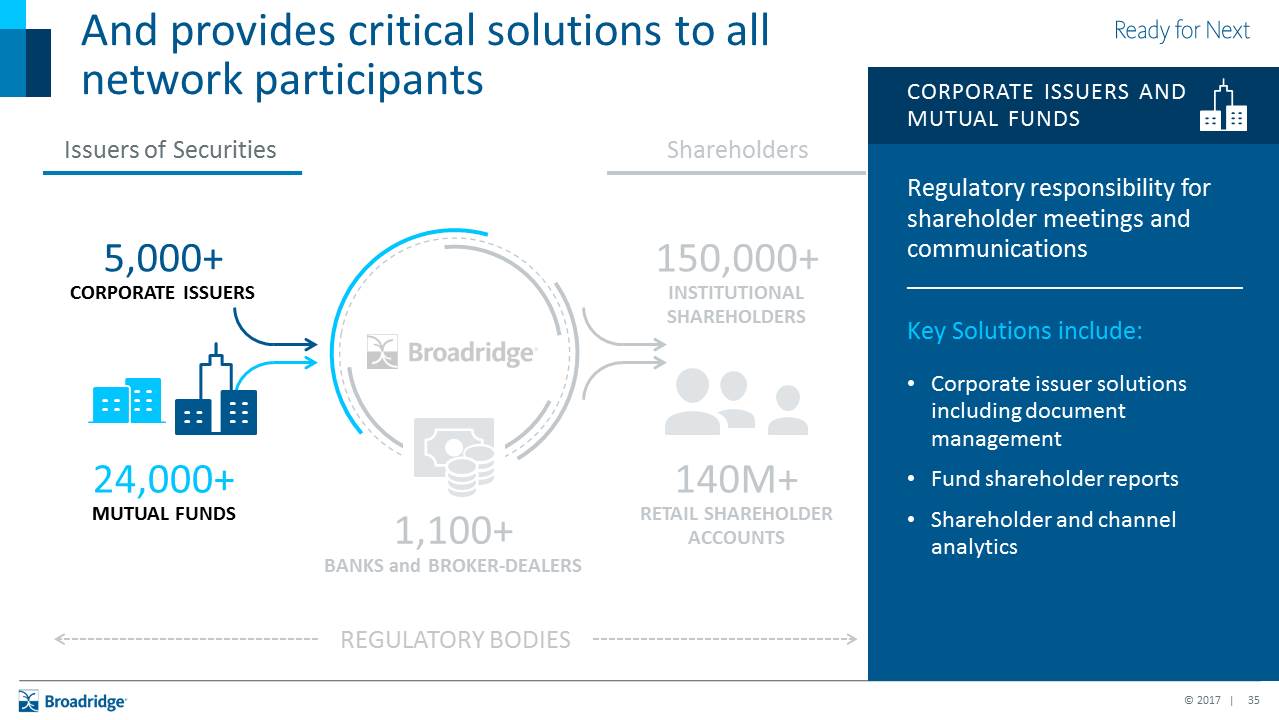
5,000+CORPORATE ISSUERS Regulatory responsibility for shareholder meetings and communications____________________________Key Solutions include:Corporate issuer solutions including document managementFund shareholder reportsShareholder and channel analytics CORPORATE ISSUERS ANDMUTUAL FUNDS Issuers of Securities Shareholders 140M+RETAIL SHAREHOLDER ACCOUNTS REGULATORY BODIES 150,000+INSTITUTIONAL SHAREHOLDERS And provides critical solutions to all network participants 1,100+ BANKS and BROKER-DEALERS 24,000+ MUTUAL FUNDS
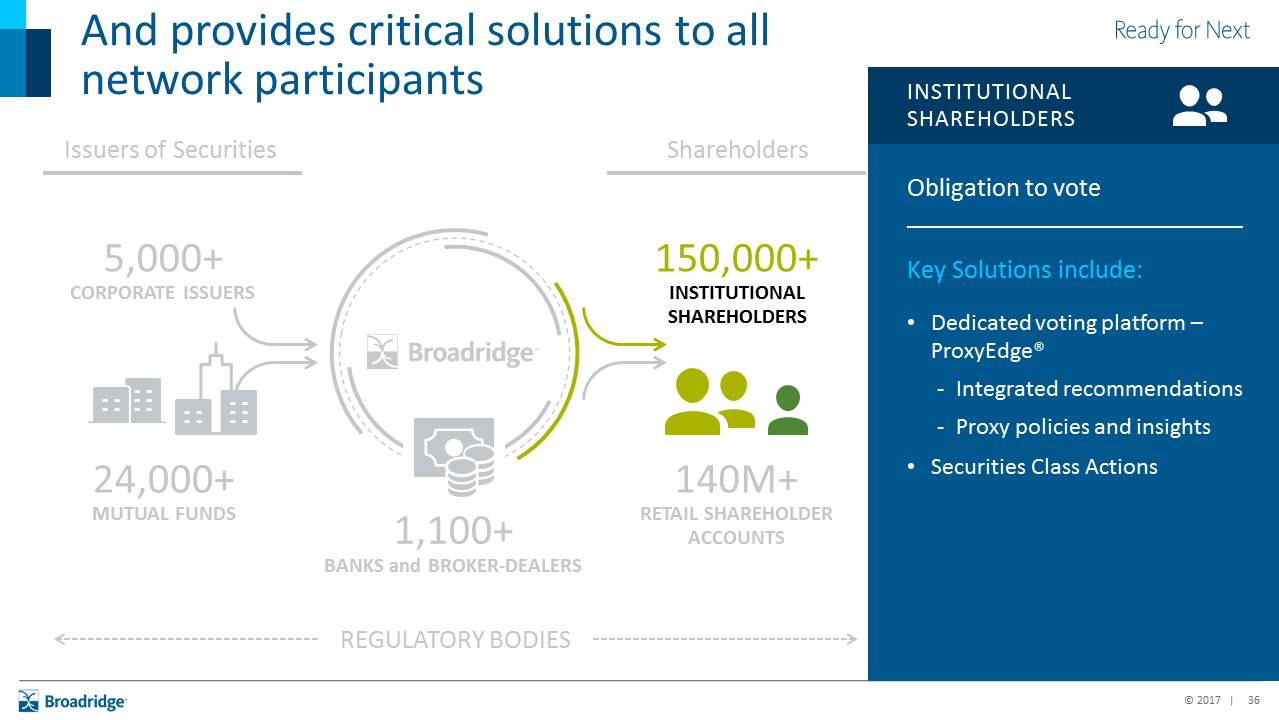
Institutional SHAREHOLDERS Issuers of Securities Shareholders 150,000+INSTITUTIONAL SHAREHOLDERS 1,100+ BANKS and BROKER-DEALERS 140M+RETAIL SHAREHOLDER ACCOUNTS REGULATORY BODIES 24,000+ MUTUAL FUNDS 5,000+CORPORATE ISSUERS And provides critical solutions to all network participants Obligation to vote____________________________Key Solutions include:Dedicated voting platform –ProxyEdge®Integrated recommendationsProxy policies and insightsSecurities Class Actions

Right to receive shareholder communications and participate in governance___________________________Key Solutions include:Retail shareholder data solutionsRetail engagement solutions RETAIL SHAREHOLDERS Issuers of Securities Shareholders 1,100+ BANKS and BROKER-DEALERS REGULATORY BODIES 150,000+INSTITUTIONAL SHAREHOLDERS 140M+RETAIL SHAREHOLDER ACCOUNTS 24,000+ MUTUAL FUNDS 5,000+CORPORATE ISSUERS And provides critical solutions to all network participants
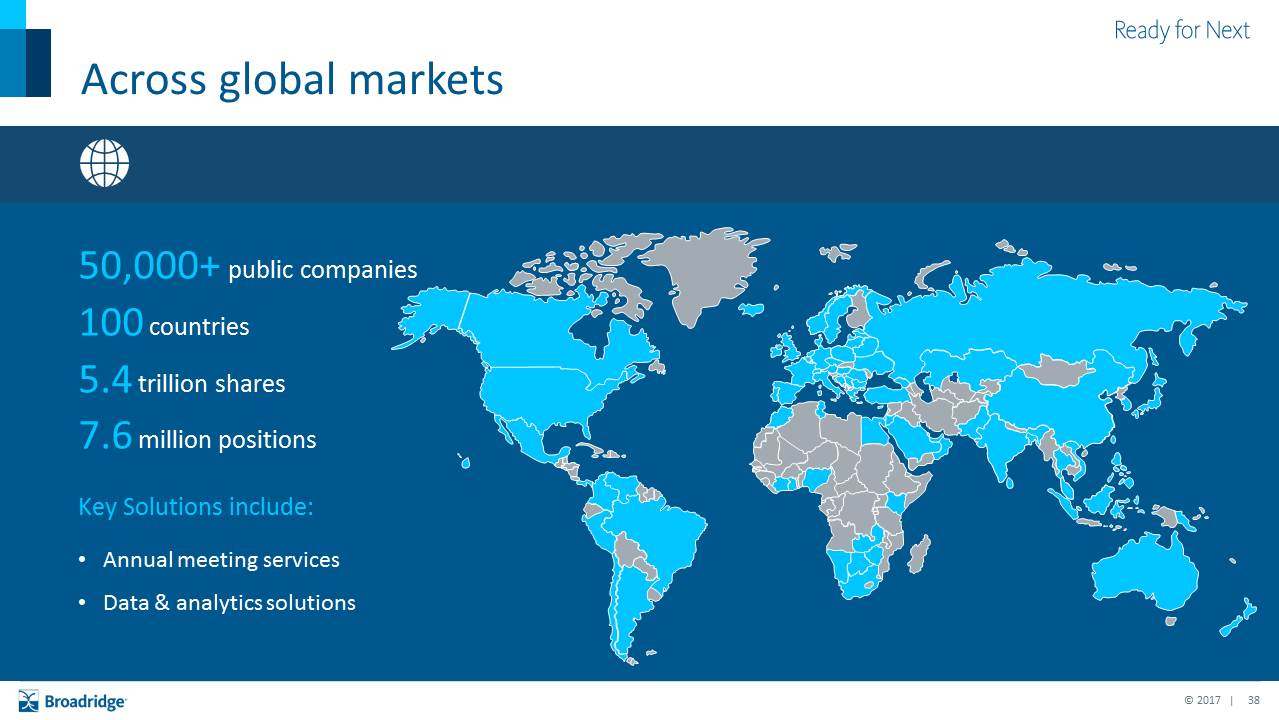
Across global markets 50,000+ public companies100 countries 5.4 trillion shares 7.6 million positionsKey Solutions include:Annual meeting servicesData & analytics solutions

Case study: Fortune 500 Annual Meeting process KICK OFF MEETING PROCURE DATA DISTRIBUTE COMMUNICATIONS RECEIVE VOTES REPORT VOTE ISSUERS BROADRIDGE BROKER- DEALERS Announce record and meeting dates Decide N&A vs full package and postal tiers Receive final vote tally Create agenda and code proposalsCollect shareholder positions from ALL brokers Run rules engine against positions to get investor distribution preferences Execute bank & broker specific processing rulesConfirm material requirement with issuersReconcile broker records with DTCC Print voting form with unique control number and distribute material Aggregate managed accounts per broker rulesDistribute via paper (full set or N&A), ProxyEdge, or digital Receive votes; including from vote agencyReceive votes from brokers based on customer instructionProcess shareholder voting at meetingIndependent review of all votes for >50K shares Reconcile erroneous votes with brokers Issue initial vote 10-15 days before meetingApply broker voteIssue supplemental vote tally daily pre-meetingProvide up to 3 vote updates on meeting date Share records with Broadridge Advisors vote proxy for managed accounts Send material and proposal language
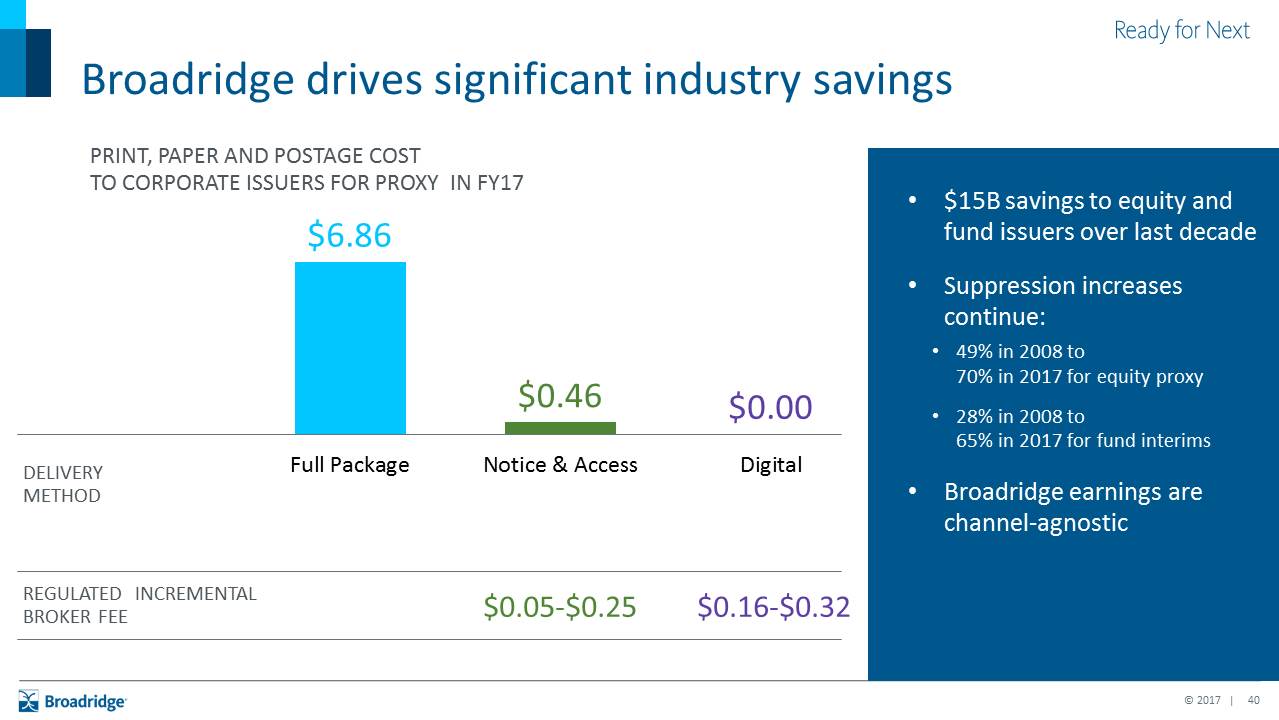
Broadridge drives significant industry savings PRINT, PAPER AND POSTAGE COST TO CORPORATE ISSUERS FOR PROXY IN FY17 DELIVERY METHOD $0.05-$0.25 $0.16-$0.32 REGULATED INCREMENTAL BROKER FEE $15B savings to equity and fund issuers over last decadeSuppression increases continue:49% in 2008 to 70% in 2017 for equity proxy28% in 2008 to 65% in 2017 for fund interimsBroadridge earnings are channel-agnostic
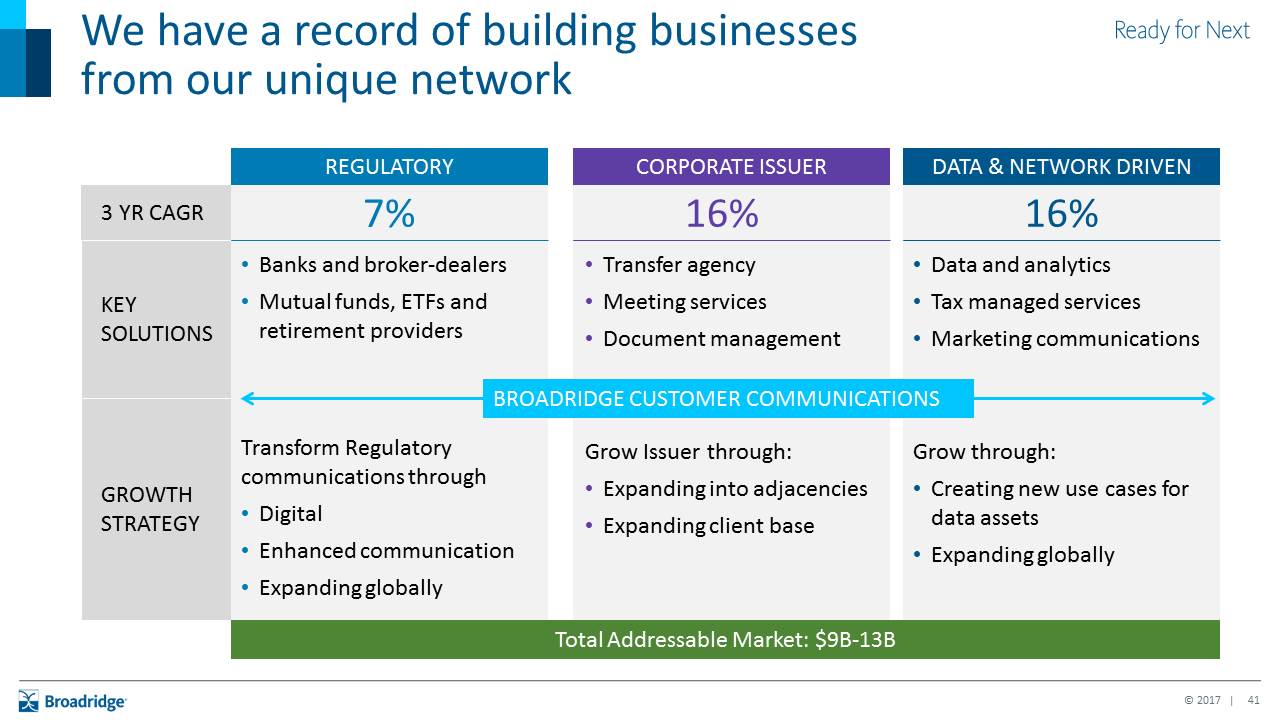
We have a record of building businesses from our unique network REGULATORY CORPORATE ISSUER DATA & NETWORK DRIVEN 3 YR CAGR 7% 16% 16% KEY SOLUTIONS Banks and broker-dealersMutual funds, ETFs and retirement providers Transfer agencyMeeting servicesDocument management Data and analyticsTax managed servicesMarketing communications Transform Regulatory communications throughDigitalEnhanced communicationExpanding globally Grow Issuer through:Expanding into adjacencies Expanding client base Grow through: Creating new use cases for data assetsExpanding globally GROWTH STRATEGY BROADRIDGE CUSTOMER COMMUNICATIONS Total Addressable Market: $9B-13B
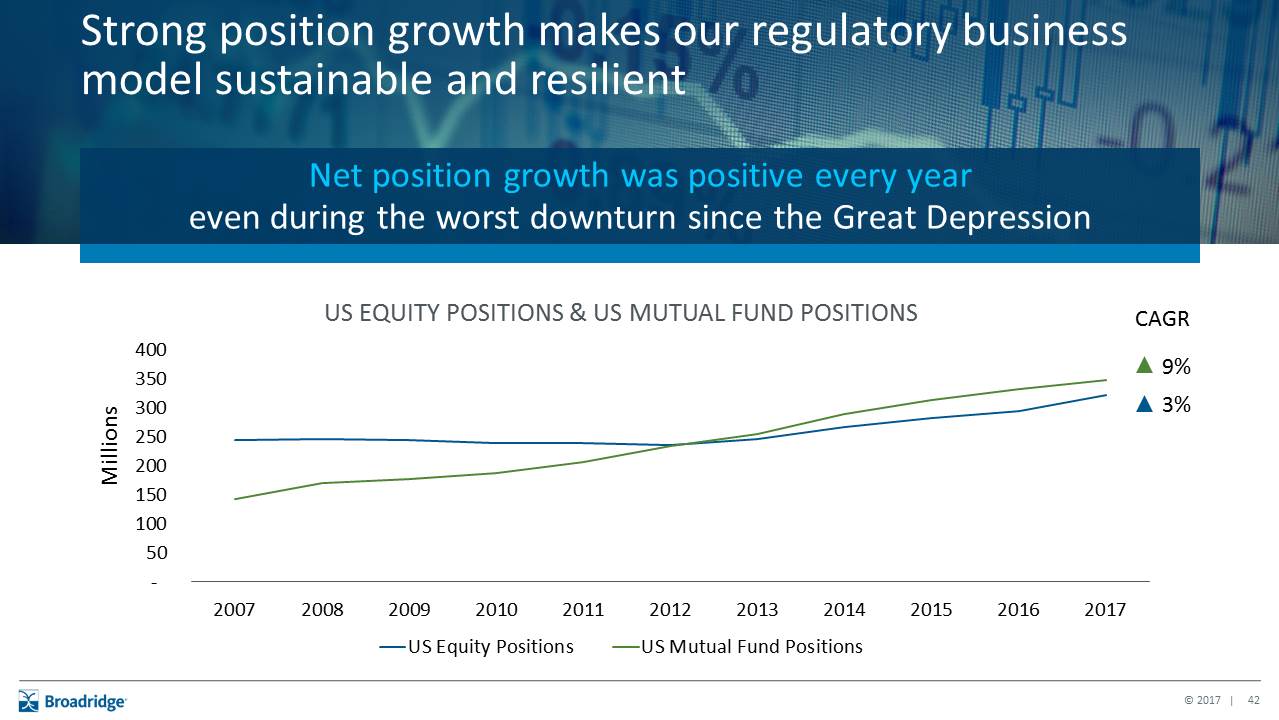
Net position growth was positive every year even during the worst downturn since the Great Depression Strong position growth makes our regulatory business model sustainable and resilient CAGR 9% 3%
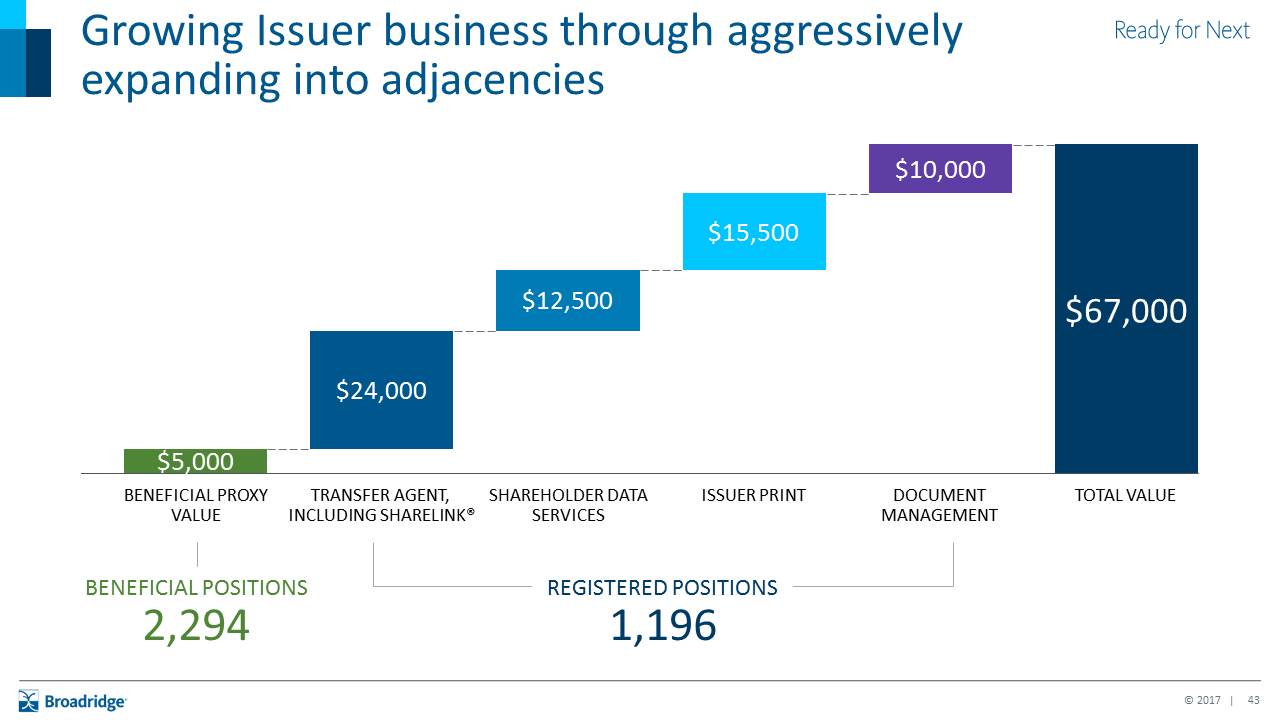
Growing Issuer business through aggressively expanding into adjacencies DOCUMENT MANAGEMENT ISSUER PRINT BENEFICIAL PROXY VALUE SHAREHOLDER DATA SERVICES TRANSFER AGENT, INCLUDING SHARELINK® TOTAL VALUE Beneficial positions 2,294 Registered positions 1,196

We have utilized the network to build a strong portfolio of data solutions FY10-FY14 Wealth Insights (WINS)Shareholder Data Services (SDS) US Market IntelligenceGlobal Dividends Reclaim Opportunity HunterGlobal Market IntelligenceInvestor Analytics Sales and Market AnalyticsDistribution Insights and ResearchRegulatory Benchmarking FY15-FY17 FY18… PRODUCTS LAUNCHED

OUR COMMITMENT Invest in technology-driven solutions to create sustained growth and scaled benefits for the entire network Data Blockchain Digital
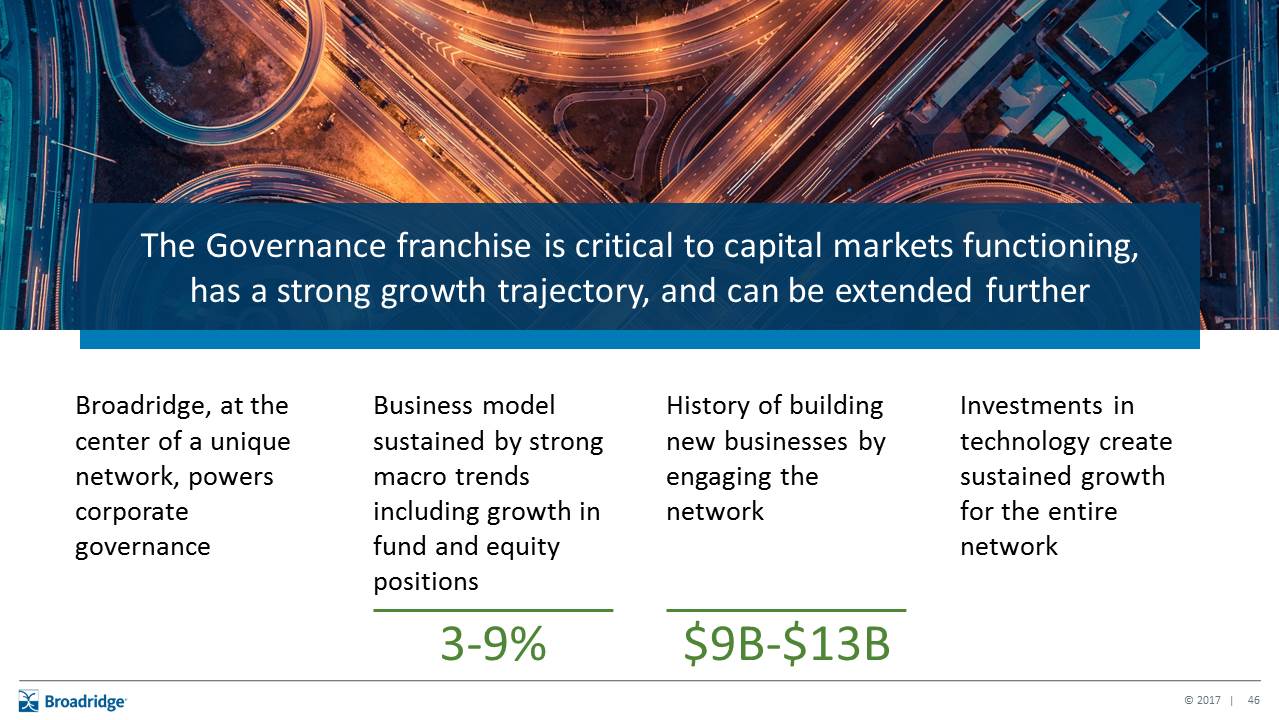
3-9% $9B-$13B Broadridge, at the center of a unique network, powers corporate governance History of building new businesses by engaging the network Investments in technology create sustained growth for the entire network Business model sustained by strong macro trends including growth in fund and equity positions The Governance franchise is critical to capital markets functioning, has a strong growth trajectory, and can be extended further
Broadridge Capital Markets Franchise Charlie MarchesaniPresident, Global Technology and Operations

As a leading global provider of capital markets technology infrastructure, Broadridge is driving simplification and transformation globally for our clients and the industry
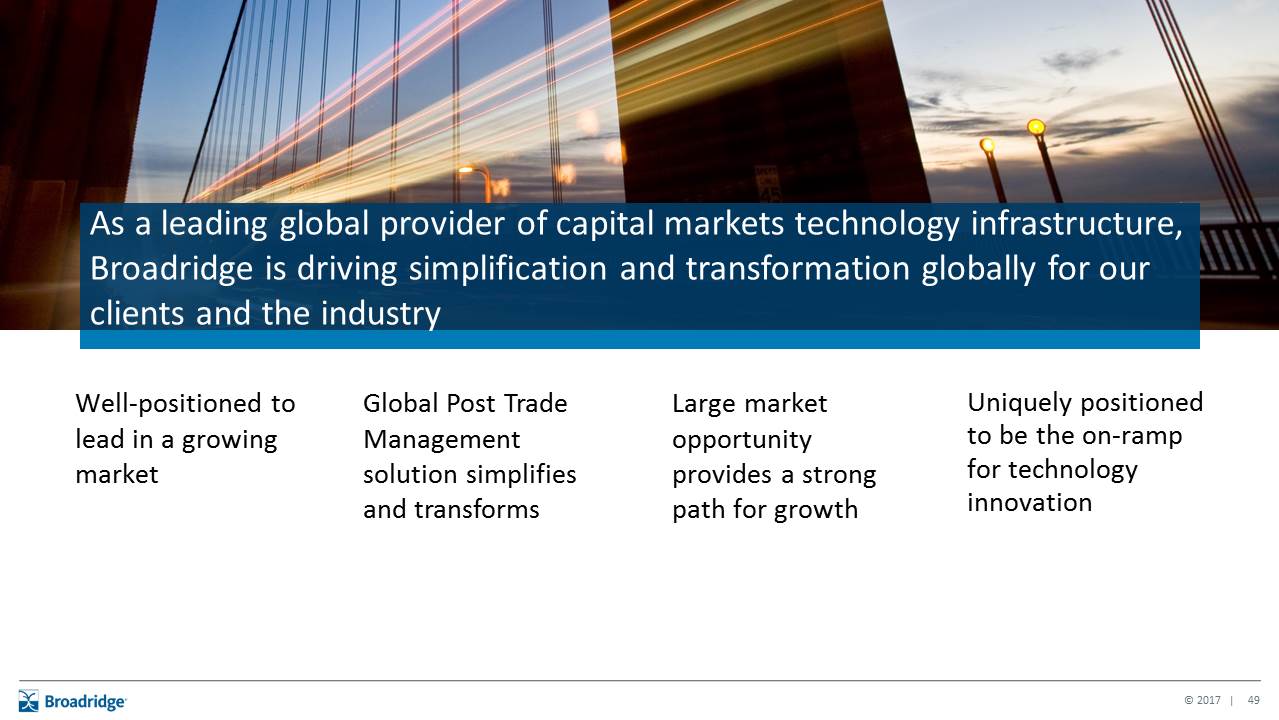
Well-positioned to lead in a growing market Large market opportunity provides a strong path for growth Uniquely positioned to be the on-ramp for technology innovation Global Post Trade Management solution simplifies and transforms As a leading global provider of capital markets technology infrastructure, Broadridge is driving simplification and transformation globally for our clients and the industry
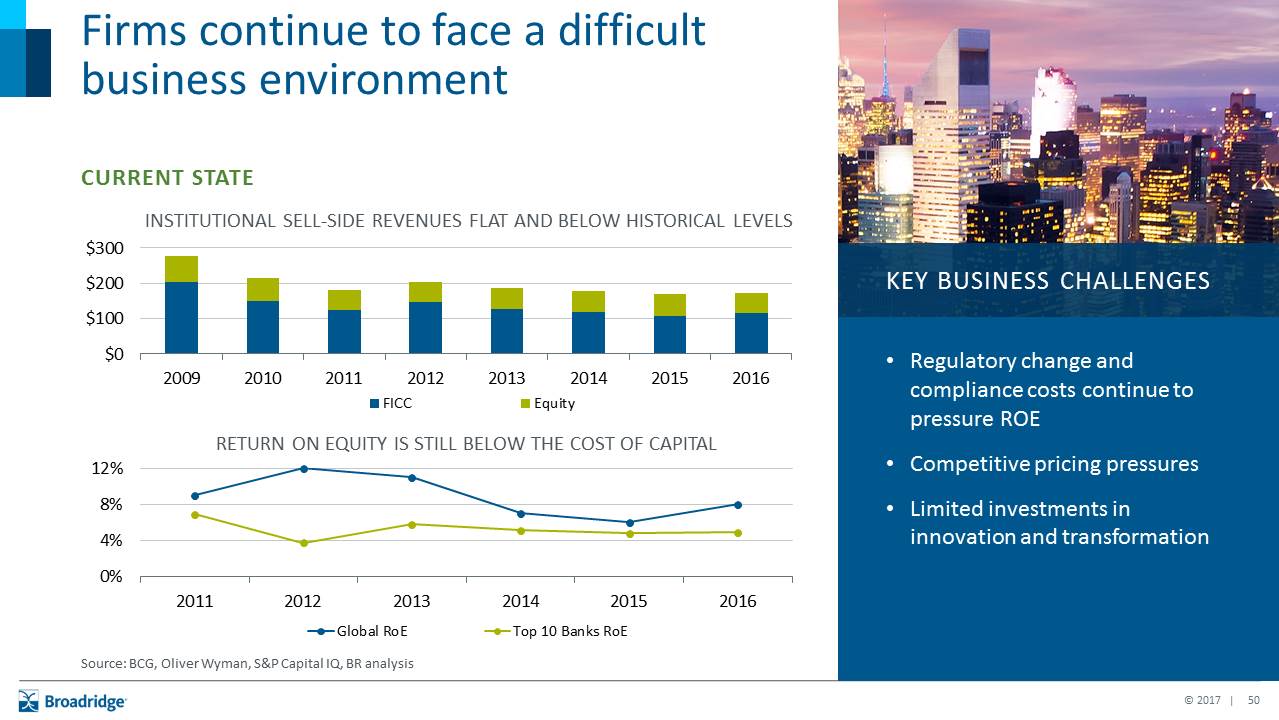
Firms continue to face a difficult business environment CURRENT STATE KEY BUSINESS CHALLENGES Regulatory change and compliance costs continue to pressure ROECompetitive pricing pressuresLimited investments in innovation and transformation INSTITUTIONAL SELL-SIDE REVENUES FLAT AND BELOW HISTORICAL LEVELS RETURN ON EQUITY IS STILL BELOW THE COST OF CAPITAL Source: BCG, Oliver Wyman, S&P Capital IQ, BR analysis

CAPITAL MARKETS PRIORITIES Focus on simplification and transformation to realize cost efficiency/ROE improvements Evolve global operating models to increase transparency, control and risk mitigationAccelerate adoption of new technologies to lower cost structures and provide greater scale and agility Mutualize operating functions by leveraging industry partners/utilities Driving significant market need to mutualize
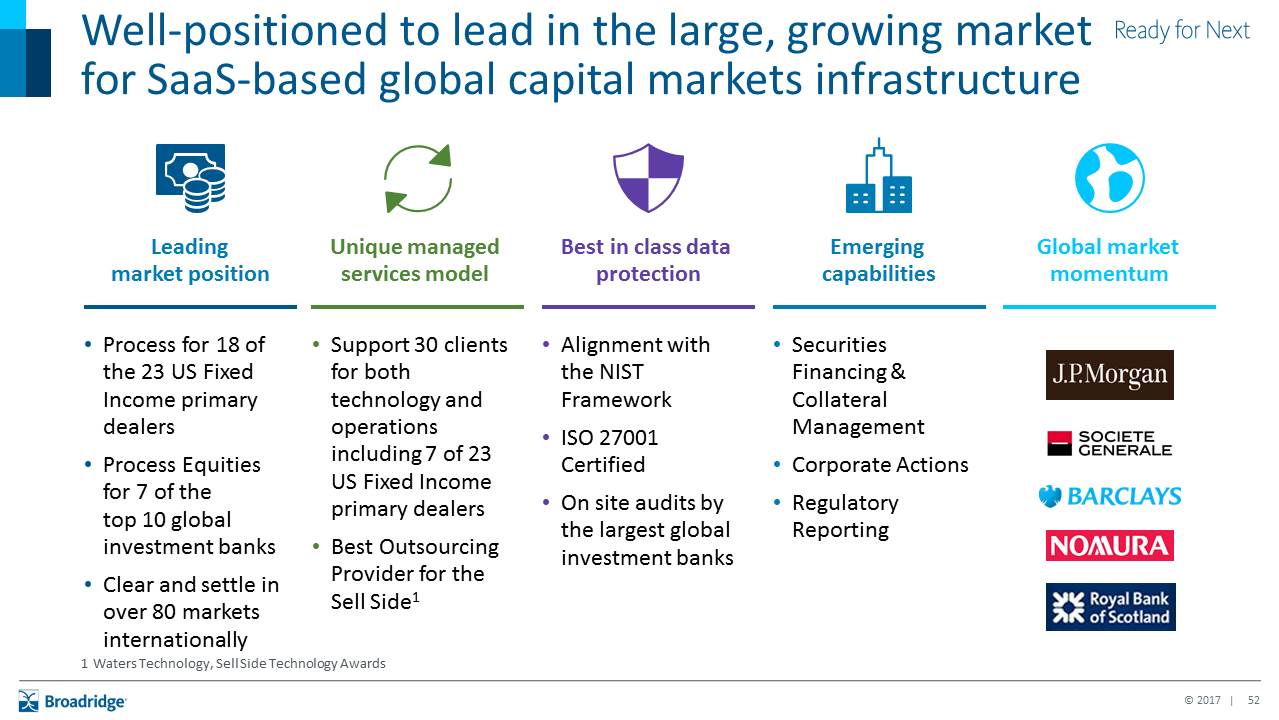
Process for 18 of the 23 US Fixed Income primary dealersProcess Equities for 7 of the top 10 global investment banksClear and settle in over 80 markets internationally Leading market position Well-positioned to lead in the large, growing market for SaaS-based global capital markets infrastructure Support 30 clients for both technology and operations including 7 of 23 US Fixed Income primary dealersBest Outsourcing Provider for the Sell Side1 Unique managed services model Alignment with the NIST FrameworkISO 27001 CertifiedOn site audits by the largest global investment banks Best in class data protection Securities Financing & Collateral Management Corporate ActionsRegulatory Reporting Emerging capabilities Global market momentum 1 Waters Technology, Sell Side Technology Awards

Solution Components SOLUTION COMPONENTS We have invested to capitalize on this global opportunity Data Fabric with Global Ontology Unified Portal Global P&L Global Sub-Ledger Managed Services Options Asset Class and Function Coverage Core Components Connectivity Reference Data Netting &Allocation Clearance &Settlement Books &Records Funding/Collateral/Fees AssetServicing Reconciliation Regulatory OperationalRisk Equities Exchange TradedDerivatives Trade & Position Financing Foreign Exchange & Money Markets Fixed Income GLOBAL POST TRADE MANAGEMENT (GPTM) Providing Our Clients With a Flexible Componentized Platform for Growth Global Position Manager
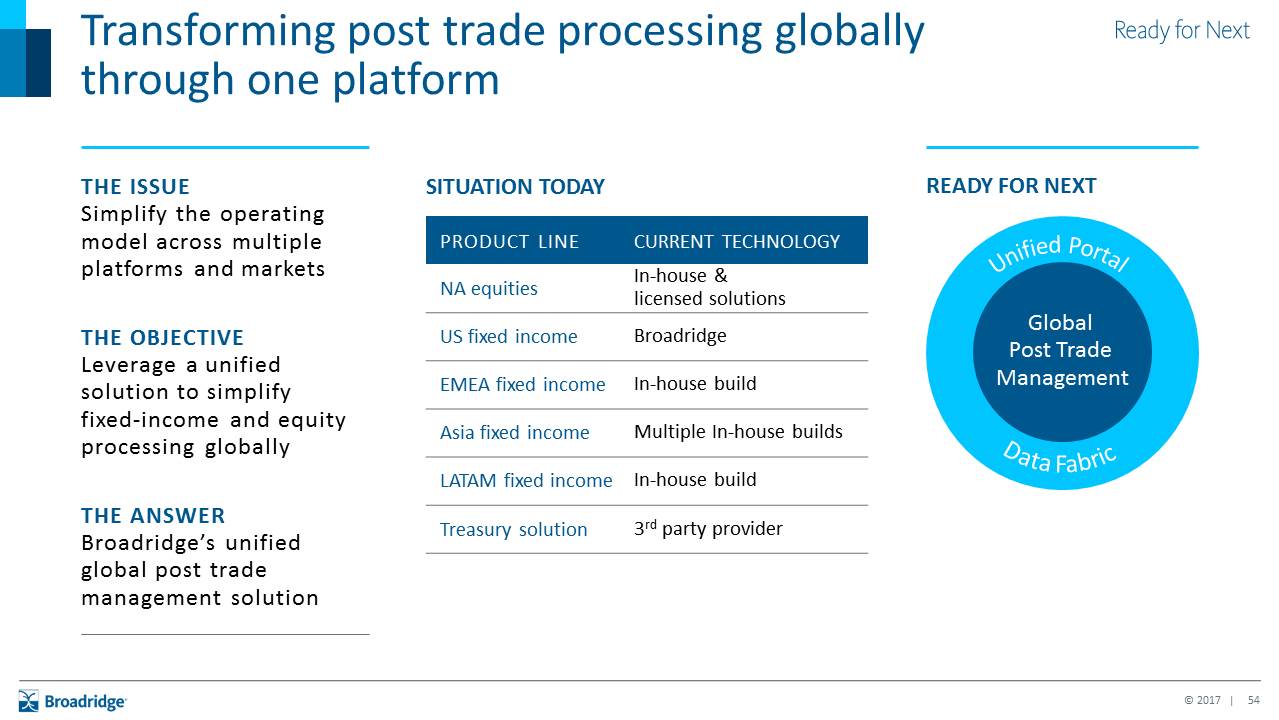
Unified Portal Data Fabric Global Post Trade Management SITUATION TODAY PRODUCT LINE CURRENT TECHNOLOGY NA equities In-house & licensed solutions US fixed income Broadridge EMEA fixed income In-house build Asia fixed income Multiple In-house builds LATAM fixed income In-house build Treasury solution 3rd party provider Transforming post trade processing globally through one platform THE ISSUESimplify the operatingmodel across multipleplatforms and markets THE OBJECTIVE Leverage a unifiedsolution to simplifyfixed-income and equityprocessing globallyTHE ANSWERBroadridge’s unified global post trade management solution READY FOR NEXT

Extending assetclass coverageExtending beyond our core capabilities Regulatory reportingNatural extension of our post trade processing capabilities Product extensionsExpanding our post trade footprint to global enterprise solutions Significant opportunities to grow business through expansion into natural adjacencies
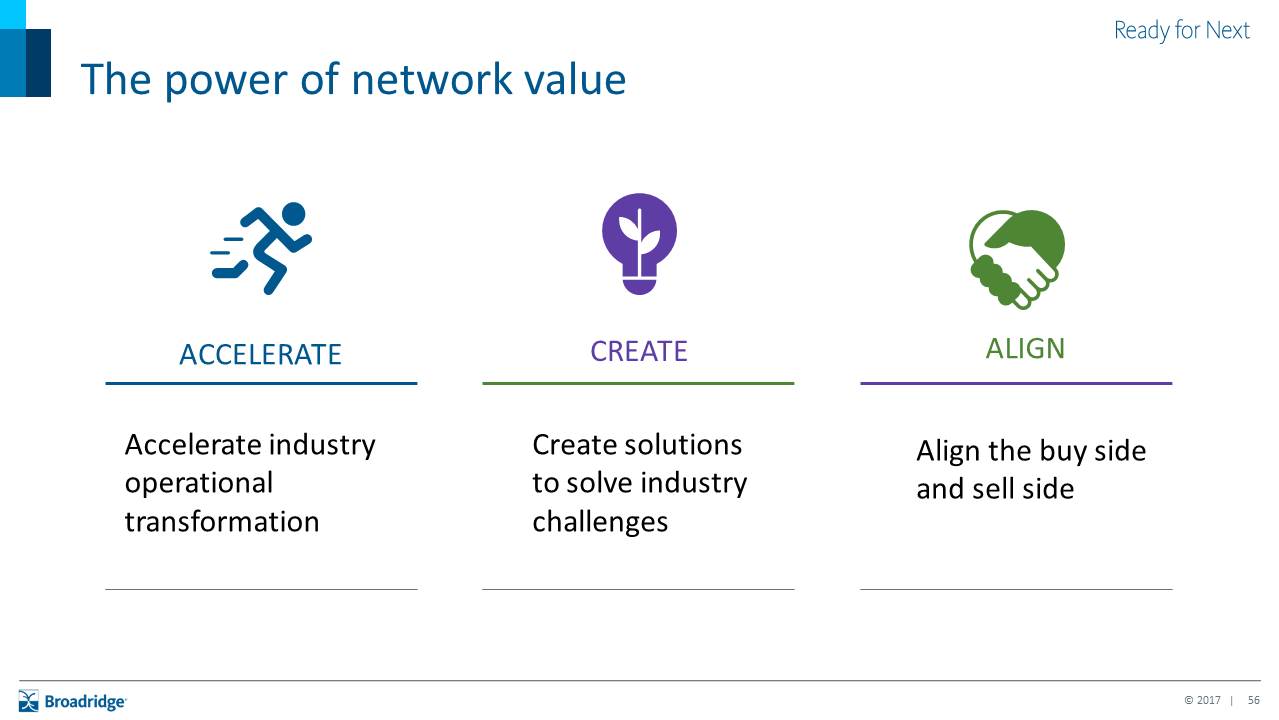
The power of network value Accelerate industryoperational transformation ACCELERATE Align the buy side and sell side ALIGN Create solutions to solve industry challenges CREATE

Uniquely positioned to provide the on ramp to advanced technology and innovation opportunities globally Be an innovation leader by partnering on tangible operational use cases BLOCKCHAIN Lead the industry in migration to Cloud CLOUD COMPUTING Mutualize investments to drive the next generation of operational scale ARTIFICIAL INTELLIGENCE
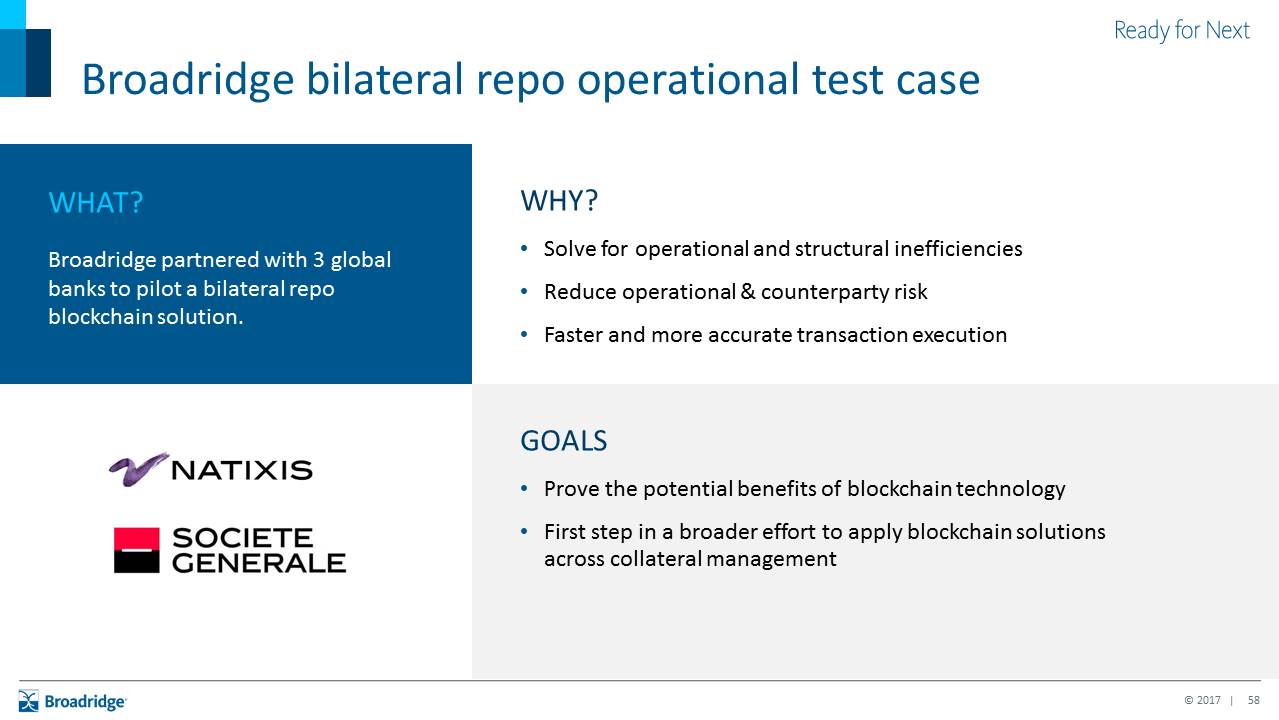
GOALSProve the potential benefits of blockchain technology First step in a broader effort to apply blockchain solutions across collateral management WHY?Solve for operational and structural inefficiencies Reduce operational & counterparty riskFaster and more accurate transaction execution WHAT?Broadridge partnered with 3 global banks to pilot a bilateral repo blockchain solution. Broadridge bilateral repo operational test case
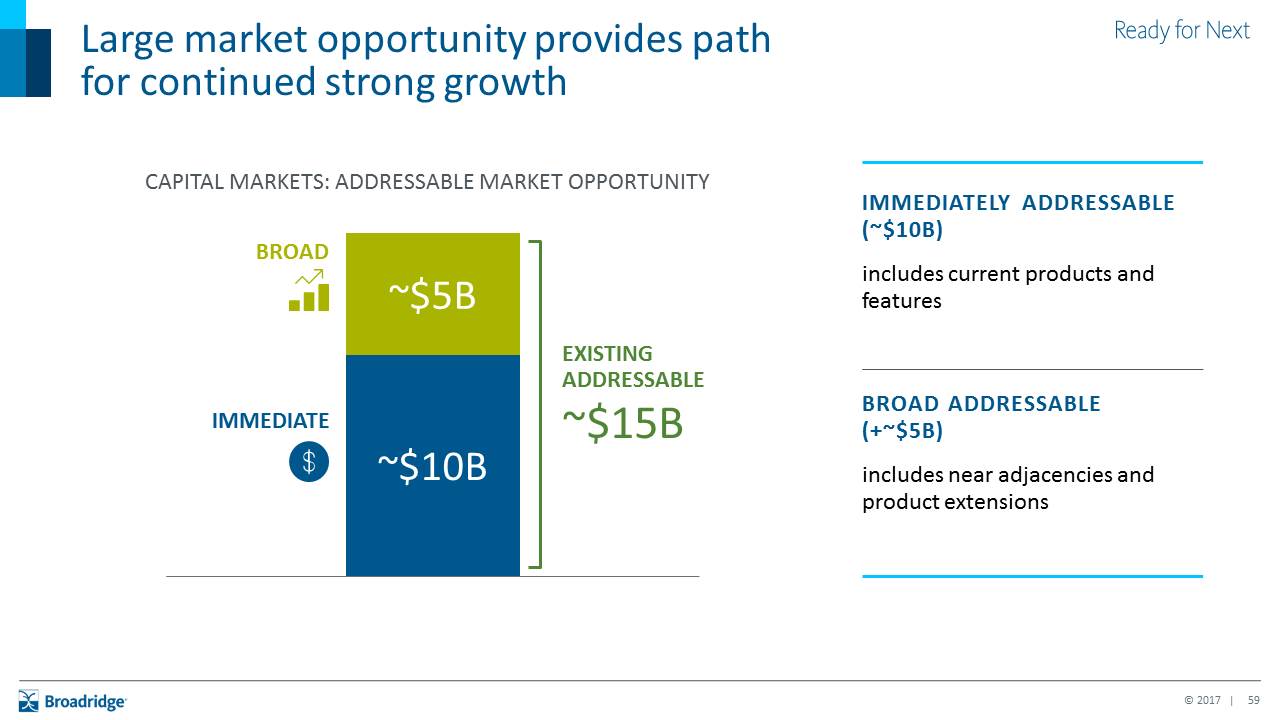
Large market opportunity provides path for continued strong growth IMMEDIATELY ADDRESSABLE (~$10B) includes current products and features BROAD ADDRESSABLE (+~$5B) includes near adjacencies and product extensions CAPITAL MARKETS: ADDRESSABLE MARKET OPPORTUNITY ~$10B ~$5B EXISTING ADDRESSABLE~$15B IMMEDIATE BROAD

Well-positioned to lead in a growing market Large market opportunity provides a strong path for growth Uniquely positioned to be the on-ramp for technology innovation Global Post Trade Management solution simplifies and transforms As a leading global provider of capital markets technology infrastructure, Broadridge is driving simplification and transformation globally for our clients and the industry

2017 Investor Day December 5, 2017
BroadridgeWealth Management Chris PerryPresident, Global Sales, Marketing, & Client Solutions

The combination of our wealth management capabilities and the evolution of the industry creates significant opportunity for Broadridge
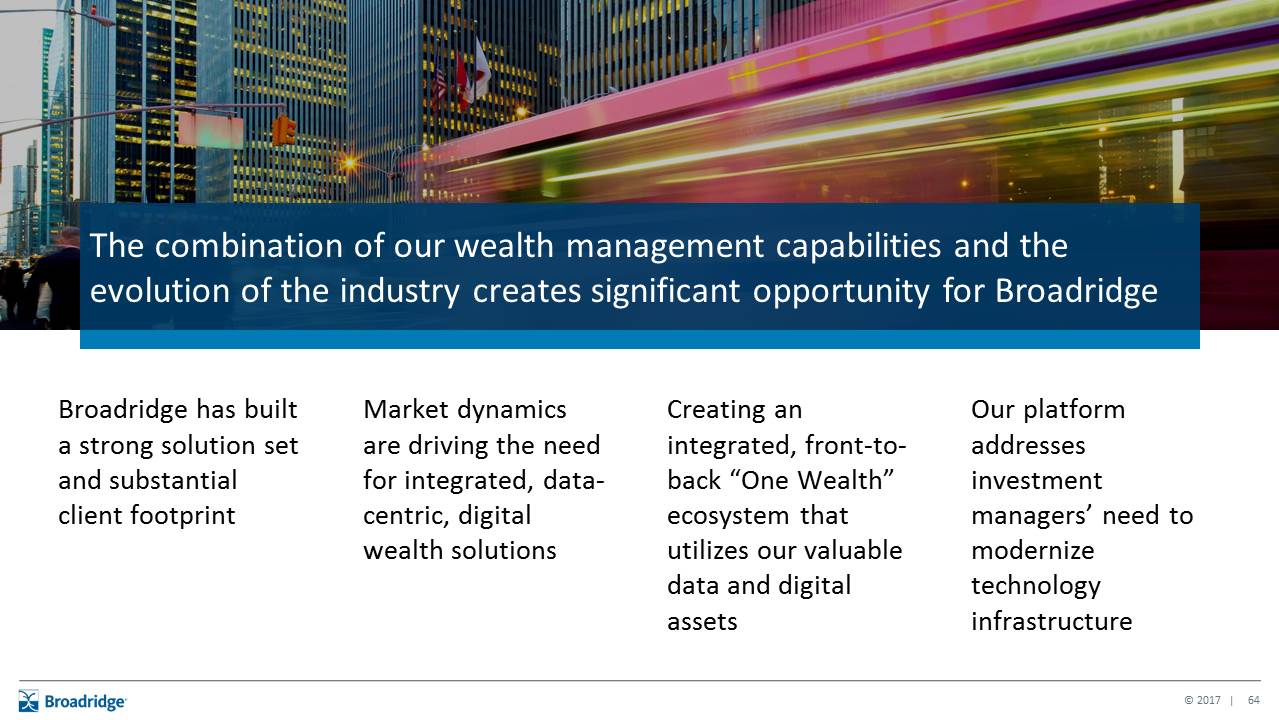
The combination of our wealth management capabilities and the evolution of the industry creates significant opportunity for Broadridge Our platform addresses investment managers’ need to modernize technology infrastructure Broadridge has built a strong solution set and substantial client footprint Market dynamics are driving the need for integrated, data-centric, digital wealth solutions Creating an integrated, front-to-back “One Wealth” ecosystem that utilizes our valuable data and digital assets
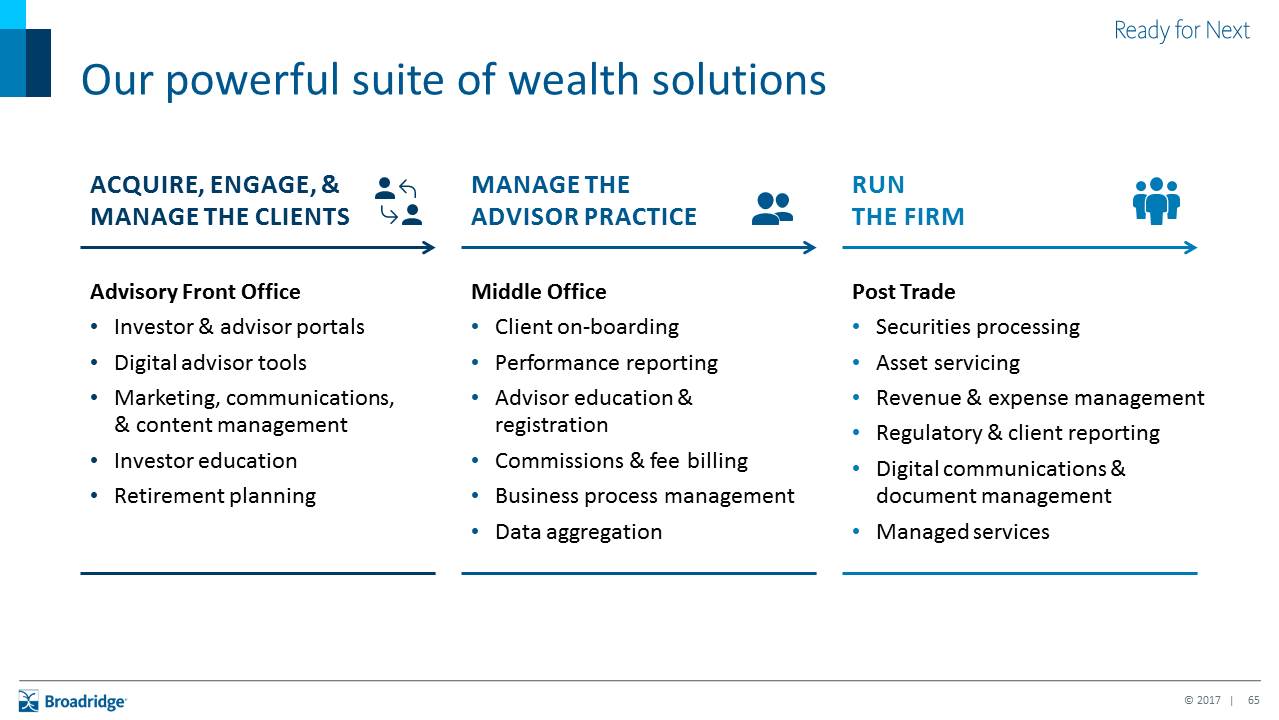
Our powerful suite of wealth solutions Advisory Front OfficeInvestor & advisor portalsDigital advisor tools Marketing, communications, & content managementInvestor education Retirement planning Middle OfficeClient on-boardingPerformance reportingAdvisor education & registrationCommissions & fee billing Business process managementData aggregation Post TradeSecurities processingAsset servicingRevenue & expense managementRegulatory & client reportingDigital communications & document management Managed services ACQUIRE, ENGAGE, & MANAGE THE CLIENTS MANAGE THE ADVISOR PRACTICE RUNTHE FIRM
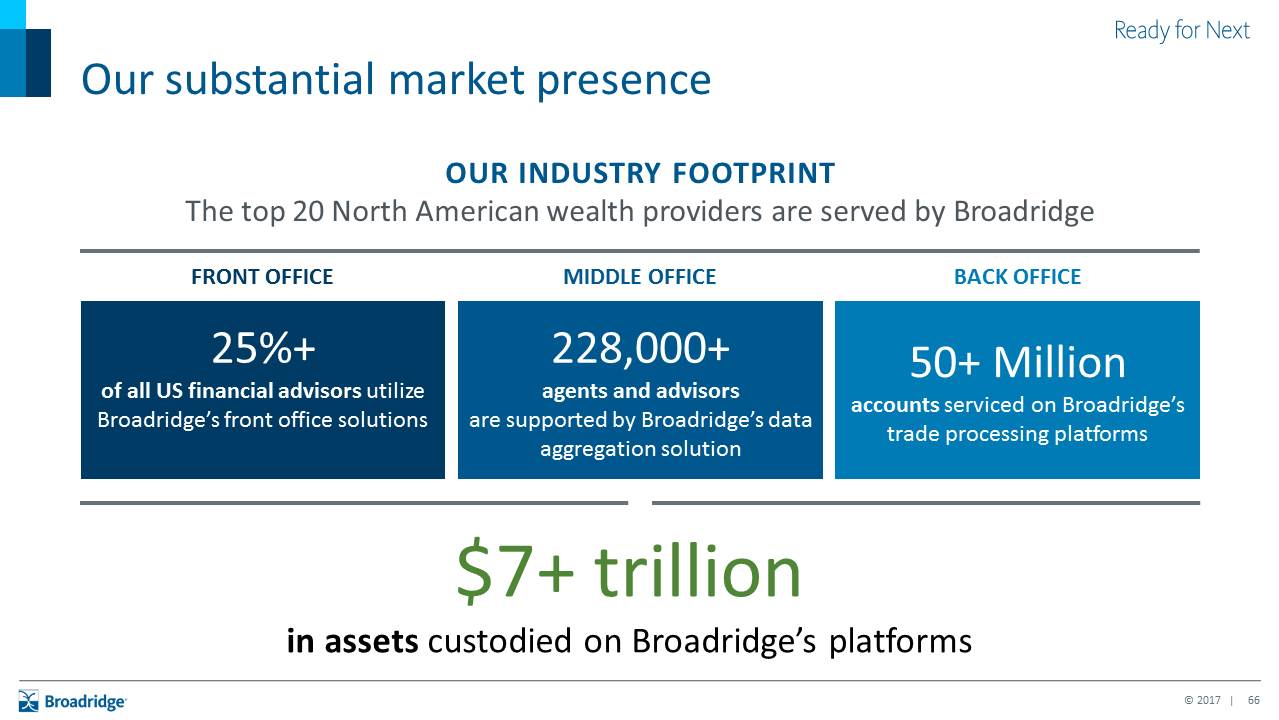
Our substantial market presence 25%+of all US financial advisors utilize Broadridge’s front office solutions 228,000+agents and advisors are supported by Broadridge’s data aggregation solution 50+ Millionaccounts serviced on Broadridge’s trade processing platforms $7+ trillion in assets custodied on Broadridge’s platforms OUR INDUSTRY FOOTPRINTThe top 20 North American wealth providers are served by Broadridge FRONT OFFICE MIDDLE OFFICE BACK OFFICE
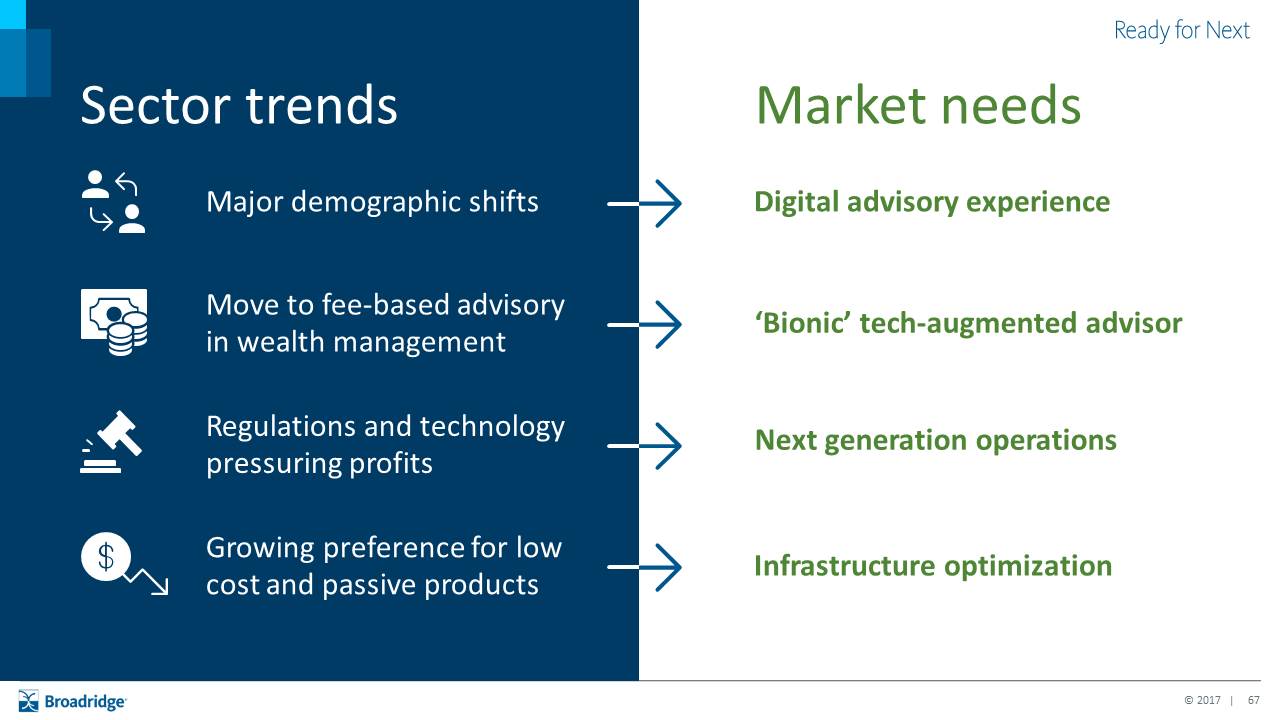
Market needs Digital advisory experience Major demographic shifts Sector trends ‘Bionic’ tech-augmented advisor Move to fee-based advisory in wealth management Next generation operations Regulations and technology pressuring profits Infrastructure optimization Growing preference for low cost and passive products

Drive growth of our targeted point solutions Offer an integrated “One Wealth” platform that provides enhanced capabilities across the entire wealth lifecycle Enrich the value of our solutions via digitization, data, and artificial intelligence Our strategy to grow our Wealth revenue
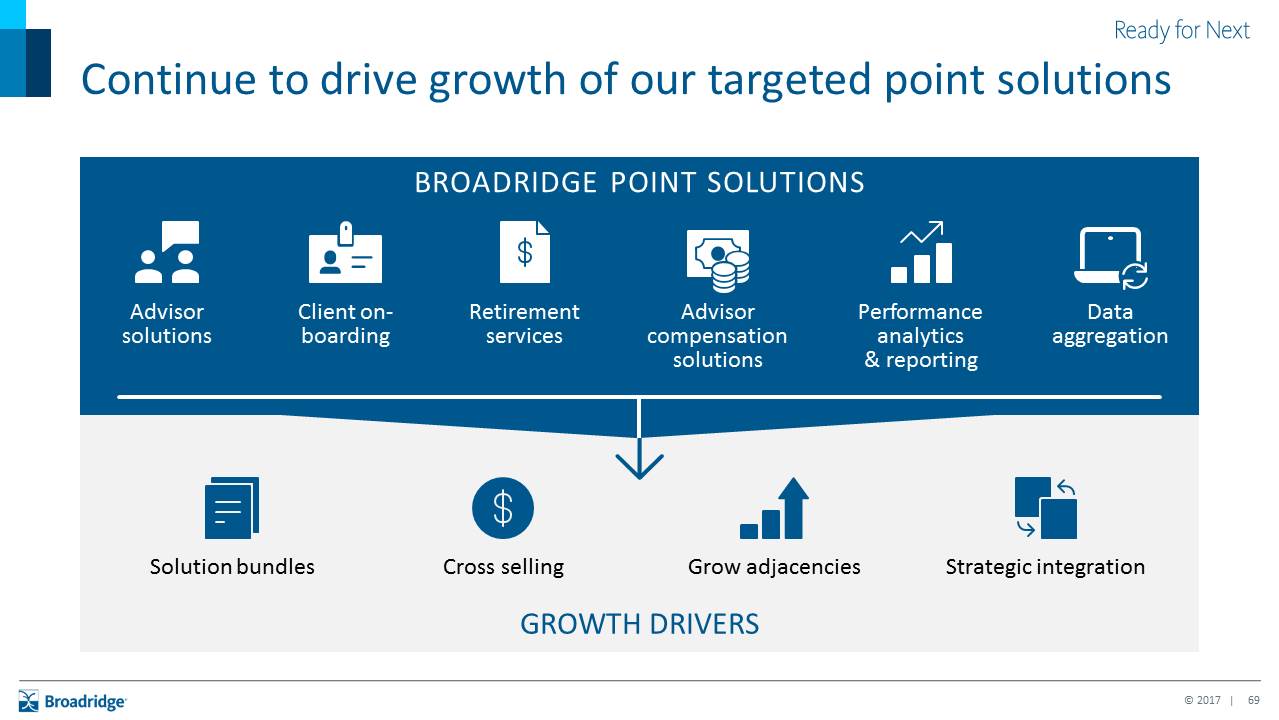
Continue to drive growth of our targeted point solutions BROADRIDGE POINT SOLUTIONS GROWTH DRIVERS Client on-boarding Advisor solutions Performance analytics & reporting Advisor compensation solutions Retirement services Data aggregation Cross selling Solution bundles Strategic integration Grow adjacencies
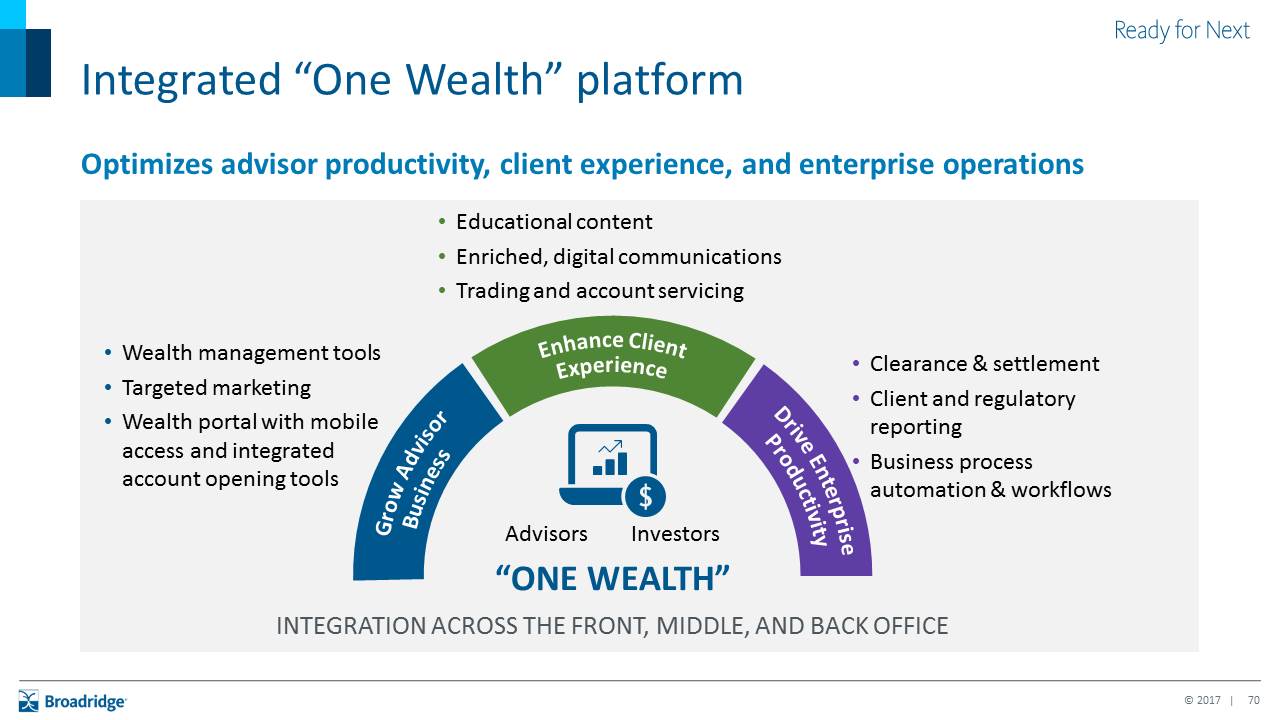
Integrated “One Wealth” platform Optimizes advisor productivity, client experience, and enterprise operations Wealth management tools Targeted marketing Wealth portal with mobile access and integrated account opening tools Educational content Enriched, digital communicationsTrading and account servicing Clearance & settlement Client and regulatory reportingBusiness process automation & workflows Grow AdvisorBusiness Enhance ClientExperience Drive EnterpriseProductivity “ONE WEALTH” INTEGRATION ACROSS THE FRONT, MIDDLE, AND BACK OFFICE Advisors Investors

Our “One Wealth” solution recently ranked #1 by Celent Broadridge demonstrates a dedication to developing its digital proposition and empowering the advisor and client through, for example, its three-prong implementation approach of AI and strong mobile apps. − Celent, “North American Wealth Front to Back Office Technology Platforms” 2017 “ “ Broadridge Wealth Solution is a true front-to-back solution offering robust modules.
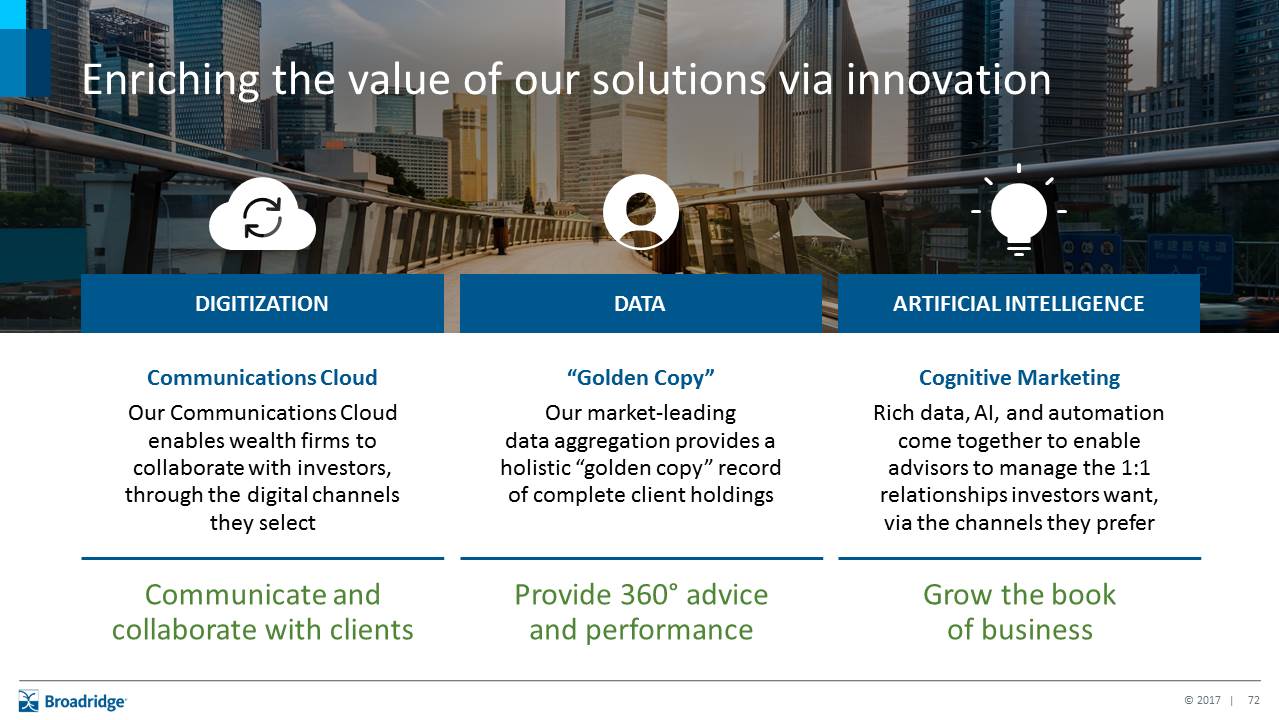
Communications CloudOur Communications Cloud enables wealth firms to collaborate with investors, through the digital channels they select Communicate and collaborate with clients Enriching the value of our solutions via innovation “Golden Copy” Our market-leading data aggregation provides a holistic “golden copy” record of complete client holdings Cognitive MarketingRich data, AI, and automation come together to enable advisors to manage the 1:1 relationships investors want, via the channels they prefer Provide 360° advice and performance Grow the book of business DIGITIZATION DATA ARTIFICIAL INTELLIGENCE

Our investment management solution suite Key trends driving sector needs Increased regulationRevenue pressureShifting service models Our powerful investment management offeringsPortfolio and order management, risk, compliance, and data managementRevenue and expense managementAccounting and general ledgerManaged data services Our substantial market presence17 of the top 20 North American investment managers Over 300 investment management clients globally including pensions, public funds, fund administrators, and custodians

The combination of our wealth management capabilities and the evolution of the industry creates significant opportunity for Broadridge Our platform addresses investment managers’ need to modernize technology infrastructure Broadridge has built a strong solution set and substantial client footprint Market dynamics are driving the need for integrated, data-centric, digital wealth solutions Creating an integrated, front-to-back “One Wealth” ecosystem that utilizes our valuable data and digital assets
Doug DeSchutter President, Broadridge Customer CommunicationsMichelle Jackson Managing Director, Broadridge Digital Solutions The Digital Future and Broadridge Customer Communications
Broadridge’s digital platform provides foundational capabilities for our Governance franchise and drives growth opportunities for BRCC
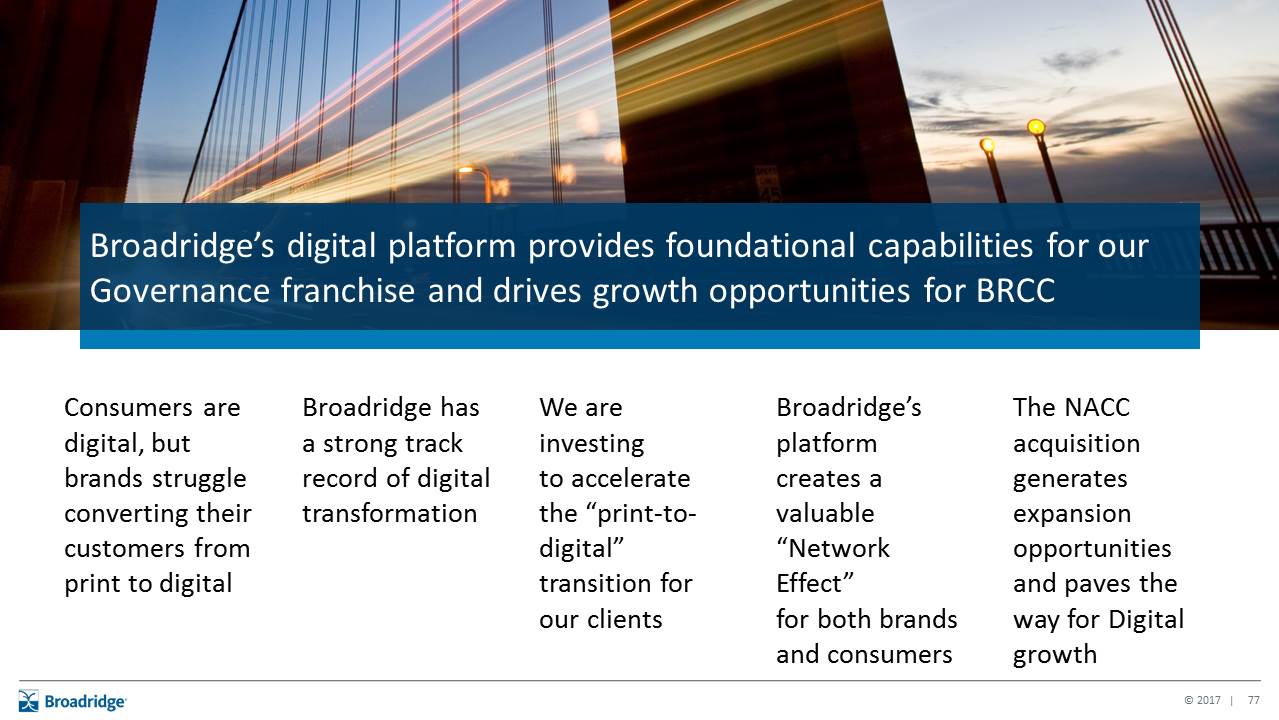
Broadridge’s digital platform provides foundational capabilities for our Governance franchise and drives growth opportunities for BRCC Consumers are digital, but brands struggle converting their customers from print to digital Broadridge has a strong track record of digital transformation We are investing to accelerate the “print-to-digital” transition for our clients Broadridge’s platform creates a valuable “Network Effect” for both brands and consumers The NACC acquisition generates expansion opportunities and paves the way for Digital growth

Consumers are digital, but brands struggleconverting their customers from print to digital US ADULTSMAKING $75K+ 70%Use paper DISTRIBUTION OF BILLS AND STATEMENTS 98%Internet users 2%Offline 30% Exclusively digital 20% “Double Dippers” Sources: Pew Research Center, 2016, Aite Group, 2017, InfoTrends, 2017, Dalbar, 2016 and Broadridge Data Analysis
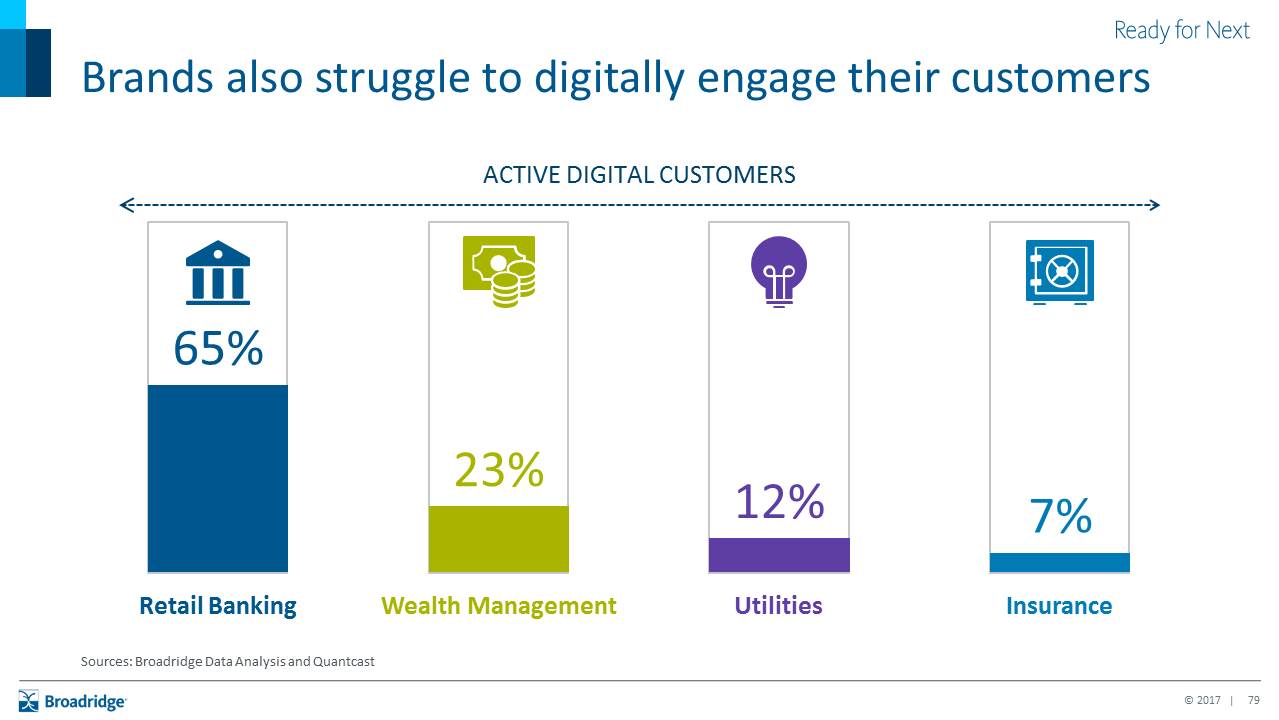
Brands also struggle to digitally engage their customers Retail Banking Wealth Management Insurance Utilities Active digital customers Sources: Broadridge Data Analysis and Quantcast
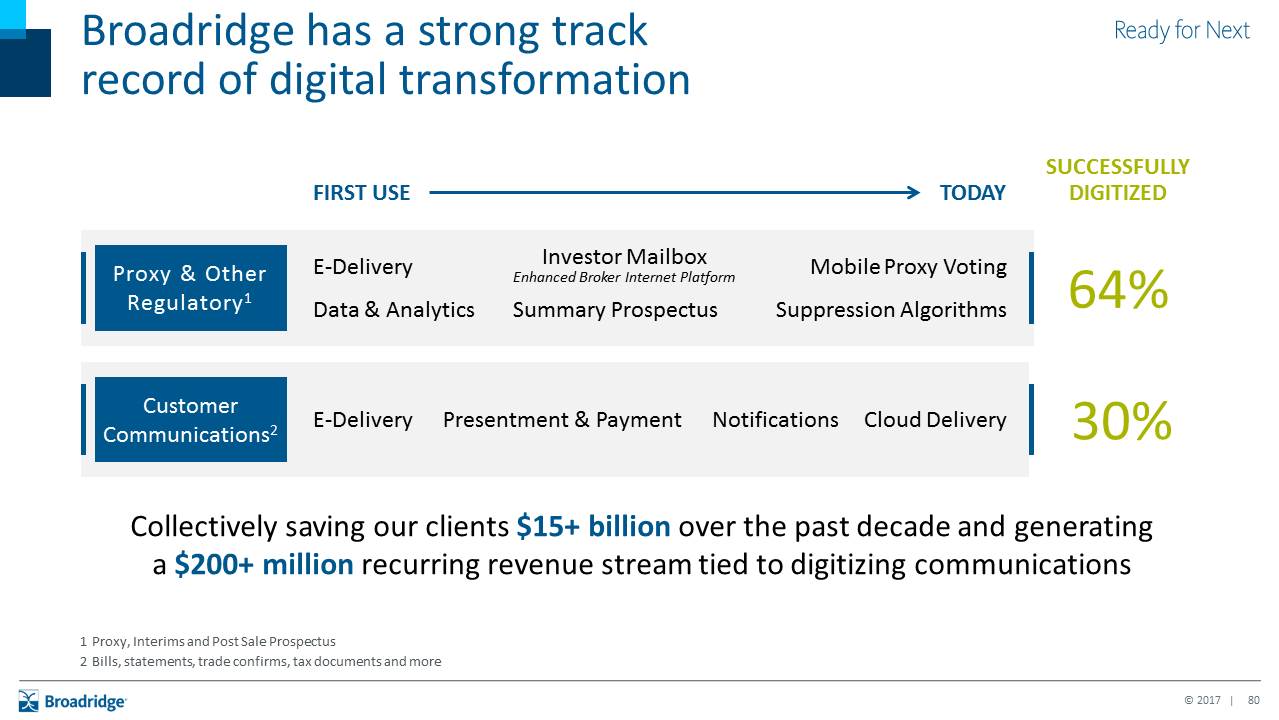
Broadridge has a strong track record of digital transformation Customer Communications2 Presentment & Payment Notifications Cloud Delivery E-Delivery Proxy & Other Regulatory1 Data & Analytics Suppression Algorithms Summary Prospectus E-Delivery Investor Mailbox Enhanced Broker Internet Platform Mobile Proxy Voting 64% Collectively saving our clients $15+ billion over the past decade and generatinga $200+ million recurring revenue stream tied to digitizing communications 30% 1 Proxy, Interims and Post Sale Prospectus2 Bills, statements, trade confirms, tax documents and more FIRST USE TODAY SUCCESSFULLY DIGITIZED
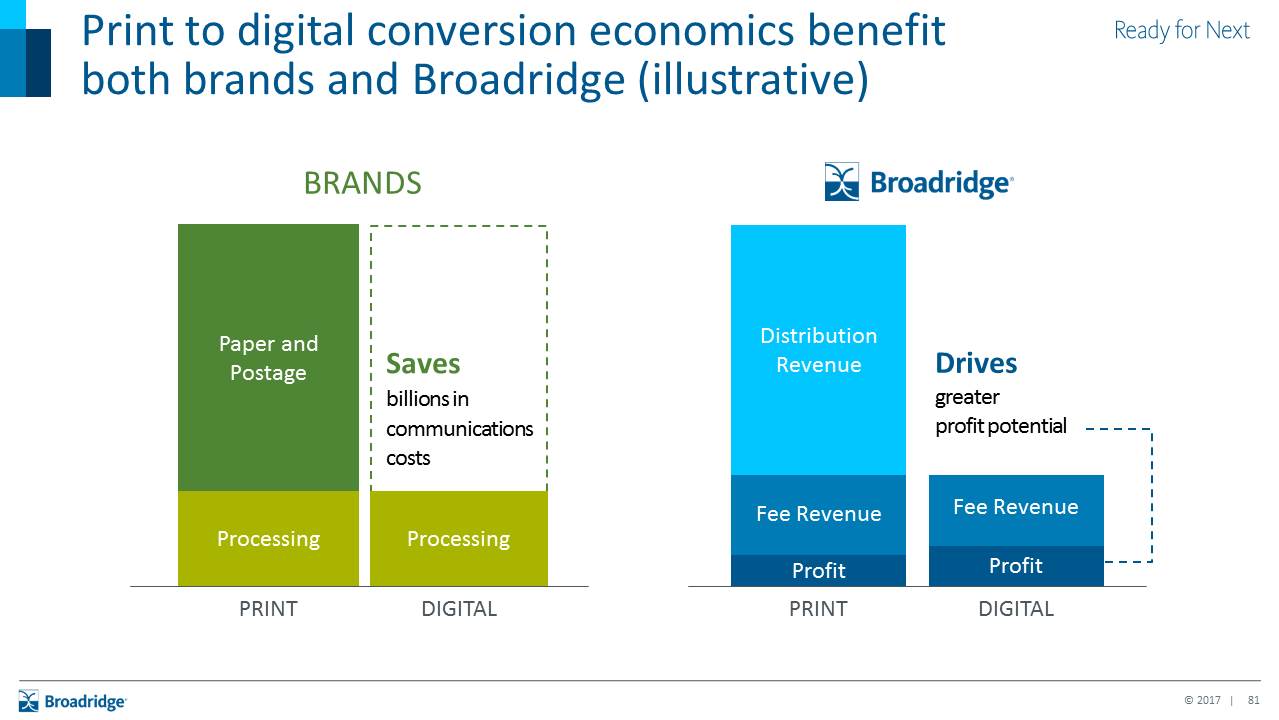
Print to digital conversion economics benefit both brands and Broadridge (illustrative) PRINT Fee Revenue Paper and Postage DIGITAL DIGITAL Saves billions in communications costs Drives greater profit potential Profit Fee Revenue PRINT Distribution Revenue Profit BRANDS Processing Processing
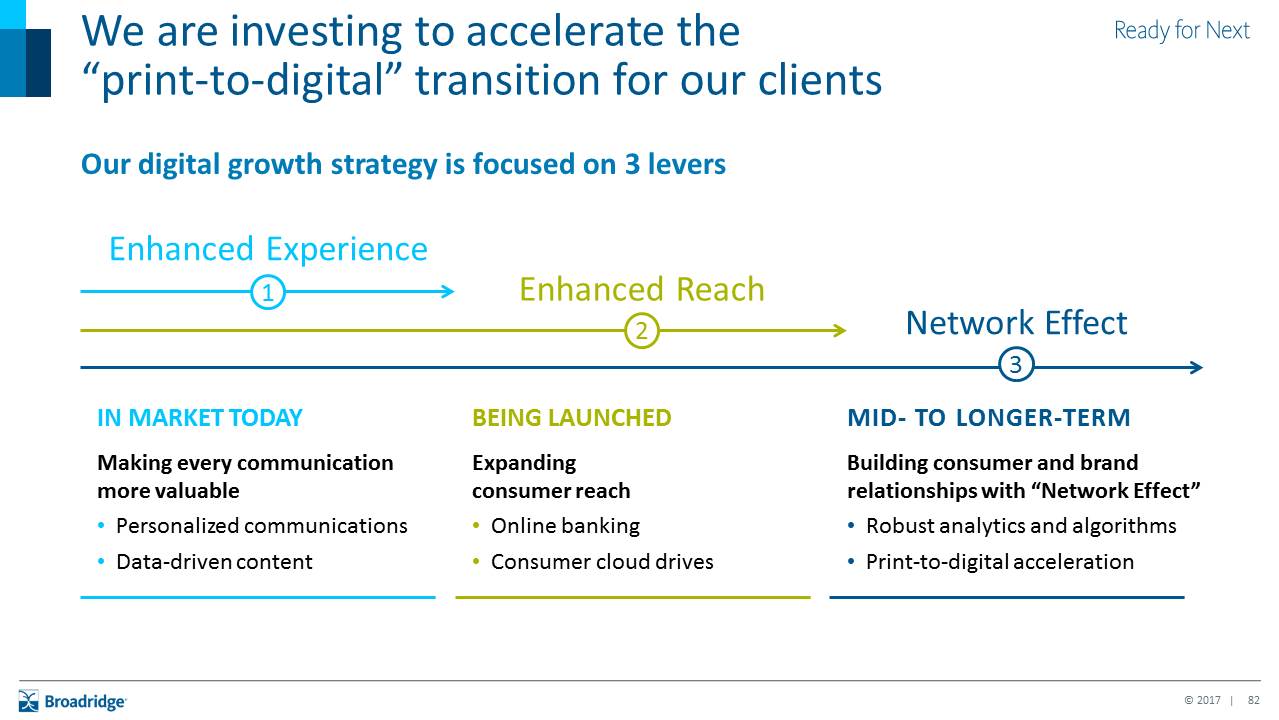
Network Effect 3 We are investing to accelerate the“print-to-digital” transition for our clients Our digital growth strategy is focused on 3 levers Enhanced Reach 2 IN MARKET TODAYMaking every communication more valuablePersonalized communicationsData-driven content BEING LAUNCHEDExpandingconsumer reachOnline bankingConsumer cloud drives MID- TO LONGER-TERMBuilding consumer and brandrelationships with “Network Effect” Robust analytics and algorithmsPrint-to-digital acceleration Enhanced Experience 1

Sources: SharesPost, 2017 and Broadridge Data Analysis Broadridge’s platform creates a valuable “Network Effect” for both brands and consumers OPPORTUNITY TO BECOME A 21ST CENTURY DIGITAL COMMUNICATIONS HUB HEALTHCARE WEALTH TELECOM 5B+Annual communications ONLINE BANKING 97% US digital consumers connect to online banking & cloud solutions UTILITIES INSURANCE BANKING 80%North American households BRANDS CHANNELS CONSUMERS 5,000+ Brands across all industries


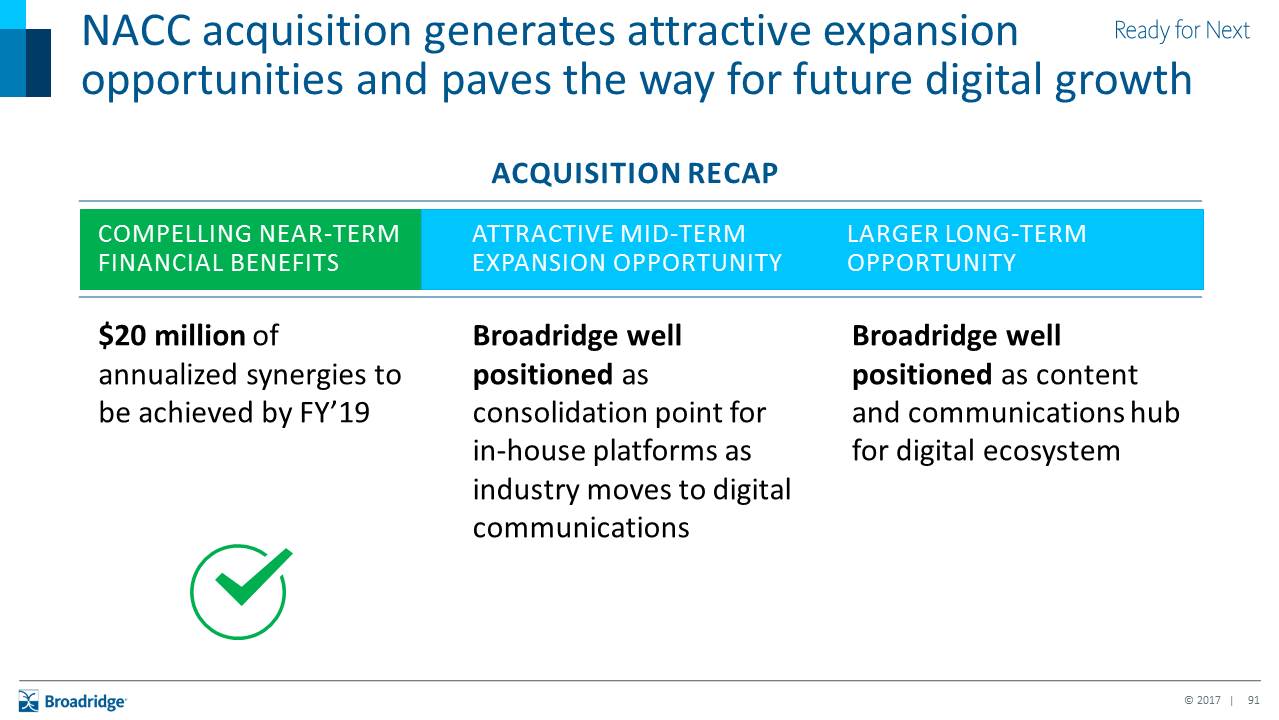
NACC acquisition generates attractive expansion opportunities and paves the way for future digital growth ACQUISITION RECAP Compelling near-term financial benefits Attractive mid-term expansion opportunity Larger long-term opportunity $20 million of annualized synergies to be achieved by FY’19 Broadridge well positioned as consolidation point for in-house platforms as industry moves to digital communications Broadridge well positioned as content and communications hub for digital ecosystem
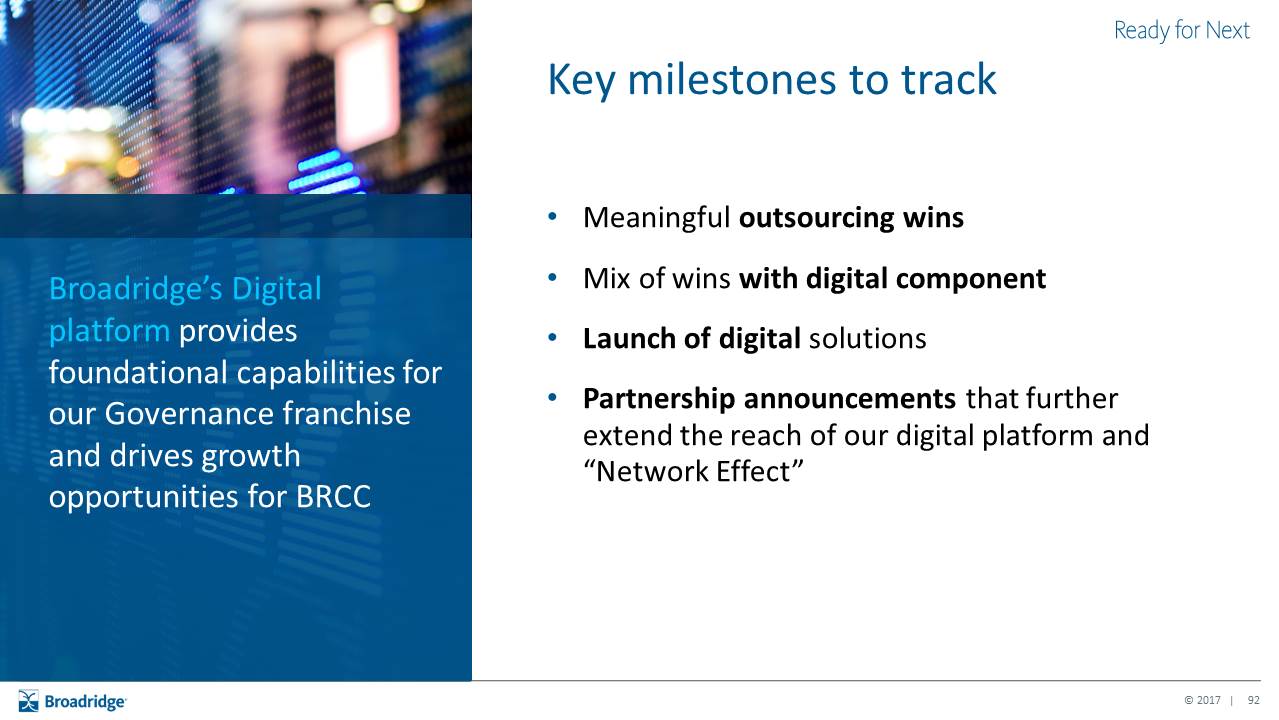
Broadridge’s Digital platform provides foundational capabilities for our Governance franchise and drives growth opportunities for BRCC Meaningful outsourcing winsMix of wins with digital componentLaunch of digital solutionsPartnership announcements that further extend the reach of our digital platform and “Network Effect” Key milestones to track
Broadridge International Tom Carey President, Broadridge International

Broadridge has a sizeable, rapidly growing presence in EMEA and Asia-Pacific Industry trends, combined with a ~$5B market opportunity creates the ability to continue our growth Driving growth through multi-year opportunities with our largest clients, expanding with regional clients, and offering market relevant solutions Successful track record of expanding client relationships and executing in our core financial markets With significant growth potential, International extends our key franchises globally
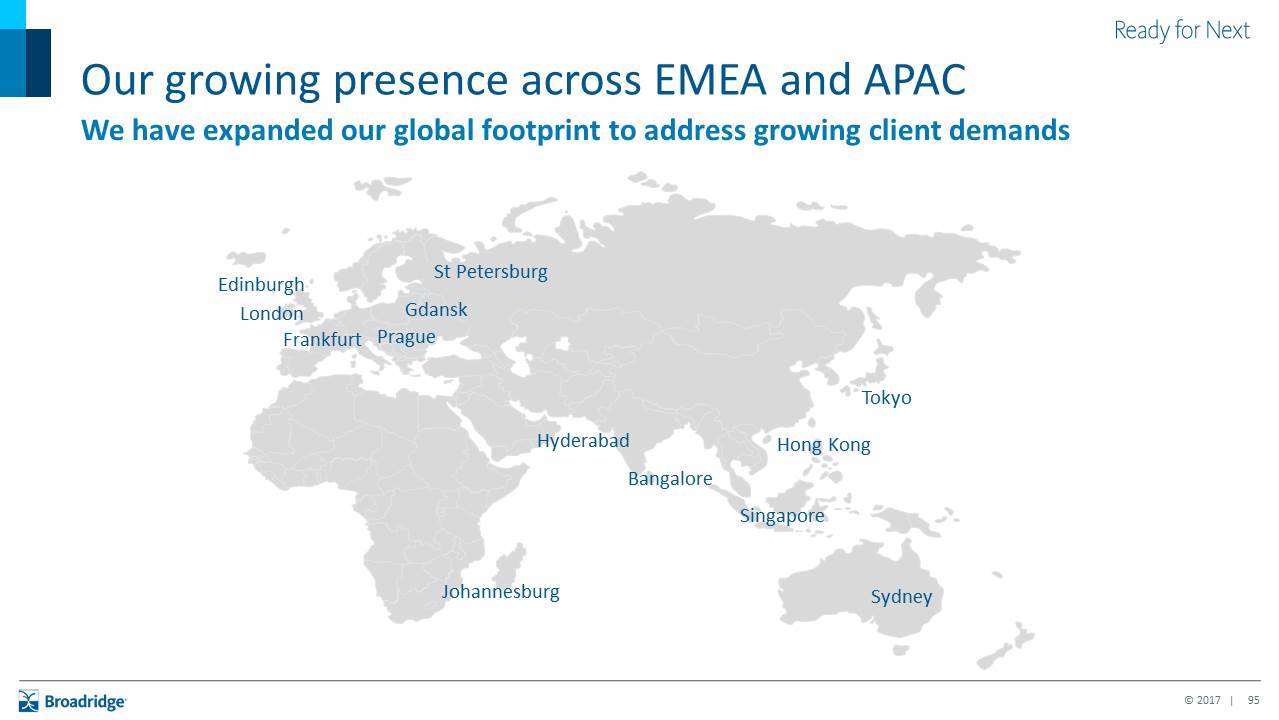
Our growing presence across EMEA and APAC We have expanded our global footprint to address growing client demands London Frankfurt Tokyo Hong Kong Singapore Sydney Edinburgh Johannesburg Prague Gdansk St Petersburg Hyderabad Bangalore

Our growing presence across EMEA and APAC YEAR LOCATION KEY MILESTONE 2013 Europe Signs large post-trade utility client Partners with Accenture to create Eurasia post-trade 2014 Europe Creates European data center Australia Signs largest local market clearer 2015 Europe Second post-trade utility client Entered market intelligence space 2016 UK Tier 1 bank joins utility UK Acquires securities financing capabilities EMEA & APAC Leading fixed income firm selects Broadridge 2017 Japan Creates SaaS offering for Tier 1 clients UK Acquires regulatory reporting capabilities Japan 800th client joins BR’s electronic proxy voting
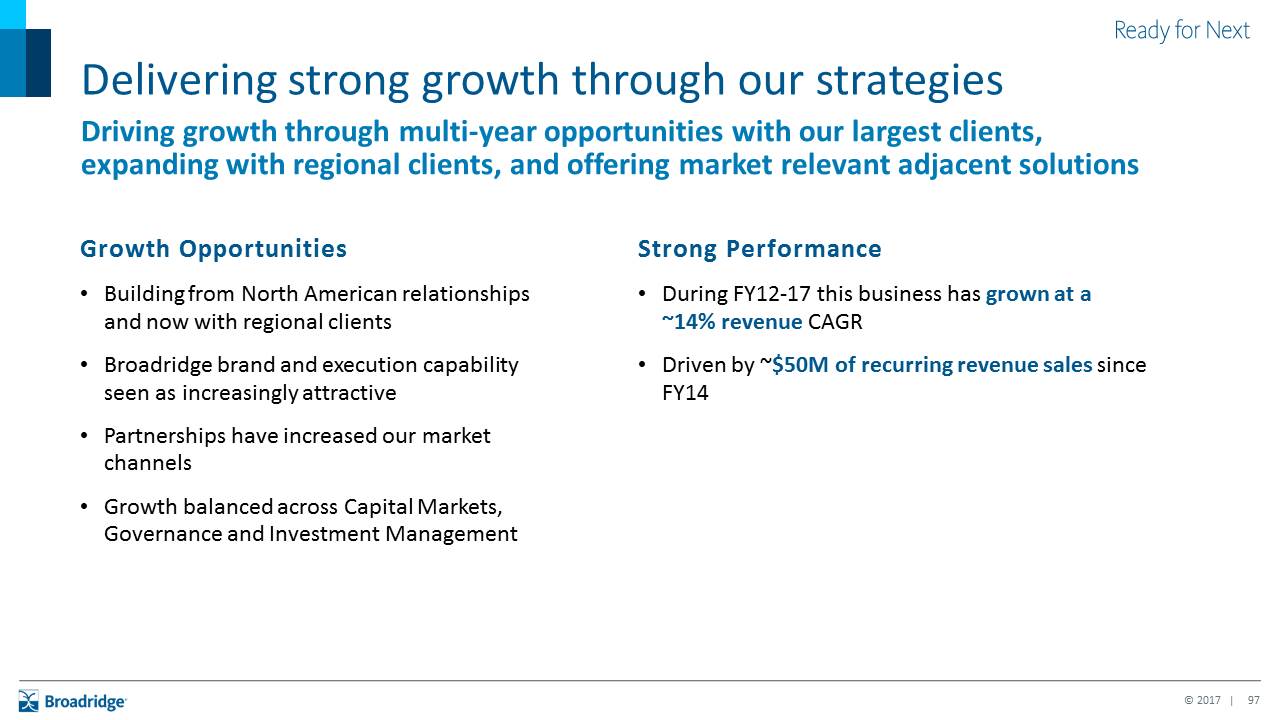
Growth Opportunities Building from North American relationships and now with regional clientsBroadridge brand and execution capability seen as increasingly attractivePartnerships have increased our market channelsGrowth balanced across Capital Markets, Governance and Investment Management Delivering strong growth through our strategies Driving growth through multi-year opportunities with our largest clients, expanding with regional clients, and offering market relevant adjacent solutions Strong PerformanceDuring FY12-17 this business has grown at a ~14% revenue CAGRDriven by ~$50M of recurring revenue sales since FY14
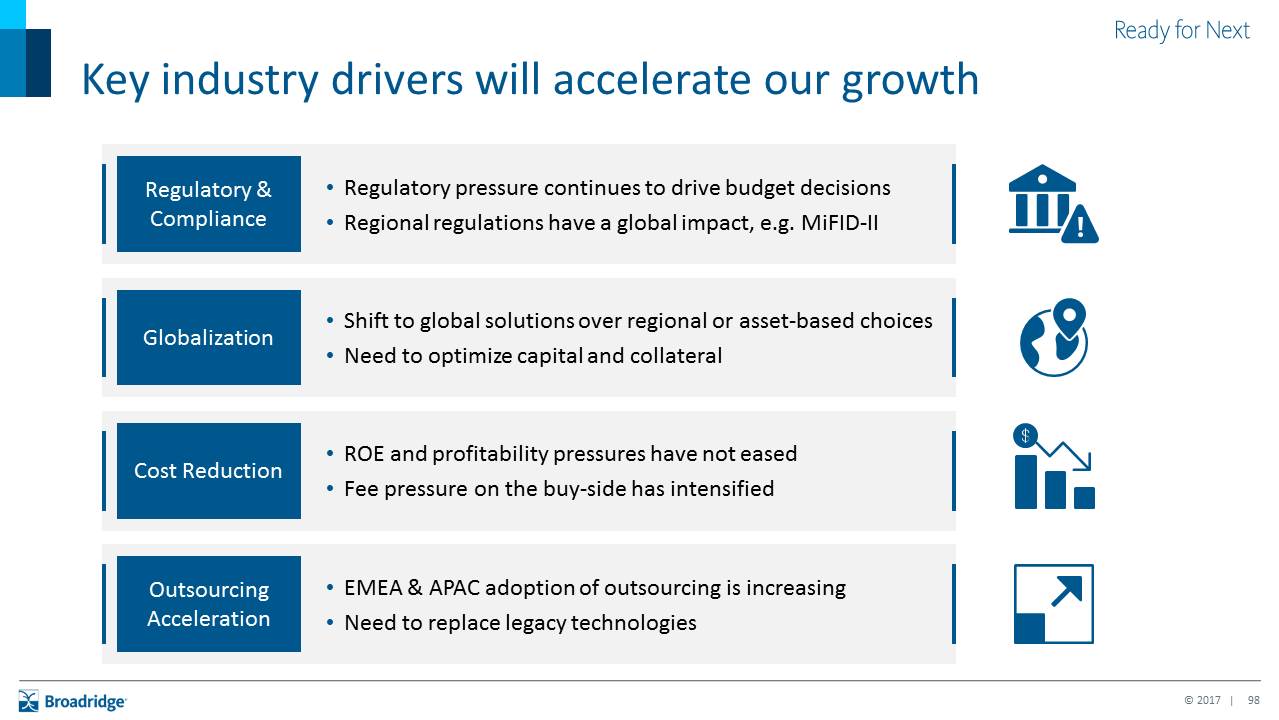
Key industry drivers will accelerate our growth Regulatory & Compliance Regulatory pressure continues to drive budget decisionsRegional regulations have a global impact, e.g. MiFID-II Globalization Shift to global solutions over regional or asset-based choicesNeed to optimize capital and collateral Cost Reduction ROE and profitability pressures have not easedFee pressure on the buy-side has intensified Outsourcing Acceleration EMEA & APAC adoption of outsourcing is increasingNeed to replace legacy technologies

Market factors enhance Broadridge’s abilityto address $5B international market Capital Markets Globalization of marketsContinued cost pressure to improve ROERegulatory change continues and has global impacts Investment Management Fee pressure driving cost rationalization Higher scrutiny on money movements and performance Governance Demand for transparency in corporate governanceShareholder engagement is growingHigher expectations for oversight role of the board Our $5B Market Opportunity
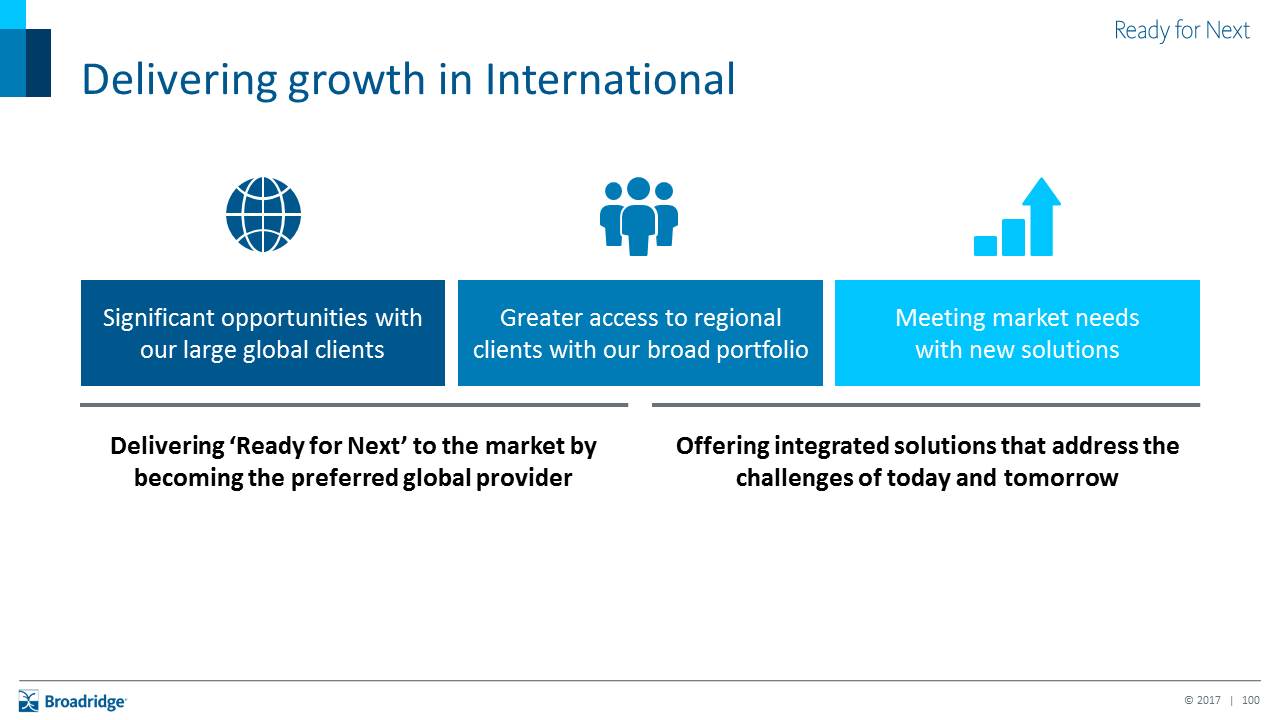
Delivering growth in International Delivering ‘Ready for Next’ to the market by becoming the preferred global provider Significant opportunities with our large global clients Greater access to regional clients with our broad portfolio Meeting market needs with new solutions Offering integrated solutions that address the challenges of today and tomorrow
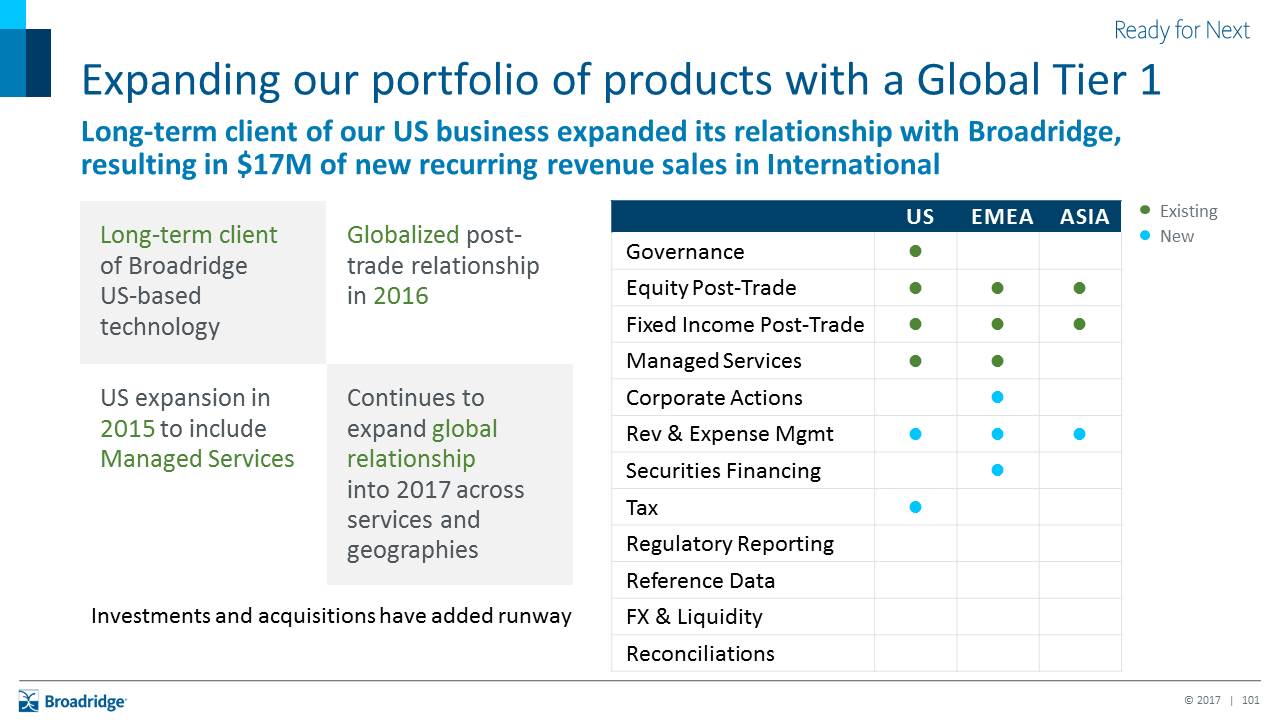
Expanding our portfolio of products with a Global Tier 1 Long-term client of our US business expanded its relationship with Broadridge, resulting in $17M of new recurring revenue sales in International US EMEA ASIA Governance Equity Post-Trade Fixed Income Post-Trade Managed Services Corporate Actions Rev & Expense Mgmt Securities Financing Tax Regulatory Reporting Reference Data FX & Liquidity Reconciliations Long-term client of Broadridge US-based technology Existing Globalized post-trade relationship in 2016 US expansion in2015 to include Managed Services Continues to expand global relationship into 2017 across services and geographies Investments and acquisitions have added runway New
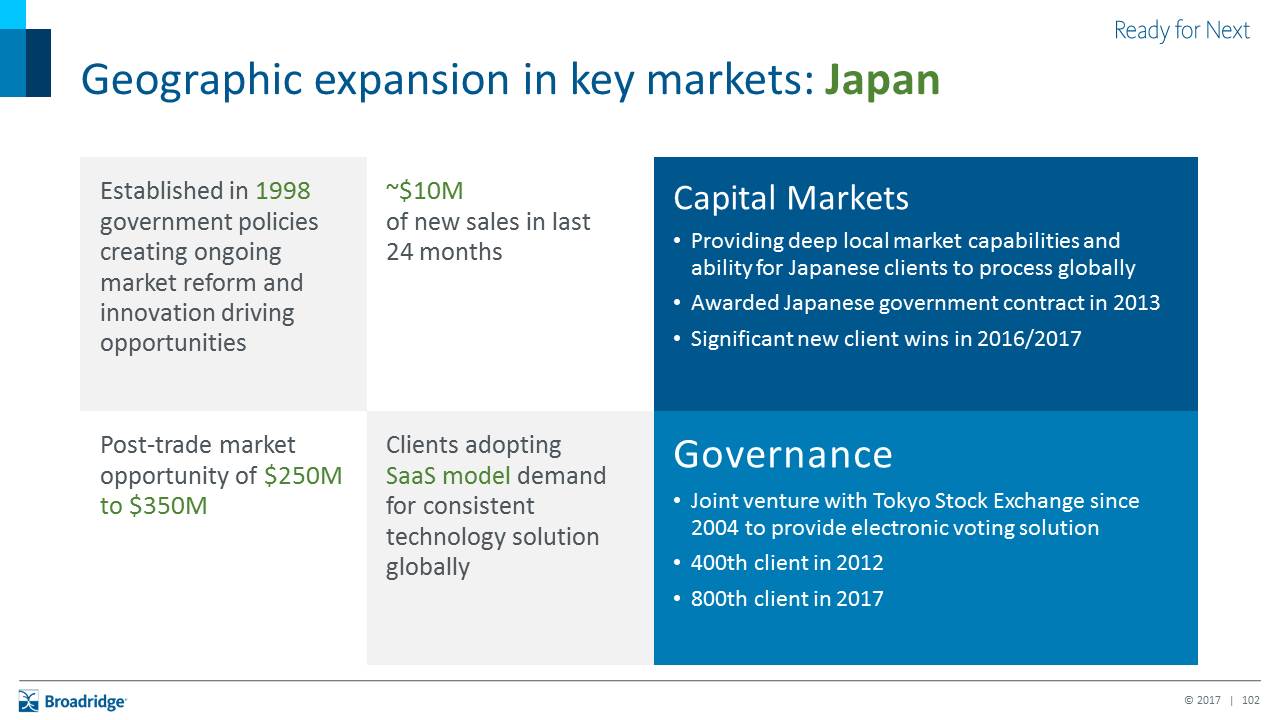
Geographic expansion in key markets: Japan Capital MarketsProviding deep local market capabilities and ability for Japanese clients to process globallyAwarded Japanese government contract in 2013Significant new client wins in 2016/2017 Established in 1998 government policies creating ongoing market reform and innovation driving opportunities ~$10M of new sales in last 24 months Post-trade marketopportunity of $250M to $350M Clients adoptingSaaS model demand for consistent technology solution globally Governance Joint venture with Tokyo Stock Exchange since 2004 to provide electronic voting solution400th client in 2012800th client in 2017

Well-positioned to drive International growth Capital Markets $2.6B Investment Management $1.7B Governance $0.7B Large market opportunity
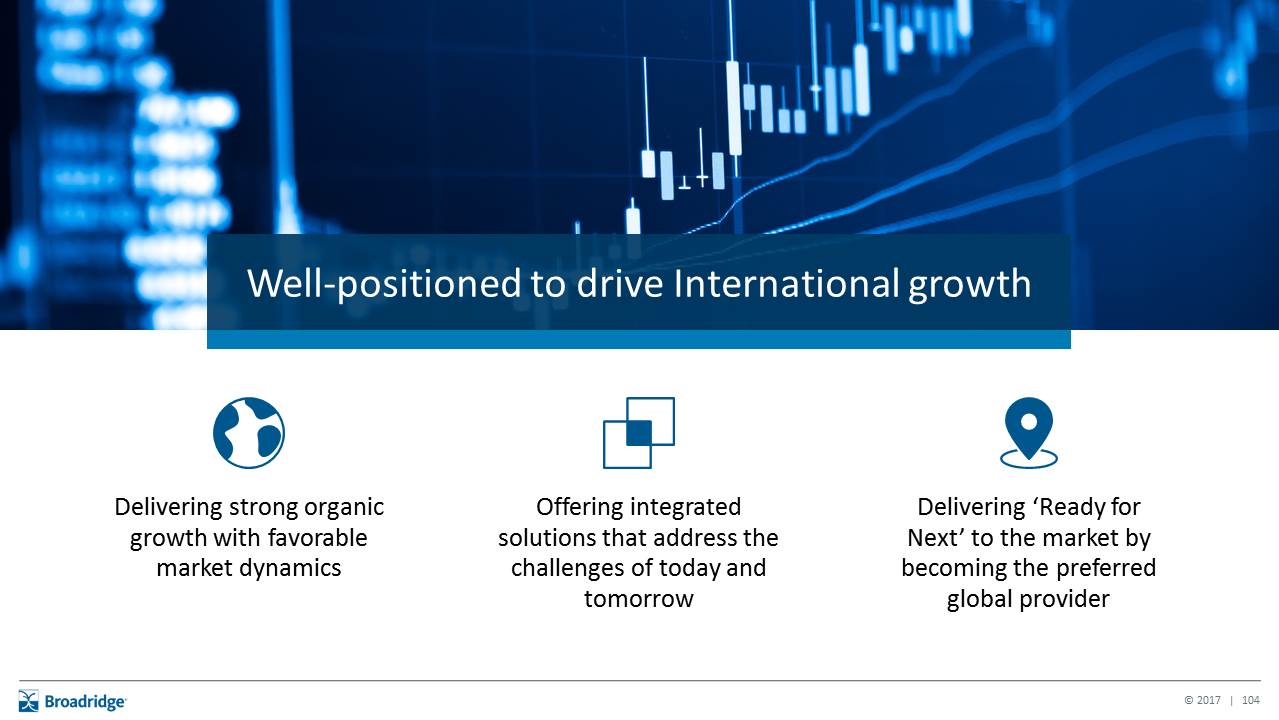
Well-positioned to drive International growth Delivering ‘Ready for Next’ to the market by becoming the preferred global provider Offering integrated solutions that address the challenges of today and tomorrow Delivering strong organic growth with favorable market dynamics
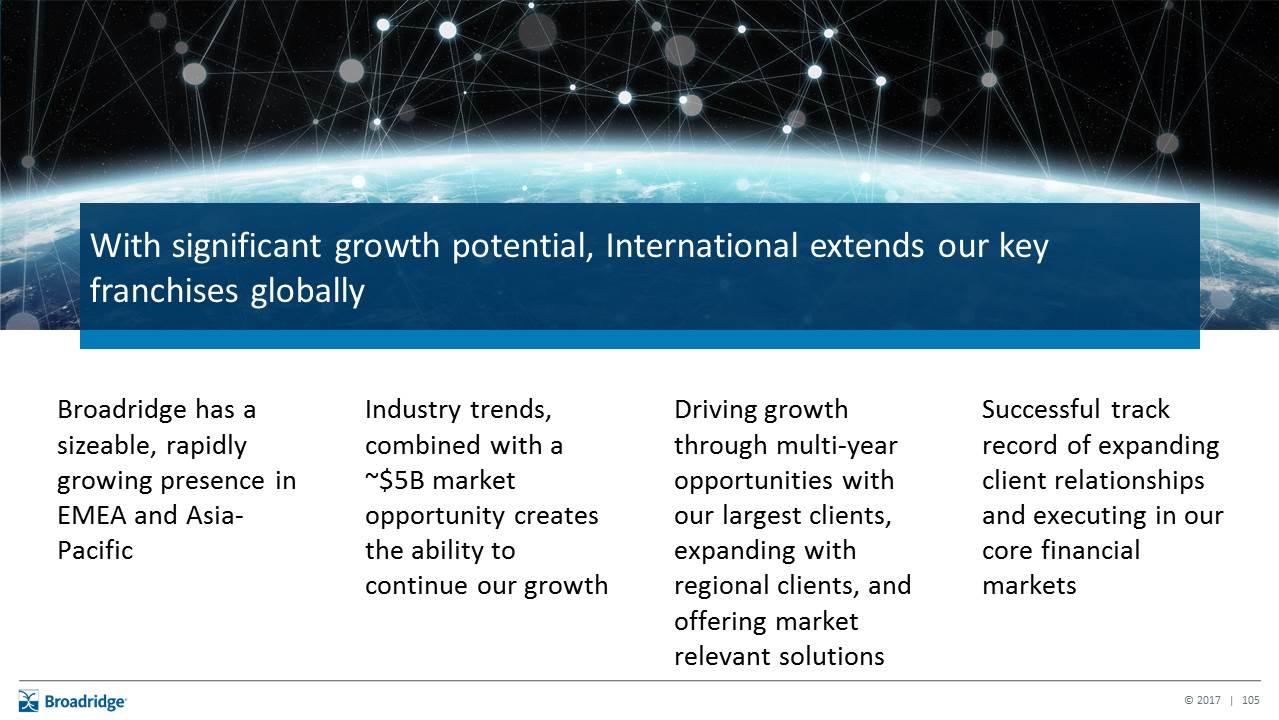
Broadridge has a sizeable, rapidly growing presence in EMEA and Asia-Pacific Industry trends, combined with a ~$5B market opportunity creates the ability to continue our growth Driving growth through multi-year opportunities with our largest clients, expanding with regional clients, and offering market relevant solutions Successful track record of expanding client relationships and executing in our core financial markets With significant growth potential, International extends our key franchises globally

MV Foundation Residential Bridge Camp CASING FORMATSHeadlines:Sentence case; no punctuationSubheads under headlines: Sentence case; with punctuationSubheads in body copy/bullets: Sentence case; no punctuation
2017 Investor Day December 5, 2017
Financial Overview Jim YoungChief Financial Officer

Key points for today’s discussion Broadridge has a strong business model with compelling growth opportunities Strong free cash flow enables balanced, shareholder-friendly capital allocation Three-year objectives constitute a plan for continued top quartile TSR
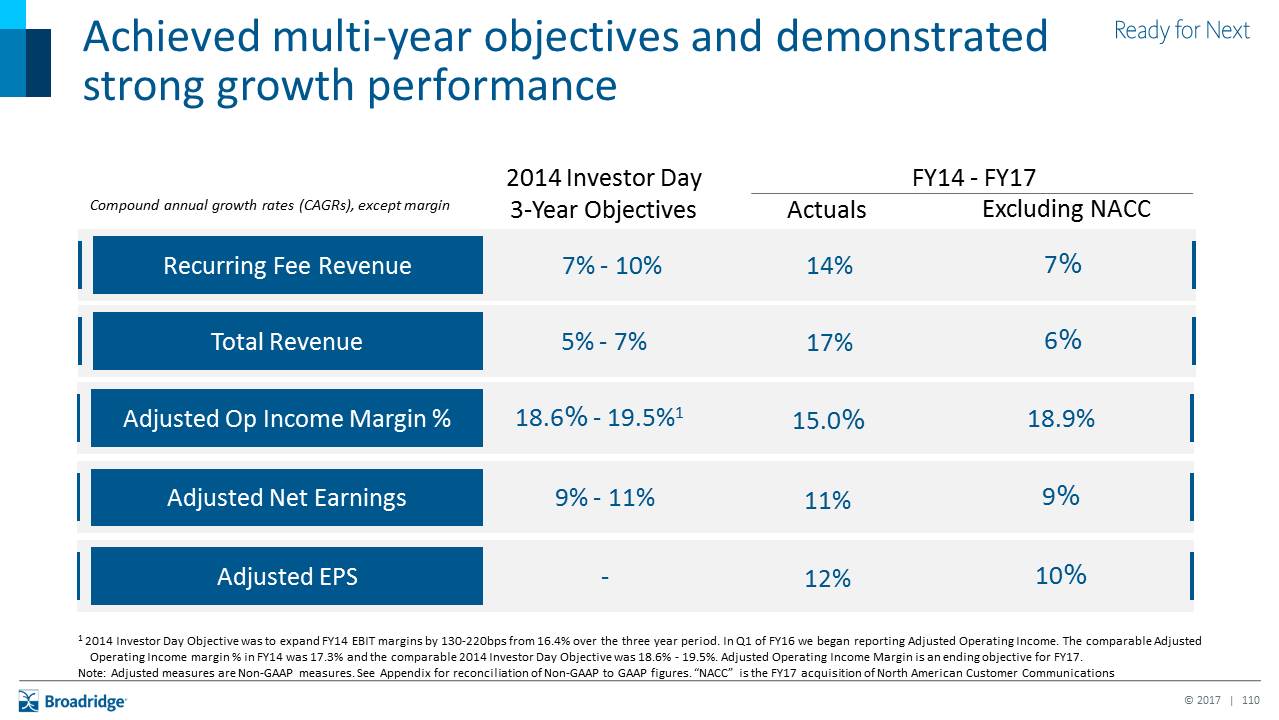
Achieved multi-year objectives and demonstrated strong growth performance 2014 Investor Day 3-Year Objectives Excluding NACC Actuals Recurring Fee Revenue 7% - 10% 7% 14% Total Revenue 5% - 7% 6% 17% Adjusted Op Income Margin % 18.6% - 19.5%1 18.9% 15.0% Adjusted Net Earnings 9% - 11% 9% 11% 1 2014 Investor Day Objective was to expand FY14 EBIT margins by 130-220bps from 16.4% over the three year period. In Q1 of FY16 we began reporting Adjusted Operating Income. The comparable Adjusted Operating Income margin % in FY14 was 17.3% and the comparable 2014 Investor Day Objective was 18.6% - 19.5%. Adjusted Operating Income Margin is an ending objective for FY17. Note: Adjusted measures are Non-GAAP measures. See Appendix for reconciliation of Non-GAAP to GAAP figures. “NACC” is the FY17 acquisition of North American Customer Communications Compound annual growth rates (CAGRs), except margin Adjusted EPS - 10% 12% FY14 - FY17
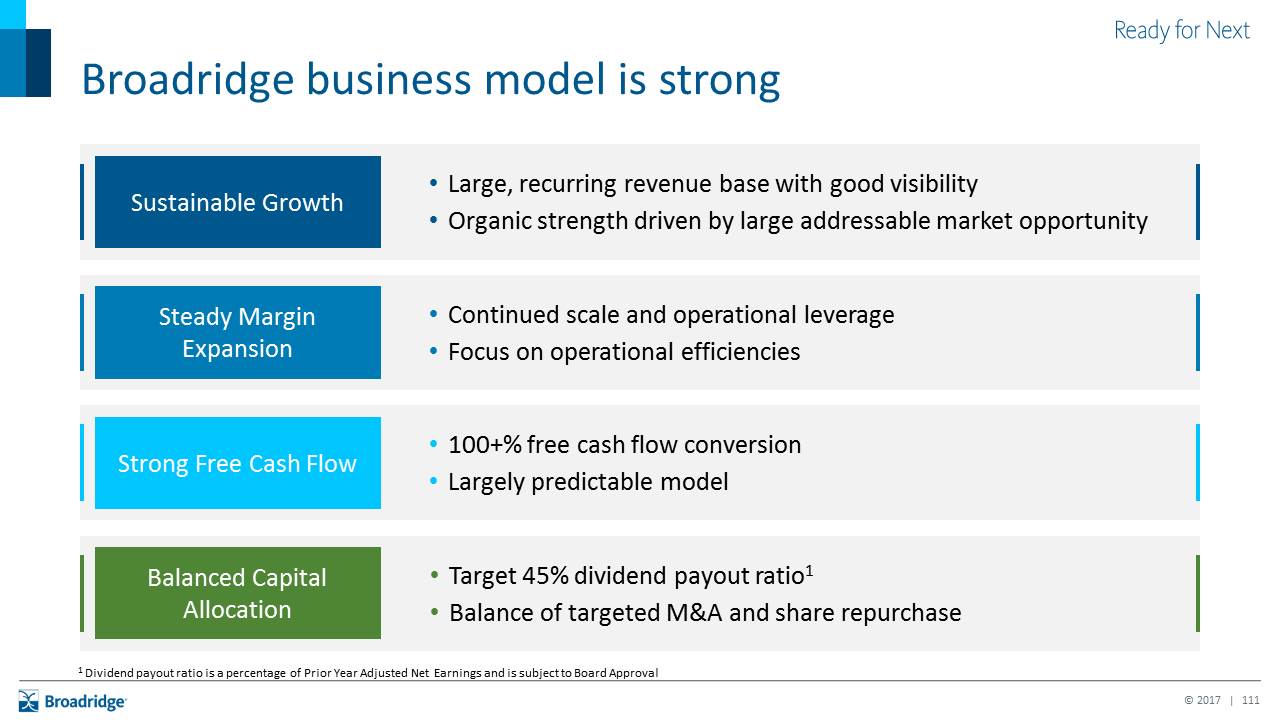
Broadridge business model is strong Sustainable Growth Large, recurring revenue base with good visibilityOrganic strength driven by large addressable market opportunity Steady Margin Expansion Continued scale and operational leverageFocus on operational efficiencies Strong Free Cash Flow 100+% free cash flow conversionLargely predictable model Balanced Capital Allocation Target 45% dividend payout ratio1Balance of targeted M&A and share repurchase 1 Dividend payout ratio is a percentage of Prior Year Adjusted Net Earnings and is subject to Board Approval

High quality revenue stream $4.1B Total FY17 Revenues Event-Driven Fee (5%) ~$200MAnnual Average (FY15-FY17) $0.2B Distribution (38%) <10% Gross Margin $1.6B Recurring Fee (59%) 14% CAGR (FY14-17) 6 yrsAverage Contract Length 5% Organic CAGR (FY14-17) 98% Revenue Retention Rate $2.5B Note: Revenue components and percentages based on FY17 results unless shown as a multi-year average or on a CAGR basis. Recurring Fee, Event-Driven Fee and Distribution exclude the impact of FX and Other.
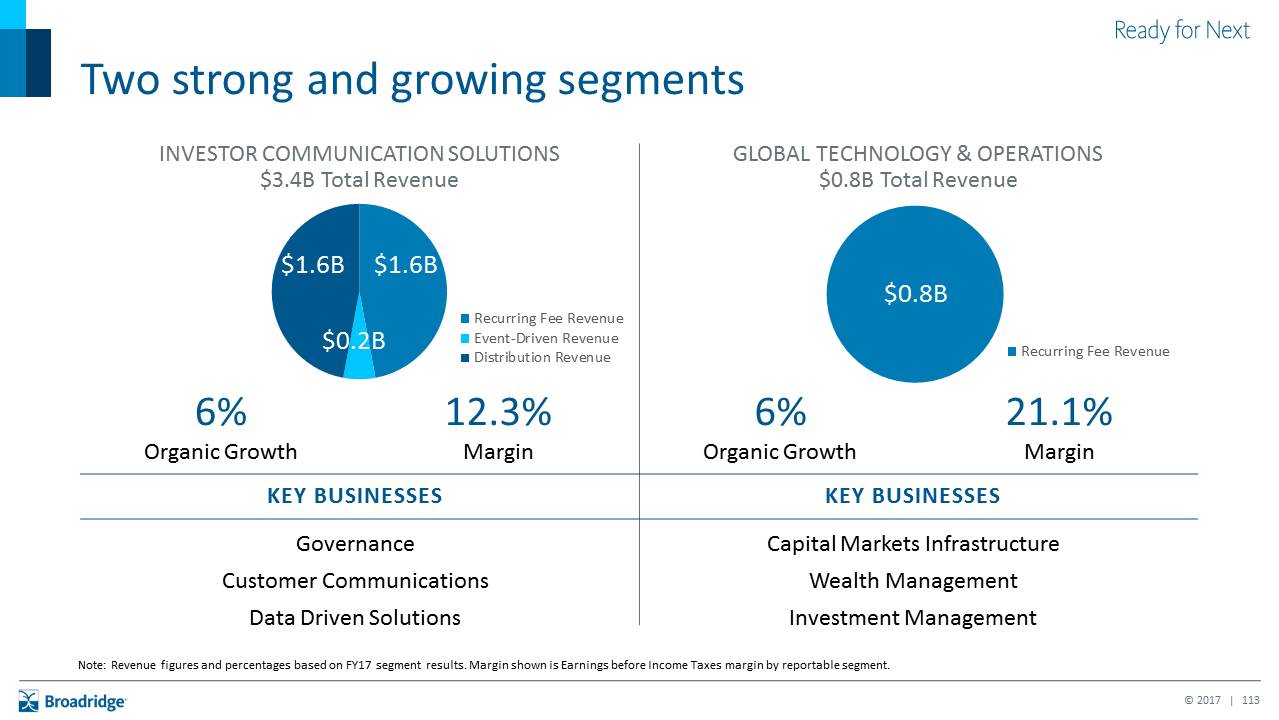
Two strong and growing segments INVESTOR COMMUNICATION SOLUTIONS $3.4B Total Revenue $0.2B 12.3%Margin 6%Organic Growth Key Businesses Key Businesses GovernanceCustomer CommunicationsData Driven Solutions Capital Markets InfrastructureWealth ManagementInvestment Management 21.1%Margin 6%Organic Growth $0.8B $1.6B $1.6B GLOBAL TECHNOLOGY & OPERATIONS$0.8B Total Revenue Note: Revenue figures and percentages based on FY17 segment results. Margin shown is Earnings before Income Taxes margin by reportable segment.
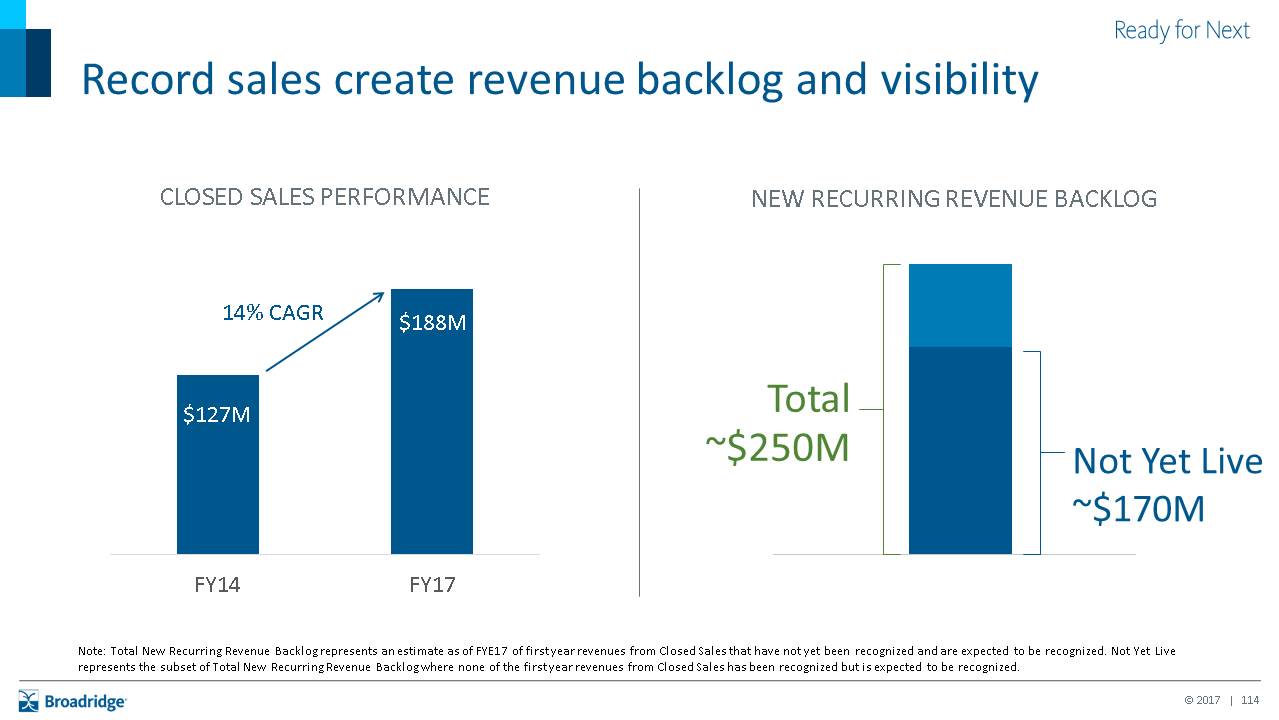
Record sales create revenue backlog and visibility CLOSED SALES PERFORMANCE NEW RECURRING REVENUE BACKLOG 14% CAGR Total~$250M Not Yet Live~$170M Note: Total New Recurring Revenue Backlog represents an estimate as of FYE17 of first year revenues from Closed Sales that have not yet been recognized and are expected to be recognized. Not Yet Live represents the subset of Total New Recurring Revenue Backlog where none of the first year revenues from Closed Sales has been recognized but is expected to be recognized.
Record sales create rvenue backlog and visibility CLOSED SALES PERFORMANCE NEW RECURRING REVENUE BACKLOG 14% CAGR Total~$250M Not Yet Live~$170M Note: Total New Recurring Revenue Backlog represents an estimate as of FYE17 of first year revenues from Closed Sales that have not yet been recognized and are expected to be recognized. Not Yet Live represents the subset of Total New Recurring Revenue Backlog where none of the first year revenues from Closed Sales has been recognized but is expected to be recognized.
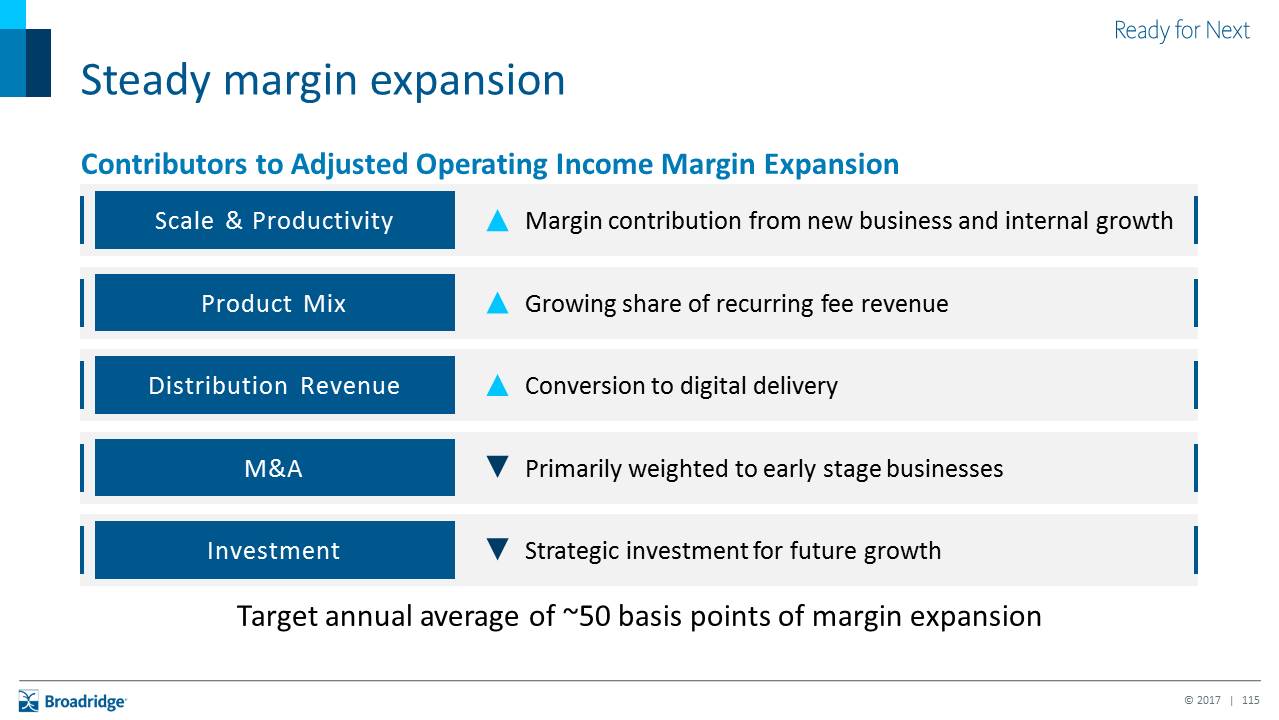
Steady margin expansion Contributors to Adjusted Operating Income Margin Expansion Scale & Productivity ▲ Margin contribution from new business and internal growth Product Mix ▲ Growing share of recurring fee revenue Distribution Revenue ▲ Conversion to digital delivery M&A ▼ Primarily weighted to early stage businesses Investment ▼ Strategic investment for future growth Target annual average of ~50 basis points of margin expansion

Free cash flow strength and predictability FY17 Free cash flow as a % of Adjusted Net earnings High Conversion 106% Low Capital Intensity FY17 Capital expenditures as % of total Revenue 2.7% Note: Free cash flow and Adjusted Net earnings are Non-GAAP measures. See Appendix for reconciliation of Non-GAAP to GAAP figures
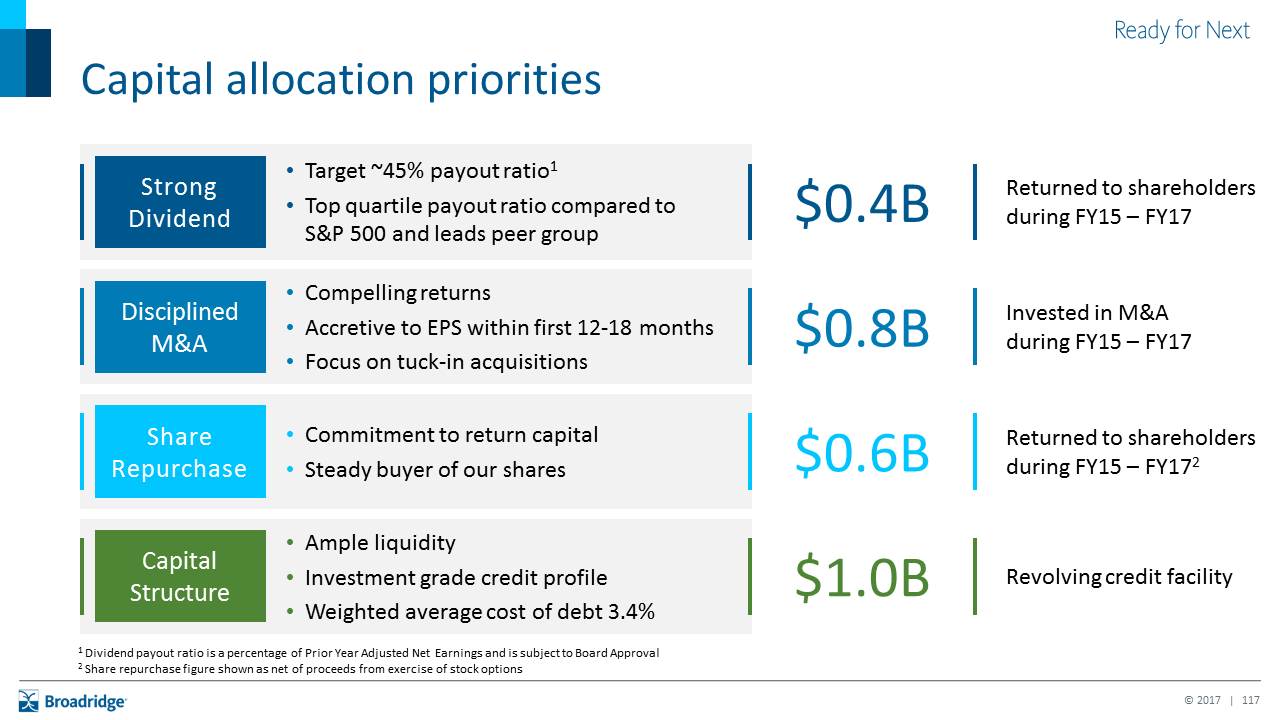
Capital allocation priorities Strong Dividend Target ~45% payout ratio1Top quartile payout ratio compared toS&P 500 and leads peer group $0.4B Returned to shareholders during FY15 – FY17 Disciplined M&A $0.8B Compelling returnsAccretive to EPS within first 12-18 monthsFocus on tuck-in acquisitions Invested in M&A during FY15 – FY17 Share Repurchase Commitment to return capitalSteady buyer of our shares $0.6B Returned to shareholders during FY15 – FY172 Capital Structure $1.0B Ample liquidity Investment grade credit profileWeighted average cost of debt 3.4% Revolving credit facility 1 Dividend payout ratio is a percentage of Prior Year Adjusted Net Earnings and is subject to Board Approval 2 Share repurchase figure shown as net of proceeds from exercise of stock options
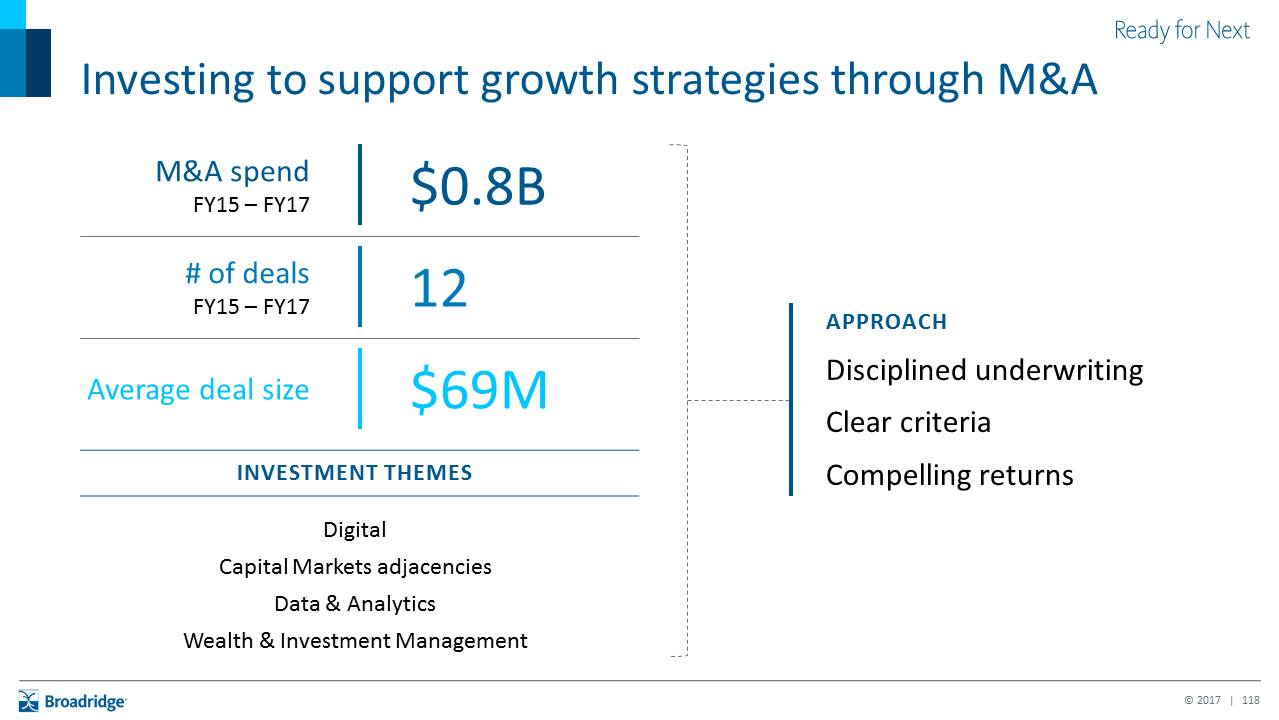
Investing to support growth strategies through M&A Investment Themes Digital Capital Markets adjacenciesData & AnalyticsWealth & Investment Management $0.8B M&A spend FY15 – FY17 12 # of deals FY15 – FY17 $69M Average deal size APPROACHDisciplined underwritingClear criteriaCompelling returns
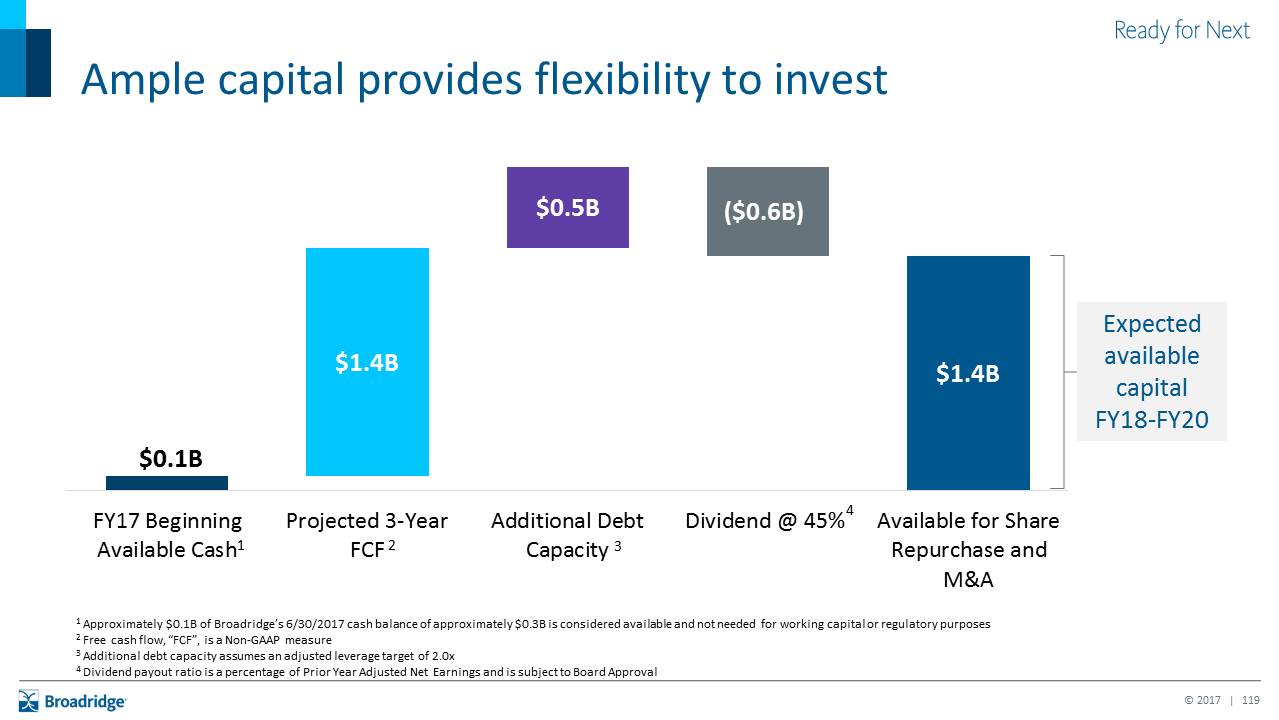
Ample capital provides flexibility to invest Expected available capital FY18-FY20 $0.1B 1 2 3 4 1 Approximately $0.1B of Broadridge’s 6/30/2017 cash balance of approximately $0.3B is considered available and not needed for working capital or regulatory purposes2 Free cash flow, “FCF”, is a Non-GAAP measure3 Additional debt capacity assumes an adjusted leverage target of 2.0x4 Dividend payout ratio is a percentage of Prior Year Adjusted Net Earnings and is subject to Board Approval
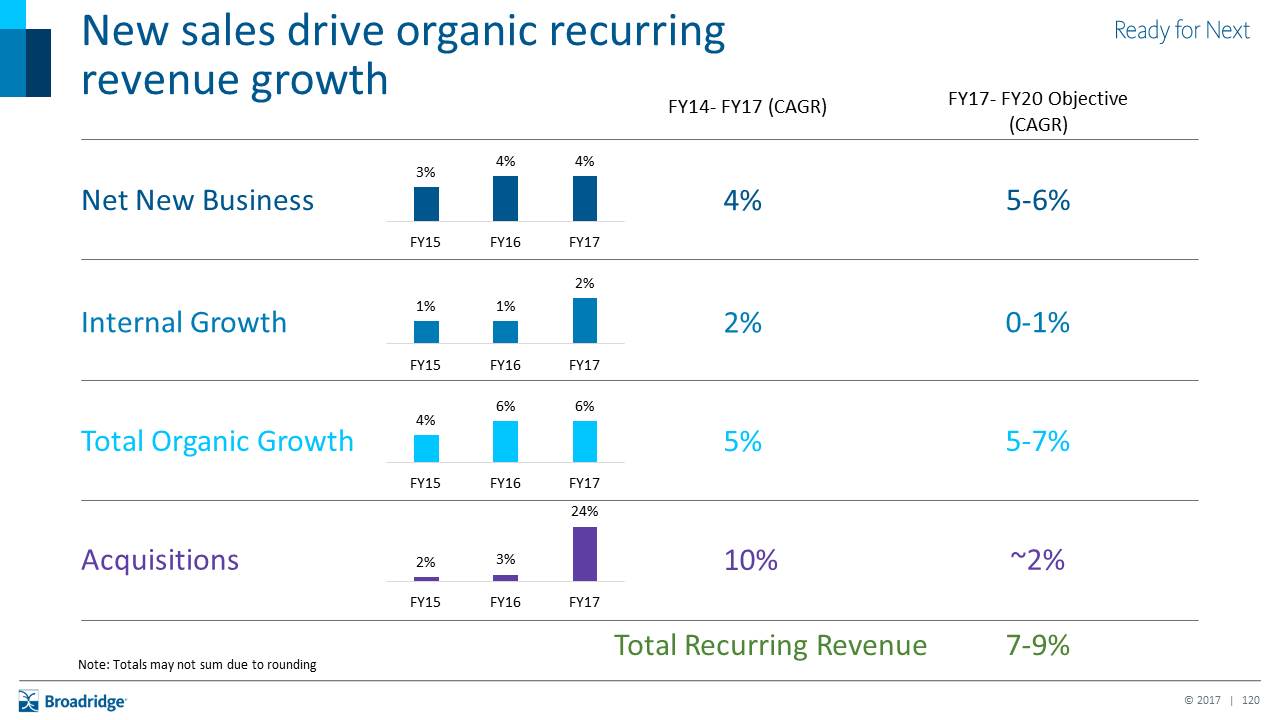
New sales drive organic recurring revenue growth Net New Business Internal Growth Total Organic Growth Acquisitions 5-6% FY17- FY20 Objective (CAGR) 0-1% 5-7% ~2% Total Recurring Revenue 7-9% 4% 2% 5% 10% FY14- FY17 (CAGR) Note: Totals may not sum due to rounding
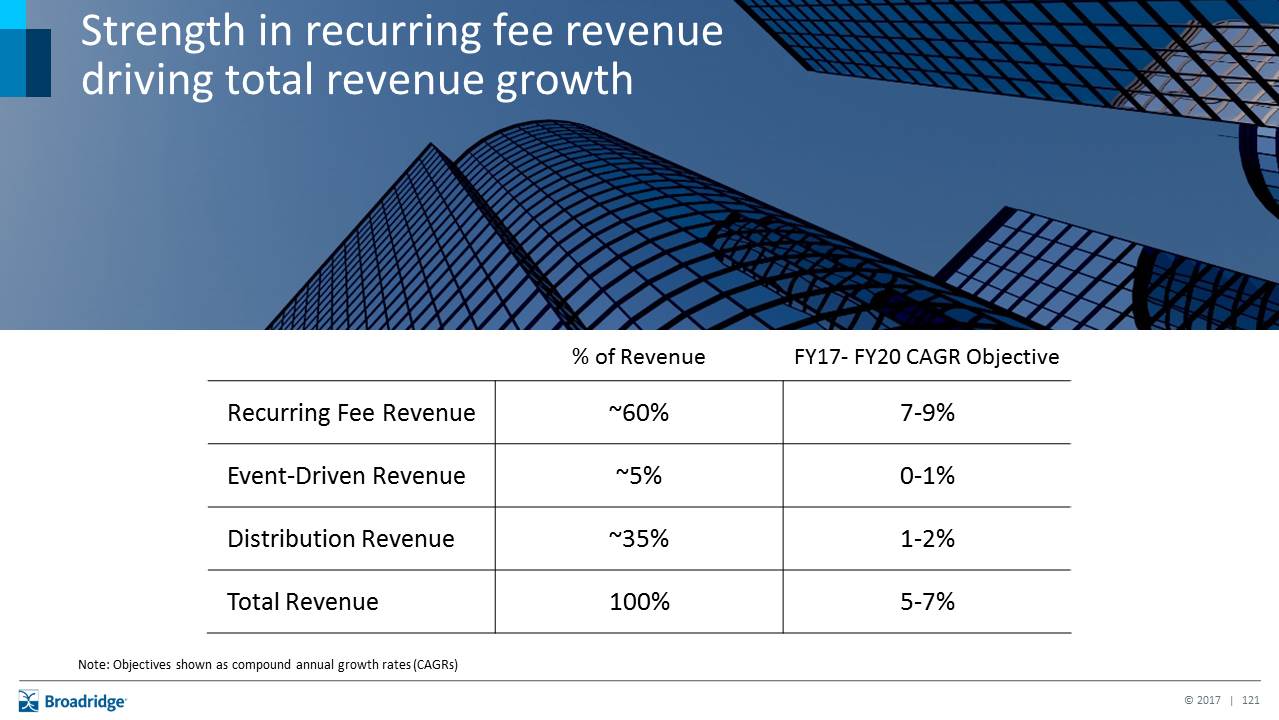
Strength in recurring fee revenue driving total revenue growth % of Revenue FY17- FY20 CAGR Objective Recurring Fee Revenue ~60% 7-9% Event-Driven Revenue ~5% 0-1% Distribution Revenue ~35% 1-2% Total Revenue 100% 5-7% Note: Objectives shown as compound annual growth rates (CAGRs)
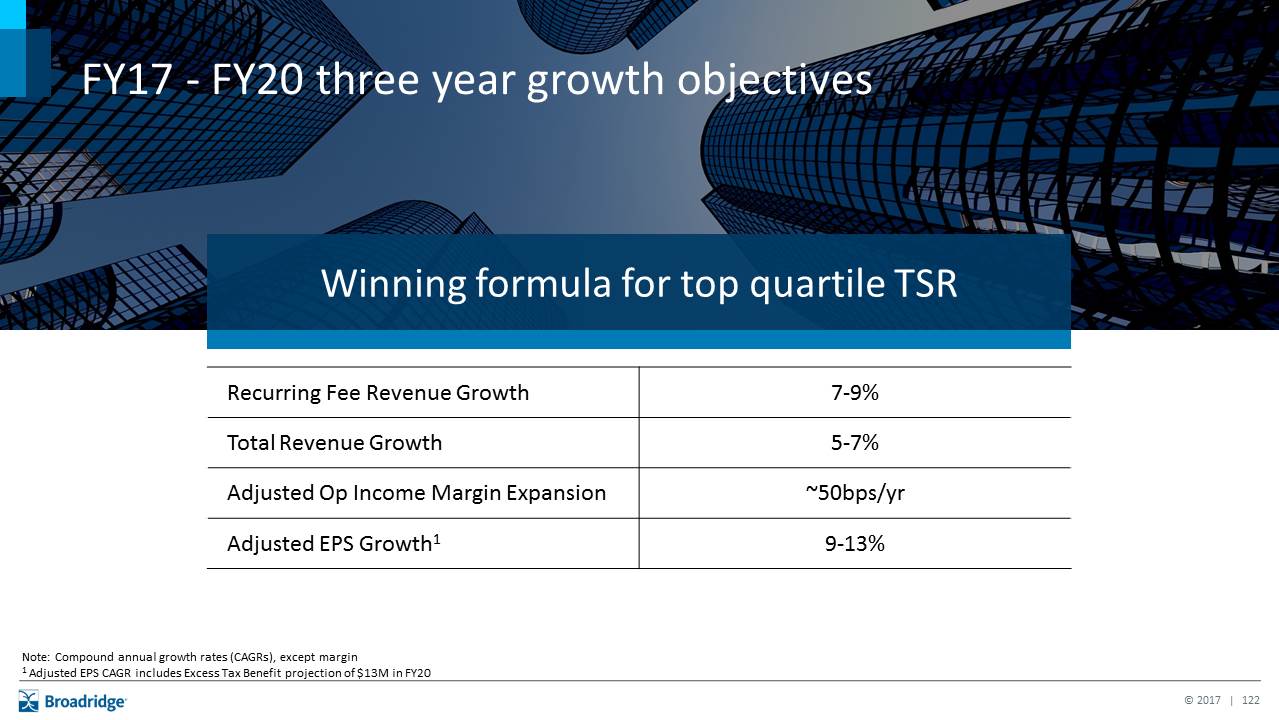
Recurring Fee Revenue Growth 7-9% Total Revenue Growth 5-7% Adjusted Op Income Margin Expansion ~50bps/yr Adjusted EPS Growth1 9-13% Winning formula for top quartile TSR FY17 - FY20 three year growth objectives Note: Compound annual growth rates (CAGRs), except margin1 Adjusted EPS CAGR includes Excess Tax Benefit projection of $13M in FY20
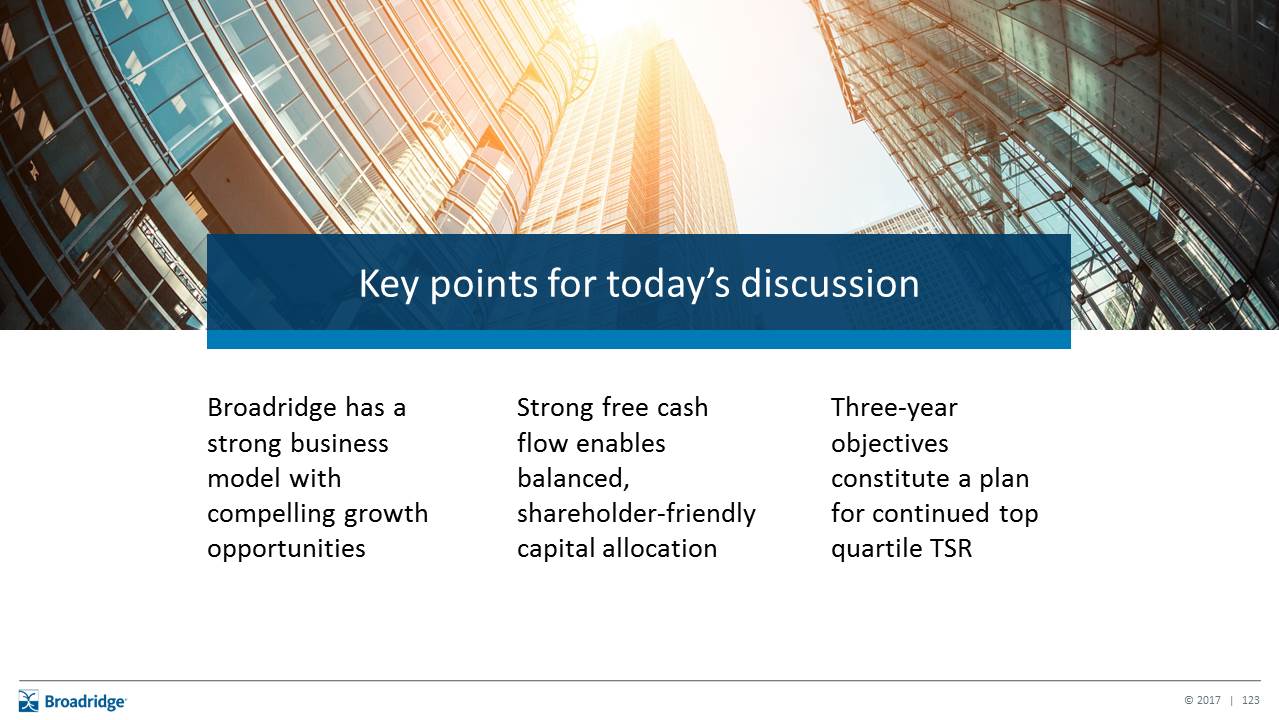
Key points for today’s discussion Broadridge has a strong business model with compelling growth opportunities Strong free cash flow enables balanced, shareholder-friendly capital allocation Three-year objectives constitute a plan for continued top quartile TSR
Conclusion Rich DalyChief Executive Officer
Core Governance and Capital Markets franchises poised for sustained growth Broadridge is Ready For Next Well-positioned to address tangible and compelling additional growth opportunities Strong financial model focused on delivering top quartile total shareholder returns through 2020 and beyond
Q&A
Appendix
Use of Non-GAAP Financial Measures Explanation and Reconciliation of the Company’s Use of Non-GAAP Financial MeasuresThe Company’s results in the Broadridge 2017 Investor Day presentations are presented in accordance with U.S. generally accepted accounting principles ("GAAP") except where otherwise noted. In certain circumstances, results have been presented that are not generally accepted accounting principles measures (“Non-GAAP”). These Non-GAAP measures are Adjusted Operating income, Adjusted Operating income margin, Adjusted Net earnings, Adjusted earnings per share, and Free cash flow. These Non-GAAP financial measures should be viewed in addition to, and not as a substitute for, the Company’s reported results.The Company believes its Non-GAAP financial measures help investors understand how management plans, measures and evaluates the Company’s business performance. Management believes that Non-GAAP measures provide consistency in its financial reporting and facilitates investors’ understanding of the Company’s operating results and trends by providing an additional basis for comparison. Management uses these Non-GAAP financial measures to, among other things, evaluate the Company's ongoing operations, for internal planning and forecasting purposes and in the calculation of performance-based compensation. In addition, and as a consequence of the importance of these Non-GAAP financial measures in managing its business, the Company’s Compensation Committee of the Board of Directors incorporates Non-GAAP financial measures in the evaluation process for determining management compensation.Adjusted Operating Income, Adjusted Operating Income Margin, Adjusted Net Earnings and Adjusted Earnings per ShareThese Non-GAAP measures reflect Operating income, Operating income margin, Net earnings, and Diluted earnings per share, as adjusted to exclude the impact of certain costs, expenses, gains and losses and other specified items that management believes are not indicative of our ongoing operating performance. These adjusted measures exclude the impact of Amortization of Acquired Intangibles and Purchased Intellectual Property, Acquisition and Integration Costs and the Message Automation Limited (“MAL”) investment gain. Amortization of Acquired Intangibles and Purchased Intellectual Property represents non-cash expenses associated with the Company's acquisition activities. Acquisition and Integration Costs represent certain transaction and integration costs associated with the Company’s acquisition activities. The MAL investment gain represents a non-cash, nontaxable gain on the Company’s 25% investment of shares of MAL. The Company excludes Amortization of Acquired Intangibles and Purchased Intellectual Property, Acquisition and Integration Costs and the MAL investment gain from these measures because excluding such information provides the Company with an understanding of the results from the primary operations of its business and these items do not reflect ordinary operations or earnings. Management believes these measures may be useful to an investor in evaluating the underlying operating performance of the Company's business.Free Cash FlowIn addition to the Non-GAAP financial measures discussed above, we provide Free cash flow information because we consider Free cash flow to be a liquidity measure that provides useful information to management and investors about the amount of cash generated that could be used for dividends, share repurchases, strategic acquisitions, other investments, as well as debt servicing. Free cash flow is a Non-GAAP financial measure and is defined by the Company as Net cash flows provided by operating activities less Capital expenditures as well as Software purchases and capitalized internal use software.Reconciliations of our historical Non-GAAP measures to the most directly comparable financial measures presented in accordance with GAAP can be found in the following tables.
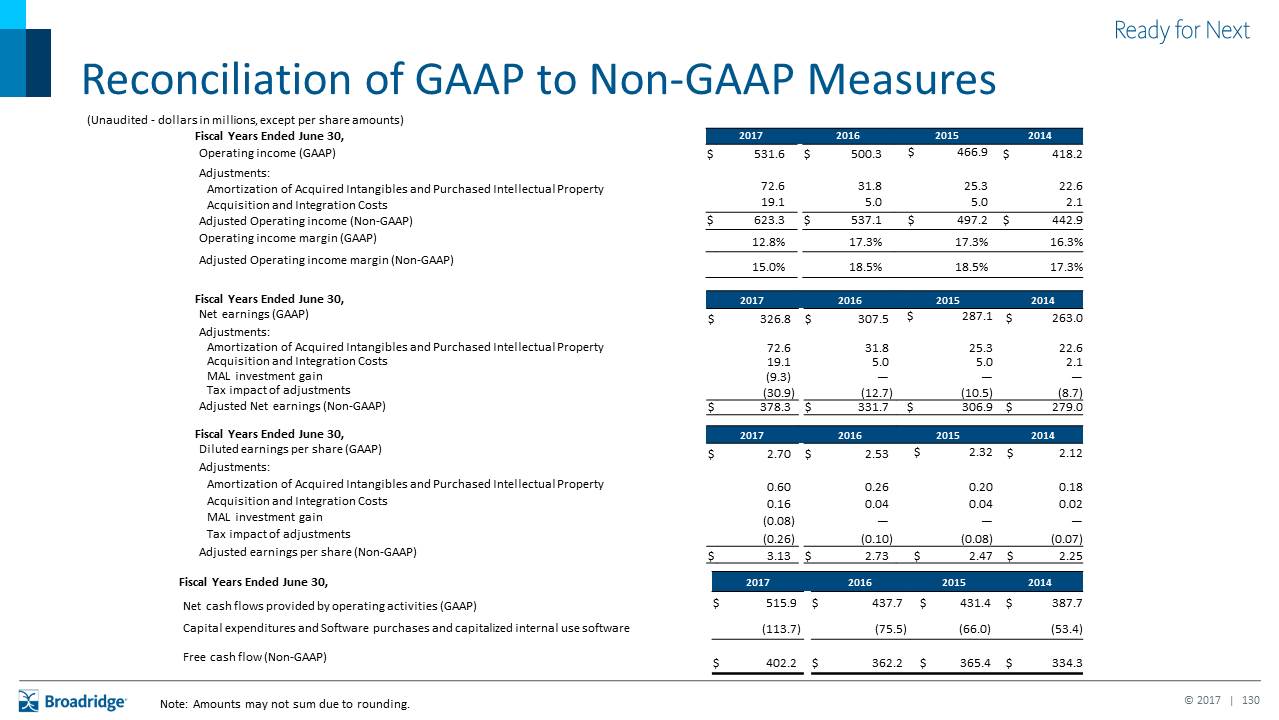
Reconciliation of GAAP to Non-GAAP Measures (Unaudited - dollars in millions, except per share amounts) Fiscal Years Ended June 30, 2017 2017 2016 2016 2015 2014 Operating income (GAAP) $ 531.6 $ 500.3 $ 466.9 $ 418.2 Adjustments: Amortization of Acquired Intangibles and Purchased Intellectual Property 72.6 31.8 25.3 22.6 Acquisition and Integration Costs 19.1 5.0 5.0 2.1 Adjusted Operating income (Non-GAAP) $ 623.3 $ 537.1 $ 497.2 $ 442.9 Operating income margin (GAAP) 12.8% 17.3% 17.3% 16.3% Adjusted Operating income margin (Non-GAAP) 15.0% 18.5% 18.5% 17.3% Fiscal Years Ended June 30, 2017 2017 2016 2016 2015 2014 Net earnings (GAAP) $ 326.8 $ 307.5 $ 287.1 $ 263.0 Adjustments: Amortization of Acquired Intangibles and Purchased Intellectual Property 72.6 31.8 25.3 22.6 Acquisition and Integration Costs 19.1 5.0 5.0 2.1 MAL investment gain (9.3) — — — Tax impact of adjustments (30.9 ) (12.7 ) (10.5) (8.7) Adjusted Net earnings (Non-GAAP) $ 378.3 $ 331.7 $ 306.9 $ 279.0 Fiscal Years Ended June 30, 2017 2017 2016 2016 2015 2014 Diluted earnings per share (GAAP) $ 2.70 $ 2.53 $ 2.32 $ 2.12 Adjustments: Amortization of Acquired Intangibles and Purchased Intellectual Property 0.60 0.26 0.20 0.18 Acquisition and Integration Costs 0.16 0.04 0.04 0.02 MAL investment gain (0.08 ) — — — Tax impact of adjustments (0.26 ) (0.10 ) (0.08) (0.07) Adjusted earnings per share (Non-GAAP) $ 3.13 $ 2.73 $ 2.47 $ 2.25 Fiscal Years Ended June 30, 2017 2017 2016 2016 2015 2014 Net cash flows provided by operating activities (GAAP) $ 515.9 $ 437.7 $ 431.4 $ 387.7 Capital expenditures and Software purchases and capitalized internal use software (113.7 ) (75.5 ) (66.0) (53.4) Free cash flow (Non-GAAP) $ 402.2 $ 362.2 $ 365.4 $ 334.3 Note: Amounts may not sum due to rounding.