EXHIBIT 99.1
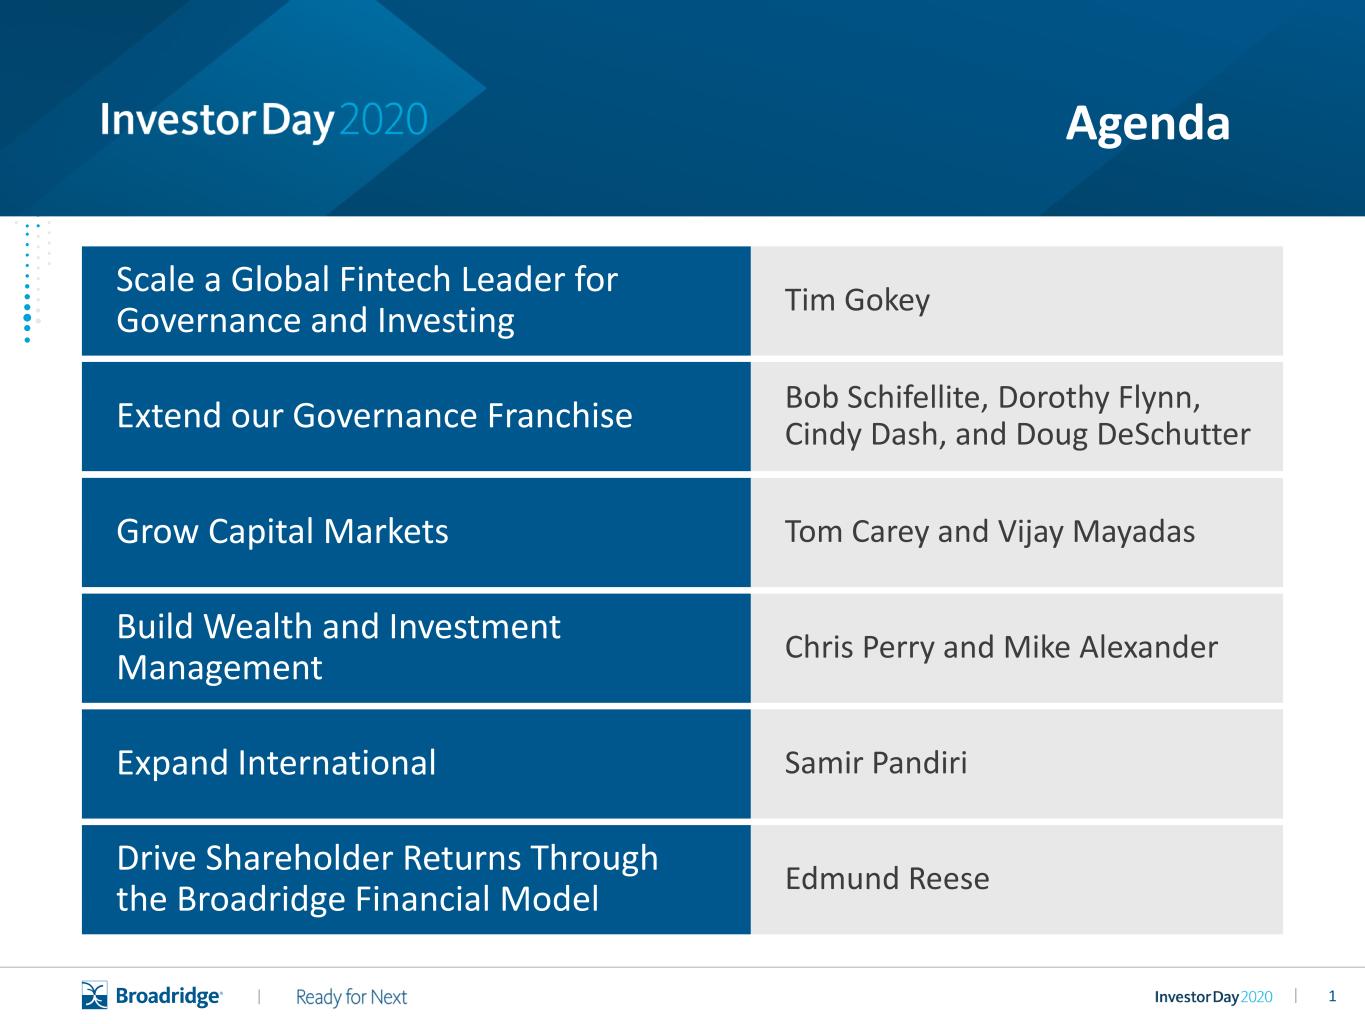
1|| Tim Gokey Bob Schifellite, Dorothy Flynn, Cindy Dash, and Doug DeSchutter Tom Carey and Vijay Mayadas Chris Perry and Mike Alexander Samir Pandiri Edmund Reese Scale a Global Fintech Leader for Governance and Investing Grow Capital Markets Build Wealth and Investment Management Extend our Governance Franchise Expand International Drive Shareholder Returns Through the Broadridge Financial Model Agenda
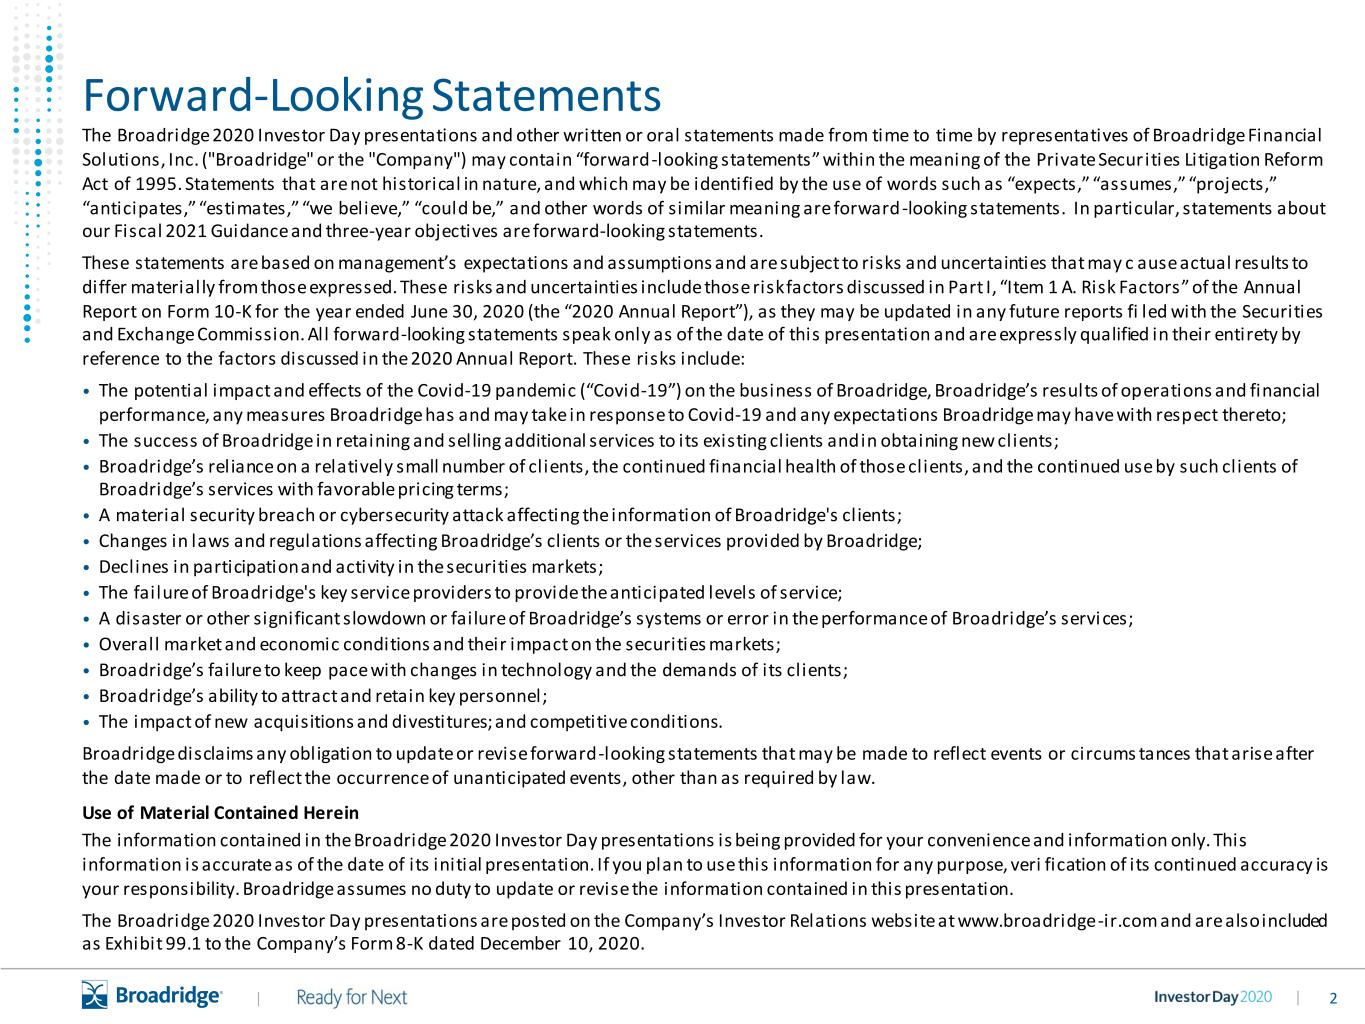
2|| Forward-Looking Statements The Broadridge 2020 Investor Day presentations and other written or oral statements made from time to time by representatives of Broadridge Financial Solutions, Inc. ("Broadridge" or the "Company") may contain “forward -looking statements” within the meaning of the Private Secur ities Litigation Reform Act of 1995. Statements that are not historical in nature, and which may be identified by the use of words such as “expects,” “assumes,” “projects,” “anticipates,” “estimates,” “we believe,” “could be,” and other words of similar meaning are forward -looking statements. In particular, statements about our Fiscal 2021 Guidance and three-year objectives are forward-looking statements. These statements are based on management’s expectations and assumptions and are subject to risks and uncertainties that may c ause actual results to differ materially from those expressed. These risks and uncertainties include those risk factors discussed in Part I, “Item 1 A. Risk Factors” of the Annual Report on Form 10-K for the year ended June 30, 2020 (the “2020 Annual Report”), as they may be updated in any future reports fi led with the Securities and Exchange Commission. All forward-looking statements speak only as of the date of this presentation and are expressly qualified in their entirety by reference to the factors discussed in the 2020 Annual Report. These risks include: • The potential impact and effects of the Covid-19 pandemic (“Covid-19”) on the business of Broadridge, Broadridge’s results of operations and financial performance, any measures Broadridge has and may take in response to Covid-19 and any expectations Broadridge may have with respect thereto; • The success of Broadridge in retaining and selling additional services to its existing clients and in obtaining new clients; • Broadridge’s reliance on a relatively small number of clients, the continued financial health of those clients, and the continued use by such clients of Broadridge’s services with favorable pricing terms; • A material security breach or cybersecurity attack affecting the information of Broadridge's clients; • Changes in laws and regulations affecting Broadridge’s clients or the services provided by Broadridge; • Declines in participation and activity in the securities markets; • The failure of Broadridge's key service providers to provide the anticipated levels of service; • A disaster or other significant slowdown or failure of Broadridge’s systems or error in the performance of Broadridge’s services; • Overall market and economic conditions and their impact on the securities markets; • Broadridge’s failure to keep pace with changes in technology and the demands of its clients; • Broadridge’s ability to attract and retain key personnel; • The impact of new acquisitions and divestitures; and competitive conditions. Broadridge disclaims any obligation to update or revise forward-looking statements that may be made to reflect events or circums tances that arise after the date made or to reflect the occurrence of unanticipated events, other than as required by law. Use of Material Contained Herein The information contained in the Broadridge 2020 Investor Day presentations is being provided for your convenience and information only. This information is accurate as of the date of its initial presentation. If you plan to use this information for any purpose, veri fication of its continued accuracy is your responsibility. Broadridge assumes no duty to update or revise the information contained in this presentation. The Broadridge 2020 Investor Day presentations are posted on the Company’s Investor Relations website at www.broadridge-ir.com and are also included as Exhibit 99.1 to the Company’s Form 8-K dated December 10, 2020.
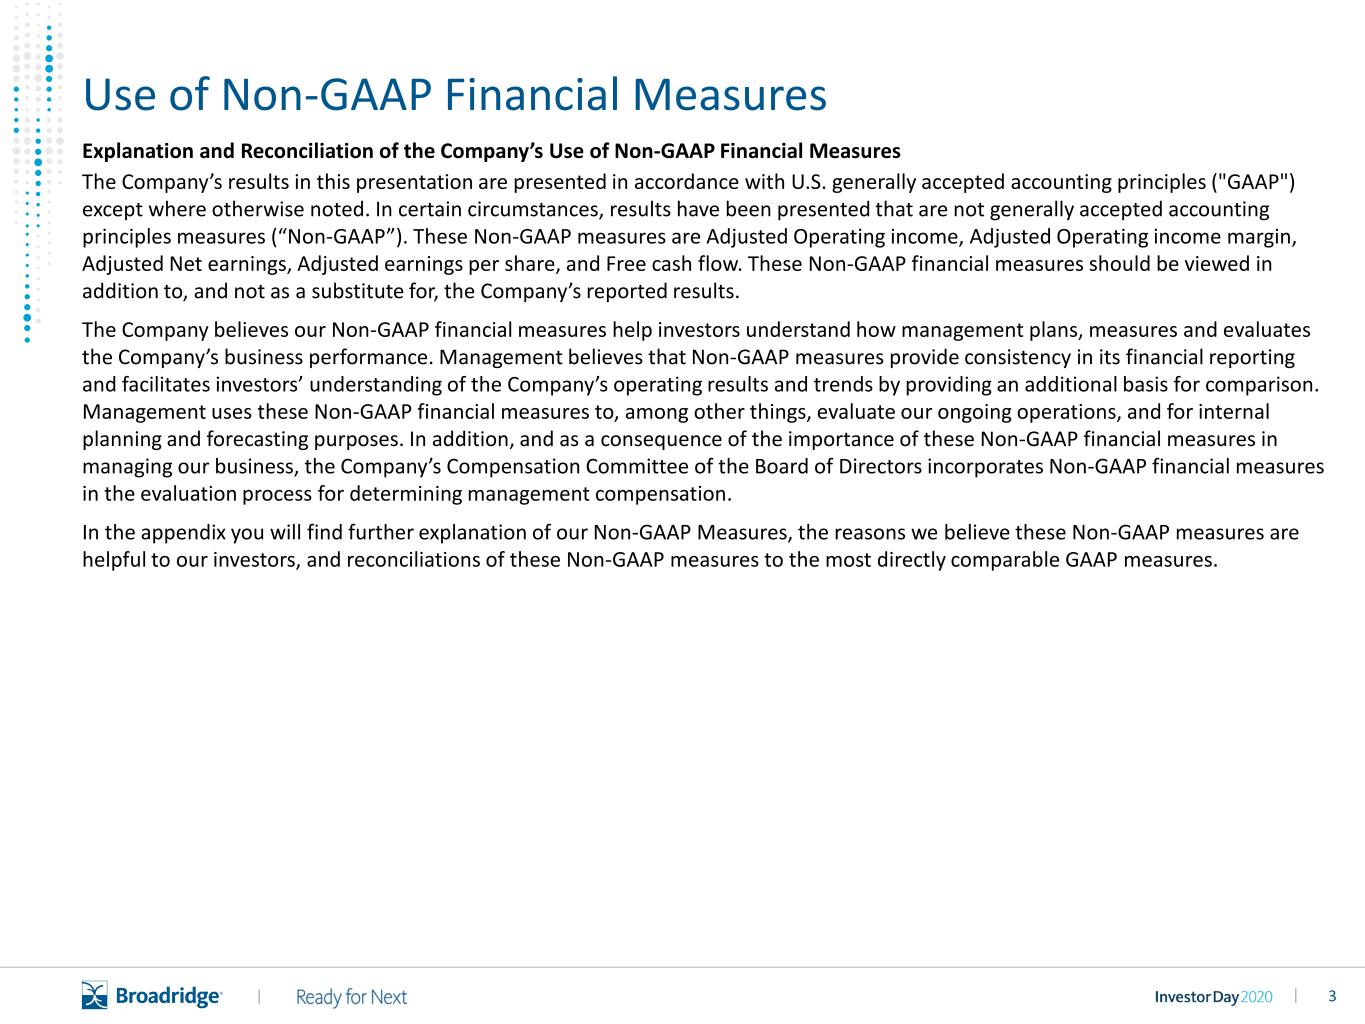
3|| Use of Non-GAAP Financial Measures Explanation and Reconciliation of the Company’s Use of Non-GAAP Financial Measures The Company’s results in this presentation are presented in accordance with U.S. generally accepted accounting principles ("GAAP") except where otherwise noted. In certain circumstances, results have been presented that are not generally accepted accounting principles measures (“Non-GAAP”). These Non-GAAP measures are Adjusted Operating income, Adjusted Operating income margin, Adjusted Net earnings, Adjusted earnings per share, and Free cash flow. These Non-GAAP financial measures should be viewed in addition to, and not as a substitute for, the Company’s reported results. The Company believes our Non-GAAP financial measures help investors understand how management plans, measures and evaluates the Company’s business performance. Management believes that Non-GAAP measures provide consistency in its financial reporting and facilitates investors’ understanding of the Company’s operating results and trends by providing an additional basis for comparison. Management uses these Non-GAAP financial measures to, among other things, evaluate our ongoing operations, and for internal planning and forecasting purposes. In addition, and as a consequence of the importance of these Non-GAAP financial measures in managing our business, the Company’s Compensation Committee of the Board of Directors incorporates Non-GAAP financial measures in the evaluation process for determining management compensation. In the appendix you will find further explanation of our Non-GAAP Measures, the reasons we believe these Non-GAAP measures are helpful to our investors, and reconciliations of these Non-GAAP measures to the most directly comparable GAAP measures.
4||
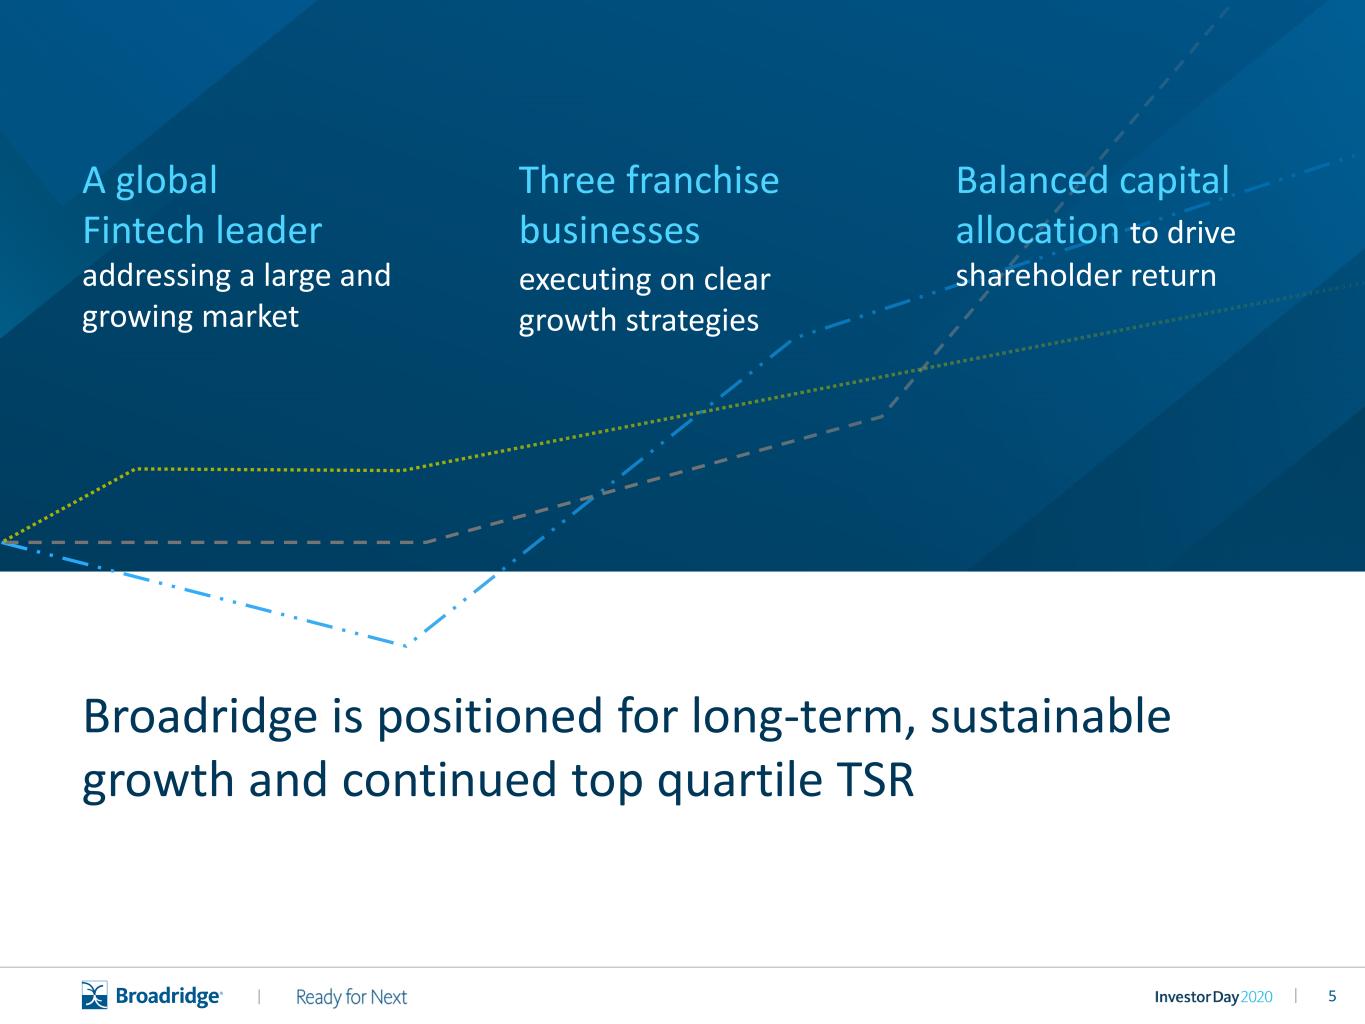
5|| Broadridge is positioned for long-term, sustainable growth and continued top quartile TSR A global Fintech leader addressing a large and growing market Balanced capital allocation to drive shareholder return Three franchise businesses executing on clear growth strategies

6|| Broadridge is a global Fintech leader Managing governance process for more than 80% of U.S. shares Powering $10T per day in fixed income and equity trades Distributing more than 6B critical communications each year 80% SHARES $10 TRILLION 6 BILLION Broadridge powers the critical infrastructure behind investing, governance, and communications

7|| We have a strong track record of delivering growth and value $1,642 $1,742 $1,897 $2,452 $2,612 $2,760 $3,036 $2.25 $2.47 $2.73 $3.13 $4.19 $4.66 $5.03 0 1 2 3 4 5 6 0 500 1000 1500 2000 2500 3000 3500 FY2014 FY2015 FY2016 FY2017 FY2018 FY2019 FY2020 Recurring revenue Adjusted EPS $M except for per share measures FY2014 - FY2020 CAGR 11% Recurring revenue 14% Adjusted EPS 23% Total Shareholder Return1 1. Annualized cumulative TSR per FactSet. Cumulative TSR formula assumes dividends are reinvested on the ex-date
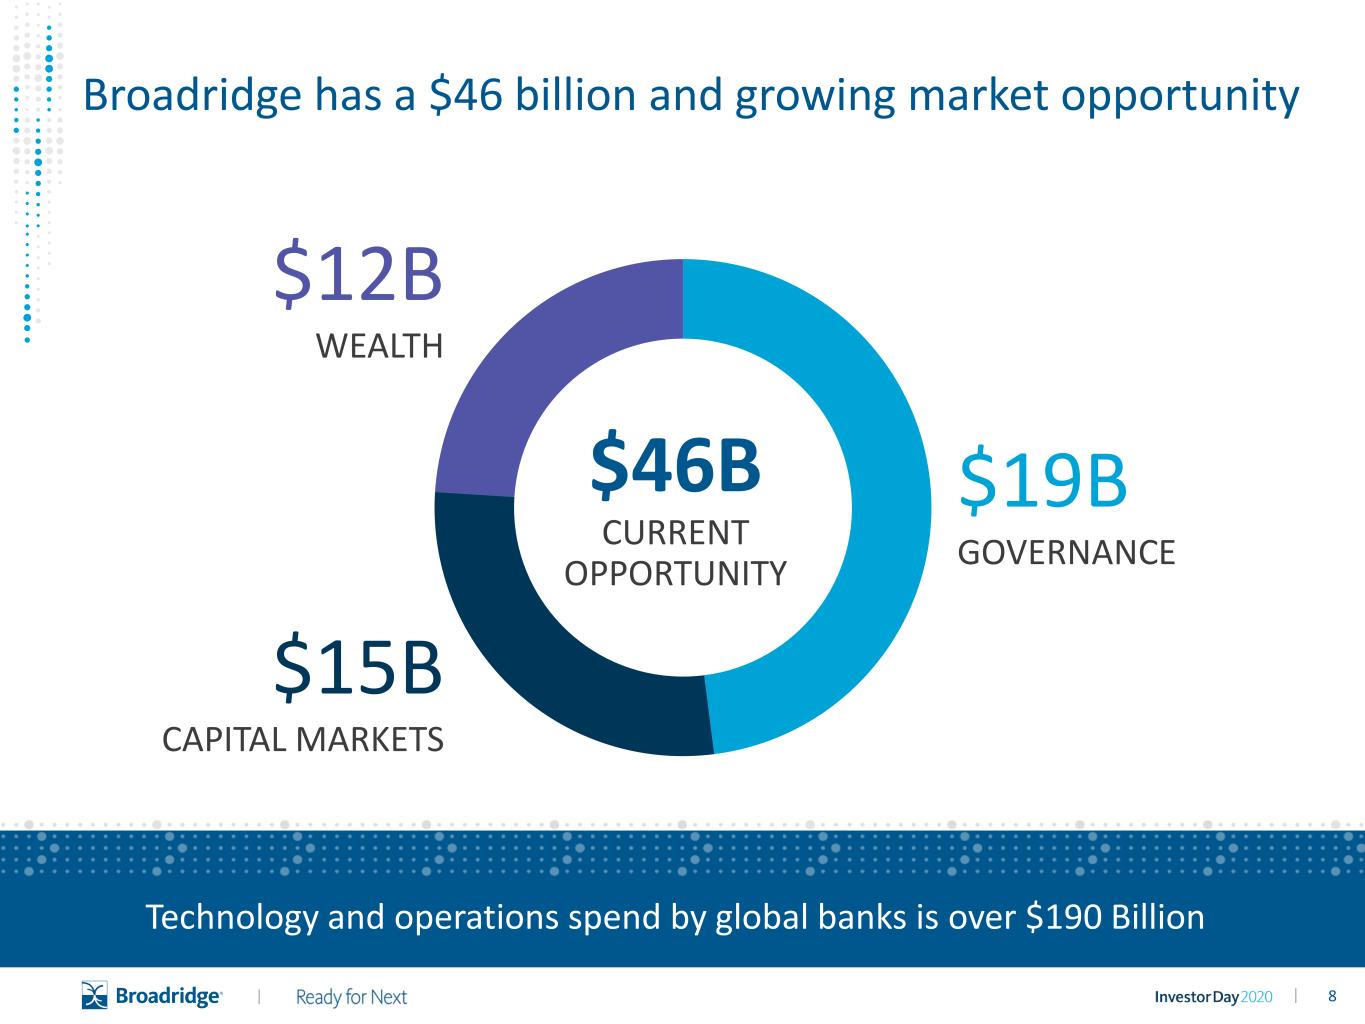
8|| Technology and operations spend by global banks is over $190 Billion Broadridge has a $46 billion and growing market opportunity $46B CURRENT OPPORTUNITY $19B GOVERNANCE $15B CAPITAL MARKETS $12B WEALTH

9|| Our growth is being driven by continued evolution of the financial services industry Commodization Passive investing AI Cloud Fintech startups REGULATION Mobile Zero commission trading Blockchain Managed accounts Digital communications Next-generation mutualization and resilience Digital transformation Data and network value
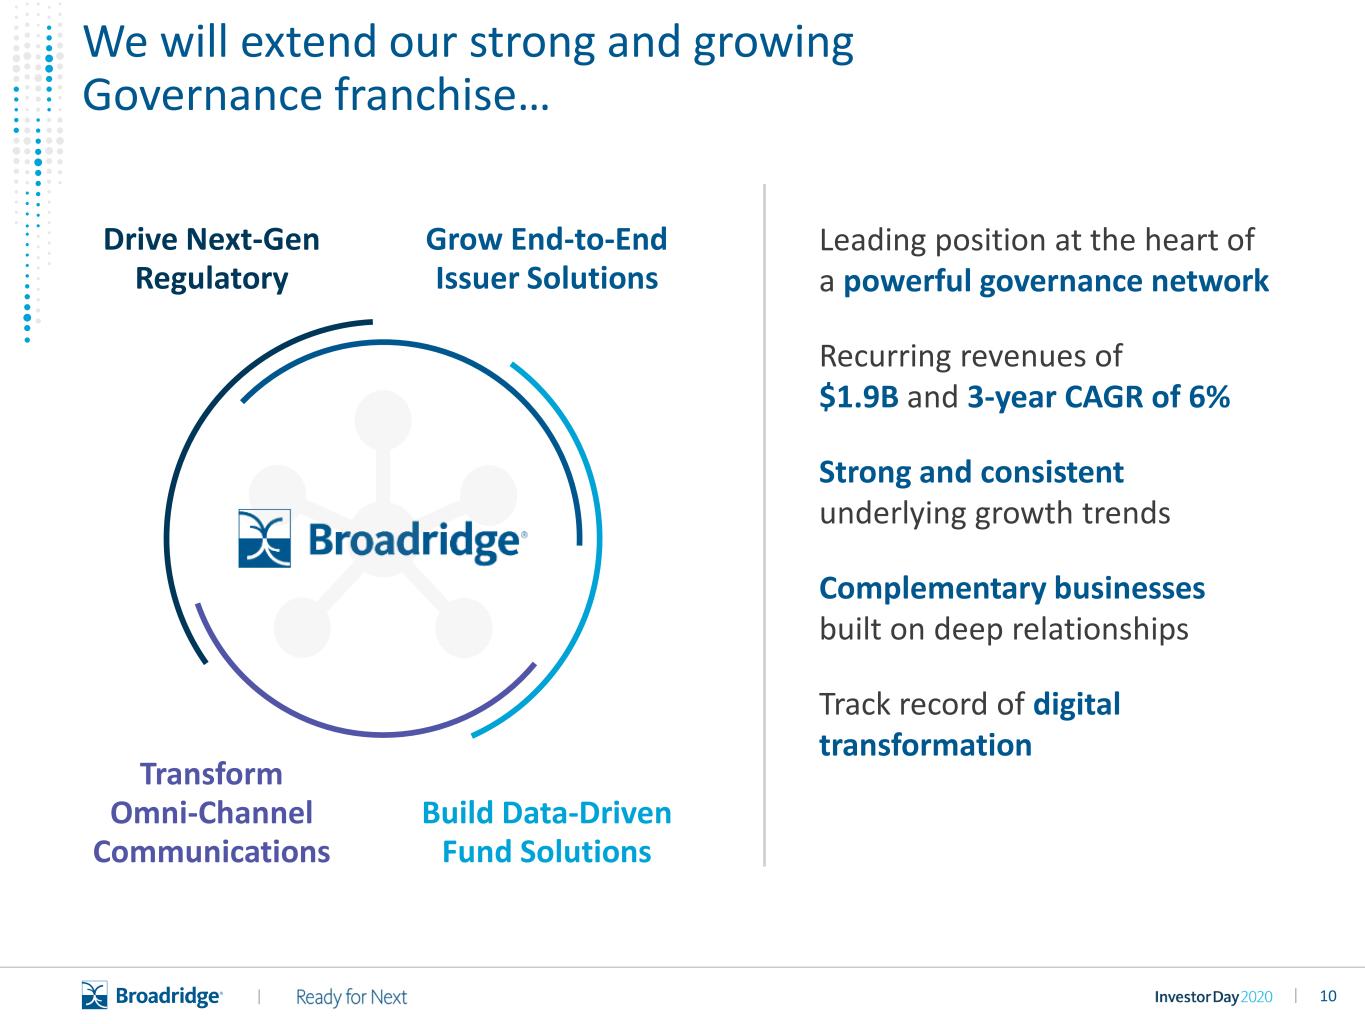
10|| We will extend our strong and growing Governance franchise… Grow End-to-End Issuer Solutions Build Data-Driven Fund Solutions Drive Next-Gen Regulatory Transform Omni-Channel Communications Leading position at the heart of a powerful governance network Recurring revenues of $1.9B and 3-year CAGR of 6% Strong and consistent underlying growth trends Complementary businesses built on deep relationships Track record of digital transformation
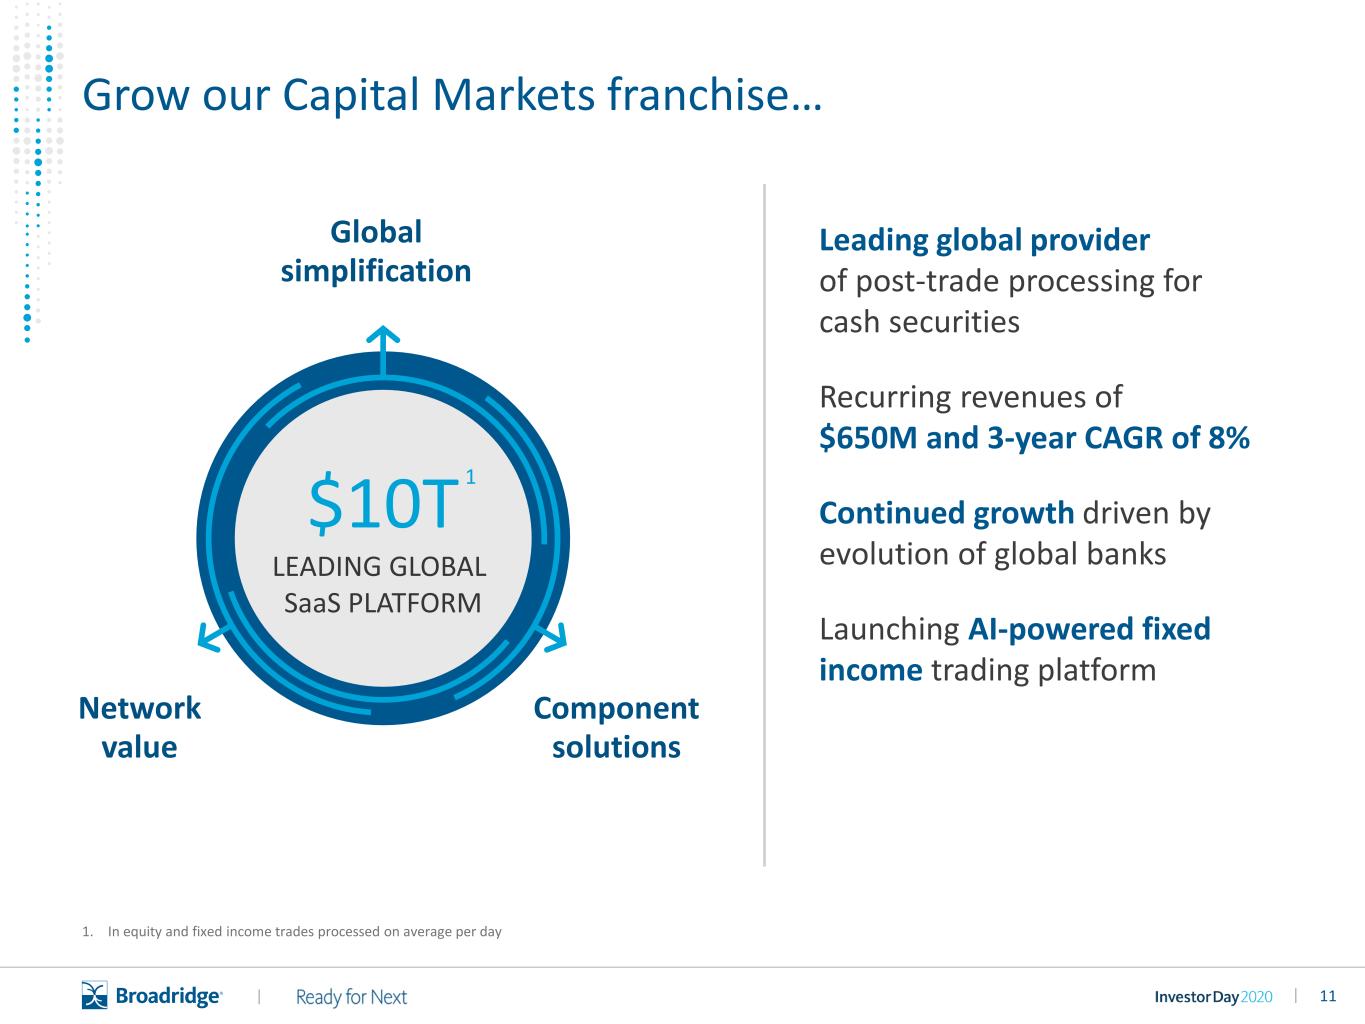
11|| Grow our Capital Markets franchise… Leading global provider of post-trade processing for cash securities Recurring revenues of $650M and 3-year CAGR of 8% Continued growth driven by evolution of global banks Launching AI-powered fixed income trading platform Component solutions Global simplification Network value $10T LEADING GLOBAL SaaS PLATFORM 1. In equity and fixed income trades processed on average per day 1

12|| …and continue building a next-generation Wealth & Investment Management franchise Leading provider of back office capabilities for North American wealth managers Strong set of differentiated component solutions for front- and middle-office Recurring revenues of $524M and 14% 3-year CAGR Launching the industry’s only unified front-back technology platform Growing our Integrated Investment Management Suite Front Office Middle Office Back Office BROADRIDGE WEALTH PLATFORM

13|| We are delivering next-generation technology and innovation to our clients Consistent investment in next-generation technology drives ongoing Innovation • APIs & Micro Services • Cloud First • Agile, Dev Ops approach • Ongoing platform modernization • Mutualization of our internal services • Driving inter-operability AI Blockchain Cloud Digital
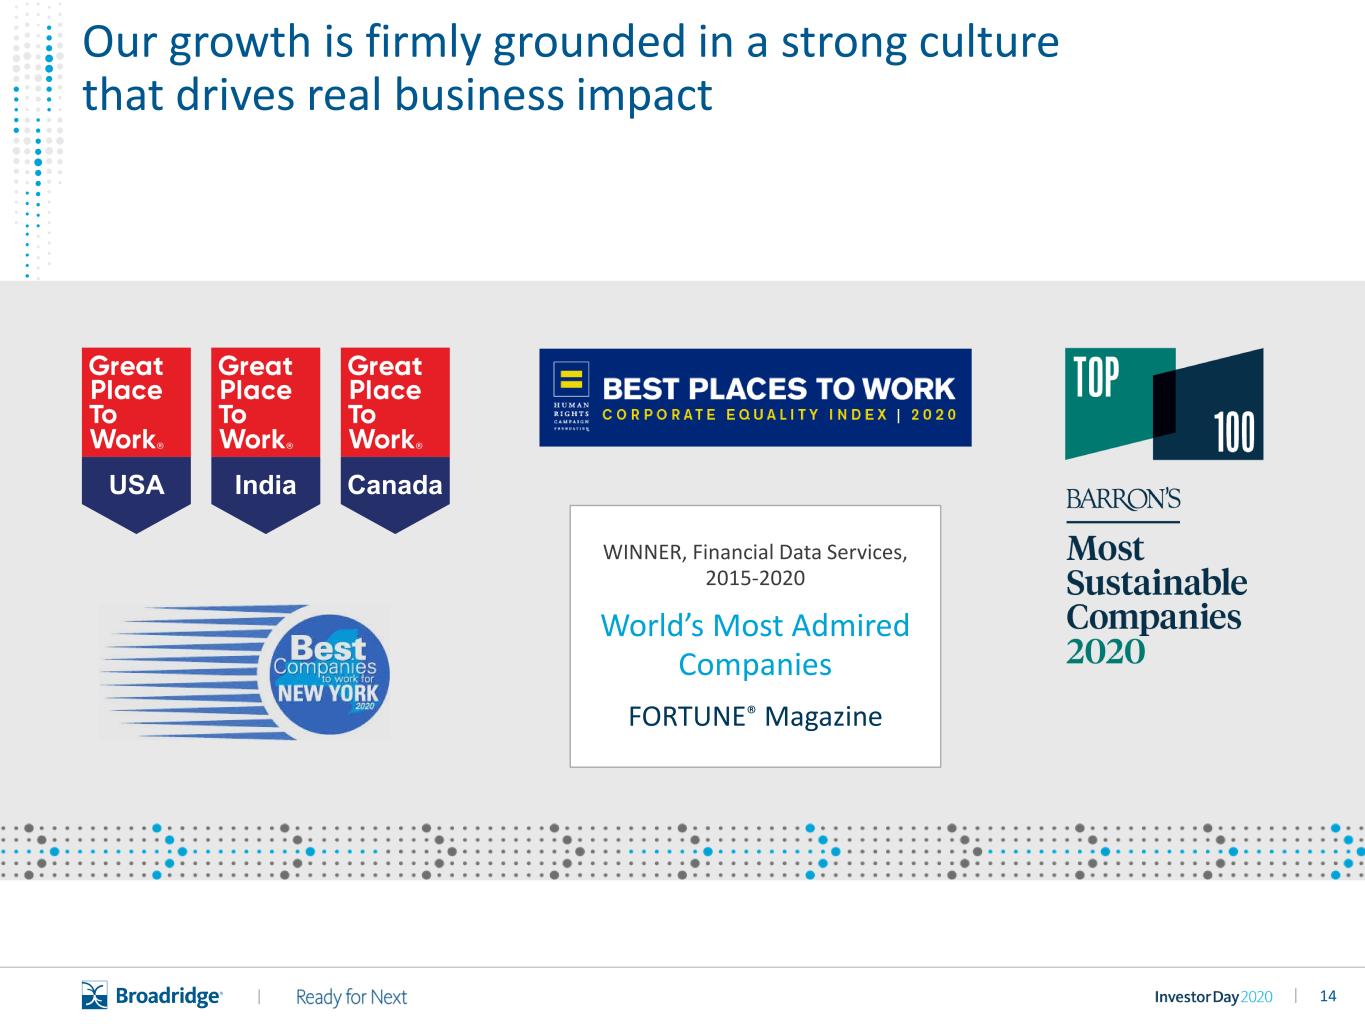
14|| Our growth is firmly grounded in a strong culture that drives real business impact WINNER, Financial Data Services, 2015-2020 World’s Most Admired Companies FORTUNE® Magazine USA India Canada
15|| $2.8B free cash flow $1.5B targeted M&A investment $2.3B returned to shareholders We remain committed to balanced, growth friendly capital allocation FY2015 – FY2020 SELECT SOURCES AND USES OF CASH

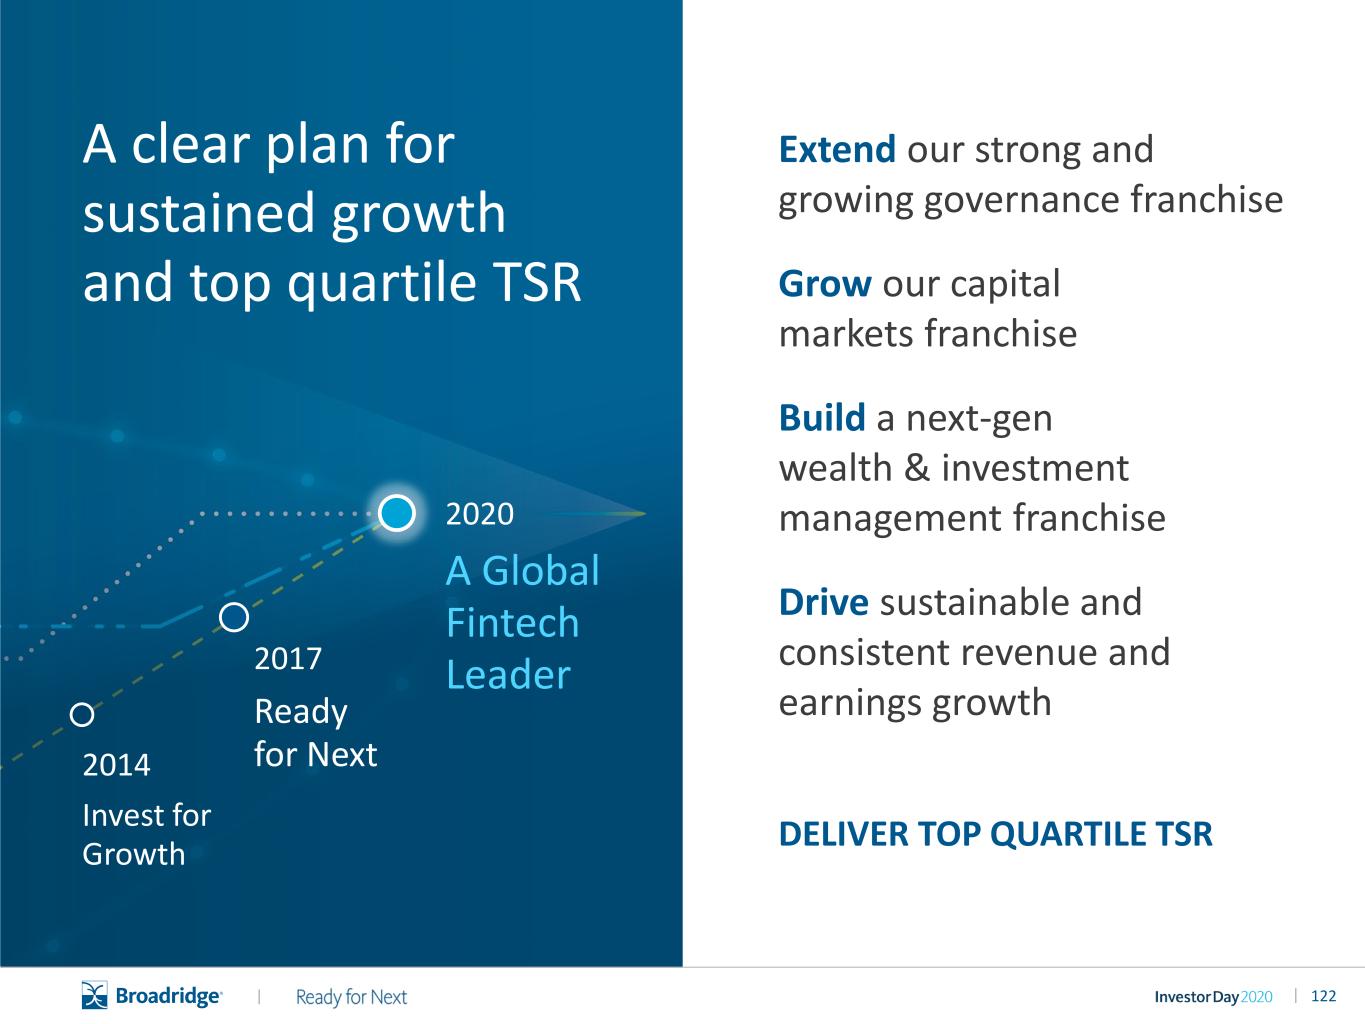
16|| A clear plan for sustained growth and top quartile TSR Extend our strong and growing governance franchise Grow our capital markets franchise Build a next-gen wealth & investment management franchise Drive sustainable and consistent revenue and earnings growth DELIVER TOP QUARTILE TSR 2014 Invest for Growth 2017 Ready for Next 2020 A Global Fintech Leader
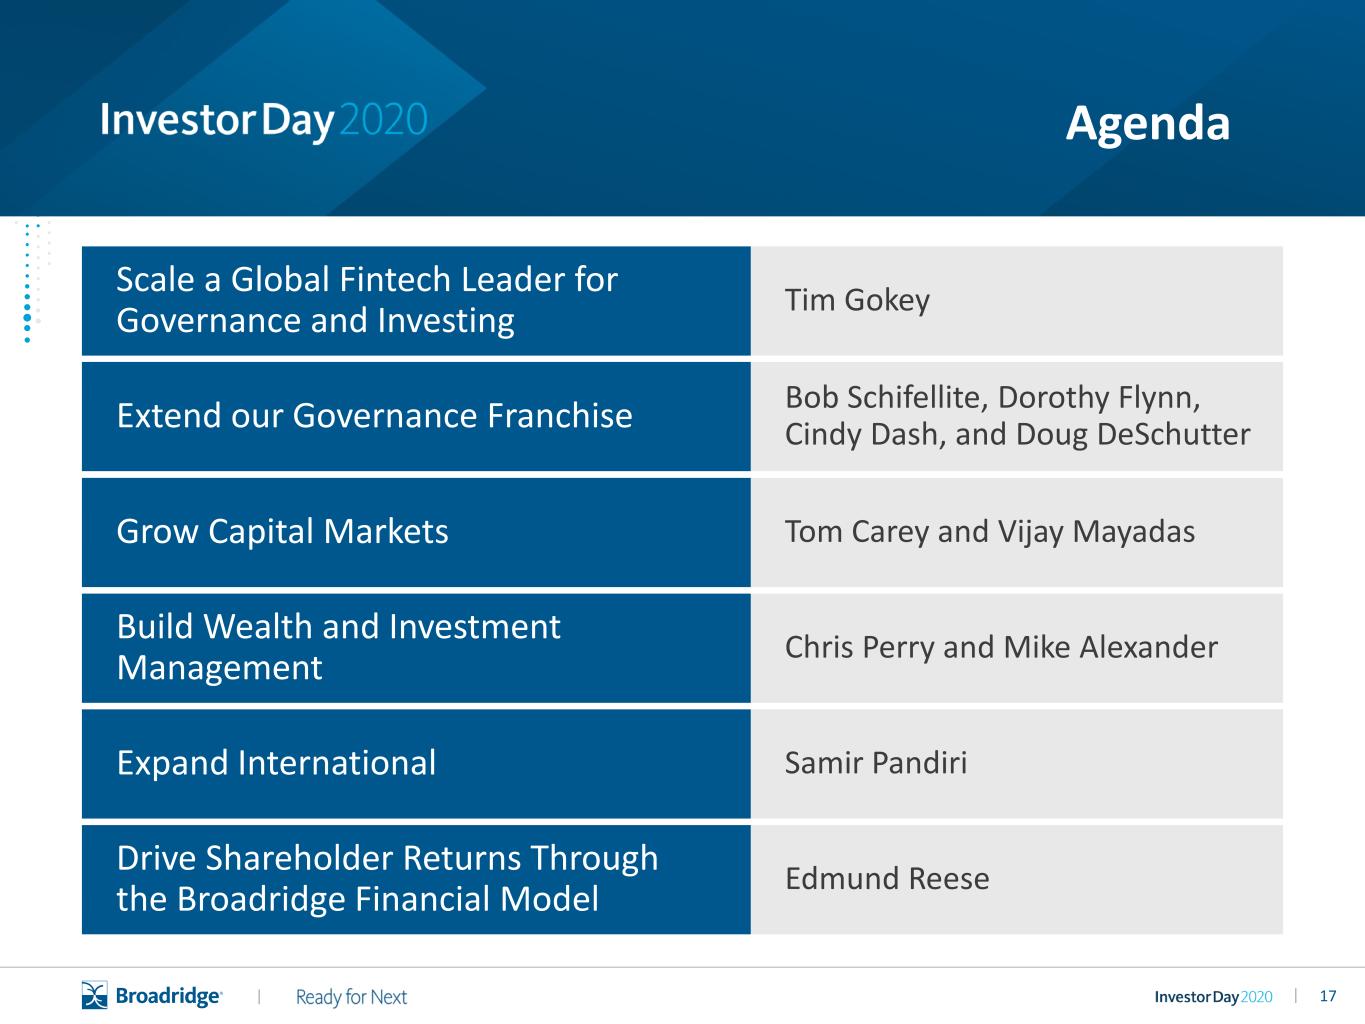
17|| Tim Gokey Bob Schifellite, Dorothy Flynn, Cindy Dash, and Doug DeSchutter Tom Carey and Vijay Mayadas Chris Perry and Mike Alexander Samir Pandiri Edmund Reese Scale a Global Fintech Leader for Governance and Investing Grow Capital Markets Build Wealth and Investment Management Extend our Governance Franchise Expand International Drive Shareholder Returns Through the Broadridge Financial Model Agenda

18||
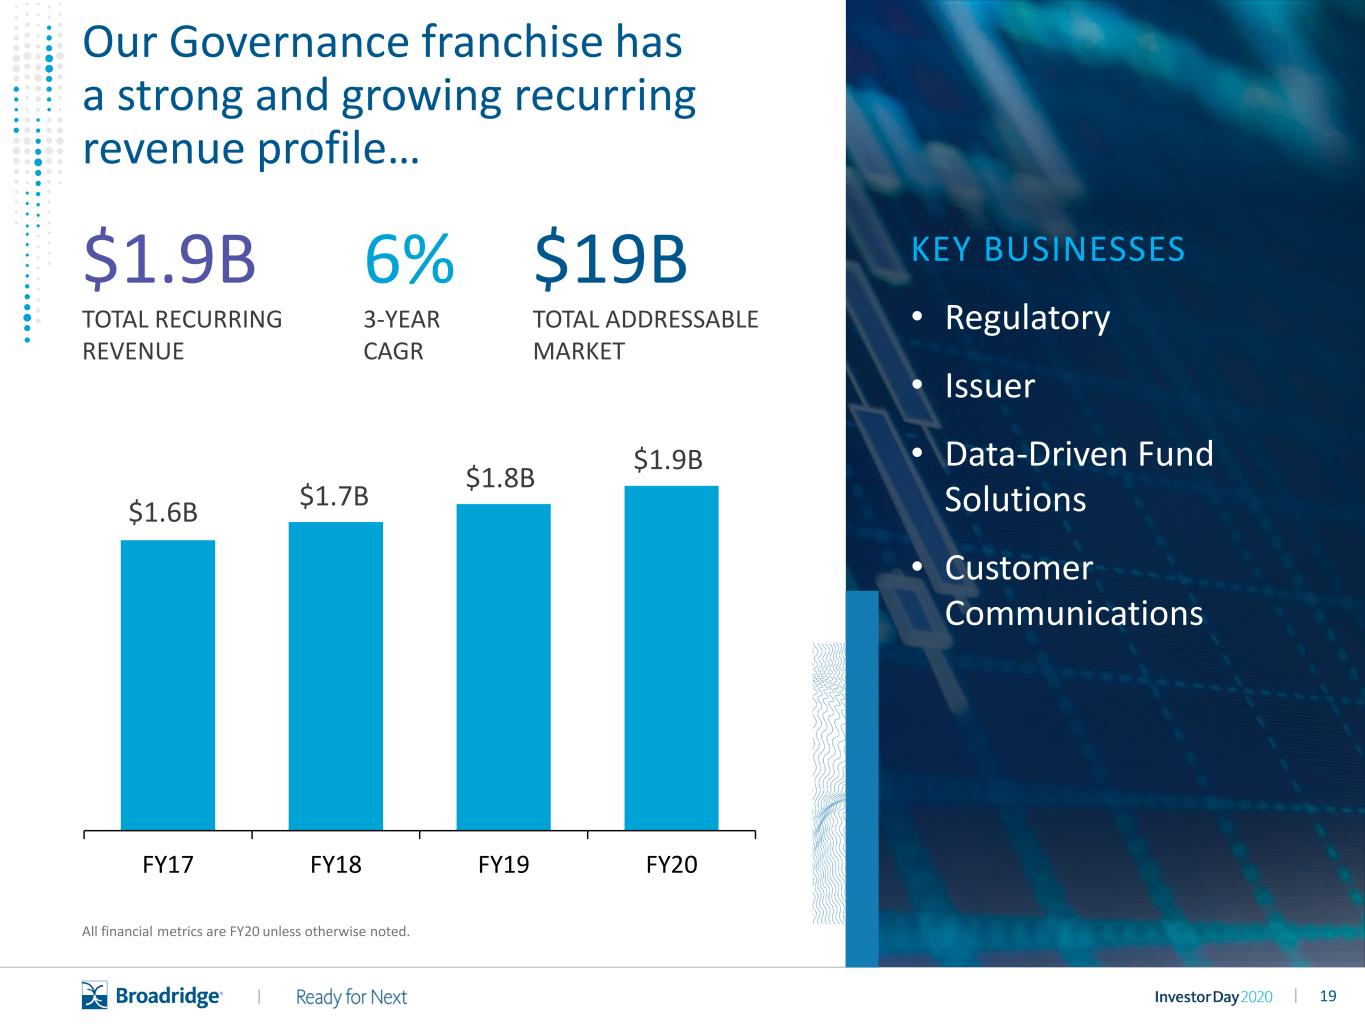
19|| $1.9B TOTAL RECURRING REVENUE 6% 3-YEAR CAGR All financial metrics are FY20 unless otherwise noted. KEY BUSINESSES • Regulatory • Issuer • Data-Driven Fund Solutions • Customer Communications $19B TOTAL ADDRESSABLE MARKET Our Governance franchise has a strong and growing recurring revenue profile… $1.6B $1.7B $1.8B $1.9B FY17 FY18 FY19 FY20
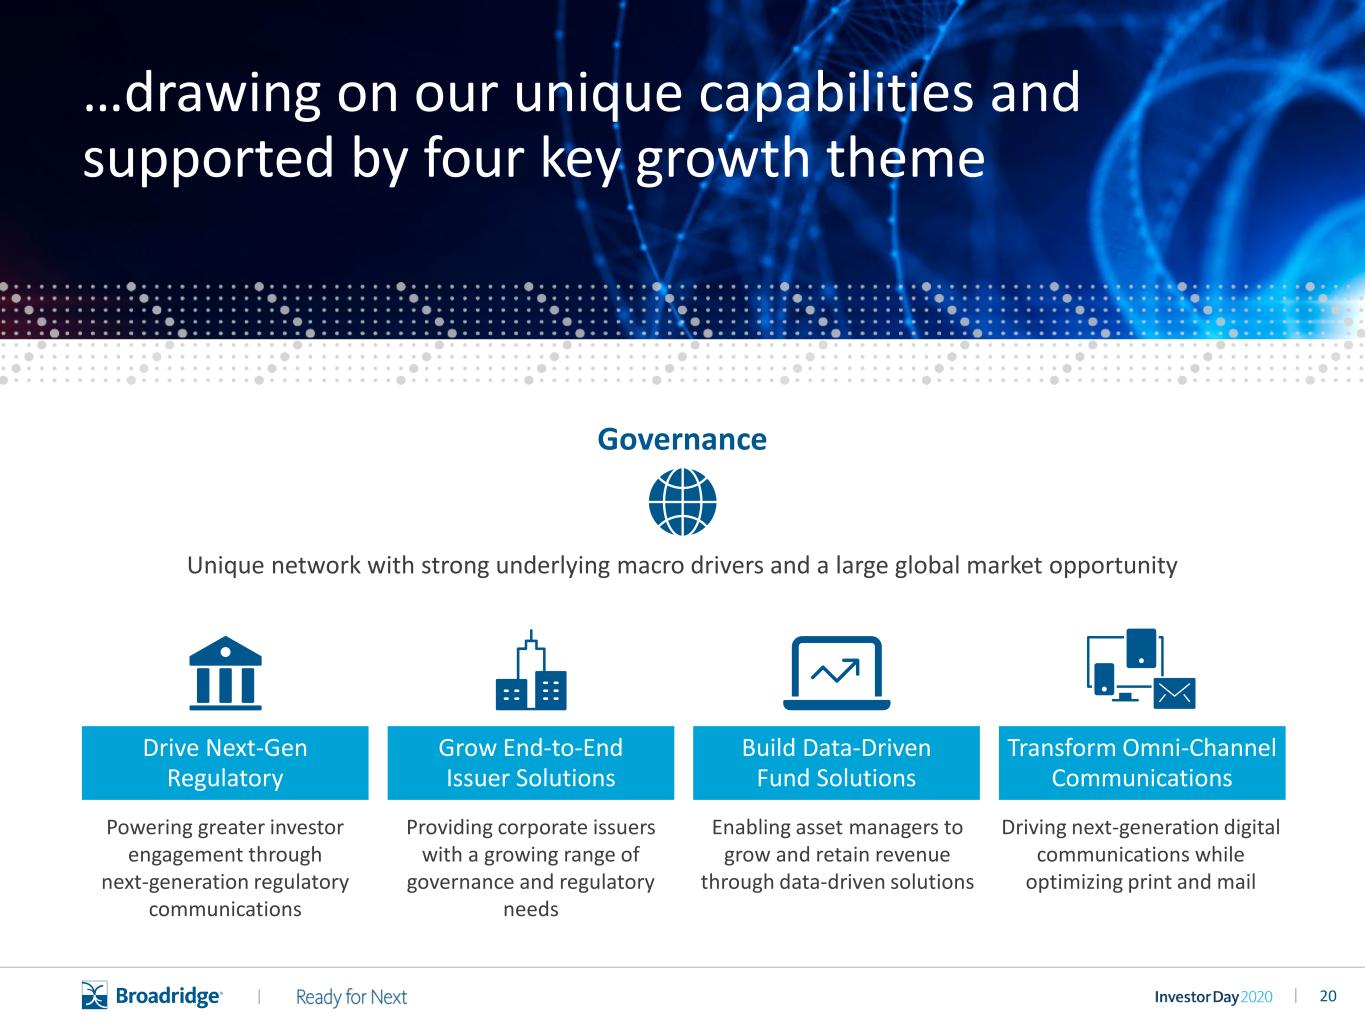
20|| Unique network with strong underlying macro drivers and a large global market opportunity Powering greater investor engagement through next-generation regulatory communications Providing corporate issuers with a growing range of governance and regulatory needs Driving next-generation digital communications while optimizing print and mail Enabling asset managers to grow and retain revenue through data-driven solutions Drive Next-Gen Regulatory Grow End-to-End Issuer Solutions Build Data-Driven Fund Solutions Transform Omni-Channel Communications …drawing on our unique capabilities and supported by four key growth theme Governance
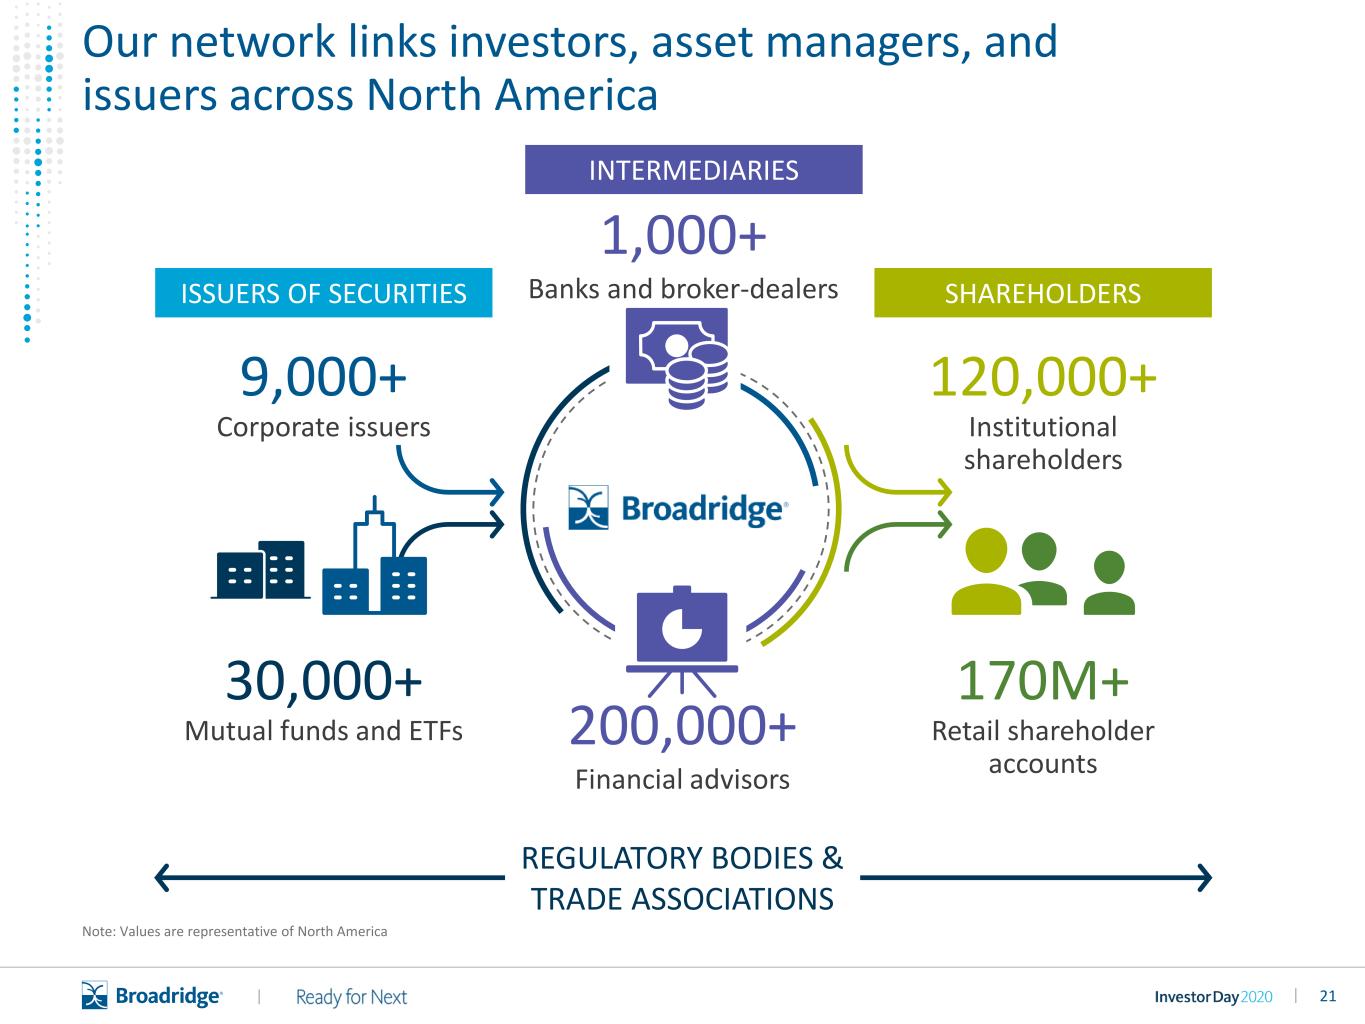
21|| 170M+ Retail shareholder accounts 120,000+ Institutional shareholders 30,000+ Mutual funds and ETFs ISSUERS OF SECURITIES SHAREHOLDERS 200,000+ Financial advisors 9,000+ Corporate issuers REGULATORY BODIES & TRADE ASSOCIATIONS 1,000+ Banks and broker-dealers Our network links investors, asset managers, and issuers across North America INTERMEDIARIES Note: Values are representative of North America

22|| Institutional • Proxy voting • Class actions Mutual funds and ETFs • Interim reports • Distribution Insight ISSUERS OF SECURITIES SHAREHOLDERS Financial advisors • Technology platforms • Data-driven marketing Corporate issuers • Annual meetings services • Disclosure solutions Banks and broker-dealers • Proxy voting • Post-sale prospectuses • Digital communications INTERMEDIARIES Each entity in our ecosystem presents an opportunity for Broadridge to provide additional services and solutions Retail • Shareholder Data Solutions • Retail engagement solutions Note: Showing select products
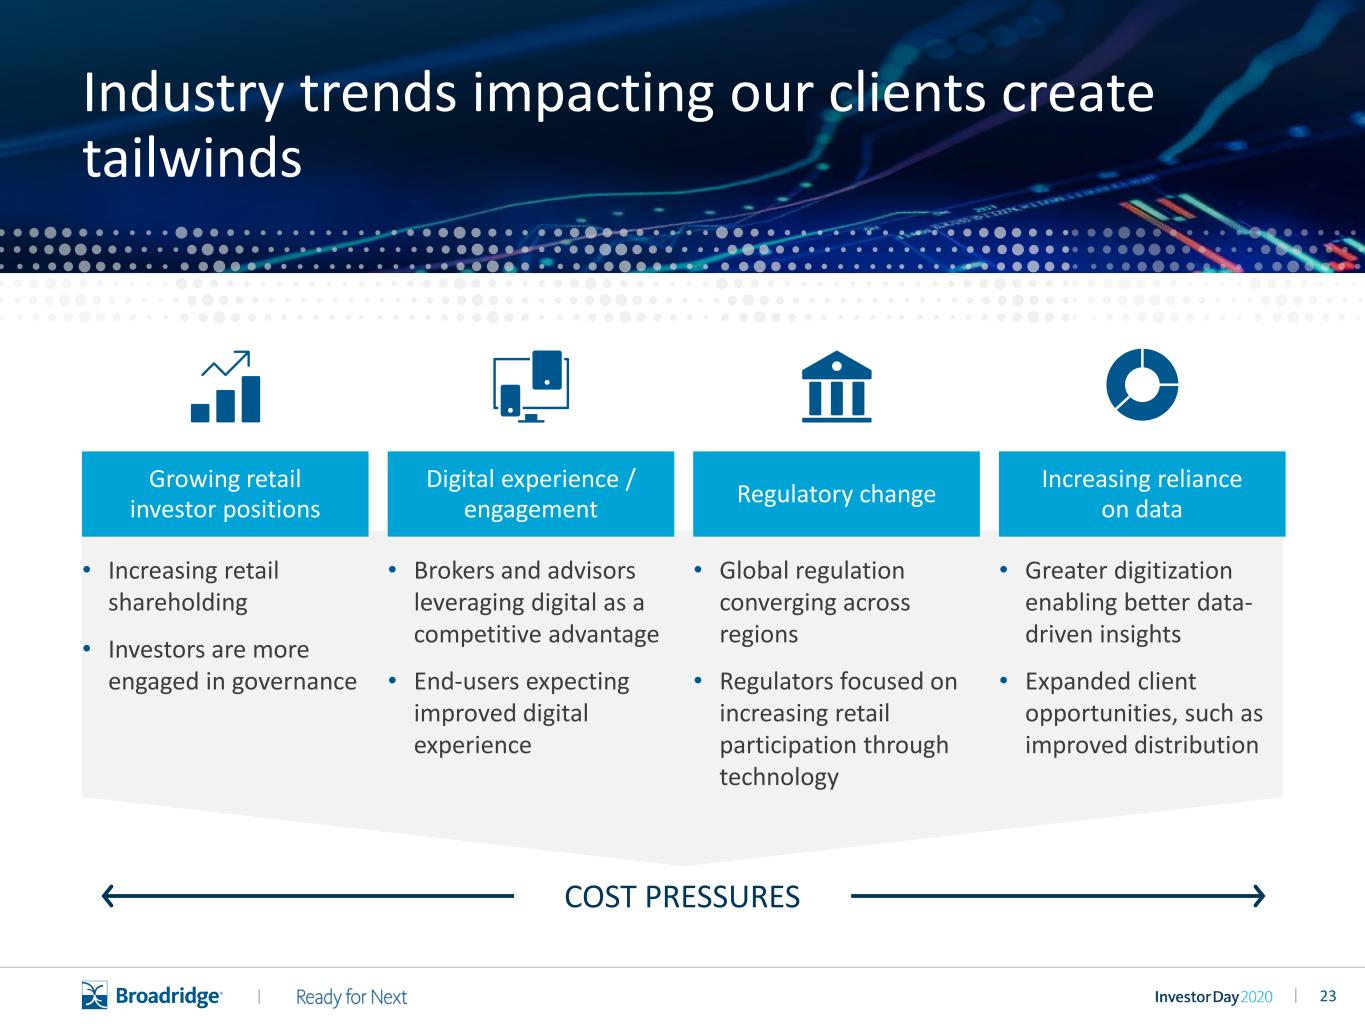
23|| • Increasing retail shareholding • Investors are more engaged in governance • Greater digitization enabling better data- driven insights • Expanded client opportunities, such as improved distribution • Brokers and advisors leveraging digital as a competitive advantage • End-users expecting improved digital experience • Global regulation converging across regions • Regulators focused on increasing retail participation through technology Growing retail investor positions Digital experience / engagement Regulatory change Increasing reliance on data Clients looking to capitalize on industry tailwinds… Industry trends impac ing our clients create COST PRESSURES
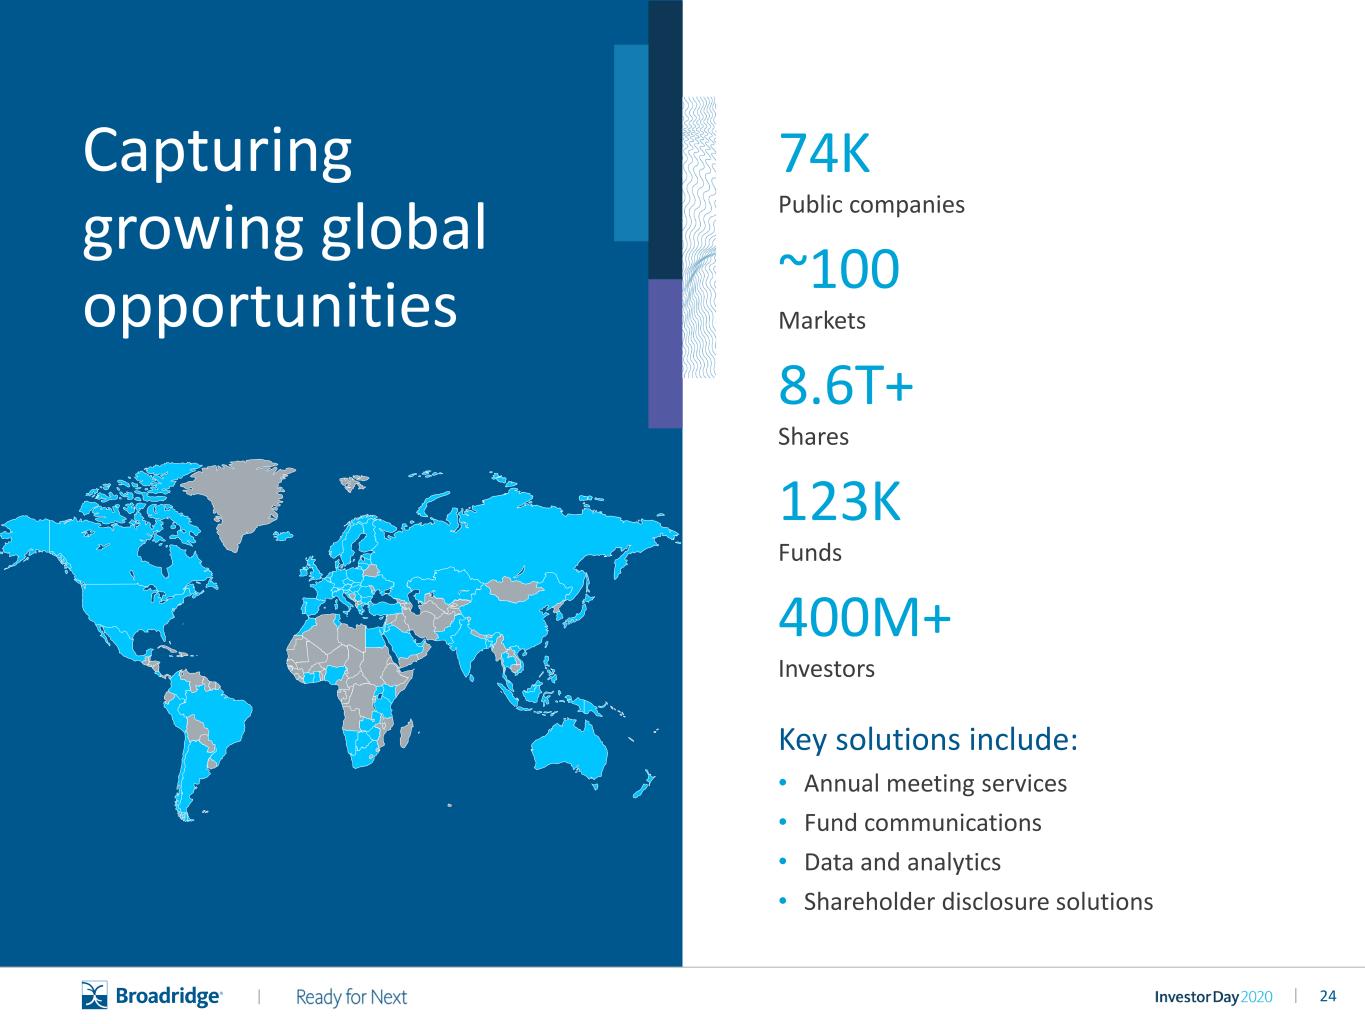
24|| Capturing growing global opportunities 74K Public companies ~100 Markets 8.6T+ Shares 123K Funds 400M+ Investors Key solutions include: • Annual meeting services • Fund communications • Data and analytics • Shareholder disclosure solutions
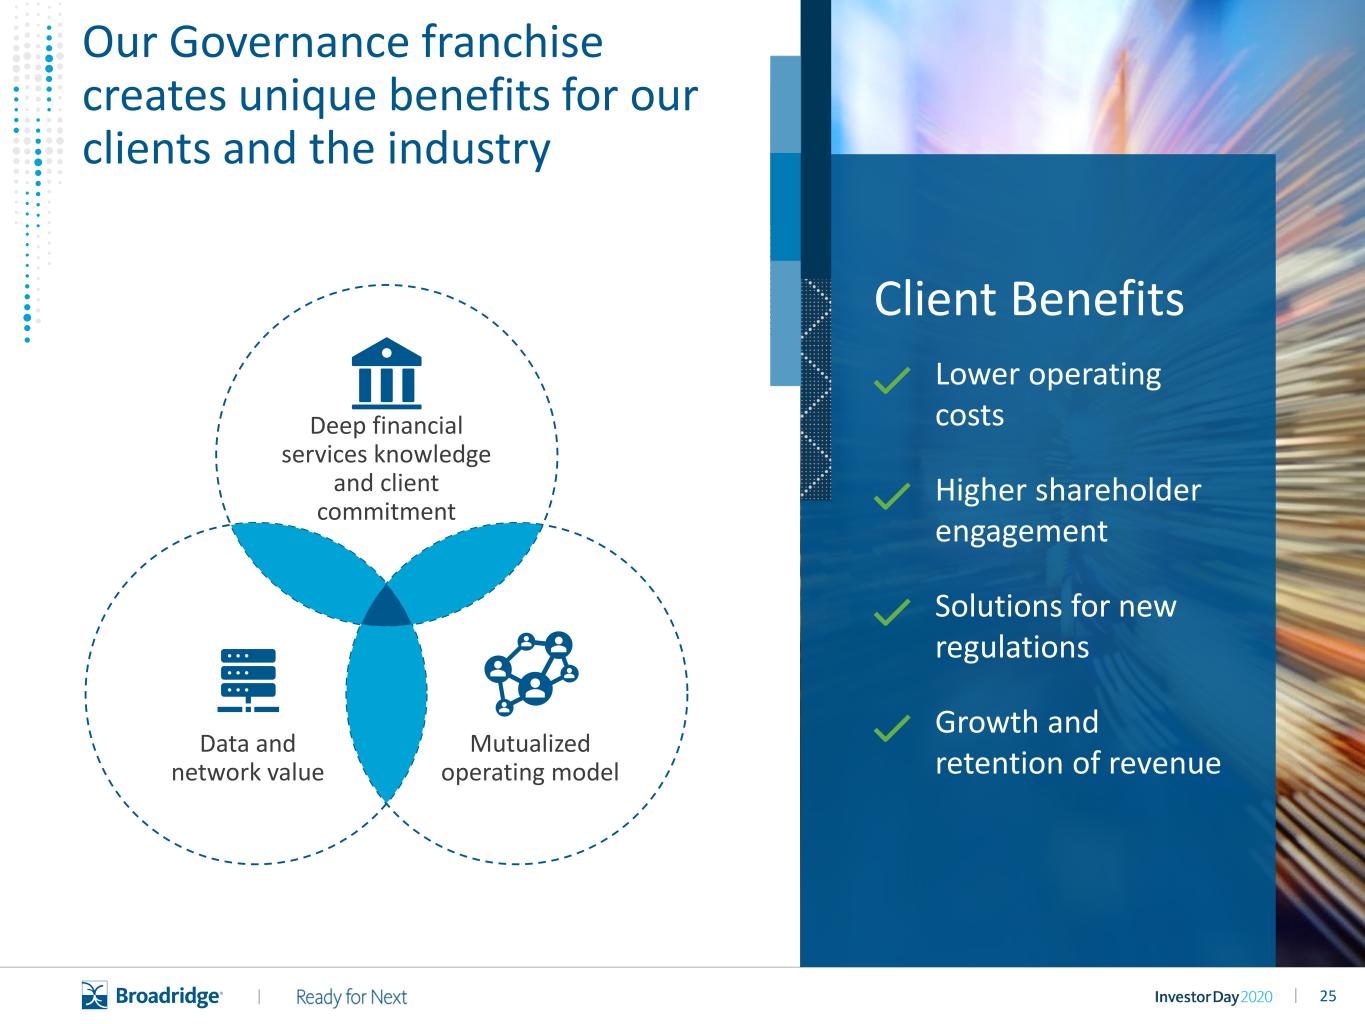
25|| Lower operating costs Higher shareholder engagement Solutions for new regulations Growth and retention of revenue Deep financial services knowledge and client commitment Data and network value Mutualized operating model Our Governance franchise creates unique benefits for our clients and the industry Client Benefits
26||
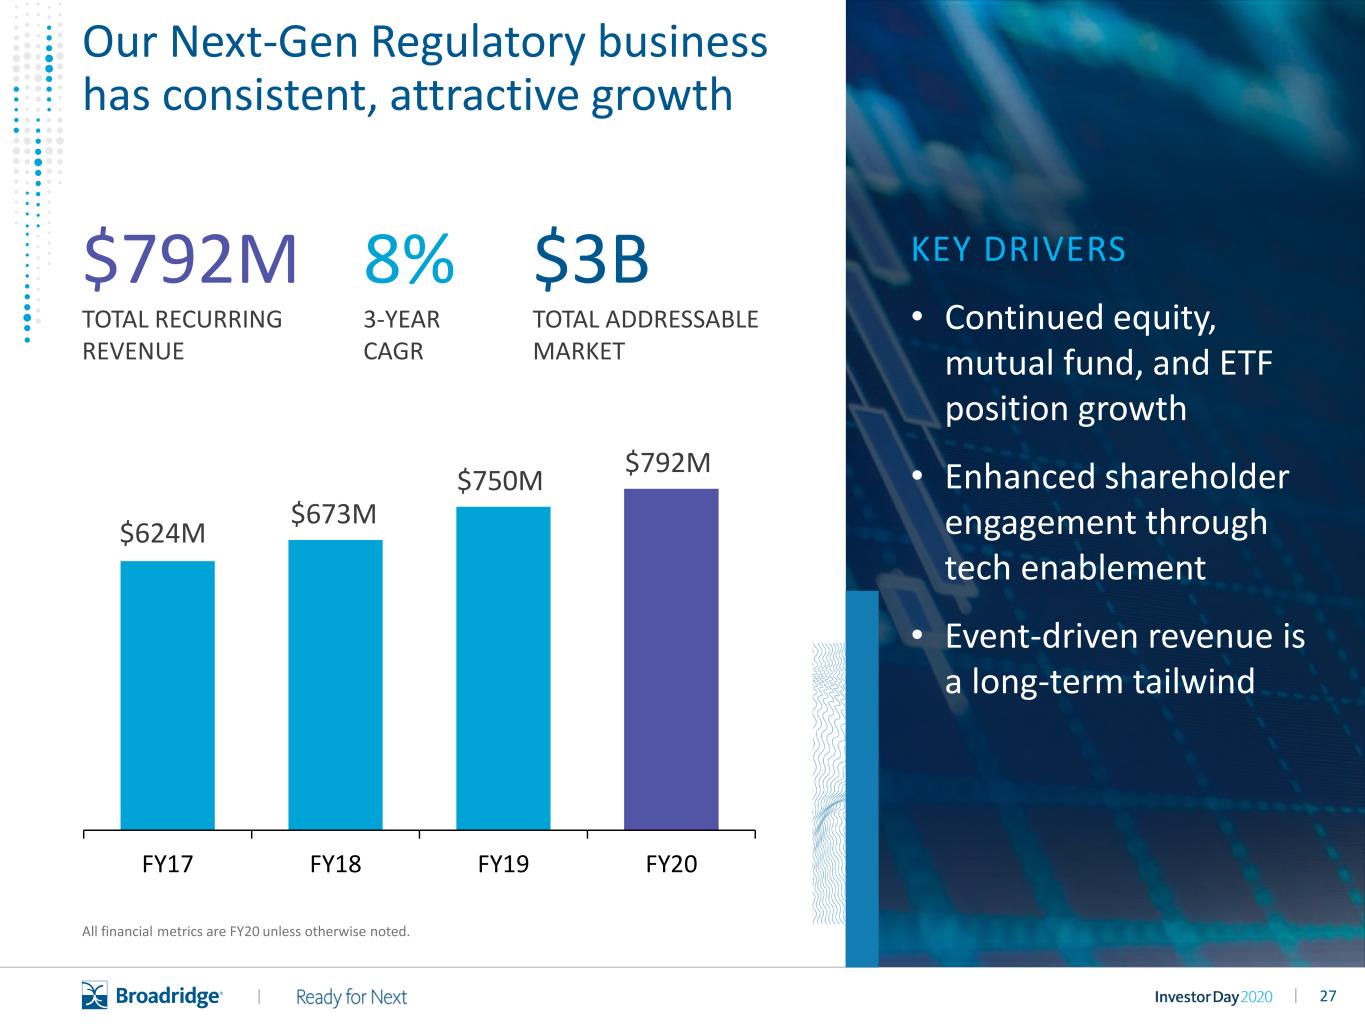
27|| $792M TOTAL RECURRING REVENUE 8% 3-YEAR CAGR All financial metrics are FY20 unless otherwise noted. $624M $673M $750M $792M FY17 FY18 FY19 FY20 KEY DRIVERS • Continued equity, mutual fund, and ETF position growth • Enhanced shareholder engagement through tech enablement • Event-driven revenue is a long-term tailwind $3B TOTAL ADDRESSABLE MARKET Our Next-Gen Regulatory business has consistent, attractive growth
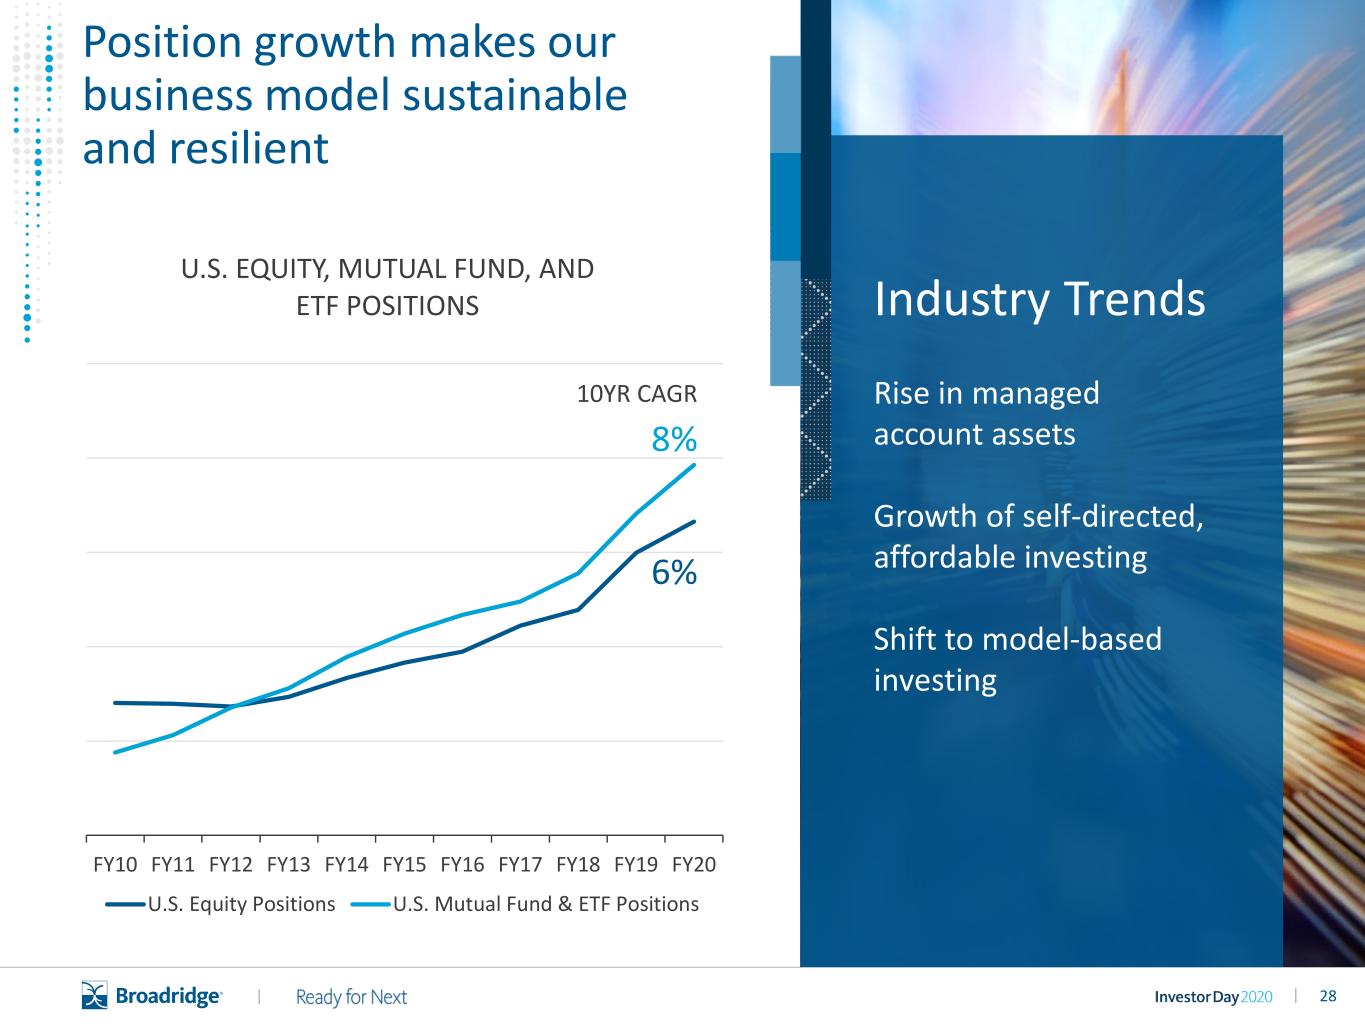
28|| Industry Trends Rise in managed account assets Growth of self-directed, affordable investing Shift to model-based investing FY10 FY11 FY12 FY13 FY14 FY15 FY16 FY17 FY18 FY19 FY20 U.S. EQUITY, MUTUAL FUND, AND ETF POSITIONS U.S. Equity Positions U.S. Mutual Fund & ETF Positions 8% 6% 10YR CAGR Position growth makes our business model sustainable and resilient
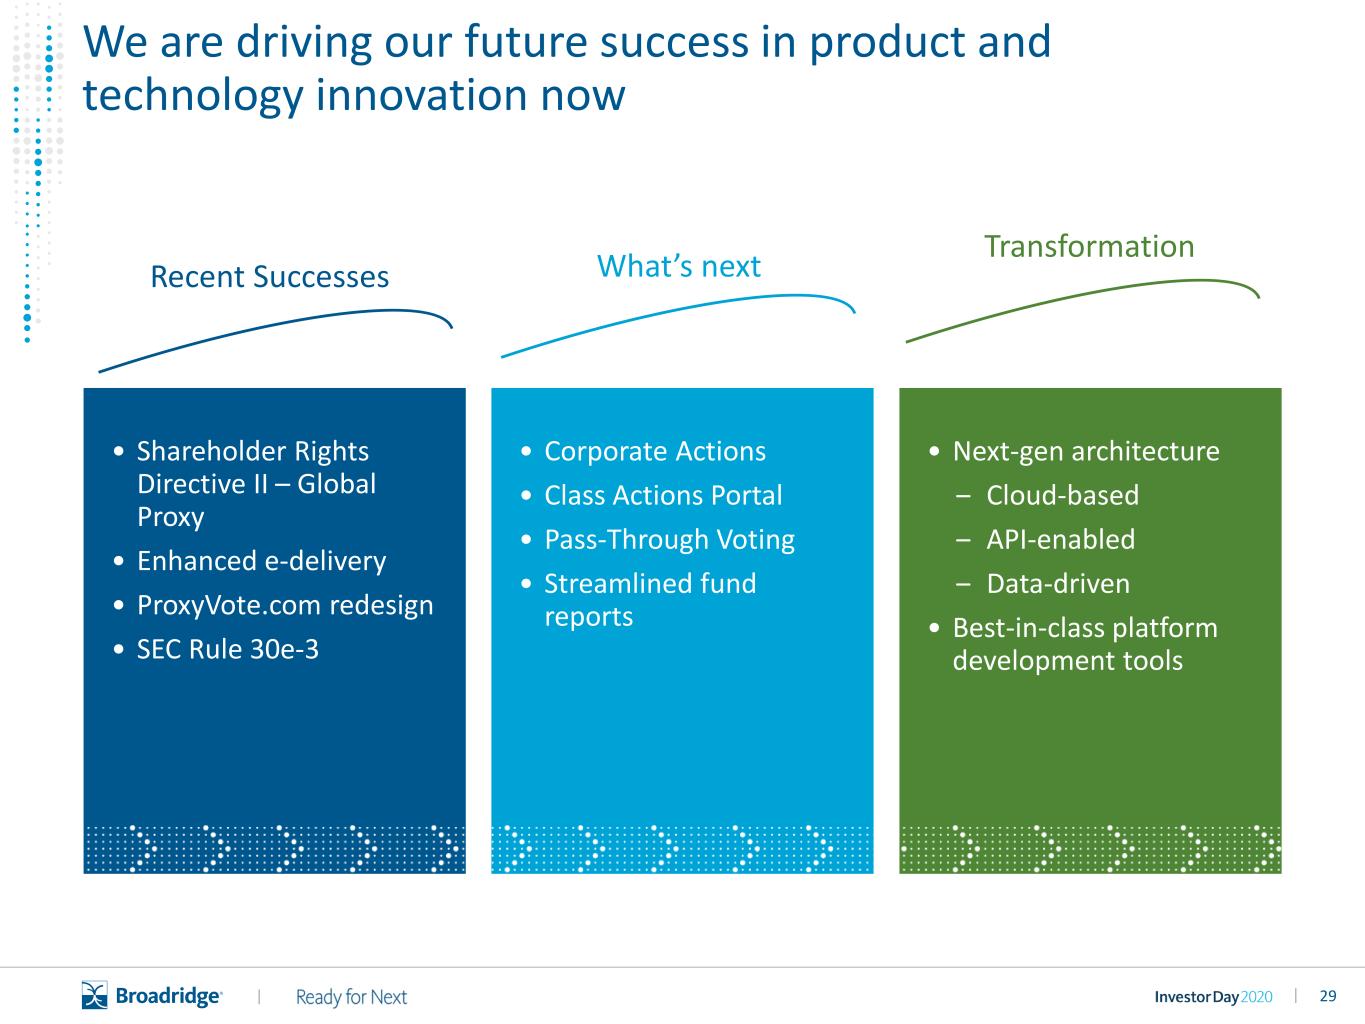
29|| • Shareholder Rights Directive II – Global Proxy • Enhanced e-delivery • ProxyVote.com redesign • SEC Rule 30e-3 • Corporate Actions • Class Actions Portal • Pass-Through Voting • Streamlined fund reports We are driving our future success in product and technology innovation now • Next-gen architecture ‒ Cloud-based ‒ API-enabled ‒ Data-driven • Best-in-class platform development tools What’s nextRecent Successes Transformation
30|| ProxyVote App Video
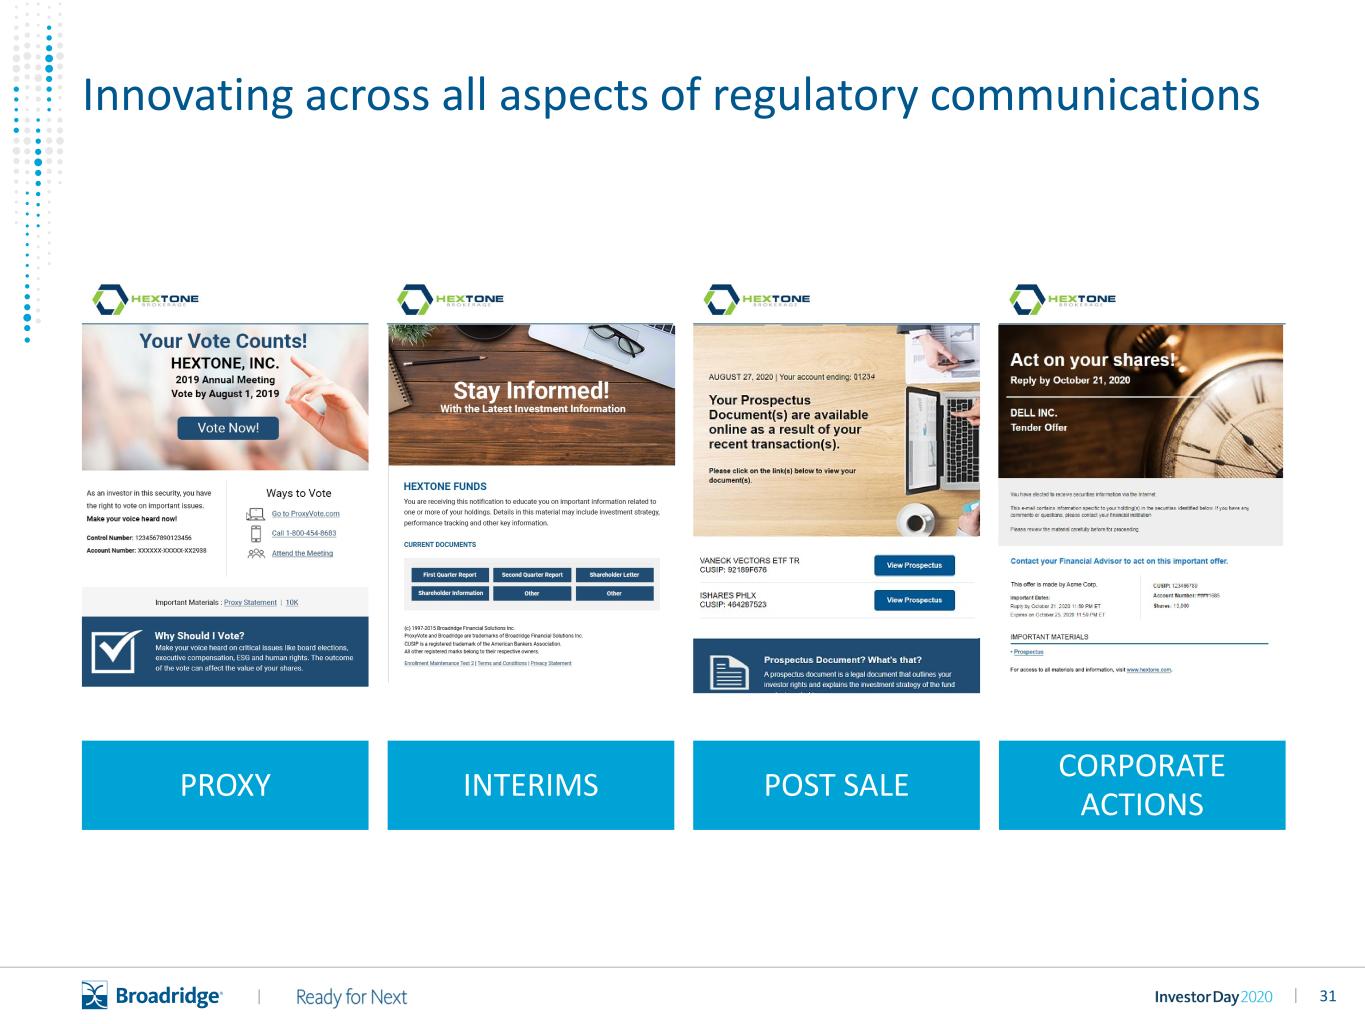
31|| Innovating across all aspects of regulatory communications PROXY INTERIMS POST SALE CORPORATE ACTIONS
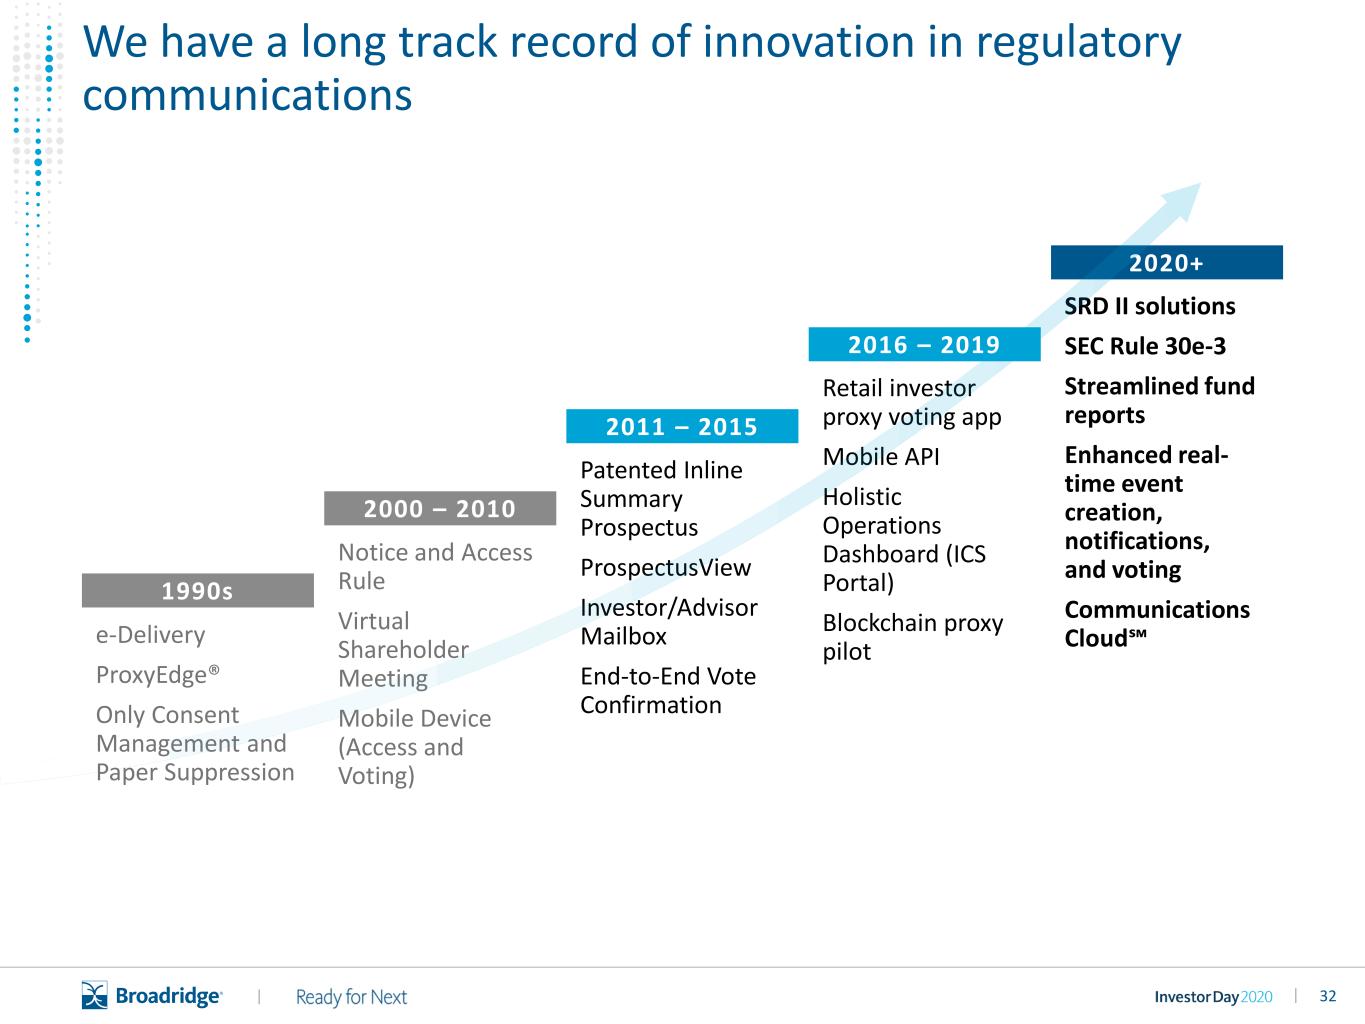
32|| Patented Inline Summary Prospectus ProspectusView Investor/Advisor Mailbox End-to-End Vote Confirmation 2011 – 2015 Notice and Access Rule Virtual Shareholder Meeting Mobile Device (Access and Voting) 2000 – 2010 e-Delivery ProxyEdge® Only Consent Management and Paper Suppression 1990s Retail investor proxy voting app Mobile API Holistic Operations Dashboard (ICS Portal) Blockchain proxy pilot 2016 – 2019 SRD II solutions SEC Rule 30e-3 Streamlined fund reports Enhanced real- time event creation, notifications, and voting Communications Cloud℠ 2020+ We have a long track record of innovation in regulatory communications

33||

34|| $157M TOTAL RECURRING REVENUE 14% 3-YEAR CAGR All financial metrics are FY20 unless otherwise noted. $104M $118M $137M $157M FY17 FY18 FY19 FY20 STRATEGY FOR GROWTH: • Expand our relationships with public companies • Grow our leadership in issuers’ required compliance activities • Drive growth in new adjacent services $2B TOTAL ADDRESSABLE MARKET We have a strong track record of growth supported by our strategy
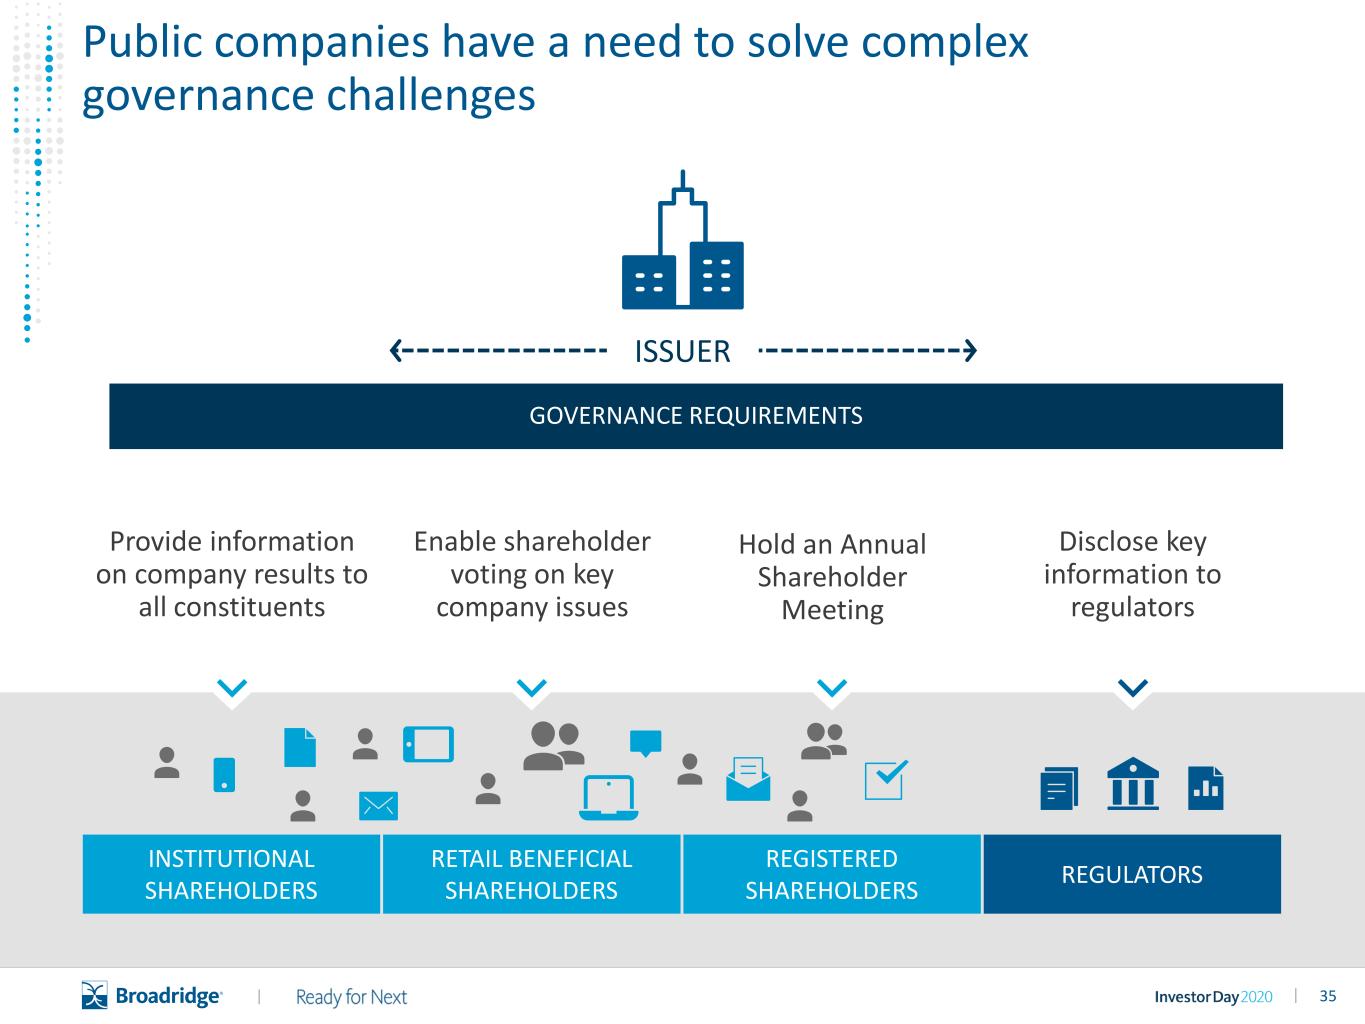
35|| Provide information on company results to all constituents Enable shareholder voting on key company issues Disclose key information to regulators ISSUER GOVERNANCE REQUIREMENTS INSTITUTIONAL SHAREHOLDERS REGULATORS REGISTERED SHAREHOLDERS RETAIL BENEFICIAL SHAREHOLDERS Public companies have a need to solve complex governance challenges Hold an Annual Shareholder Meeting
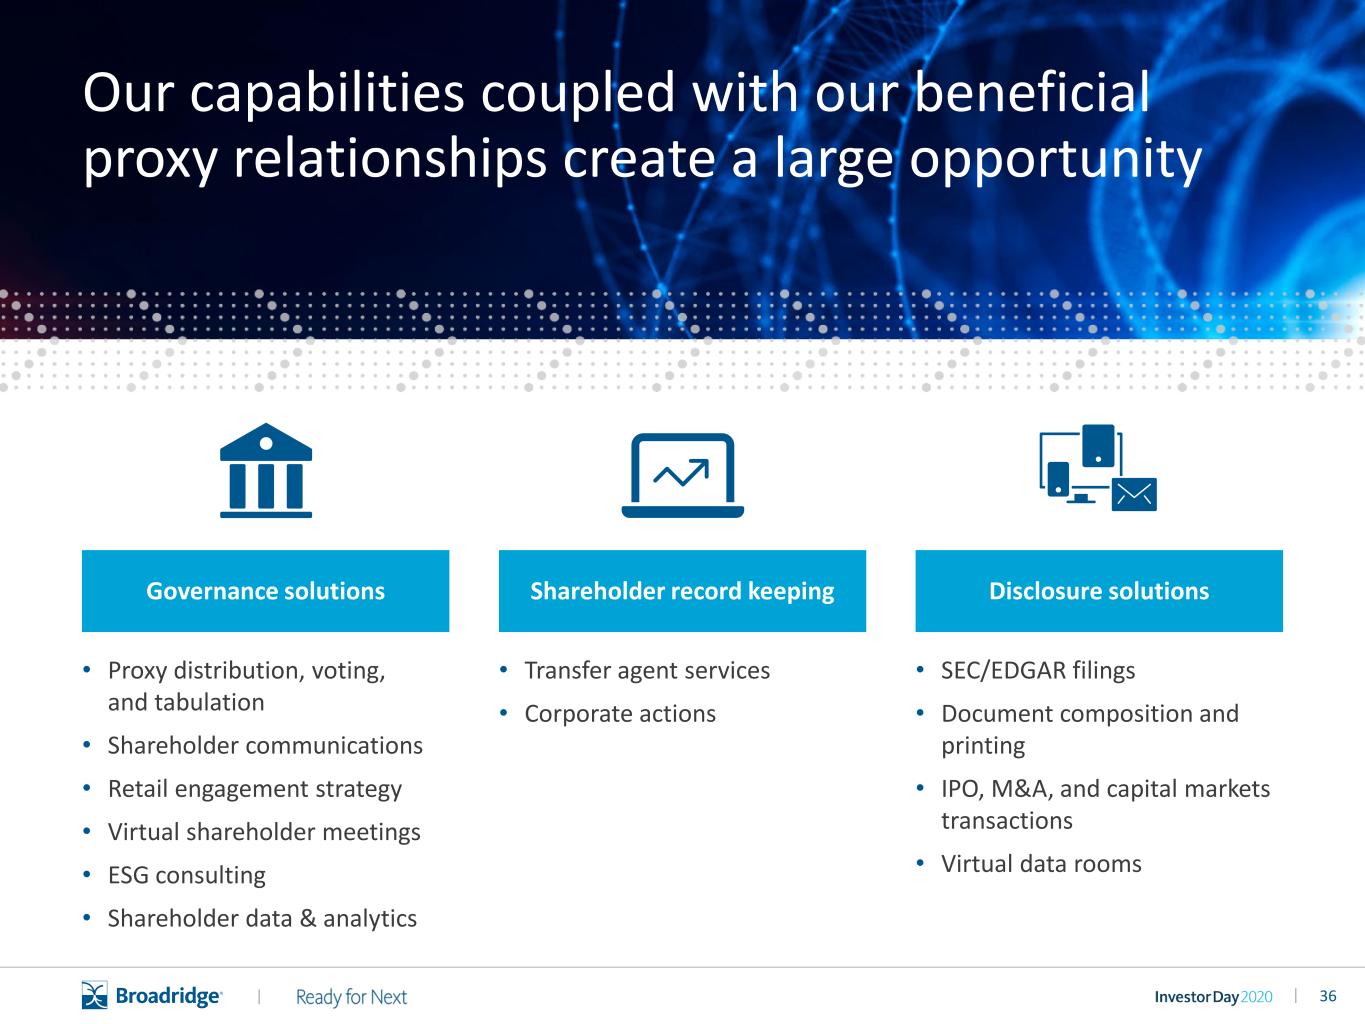
36|| • Transfer agent services • Corporate actions • Proxy distribution, voting, and tabulation • Shareholder communications • Retail engagement strategy • Virtual shareholder meetings • ESG consulting • Shareholder data & analytics • SEC/EDGAR filings • Document composition and printing • IPO, M&A, and capital markets transactions • Virtual data rooms Shareholder record keeping Disclosure solutionsGovernance solutions Our capabilities coupled with our beneficial proxy relationships create a large opportunity
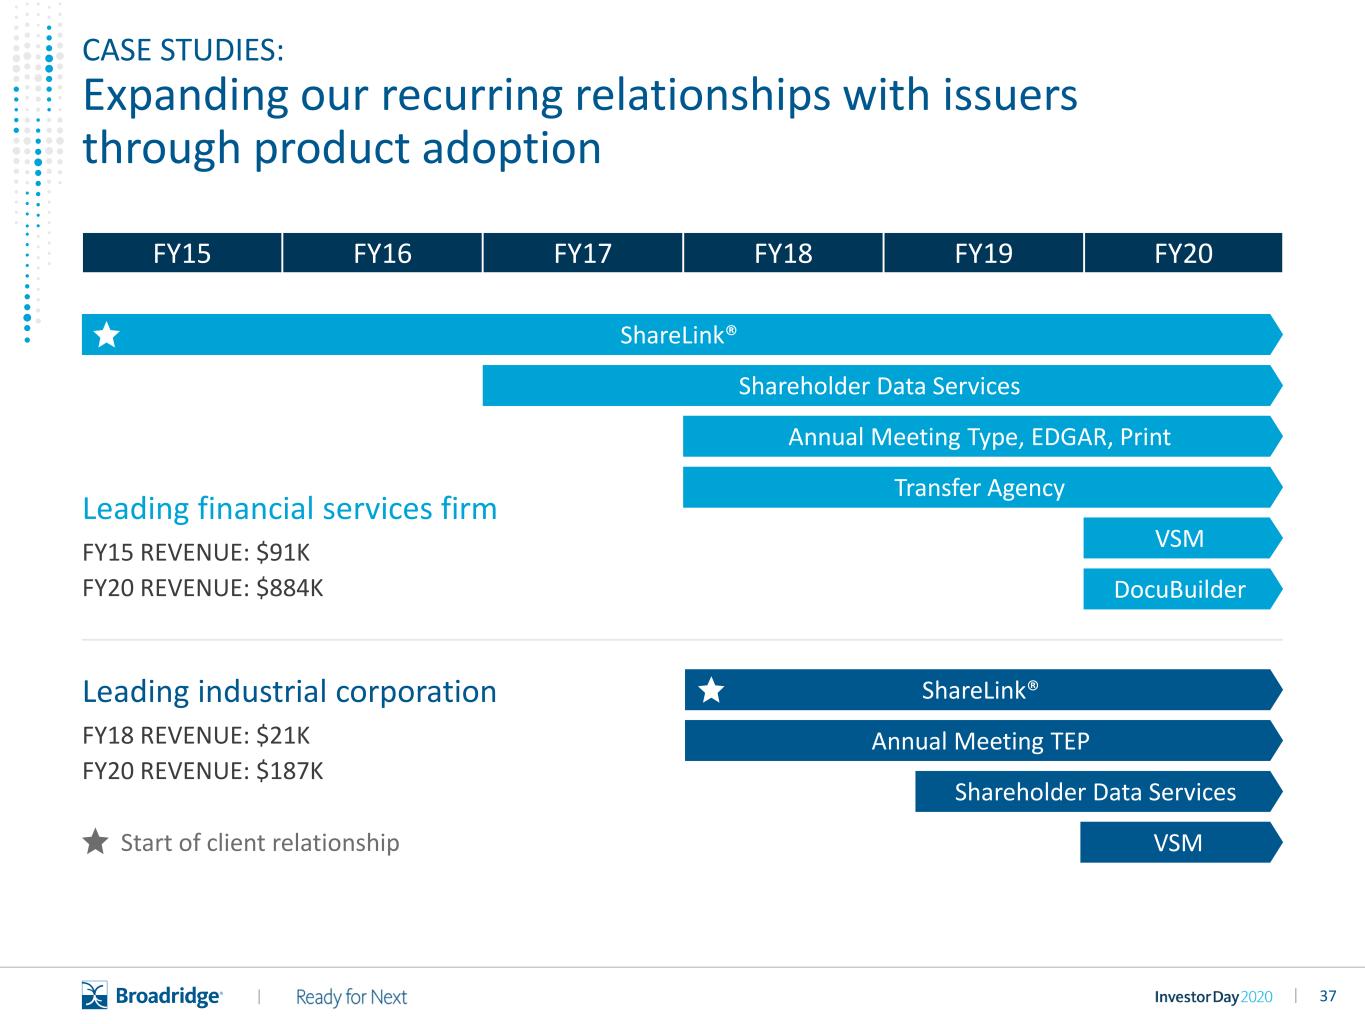
37|| Leading financial services firm FY15 REVENUE: $91K FY20 REVENUE: $884K Leading industrial corporation FY18 REVENUE: $21K FY20 REVENUE: $187K FY20FY19FY18FY17FY16FY15 ShareLink® Shareholder Data Services Annual Meeting Type, EDGAR, Print Transfer Agency VSM DocuBuilder ShareLink® Annual Meeting TEP Shareholder Data Services VSM CASE STUDIES: Expanding our recurring relationships with issuers through product adoption Start of client relationship
38|| Virtual Shareholder Meeting Video
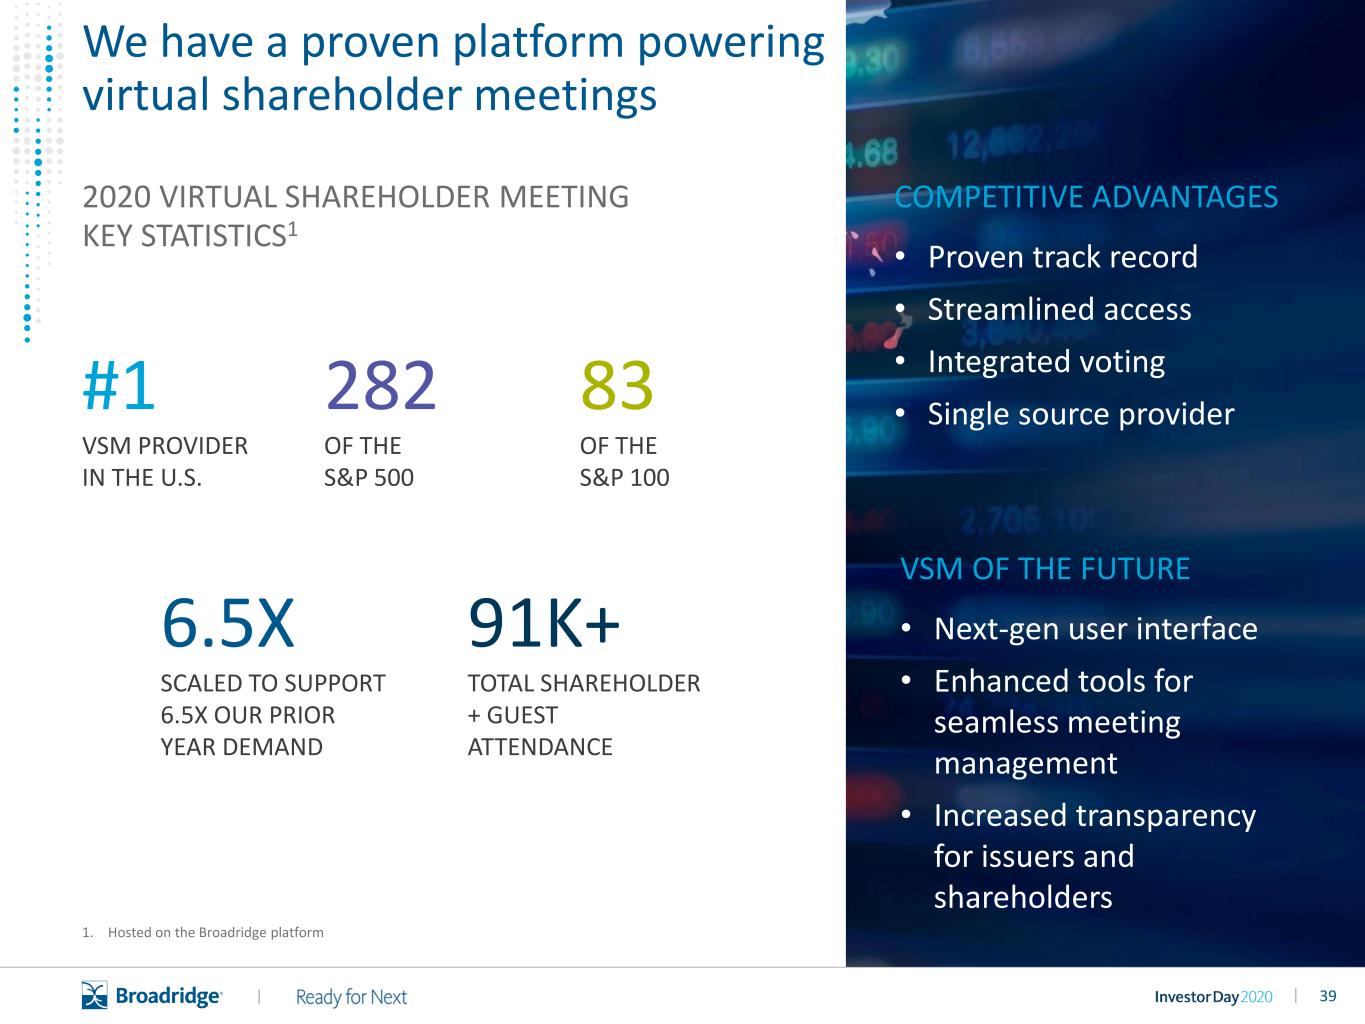
39|| COMPETITIVE ADVANTAGES • Proven track record • Streamlined access • Integrated voting • Single source provider 2020 VIRTUAL SHAREHOLDER MEETING KEY STATISTICS1 VSM OF THE FUTURE • Next-gen user interface • Enhanced tools for seamless meeting management • Increased transparency for issuers and shareholders 1. Hosted on the Broadridge platform We have a proven platform powering virtual shareholder meetings #1 VSM PROVIDER IN THE U.S. 6.5X SCALED TO SUPPORT 6.5X OUR PRIOR YEAR DEMAND 83 OF THE S&P 100 91K+ TOTAL SHAREHOLDER + GUEST ATTENDANCE 282 OF THE S&P 500
40||
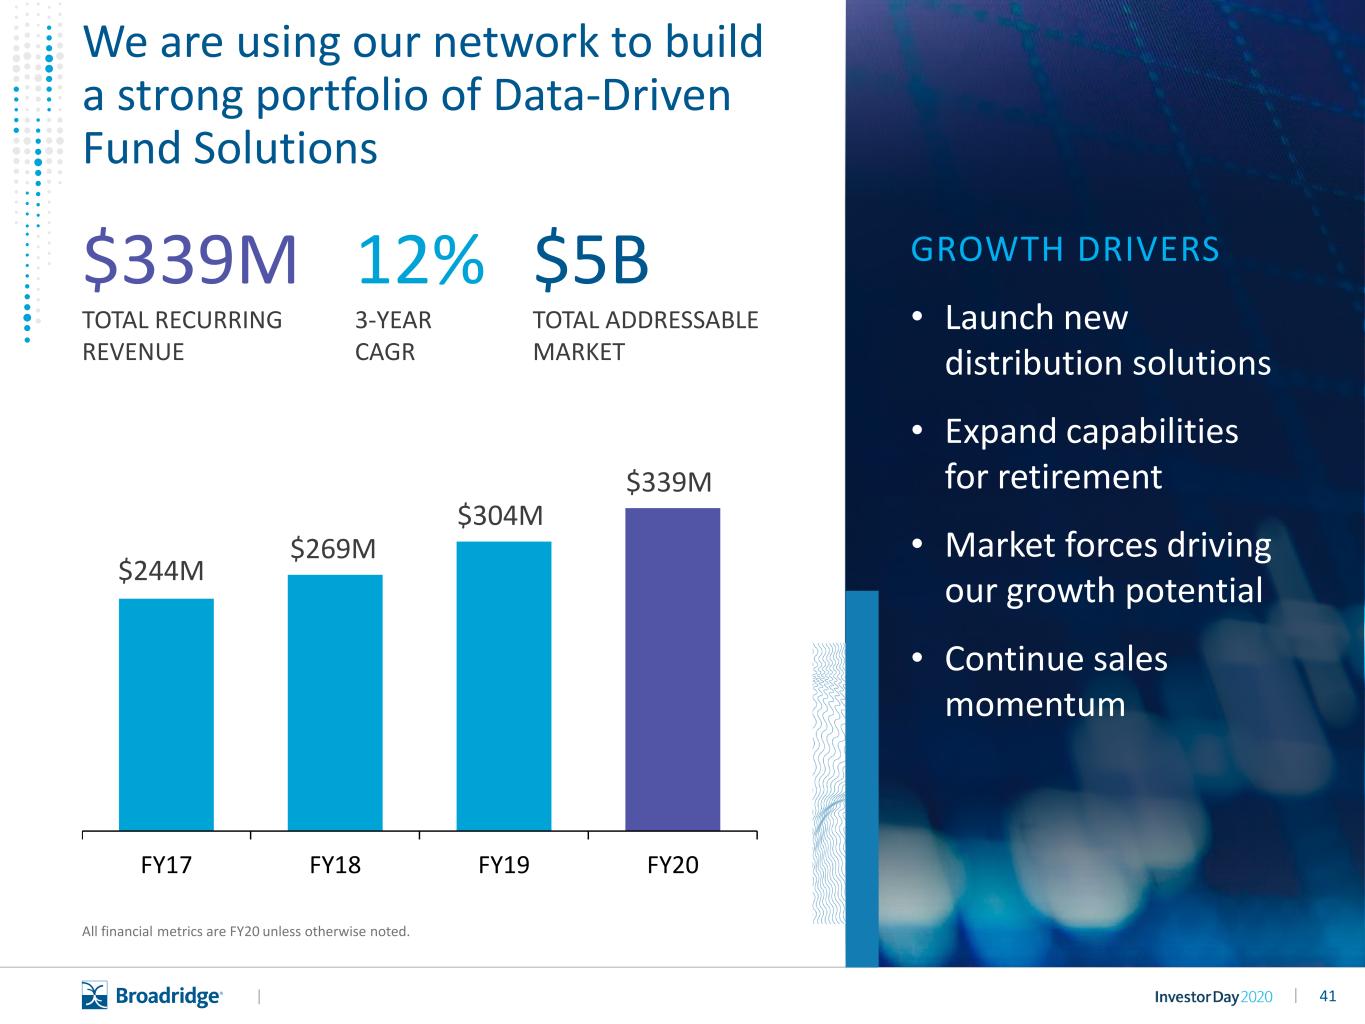
41|| $339M TOTAL RECURRING REVENUE 12% 3-YEAR CAGR All financial metrics are FY20 unless otherwise noted. $244M $269M $304M $339M FY17 FY18 FY19 FY20 GROWTH DRIVERS • Launch new distribution solutions • Expand capabilities for retirement • Market forces driving our growth potential • Continue sales momentum $5B TOTAL ADDRESSABLE MARKET We are using our network to build a strong portfolio of Data-Driven Fund Solutions
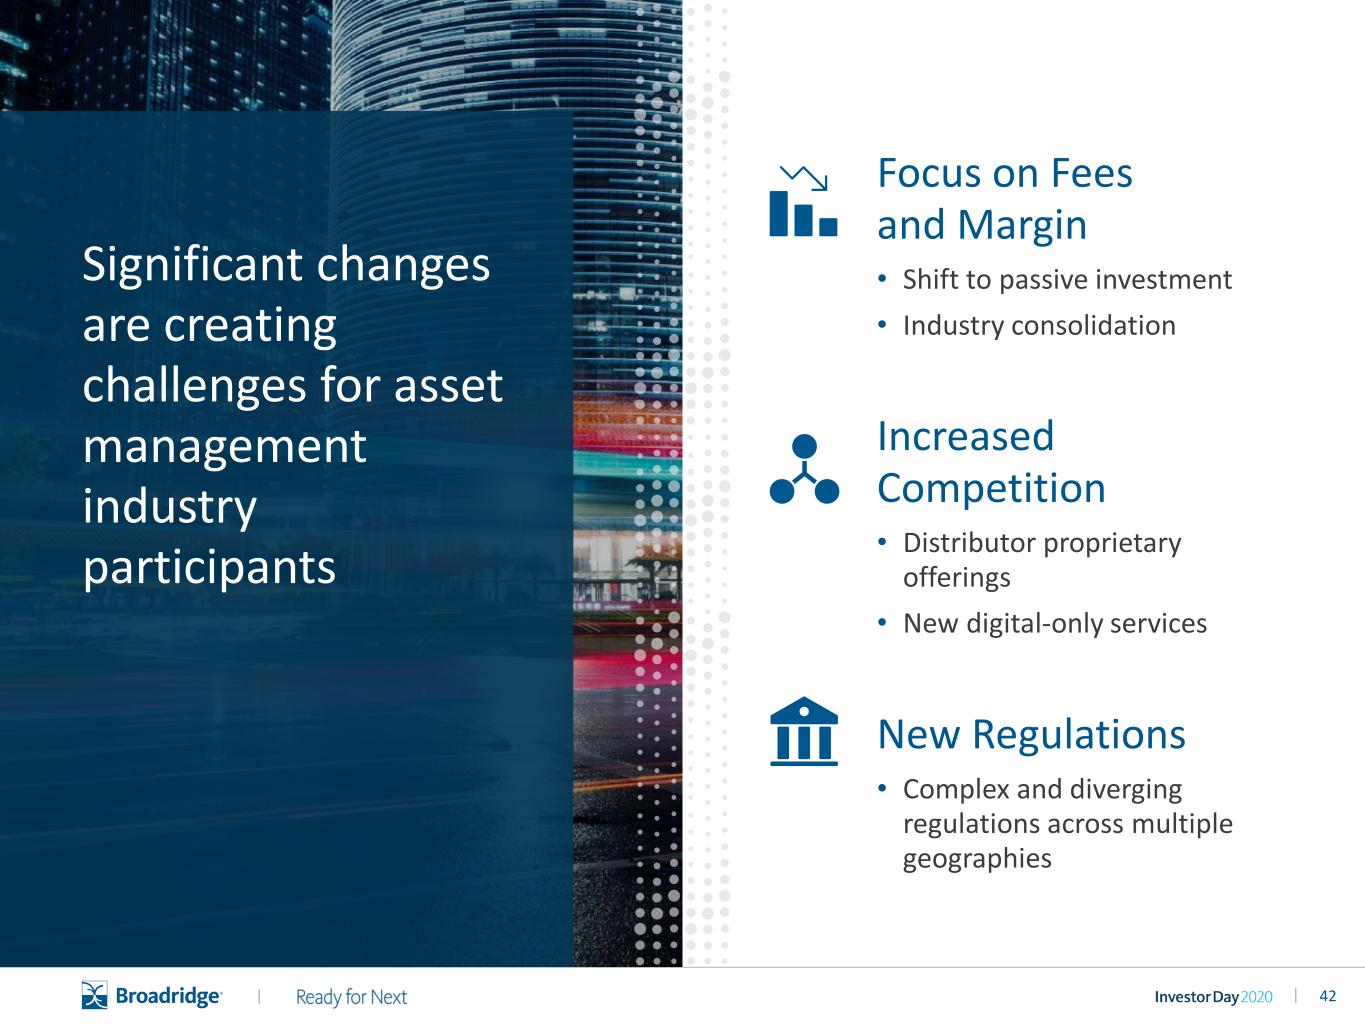
42|| Increased Competition • Distributor proprietary offerings • New digital-only services New Regulations • Complex and diverging regulations across multiple geographies Focus on Fees and Margin • Shift to passive investment • Industry consolidation Significant changes are creating challenges for asset management industry participants

43|| We leverage data-driven insights to help our clients grow their business, maintain compliance, and drive engagement Global Distribution Retirement Technology and Analytics Trusted advisor for the front-office of distribution Robust network connecting asset managers, advisors, and investors Driving better financial outcomes for fund investors and retirement participants Customer Journey Management

44|| Data and Analytics Enhanced global data-sets Curated Research and Insights For better decision-making Integrated Platform Distribution Insight Optimizing product and distribution strategy Empowering the front-office of asset managers while mutualizing middle-office distribution costs 1 | GLOBAL DISTRIBUTION 87,000 ETF and Mutual Funds tracked globally $80T Retail and Institutional assets covered $1.7B Market Opportunity
45|| Distribution Insight Video
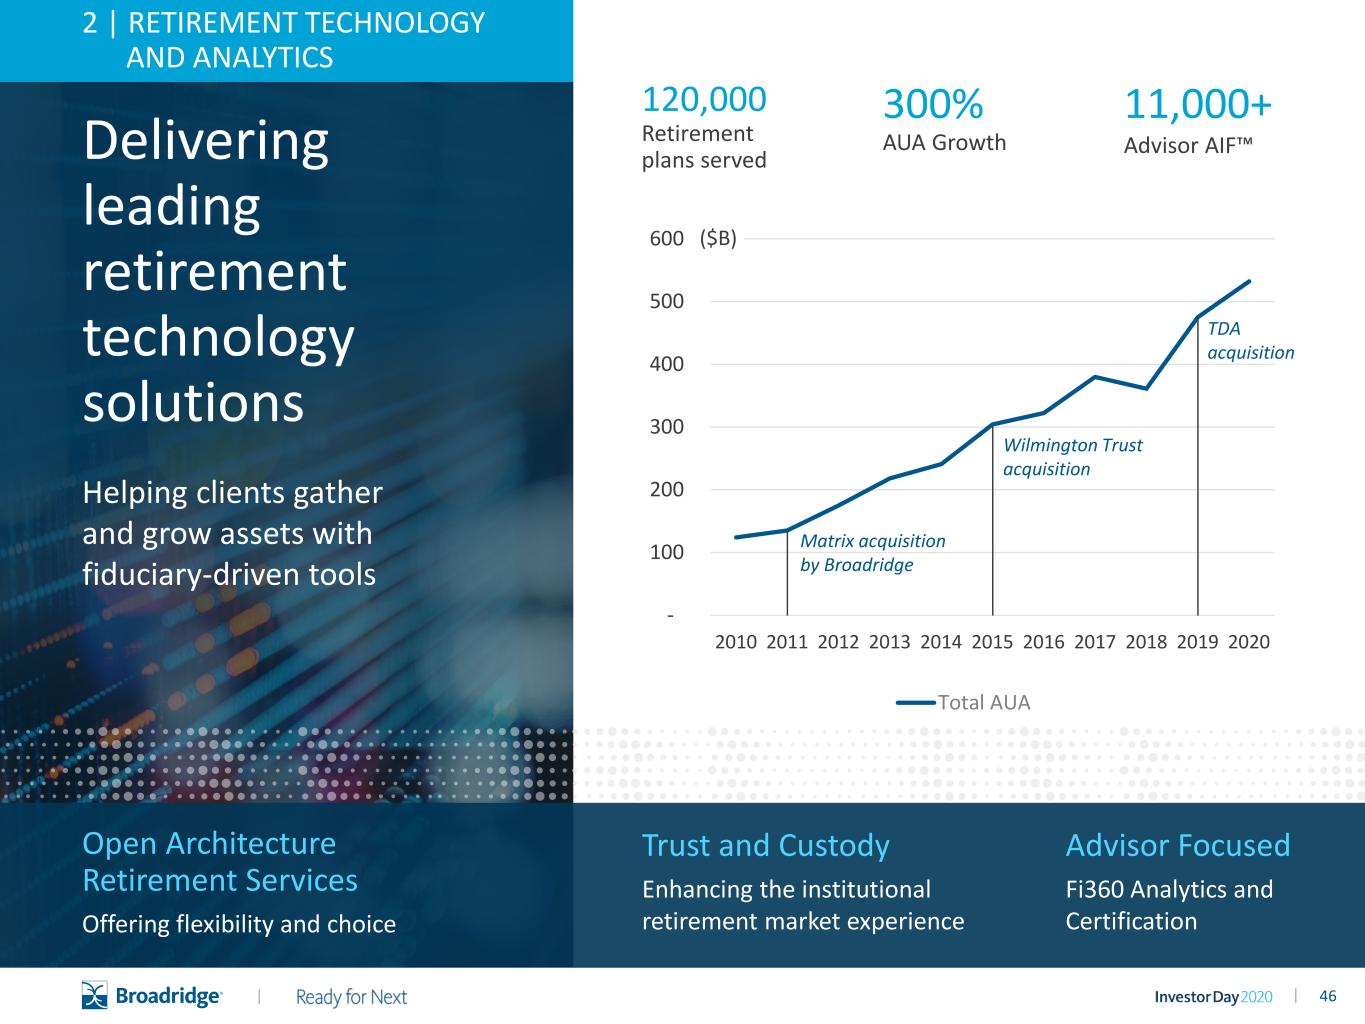
46|| Delivering leading retirement technology solutions Helping clients gather and grow assets with fiduciary-driven tools 2 | RETIREMENT TECHNOLOGY AND ANALYTICS Open Architecture Retirement Services Offering flexibility and choice Trust and Custody Enhancing the institutional retirement market experience Advisor Focused Fi360 Analytics and Certification 300% AUA Growth - 100 200 300 400 500 600 2010 2011 2012 2013 2014 2015 2016 2017 2018 2019 2020 Total AUA ($B) Matrix acquisition by Broadridge TDA acquisition Wilmington Trust acquisition 11,000+ Advisor AIF™ 120,000 Retirement plans served
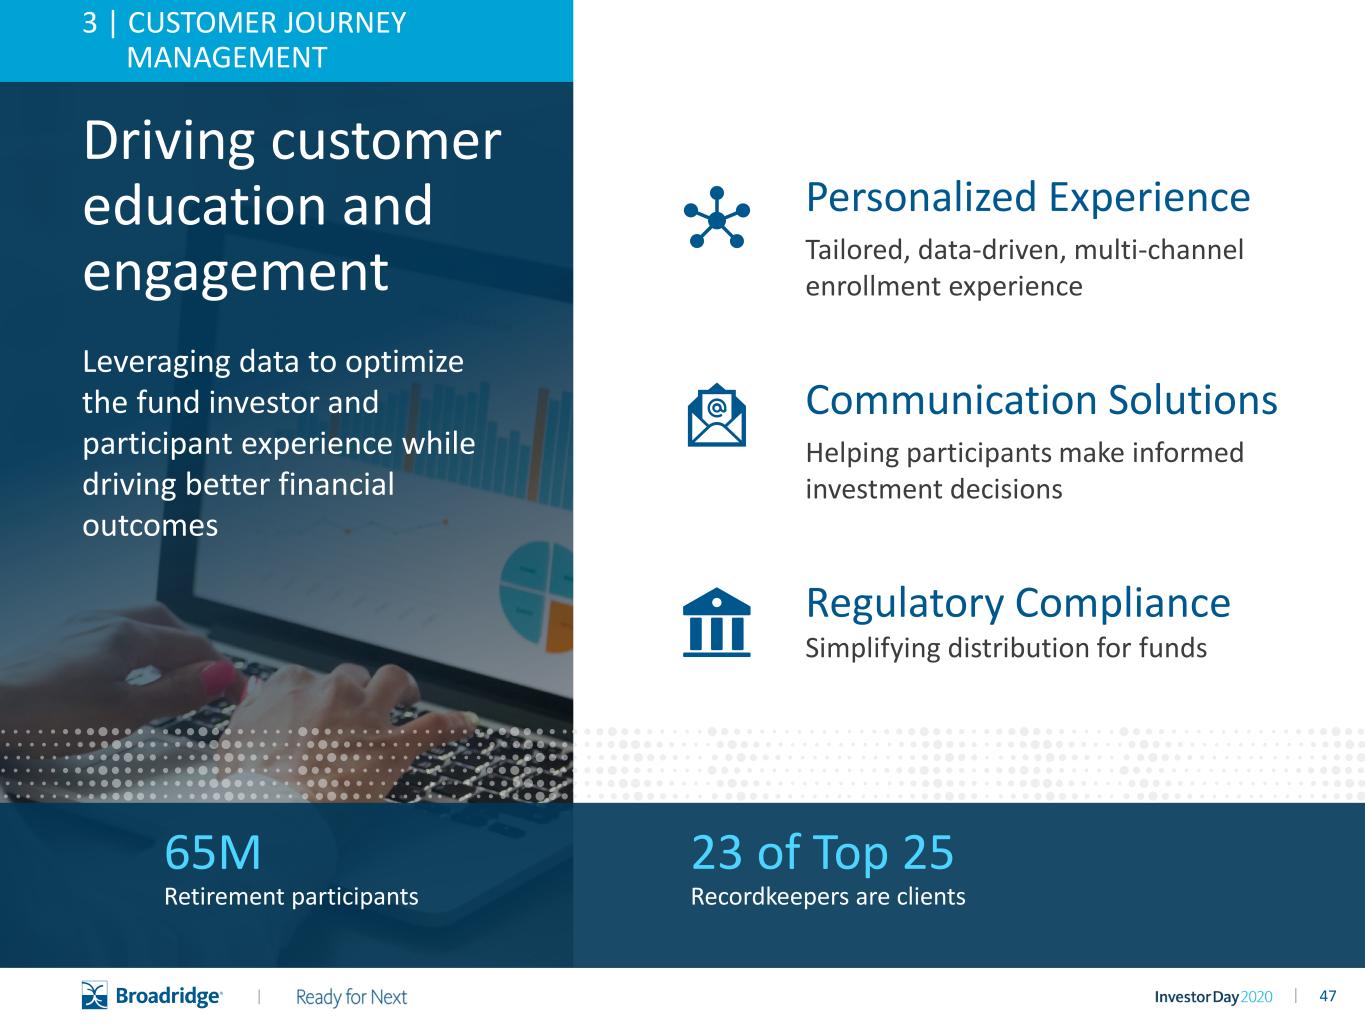
47|| Driving customer education and engagement Leveraging data to optimize the fund investor and participant experience while driving better financial outcomes 65M Retirement participants 23 of Top 25 Recordkeepers are clients 3 | CUSTOMER JOURNEY MANAGEMENT Personalized Experience Tailored, data-driven, multi-channel enrollment experience Communication Solutions Helping participants make informed investment decisions Regulatory Compliance Simplifying distribution for funds
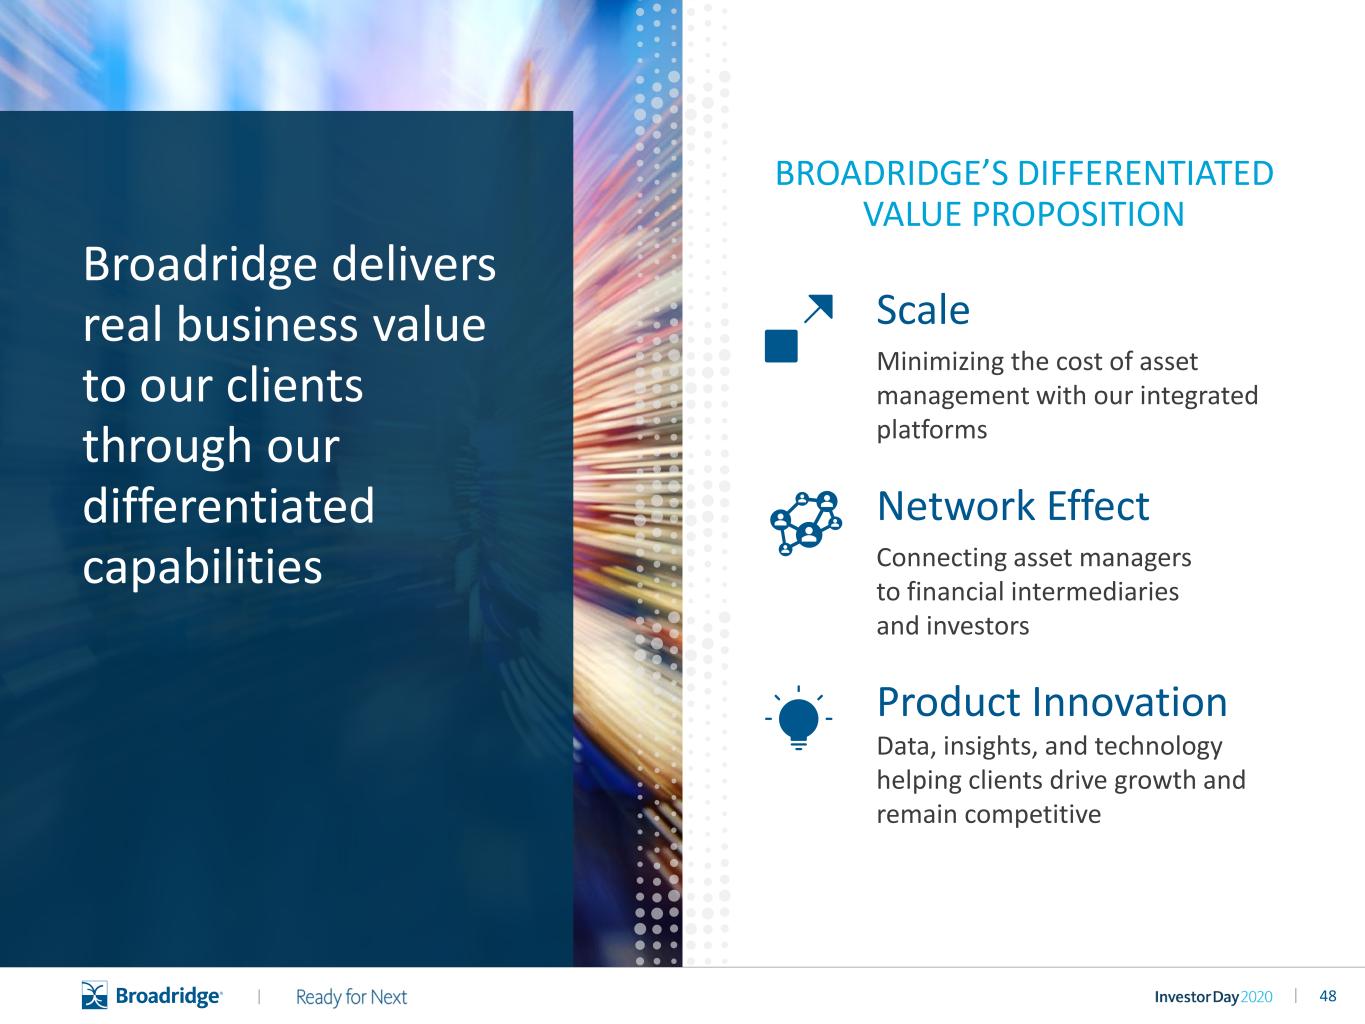
48|| Scale Minimizing the cost of asset management with our integrated platforms Network Effect Connecting asset managers to financial intermediaries and investors Product Innovation Data, insights, and technology helping clients drive growth and remain competitive Broadridge delivers real business value to our clients through our differentiated capabilities BROADRIDGE’S DIFFERENTIATED VALUE PROPOSITION

49||
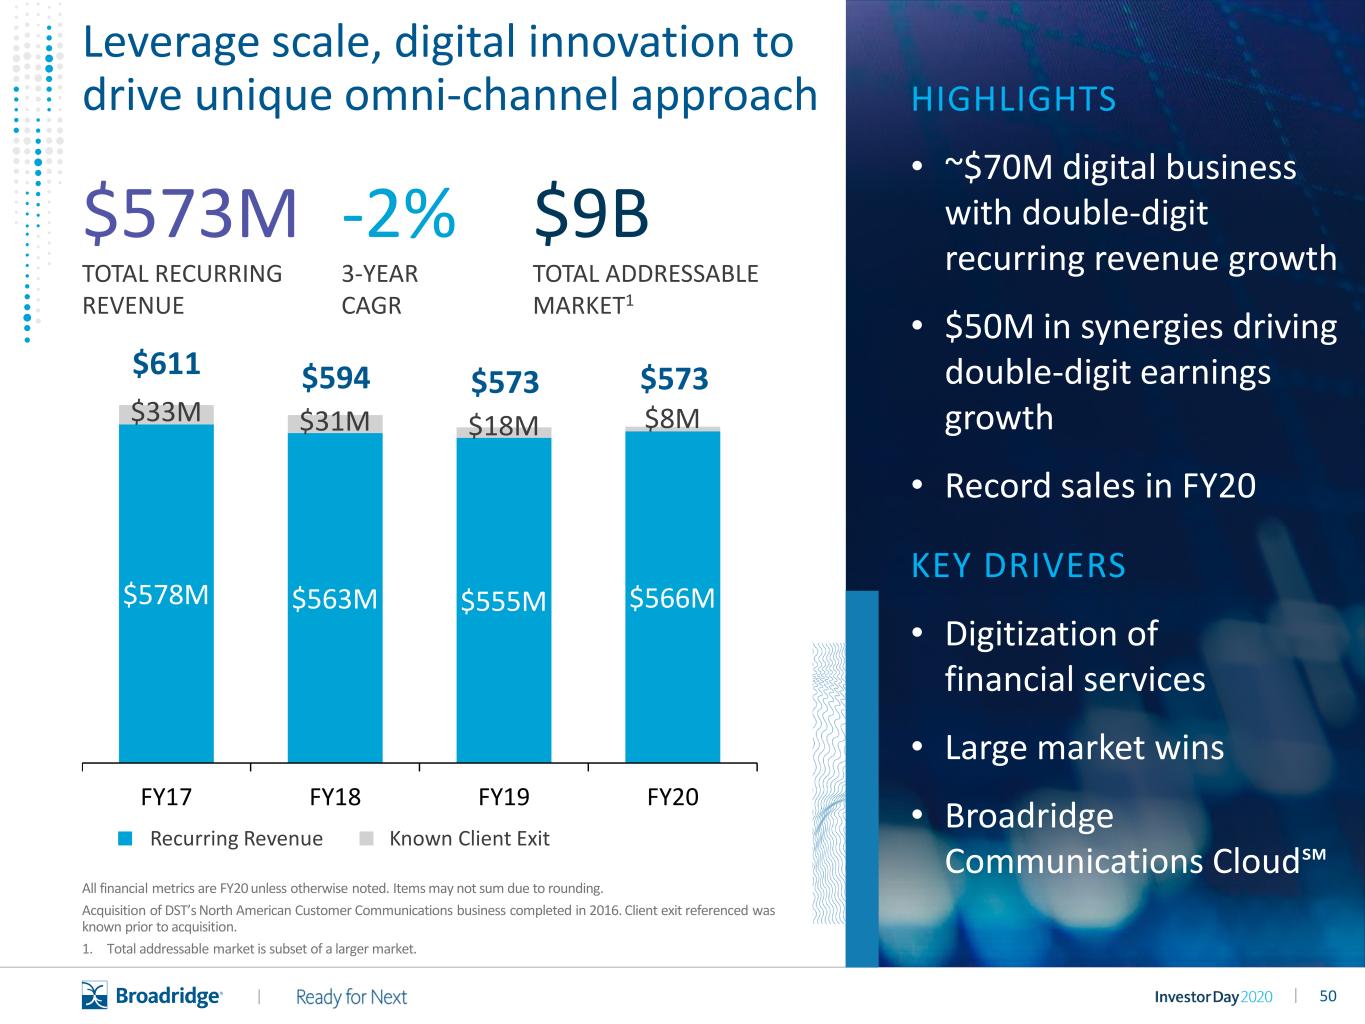
50|| Leverage scale, digital innovation to drive unique omni-channel approach $573M TOTAL RECURRING REVENUE HIGHLIGHTS • ~$70M digital business with double-digit recurring revenue growth • $50M in synergies driving double-digit earnings growth • Record sales in FY20 KEY DRIVERS • Digitization of financial services • Large market wins • Broadridge Communications Cloud℠ $9B TOTAL ADDRESSABLE MARKET1 -2% 3-YEAR CAGR All financial metrics are FY20 unless otherwise noted. Items may not sum due to rounding. Acquisition of DST’s North American Customer Communications business completed in 2016. Client exit referenced was known prior to acquisition. 1. Total addressable market is subset of a larger market. $578M $563M $555M $566M $33M $31M $18M $8M FY17 FY18 FY19 FY20 ■ Recurring Revenue ■ Known Client Exit $611 $594 $573 $573
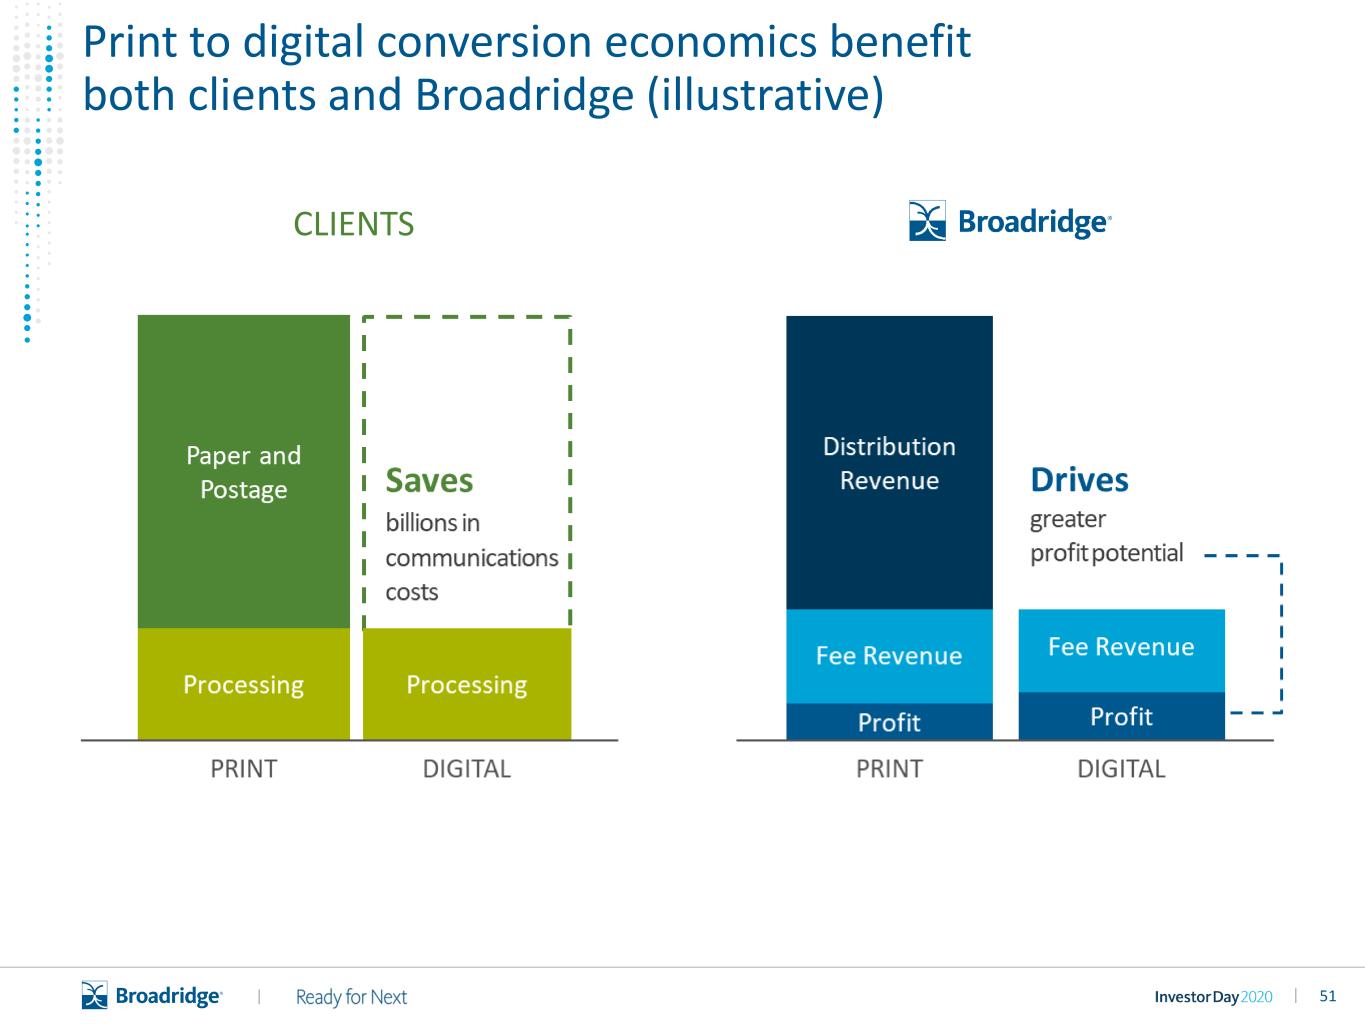
51|| Print to digital conversion economics benefit both clients and Broadridge (illustrative) CLIENTS
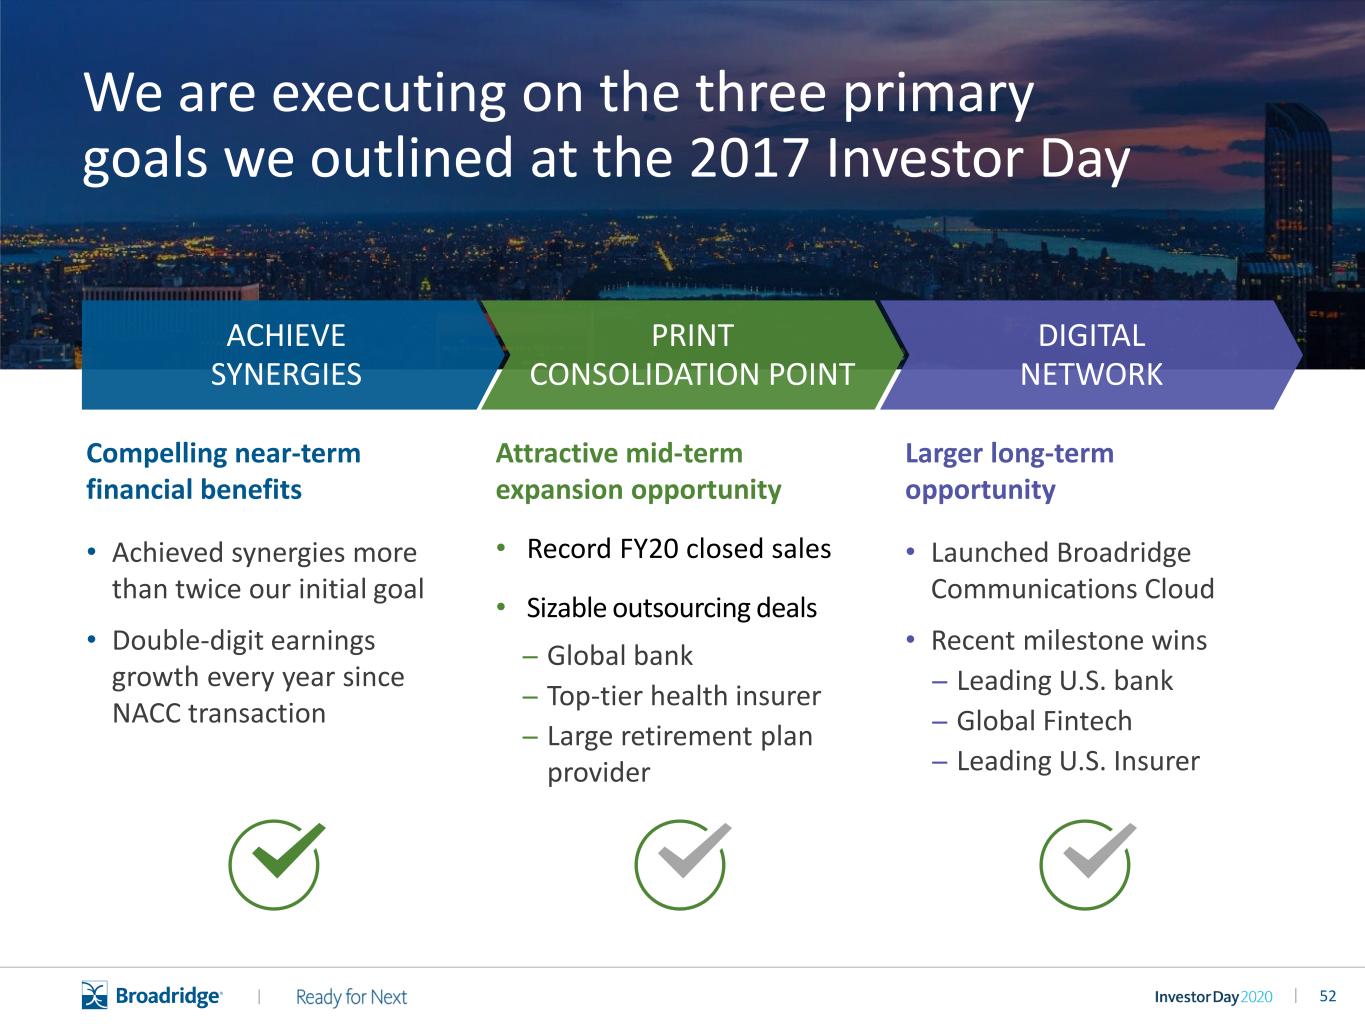
52|| Larger long-term opportunity • Launched Broadridge Communications Cloud • Recent milestone wins ̶ Leading U.S. bank ̶ Global Fintech ̶ Leading U.S. Insurer Compelling near-term financial benefits • Achieved synergies more than twice our initial goal • Double-digit earnings growth every year since NACC transaction Attractive mid-term expansion opportunity • Record FY20 closed sales • Sizable outsourcing deals ̶ Global bank ̶ Top-tier health insurer ̶ Large retirement plan provider PRINT CONSOLIDATION POINT ACHIEVE SYNERGIES DIGITAL NETWORK We are executing on the three primary goals we outlined at the 2017 Investor Day
53|| THERE IS OPPORTUNITY IN FURTHER DIGITIZING FINANCIAL SERVICES Financial institutions continue to meet the needs of digitizing their customer base in the broad sense with more efficient and cost-effective services, such as robo-advisors, trading apps, online banking, and mobile services Yet, the majority still struggle to digitize communications
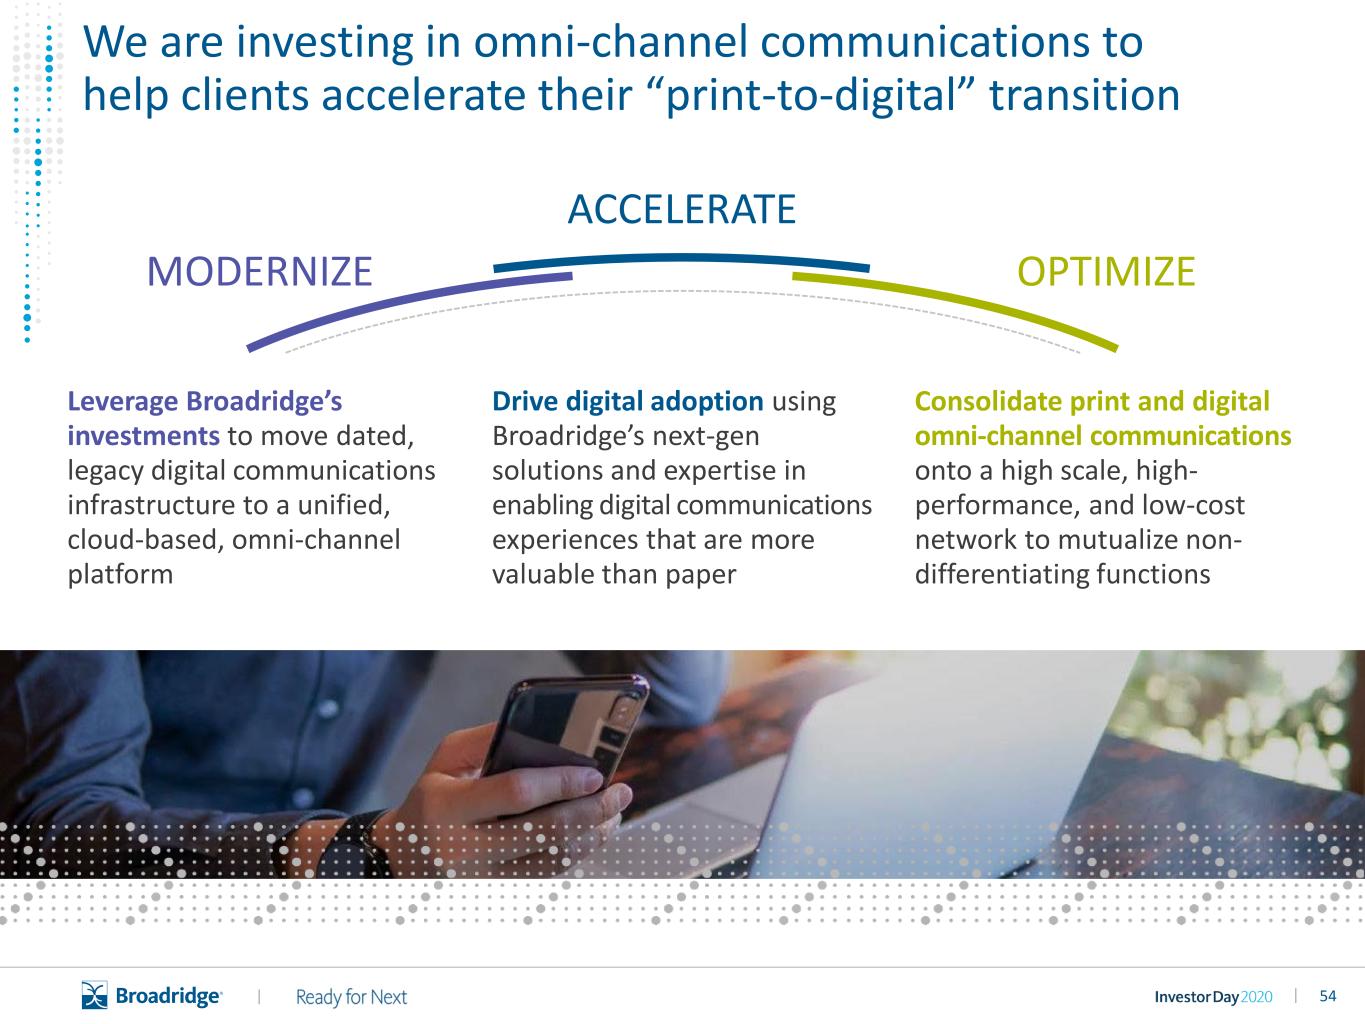
54|| Leverage Broadridge’s investments to move dated, legacy digital communications infrastructure to a unified, cloud-based, omni-channel platform Consolidate print and digital omni-channel communications onto a high scale, high- performance, and low-cost network to mutualize non- differentiating functions MODERNIZE ACCELERATE OPTIMIZE Drive digital adoption using Broadridge’s next-gen solutions and expertise in enabling digital communications experiences that are more valuable than paper We are investing in omni-channel communications to help clients accelerate their “print-to-digital” transition
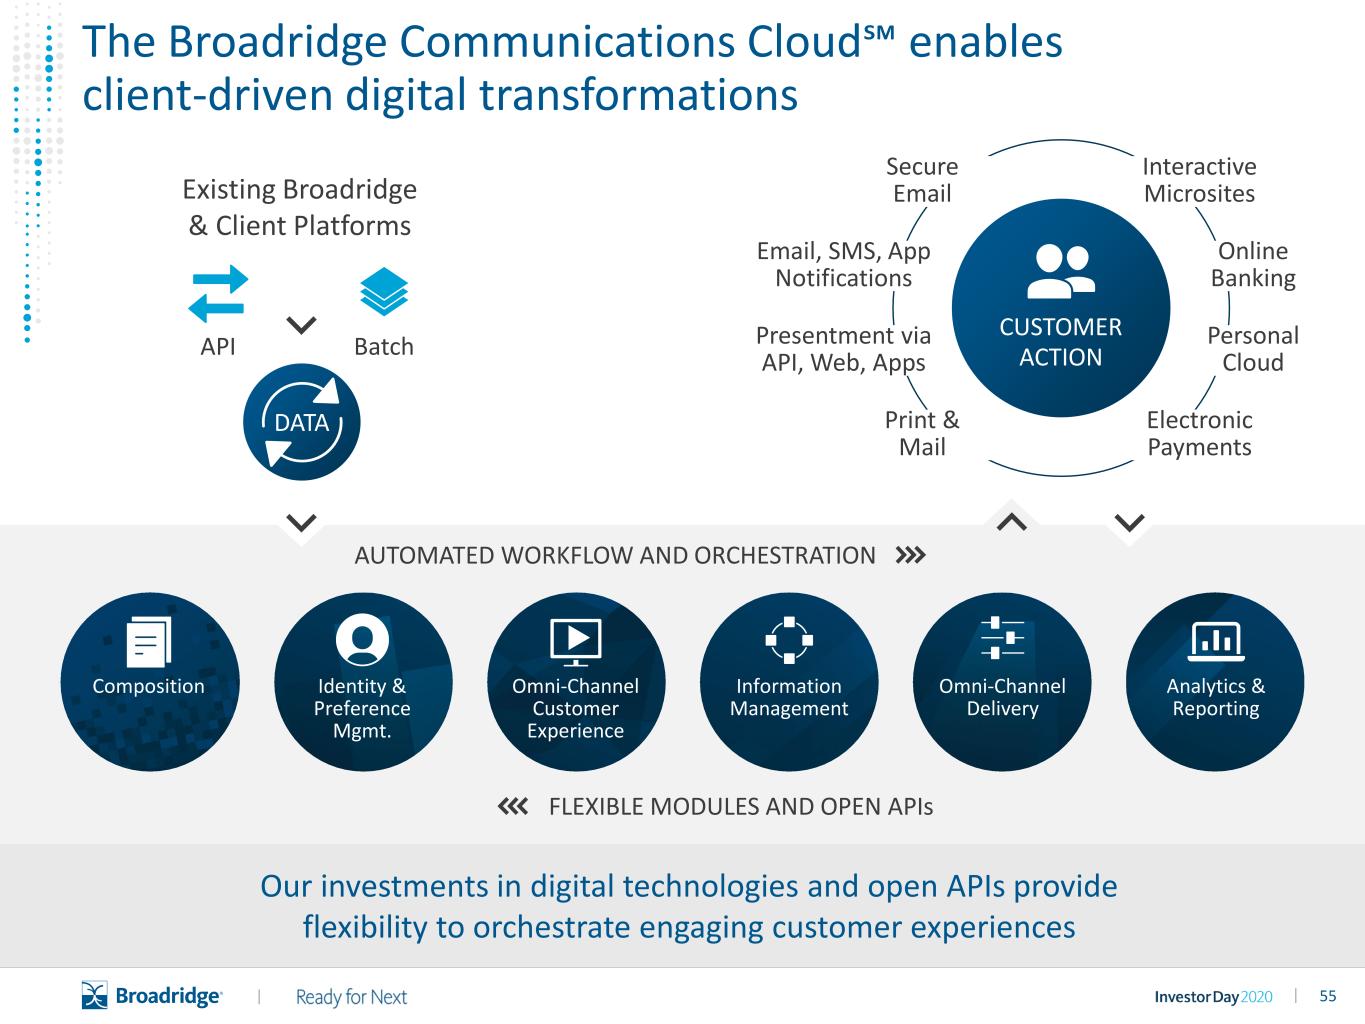
55|| AUTOMATED WORKFLOW AND ORCHESTRATION FLEXIBLE MODULES AND OPEN APIs Existing Broadridge & Client Platforms API Batch DATA Composition Analytics & Reporting Identity & Preference Mgmt. Omni-Channel Customer Experience Information Management Omni-Channel Delivery CUSTOMER ACTION Email, SMS, App Notifications Presentment via API, Web, Apps Online Banking Personal Cloud Print & Mail Secure Email Interactive Microsites Electronic Payments The Broadridge Communications Cloud℠ enables client-driven digital transformations Our investments in digital technologies and open APIs provide flexibility to orchestrate engaging customer experiences
56|| Communications Cloud Video
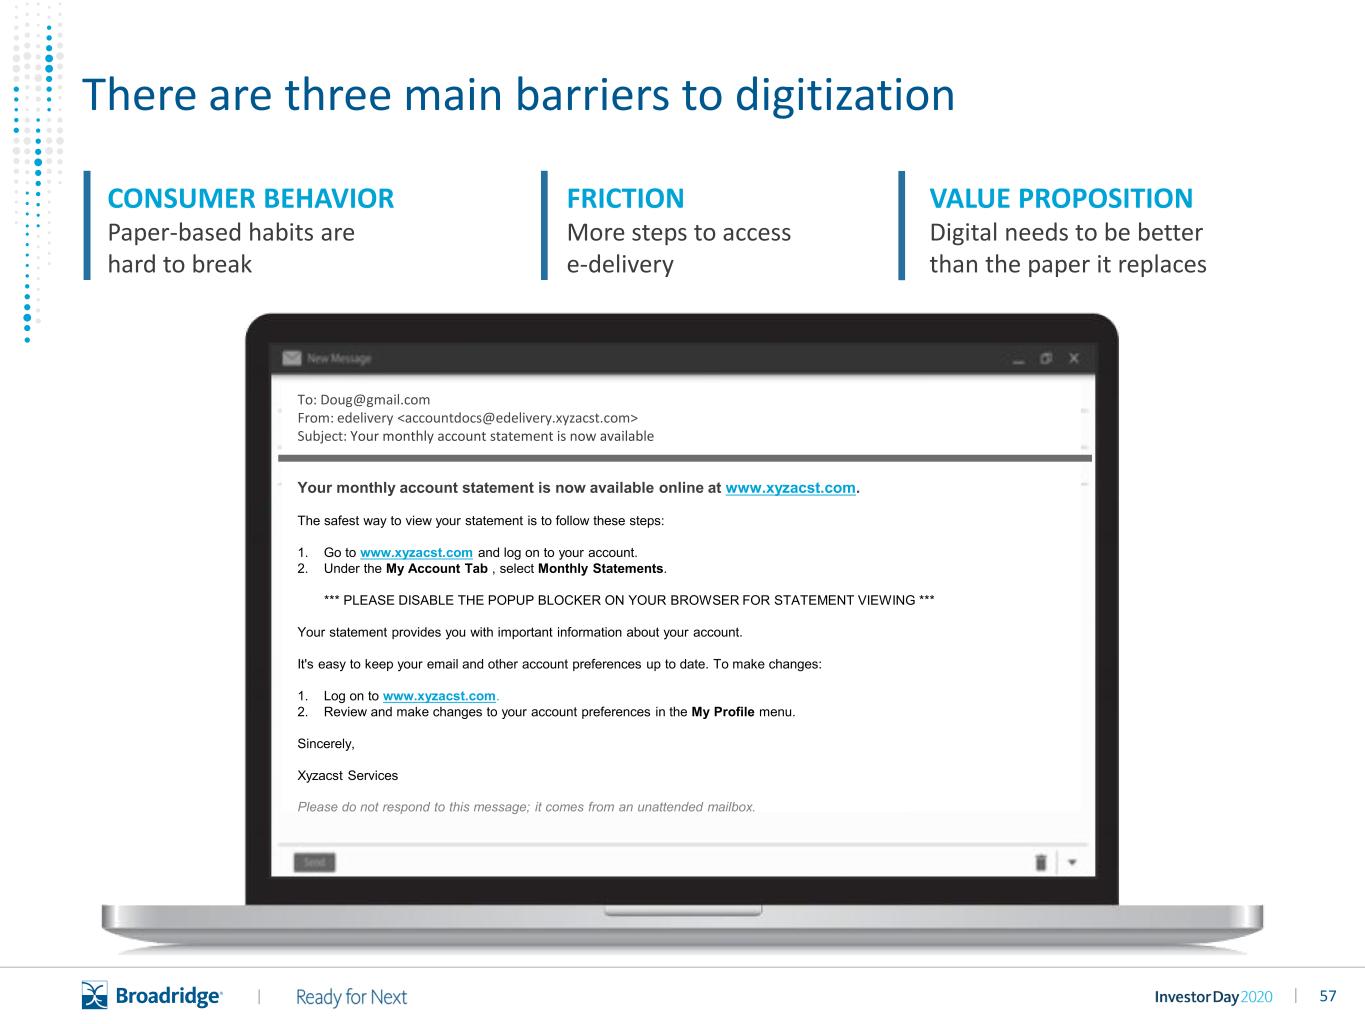
57|| FRICTION More steps to access e-delivery Your monthly account statement is now available online at www.xyzacst.com. The safest way to view your statement is to follow these steps: 1. Go to www.xyzacst.com and log on to your account. 2. Under the My Account Tab , select Monthly Statements. *** PLEASE DISABLE THE POPUP BLOCKER ON YOUR BROWSER FOR STATEMENT VIEWING *** Your statement provides you with important information about your account. It's easy to keep your email and other account preferences up to date. To make changes: 1. Log on to www.xyzacst.com. 2. Review and make changes to your account preferences in the My Profile menu. Sincerely, Xyzacst Services Please do not respond to this message; it comes from an unattended mailbox. To: Doug@gmail.com From: edelivery <accountdocs@edelivery.xyzacst.com> Subject: Your monthly account statement is now available CONSUMER BEHAVIOR Paper-based habits are hard to break VALUE PROPOSITION Digital needs to be better than the paper it replaces There are three main barriers to digitization
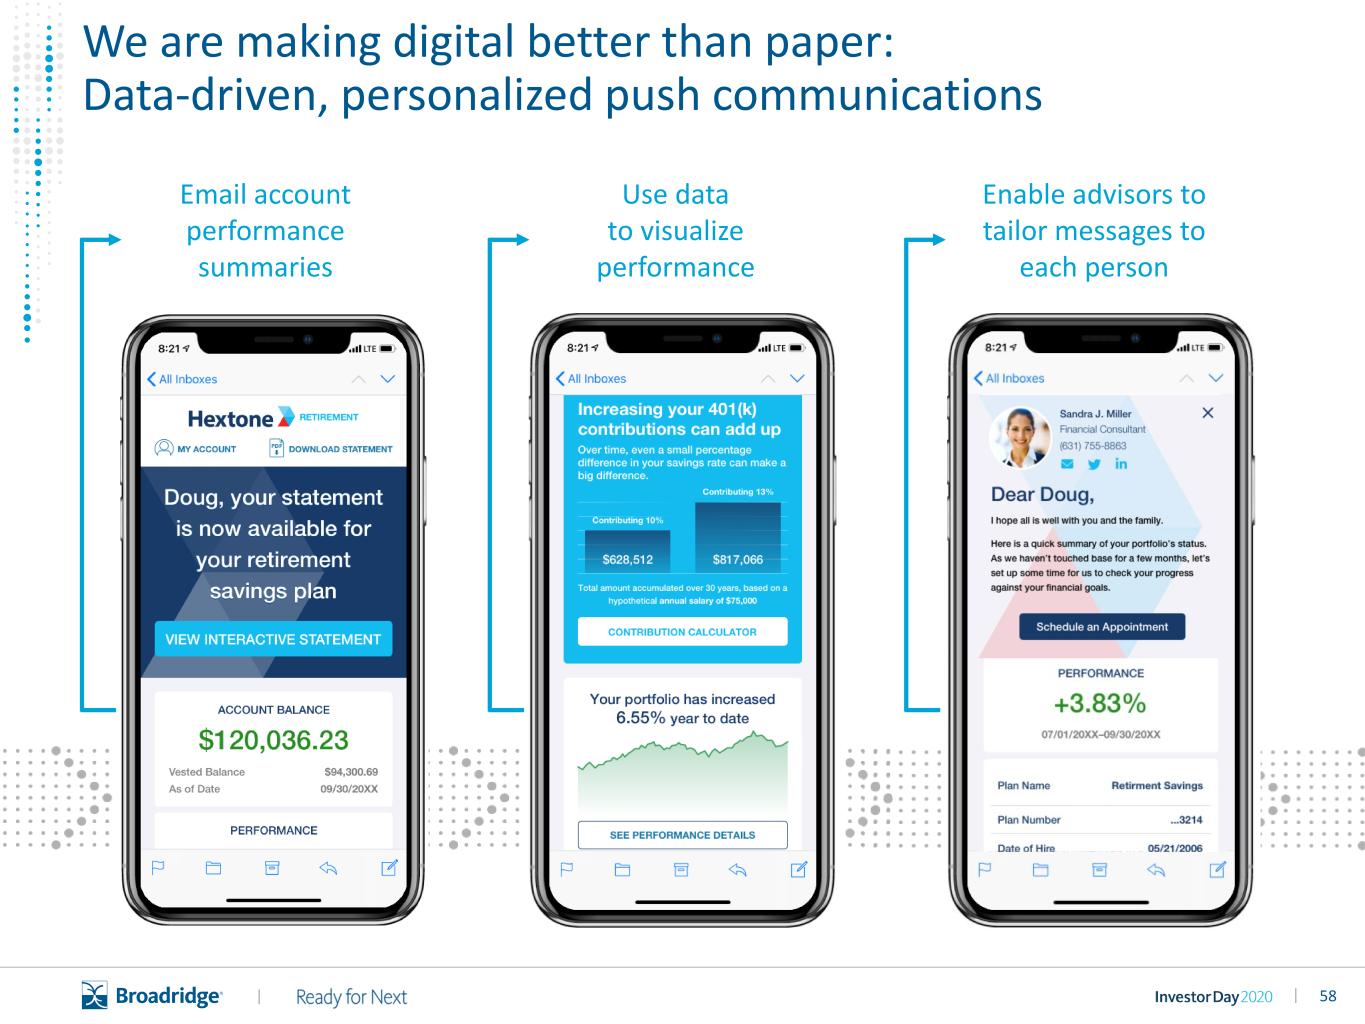
58|| Email account performance summaries Use data to visualize performance Enable advisors to tailor messages to each person We are making digital better than paper: Data-driven, personalized push communications
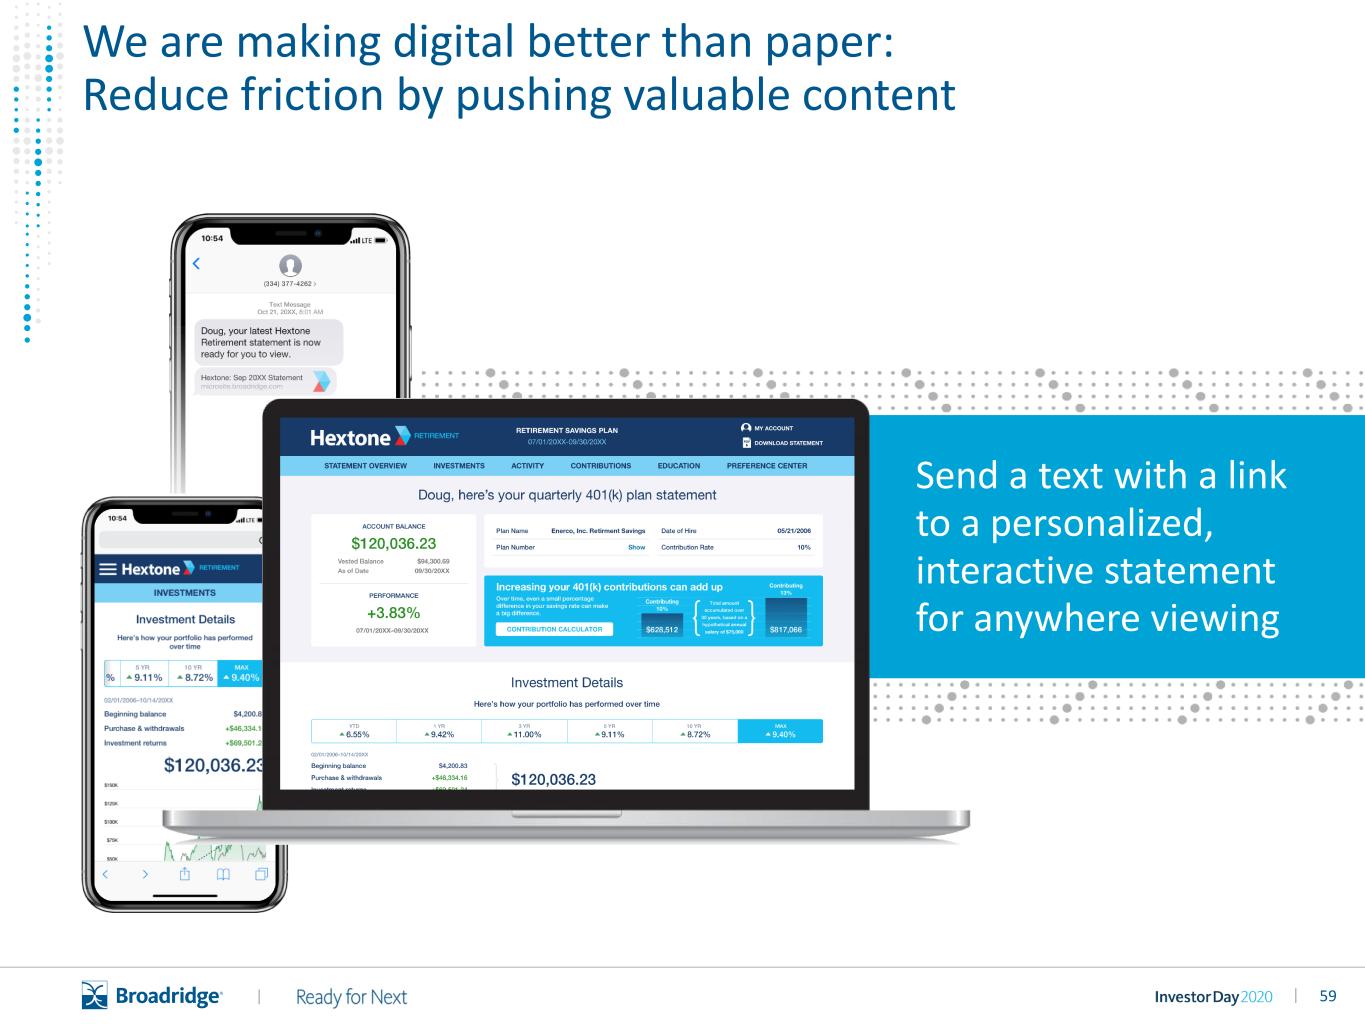
59|| Send a text with a link to a personalized, interactive statement for anywhere viewing American Century Capital Value Fund – Shareholder Action Required We are making digital better than paper: Reduce friction by pushing valuable content

60|| ONE STEP ACCELERATE DIGITAL ADOPTION by creating a synchronized, seamless experience USE QR CODES TO ENGAGE CUSTOMERS IN AN INTERACTIVE AND EFFORTLESS EXPERIENCE USE INNOVATIVE TECHNIQUES on your transactional, marketing, and regulatory print communications to drive digital engagement Making digital better than paper: Deploy print-to-digital accelerators
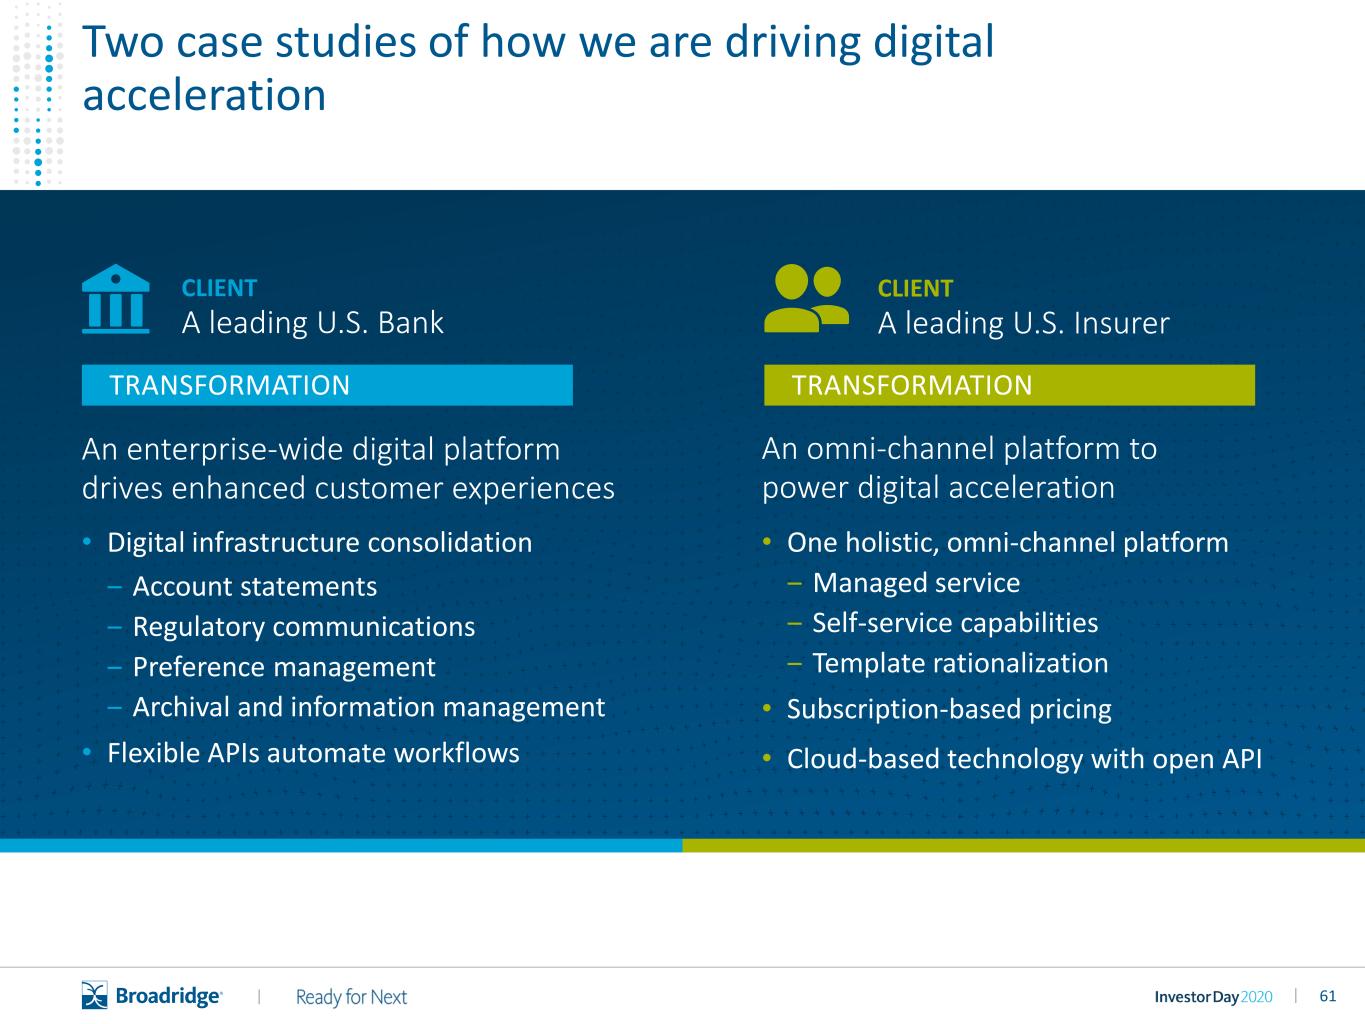
61|| Two case studies of how we are driving digital acceleration CLIENT A leading U.S. Insurer • One holistic, omni-channel platform ‒ Managed service ‒ Self-service capabilities ‒ Template rationalization • Subscription-based pricing • Cloud-based technology with open API An enterprise-wide digital platform drives enhanced customer experiences TRANSFORMATION • Digital infrastructure consolidation ‒ Account statements ‒ Regulatory communications ‒ Preference management ‒ Archival and information management • Flexible APIs automate workflows CLIENT A leading U.S. Bank An omni-channel platform to power digital acceleration TRANSFORMATION
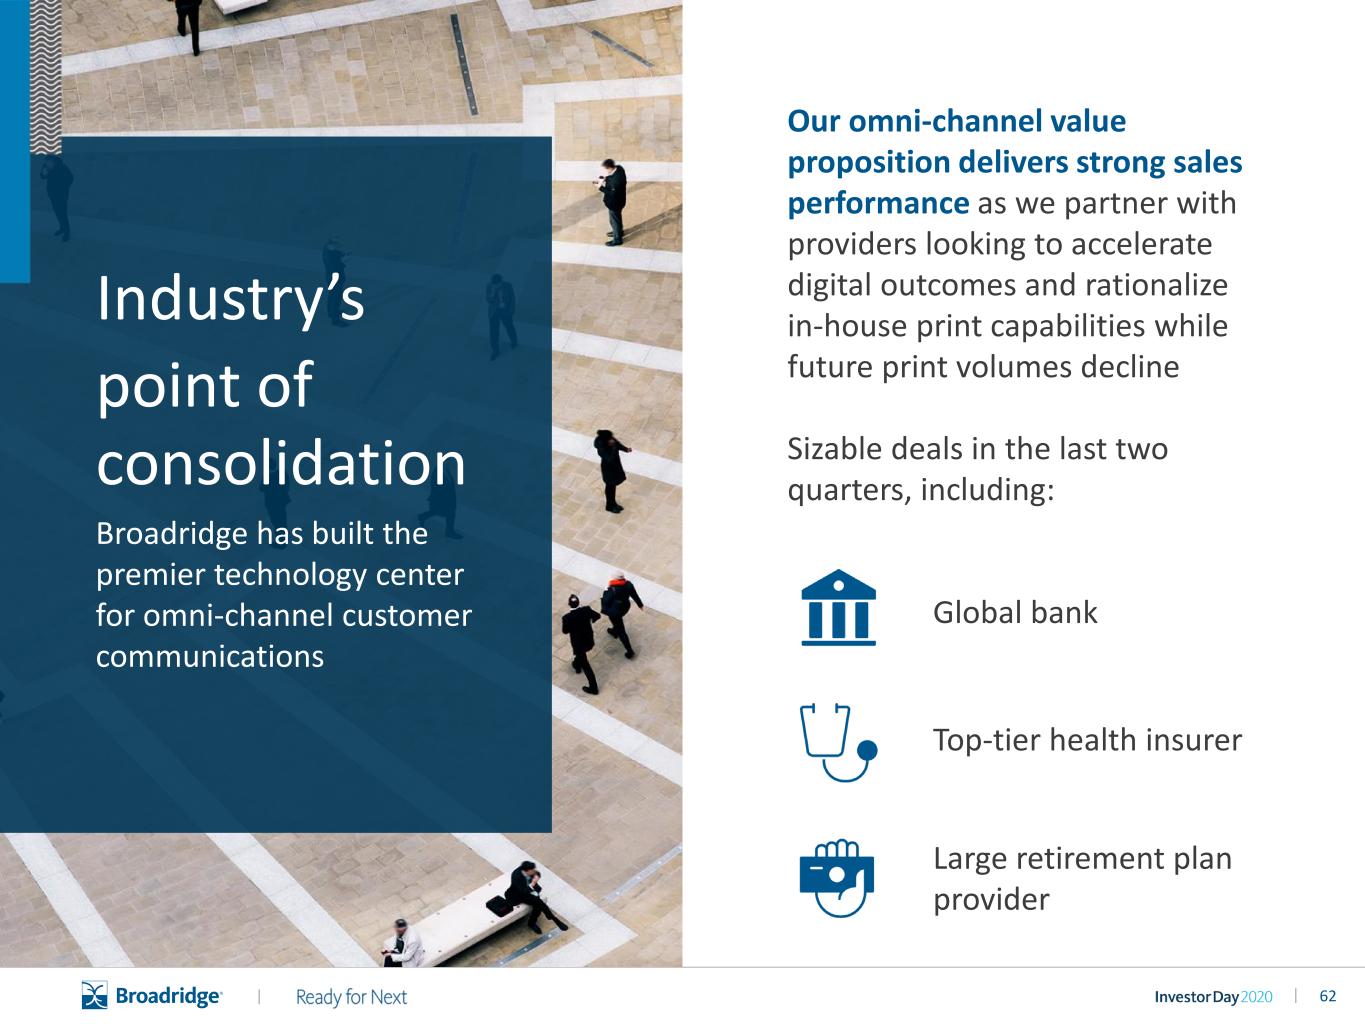
62|| Industry’s point of consolidation Broadridge has built the premier technology center for omni-channel customer communications Our omni-channel value proposition delivers strong sales performance as we partner with providers looking to accelerate digital outcomes and rationalize in-house print capabilities while future print volumes decline Sizable deals in the last two quarters, including: Global bank Top-tier health insurer Large retirement plan provider
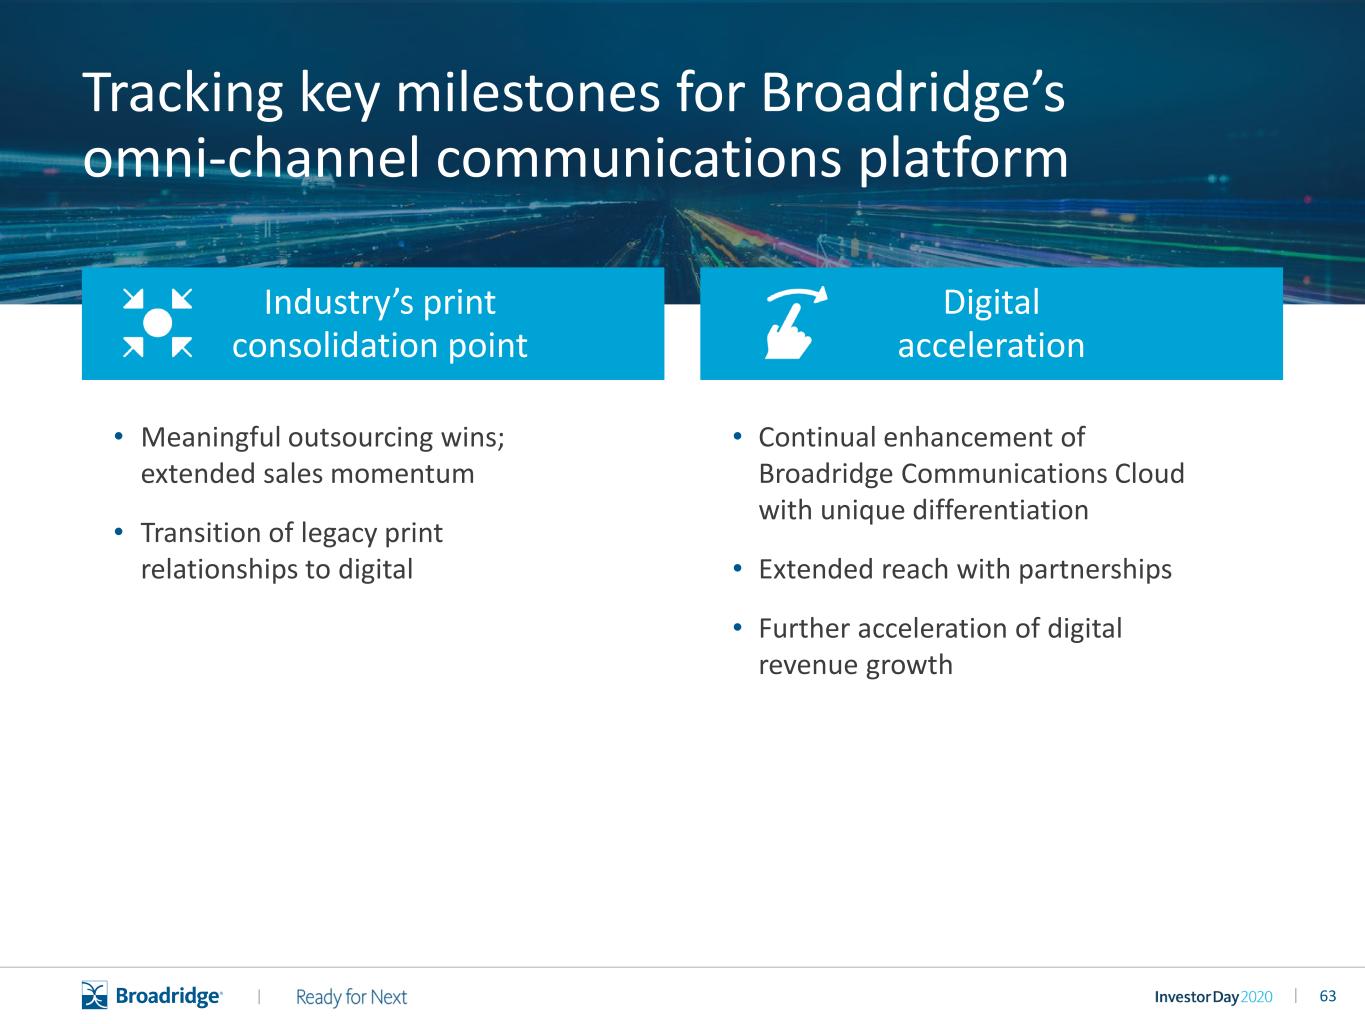
63|| • Meaningful outsourcing wins; extended sales momentum • Transition of legacy print relationships to digital • Continual enhancement of Broadridge Communications Cloud with unique differentiation • Extended reach with partnerships • Further acceleration of digital revenue growth Industry’s print consolidation point Digital acceleration Tracking key milestones for Broadridge’s omni-channel communications platform
64||

65|| Unique network with strong underlying macro drivers and a large global market opportunity Powering greater investor engagement through next-generation regulatory communications Providing corporate issuers with a growing range of governance and regulatory needs Driving next-generation digital communications while optimizing print and mail Enabling asset managers to grow and retain revenue through data-driven solutions Drive Next-Gen Regulatory Grow End-to-End Issuer Solutions Build Data-Driven Fund Solutions Transform Omni-Channel Communications Our Governance franchise draws on our unique capabilities and is supported by four key themes Governance

66||
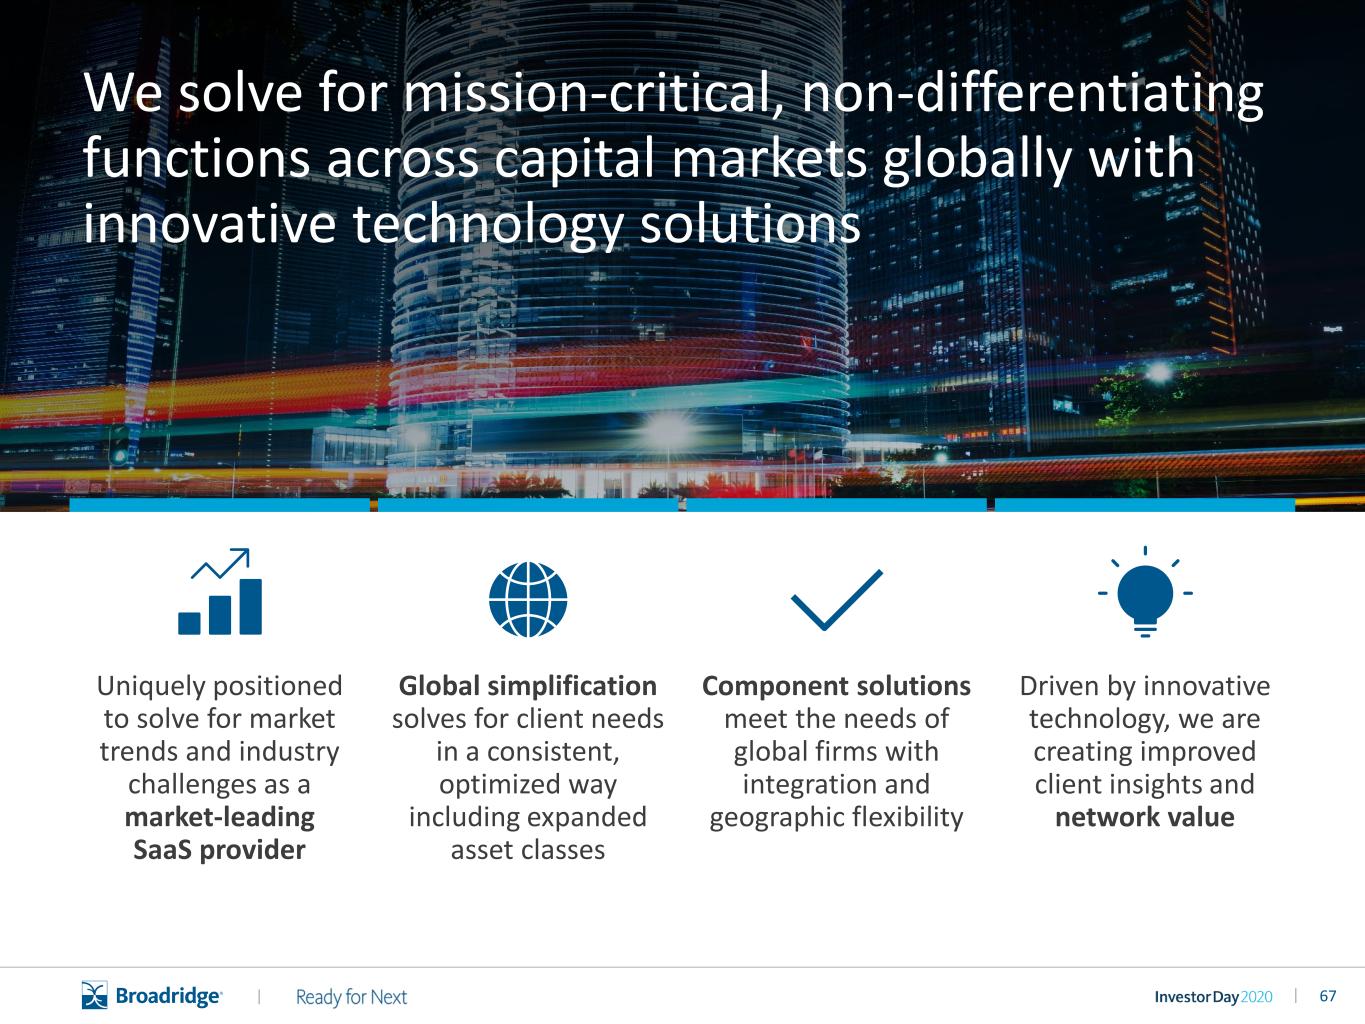
67|| Uniquely positioned to solve for market trends and industry challenges as a market-leading SaaS provider Global simplification solves for client needs in a consistent, optimized way including expanded asset classes Component solutions meet the needs of global firms with integration and geographic flexibility Driven by innovative technology, we are creating improved client insights and network value We solve for mission-critical, non-differentiating functions across capital markets globally with innovative technology solutions

68|| $517M $569M $591M $650M FY17 FY18 FY19 FY20 $650M TOTAL RECURRING REVENUE KEY DRIVERS • Delivery of next-gen post-trade platform • Launch of new SaaS solutions • Strong sales momentum • Onboarding of major clients 8% 3-YEAR CAGR All financial metrics are FY20 unless otherwise noted. $15B TOTAL ADDRESSABLE MARKET Our Capital Markets franchise drives meaningful growth with strong sales momentum
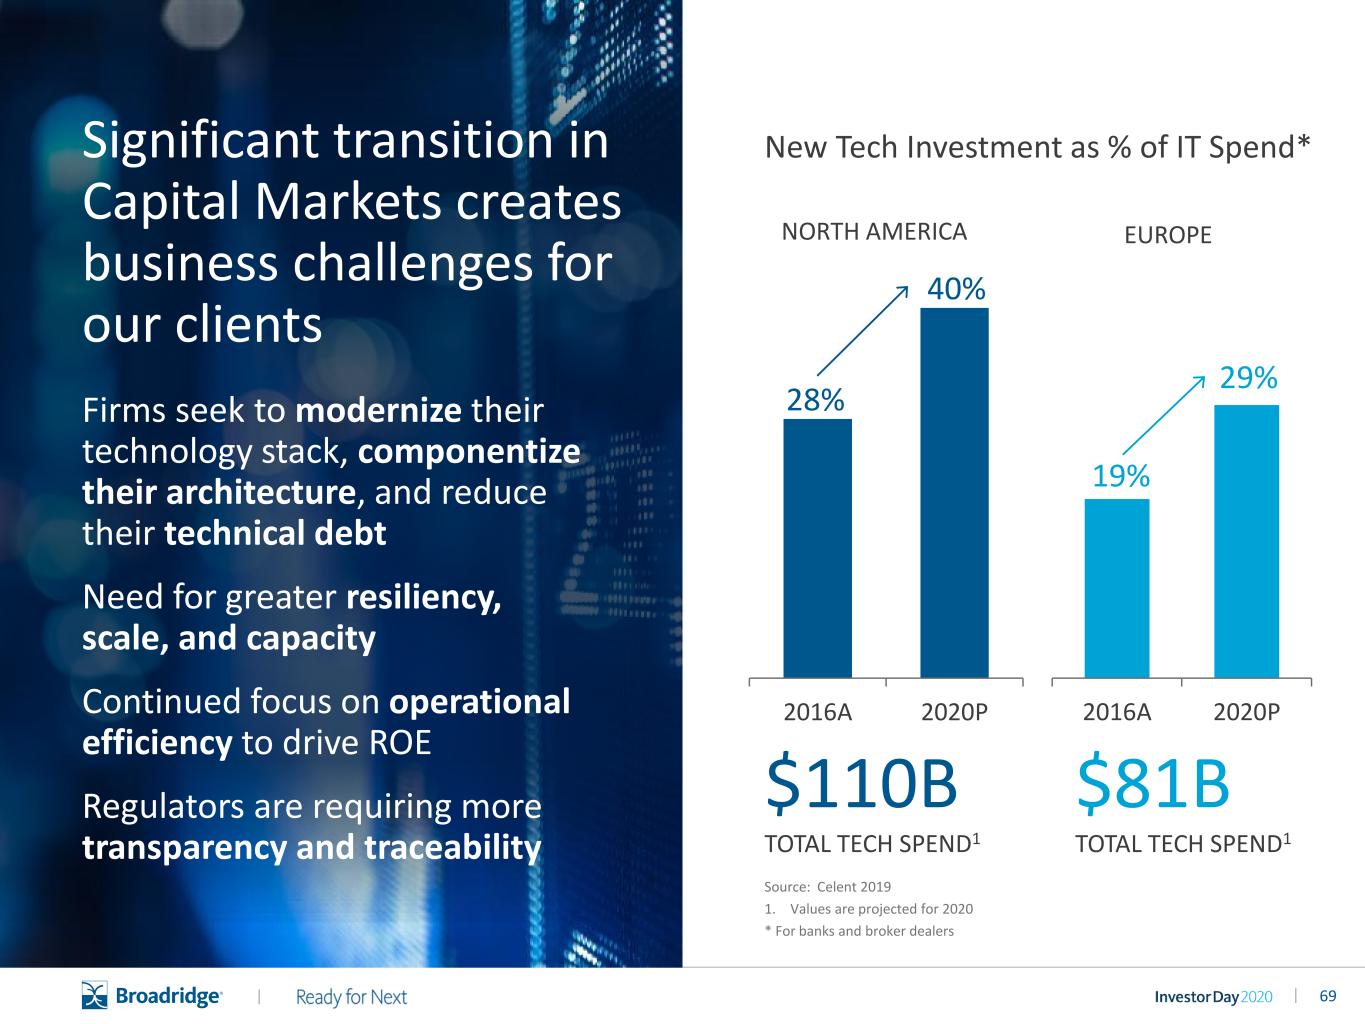
69|| Significant transition in Capital Markets creates business challenges for our clients Firms seek to modernize their technology stack, componentize their architecture, and reduce their technical debt Need for greater resiliency, scale, and capacity Continued focus on operational efficiency to drive ROE Regulators are requiring more transparency and traceability 28% 40% 2016A 2020P NORTH AMERICA 19% 29% 2016A 2020P EUROPE New Tech Investment as % of IT Spend* $110B TOTAL TECH SPEND1 $81B TOTAL TECH SPEND1 Source: Celent 2019 1. Values are projected for 2020 * For banks and broker dealers

70|| Comprehensive solutions that span the post-trade lifecycle end-to-end 19 of 24 U.S. primary dealers use Broadridge’s institutional fixed income trading platform 11 of top 15 process equities for top global investment banks 75+ self-clearing U.S. broker- dealers use Broadridge’s platform 100+ countries supported in multi-asset trade processing $10T in equity and fixed income trades processed per day Providing scale and unique insight on clients’ trading and operational activities We fill a critical role in the post-trade ecosystem delivering scalable, resilient technology

71|| We execute our strategy across three growth opportunities Drive global simplification in post-trade Combine data and technology to create network value Deliver new components, solutions, and services
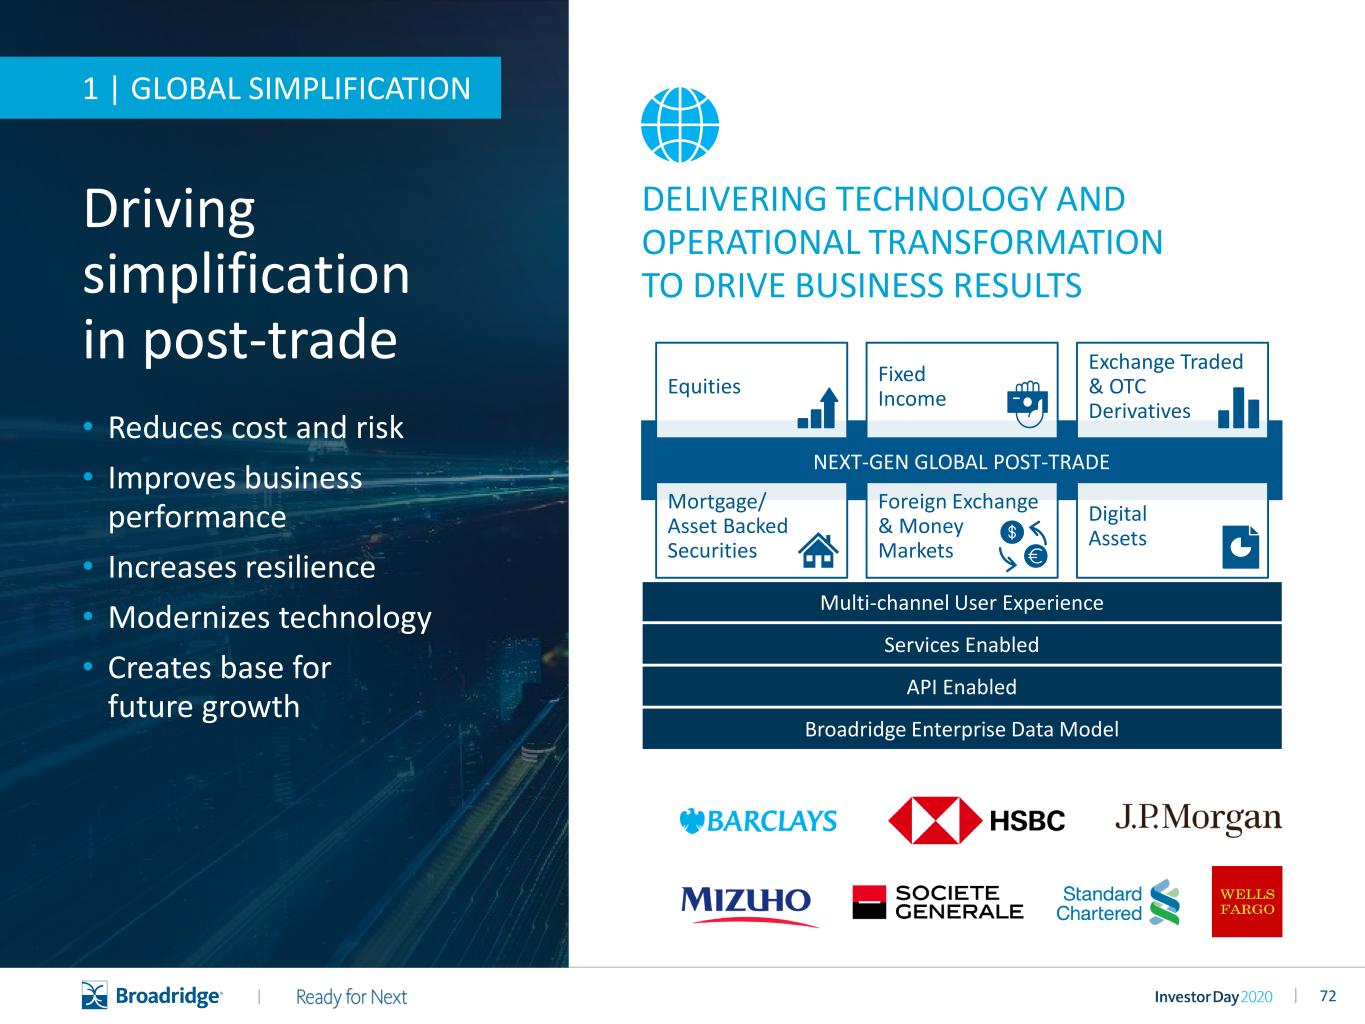
72|| Driving simplification in post-trade • Reduces cost and risk • Improves business performance • Increases resilience • Modernizes technology • Creates base for future growth DELIVERING TECHNOLOGY AND OPERATIONAL TRANSFORMATION TO DRIVE BUSINESS RESULTS NEXT-GEN GLOBAL POST-TRADE Multi-channel User Experience Services Enabled API Enabled Broadridge Enterprise Data Model Equities FixedIncome Exchange Traded & OTC Derivatives Foreign Exchange & Money Markets Digital Assets Mortgage/ Asset Backed Securities 1 | GLOBAL SIMPLIFICATION
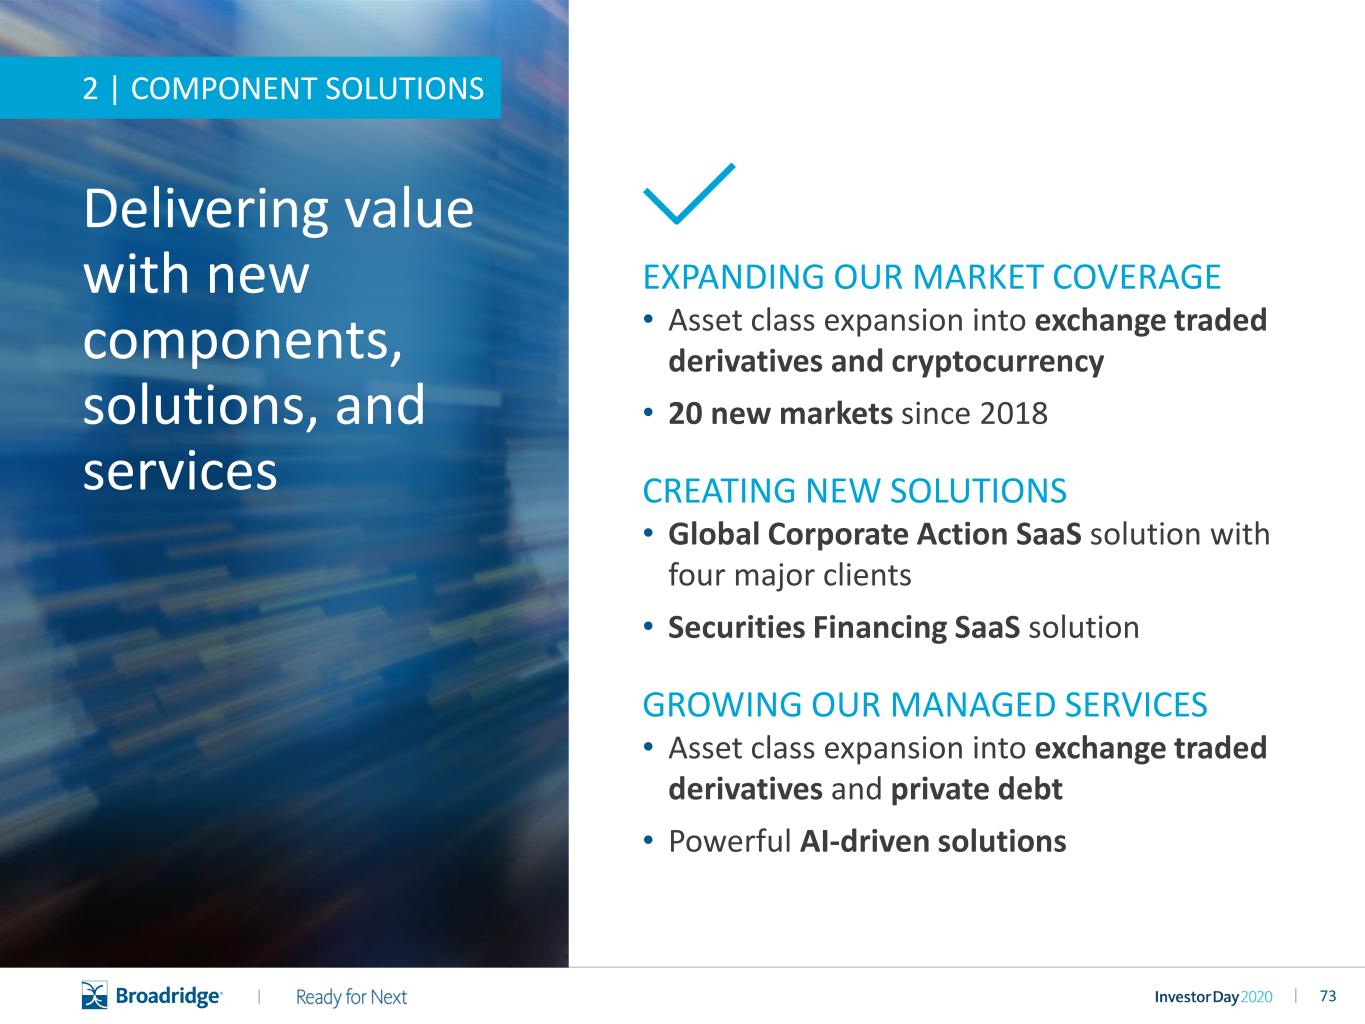
73|| Delivering value with new components, solutions, and services EXPANDING OUR MARKET COVERAGE • Asset class expansion into exchange traded derivatives and cryptocurrency • 20 new markets since 2018 CREATING NEW SOLUTIONS • Global Corporate Action SaaS solution with four major clients • Securities Financing SaaS solution GROWING OUR MANAGED SERVICES • Asset class expansion into exchange traded derivatives and private debt • Powerful AI-driven solutions 2 | COMPONENT SOLUTIONS
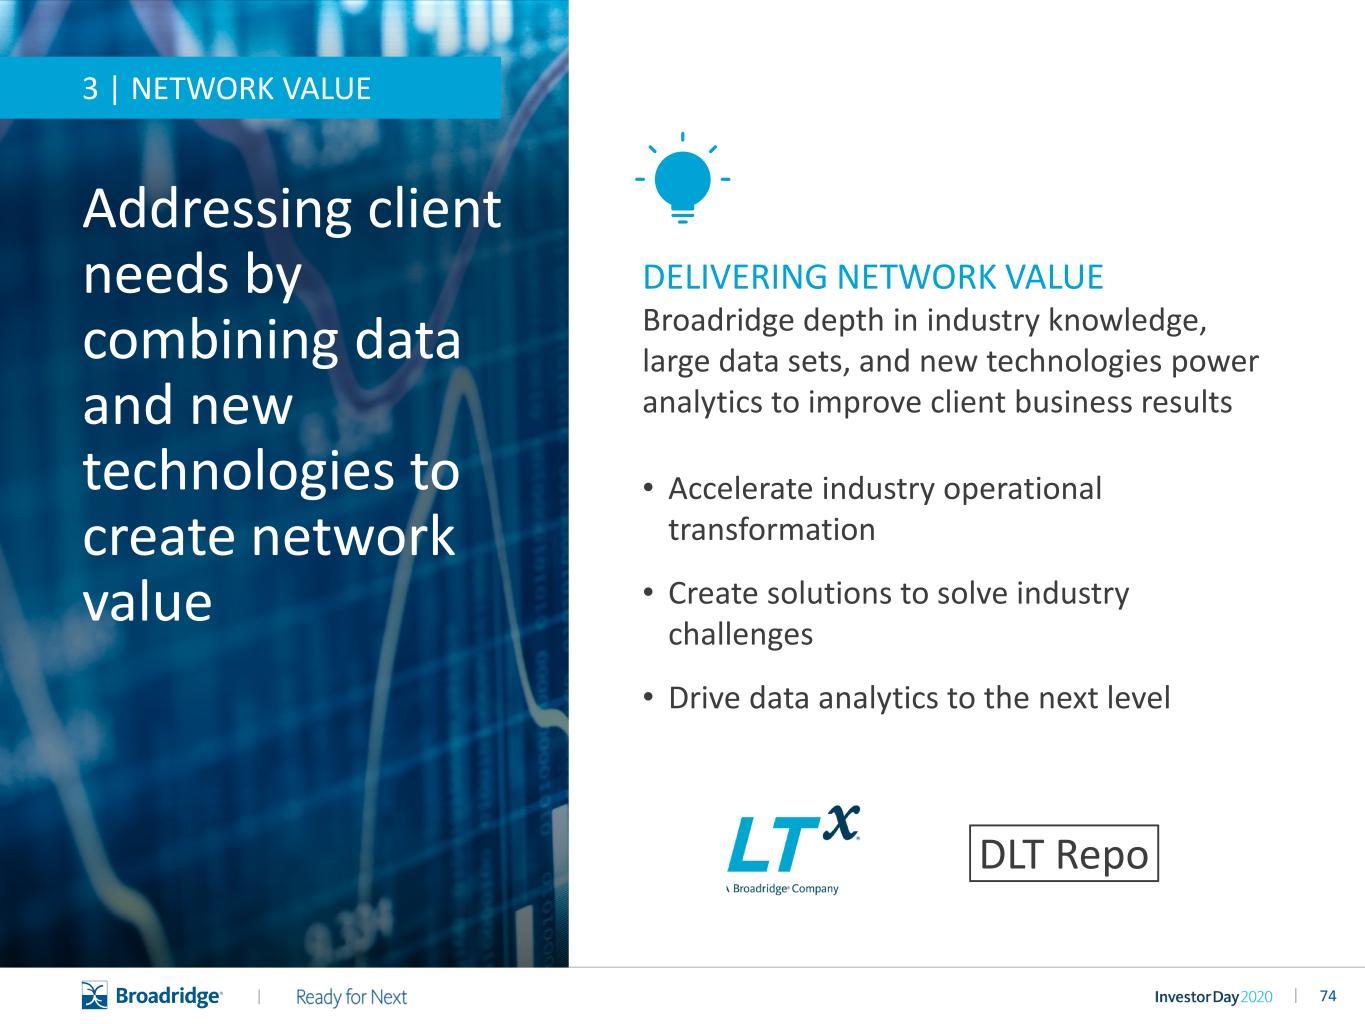
74|| Addressing client needs by combining data and new technologies to create network value DELIVERING NETWORK VALUE Broadridge depth in industry knowledge, large data sets, and new technologies power analytics to improve client business results • Accelerate industry operational transformation • Create solutions to solve industry challenges • Drive data analytics to the next level DLT Repo 3 | NETWORK VALUE
75|| LTX Video
76|| LTX is our fixed income trading platform combining AI and next-generation protocols Expected to launch Q3 FY21 with 10 dealers and over 35 buy-side customers Aiming to digitize trading for the nearly $10 trillion U.S. corporate bond market Utilizes powerful AI to identify natural buyers and sellers of corporate bonds Instantly aggregates liquidity among hundreds of customers through a next-gen protocol, RFX Our proprietary analytics and digitized workflows allow dealers to trade more efficiently, grow revenue by creating trading opportunities, and deliver improved best execution to their customers
77|| Our Distributed Ledger Repo solution increases efficiency and reduces costs and risk in bi-lateral repo transactions Generates cost savings in the $2 trillion bi-lateral repo market Creates operational efficiencies by reducing custodian, tri-party and Fed costs due to immobilization of collateral Reduces operational costs and risk via synchronized workflows, eliminating reconciliations and fails
78|| We solve for mission-critical, non-differentiating functions across capital markets globally with innovative technology solutions Uniquely positioned to solve for market trends and industry challenges as a market-leading SaaS provider Global simplification solves for client needs in a consistent, optimized way including expanded asset classes Component solutions meet the needs of global firms with integration and geographic flexibility Driven by innovative technology, we are creating improved client insights and network value
79|| Wealth Platform Video

80||
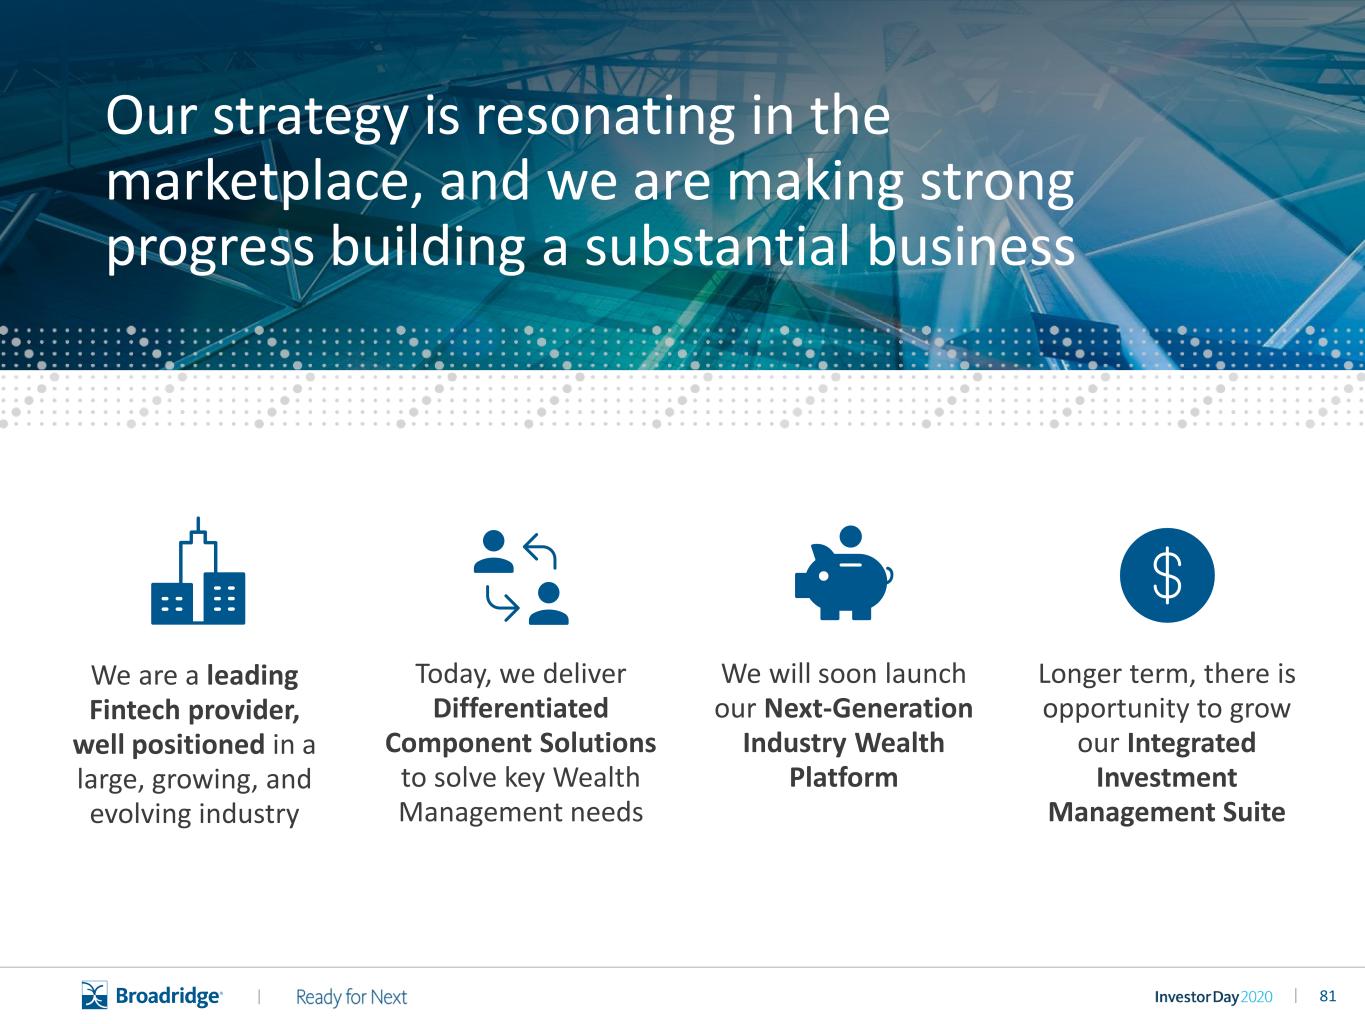
81|| We will soon launch our Next-Generation Industry Wealth Platform Longer term, there is opportunity to grow our Integrated Investment Management Suite Today, we deliver Differentiated Component Solutions to solve key Wealth Management needs Our strategy is resonating in the marketplace, and we are making strong progress building a substantial business We are a leading Fintech provider, well positioned in a large, growing, and evolving industry

82|| NORTH AMERICAN WEALTH AUM GROWTH OVER 2012-20Rapidly evolving industry trends and market needs are driving demand for our wealth solutions and services Generational shifts are driving demand for personalization, holistic advice, and new investment options Acceleration of digitization Fee compression and various low-cost products driving business model changes and cost pressure Continued industry consolidation $33T 2012 $59T 2020(1) Source: PwC – Asset & Wealth Management Revolution: Embracing Exponential Change 1. Value represents projection for calendar year 2020
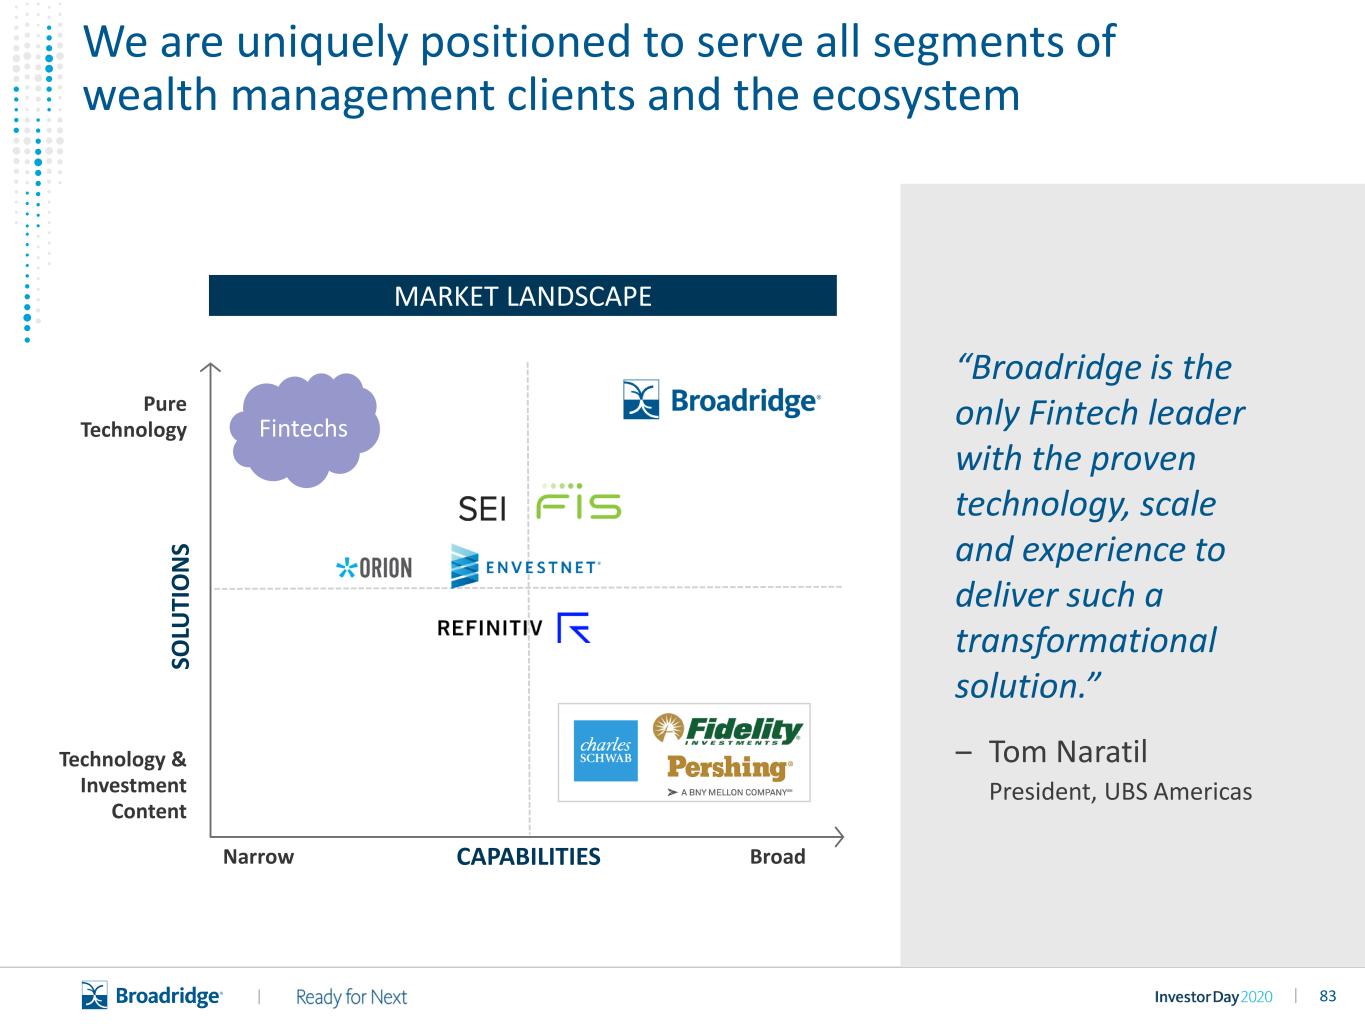
83|| Narrow Technology & Investment Content Fintechs Pure Technology BroadCAPABILITIES SO LU TI O N S MARKET LANDSCAPE “Broadridge is the only Fintech leader with the proven technology, scale and experience to deliver such a transformational solution.” ‒ Tom Naratil President, UBS Americas We are uniquely positioned to serve all segments of wealth management clients and the ecosystem
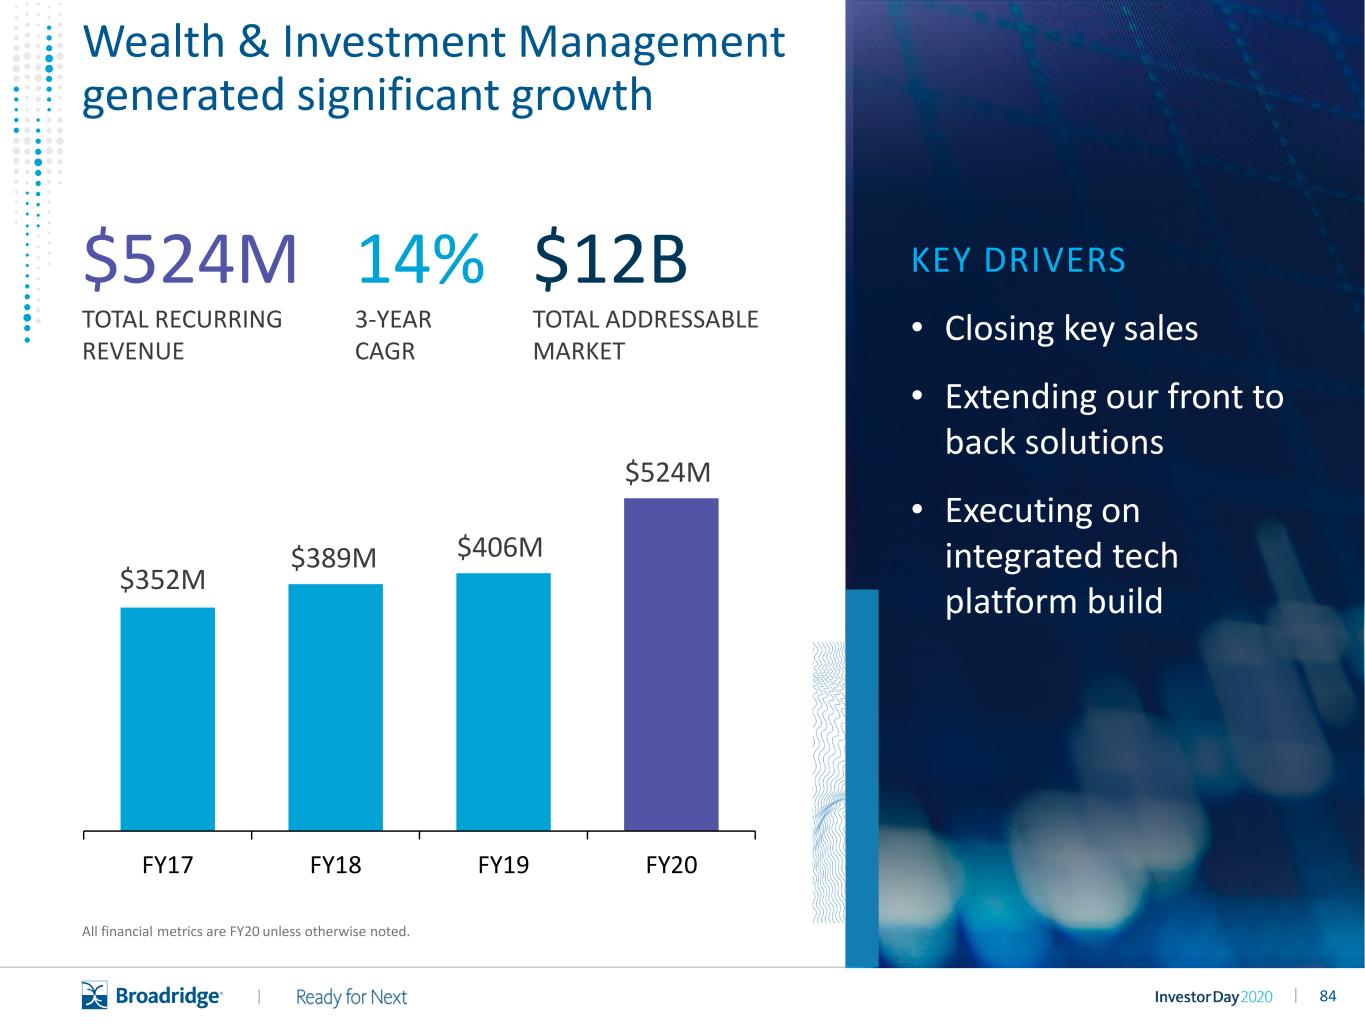
84|| Wealth & Investment Management generated significant growth $524M TOTAL RECURRING REVENUE KEY DRIVERS • Closing key sales • Extending our front to back solutions • Executing on integrated tech platform build 14% 3-YEAR CAGR All financial metrics are FY20 unless otherwise noted. $352M $389M $406M $524M FY17 FY18 FY19 FY20 $12B TOTAL ADDRESSABLE MARKET
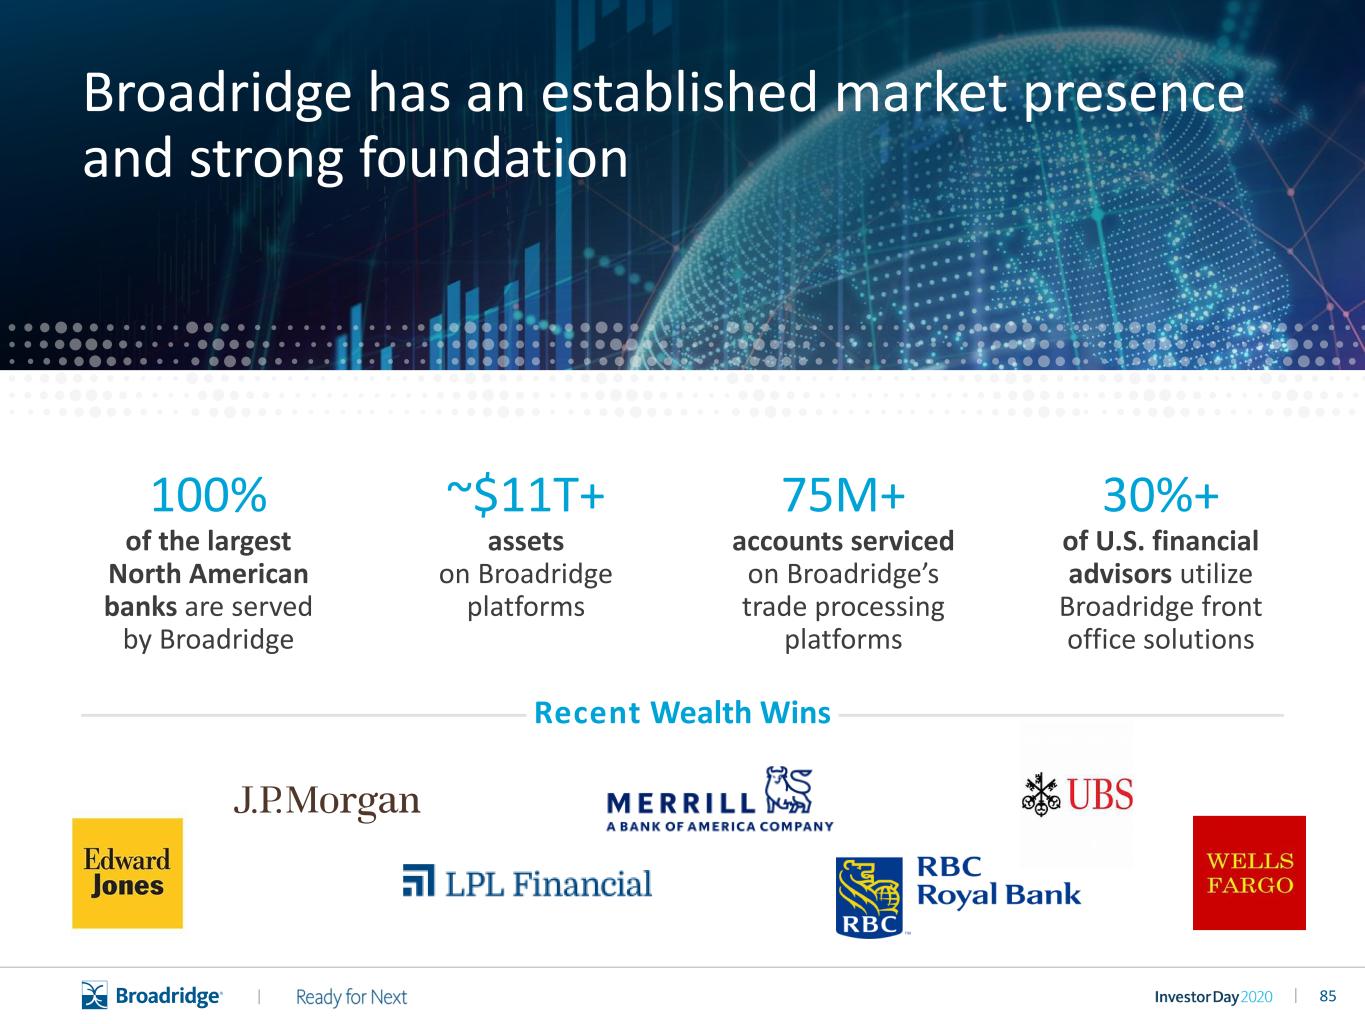
85|| 100% of the largest North American banks are served by Broadridge 30%+ of U.S. financial advisors utilize Broadridge front office solutions ~$11T+ assets on Broadridge platforms 75M+ accounts serviced on Broadridge’s trade processing platforms Broadridge has an established market presence and strong foundation Recent Wealth Wins

86|| We have a clear strategy for continued growth Deliver differentiated component solutions Grow integrated investment management suite Launch the next-generation industry wealth platform

87|| Acquire, engage, and manage clients FRONT OFFICE Manage the advisory business MIDDLE OFFICE Run the firm BACK OFFICE • Increasing engagement using AI technology • Enriching data aggregation solutions • Launching new digital capabilities • Expanding our product and client portfolio • Making our platform scalable and resilient • Driving efficiency via managed services “Broadridge demonstrates a dedication to developing its digital proposition and empowering the advisor and client.” ‒ CELENT We offer a suite of best-in-class wealth component offerings that expand across the entire lifecycle 1 | DIFFERENTIATED COMPONENT SOLUTIONS

88|| The optimum combination of Broadridge technology plus integrated firm proprietary and best-in-class third party tools Our wealth platform is a comprehensive ecosystem enabling firms to grow their business Optimize advisor productivity Desktop, tablet, and mobile workstation Enhance the investor experience Integrated wealth management process Digitize branch and operations Scalable and efficient back office 2 | INDUSTRY WEALTH PLATFORM

89|| Well positioned for success • Growing market • Cost effective solutions • Access to higher value clients • Serves 17 of the largest 20 global investment managers and 500+ firms globally Key trends driving market growth • Consolidation in the investment management industry • Outsourcing of non-core functions is increasing • Active to passive is forcing a “do more with less” mindset Data management Unified client portal Visual analytics BEST-IN-SUITE GLOBAL PLATFORM Portfolio & order management Revenue & expense management Private debt & portfolio management Investment accounting Private market hub Compelling solutions for investment managers 3 | INVESTMENT MANAGEMENT
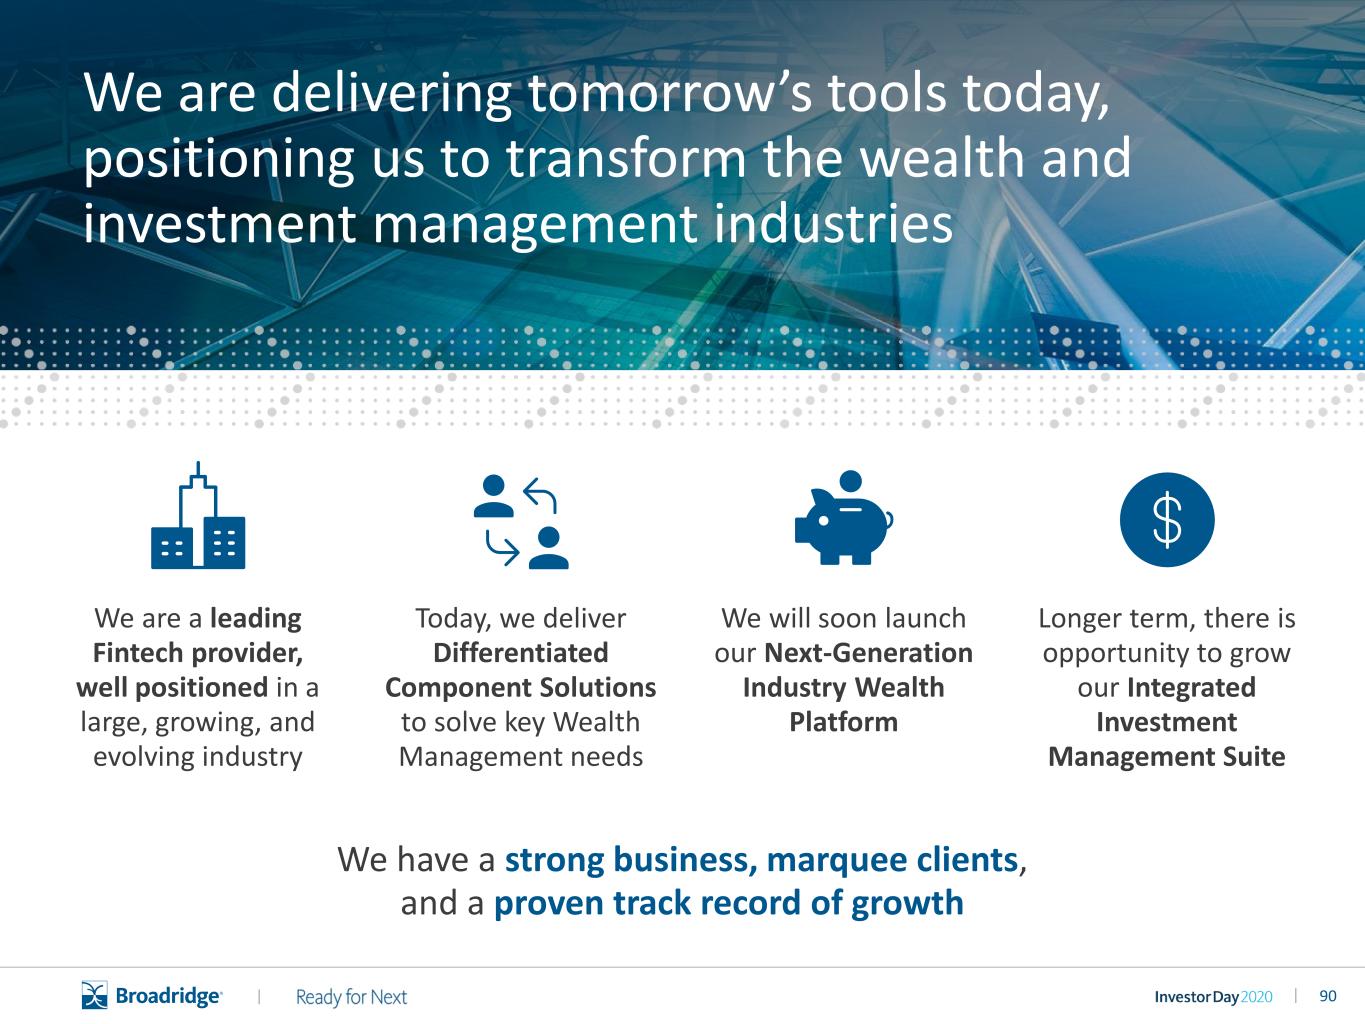
90|| We are a leading Fintech provider, well positioned in a large, growing, and evolving industry We will soon launch our Next-Generation Industry Wealth Platform Longer term, there is opportunity to grow our Integrated Investment Management Suite Today, we deliver Differentiated Component Solutions to solve key Wealth Management needs We are delivering tomorrow’s tools today, positioning us to transform the wealth and investment management industries We have a strong business, marquee clients, and a proven track record of growth
91||

92|| With significant growth potential, International extends our key franchises globally Broadridge has a sizeable, rapidly growing presence in EMEA and APAC We continue to expand our Fund Communication Solutions Our next-generation Governance solutions are driving growth We are globalizing Capital Markets capabilities and client relationships

93|| We continue to extend our North American franchises globally CAPITAL MARKETS and GOVERNANCE RUSSIA IRELAND UK POLAND CZECHGERMANY NETHERLANDS JAPAN HONG KONG SINGAPORE INDIA AUSTRALIA 1,100+ associates in EMEA & APAC 3,600+ global support associates in India 800+ clients 18% FY17-20 revenue CAGR 3.6x FY17-20 sales growth
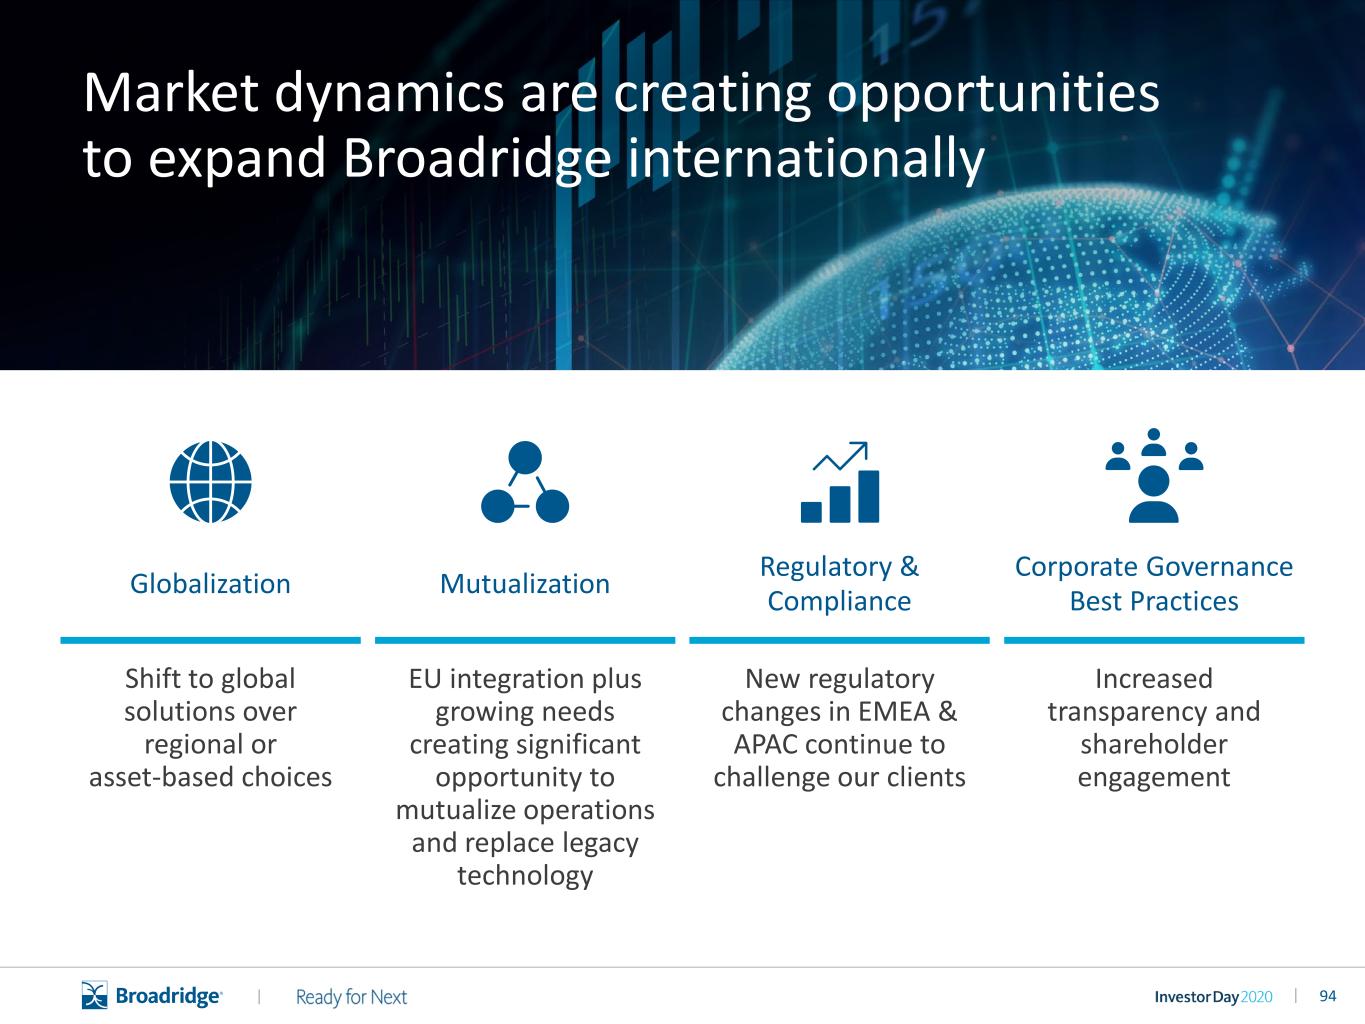
94|| Market dynamics are creating opportunities to expand Broadridge internationally Shift to global solutions over regional or asset-based choices Increased transparency and shareholder engagement New regulatory changes in EMEA & APAC continue to challenge our clients EU integration plus growing needs creating significant opportunity to mutualize operations and replace legacy technology Globalization Mutualization Regulatory & Compliance Corporate Governance Best Practices
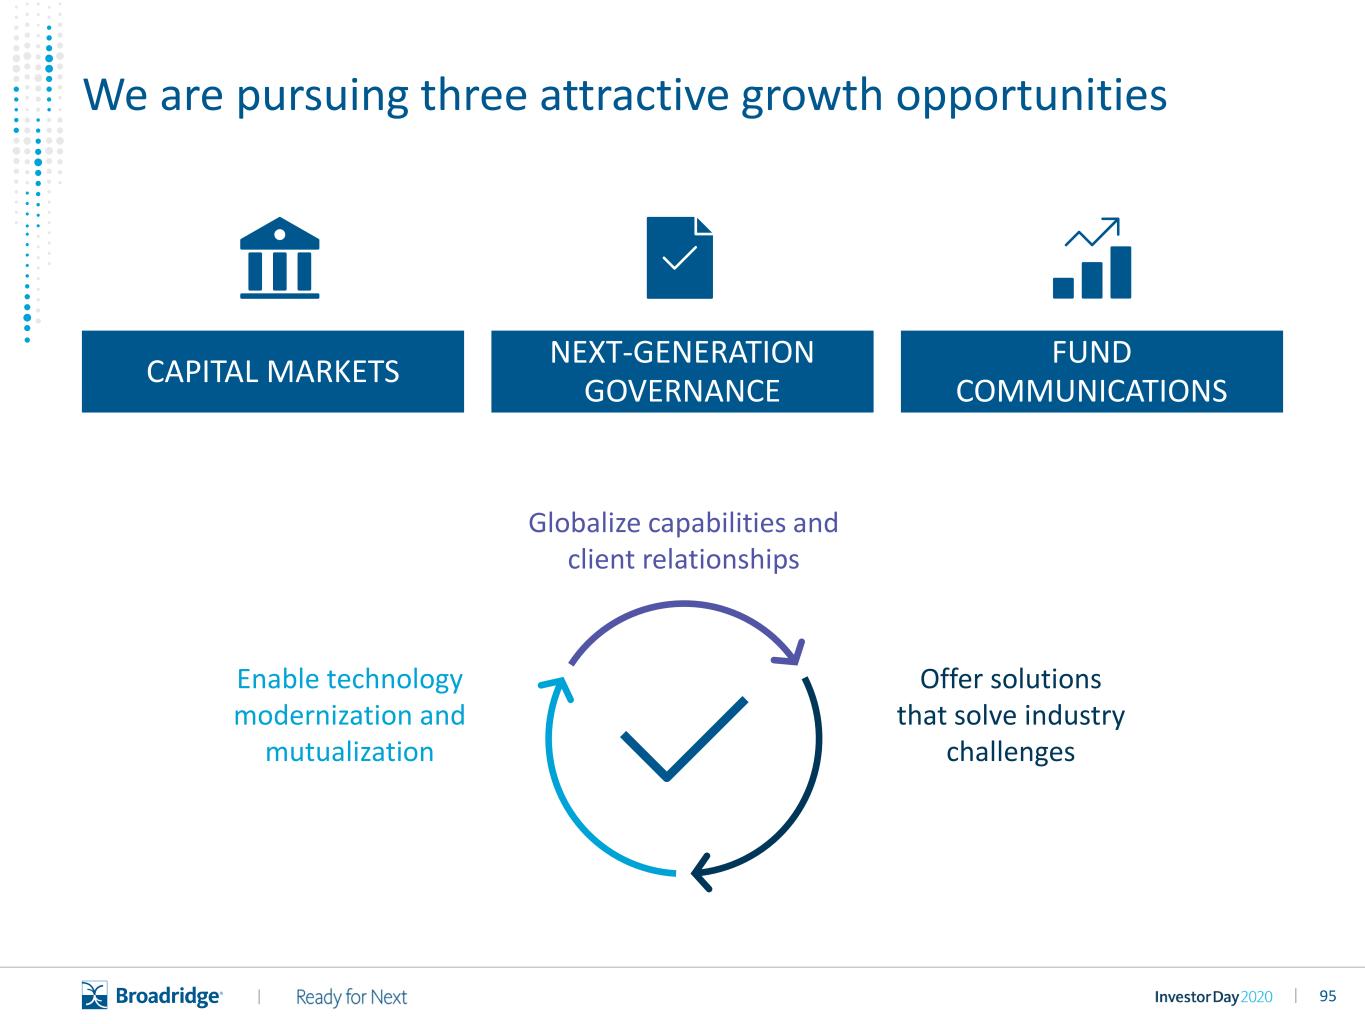
95|| We are pursuing three attractive growth opportunities Globalize capabilities and client relationships Offer solutions that solve industry challenges Enable technology modernization and mutualization CAPITAL MARKETS NEXT-GENERATION GOVERNANCE FUND COMMUNICATIONS

96|| Reconciliation, clearing reports, and distribution insights Trade and transaction reporting U.S. fixed income post-trade Revenue & expense management, BPO 1st market 11 total markets 29 total markets International equities post-trade (4 total markets) International & U.S. fixed income post-trade (44 total markets) International fixed income post-trade 2021 Q1 Q2 Q3 Q4Q1 Q2 Q3 Q4Q1 Q2 Q3 Q4Q1 Q2 Q3 Q4Q4 2020201920182017 Globalize Capital Markets post-trade capabilities and relationships CASE STUDY: Leading Asian bank undergoing technology transformation with Broadridge to simplify operations across multiple markets ■ Live ■ In progress 1 | CAPITAL MARKETS
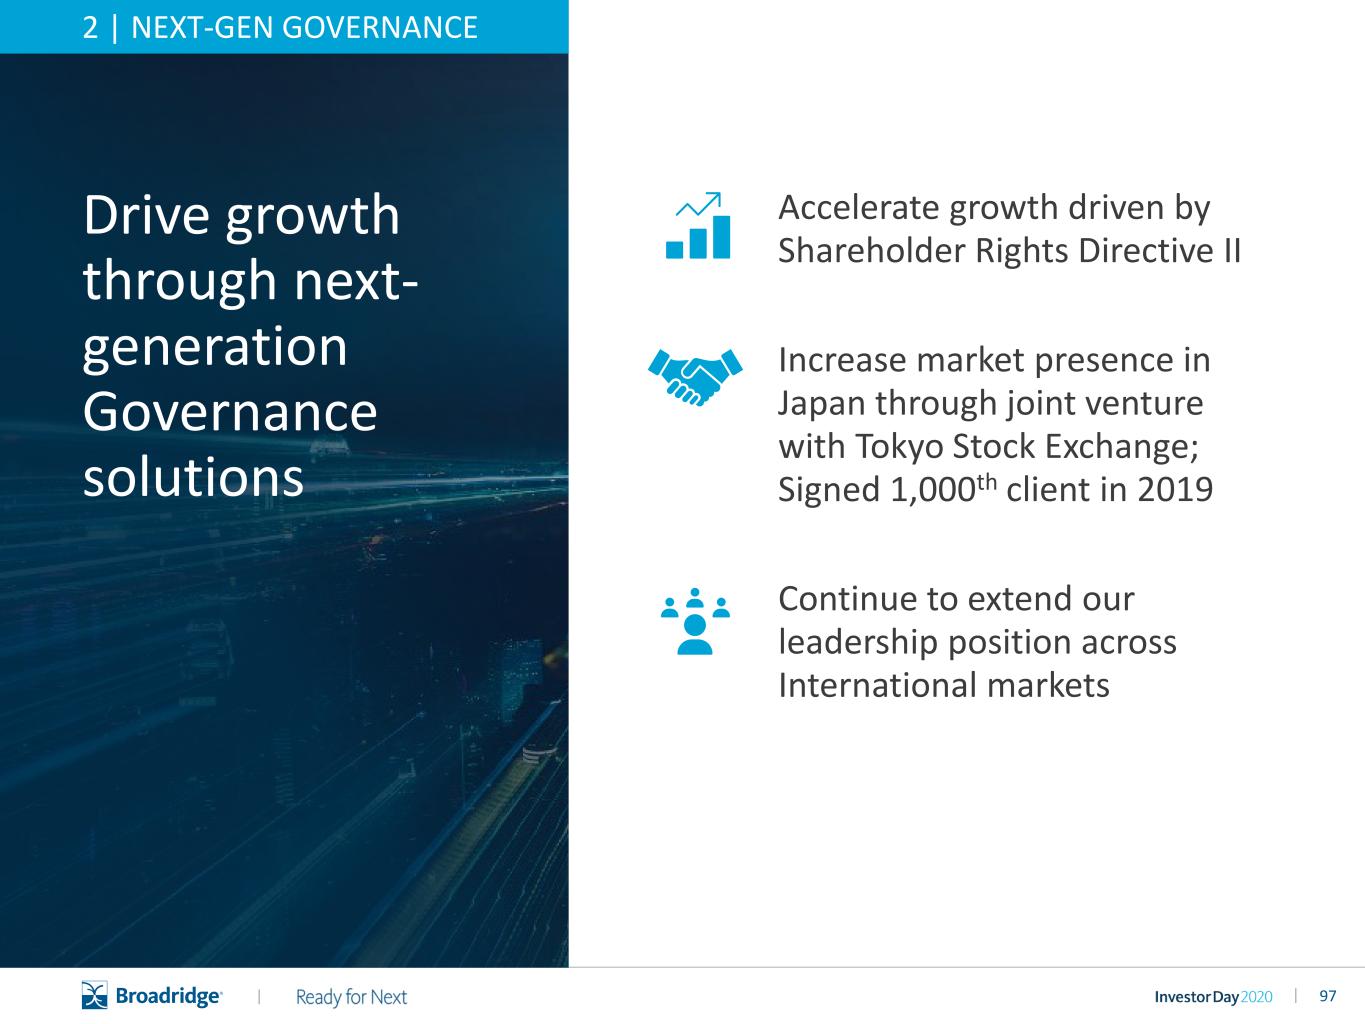
97|| Accelerate growth driven by Shareholder Rights Directive II Increase market presence in Japan through joint venture with Tokyo Stock Exchange; Signed 1,000th client in 2019 Continue to extend our leadership position across International markets Drive growth through next- generation Governance solutions 2 | NEXT-GEN GOVERNANCE
98|| Shareholder Rights Directive II Video

99|| CASE STUDY Shareholder Rights Directive II 110+ IMPLEMENTATIONS COMPLETED THE RULE Financial intermediaries to comply with stricter requirements on proxy voting and shareholder disclosure THE OPPORTUNITY Broadridge is uniquely positioned to solve the industry needs THE ANSWER Delivered end-to-end solution for global institutional and retail proxy voting. Built innovative blockchain solution for shareholder disclosure STRONG PERFORMANCE Record sales in FY20
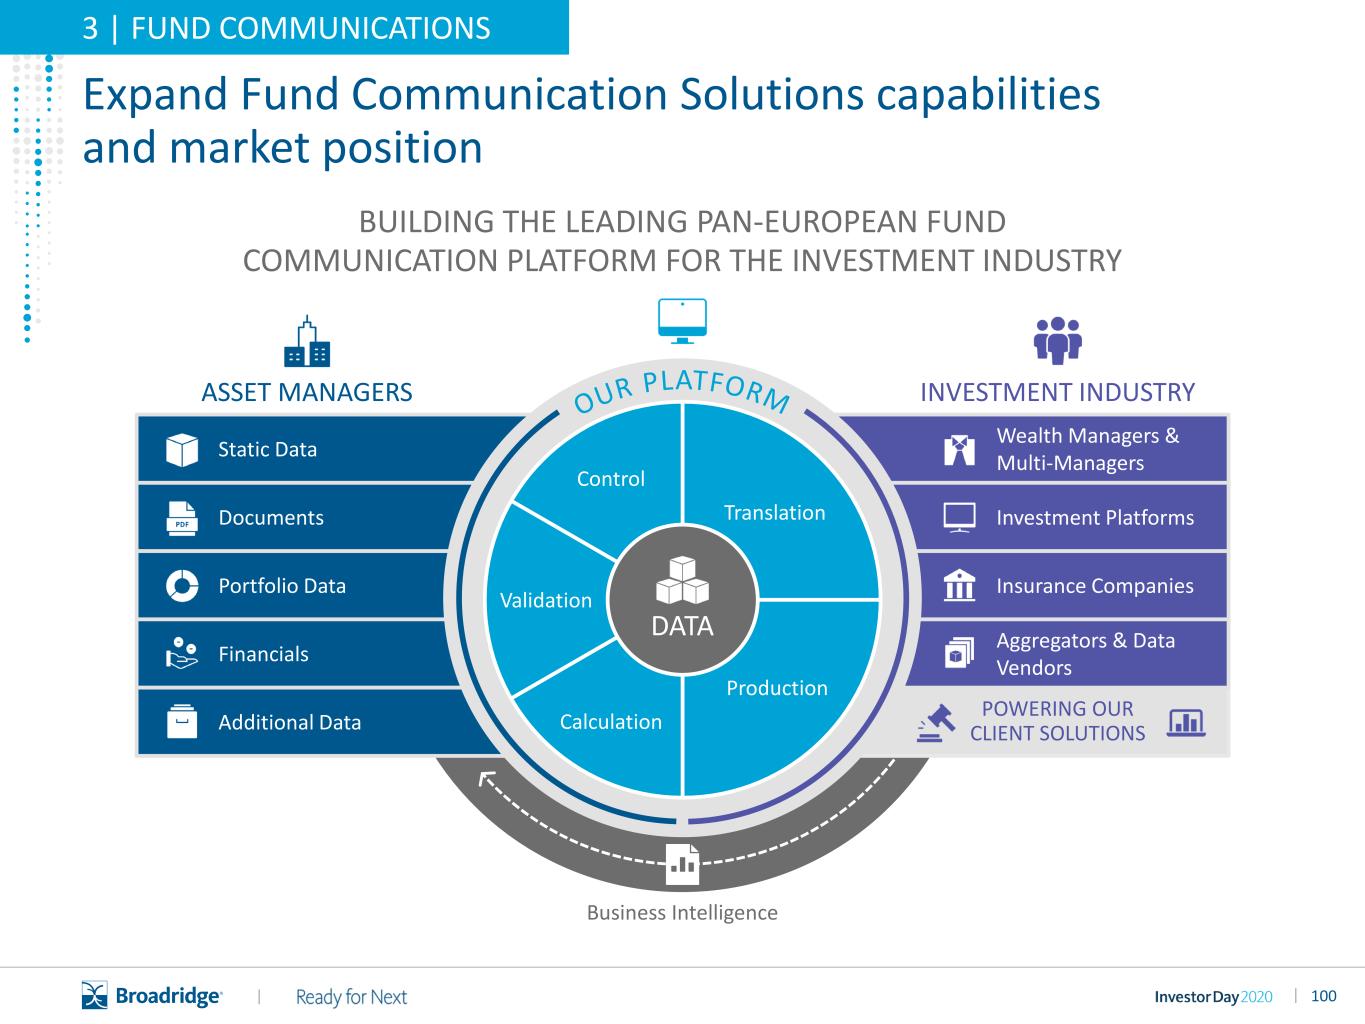
100|| POWERING OUR CLIENT SOLUTIONS Wealth Managers & Multi-Managers Investment Platforms Insurance Companies Aggregators & Data Vendors Static Data Documents Portfolio Data Financials Additional Data ASSET MANAGERS INVESTMENT INDUSTRY Expand Fund Communication Solutions capabilities and market position BUILDING THE LEADING PAN-EUROPEAN FUND COMMUNICATION PLATFORM FOR THE INVESTMENT INDUSTRY Business Intelligence DATA Control Validation Calculation Translation Production 3 | FUND COMMUNICATIONS
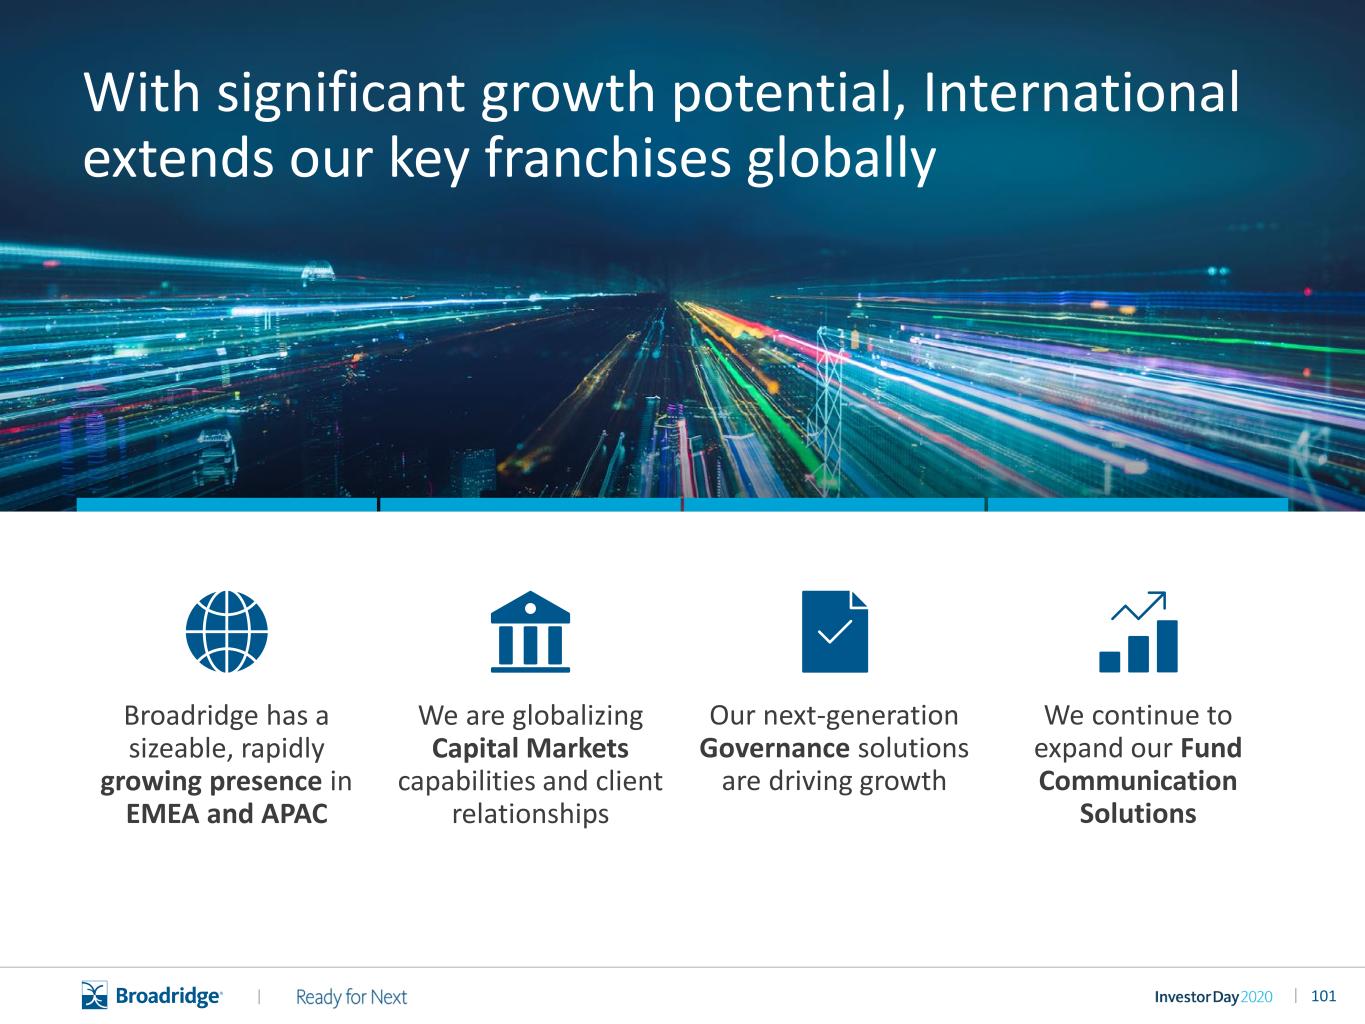
101|| With significant growth potential, International extends our key franchises globally Broadridge has a sizeable, rapidly growing presence in EMEA and APAC We continue to expand our Fund Communication Solutions Our next-generation Governance solutions are driving growth We are globalizing Capital Markets capabilities and client relationships
102||

103|| The Broadridge financial model is focused on driving steady revenue growth and consistent earnings per share growth, generated by: Continued margin expansion from our scale and operational efficiencies Balanced capital allocation leveraging our strong free cash flow businesses Investments in our long-term growth strategy Sustainable recurring revenue growth

104|| This simple financial model has produced steady and consistent earnings over time resulting in top quartile TSR growth FY14 - FY17 (CAGR) FY17 - FY20 (CAGR) Organic Recurring revenue growth1 5% 5% Recurring revenue growth 7%2 7% Adj. Operating Income Margin (bps/ year) 532 80 Adj. Earnings per share growth 12% 12%3 1. Average Organic Recurring revenue growth per year 2. Excluding the NACC acquisition 3. Excluding the impact of the Tax Act. As reported and including the Tax Act impact, Adjusted EPS growth CAGR was 17% 4. Annualized cumulative TSR per FactSet. Cumulative TSR formula assumes dividends are reinvested on the ex-date Total Shareholder Return4 25% 21%
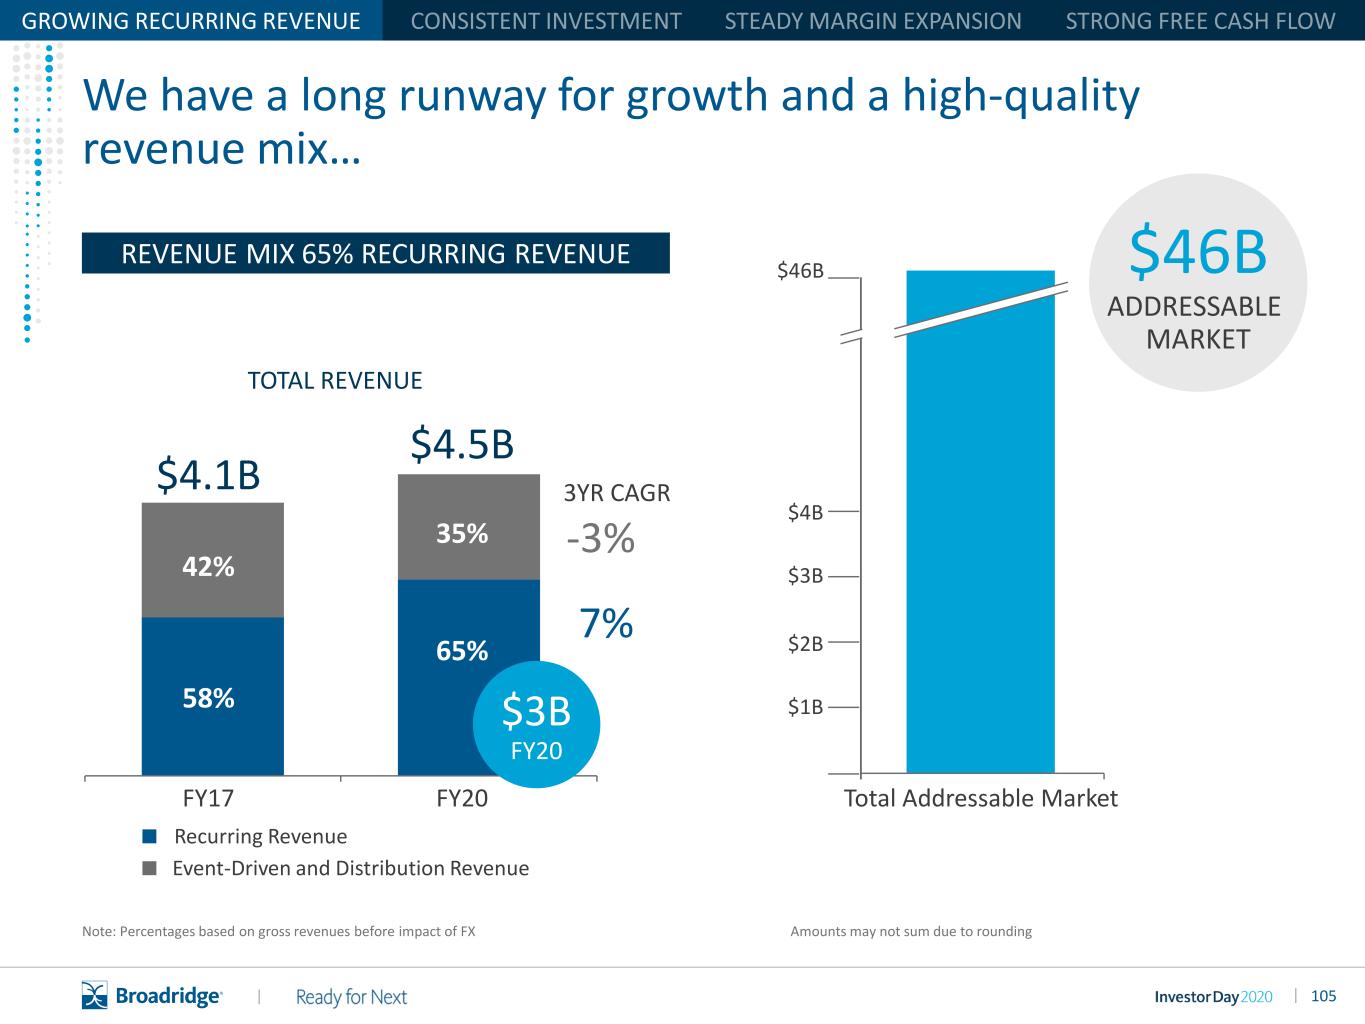
105|| GROWING RECURRING REVENUE $46B ADDRESSABLE MARKET $46B $1B $2B $3B $4B Total Addressable Market Amounts may not sum due to rounding We have a long runway for growth and a high-quality revenue mix… 42% FY17 FY20 REVENUE MIX 65% RECURRING REVENUE $4.5B TOTAL REVENUE $4.1B -3% 7% 58% 65% $3.0B 35% $3B FY20 ■ Recurring Revenue ■ Event-Driven and Distribution Revenue Note: Percentages based on gross revenues before impact of FX 3YR CAGR
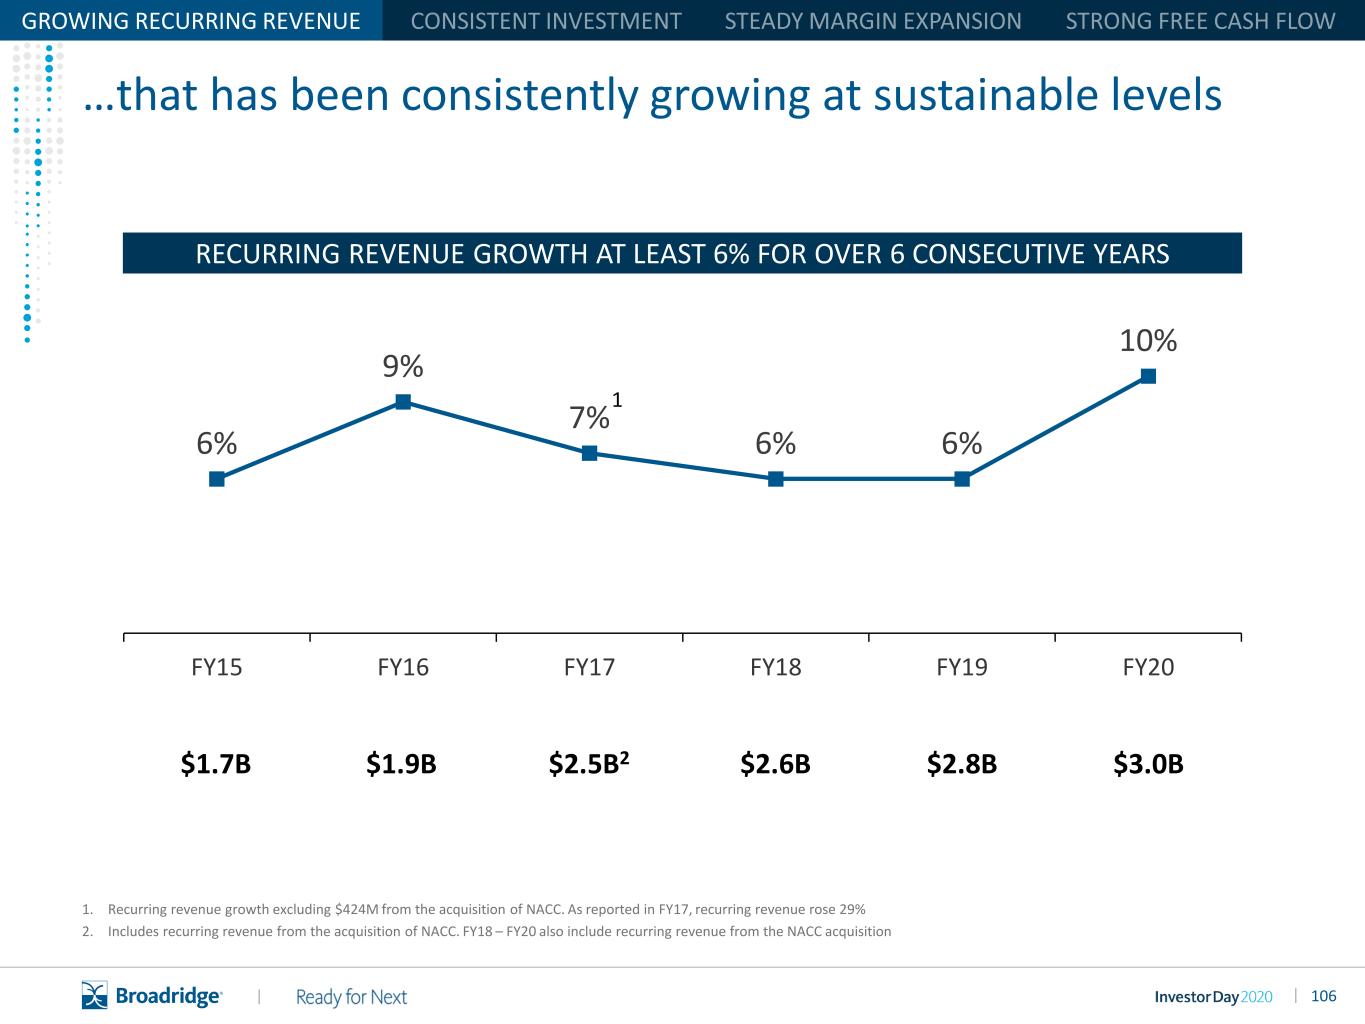
106|| …that has been consistently growing at sustainable levels RECURRING REVENUE GROWTH AT LEAST 6% FOR OVER 6 CONSECUTIVE YEARS 6% 9% 7% 6% 6% 10% FY15 FY16 FY17 FY18 FY19 FY20 1. Recurring revenue growth excluding $424M from the acquisition of NACC. As reported in FY17, recurring revenue rose 29% 2. Includes recurring revenue from the acquisition of NACC. FY18 – FY20 also include recurring revenue from the NACC acquisition $1.7B $1.9B $2.6B $2.8B $3.0B$2.5B2 GROWING RECURRING REVENUE 1
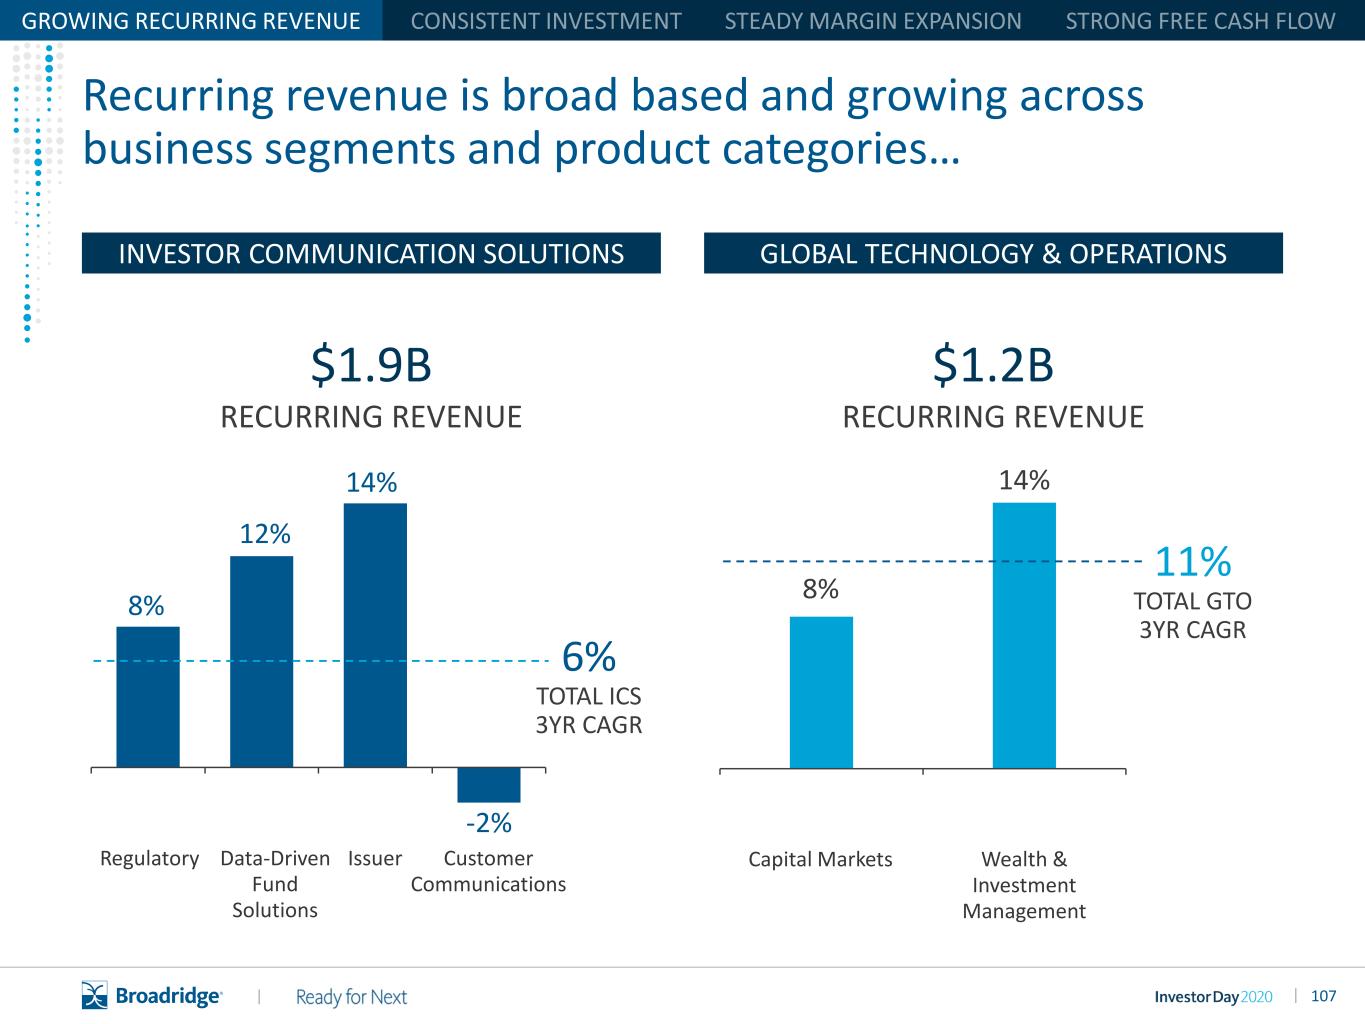
107|| Regulatory 8% Data-Driven Fund Solutions 12% Issuer Customer Communications 14% -2% $1.9B RECURRING REVENUE $1.2B RECURRING REVENUE Capital Markets Wealth & Investment Management 8% 14% GROWING RECURRING REVENUE Recurring revenue is broad based and growing across business segments and product categories… INVESTOR COMMUNICATION SOLUTIONS 6% TOTAL ICS 3YR CAGR GLOBAL TECHNOLOGY & OPERATIONS 11% TOTAL GTO 3YR CAGR
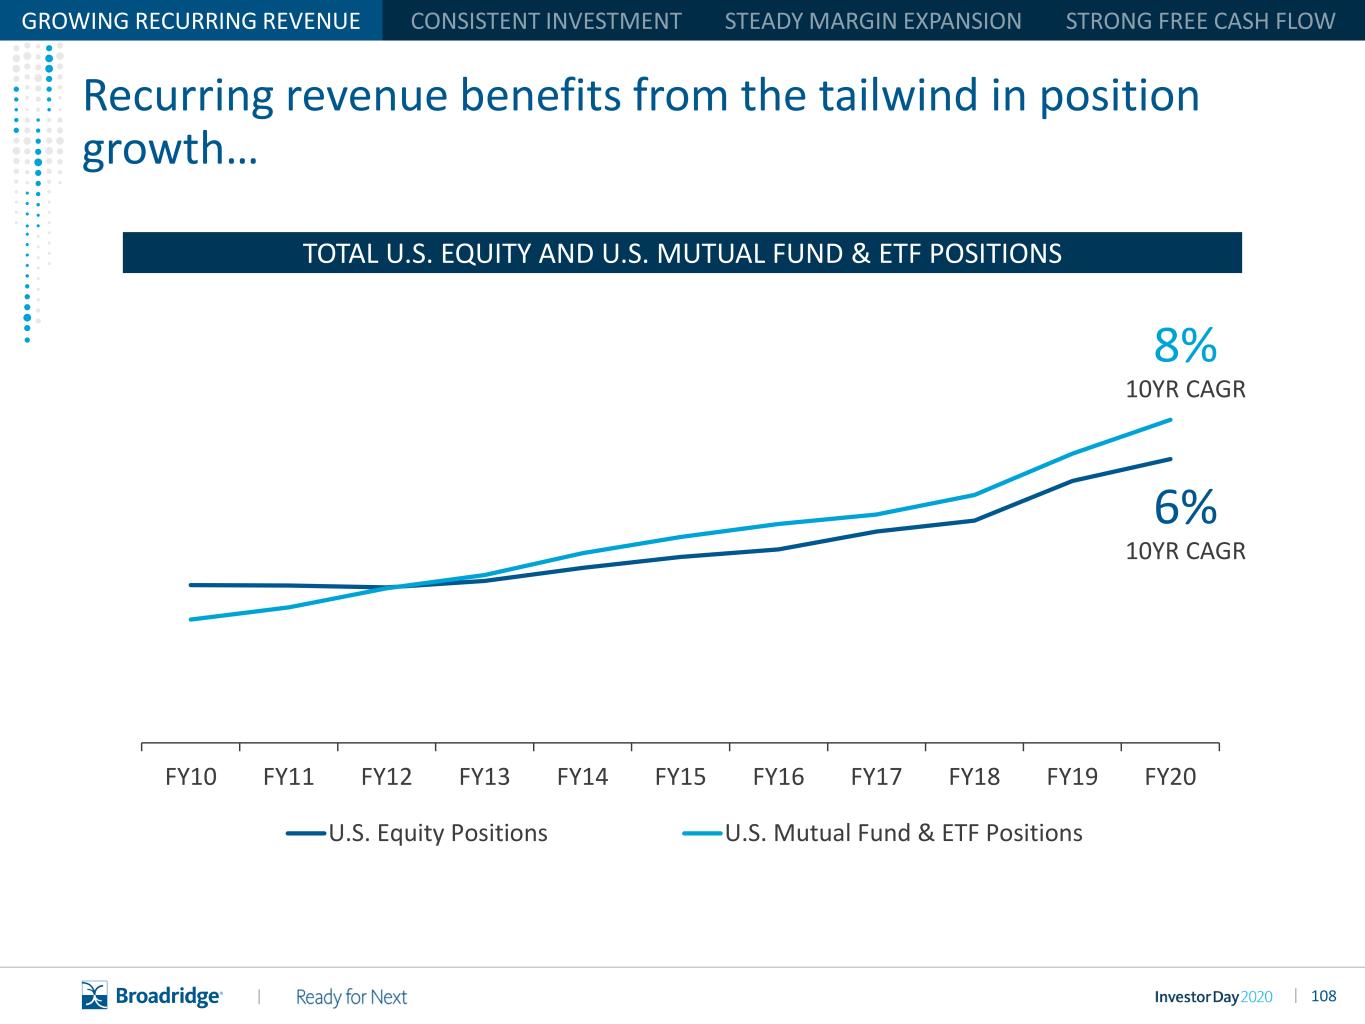
108|| GROWING RECURRING REVENUE Recurring revenue benefits from the tailwind in position growth… TOTAL U.S. EQUITY AND U.S. MUTUAL FUND & ETF POSITIONS FY10 FY11 FY12 FY13 FY14 FY15 FY16 FY17 FY18 FY19 FY20 U.S. Equity Positions U.S. Mutual Fund & ETF Positions 8% 10YR CAGR 6% 10YR CAGR
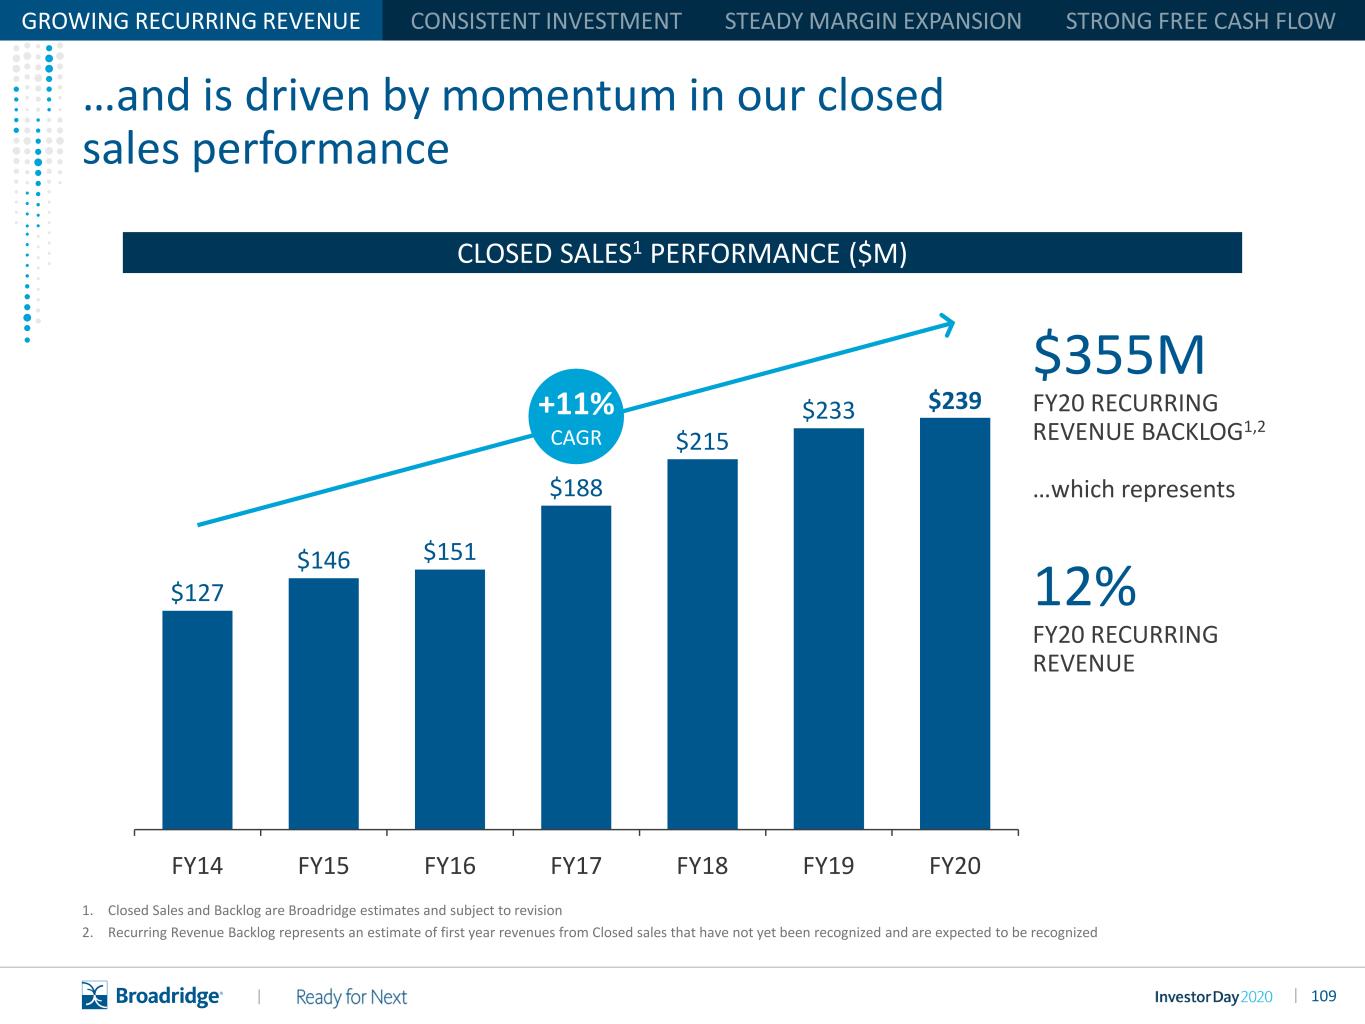
109|| $127 $146 $151 $188 $215 $233 $239 FY15FY14 FY16 FY17 FY18 FY19 FY20 +11% CAGR GROWING RECURRING REVENUE …and is driven by momentum in our closed sales performance 1. Closed Sales and Backlog are Broadridge estimates and subject to revision 2. Recurring Revenue Backlog represents an estimate of first year revenues from Closed sales that have not yet been recognized and are expected to be recognized $355M FY20 RECURRING REVENUE BACKLOG1,2 …which represents 12% FY20 RECURRING REVENUE CLOSED SALES1 PERFORMANCE ($M)

110|| …and anchored in strong retention across our client base RECURRING REVENUE RETENTION RATE GROWING RECURRING REVENUE 97% 98% 98% 97% 97% 98% FY15 FY16 FY17 FY18 FY19 FY20
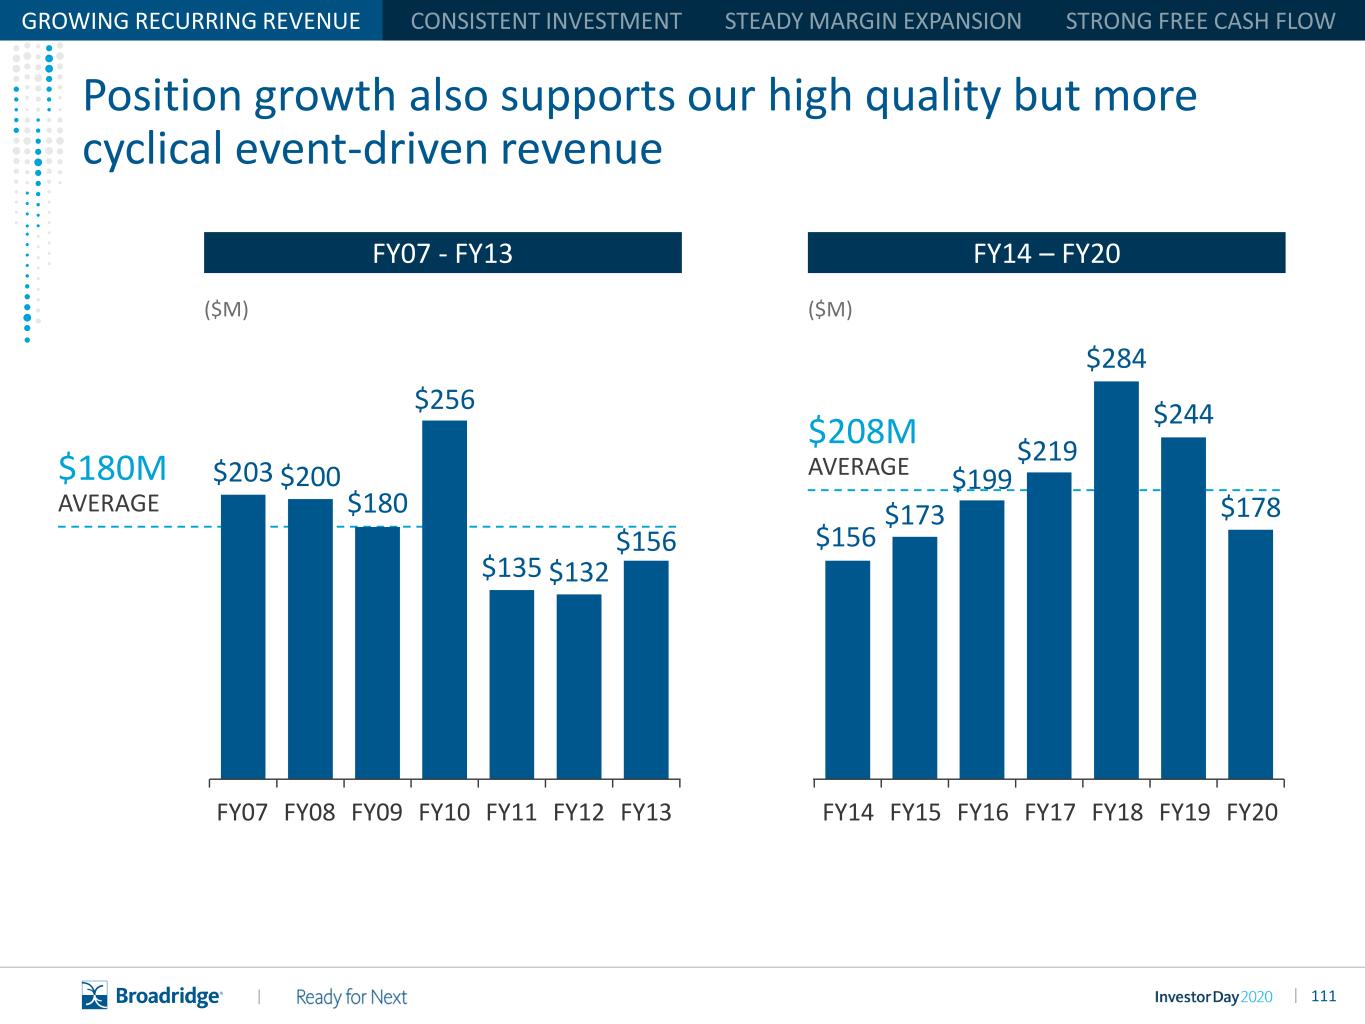
111|| Which $203 $200 $180 $256 $135 $132 $156 $156 $173 $199 $219 $284 $244 $178 1 2 3 4 5 6 7 8 9 10 11 12 13 14 15 16 ($M) GROWING RECURRING REVENUE Position growth also supports our high quality but more cyclical event-driven revenue FY07 FY08 FY09 FY10 FY11 FY12 FY13 FY07 - FY13 $180M AVERAGE FY14 – FY20 ($M) FY14 FY 5 FY16 FY17 FY18 FY19 FY20 $208M AVERAGE
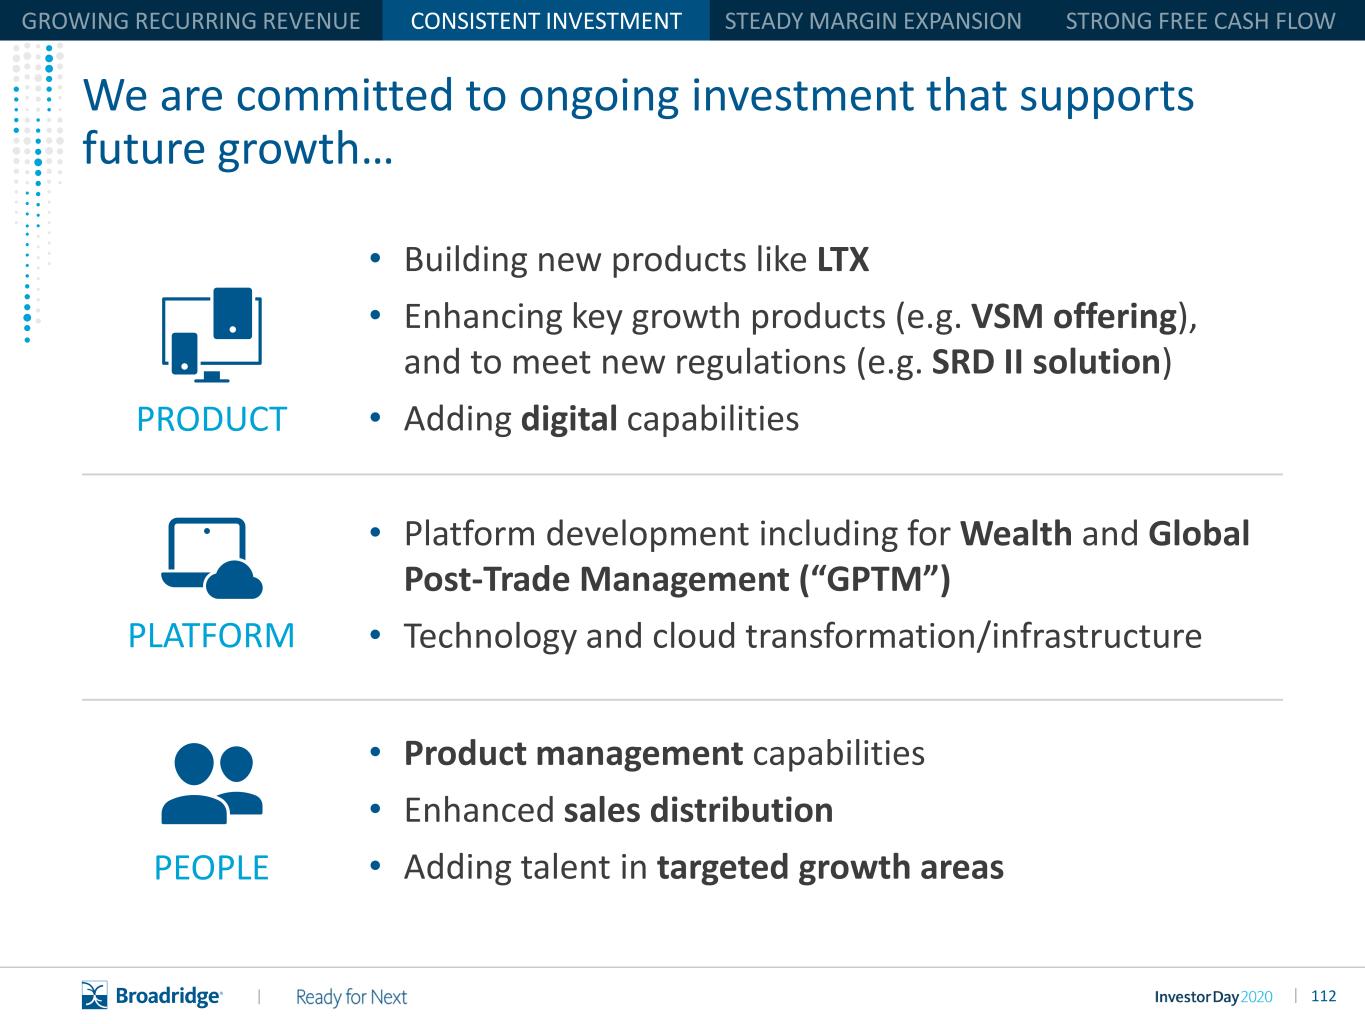
112|| • Building new products like LTX • Enhancing key growth products (e.g. VSM offering), and to meet new regulations (e.g. SRD II solution) • Adding digital capabilities PRODUCT PLATFORM PEOPLE CONSISTENT INVESTMENT We are committed to ongoing investment that supports future growth… • Platform development including for Wealth and Global Post-Trade Management (“GPTM”) • Technology and cloud transformation/infrastructure • Product management capabilities • Enhanced sales distribution • Adding talent in targeted growth areas
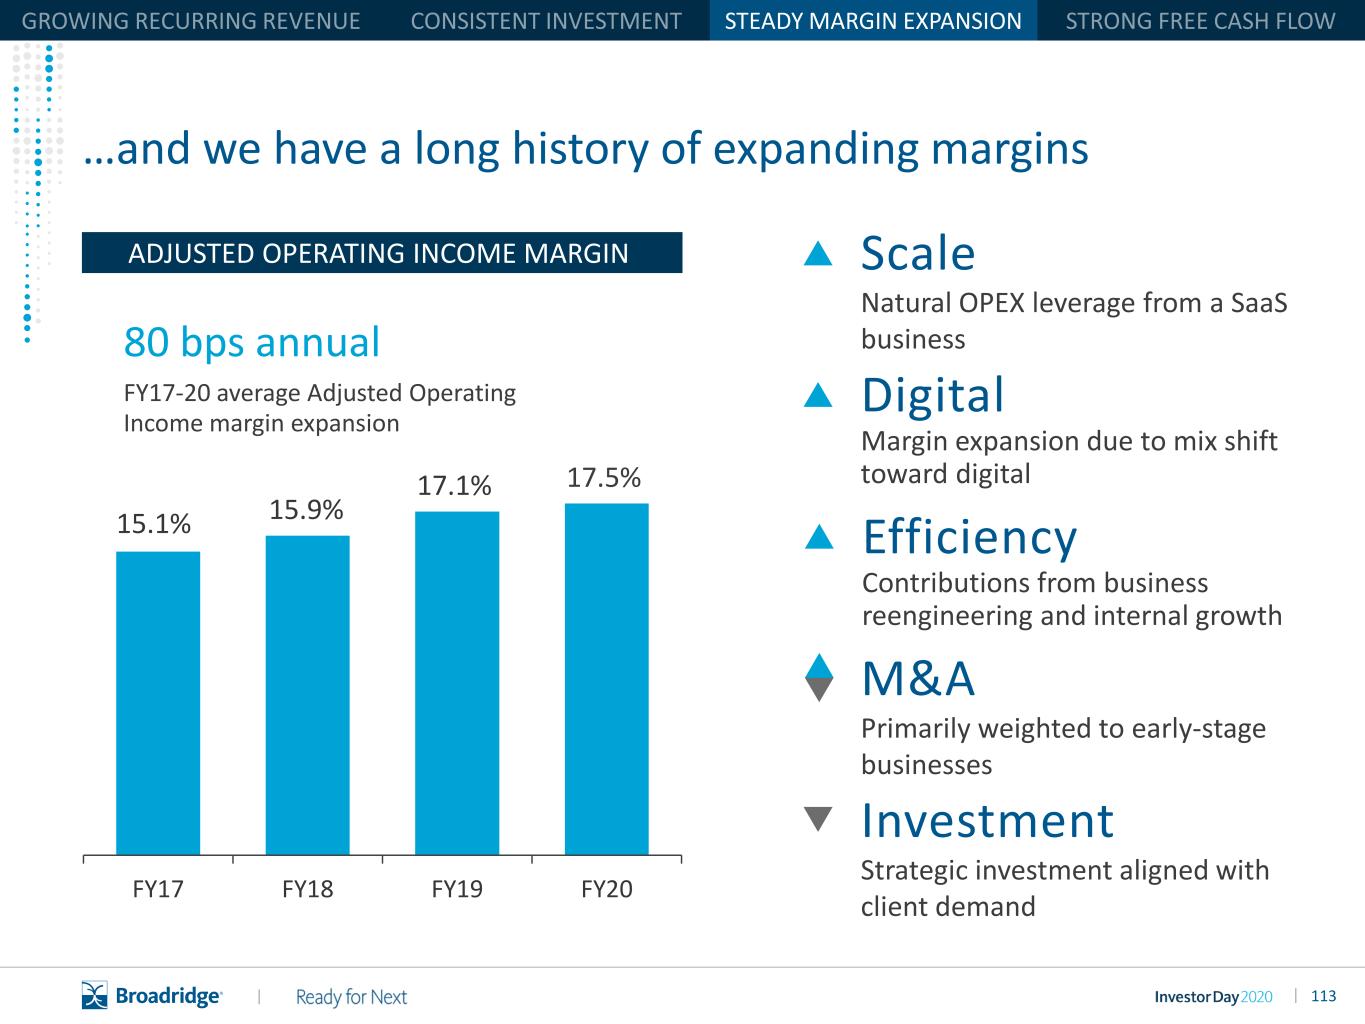
113|| 80 bps annual FY17-20 average Adjusted Operating Income margin expansion Efficiency Contributions from business reengineering and internal growth Digital Margin expansion due to mix shift toward digital M&A Primarily weighted to early-stage businesses Investment Strategic investment aligned with client demand Scale Natural OPEX leverage from a SaaS business ADJUSTED OPERATING INCOME MARGIN STEADY MARGIN EXPANSION …and we have a long history of expanding margins 15.1% 15.9% 17.1% 17.5% FY17 FY18 FY19 FY20
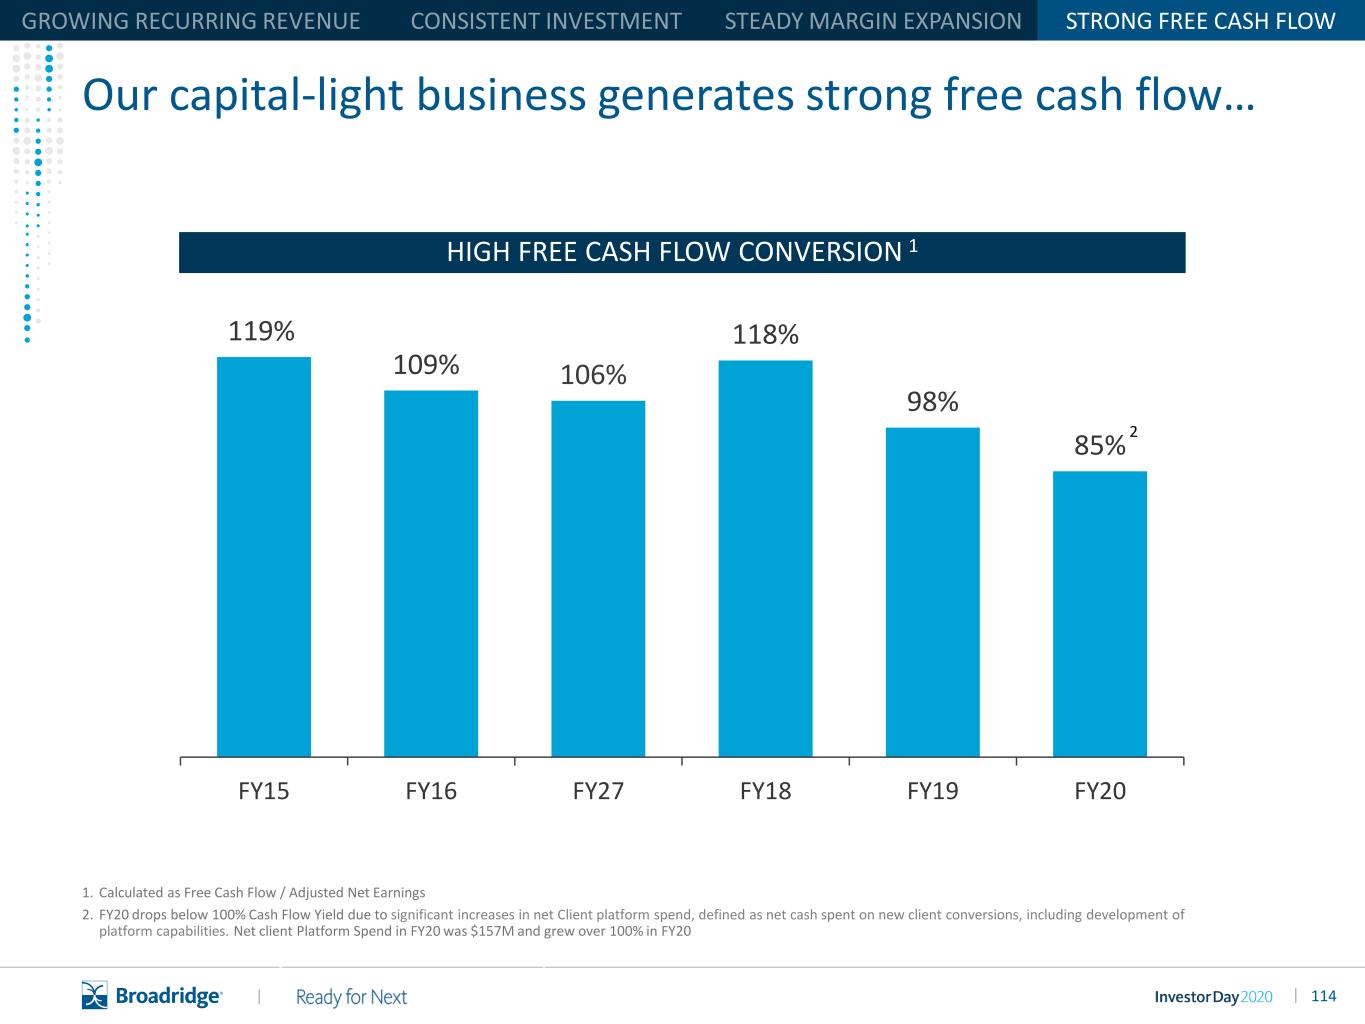
114|| Our capital-light business generates strong free cash flow… 1. Calculated as Free Cash Flow / Adjusted Net Earnings 2. FY20 drops below 100% Cash Flow Yield due to significant increases in net Client platform spend, defined as net cash spent on new client conversions, including development of platform capabilities. Net client Platform Spend in FY20 was $157M and grew over 100% in FY20 STRONG FREE CASH FLOW 119% 109% 106% 118% 98% 85% FY15 FY16 FY27 FY18 FY19 FY20 2 HIGH FREE CASH FLOW CONVERSION 1
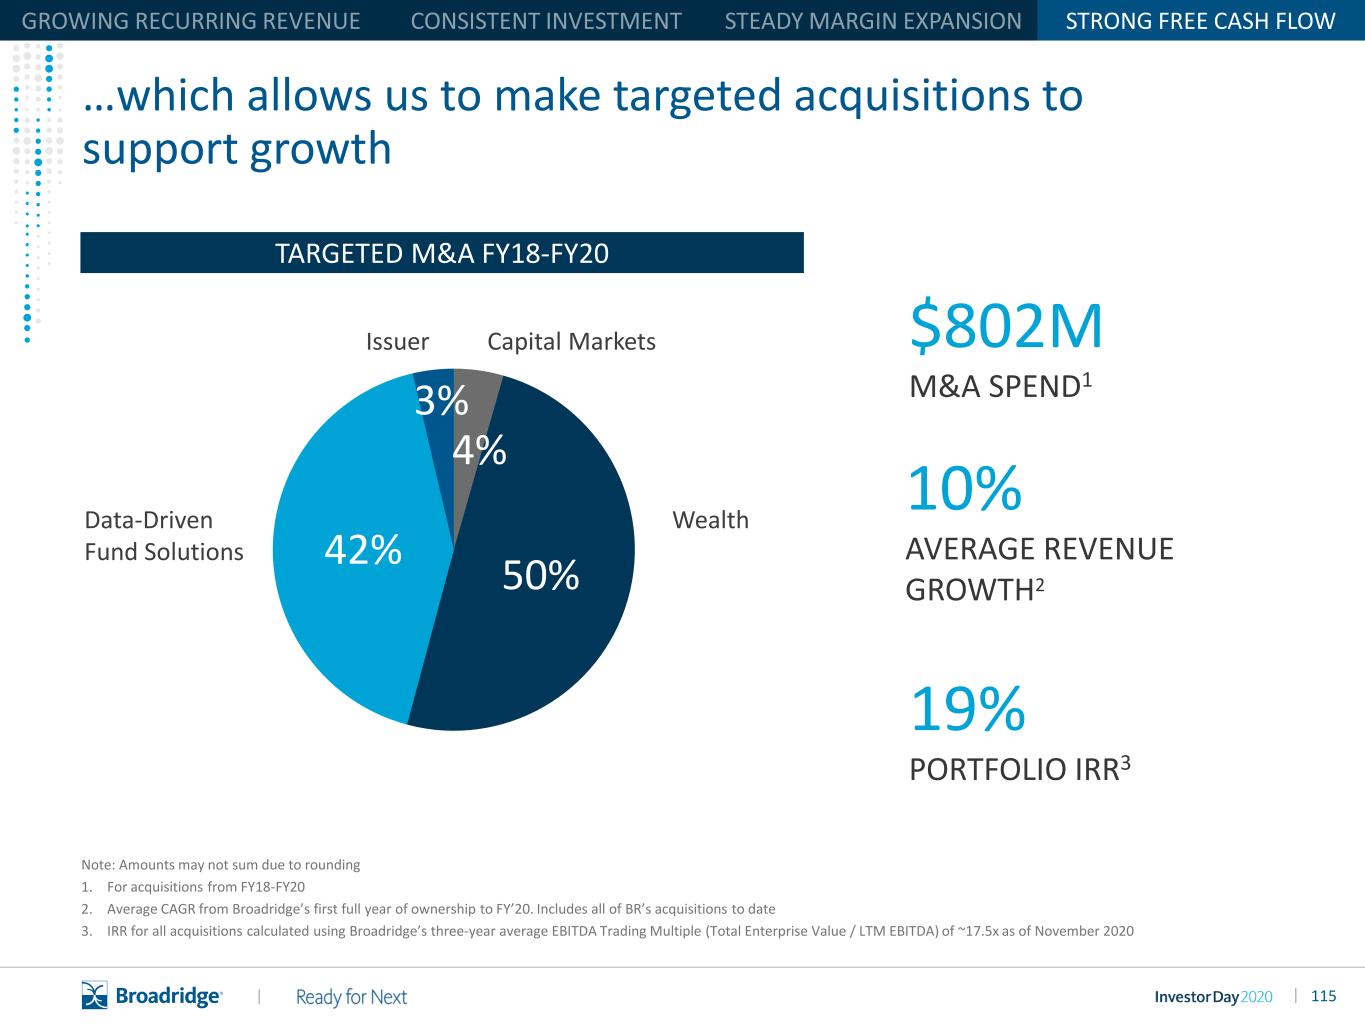
115|| 4% 50%42% 3% $802M M&A SPEND1 19% PORTFOLIO IRR3 10% AVERAGE REVENUE GROWTH2 Capital Markets WealthData-Driven Fund Solutions Issuer TARGETED M&A FY18-FY20 STRONG FREE CASH FLOW …which allows us to make targeted acquisitions to support growth Note: Amounts may not sum due to rounding 1. For acquisitions from FY18-FY20 2. Average CAGR from Broadridge’s first full year of ownership to FY’20. Includes all of BR’s acquisitions to date 3. IRR for all acquisitions calculated using Broadridge’s three-year average EBITDA Trading Multiple (Total Enterprise Value / LTM EBITDA) of ~17.5x as of November 2020
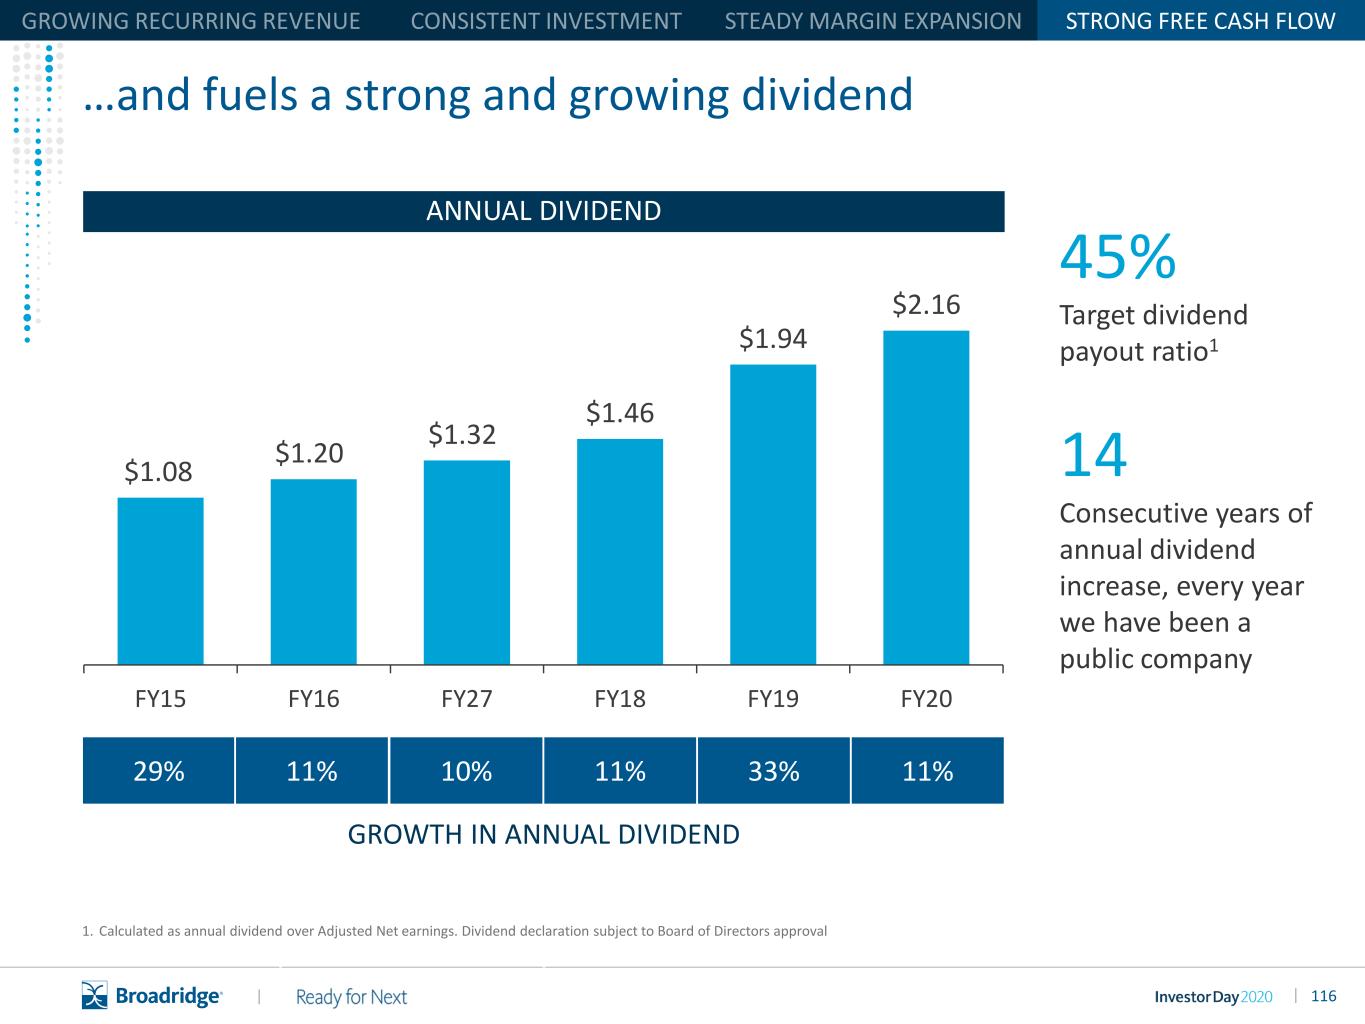
116|| …and fuels a strong and growing dividend 1. Calculated as annual dividend over Adjusted Net earnings. Dividend declaration subject to Board of Directors approval STRONG FREE CASH FLOW GROWTH IN ANNUAL DIVIDEND $1.08 $1.20 $1.32 $1.46 $1.94 $2.16 FY15 FY16 FY27 FY18 FY19 FY20 29% 11% 11% 33% 11%10% ANNUAL DIVIDEND 45% Target dividend payout ratio1 14 Consecutive years of annual dividend increase, every year we have been a public company

117|| …and attractive capital returns to shareholders 1. Capital return to shareholders through Annual Dividend and total share repurchase net of option proceeds STRONG FREE CASH FLOW DIVIDENDS AND SHARE REPURCHASES1 $1.08 $1.20 $1.32 $1.46 $1.94 $2.16 $1.93 $0.78 $2.33 $1.87 $3.09 $0.24 $3.33 $3.01 $1.98 $3.65 $5.03 $2.40 . $362M $434M $391M $578M$233M $269M TOTAL RETURN ■ Share Repurchases ■ Dividends FY15 FY16 FY17 FY18 FY19 FY20
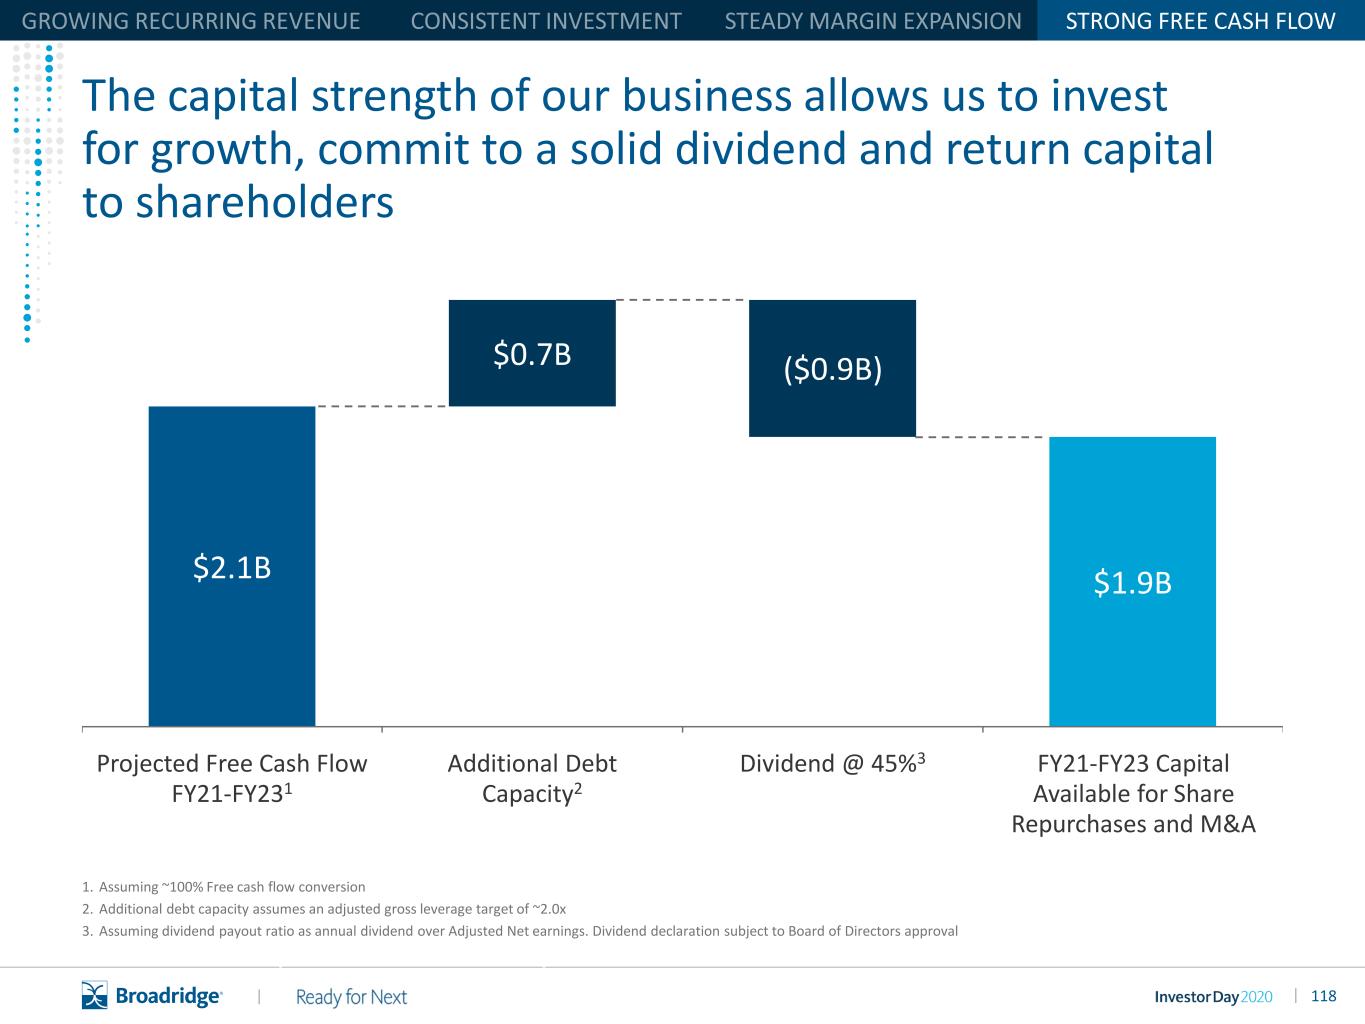
118|| $2.1B $1.9B $0.7B Additional Debt Capacity2 Projected Free Cash Flow FY21-FY231 Dividend @ 45%3 FY21-FY23 Capital Available for Share Repurchases and M&A STRONG FREE CASH FLOW The capital strength of our business allows us to invest for growth, commit to a solid dividend and return capital to shareholders ($0.9B) 1. Assuming ~100% Free cash flow conversion 2. Additional debt capacity assumes an adjusted gross leverage target of ~2.0x 3. Assuming dividend payout ratio as annual dividend over Adjusted Net earnings. Dividend declaration subject to Board of Directors approval

119|| Guidance – Reaffirmed FY211 Recurring revenue growth 3-6% Total revenue growth 1-4% Adj. Operating Income Margin expansion (bps) ~100 Closed Sales $190–235M Adj. Earnings per Share Growth 6-10% 1. Fiscal year 2021 Guidance as of October 30, 2020 We are reaffirming our full-year guidance for FY21…
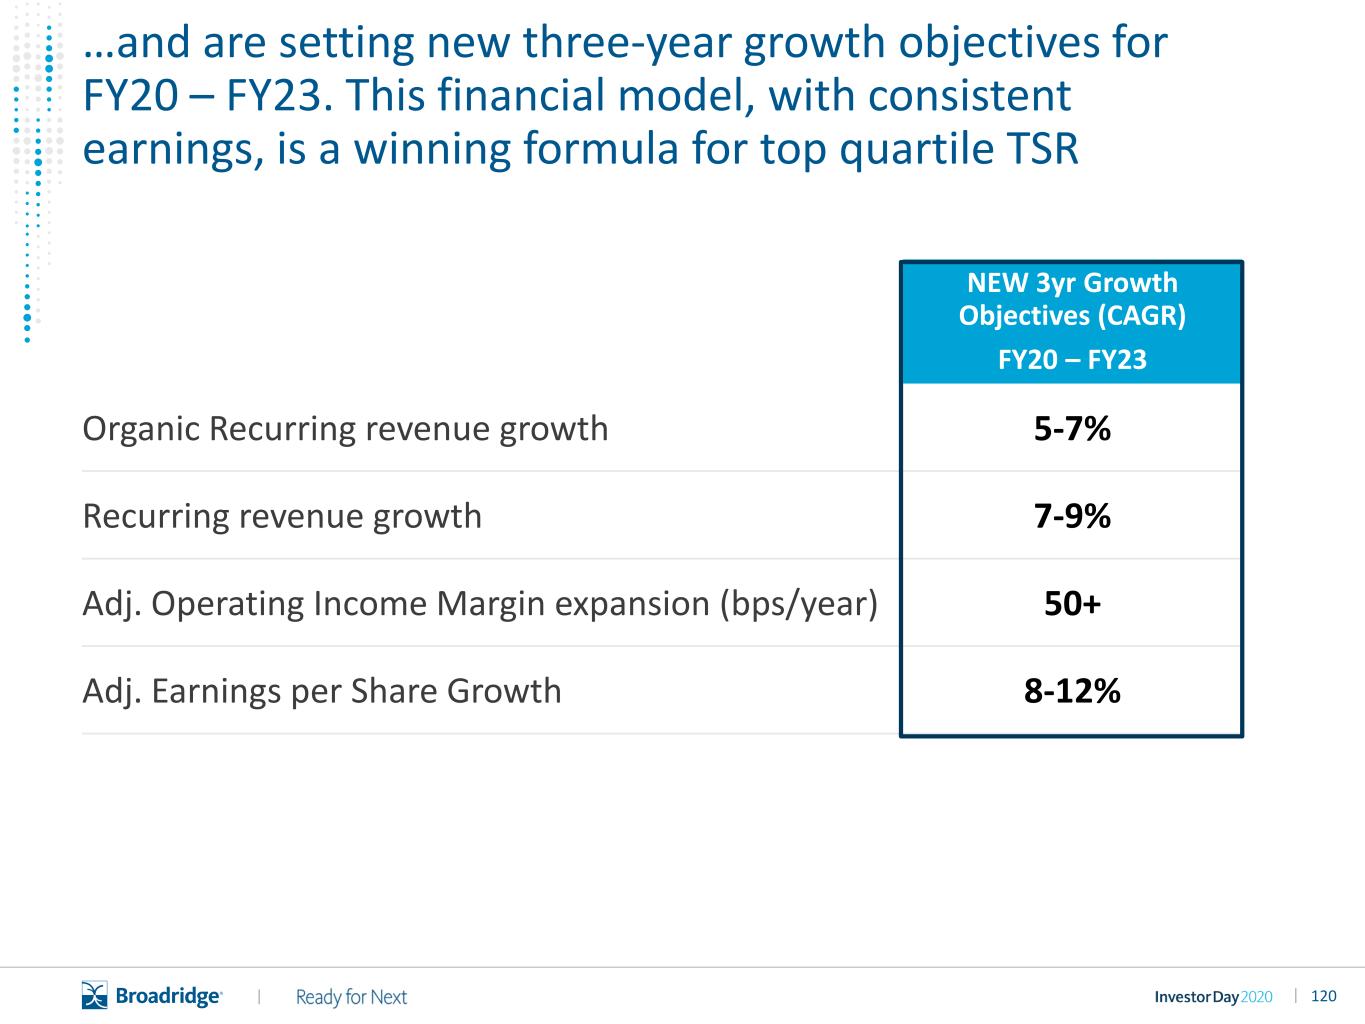
120|| NEW 3yr Growth Objectives (CAGR) FY20 – FY23 Organic Recurring revenue growth 5-7% Recurring revenue growth 7-9% Adj. Operating Income Margin expansion (bps/year) 50+ Adj. Earnings per Share Growth 8-12% …and are setting new three-year growth objectives for FY20 – FY23. This financial model, with consistent earnings, is a winning formula for top quartile TSR
121||
122|| A clear plan for sustained growth and top quartile TSR Extend our strong and growing governance franchise Grow our capital markets franchise Build a next-gen wealth & investment management franchise Drive sustainable and consistent revenue and earnings growth DELIVER TOP QUARTILE TSR 2014 Invest for Growth 2017 Ready for Next 2020 A Global Fintech Leader
123|| Appendix
124|| Key Performance Indicators
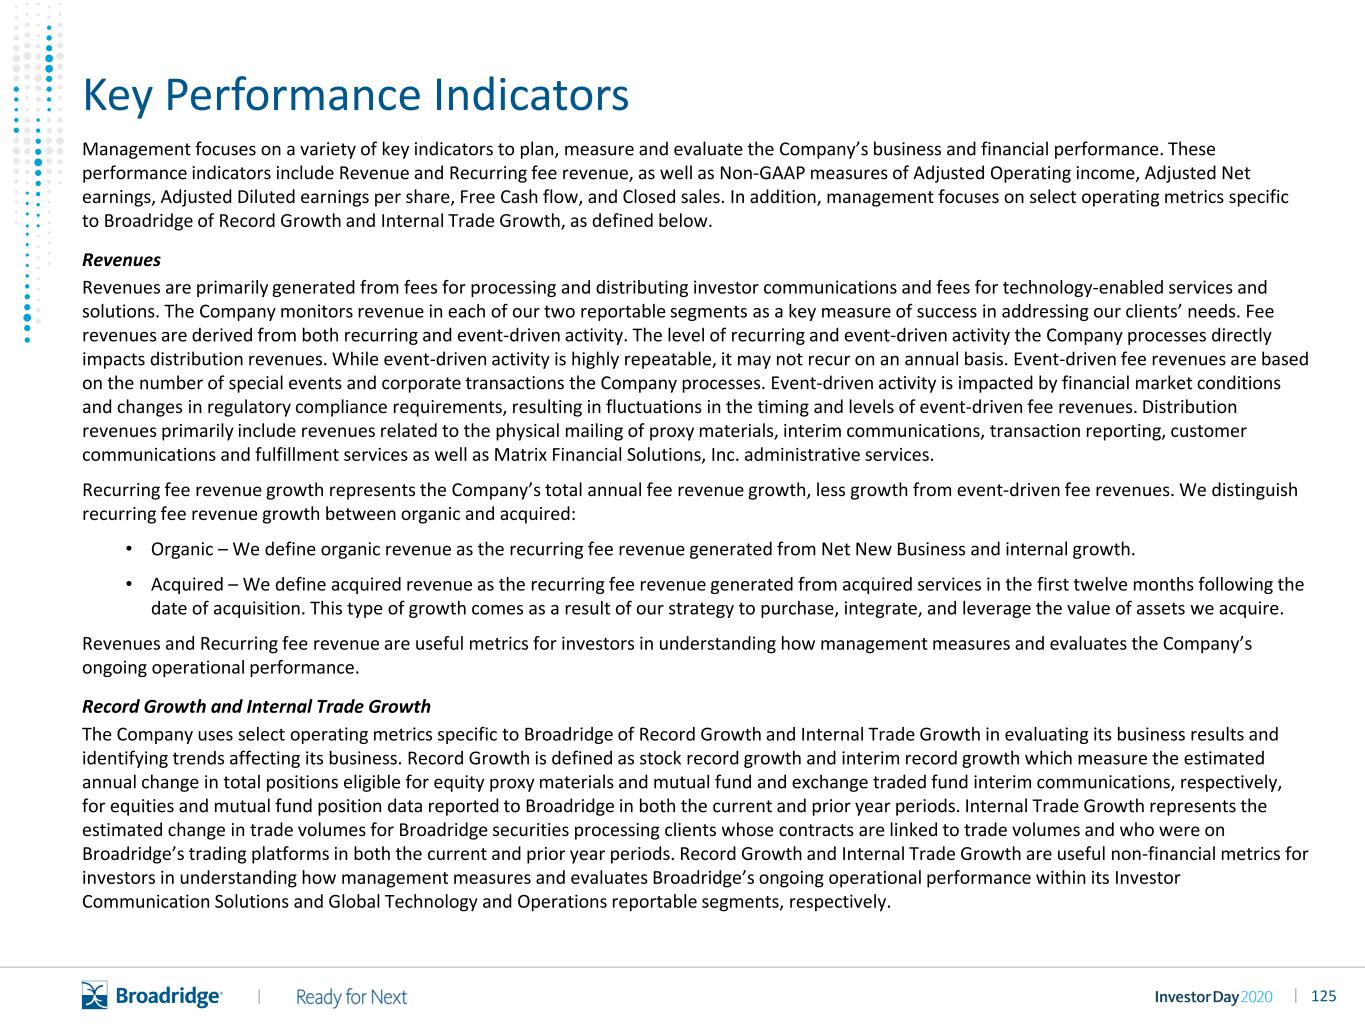
125|| Key Performance Indicators Management focuses on a variety of key indicators to plan, measure and evaluate the Company’s business and financial performance. These performance indicators include Revenue and Recurring fee revenue, as well as Non-GAAP measures of Adjusted Operating income, Adjusted Net earnings, Adjusted Diluted earnings per share, Free Cash flow, and Closed sales. In addition, management focuses on select operating metrics specific to Broadridge of Record Growth and Internal Trade Growth, as defined below. Revenues Revenues are primarily generated from fees for processing and distributing investor communications and fees for technology-enabled services and solutions. The Company monitors revenue in each of our two reportable segments as a key measure of success in addressing our clients’ needs. Fee revenues are derived from both recurring and event-driven activity. The level of recurring and event-driven activity the Company processes directly impacts distribution revenues. While event-driven activity is highly repeatable, it may not recur on an annual basis. Event-driven fee revenues are based on the number of special events and corporate transactions the Company processes. Event-driven activity is impacted by financial market conditions and changes in regulatory compliance requirements, resulting in fluctuations in the timing and levels of event-driven fee revenues. Distribution revenues primarily include revenues related to the physical mailing of proxy materials, interim communications, transaction reporting, customer communications and fulfillment services as well as Matrix Financial Solutions, Inc. administrative services. Recurring fee revenue growth represents the Company’s total annual fee revenue growth, less growth from event-driven fee revenues. We distinguish recurring fee revenue growth between organic and acquired: • Organic – We define organic revenue as the recurring fee revenue generated from Net New Business and internal growth. • Acquired – We define acquired revenue as the recurring fee revenue generated from acquired services in the first twelve months following the date of acquisition. This type of growth comes as a result of our strategy to purchase, integrate, and leverage the value of assets we acquire. Revenues and Recurring fee revenue are useful metrics for investors in understanding how management measures and evaluates the Company’s ongoing operational performance. Record Growth and Internal Trade Growth The Company uses select operating metrics specific to Broadridge of Record Growth and Internal Trade Growth in evaluating its business results and identifying trends affecting its business. Record Growth is defined as stock record growth and interim record growth which measure the estimated annual change in total positions eligible for equity proxy materials and mutual fund and exchange traded fund interim communications, respectively, for equities and mutual fund position data reported to Broadridge in both the current and prior year periods. Internal Trade Growth represents the estimated change in trade volumes for Broadridge securities processing clients whose contracts are linked to trade volumes and who were on Broadridge’s trading platforms in both the current and prior year periods. Record Growth and Internal Trade Growth are useful non-financial metrics for investors in understanding how management measures and evaluates Broadridge’s ongoing operational performance within its Investor Communication Solutions and Global Technology and Operations reportable segments, respectively.

126|| Explanation of Non-GAAP Measures and Reconciliation of GAAP to Non-GAAP Measures

127|| Non-GAAP Measures Adjusted Operating Income, Adjusted Operating Income Margin, Adjusted Net Earnings and Adjusted Earnings Per Share These Non-GAAP measures reflect Operating income, Operating income margin, Net earnings, and Diluted earnings per share, each as adjusted to exclude the impact of certain costs, expenses, gains and losses and other specified items the exclusion of which management believes provides insight regarding our ongoing operating performance. Depending on the period presented, these adjusted measures exclude the impact of certain of the following items: (i) Amortization of Acquired Intangibles and Purchased Intellectual Property, (ii) Acquisition and Integration Costs, (iii) IBM Private Cloud Charges, (iv) Covid-19 Related Expenses, (v) the Gain on Sale of a Joint Venture Investment, (vi) the Gain on Sale of Securities, (vii) U.S. Tax Cuts and Jobs Act (“Tax Act”) items and (viii) the Message Automation Limited (“MAL”) investment gain. Amortization of Acquired Intangibles and Purchased Intellectual Property represents non- cash amortization expenses associated with the Company's acquisition activities. Acquisition and Integration Costs represent certain transaction and integration costs associated with the Company’s acquisition activities. IBM Private Cloud Charges represent a charge on the hardware assets to be transferred to IBM and other charges related to the IBM Private Cloud Agreement. Covid-19 Related Expenses represent certain non-recurring expenses associated with the Covid-19 pandemic. The Gain on Sale of a Joint Venture Investment represents a non-operating, cash gain on the sale of one of the Company’s joint venture investments. The Gain on Sale of Securities represents a non-operating gain on the sale of securities associated with the Company’s retirement plan obligations. Tax Act items represent the net impact of a U.S. federal transition tax on earnings of certain foreign subsidiaries, foreign jurisdiction withholding taxes and certain benefits related to the remeasurement of the Company’s net U.S. federal and state deferred tax liabilities attributable to the Tax Act. The MAL investment gain represents a non-cash, nontaxable gain on investment from the Company’s acquisition of MAL in March 2017. We exclude Acquisition and Integration Costs, IBM Private Cloud Charges, Gain on Sale of a Joint Venture Investment, Covid-19 Related Expenses, Gain on Sale of Securities, Tax Act items and the MAL investment gain from our Adjusted Operating income (as applicable) and other adjusted earnings measures because excluding such information provides us with an understanding of the results from the primary operations of our business and enhances comparability across fiscal reporting periods, as these items are not reflective of our underlying operations or performance. We also exclude the impact of Amortization of Acquired Intangibles and Purchased Intellectual Property, as these non-cash amounts are significantly impacted by the timing and size of individual acquisitions and do not factor into the Company's capital allocation decisions, management compensation metrics or multi-year objectives. Furthermore, management believes that this adjustment enables better comparison of our results as Amortization of Acquired Intangibles and Purchased Intellectual Property will not recur in future periods once such intangible assets have been fully amortized. Although we exclude Amortization of Acquired Intangibles and Purchased Intellectual Property from our adjusted earnings measures, our management believes that it is important for investors to understand that these intangible assets contribute to revenue generation. Amortization of intangible assets that relate to past acquisitions will recur in future periods until such intangible assets have been fully amortized. Any future acquisitions may result in the amortization of additional intangible assets. Free Cash Flow In addition to the Non-GAAP financial measures discussed above, we provide Free cash flow information because we consider Free cash flow to be a liquidity measure that provides useful information to management and investors about the amount of cash generated that could be used for dividends, share repurchases, strategic acquisitions, other investments, as well as debt servicing. Free cash flow is a Non-GAAP financial measure and is defined by the Company as Net cash flows provided by operating activities less Capital expenditures as well as Software purchases and capitalized internal use software. Reconciliations of such Non-GAAP measures to the most directly comparable financial measures presented in accordance with GAAP can be found in the tables that are part of this presentation.
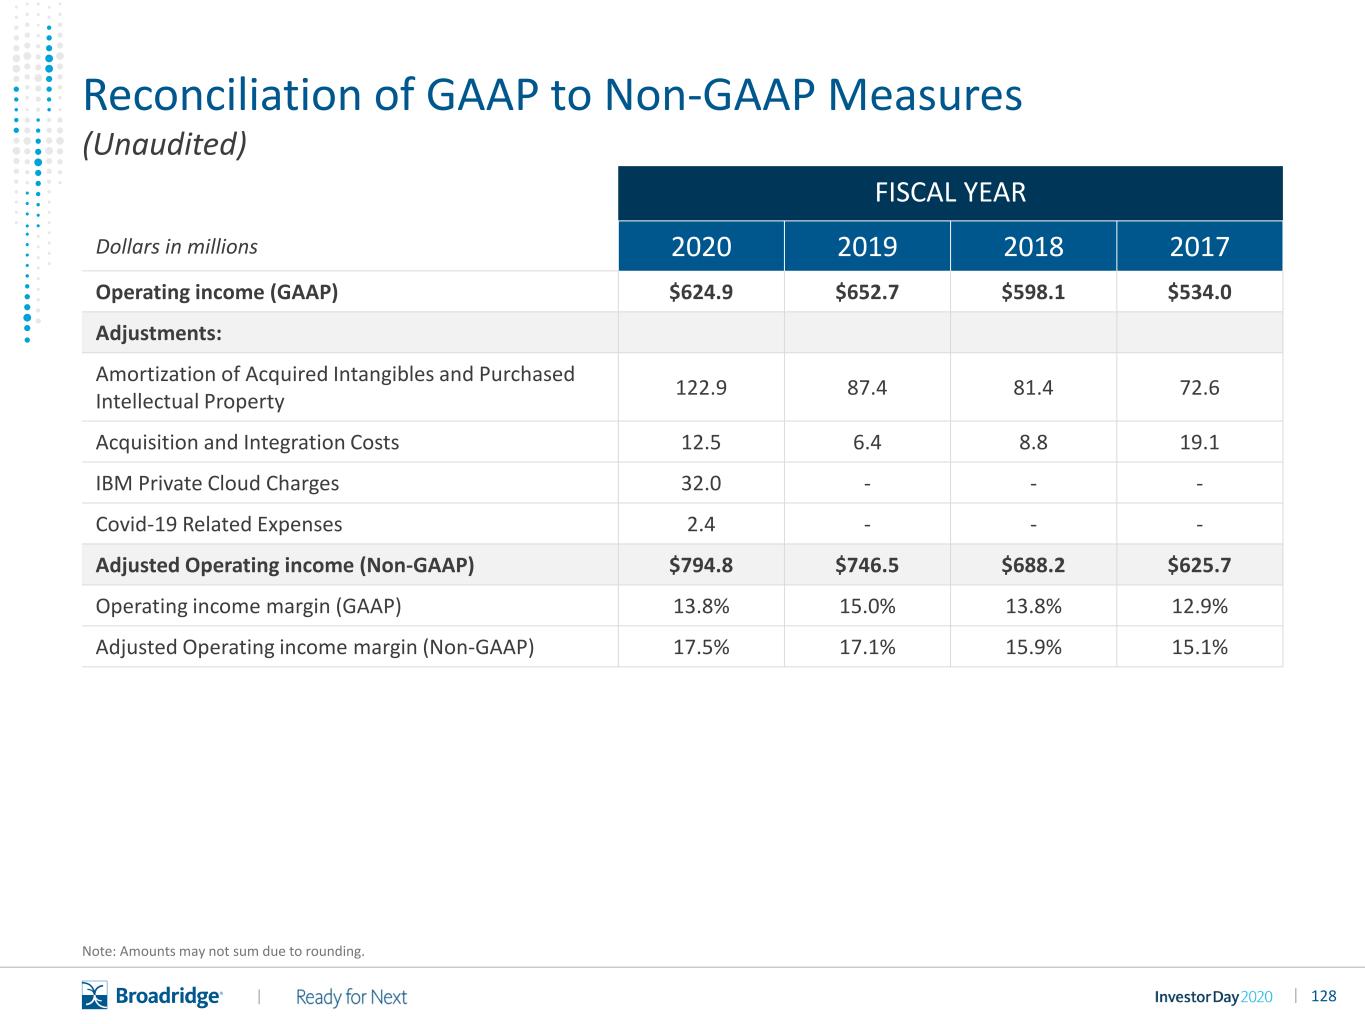
128|| Reconciliation of GAAP to Non-GAAP Measures FISCAL YEAR Dollars in millions 2020 2019 2018 2017 Operating income (GAAP) $624.9 $652.7 $598.1 $534.0 Adjustments: Amortization of Acquired Intangibles and Purchased Intellectual Property 122.9 87.4 81.4 72.6 Acquisition and Integration Costs 12.5 6.4 8.8 19.1 IBM Private Cloud Charges 32.0 - - - Covid-19 Related Expenses 2.4 - - - Adjusted Operating income (Non-GAAP) $794.8 $746.5 $688.2 $625.7 Operating income margin (GAAP) 13.8% 15.0% 13.8% 12.9% Adjusted Operating income margin (Non-GAAP) 17.5% 17.1% 15.9% 15.1% (Unaudited) Note: Amounts may not sum due to rounding.
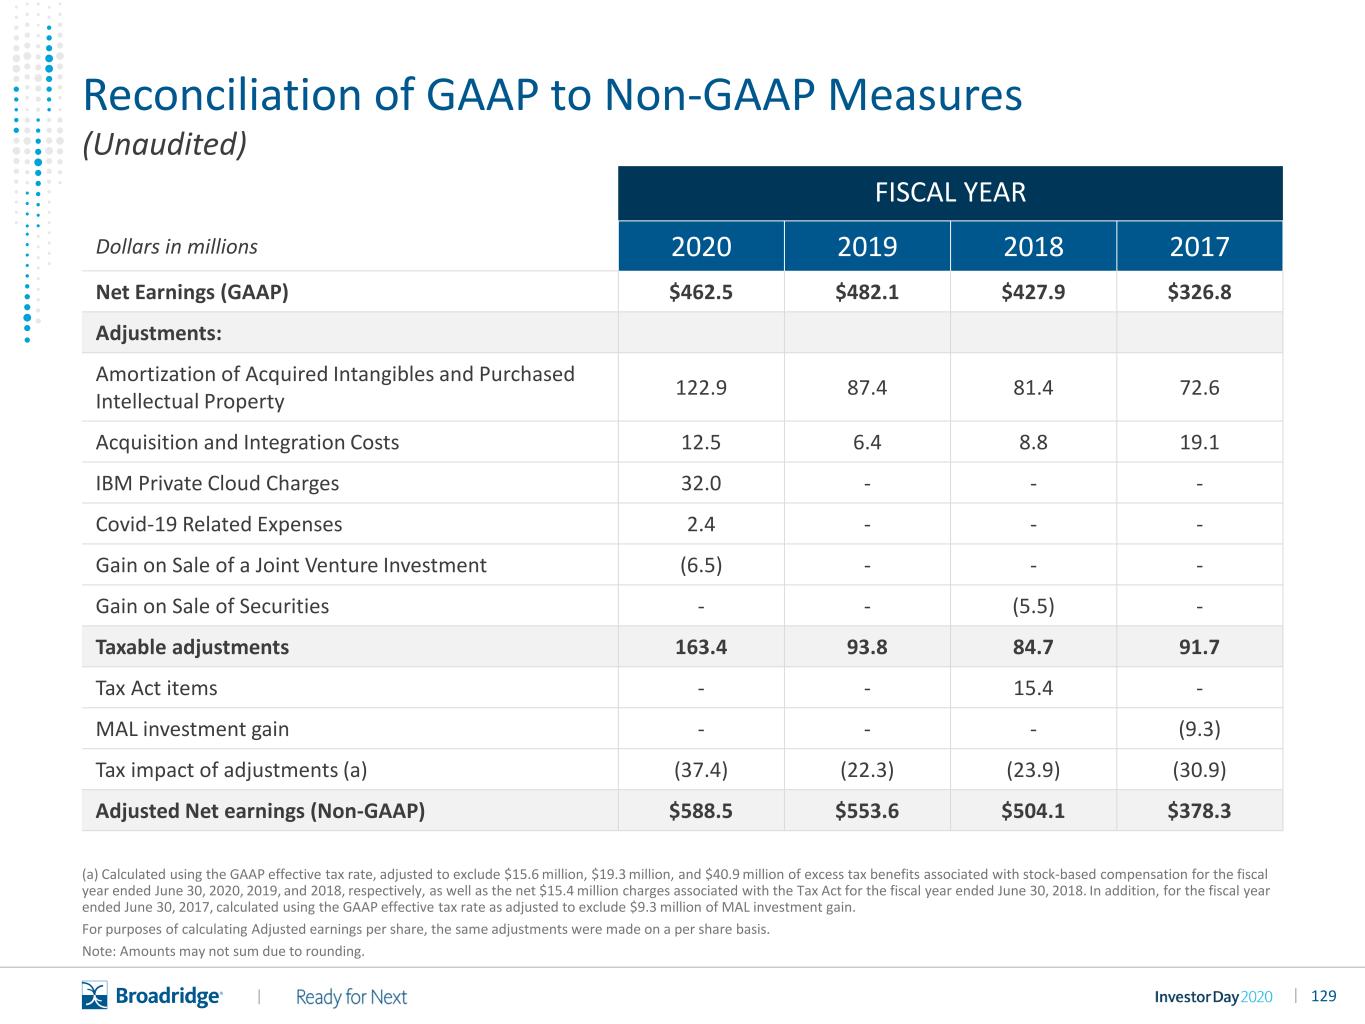
129|| Reconciliation of GAAP to Non-GAAP Measures FISCAL YEAR Dollars in millions 2020 2019 2018 2017 Net Earnings (GAAP) $462.5 $482.1 $427.9 $326.8 Adjustments: Amortization of Acquired Intangibles and Purchased Intellectual Property 122.9 87.4 81.4 72.6 Acquisition and Integration Costs 12.5 6.4 8.8 19.1 IBM Private Cloud Charges 32.0 - - - Covid-19 Related Expenses 2.4 - - - Gain on Sale of a Joint Venture Investment (6.5) - - - Gain on Sale of Securities - - (5.5) - Taxable adjustments 163.4 93.8 84.7 91.7 Tax Act items - - 15.4 - MAL investment gain - - - (9.3) Tax impact of adjustments (a) (37.4) (22.3) (23.9) (30.9) Adjusted Net earnings (Non-GAAP) $588.5 $553.6 $504.1 $378.3 (Unaudited) (a) Calculated using the GAAP effective tax rate, adjusted to exclude $15.6 million, $19.3 million, and $40.9 million of excess tax benefits associated with stock-based compensation for the fiscal year ended June 30, 2020, 2019, and 2018, respectively, as well as the net $15.4 million charges associated with the Tax Act for the fiscal year ended June 30, 2018. In addition, for the fiscal year ended June 30, 2017, calculated using the GAAP effective tax rate as adjusted to exclude $9.3 million of MAL investment gain. For purposes of calculating Adjusted earnings per share, the same adjustments were made on a per share basis. Note: Amounts may not sum due to rounding.

130|| Reconciliation of GAAP to Non-GAAP Measures FISCAL YEAR Dollars in millions, except per share amounts 2020 2019 2018 2017 Diluted earning per share (GAAP) $3.95 $4.06 $3.56 $2.70 Adjustments: Amortization of Acquired Intangibles and Purchased Intellectual Property 1.05 0.74 0.68 0.60 Acquisition and Integration Costs 0.11 0.05 0.07 0.16 IBM Private Cloud Charges 0.27 - - - Covid-19 Related Expenses 0.02 - - - Gain on Sale of a Joint Venture Investment (0.06) - - - Gain on Sale of Securities - - (0.05) - Taxable adjustments 1.40 0.79 0.70 0.76 Tax Act items - - 0.13 - MAL investment gain - - - (0.08) Tax impact of adjustments (a) (0.32) (0.19) (0.20) (0.26) Adjusted earnings per share (Non-GAAP) $5.03 $4.66 $4.19 $3.13 (Unaudited) (a) Calculated using the GAAP effective tax rate, adjusted to exclude $15.6 million, $19.3 million, and $40.9 million of excess tax benefits associated with stock-based compensation for the fiscal year ended June 30, 2020, 2019, and 2018, respectively, as well as the net $15.4 million charges associated with the Tax Act for the fiscal year ended June 30, 2018. In addition, for the fiscal year ended June 30, 2017, calculated using the GAAP effective tax rate as adjusted to exclude $9.3 million of MAL investment gain. For purposes of calculating Adjusted earnings per share, the same adjustments were made on a per share basis. Note: Amounts may not sum due to rounding.
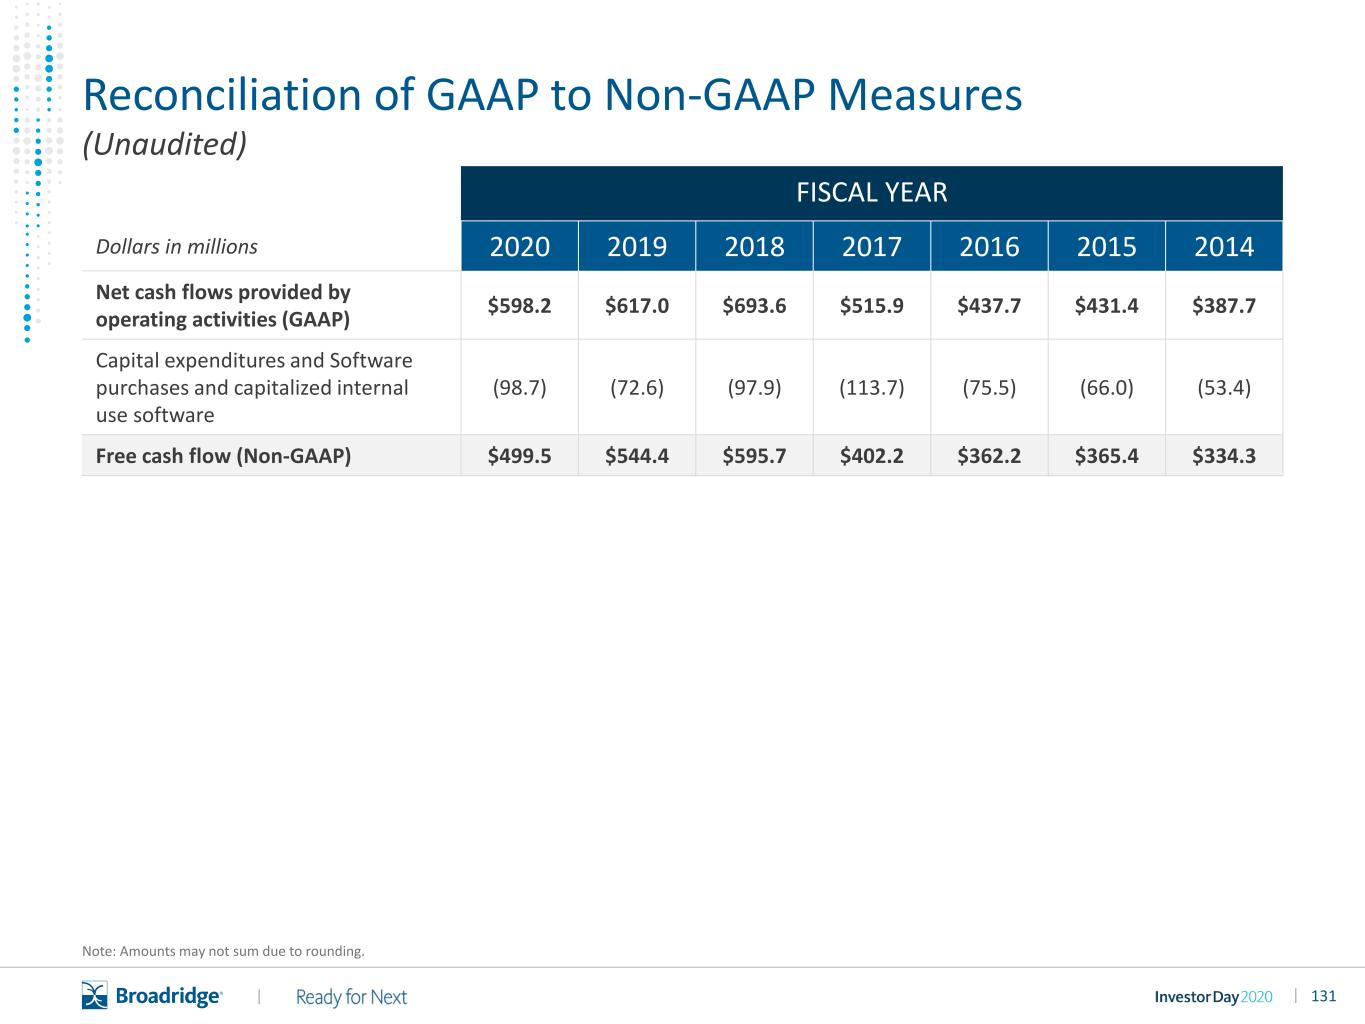
131|| Reconciliation of GAAP to Non-GAAP Measures FISCAL YEAR Dollars in millions 2020 2019 2018 2017 2016 2015 2014 Net cash flows provided by operating activities (GAAP) $598.2 $617.0 $693.6 $515.9 $437.7 $431.4 $387.7 Capital expenditures and Software purchases and capitalized internal use software (98.7) (72.6) (97.9) (113.7) (75.5) (66.0) (53.4) Free cash flow (Non-GAAP) $499.5 $544.4 $595.7 $402.2 $362.2 $365.4 $334.3 (Unaudited) Note: Amounts may not sum due to rounding.
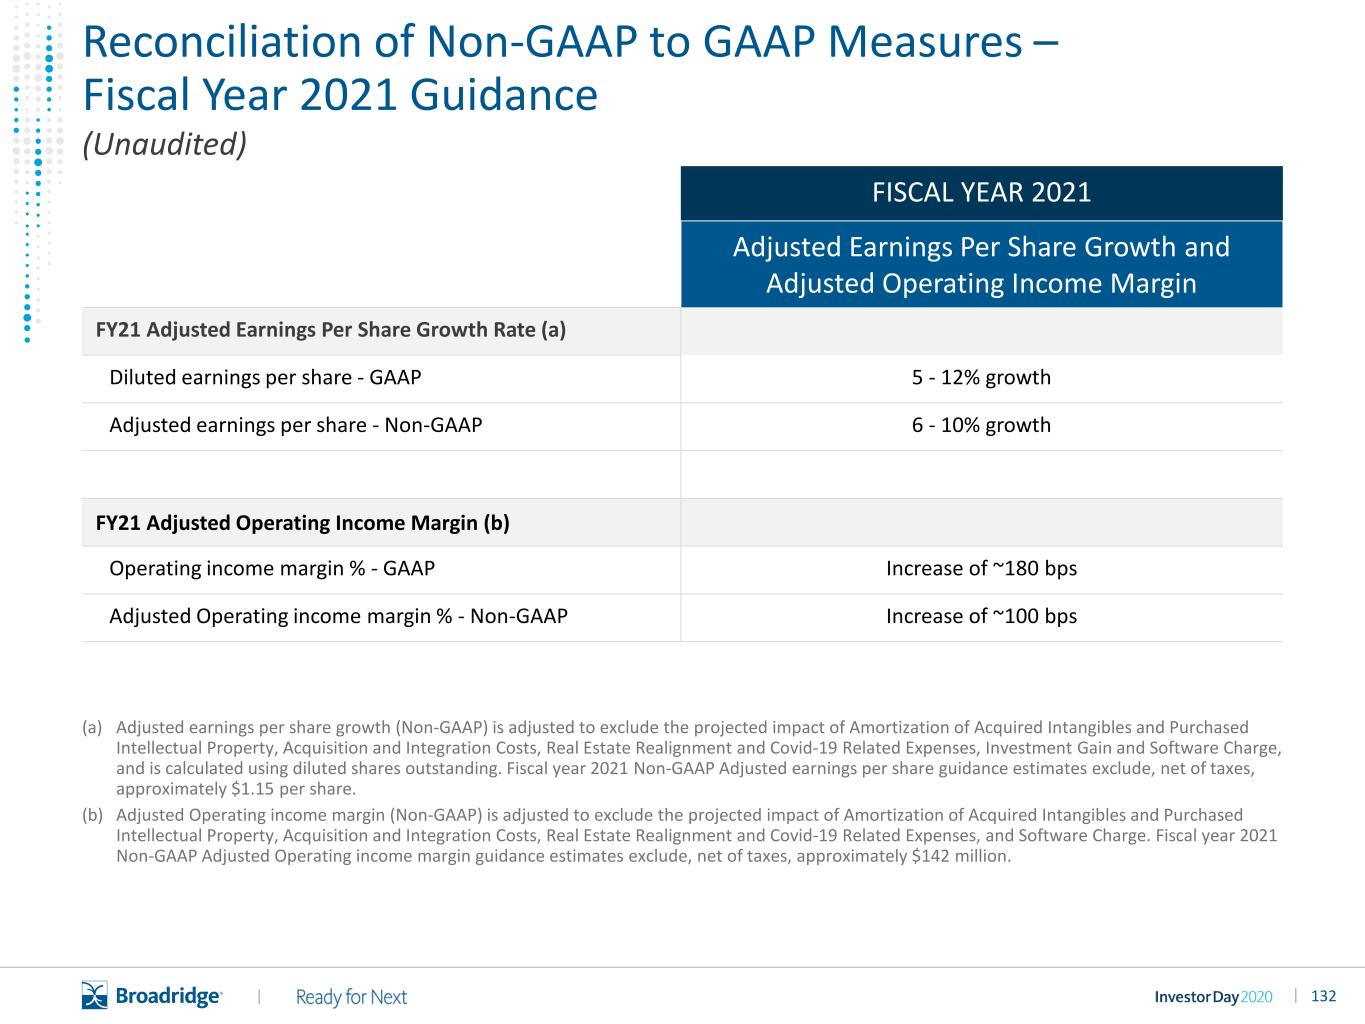
132|| FISCAL YEAR 2021 Adjusted Earnings Per Share Growth and Adjusted Operating Income Margin FY21 Adjusted Earnings Per Share Growth Rate (a) Diluted earnings per share - GAAP 5 - 12% growth Adjusted earnings per share - Non-GAAP 6 - 10% growth FY21 Adjusted Operating Income Margin (b) Operating income margin % - GAAP Increase of ~180 bps Adjusted Operating income margin % - Non-GAAP Increase of ~100 bps Reconciliation of Non-GAAP to GAAP Measures – Fiscal Year 2021 Guidance (Unaudited) (a) Adjusted earnings per share growth (Non-GAAP) is adjusted to exclude the projected impact of Amortization of Acquired Intangibles and Purchased Intellectual Property, Acquisition and Integration Costs, Real Estate Realignment and Covid-19 Related Expenses, Investment Gain and Software Charge, and is calculated using diluted shares outstanding. Fiscal year 2021 Non-GAAP Adjusted earnings per share guidance estimates exclude, net of taxes, approximately $1.15 per share. (b) Adjusted Operating income margin (Non-GAAP) is adjusted to exclude the projected impact of Amortization of Acquired Intangibles and Purchased Intellectual Property, Acquisition and Integration Costs, Real Estate Realignment and Covid-19 Related Expenses, and Software Charge. Fiscal year 2021 Non-GAAP Adjusted Operating income margin guidance estimates exclude, net of taxes, approximately $142 million.
133|| Elsa Ballard Tel: 212-973-6197 Email: Elsa.Ballard@Broadridge.com W. Edings Thibault Tel: 516-472-5129 Email: Edings.Thibault@Broadridge.com Broadridge Investor Relations Contacts

No part of this document may be distributed, reproduced or posted without the express written permission of Broadridge Financial Solutions, Inc. ©2020 Broadridge Financial Solutions, Inc. All rights reserved.


