
0© 2022 | Scaling a Global Fintech Leader E A R N I N G S C O N F E R E N C E C A L L Third Quarter Fiscal Year 2022 EXHIBIT 99.2
1© 2022 | Forward-Looking Statements This presentation and other written or oral statements made from time to time by representatives of Broadridge Financial Solutions, Inc. ("Broadridge" or the "Company") may contain “forward-looking statements” within the meaning of the Private Securities Litigation Reform Act of 1995. Statements that are not historical in nature, and which may be identified by the use of words such as “expects,” “assumes,” “projects,” “anticipates,” “estimates,” “we believe,” “could be,” “on track,” and other words of similar meaning are forward-looking statements. In particular, information appearing in the “Fiscal Year 2022 Guidance” section and statements about our three-year objectives are forward-looking statements. These statements are based on management’s expectations and assumptions and are subject to risks and uncertainties that may cause actual results to differ materially from those expressed. These risks and uncertainties include those risk factors described and discussed in Part I, “Item 1A. Risk Factors” of the Annual Report on Form 10-K for the year ended June 30, 2021 (the “2021 Annual Report”), as they may be updated in any future reports filed with the Securities and Exchange Commission. All forward-looking statements speak only as of the date of this presentation and are expressly qualified in their entirety by reference to the factors discussed in the 2021 Annual Report. These risks include: • The potential impact and effects of the Covid-19 pandemic (“Covid-19”) on the business of Broadridge, Broadridge’s results of operations and financial performance, any measures Broadridge has and may take in response to Covid-19 and any expectations Broadridge may have with respect thereto; • The success of Broadridge in retaining and selling additional services to its existing clients and in obtaining new clients; • Broadridge’s reliance on a relatively small number of clients, the continued financial health of those clients, and the continued use by such clients of Broadridge’s services with favorable pricing terms; • A material security breach or cybersecurity attack affecting the information of Broadridge's clients; • Changes in laws and regulations affecting Broadridge’s clients or the services provided by Broadridge; • Declines in participation and activity in the securities markets; • The failure of Broadridge's key service providers to provide the anticipated levels of service; • A disaster or other significant slowdown or failure of Broadridge’s systems or error in the performance of Broadridge’s services; • Overall market, economic and geopolitical conditions and their impact on the securities markets; • Broadridge’s failure to keep pace with changes in technology and demands of its clients; • Broadridge’s ability to attract and retain key personnel; • The impact of new acquisitions and divestitures; and • Competitive conditions. Broadridge disclaims any obligation to update or revise forward-looking statements that may be made to reflect events or circumstances that arise after the date made or to reflect the occurrence of unanticipated events, other than as required by law.
2© 2022 | Use of Non-GAAP financial measures, KPIs and foreign exchange rates Use of Non-GAAP Financial Measures This presentation includes certain Non-GAAP financial measures including Adjusted Operating income, Adjusted Operating income margin, Adjusted Net earnings, Adjusted earnings per share (“EPS”), and Free cash flow. Please see the “Explanation of Non-GAAP Measures and Reconciliation of GAAP to Non-GAAP Measures” section of this presentation for more information on Broadridge’s use of Non-GAAP measures and reconciliations to GAAP measures. Key Performance Indicators Management focuses on a variety of key indicators to plan, measure and evaluate the Company’s business and financial performance. These performance indicators include Revenues and Recurring revenue, as well as Non-GAAP measures of Adjusted Operating income, Adjusted Net earnings, Adjusted EPS, Free cash flow, and Closed sales. In addition, management focuses on select operating metrics specific to Broadridge of Record Growth and Internal Trade Growth. Please refer to Item 7. Management’s Discussion and Analysis of Financial Condition of the Company’s Form 10-Q for a discussion of Revenues, Recurring revenue, Record Growth and Internal Trade Growth in the “Key Performance Indicators” section and the “Results of Operations” section for a description of Closed sales. Foreign Exchange Rates Beginning with the first quarter of fiscal year 2022, the Company revised the foreign exchange rates used to present segment revenues, Closed sales, and supplemental reporting, to further allocate the foreign exchange impact to the individual segment revenue metrics. The presentation of segment revenues and Closed sales for fiscal year 2020 and fiscal year 2021 provided has been changed to conform to the current period presentation. Total consolidated revenues and earnings before income taxes were not impacted. Note on Rounding Amounts presented in this presentation may not sum due to rounding. Use of Material Contained Herein The information contained in this presentation is being provided for your convenience and information only. This information is accurate as of the date of its initial presentation. If you plan to use this information for any purpose, verification of its continued accuracy is your responsibility. Broadridge assumes no duty to update or revise the information contained in this presentation.
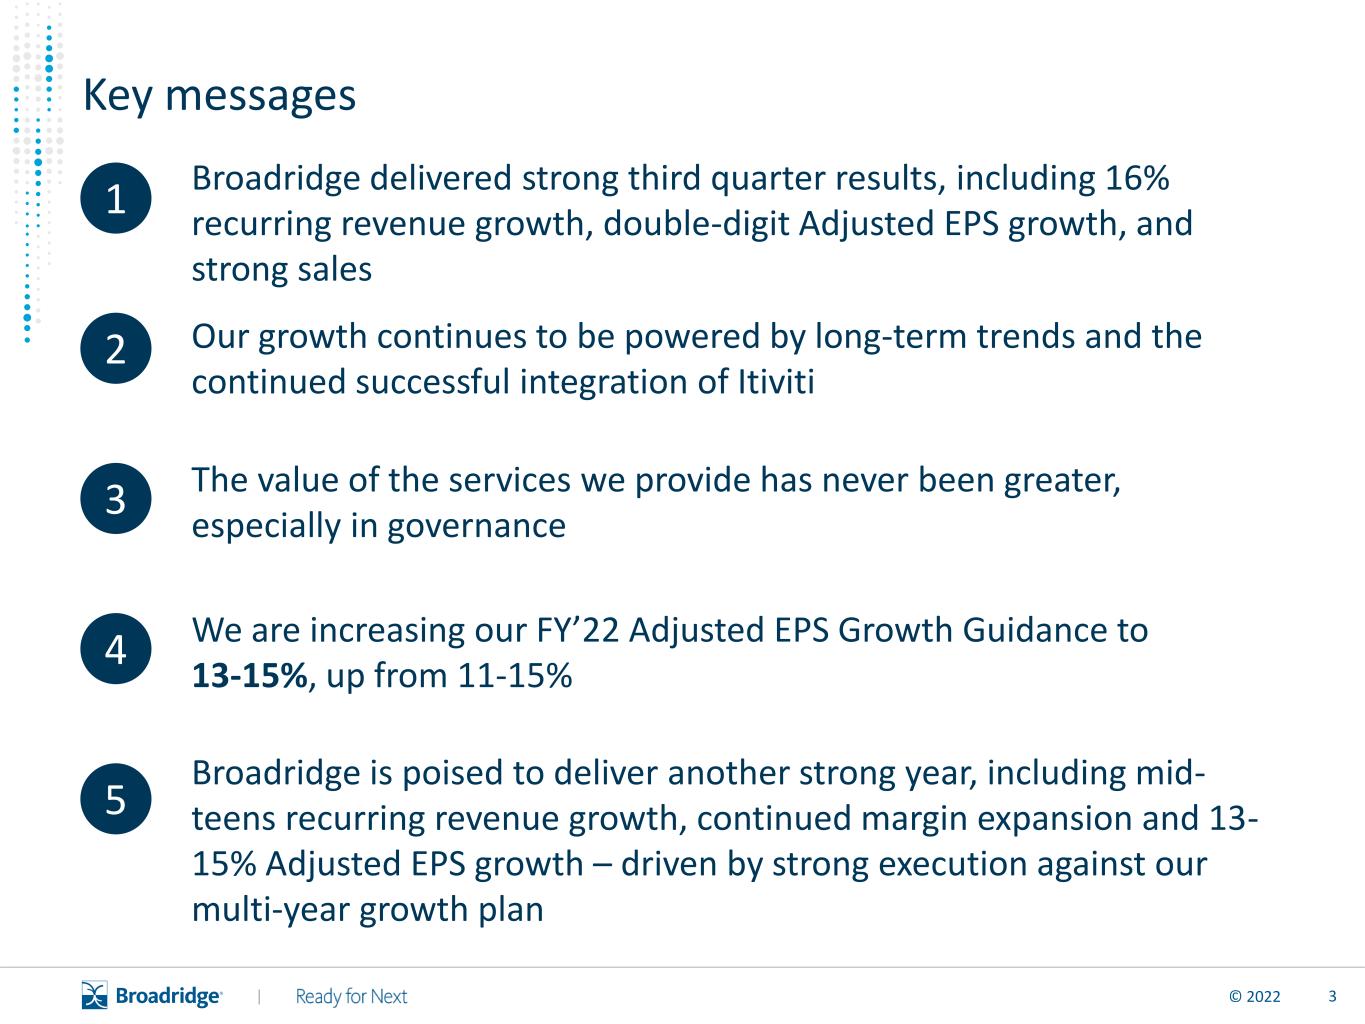
3© 2022 | Key messages Broadridge delivered strong third quarter results, including 16% recurring revenue growth, double-digit Adjusted EPS growth, and strong sales 1 2 3 4 5 Our growth continues to be powered by long-term trends and the continued successful integration of Itiviti The value of the services we provide has never been greater, especially in governance We are increasing our FY’22 Adjusted EPS Growth Guidance to 13-15%, up from 11-15% Broadridge is poised to deliver another strong year, including mid- teens recurring revenue growth, continued margin expansion and 13- 15% Adjusted EPS growth – driven by strong execution against our multi-year growth plan

4© 2022 | Broadridge is executing across Governance, Capital Markets, and Wealth & Investment Management Extend Governance Grow Capital Markets Build Wealth & Investment Mgmt. $630M +9% YoY $247M +56% YoY $134M (2)% YoY 1. Excludes event and distribution revenue 1 Q3’22 Highlights • 17% equity record growth driven by broad growth across wealth managers and accompanied by strong growth in fund positions • Strong Itiviti results highlight continued momentum in the market • DLT and AI solutions gaining traction • Wealth Management continues to generate strong closed sales while lapping elevated Fiscal 21 meme stock trading volumes
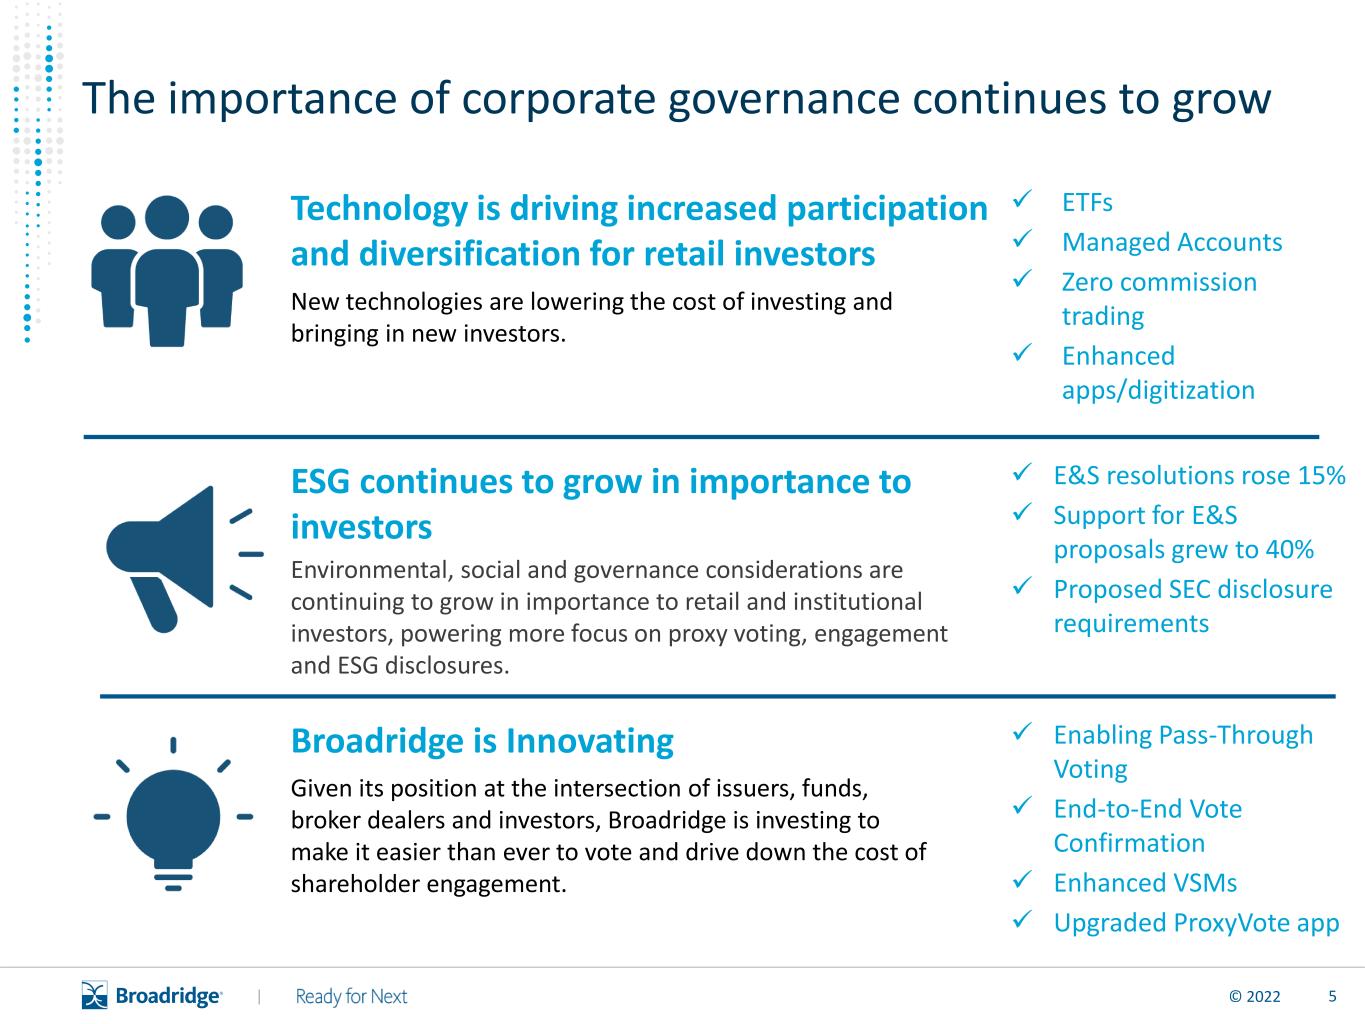
5© 2022 | The importance of corporate governance continues to grow Technology is driving increased participation and diversification for retail investors New technologies are lowering the cost of investing and bringing in new investors. ✓ ETFs ✓ Managed Accounts ✓ Zero commission trading ✓ Enhanced apps/digitization Broadridge is Innovating Given its position at the intersection of issuers, funds, broker dealers and investors, Broadridge is investing to make it easier than ever to vote and drive down the cost of shareholder engagement. ✓ Enabling Pass-Through Voting ✓ End-to-End Vote Confirmation ✓ Enhanced VSMs ✓ Upgraded ProxyVote app ESG continues to grow in importance to investors Environmental, social and governance considerations are continuing to grow in importance to retail and institutional investors, powering more focus on proxy voting, engagement and ESG disclosures. ✓ E&S resolutions rose 15% ✓ Support for E&S proposals grew to 40% ✓ Proposed SEC disclosure requirements
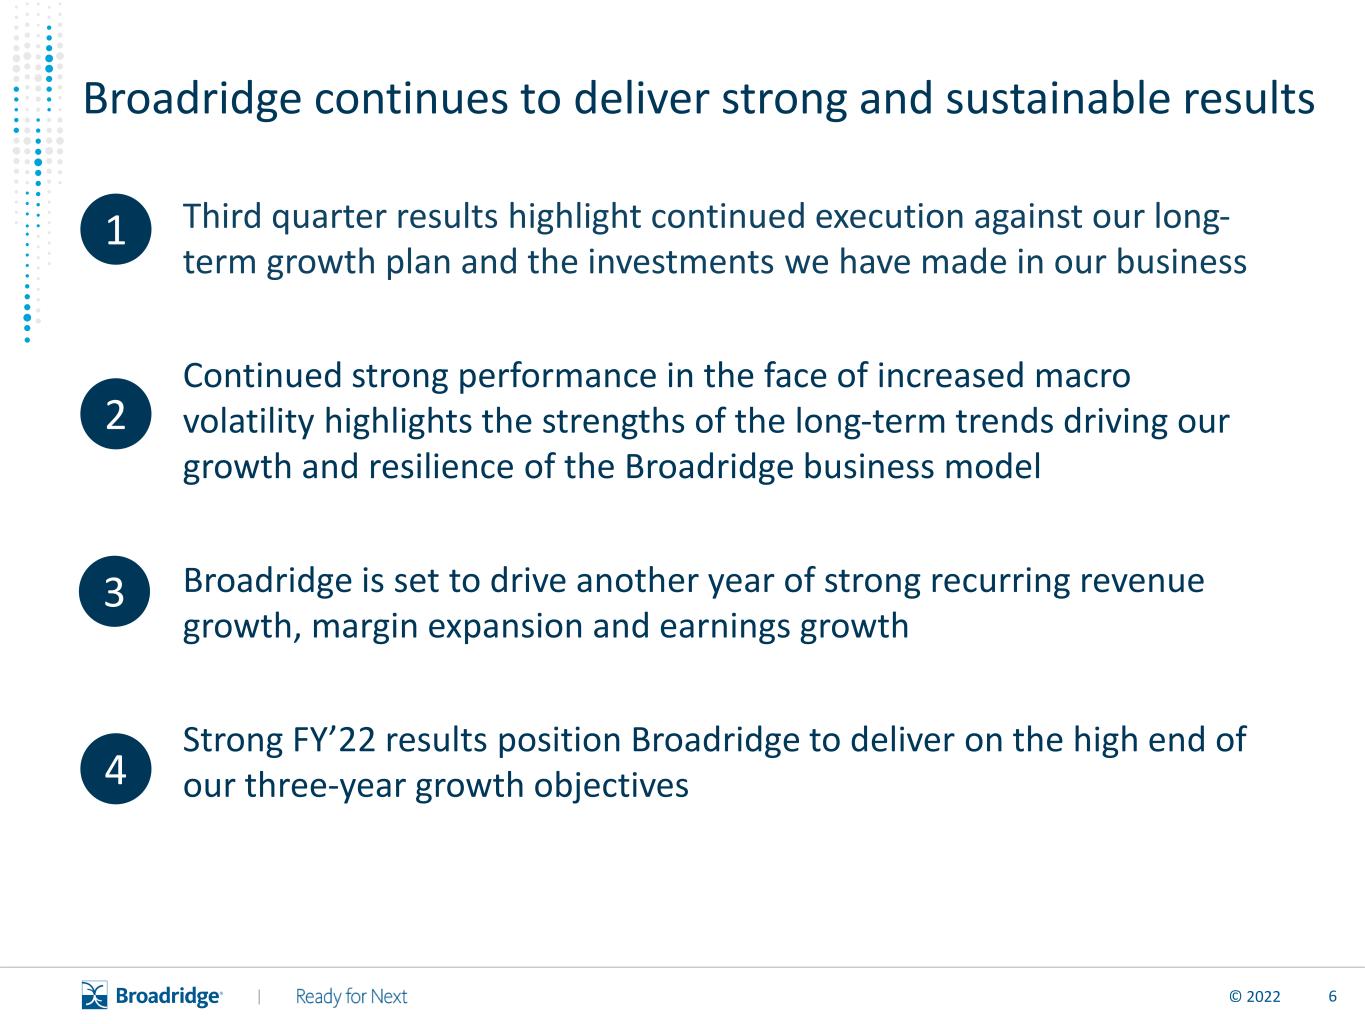
6© 2022 | Broadridge continues to deliver strong and sustainable results Third quarter results highlight continued execution against our long- term growth plan and the investments we have made in our business Continued strong performance in the face of increased macro volatility highlights the strengths of the long-term trends driving our growth and resilience of the Broadridge business model Broadridge is set to drive another year of strong recurring revenue growth, margin expansion and earnings growth Strong FY’22 results position Broadridge to deliver on the high end of our three-year growth objectives 1 2 3 4
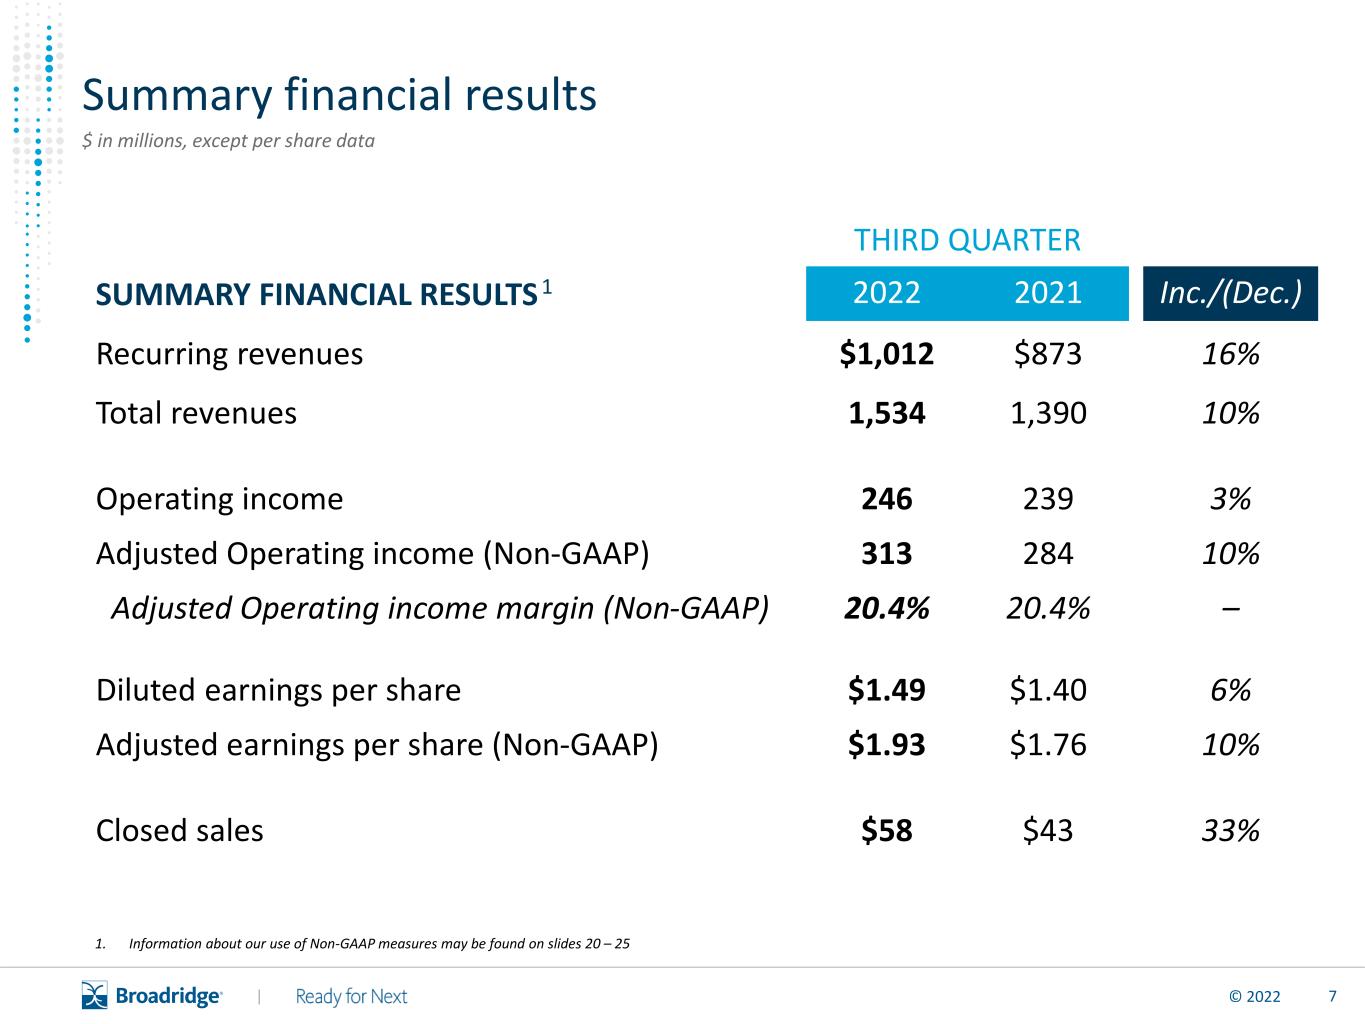
7© 2022 | Summary financial results $ in millions, except per share data THIRD QUARTER SUMMARY FINANCIAL RESULTS 2022 2021 Inc./(Dec.) Recurring revenues $1,012 $873 16% Total revenues 1,534 1,390 10% Operating income 246 239 3% Adjusted Operating income (Non-GAAP) 313 284 10% Adjusted Operating income margin (Non-GAAP) 20.4% 20.4% – Diluted earnings per share $1.49 $1.40 6% Adjusted earnings per share (Non-GAAP) $1.93 $1.76 10% Closed sales $58 $43 33% 1. Information about our use of Non-GAAP measures may be found on slides 20 – 25 1
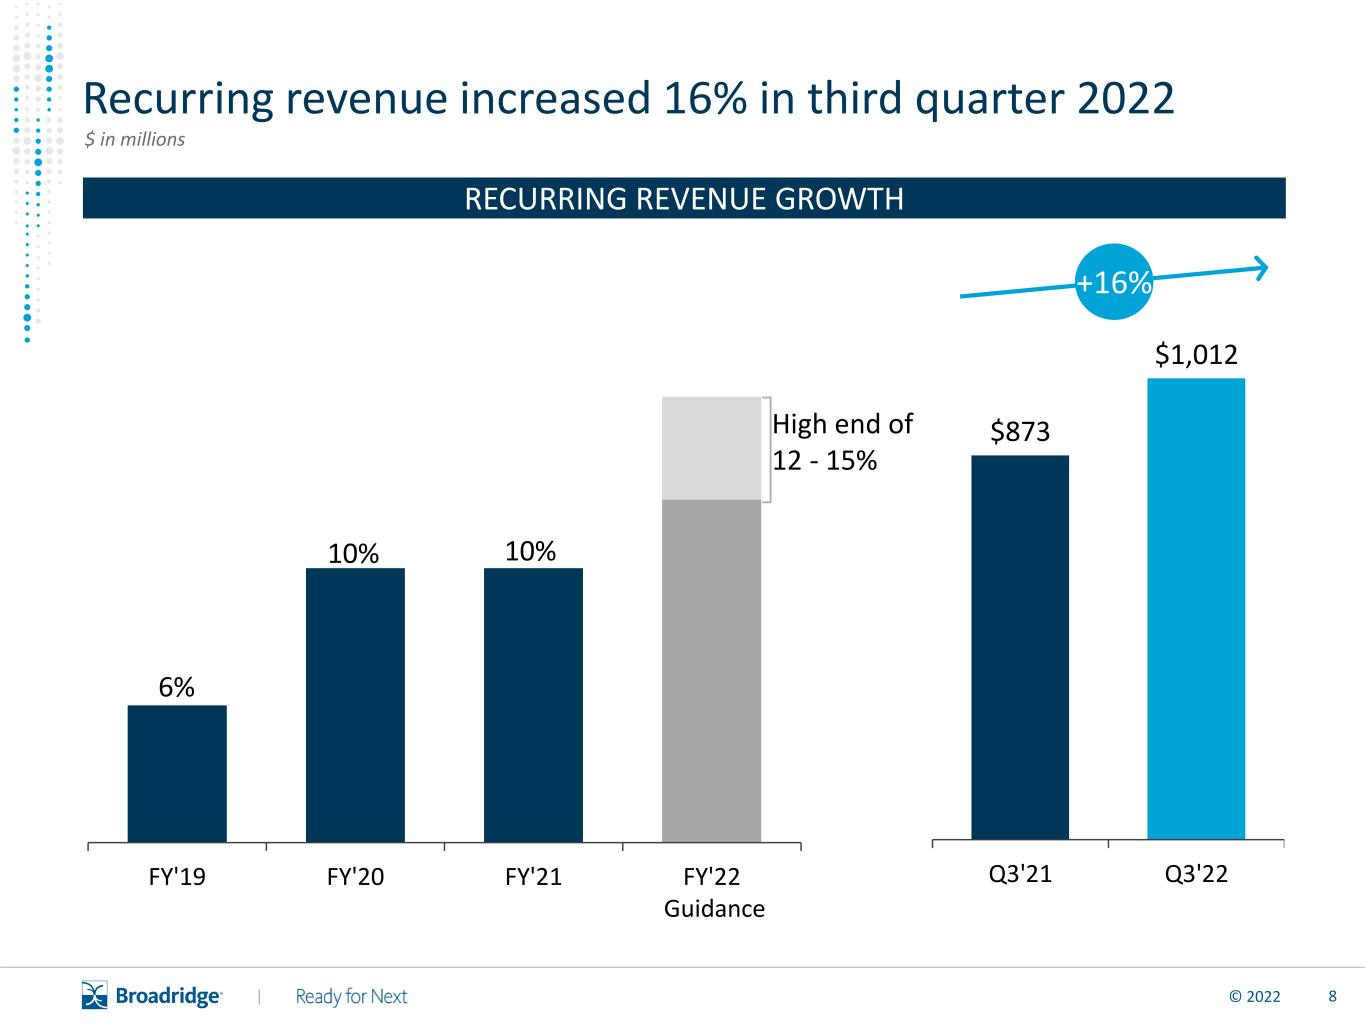
8© 2022 | FY'19 FY'20 FY'21 FY'22 $873 $1,012 Q3'21 Q3'22 Recurring revenue increased 16% in third quarter 2022 RECURRING REVENUE GROWTH 10%10% $ in millions Guidance High end of 12 - 15% 6% +16%
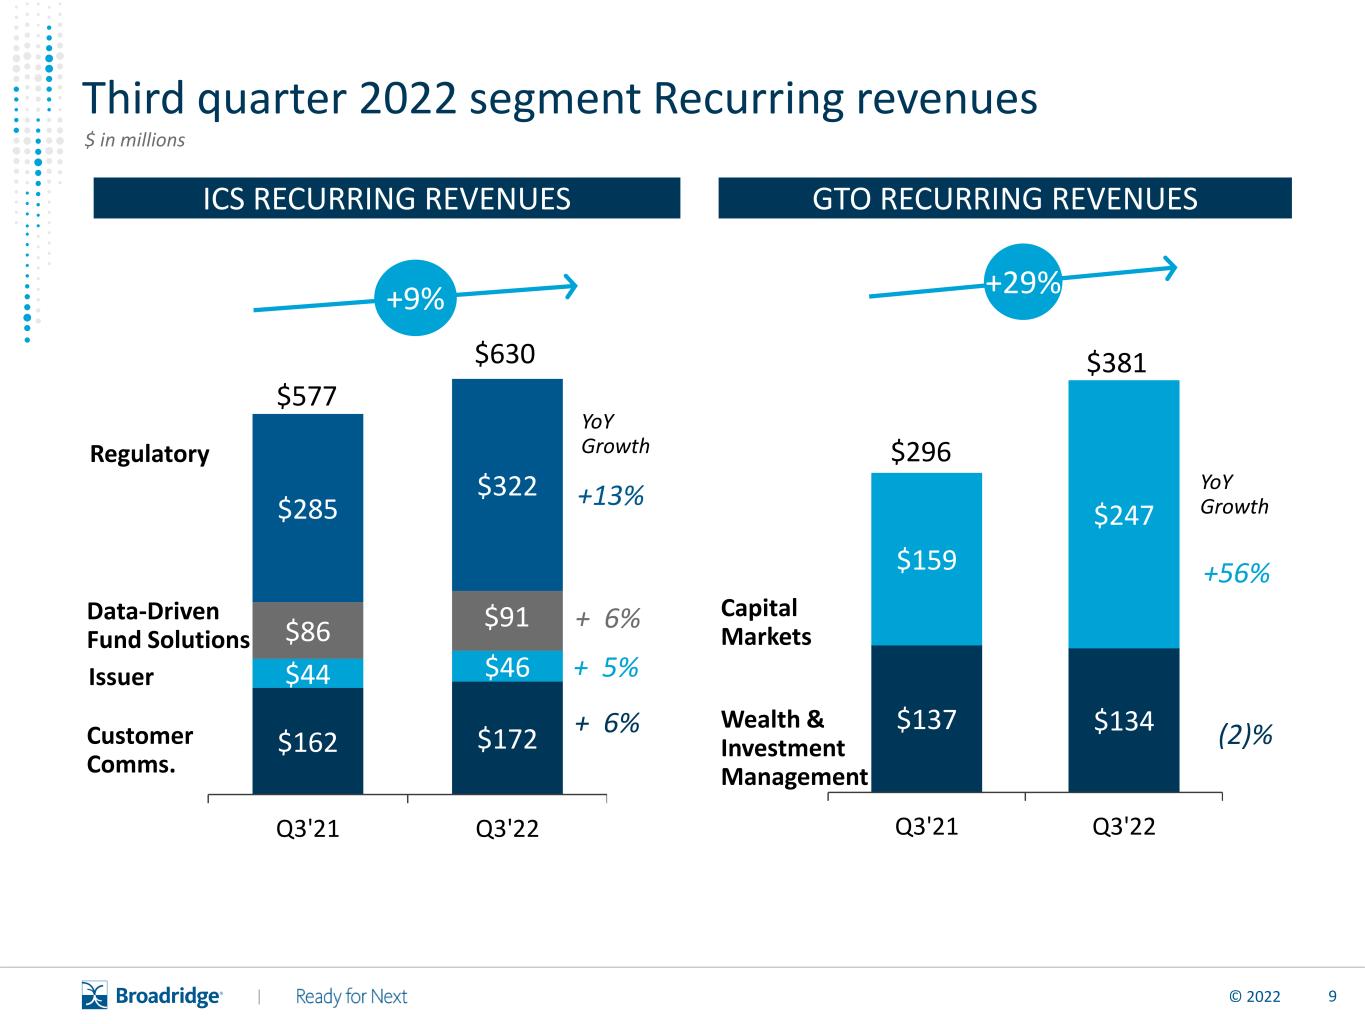
9© 2022 | $137 $134 $159 $247 Q3'21 Q3'22 $162 $172 $44 $46 $86 $285 $322 Q3'21 Q3'22 Regulatory Customer Comms. Data-Driven Fund Solutions Issuer $ in millions + 5% + 6% + 6% +13% ICS RECURRING REVENUES GTO RECURRING REVENUES Third quarter 2022 segment Recurring revenues $630 $577 Capital Markets Wealth & Investment Management $381 $296 +56% (2)% YoY Growth YoY Growth $91 +9% +29%
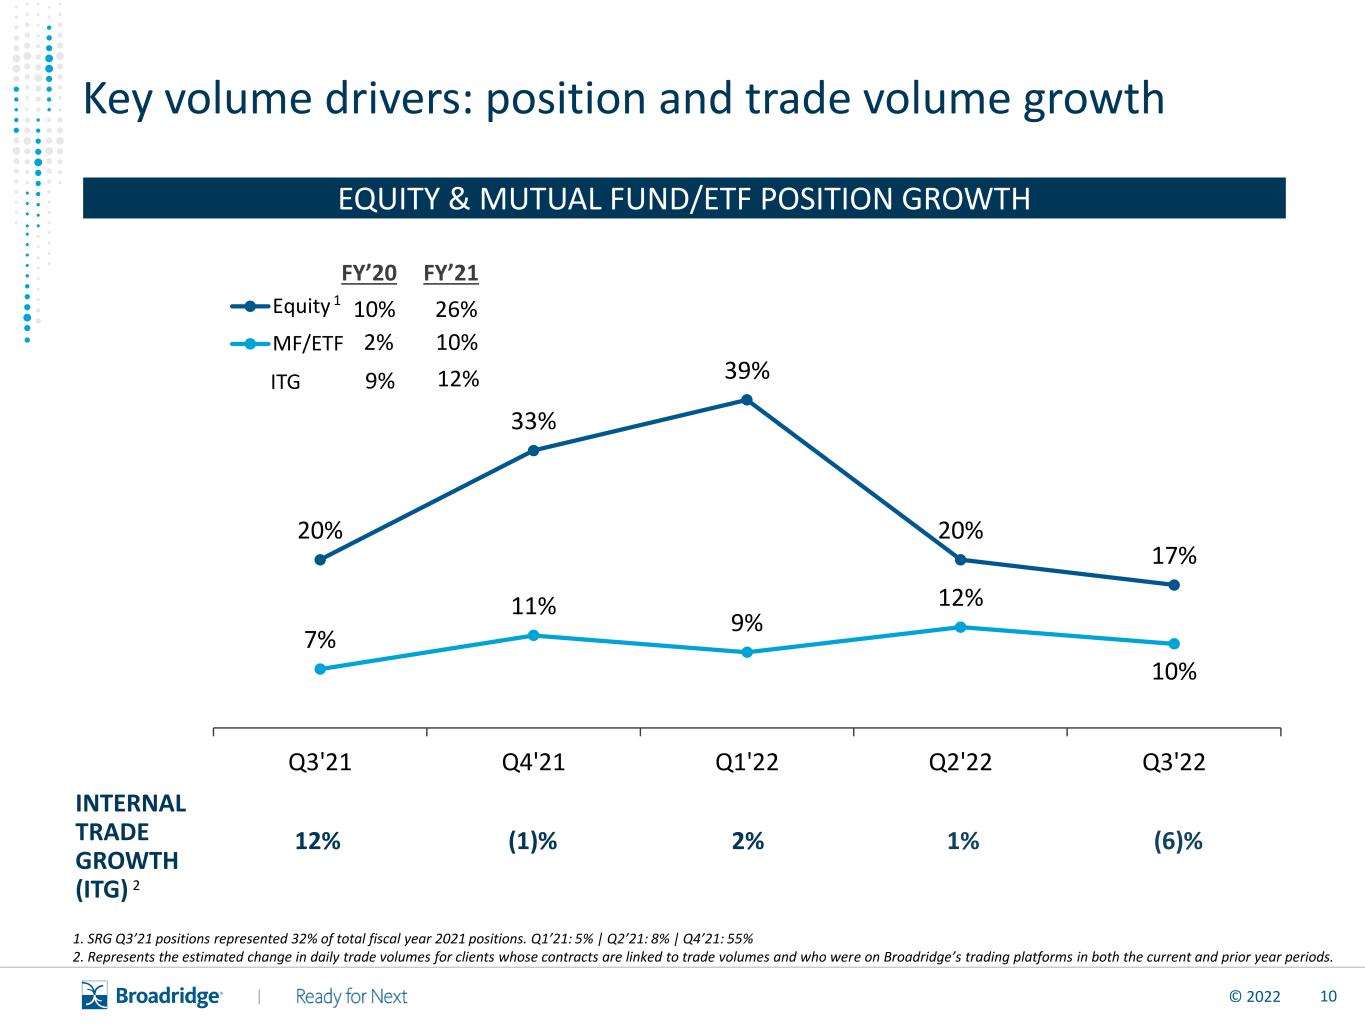
10© 2022 | INTERNAL TRADE GROWTH (ITG) 20% 33% 39% 20% 17% 7% 11% 9% 12% 10% Q3'21 Q4'21 Q1'22 Q2'22 Q3'22 Equity MF/ETF EQUITY & MUTUAL FUND/ETF POSITION GROWTH Key volume drivers: position and trade volume growth 12% (1)% 2% 1% (6)% FY’20 FY’21 26% 10% 10% 2% ITG 12%9% 1. SRG Q3’21 positions represented 32% of total fiscal year 2021 positions. Q1’21: 5% | Q2’21: 8% | Q4’21: 55% 2. Represents the estimated change in daily trade volumes for clients whose contracts are linked to trade volumes and who were on Broadridge’s trading platforms in both the current and prior year periods. 1 2
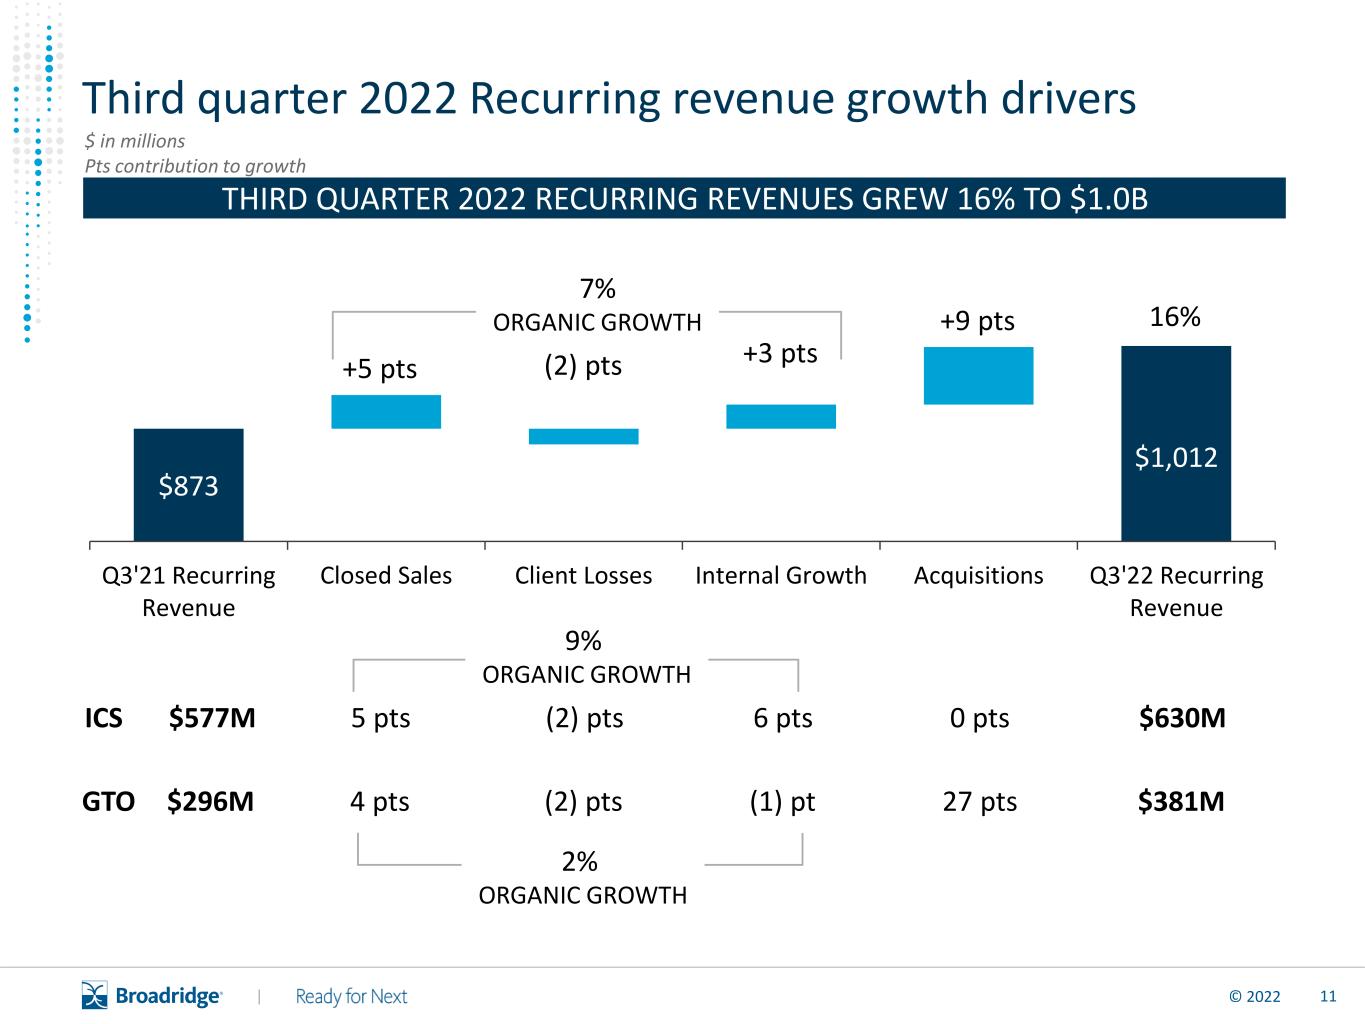
11© 2022 | GTO $296M 4 pts (2) pts (1) pt 27 pts $381M ICS $577M 5 pts (2) pts 6 pts 0 pts $630M Third quarter 2022 Recurring revenue growth drivers THIRD QUARTER 2022 RECURRING REVENUES GREW 16% TO $1.0B $ in millions Pts contribution to growth $873 $1,012 Q3'21 Recurring Revenue Closed Sales Client Losses Internal Growth Acquisitions Q3'22 Recurring Revenue +5 pts (2) pts +3 pts +9 pts 16% 7% ORGANIC GROWTH 9% ORGANIC GROWTH 2% ORGANIC GROWTH
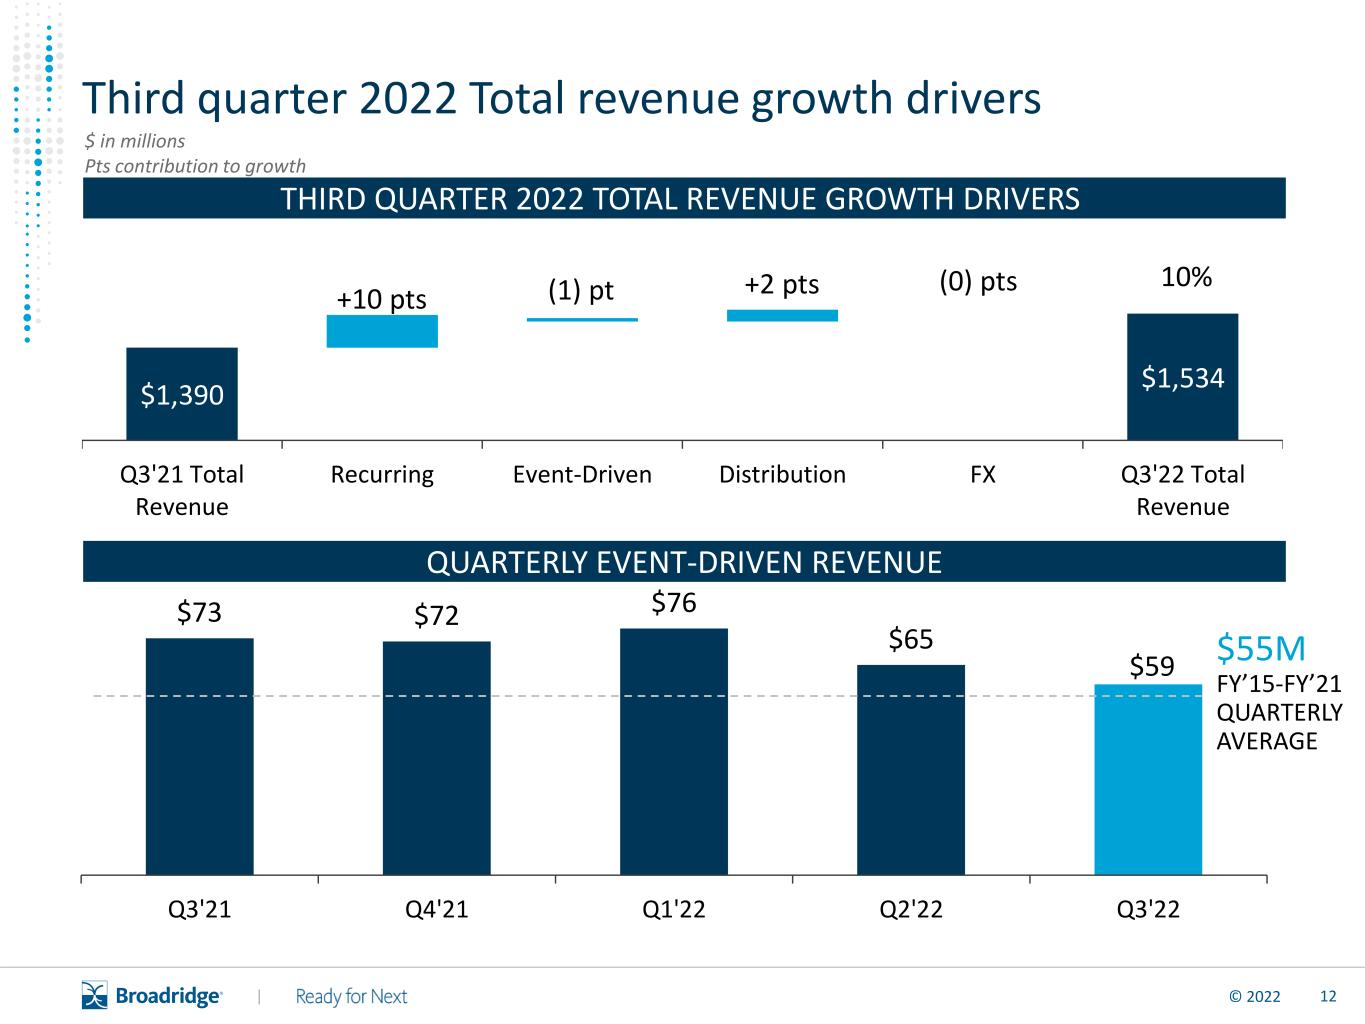
12© 2022 | $73 $72 $76 $65 $59 Q3'21 Q4'21 Q1'22 Q2'22 Q3'22 $1,390 $1,534 Q3'21 Total Revenue Recurring Event-Driven Distribution FX Q3'22 Total Revenue Third quarter 2022 Total revenue growth drivers QUARTERLY EVENT-DRIVEN REVENUE +10 pts (1) pt +2 pts (0) pts 10% THIRD QUARTER 2022 TOTAL REVENUE GROWTH DRIVERS $55M FY’15-FY’21 QUARTERLY AVERAGE $ in millions Pts contribution to growth

13© 2022 | 17.1% 17.5% 18.1% FY'19 FY'20 FY'21 FY'22 15.0% 13.8% 13.6% 16.0%17.2% 20.4% 20.4% Q3'21 Q3'22 +120 bps +40 bps +60 bps OPERATING INCOME MARGIN (GAAP) ADJUSTED OPERATING INCOME MARGIN (NON- GAAP) ~18.5% Guidance Operating income margin and Adjusted Operating income margin OPERATING INCOME MARGIN

14© 2022 | $119 $170 YTD'21 YTD'22FY'20 FY'21 FY'22 $228 $232 Guidance Closed sales remain on track with fiscal year 2022 guidance $ in millions $240 – $280M CLOSED SALES
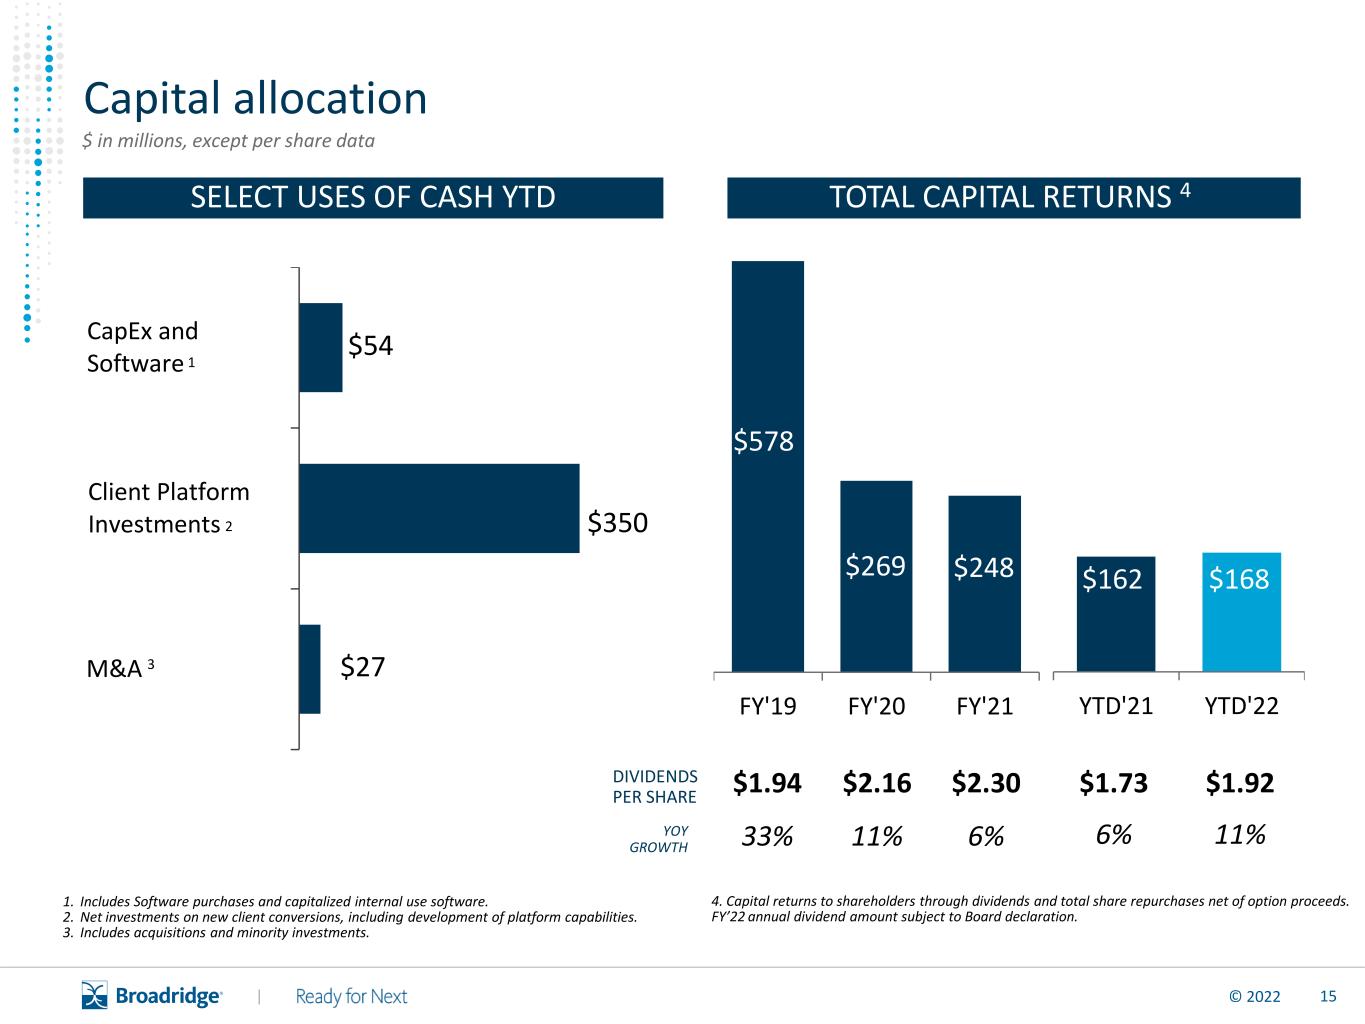
15© 2022 | TOTAL CAPITAL RETURNS 4 YTD'21 YTD'22 $1.94 $2.16 $2.30 33% 11% 6% DIVIDENDS PER SHARE M&A Client Platform Investments CapEx and Software Capital allocation 2 1. Includes Software purchases and capitalized internal use software. 2. Net investments on new client conversions, including development of platform capabilities. 3. Includes acquisitions and minority investments. SELECT USES OF CASH YTD 1 $350 FY'19 FY'20 FY'21 $54 $27 $ in millions, except per share data 3 6 $1.73 $1.92 6% 11% $168$162$248$269 $578 4. Capital returns to shareholders through dividends and total share repurchases net of option proceeds. FY’22 annual dividend amount subject to Board declaration. YOY GROWTH

16© 2022 | Fiscal Year 2022 Guidance FY’22 Guidance Updates / Change Recurring revenue growth High end of 12-15% No change Adjusted Operating income margin (Non-GAAP) ~18.5% No change Adjusted earnings per share growth (Non-GAAP) 13-15% Increasing from 11-15% Closed sales $240-$280M No change

17© 2022 | Appendix
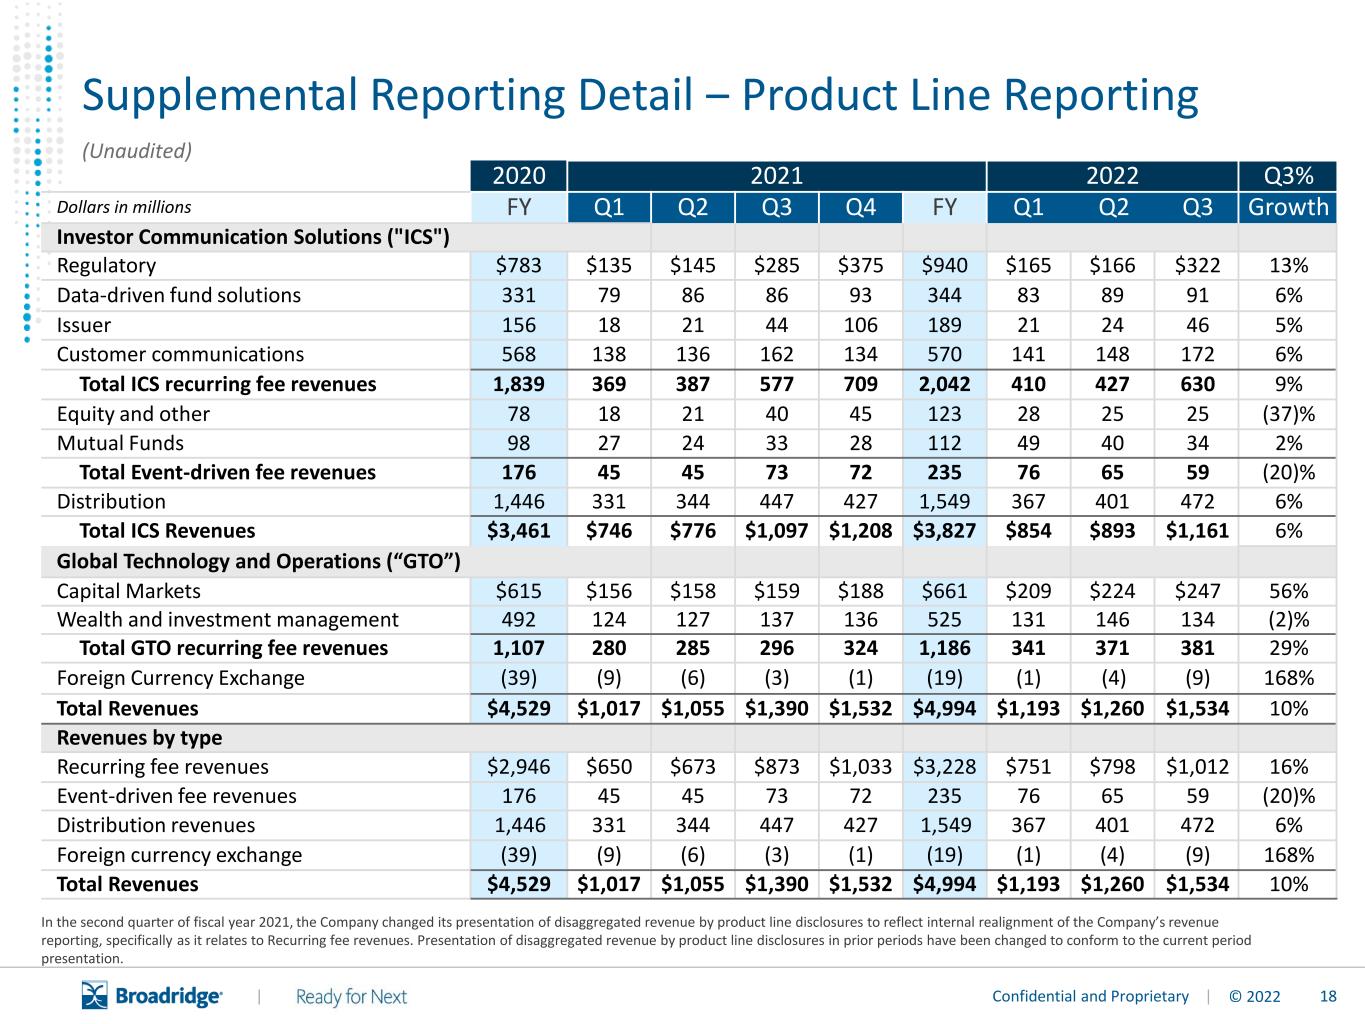
18© 2022 | Confidential and Proprietary | Supplemental Reporting Detail ‒ Product Line Reporting (Unaudited) In the second quarter of fiscal year 2021, the Company changed its presentation of disaggregated revenue by product line disclosures to reflect internal realignment of the Company’s revenue reporting, specifically as it relates to Recurring fee revenues. Presentation of disaggregated revenue by product line disclosures in prior periods have been changed to conform to the current period presentation. 2020 2021 2022 Q3% Dollars in millions FY Q1 Q2 Q3 Q4 FY Q1 Q2 Q3 Growth Investor Communication Solutions ("ICS") Regulatory $783 $135 $145 $285 $375 $940 $165 $166 $322 13% Data-driven fund solutions 331 79 86 86 93 344 83 89 91 6% Issuer 156 18 21 44 106 189 21 24 46 5% Customer communications 568 138 136 162 134 570 141 148 172 6% Total ICS recurring fee revenues 1,839 369 387 577 709 2,042 410 427 630 9% Equity and other 78 18 21 40 45 123 28 25 25 (37)% Mutual Funds 98 27 24 33 28 112 49 40 34 2% Total Event-driven fee revenues 176 45 45 73 72 235 76 65 59 (20)% Distribution 1,446 331 344 447 427 1,549 367 401 472 6% Total ICS Revenues $3,461 $746 $776 $1,097 $1,208 $3,827 $854 $893 $1,161 6% Global Technology and Operations (“GTO”) Capital Markets $615 $156 $158 $159 $188 $661 $209 $224 $247 56% Wealth and investment management 492 124 127 137 136 525 131 146 134 (2)% Total GTO recurring fee revenues 1,107 280 285 296 324 1,186 341 371 381 29% Foreign Currency Exchange (39) (9) (6) (3) (1) (19) (1) (4) (9) 168% Total Revenues $4,529 $1,017 $1,055 $1,390 $1,532 $4,994 $1,193 $1,260 $1,534 10% Revenues by type Recurring fee revenues $2,946 $650 $673 $873 $1,033 $3,228 $751 $798 $1,012 16% Event-driven fee revenues 176 45 45 73 72 235 76 65 59 (20)% Distribution revenues 1,446 331 344 447 427 1,549 367 401 472 6% Foreign currency exchange (39) (9) (6) (3) (1) (19) (1) (4) (9) 168% Total Revenues $4,529 $1,017 $1,055 $1,390 $1,532 $4,994 $1,193 $1,260 $1,534 10%
19© 2022 | Explanation of Non-GAAP measures and Reconciliation of GAAP to Non-GAAP measures
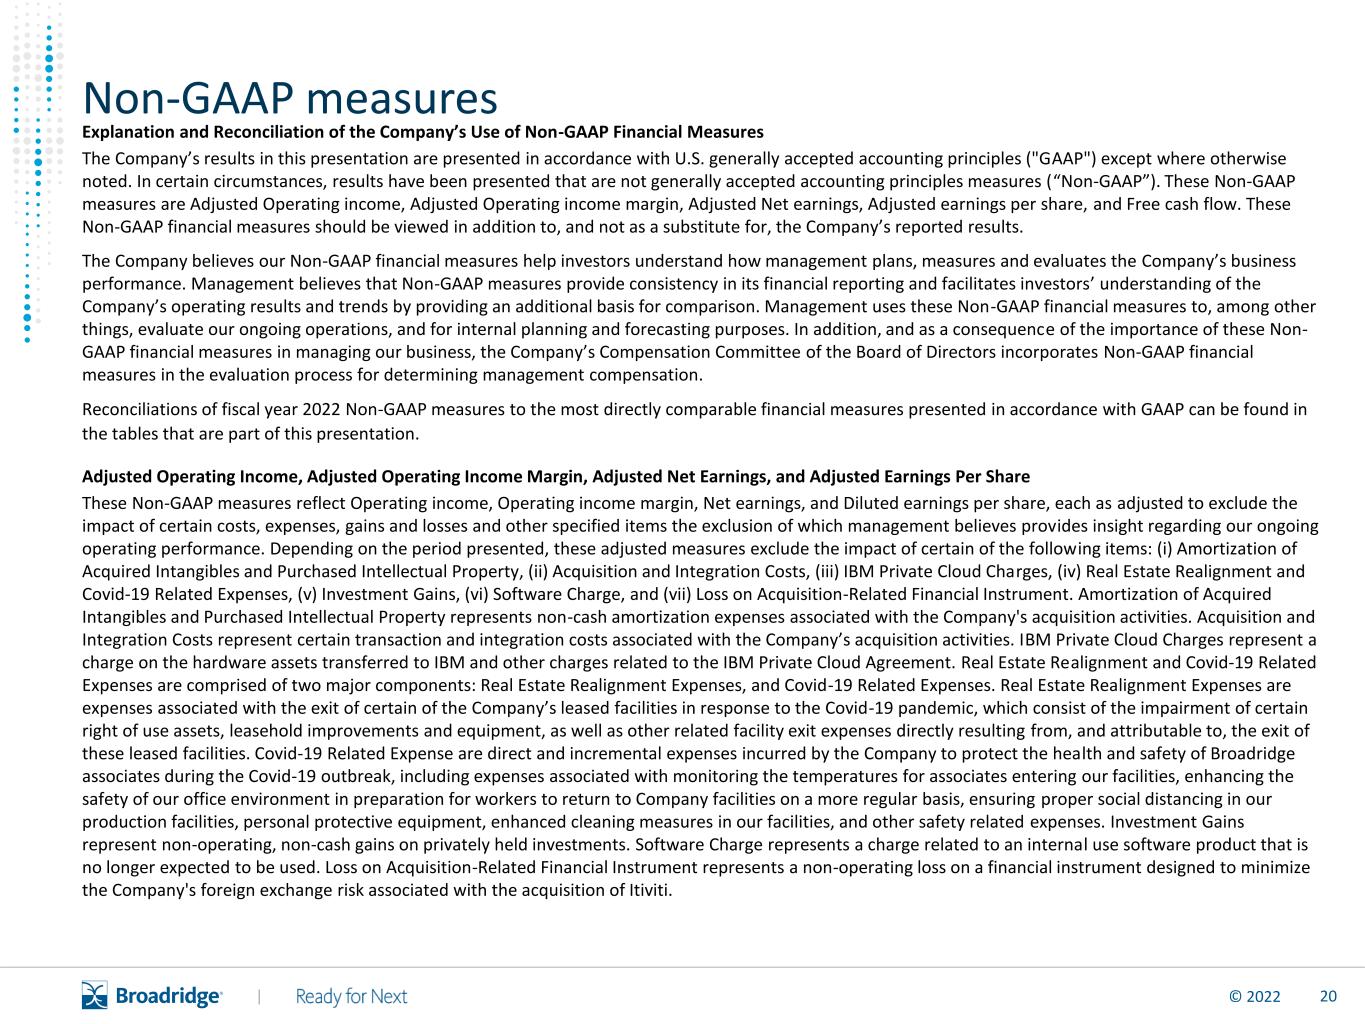
20© 2022 | Non-GAAP measures Explanation and Reconciliation of the Company’s Use of Non-GAAP Financial Measures The Company’s results in this presentation are presented in accordance with U.S. generally accepted accounting principles ("GAAP") except where otherwise noted. In certain circumstances, results have been presented that are not generally accepted accounting principles measures (“Non-GAAP”). These Non-GAAP measures are Adjusted Operating income, Adjusted Operating income margin, Adjusted Net earnings, Adjusted earnings per share, and Free cash flow. These Non-GAAP financial measures should be viewed in addition to, and not as a substitute for, the Company’s reported results. The Company believes our Non-GAAP financial measures help investors understand how management plans, measures and evaluates the Company’s business performance. Management believes that Non-GAAP measures provide consistency in its financial reporting and facilitates investors’ understanding of the Company’s operating results and trends by providing an additional basis for comparison. Management uses these Non-GAAP financial measures to, among other things, evaluate our ongoing operations, and for internal planning and forecasting purposes. In addition, and as a consequence of the importance of these Non- GAAP financial measures in managing our business, the Company’s Compensation Committee of the Board of Directors incorporates Non-GAAP financial measures in the evaluation process for determining management compensation. Reconciliations of fiscal year 2022 Non-GAAP measures to the most directly comparable financial measures presented in accordance with GAAP can be found in the tables that are part of this presentation. Adjusted Operating Income, Adjusted Operating Income Margin, Adjusted Net Earnings, and Adjusted Earnings Per Share These Non-GAAP measures reflect Operating income, Operating income margin, Net earnings, and Diluted earnings per share, each as adjusted to exclude the impact of certain costs, expenses, gains and losses and other specified items the exclusion of which management believes provides insight regarding our ongoing operating performance. Depending on the period presented, these adjusted measures exclude the impact of certain of the following items: (i) Amortization of Acquired Intangibles and Purchased Intellectual Property, (ii) Acquisition and Integration Costs, (iii) IBM Private Cloud Charges, (iv) Real Estate Realignment and Covid-19 Related Expenses, (v) Investment Gains, (vi) Software Charge, and (vii) Loss on Acquisition-Related Financial Instrument. Amortization of Acquired Intangibles and Purchased Intellectual Property represents non-cash amortization expenses associated with the Company's acquisition activities. Acquisition and Integration Costs represent certain transaction and integration costs associated with the Company’s acquisition activities. IBM Private Cloud Charges represent a charge on the hardware assets transferred to IBM and other charges related to the IBM Private Cloud Agreement. Real Estate Realignment and Covid-19 Related Expenses are comprised of two major components: Real Estate Realignment Expenses, and Covid-19 Related Expenses. Real Estate Realignment Expenses are expenses associated with the exit of certain of the Company’s leased facilities in response to the Covid-19 pandemic, which consist of the impairment of certain right of use assets, leasehold improvements and equipment, as well as other related facility exit expenses directly resulting from, and attributable to, the exit of these leased facilities. Covid-19 Related Expense are direct and incremental expenses incurred by the Company to protect the health and safety of Broadridge associates during the Covid-19 outbreak, including expenses associated with monitoring the temperatures for associates entering our facilities, enhancing the safety of our office environment in preparation for workers to return to Company facilities on a more regular basis, ensuring proper social distancing in our production facilities, personal protective equipment, enhanced cleaning measures in our facilities, and other safety related expenses. Investment Gains represent non-operating, non-cash gains on privately held investments. Software Charge represents a charge related to an internal use software product that is no longer expected to be used. Loss on Acquisition-Related Financial Instrument represents a non-operating loss on a financial instrument designed to minimize the Company's foreign exchange risk associated with the acquisition of Itiviti.
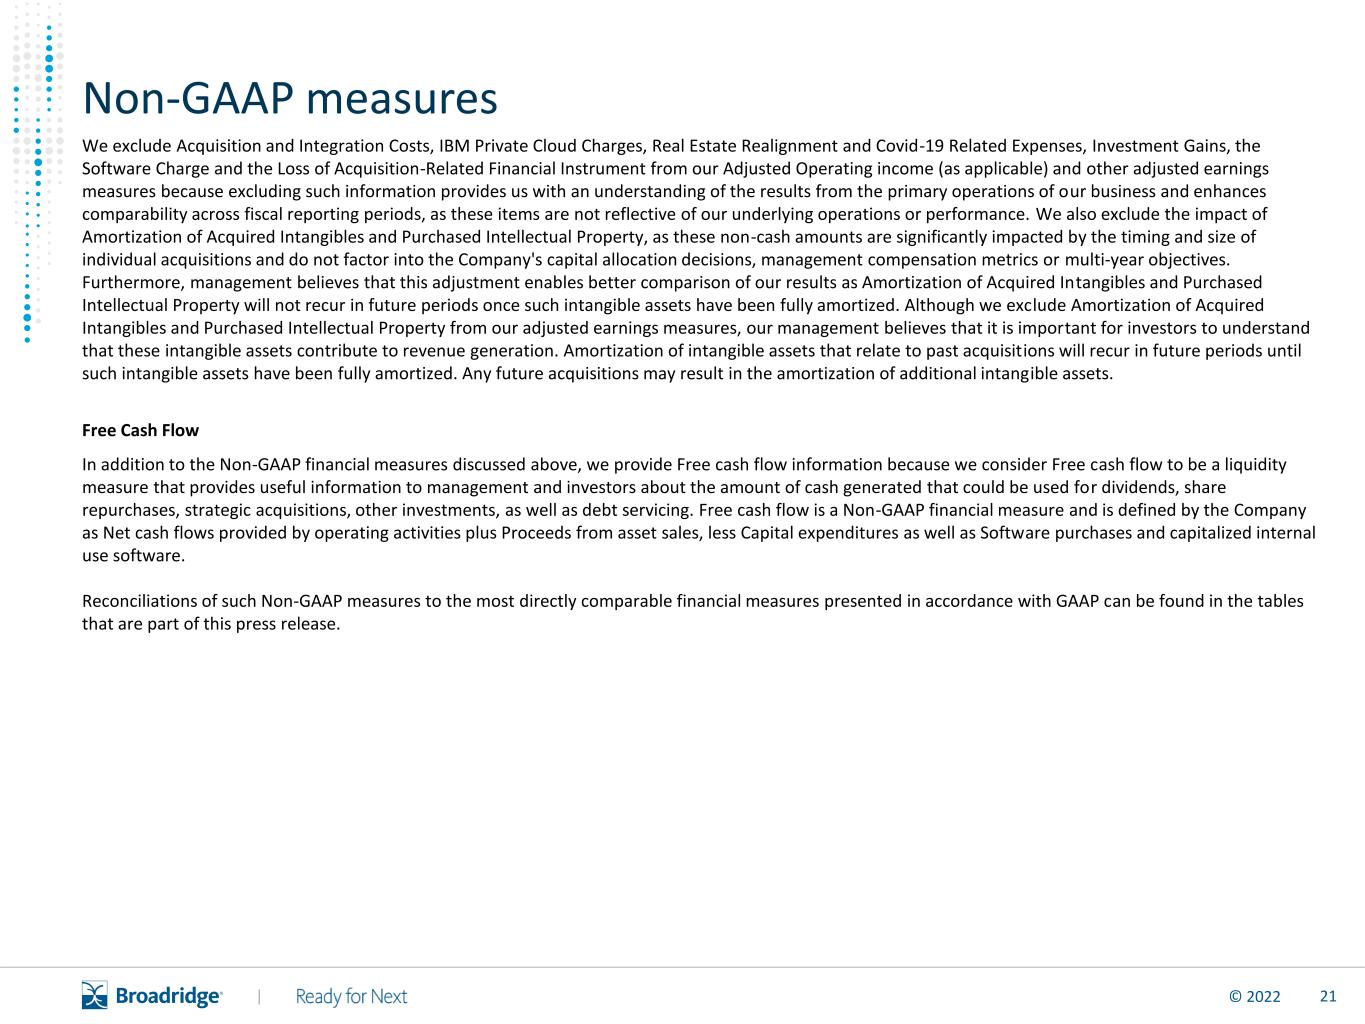
21© 2022 | Non-GAAP measures We exclude Acquisition and Integration Costs, IBM Private Cloud Charges, Real Estate Realignment and Covid-19 Related Expenses, Investment Gains, the Software Charge and the Loss of Acquisition-Related Financial Instrument from our Adjusted Operating income (as applicable) and other adjusted earnings measures because excluding such information provides us with an understanding of the results from the primary operations of our business and enhances comparability across fiscal reporting periods, as these items are not reflective of our underlying operations or performance. We also exclude the impact of Amortization of Acquired Intangibles and Purchased Intellectual Property, as these non-cash amounts are significantly impacted by the timing and size of individual acquisitions and do not factor into the Company's capital allocation decisions, management compensation metrics or multi-year objectives. Furthermore, management believes that this adjustment enables better comparison of our results as Amortization of Acquired Intangibles and Purchased Intellectual Property will not recur in future periods once such intangible assets have been fully amortized. Although we exclude Amortization of Acquired Intangibles and Purchased Intellectual Property from our adjusted earnings measures, our management believes that it is important for investors to understand that these intangible assets contribute to revenue generation. Amortization of intangible assets that relate to past acquisitions will recur in future periods until such intangible assets have been fully amortized. Any future acquisitions may result in the amortization of additional intangible assets. Free Cash Flow In addition to the Non-GAAP financial measures discussed above, we provide Free cash flow information because we consider Free cash flow to be a liquidity measure that provides useful information to management and investors about the amount of cash generated that could be used for dividends, share repurchases, strategic acquisitions, other investments, as well as debt servicing. Free cash flow is a Non-GAAP financial measure and is defined by the Company as Net cash flows provided by operating activities plus Proceeds from asset sales, less Capital expenditures as well as Software purchases and capitalized internal use software. Reconciliations of such Non-GAAP measures to the most directly comparable financial measures presented in accordance with GAAP can be found in the tables that are part of this press release.
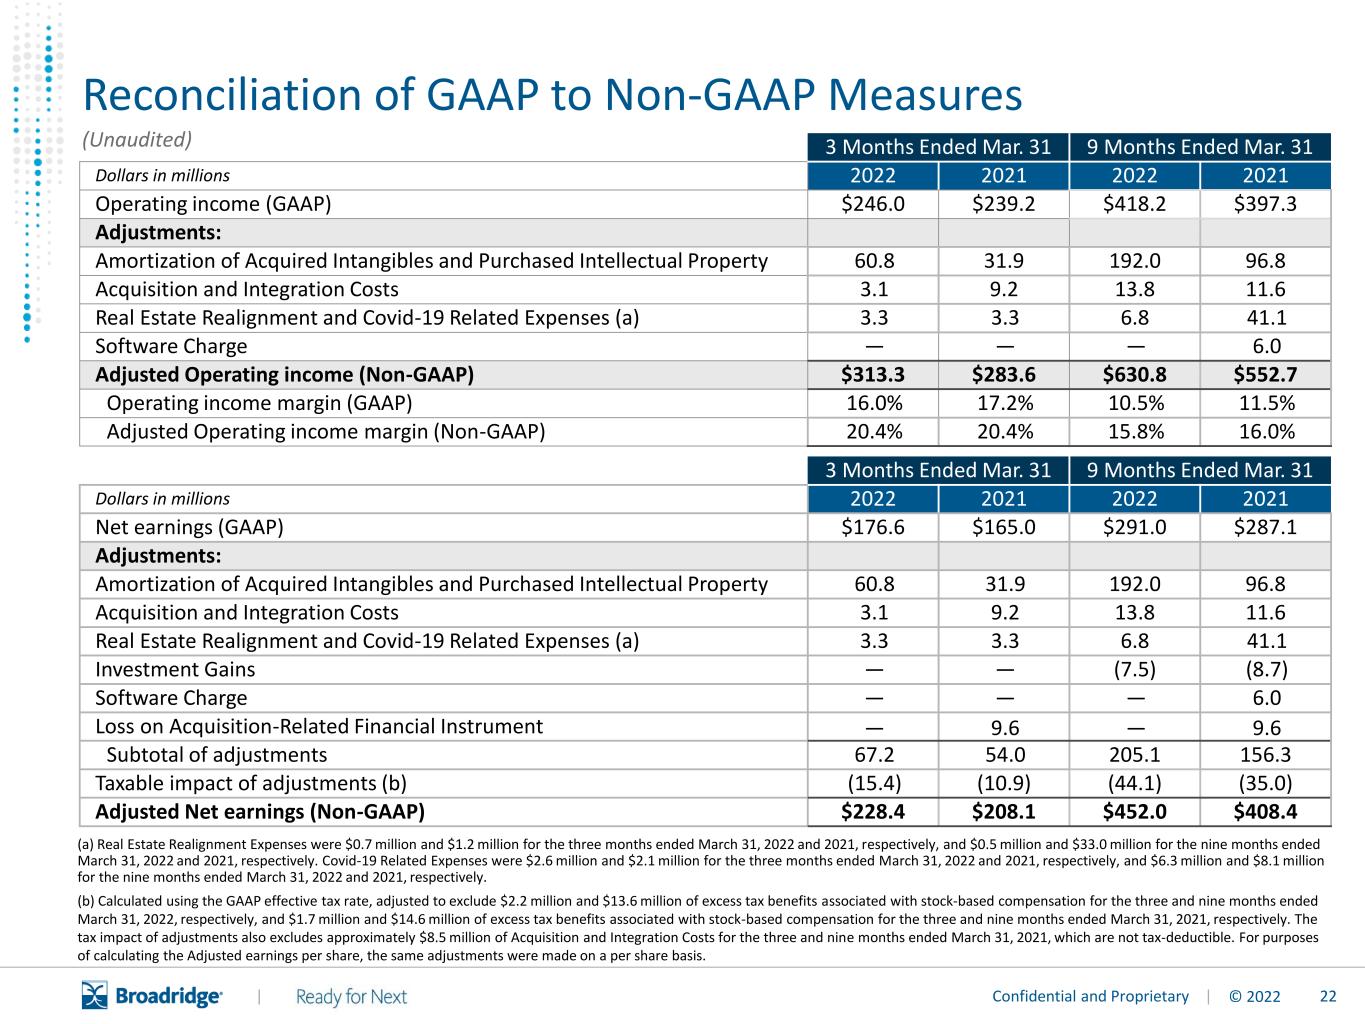
22© 2022 | Confidential and Proprietary | Reconciliation of GAAP to Non-GAAP Measures (Unaudited) 3 Months Ended Mar. 31 9 Months Ended Mar. 31 Dollars in millions 2022 2021 2022 2021 Operating income (GAAP) $246.0 $239.2 $418.2 $397.3 Adjustments: Amortization of Acquired Intangibles and Purchased Intellectual Property 60.8 31.9 192.0 96.8 Acquisition and Integration Costs 3.1 9.2 13.8 11.6 Real Estate Realignment and Covid-19 Related Expenses (a) 3.3 3.3 6.8 41.1 Software Charge — — — 6.0 Adjusted Operating income (Non-GAAP) $313.3 $283.6 $630.8 $552.7 Operating income margin (GAAP) 16.0% 17.2% 10.5% 11.5% Adjusted Operating income margin (Non-GAAP) 20.4% 20.4% 15.8% 16.0% 3 Months Ended Mar. 31 9 Months Ended Mar. 31 Dollars in millions 2022 2021 2022 2021 Net earnings (GAAP) $176.6 $165.0 $291.0 $287.1 Adjustments: Amortization of Acquired Intangibles and Purchased Intellectual Property 60.8 31.9 192.0 96.8 Acquisition and Integration Costs 3.1 9.2 13.8 11.6 Real Estate Realignment and Covid-19 Related Expenses (a) 3.3 3.3 6.8 41.1 Investment Gains — — (7.5) (8.7) Software Charge — — — 6.0 Loss on Acquisition-Related Financial Instrument — 9.6 — 9.6 Subtotal of adjustments 67.2 54.0 205.1 156.3 Taxable impact of adjustments (b) (15.4) (10.9) (44.1) (35.0) Adjusted Net earnings (Non-GAAP) $228.4 $208.1 $452.0 $408.4 (a) Real Estate Realignment Expenses were $0.7 million and $1.2 million for the three months ended March 31, 2022 and 2021, respectively, and $0.5 million and $33.0 million for the nine months ended March 31, 2022 and 2021, respectively. Covid-19 Related Expenses were $2.6 million and $2.1 million for the three months ended March 31, 2022 and 2021, respectively, and $6.3 million and $8.1 million for the nine months ended March 31, 2022 and 2021, respectively. (b) Calculated using the GAAP effective tax rate, adjusted to exclude $2.2 million and $13.6 million of excess tax benefits associated with stock-based compensation for the three and nine months ended March 31, 2022, respectively, and $1.7 million and $14.6 million of excess tax benefits associated with stock-based compensation for the three and nine months ended March 31, 2021, respectively. The tax impact of adjustments also excludes approximately $8.5 million of Acquisition and Integration Costs for the three and nine months ended March 31, 2021, which are not tax-deductible. For purposes of calculating the Adjusted earnings per share, the same adjustments were made on a per share basis.
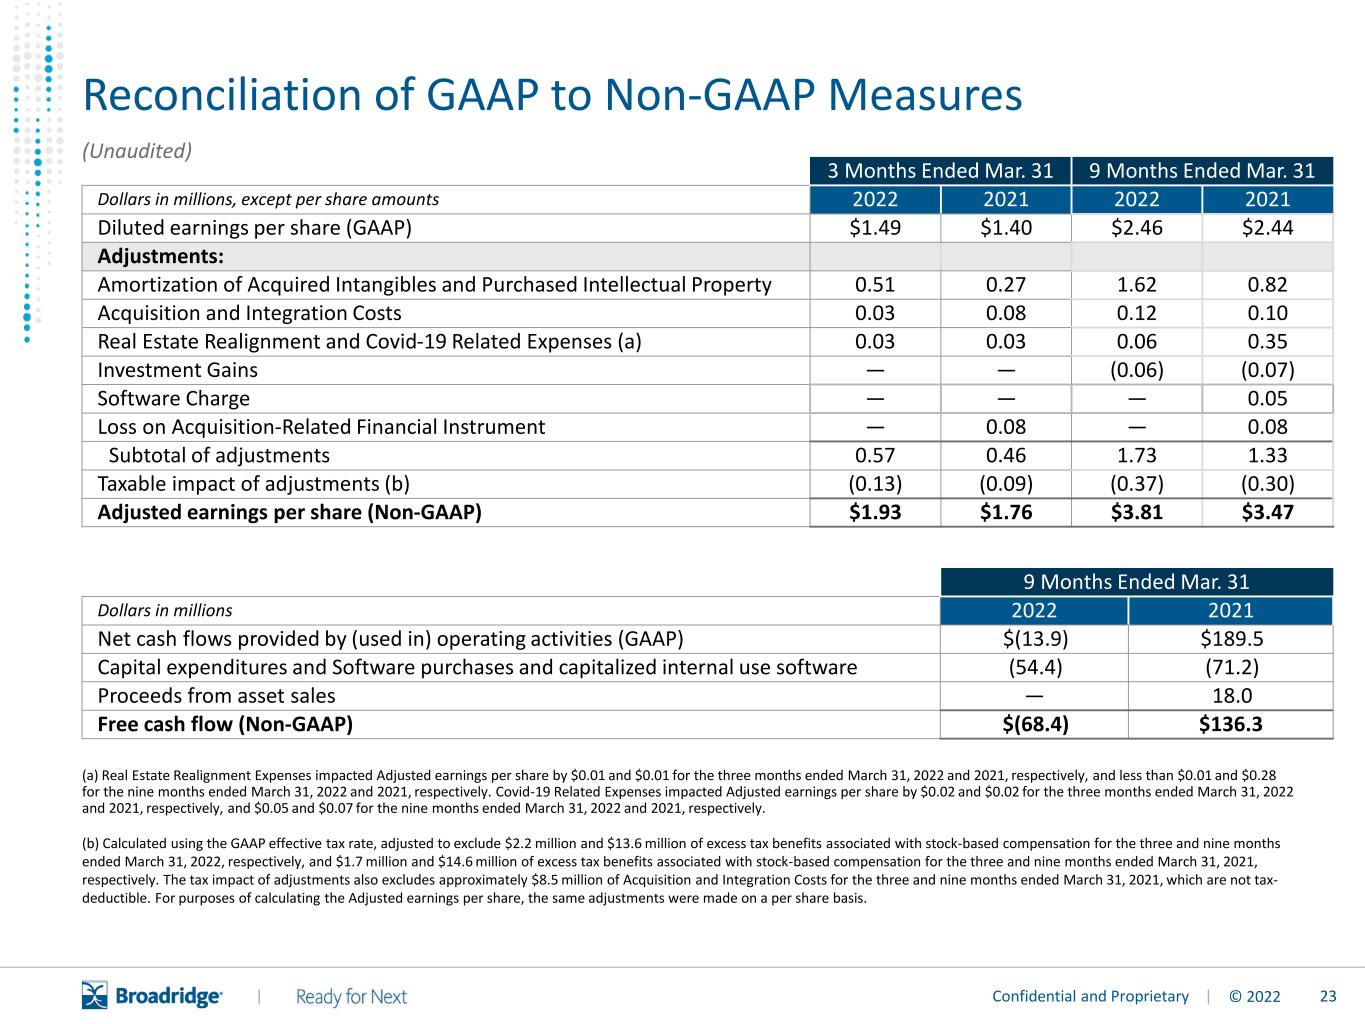
23© 2022 | Confidential and Proprietary | Reconciliation of GAAP to Non-GAAP Measures (Unaudited) (a) Real Estate Realignment Expenses impacted Adjusted earnings per share by $0.01 and $0.01 for the three months ended March 31, 2022 and 2021, respectively, and less than $0.01 and $0.28 for the nine months ended March 31, 2022 and 2021, respectively. Covid-19 Related Expenses impacted Adjusted earnings per share by $0.02 and $0.02 for the three months ended March 31, 2022 and 2021, respectively, and $0.05 and $0.07 for the nine months ended March 31, 2022 and 2021, respectively. (b) Calculated using the GAAP effective tax rate, adjusted to exclude $2.2 million and $13.6 million of excess tax benefits associated with stock-based compensation for the three and nine months ended March 31, 2022, respectively, and $1.7 million and $14.6 million of excess tax benefits associated with stock-based compensation for the three and nine months ended March 31, 2021, respectively. The tax impact of adjustments also excludes approximately $8.5 million of Acquisition and Integration Costs for the three and nine months ended March 31, 2021, which are not tax- deductible. For purposes of calculating the Adjusted earnings per share, the same adjustments were made on a per share basis. 3 Months Ended Mar. 31 9 Months Ended Mar. 31 Dollars in millions, except per share amounts 2022 2021 2022 2021 Diluted earnings per share (GAAP) $1.49 $1.40 $2.46 $2.44 Adjustments: Amortization of Acquired Intangibles and Purchased Intellectual Property 0.51 0.27 1.62 0.82 Acquisition and Integration Costs 0.03 0.08 0.12 0.10 Real Estate Realignment and Covid-19 Related Expenses (a) 0.03 0.03 0.06 0.35 Investment Gains — — (0.06) (0.07) Software Charge — — — 0.05 Loss on Acquisition-Related Financial Instrument — 0.08 — 0.08 Subtotal of adjustments 0.57 0.46 1.73 1.33 Taxable impact of adjustments (b) (0.13) (0.09) (0.37) (0.30) Adjusted earnings per share (Non-GAAP) $1.93 $1.76 $3.81 $3.47 9 Months Ended Mar. 31 Dollars in millions 2022 2021 Net cash flows provided by (used in) operating activities (GAAP) $(13.9) $189.5 Capital expenditures and Software purchases and capitalized internal use software (54.4) (71.2) Proceeds from asset sales — 18.0 Free cash flow (Non-GAAP) $(68.4) $136.3

24© 2022 | Confidential and Proprietary | Reconciliation of GAAP to Non-GAAP Measures (Unaudited) (a) Real Estate Realignment Expenses were $29.6 million for the year ended June 30, 2021. Covid-19 Related Expenses were $15.7 million and $2.4 million for the year ended June 30, 2021 and 2020, respectively. Year ended June 30, Dollars in millions 2021 2020 2019 Operating income (GAAP) $678.7 $624.9 $652.7 Adjustments: Amortization of Acquired Intangibles and Purchased Intellectual Property 153.7 122.9 87.4 Acquisition and Integration Costs 18.1 12.5 6.4 IBM Private Cloud Charges — 32.0 — Real Estate Realignment and Covid-19 Related Expenses (a) 45.3 2.4 — Software Charge 6.0 — — Adjusted operating income (Non-GAAP) $901.8 $794.8 $746.5 Operating income margin (GAAP) 13.6% 13.8% 15.0% Adjusted Operating income margin (Non-GAAP) 18.1% 17.5% 17.1%
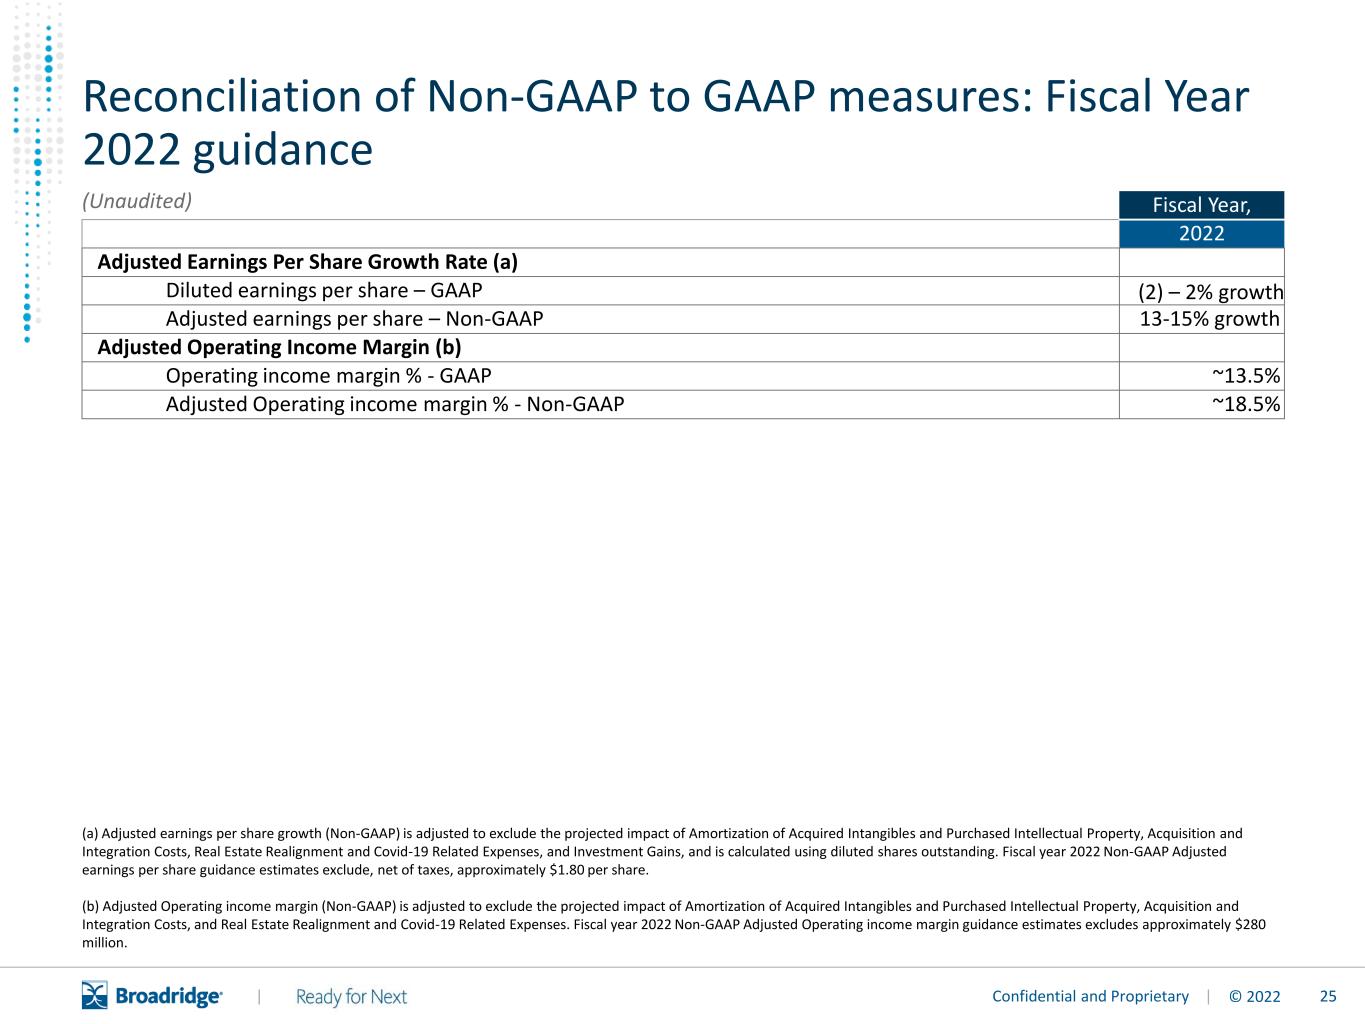
25© 2022 | Confidential and Proprietary | Fiscal Year, 2022 Adjusted Earnings Per Share Growth Rate (a) Diluted earnings per share – GAAP (2) – 2% growth Adjusted earnings per share – Non-GAAP 13-15% growth Adjusted Operating Income Margin (b) Operating income margin % - GAAP ~13.5% Adjusted Operating income margin % - Non-GAAP ~18.5% (Unaudited) (a) Adjusted earnings per share growth (Non-GAAP) is adjusted to exclude the projected impact of Amortization of Acquired Intangibles and Purchased Intellectual Property, Acquisition and Integration Costs, Real Estate Realignment and Covid-19 Related Expenses, and Investment Gains, and is calculated using diluted shares outstanding. Fiscal year 2022 Non-GAAP Adjusted earnings per share guidance estimates exclude, net of taxes, approximately $1.80 per share. (b) Adjusted Operating income margin (Non-GAAP) is adjusted to exclude the projected impact of Amortization of Acquired Intangibles and Purchased Intellectual Property, Acquisition and Integration Costs, and Real Estate Realignment and Covid-19 Related Expenses. Fiscal year 2022 Non-GAAP Adjusted Operating income margin guidance estimates excludes approximately $280 million. Reconciliation of Non-GAAP to GAAP measures: Fiscal Year 2022 guidance
26© 2022 | Contacts W. Edings Thibault Edings.Thibault@Broadridge.com Sean Silva Sean.Silva@Broadridge.com Replay Options Online replay available at broadridge-ir.com Telephone replay available through May 10, 2022 Domestic Dial-In: 1-877-344-7529 Access Code: 3051064 International Toll Dial-In: 1-412-317-0088 Passcode: 3051064 Click here for dial-ins by country Broadridge Fiscal Third Quarter 2022 Earnings Conference Call Live Call Information Date: May 3, 2022 Start Time: 8:30 A.M. ET Toll-Free: 1-877-328-2502 International: 1-412-317-5419 Webcast: broadridge-ir.com


