Table of Contents
UNITED STATES
SECURITIES AND EXCHANGE COMMISSION
Washington, D.C. 20549
FORM10-K
(Mark One)
| x | ANNUAL REPORT PURSUANT TO SECTION 13 OR 15(d) OF THE SECURITIES EXCHANGE ACT OF 1934 |
For the fiscal year ended June 30, 2013
Or
| ¨ | TRANSITION REPORT PURSUANT TO SECTION 13 OR 15(d) OF THE SECURITIES EXCHANGE ACT OF 1934 |
For the transition period from to
Commission file number:001-35188
FUSION-IO, INC.
(Exact name of registrant as specified in its charter)
| Delaware | 20-4232255 | |
(State or other jurisdiction of incorporation or organization) | (I.R.S. Employer Identification Number) | |
2855 E. Cottonwood Parkway, Suite 100 Salt Lake City, Utah | 84121 | |
| (Address of principal executive offices) | (Zip Code) | |
Registrant’s telephone number, including area code:(801) 424-5500
Securities registered pursuant to Section 12(b) of the Act:
Title of each class: | Name of each exchange on which registered: | |
| Common stock, $0.0002 par value | The New York Stock Exchange |
Securities registered pursuant to Section 12(g) of the Act:
Indicate by check mark if the registrant is awell-known seasoned issuer, as defined in Rule 405 of the Securities Act. Yes x No ¨
Indicate by check mark if the registrant is not required to file reports pursuant to Section 13 or Section 15(d) of the Act. Yes ¨ No x
Indicate by check mark whether the registrant (1) has filed all reports required to be filed by Section 13 or 15(d) of the Securities Exchange Act of 1934 during the preceding 12 months (or for such shorter period that the registrant was required to file such reports), and (2) has been subject to such filing requirements for the past 90 days. Yes x No ¨
Indicate by check mark whether the registrant has submitted electronically and posted on its corporate Web site, if any, every Interactive Data File required to be submitted and posted pursuant to Rule 405 ofRegulation S-T (§ 232.405 of this chapter) during the preceding 12 months (or for such shorter period that the registrant was required to submit and post such files). Yes x No ¨
Indicate by check mark if disclosure of delinquent filers pursuant to Item 405 ofRegulation S-K is not contained herein, and will not be contained, to the best of registrant’s knowledge, in definitive proxy or information statements incorporated by reference in Part III of this Form10-K or any amendment to this Form10-K. ¨
Indicate by check mark whether the registrant is a large accelerated filer, an accelerated filer, anon-accelerated filer, or a smaller reporting company. See the definitions of “large accelerated filer,” “accelerated filer” and “smaller reporting company” inRule 12b-2 of the Exchange Act. (Check one):
| Large accelerated filer | x | Accelerated filer | ¨ | |||
| Non-accelerated filer | ¨ (Do not check if a smaller reporting company) | Smaller reporting company | ¨ | |||
Indicate by check mark whether the registrant is a shell company (as defined inRule 12b-2 of the Exchange Act). Yes ¨ No x
The aggregate market value of voting andnon-voting common equity held bynon-affiliates of the registrant was approximately $1,327,734,157 based on a closing sale price of $22.93 per share as reported for the New York Stock Exchange on December 31, 2012, which is the last business day of the registrant’s most recently completed second fiscal quarter. For the purpose of this calculation, shares of common stock held by the registrant’s current officers and directors and shares of common stock held by persons who hold more than 10% of the outstanding common stock of the registrant have been excluded from this calculation because such persons may be deemed affiliates. This determination of executive officer or affiliate status is not necessarily a conclusive determination for other purposes.
The number of shares of the registrant’s common stock, $0.0002 par value per share, outstanding as of August 15, 2013 was 100,155,006.
DOCUMENTS INCORPORATED BY REFERENCE
Part III of this annual report on Form10-K incorporates by reference portions of the registrant’s Proxy Statement for its 2013 Annual Meeting of Stockholders to be held on November 21, 2013.
Table of Contents
Fusion-io, Inc.
Form10-K
For the Fiscal Year Ended June 30, 2013
| 2 | ||||||||
| Item 1. | 2 | |||||||
| Item 1A. | 12 | |||||||
| Item 1B. | 33 | |||||||
| Item 2. | 33 | |||||||
| Item 3. | 34 | |||||||
| Item 4. | 34 | |||||||
| 35 | ||||||||
Item 5. | 35 | |||||||
Item 6. | 38 | |||||||
Item 7. | Management’s Discussion and Analysis of Financial Condition and Results of Operations | 39 | ||||||
Item 7A. | 57 | |||||||
Item 8. | 57 | |||||||
Item 9. | Changes in and Disagreements with Accountants on Accounting and Financial Disclosure | 57 | ||||||
Item 9A. | 58 | |||||||
Item 9B. | 59 | |||||||
| 59 | ||||||||
Item 10. | 59 | |||||||
Item 11. | 59 | |||||||
Item 12. | Security Ownership of Certain Beneficial Owners and Management and Related Stockholder Matters | 59 | ||||||
Item 13. | Certain Relationships and Related Transactions, and Director Independence | 59 | ||||||
Item 14. | 59 | |||||||
| 59 | ||||||||
Item 15. | Exhibits, Consolidated Financial Statements and Financial Statement Schedules | 59 | ||||||
-i-
Table of Contents
Fusion-io, Inc.
Form 10-K
For the Fiscal Year Ended June 30, 2013
Special Note RegardingForward-Looking Statements
In addition to historical information, this Annual Report onForm 10-K contains“forward-looking statements” within the meaning of the Private Securities Litigation Reform Act of 1995. These forward-looking statements reflect the views of our management regarding current expectations and projections about future events and are based on currently available information. These forward-looking statements include, but are not limited to, statements concerning our possible or assumed future results of operations, business strategies, financing plans, technological leadership, market opportunity, expectations regarding product acceptance, ability to innovate new products and bring them to market in a timely manner, ability to successfully increase sales of our software offerings as part of our overall sales strategy, expectations concerning our technologies, products and solutions, including our current and new ioMemory platforms, our ION Data Accelerator software, our virtualization acceleration software, our existing ioDrive and ioScale product lines and the ioControl hybrid storage system, competitive position and the effects of competition, industry environment, potential growth opportunities, ability to expand internationally, ability to expand in adjacent markets, the impact of quarterly fluctuations of revenue and operating results, changes to and expectations concerning gross margin, expectations concerning relationships with third parties, including channel partners, key customers and original equipment manufacturers, or OEMs, expectations regarding future revenues from our customers, levels of capital expenditures, future capital requirements and availability to fund operations and growth, the adequacy of facilities, impact and expectations concerning our acquisitions of the ID7 Ltd. and SCST Limited, or ID7 Entities, and NexGen Storage, Inc., or NexGen, the adequacy of our intellectual property rights, expectations concerning pending legal proceedings and related costs, the sufficiency of our issued patents and patent applications to protect our intellectual property rights, the effects of a natural disaster on us or our suppliers, our ability to resell inventory that we cannot use in our products due to obsolescence, our ability to maintain or grow our sales through OEMs and other channel partners and to maintain our relationships with those channel partners, including the timely qualification of our products for promotion and sale through those channels, particularly OEMs, OEMs continuing to design our products into their products, the importance of software innovation, and volatility regarding our provision for income taxes. Forward-looking statements include statements that are not historical facts and can be identified by terms such as “anticipates,” “believes,” “could,” “seeks,” “estimates,” “expects,” “intends,” “may,” “plans,” “potential,” “predicts, “projects,” “should,” “will,” “would,” or similar expressions and the negatives of those terms.
These forward-looking statements are inherently subject to uncertainties, risks, and changes in circumstances that are difficult to predict. Actual results could differ materially from those contained in these forward-looking statements for a variety of reasons, including, but not limited to, those discussed in the section entitled “Risk Factors” in Part II, Item 1A and elsewhere in this report. Other unknown or unpredictable factors also could have a material adverse effect on our business, financial condition, and results of operations. Accordingly, readers should not place undue reliance on these forward-looking statements. Also,forward-looking statements represent our management’s beliefs and assumptions only as of the date of thisForm 10-K.
We are not under any obligation to, and do not intend to, publicly update or review any of these forward-looking statements, whether as a result of new information, future events, or otherwise, even if experience or future events make it clear that any expected results expressed or implied by those forward-looking statements will not be realized, except to the extent required by applicable securities laws. Please carefully review and consider the various disclosures made in this report and in our other reports filed with the Securities and Exchange Commission, or SEC, that attempt to advise interested parties of the risks and factors that may affect our business, prospects, and results of operations.
-1-
Table of Contents
Corporate Information
TheFusion-io, NexGen, ioControl, and Atomic design logos and the marks “Adaptive Flashback”, “ACM”, “Auto Commit Memory”, “directCache”, “Flashback”, “FlashScale”, “Fusion-io”, “Fusion Monitoring Service”, “Fusion Powered”, “Fusion Powered-IO”, “Fusion SureErase”, “Fusion Storage Target Software”, “ioCache”, “ioControl”, “ioControl Hybrid Storage”, “ioControl Operating Environment”, “ioDirector”, “ioDrive”, “ioDrive Duo”, “ioDrive2 Duo”, “ioDrive Octal”, “ioExpress”, “ioFX”, “ioMemory”, “ION Data Accelerator”, “ioSan”, “ioSphere”, “ioScale”, “ioTDX”, “ioTurbine”, “ioTurbine Desktop Scaler”, “ioVDI”, “ioXtreme”, “NexGen”, “NexGen Storage”, “OpenNVM”, “Powering Innovation”, “SureConnect”, “Transparent File Sharing”,“VSL”, “Virtual Storage Layer”, and “Write Vectoring” are our trademarks. This annual report onForm 10-K contains additional trade names, trademarks, and service marks of other companies. We do not intend our use or display of other companies’ trade names, trademarks, or service marks to imply a relationship with, or endorsement or sponsorship of us by these other companies.
Overview
We provide solutions for enterprises, hyperscale datacenters, and small to medium enterprises, or SMEs, that accelerate databases, virtualization, mission-critical applications, cloud computing, big data, and information systems. These solutions help drive business from small enterprises to Fortune Global 500 companies and the world’s hyperscale leaders. Our integrated hardware and software platforms and solutions enable the acceleration of data and applications in legacy, open, and proprietary architectures. Our core technology leverages flash memory to significantly increase datacenter and computer-based information system efficiency, with enterprise grade performance, reliability, availability, and manageability. We sell our solutions through a global direct sales force, original equipment manufacturers, or OEMs, including Cisco, Dell, HP, and IBM, and other channel partners.
We were incorporated in December 2005 as Canvas Technologies, Inc., a Nevada corporation. In June 2006, we changed our name to Fusion Multisystems, Inc. In June 2010, we changed our name toFusion-io, Inc. and reincorporated as a Delaware corporation. Our principal executive offices are located at 2855 E. Cottonwood Parkway, Suite 100, Salt Lake City, Utah 84121, and our telephone number is 801.424.5500. We also have significant operations in San Jose, California.
As of June 30, 2013, we had 938 employees globally. In fiscal 2013, we had three customers account for 10% or greater of our revenue, including our direct customer Facebook, Apple, through a reseller, and one of our OEMs, HP. We have experienced substantial growth over the past three years; our revenue was $197.2 million, $359.3 million, and $432.4 million in fiscal 2011, 2012, and 2013, respectively.
Our fiscal year end is June 30 and our fiscal quarters end on September 30, December 31, March 31, and June 30. Our fiscal years ended June 30, 2011, 2012, and 2013 are referred to herein as fiscal 2011, 2012, and 2013, respectively.
Recent Developments
In April 2013, we acquired 100% of the stock of NexGen Storage, Inc., or NexGen, a developer of hybrid storage systems based in Louisville, Colorado. The acquisition of NexGen adds to our storage solution portfolio and expands our reach into small to medium enterprise markets. The consideration transferred was $110.7 million, consisting of (i) $109.0 million in cash, (ii) $1.4 million in assumed stock options, and (iii) $0.3 million related to the elimination of intercompany balances. In addition, we
-2-
Table of Contents
agreed to pay $5.0 million in cash to one of the selling stockholders in 12 equal quarterly installments and 339,627 in shares of our common stock to another selling stockholder, which is subject to a repurchase right that lapses in 12 equal quarterly installments. The quarterly installments for both the cash and restricted stock amounts are subject to ongoing employment requirements. We also assumed NexGen’s options and restricted stock units that were unvested at the time of the merger that were converted into unvested options to purchase 822,927 shares of our common stock and 84,808 of our restricted stock units. Subsequent to the acquisition, we will recognize over the underlying future service period up to approximately $23.7 million of compensation expense related to the fair value of the cash, restricted stock, and the assumed stock-based awards. The assets, liabilities and operating results of NexGen are reflected in our consolidated financial statements following the date of acquisition.
In March 2013, we acquired 100% of the stock of ID7 Ltd. and SCST Limited, or the ID7 Entities, for total cash consideration of approximately $5.9 million. The ID7 Entities, located in England and Wales, are the primary developers of the SCST storage subsystem enabling enhanced shared storage software functionality for any Linux server or appliance. In connection with the acquisition, we issued 135,131 shares of our common stock to the former shareholders of the ID7 Entities, which is subject to a repurchase right, that lapse 25% after one year and the remaining 75% in 12 equal quarterly installments thereafter. Subsequent to the acquisition, we will recognize over the underlying future service period up to approximately $2.4 million of stock-based compensation expense related to the fair value of the restricted stock awards. The assets, liabilities and operating results of the ID7 Entities are reflected in our consolidated financial statements following the date of acquisition.
Industry Background
The profitability andlong-term competitiveness of businesses increasingly depends on their ability to rapidly extract value from their information or data assets while addressing the following key challenges:
| • | Growth in Quantity of Data — The amount of data that consumers and businesses are generating continues to grow at exponential rates. |
| • | Growth in Frequency of Access to Data — The number of users accessing information systems and the frequency of their access are also growing substantially. More devices, applications, and services are being used more frequently. |
| • | Growing Demand for Faster, More Relevant Responses — Businesses and consumers expect information systems to bereal-time,on-demand,always-on, mobile, and highly responsive with pertinent information. |
The traditional data processing and data management infrastructure many companies use today is unable to scale to meet these challenges and are subject to many of the following constraints:
| • | Limited Financial Resources — All businesses must prioritize their finite financial resources to invest in their datacenter infrastructure and operations. |
| • | Limited Resources for Datacenters — Datacenters are highly specialized, require substantial energy, cooling, and space and impose long lead times to build. Therefore, businesses ultimately face limitations on their ability to expand, modify existing datacenters, or build new ones to meet the rapidly growing data processing demands. |
| • | Pressure to be Energy Efficient — Building new datacenters or expanding existing datacenters causes substantial increases in energy consumption and its carbon footprint impact on the environment forcing enterprises to better leverage their resources. |
-3-
Table of Contents
To address this increased growth in quantity of data, frequency of data access, and performance demands, enterprises are seeking alternatives to deploying costly and inefficient datacenter architectures and wasteful infrastructures. Similarly, small to medium enterprises are driven to optimize capital and operating expenses by leveraging technology to not only meet their information technology, or IT, requirements but also to add new levels of business opportunities and product offerings.
Technology
Our approach significantly improves datacenter efficiency, scalability, and application performance or data processing. This is accomplished through advanced hardware and software architectures that improve performance, density, reliability, form factor, and management of NAND flash memory in mission-critical data intensive, storage or memory latency-sensitive applications.
ioMemory Architecture
Fusion-io’s ioMemory architecture is asub-system that aggregates, protects, and manages a large array ofindustry-standard NAND flash chips through our proprietarydata-path hardware controller and our virtual storage layer, or VSL, software. The ioMemory architecture creates a reliable tier of high-capacity low-latency memory that natively attaches to a server’sPCI-Express peripheral bus, or PCIe, with the following enterprise characteristics:
| • | Speed — Our architecture leverages flash memory media, which has up to 200,000 times the input output, or I/O, performance of an equivalent capacity mechanical spinning disk drive. Faster I/O results in low latency response times and high bandwidth processing that are critical to achieving better application and system-level performance. This I/O improvement is accomplished with our proprietary data-path hardware controller that combines the parallel performance from many NAND flash memory chips supported by our VSL software that avoids the bottlenecks of networks, storage protocols and buses, embedded central processing units, or CPUs, and offload controllers. |
| • | Density — Our architecture leverages flash memory media, which has up to 100 times the capacity density of dynamic random access memory, or DRAM, but with the persistence of traditional storage. Our data-path controller aggregates large quantities of flash memory chips while our VSL software allows us to manage the sub-system at both a chip and sub-chip, or die level, in a single design. |
| • | Reliability — We protect the data managed by our ioMemory architecture against corruption and loss due to inherent flash memory defects, operating system or application software failures, and sub-system power interruptions. Our Adaptive Flashback Protection, an advancedself-healing technology, is capable of recognizing, correcting, and resurrecting lost data in theflash-based storagesub-system. This is accomplished by using advanced bit error correction, proactive data integrity monitoring of stored data, and dedicated memory chips to automate the repair of failed NAND blocks inreal-time. Our PowerCut technology protects in-process data in the event of a power loss. |
| • | Form Factor — By utilizing theindustry-standard PCIe specification, our products operate at the highest performance levels, conform to electrical and mechanical standards, and can be installed into a server’s PCIe expansion slots, allowing customers to use our products either in new or existing server datacenter equipment. |
| • | Manageability — Our ioSphere Platform Management Software is a suite of management softwarepurpose-built for our storage memory infrastructure and designed around our ioMemory acceleration platform. ioSphere software is accessible through a graphical user interface that enables datacenter administrators to centrally configure, monitor, manage, and tune all distributed ioMemory devices throughout the datacenter. In addition, this software offersreal-time, predictive, and historical reporting of ioMemory’s performance and wear. |
-4-
Table of Contents
Virtual Storage Layer Software
Our VSL software enables ioMemory to exist as a new data storage memory tier within the enterprise server and operate with more efficiency and capability than traditional storage systems using embedded controllers. VSL software integrates with the server’s operating system and provides native access to data stored on ioMemory, bypassing legacy storage input/output interfaces. In doing so, VSL software allows:
| • | Symmetrical Performance — Servers can achieve significantly increased application and data processing performance due to ioMemory’s low latency access and high bandwidth throughput.Non-volatile memory, including NAND Flash memory, is inherently asymmetrical in that read, program, and erase times are different, resulting in divergent read and write access performance. VSL software allows applications to read and write with nearly equivalent times by means of alog-structured data store that completes data transactions in microseconds as opposed to alternative high performance filing systems that complete data transactions in milliseconds, which implies an approximately 1,000 times improvement in storage performance. |
| • | Extensibility — Because VSL software is field upgradeable and architecturally extensible, we are able to add new features includingdata-tiering, caching software and quality of service for single host, virtual server, and shared storage environments. |
| • | Interoperability — VSL software runs on a variety of open and commercially available operating systems, including Windows, Linux, VMware ESX/ESXi, Solaris, and Mac OS X. |
Products
Our portfolio of storage memory products packages ioMemory hardware combined with our VSL software into a family of products suitable for direct, shared, and cached acceleration environments. Each product family leverages the cost economics and management simplicity of industry-standard servers combined with ioMemory, VSL, and additional software as necessary.
Direct Acceleration
Direct acceleration is provided by our ioDrive, ioScale, and ioFX enterprise grade PCIe-products that leverage flash and are placed in x86 servers or workstations to directly accelerate locally hosted applications. By locating process-critical, or “active,” data close to the host’s CPU, direct acceleration provides extremely high performance for local applications.
| • | ioDrive — Our ioDrive products are optimized for the stringent reliability, performance and extended life-cycle needs of enterprise customers. |
| • | ioScale — Our ioScale products are optimized for the low cost demands and high capacity requirements of hyperscale datacenters cost sensitive applications. |
| • | ioFX — Our ioFX products are designed for theprice-sensitive professional workstation market and offer enhanced heat dissipation features given restricted ventilation common in workstation chassis designs. |
We classify our ioDrive, ioScale, and ioFX products based on capacity, latency, bandwidth, and input/output operations per second, or IOPS.
Shared Acceleration
Shared acceleration is provided by our specialized ION Data Accelerator or ioControl software combined with ioMemory, VSL, and industry-standard servers. Our shared acceleration products allow
-5-
Table of Contents
flash memory acceleration to be deployed centrally and accessed by many servers connected to a storage area network.
| • | ION Data Accelerator — Our ION Data Accelerator software transforms industry-standard servers with our ioDrive and ioScale products into all flash shared storage appliances. ION Data Accelerator appliances offer the highest shared storage performance and enable the reliability, and management benefits of ioMemory and VSL to be shared across many servers connected over industry-standard storage area networks including Fibre Channel, Infiniband and Ethernet. Available as a fully integrated appliance or asstand-alone software, our ION Data Accelerator enables OEMs and value-added resellers, or VARs, to create a customized appliance for shared storage application acceleration. ION Data Accelerator offers a number of sophisticated storage features, including the creation of redundant array of independent disks, or RAID, sets, management of logical unit numbers, or LUNs, and monitoring through support of the simple network management protocol, or SNMP. |
| • | ioControl — Our ioControl software transforms industry-standard servers with our ioDrive and ioScale products into hybrid, or flash and disk, shared storage appliances. ioControl appliances combine ioMemory performance with cost-effective high-capacity spinning disks in an integrated solution that can be shared across many application servers but with the ability to provision, prioritize, and control shared storage performance. Available as a fully integrated appliance, our ioControl appliances enable VARs to introduce flash acceleration to cost-sensitive customers. ioControl offers a number of sophisticated storage features, including data-tiering between flash and disk, Ethernet or internet small computer system interface, or iSCSI, connectivity, quality of service to manage performance across applications, and snapshot services to meet recovery point and time objectives. |
Virtualization Acceleration
Our virtualization acceleration software is specialized to transparently leverage flash resident in direct or shared environments by accelerating the storage demands of commercially available and open source applications software. Our software virtualizes available flash to intelligently apply acceleration for active data while directing persistent data to existing shared storage infrastructure. This capability allows enterprises to realize the benefits of our technology without replacing or modifying their existing datacenter infrastructure. Our ioTurbine software is compatible with our ioDrive, ioScale, ION Data Accelerator, and ioControl products and is sometimes supported with other vendor flash memory.
| • | ioTurbine — Our ioTurbine software supports intelligent flash acceleration in VMware, Windows, and Linux environments. The ioTurbine software intelligently accelerates active data while directing persistent data to shared storage from us or other vendors. For VMware environments, the ioTurbine software fully and dynamically supports VMware features, such as vMotion, that require shared storage for persistent data. |
| • | ioCache — Our ioCache product bundles ioTurbine software with our ioMemory products for simple deployment as an integrated offering. |
| • | ioVDI — Our ioVDI software is a new technology that is specifically designed to accelerate virtual desktops hosted on flash accelerated servers. The ioVDI software intelligently directs non-essential desktop data to local flash with our Write Vectoring feature and takes advantage of common desktop files using our Transparent File Sharing feature to deliver desktop performance that compares to physical desktops even during peak load periods. |
-6-
Table of Contents
OEM Products
Our OEMs, including Cisco, Dell, HP, and IBM, sell branded storage memory solutions based on our standard products as well as customform-factor versions to fit specific applications. For example, HP offers a tailored version of our technology in aform-factor specific to itsC-class blade servers, which it markets as “HP StorageWorks IO Accelerator”. Similarly, IBM incorporates a tailored version of our ioDrive product into its “InfoSphere Smart Analytics System 5600” and “WebSphere XC10 Middleware” appliances. Cisco offers Fusion-io ioMemory based products developed specifically for its unified computing system, or UCS, blade servers.
Sales and Marketing
We sell our products through our global direct sales force, OEMs, and other channel partners. Our direct sales teams are comprised of a combination of a field sales representative, systems engineers, and a sales development representative. Each sales team is responsible for either a geographical territory, market vertical, or has responsibility for a number of named major accounts. The sales cycle from the time of initial prospect qualification to completion of an initial sale may take a few days to several months or more for larger accounts. After initial deployment, our sales teams focus on ongoing account management and the development offollow-on sales. A majority of the sales opportunities are directly fulfilled via our OEMs and other channel partners.
We also haveOEM-focused sales teams. These sales teams are dedicated to working exclusively with each of our OEM partners to maximize the global market penetration of our technology. Current OEMs include Cisco, Dell, HP, IBM, and others. Our OEMs sell and support our products through their respective sales channels, their direct distribution, their value added resellers, and their systems integrators. Our OEMs may integrate our platform into their own proprietary product offerings or sell a customized or branded version of our standard products.
We also work closely with a variety of other OEM and channel partners to promote and sell our products. These companies include appliance builders, systems integrators, value added resellers, and various private label system manufacturers. We offer a technology alliance partnership program and software development kits to jointly create and develop hardware and software solutions with a number of independent software and appliance vendors. We believe these types of partner efforts will facilitate broader and faster adoption of our products and technology.
We focus our marketing efforts on increasing brand awareness, communicating product advantages, and generating qualified leads for our sales force, OEMs, and other channel partners. We rely on a variety of marketing vehicles, including trade shows, micro events, social media, advertising, public relations, industry research, our website, and strategic collaborative relationships with technology leaders including our OEM channel partners.
Solutions
Our products are used to accelerate performance-sensitive applications that impact the revenue, cost, and quality of services delivered by our customers. Our customers’ critical applications are relational databases, server virtualization, virtual desktop infrastructure, or VDI, and big data. We selectively work with application developers to ensure compatibility, optimize performance, and provide best practices on deployment.
| • | Relational Databases — Relational databases common to business and mission critical data center environments are especially sensitive to I/O performance available from servers and storage systems. Our direct, caching and shared acceleration products are used to accelerate many relational databases including Microsoft SQL Server, Oracle and Oracle RAC, MySQL, Percona, SkySQL, and MariaDB. |
-7-
Table of Contents
| • | Server Virtualization — Server virtualization consolidates server infrastructure, load-balances applications across server hardware, and increases application reliability through virtual machine migration, high availability, and replication features that place heavy I/O loads on datacenter server and storage resources. Our shared acceleration products are used to accelerate VMware ESXi, Microsoft Hyper-V, and RedHat KVM environments while our caching acceleration products are used to accelerate VMware virtual server environments. |
| • | Virtual Desktops — Virtual desktops are desktop images hosted on centralized server and storage infrastructure for security or simplified desktop management. Hosted desktop performance is directly tied to available I/O, particularly during common boot times known as boot or login storms. Our direct, caching, and shared acceleration products are used to accelerate VM Horizon View and Citrix XenDesktop virtual desktops to deliver performance comparable to physical desktops. |
| • | Big Data — Big Data applications are increasingly being used to discover correlations across massive data sets that can be used for business, government, healthcare, and research applications. Our direct acceleration products are used to accelerate big data performance for applications such as Cassandra and MongoDB where I/O processing is critical to the timely completion of reliable analytic, search, and reporting processes. |
Customers
Our products are used in a variety of markets such as financial services, Internet, technology, education, retail, manufacturing, energy, life sciences, and government.
We generally sell pursuant to individual purchase orders from direct customers and under various master supply or reseller agreements. Our 10 largest customers, including the applicable OEM customers, accounted for an aggregate of 92%, 91%, and 84% of our revenue in fiscal 2011, 2012, and 2013, respectively. The composition of the group of our largest customers changes from period to period. Our direct customer Facebook, Apple, through a reseller, and OEM customer HP, each accounted for 30%, 25%, and 17% of our revenue, respectively, in fiscal 2012 and 29%, 15%, and 17% of our revenue, respectively, in fiscal 2013. We expect that sales of our products to a limited number of customers will continue to account for a majority of our revenue in the foreseeable future.
Customer Support
We offer standard warranty service and support with our products, including those sold directly or through resellers. This includes periodic software updates and maintenance releases and patches,if-and-when available, and other product support such as Internet access to technical content and24-hour telephone and email access to technical support personnel. Our OEMs provide primary product support for our products sold by them. We also sellpremium-tiered support and subscriptions pursuant to service contracts. Service contracts typically have a one to five year term. Our support personnel are primarily based in San Jose, California and Salt Lake City, Utah. We began expansion internationally with technical support personnel located to service our global customer base in Asia-Pacific and European geographies.
Research and Development
Our research and development efforts are focused primarily on improving and enhancing our existing products and developing new and next generation solutions on a regular cadence to maintain our competitive position. Our hardware platform roadmap leverages changes in NAND geometries to deliver higher levels of performance, reliability, customer return on investment, or ROI, and total cost of ownership, or TCO. We believe that software is critical to maintaining existing and expanding our leadership in leveraging data decentralization architectures and application acceleration. To date, we
-8-
Table of Contents
have not had significant software sales, but we are devoting the majority of our research and development resources to software development including value added software such as third party infrastructure and applications. We also intend to enhance our VSL, ioTurbine, ION Data Accelerator, ioSphere, ioControl, and data-tiering software. Our engineering team has extensive operating system expertise, including Linux kernel contributors and developers with expertise in a variety of other operating systems. We work closely with our customers to understand their current and future needs and have designed a product development process that integrates our customers’ feedback.
We believe the timely development of new products is essential to maintaining our competitive position. As of June 30, 2013, we had 376 employees in our research and development organization, substantially all of whom were located at our locations in Salt Lake City, Utah, San Jose, California, and Boulder, Colorado. We supplement our research and development efforts withthird-party developers and contractors. We also test our products to certify and ensure interoperability withthird-party hardware and software products, including PCIe interoperability and OEM certification. We plan to dedicate significant resources to these continued research and development efforts.
Our research and development expenses were $27.2 million, $60.0 million, and $95.5 million in fiscal 2011, 2012, and 2013, respectively.
Manufacturing
We outsource manufacturing of our hardware products using a limited number of contract manufacturers. We procure a majority of the components used in our products directly fromthird-party vendors and have them delivered to our contract manufacturers for manufacturing and assembly. Once our contract manufacturers performsub-assembly and quality tests, they are assembled to our specified configurations. We perform final manufacturing assurance tests, labeling, final configuration, including a final firmware installation and fulfillment to our customers.
Our demand driven manufacturing flow process is designed to minimize the amount of inventory that we are required to maintain and meet customer demand while supportingmix-model production. We place orders with our contract manufacturers on a purchase order basis and, in general, we engage our contract manufacturers to manufacture products to meet our forecasted demand or when our inventories drop below certain levels. Our agreements with our contract manufacturers require us to provide regular forecasts for orders. However, we may cancel or reschedule orders, subject to applicable notice periods and fees, and delivery schedules requested by us in these purchase orders vary based upon our particular needs. Our contract manufacturers work closely with us to ensure design for manufacturability, design for testability, and product quality.
Backlog
We do not believe that our backlog at any particular time is meaningful because it is not necessarily indicative of future revenue. In particular, customers may generally cancel or reschedule orders without penalty, and delivery schedules requested by customers in their purchase orders frequently vary based upon each customer’s particular needs. Additionally, shipments to customers may be delayed due to inventory constraints or expedited at a customer’s request.
Competition
We believe that the most important competitive factor in our market is to provide a comprehensive platform with the following attributes:
| • | hardware solutions incorporating persistent memory in sufficient capacity and rate of access, in a form factor that can be natively integrated withinindustry-standard servers; |
| • | ability to leverage commodity NAND supplies at the leading edge lithographies for the highest density, lowest cost solutions; |
-9-
Table of Contents
| • | software that can virtualize persistent memory and storage resources and govern the flow and management of data between storage and the server; |
| • | software applications and extensions that enable these platforms to be utilized within both new and existing datacenter architectures; and |
| • | software that centrally configures, manages, and monitors this new distributed data infrastructure. |
Other principal factors affecting our market include:
| • | application performance, including consistent low latency, symmetrical IOPs, and high bandwidth; |
| • | enterprise grade data endurance, reliability, retention, and availability not inherent in mainstream NAND Flash memory; |
| • | ease of management; |
| • | space efficiency; |
| • | energy efficiency; |
| • | low total cost of ownership; and |
| • | high return on investment. |
We believe that we compete favorably against our competitors on the basis of these factors.
Our direct acceleration products compete with various traditional datacenter architectures, including high performance server and storage approaches. These may include offerings from traditional data storage providers, including storage array vendors such as EMC, which typically sell centralized storage products as well ashigh-performance storage approaches utilizing solid state disks, as well as vertically integrated appliance vendors such as Oracle. In addition, we may also compete with enterprise solid state disk vendors such as Huawei Technologies, Intel, LSI, Marvell Semiconductor, Micron Technology, OCZ Technology Group, Samsung Electronics, SanDisk, Seagate Technology, Toshiba, Western Digital, and other privately held companies. A number of new, privately held companies are currently attempting to enter our market, one or more of which may become significant competitors in the future.
Our shared acceleration products compete with proprietary integrated flash appliances from EMC, Dell, flash-based storage products by HP, NetApp, TMS by IBM, and other privately held companies.
Our virtualization acceleration products compete with solutions from Adaptec, EMC, LSI, Oracle, Sandisk, and Western Digital, as well as several open source software solutions and other software-based hardware cache solutions being developed by privately held companies.
Many of our current competitors have, and some of our potential competitors could have, longer operating histories, greater name recognition, larger customer bases, and significantly greater financial, technical, sales, marketing, and other resources than we have. Potential customers may prefer to purchase from their existing suppliers rather than a new supplier regardless of product performance or features. Some of our competitors have made acquisitions of businesses that allow them to offer more directly competitive and comprehensive solutions than they had previously offered. In addition, some of our competitors may sell at zero or negative margins to gain business. Our current and potential competitors may also establish cooperative relationships among themselves or with third parties. As a result, we cannot assure that our products will continue to compete favorably, and any failure to do so could seriously harm our business, operating results, and financial condition.
-10-
Table of Contents
Intellectual Property
Our success depends in part upon our ability to protect our core technology and intellectual property. We rely on patents, trademarks, copyrights and trade secret laws, confidentiality procedures, and employee disclosure and invention assignment agreements to protect our intellectual property rights.
We have 55 issued patents and 139 patent applications in the United States and 4 issued patents and 54 patent applications in foreign countries, as of August 15, 2013 relating tonon-volatile solid state storage,non-volatile solid state memory, software acceleration, and related technologies. We cannot assure you whether any of our patent applications will result in the issuance of a patent or whether the examination process will require us to narrow our claims. Any patents that may issue may be contested, circumvented, found unenforceable or invalidated, and we may not be able to prevent third parties from infringing them.
We generally control access to and use of our proprietary software and other confidential information through the use of internal and external controls, including contractual protections with employees, contractors, customers, and partners, and our software is protected by U.S. and international copyright laws. Despite our efforts to protect our trade secrets and proprietary rights through intellectual property rights, licenses, and confidentiality agreements, unauthorized parties may still copy or otherwise obtain and use our software and technology. In addition, we intend to expand our international operations, and effective patent, copyright, trademark, and trade secret protection may not be available or may be limited in foreign countries.
Third parties could claim that our products or technologies infringe their proprietary rights. The data storage industry is characterized by the existence of a large number of patents, trademarks, and copyrights and by frequent litigation based on allegations of infringement or other violations of intellectual property rights. We expect that infringement claims may further increase as the number of products and competitors in our market increase. In addition, to the extent that we gain greater visibility and market exposure as a public company, we face a higher risk of being the subject of intellectual property infringement claims from third parties. We cannot assure you that we do not currently infringe, or that we will not in the future infringe, upon anythird-party patents or other proprietary rights. See “Risk Factors” for additional information.
Employees
We believe the expertise of our people and our technology focused culture is a key enabler of our technology leadership. Our team has a broad range of expertise across operating systems, datacenter software, systems, storage, networking, and servers. As of June 30, 2013, we had 938 employees. None of our employees is represented by a labor organization or is a party to any collective bargaining arrangement, except to the extent required by the laws of certain foreign jurisdictions. We have never had a work stoppage, and we consider our relationship with our employees to be good.
Financial Information about Segments and Geographic Areas
We operate our business in one segment. The segment and geographic information required herein is contained in Note 1 “Segment and Geographic Information” in the notes to our consolidated financial statements.
Additional Information
Company Website and Public Filings. We maintain a corporate website at www.fusionio.com. Except as explicitly noted, the information on our website is not incorporated by reference in this annual report onForm 10-K, or in any other filings with, or in any information furnished or submitted to the SEC.
-11-
Table of Contents
We make available, free of charge through our website, our annual reports onForm 10-K, quarterly reports onForm 10-Q and current reports onForm 8-K, and amendments to those reports, filed or furnished pursuant to Section 13(a) or Section 15(d) of the Securities Exchange Act of 1934, as amended, as soon as reasonably practicable after they have been electronically filed with, or furnished to, the SEC.
The public may read and copy any materials we file with the SEC at the SEC’s Public Reference Room at 100 F. Street, NE, Washington, DC 20549. The public may obtain information on the operation of the Public Reference Room by calling the SEC at1-800-SEC-0330. The SEC maintains an internet site (http://www.sec.gov) that contains reports, proxy and information statements, and other information regarding issuers that file electronically with the SEC.
Set forth below and elsewhere in this annual report onForm 10-K, and in other documents we file with the SEC, are descriptions of risks and uncertainties that could cause actual results to differ materially from the results contemplated by theforward-looking statements contained in this report. Because of the following factors, as well as other variables affecting our operating results, past financial performance should not be considered a reliable indicator of future performance and investors should not use historical trends to anticipate results or trends in future periods. The risks and uncertainties described below are not the only ones we face. Other events that we do not currently anticipate or that we currently deem immaterial also may affect our results of operations and financial condition.
Risks Related to Our Business and Industry
Our limited operating history makes it difficult to evaluate our current business and future prospects, and may increase the risk of your investment.
We were founded in December 2005 and sold our first products in April 2007. The majority of our revenue growth has occurred since December 31, 2009. We continue to innovate and develop enterprise data acceleration solutions. For example, we expanded our line of PCIe attached Flash product lines to include both performance and cost optimized solutions, released and upgraded our ION Data Accelerator software, acquired hybrid storage solutions for the SME market, added extensions to our virtualization and automated data-tiering caching software, and introduced industry standard application programming interfaces, or APIs, under the OpenNVM initiative. In addition, our current management team has only been working together for a relatively short period of time. Our limited operating history makes it difficult to evaluate our current business and our future prospects, including our ability to plan for and model future growth. We have encountered and will continue to encounter risks and difficulties frequently experienced by growing companies in rapidly changing industries, such as the risks described herein. If we do not address these risks successfully, our business and operating results would be adversely affected, and our stock price could decline.
Our revenue growth rate in recent periods is not expected to recur in the near term and may not be indicative of our future performance.
You should not consider our revenue growth in recent periods as indicative of our future performance. In future periods, we do not expect to achieve similar percentage revenue growth rates as have achieved in some past periods. We have experienced in the past, and continue to expect to experience, substantial concentrated purchases by customers to complete or upgrade large-scale datacenter deployments. As illustrated in the three months ended March 31, 2013 and June 30, 2013, our revenue in any particular quarterly period could be disproportionately affected if this trend continues. You should not rely on our revenue for any prior quarterly or annual periods as an indication of our future revenue or revenue growth. If we are unable to maintain consistent revenue or revenue growth, our stock price could be volatile, and it may be difficult to achieve and maintain profitability.
-12-
Table of Contents
We have experienced rapid growth in recent periods and we may not be able to sustain or manage any future growth effectively.
We have significantly expanded our overall business, customer base, headcount, and operations, and we anticipate that we will continue to grow our business. For example, from June 30, 2012 to June 30, 2013, our headcount increased from 669 to 938 employees, representing an increase of 269 employees. Our future operating results depend to a large extent on our ability to successfully manage our anticipated expansion and growth.
To manage our growth successfully, we believe we must effectively, among other things:
| • | maintain and extend our leadership in enterprise, hyperscale, and SME data acceleration; |
| • | maintain and expand our existing OEM and channel partner relationships and develop new OEM and channel partner relationships; |
| • | forecast and control expenses; |
| • | recruit, hire, train, and manage additional research and development and sales personnel; |
| • | expand our support capabilities; |
| • | enhance and expand our distribution and supply chain infrastructure; |
| • | manage inventory levels; |
| • | enhance and expand our international operations; and |
| • | implement, improve, and maintain our administrative, financial and operational systems, procedures, and controls. |
We expect that our future growth will continue to place a significant strain on our managerial, administrative, operational, financial, and other resources. We will incur costs associated with this future growth prior to realizing the anticipated benefits, and the return on these investments may be lower, or may develop more slowly, than we expect or may be nonexistent. If we are unable to manage our growth effectively, we may not be able to take advantage of market opportunities or develop new products or enhancements to existing products, and we may fail to satisfy end-users’ requirements, maintain product quality, execute on our business plan or respond to competitive pressures, each of which could adversely affect our business and operating results.
We expect large and concentrated purchases by a limited number of customers to continue to represent a substantial majority of our revenue, and any loss or delay of expected purchases could adversely affect our operating results.
Historically, large purchases by a relatively limited number of customers have accounted for a substantial majority of our revenue, and the composition of the group of our largest customers changes from period to period. Some of our customers make concentrated purchases to complete or upgrade specificlarge-scale data storage installations. These concentrated purchases areshort-term in nature and are typically made on a purchase order basis rather than pursuant tolong-term contracts. During fiscal 2011, 2012, and 2013, sales to the 10 largest customers in each period, including the applicable OEMs, accounted for approximately 92%, 91%, and 84% of revenue, respectively. Our direct customer Facebook, Apple, through a reseller, and our OEM customer HP, each accounted for 29%, 15%, and 17% of our revenue, respectively, in fiscal 2013.
As a consequence of our limited number of large customers and the concentrated nature of their purchases, our quarterly revenue and operating results may fluctuate from quarter to quarter and are difficult to estimate. For example, any acceleration or delay in anticipated product purchases or the
-13-
Table of Contents
acceptance of shipped products by our larger customers could materially impact our revenue and operating results in any quarterly period. Additionally, our revenue and operating results could be adversely affected if any of these larger customers purchase our competitors’ products instead of purchasing our products. We typically have limited visibility into the timing and size of purchases by our larger customers. We cannot provide any assurance that we will be able to sustain or increase our revenue from our larger customers or that we will be able to offset the discontinuation of concentrated purchases by our larger customers with purchases by new or existing customers. We expect that sales of our products to a limited number of customers will continue to contribute materially to our revenue for the foreseeable future, but that competition for these sales will increase. The loss of, or a significant delay or reduction in purchases by or change in the purchasing patterns of, a small number of significant customers could materially harm our business and operating results.
Our gross margins are impacted by a variety of factors, are subject to variation from period to period, and are difficult to predict.
Our gross margins fluctuate from period to period due primarily to product costs, customer mix, and product mix. Over fiscal 2013, our quarterly gross margins ranged from 55.1% to 61.8%. Our gross margins are likely to continue to fluctuate and may be affected by a variety of factors, including:
| • | demand for our products; |
| • | rebates, sales and marketing initiatives, discount levels, and competitive pricing; |
| • | changes in customer, geographic, or product mix, including mix of configurations within products; |
| • | significant new customer deployments; |
| • | the cost of components and freight; |
| • | changes in our manufacturing costs, including fluctuations in yields and production volumes; |
| • | new product introductions and enhancements, potentially with initial sales at relatively small volumes and higher product costs; |
| • | our growth strategy; |
| • | changes in the mix between direct versus channel sales; |
| • | the timing and amount of revenue recognized and deferred; |
| • | excess inventory levels or purchase commitments as a result of changes in demand forecasts or last time buy purchases; |
| • | write-downs due to excess and obsolete inventory; |
| • | possible product and software defects and related increased warranty or repair costs; |
| • | the timing of technical support service contracts and contract renewals; |
| • | expenses relating to licensed technology; |
| • | inventory stocking requirements to mitigate supply constraints, accommodate unforeseen demand, or support new product introductions; and |
| • | product quality and service ability issues. |
Due to such factors, gross margins are subject to variation from period to period and are difficult to predict. If we are unable to manage these factors effectively, our gross margins may decline, and fluctuations in gross margin may make it difficult to manage our business and achieve or maintain profitability, which could materially harm our business and operating results.
-14-
Table of Contents
Some of our large customers require more favorable terms and conditions from their vendors and may request pricing concessions. As we seek to sell more products to these customers, we may be required to agree to terms and conditions that may have an adverse effect on our business or ability to recognize revenue.
Some of our larger customers have significant purchasing power and, accordingly, have requested and received more favorable terms and conditions, including lower prices, than we typically provide. As we seek to sell more products to this class of customer, we may be required to agree to these terms and conditions, which may include terms that affect the timing of our revenue recognition or may reduce our gross margins and have an adverse effect on our business and operating results.
The future growth of our sales to OEMs is dependent on OEM customers incorporating our products into their server and data storage systems and the OEM’s sales efforts. Any failure to grow our OEM sales and maintain relationships with OEMs could adversely affect our business, operating results, and financial condition.
Sales of our products to OEMs represent a significant portion of our revenue and we anticipate that our OEM sales will constitute a substantial portion of our future sales. In some cases, our products must be designed into the OEM’s products. If that fails to occur for a given product line of an OEM, we would likely be unable to sell our products to that OEM for such product line during the life cycle of that product. Even if an OEM integrates one or more of our products into its server, data storage systems or appliance solutions, we cannot be assured that its product will be commercially successful, and as a result, our sales volumes may be less than anticipated. Our OEM customers are typically not obligated to purchase our products and can choose at any time to stop using our products, if their own systems are not commercially successful or if they decide to pursue other strategies or for any other reason, including the incorporation or development of competing products by these OEMs. Moreover, our OEM customers may not devote sufficient attention and resources to selling our products. We may not be able to develop or maintain relationships with OEMs for a number of reasons, including because of the OEM’s relationships with our competitors or prospective competitors or other incentives that may not motivate their internal sales forces to promote our products. In addition, direct sales of our ioDrive and ioScale product lines may compete with products sold by our OEM partners, and our OEM partners may compete directly with our other OEM partners, which may affect the commitment of our OEM partners to sell our products. Even if we are successful in selling through OEMs, sales through OEMs could result in a lower gross margin business than our direct sales business. If we are unable to grow our OEM sales, if our OEM customers’ systems incorporating our products are not commercially successful, if our products, including new and next generation products, are not designed into a given OEM product cycle, if we fail to minimize conflicts between our channel partners, in particular OEMs, if our OEM customers do not timely qualify our products for promotion or sale by them, or if our OEM customers significantly reduce, cancel, or delay their orders with us, our revenue would suffer and our business, operating results, and financial condition could be materially adversely affected.
Ineffective management of our inventory levels could adversely affect our operating results.
If we are unable to properly forecast, monitor, control, and manage our inventory and maintain appropriate inventory levels and mix of products to support our customers’ needs, we may incur increased and unexpected costs associated with our inventory. Sales of our products are generally made through individual purchase orders and some of our customers place large orders with short lead times, which make it difficult to predict demand for our products and the level of inventory that we need to maintain to satisfy customer demand. If we build our inventory in anticipation of future demand that does not materialize, or if a customer cancels or postpones outstanding orders, we could experience an unanticipated increase in levels of our finished products. For some customers, even if we are not contractually obligated to accept returned products, we may determine that it is in our best interest to
-15-
Table of Contents
accept returns in order to maintain good relationships with those customers. Product returns would increase our inventory and reduce our revenue. If we are unable to sell our inventory in a timely manner, we could incur additional carrying costs, reduced inventory turns, and potential write-downs due to obsolescence.
Alternatively, we could carry insufficient inventory, and we may not be able to satisfy demand, which could have an adverse effect on our customer relationships or cause us to lose potential sales.
We have often experienced order changes including delivery delays and fluctuations in order levels from period-to-period, and we expect to continue to experience similar delays and fluctuations in the future, which could result in fluctuations in inventory levels, cash balances, and revenue.
The occurrence of any of these risks could adversely affect our business, operating results, and financial condition.
Our operating results may fluctuate significantly, which could make our future results difficult to predict and could cause our operating results to fall below expectations.
Our operating results may fluctuate due to a variety of factors, many of which are outside of our control. As a result, comparing our operating results on a period-to-period basis may not be meaningful. You should not rely on our past results as an indication of our future performance. If our revenue or operating results fall below the expectations of investors or any securities analysts that follow our company, the price of our common stock would likely decline.
Factors that are difficult to predict and that could cause our operating results to fluctuate include:
| • | the timing and magnitude of orders, shipments, and acceptance of our products in any quarter; |
| • | our ability to control the costs of the components we use in our hardware products; |
| • | our ability to timely adopt subsequent generations of non-volatile memory components into our hardware products; |
| • | disruption in our supply chains, component availability, and related procurement costs; |
| • | reductions in customers’ budgets for information technology purchases; |
| • | delays in customers’ purchasing cycles or deferments of customers’ product purchases in anticipation of new products or updates from us or our competitors; |
| • | delays in customers’ purchasing cycles or deferments of customers’ product purchases due to data center physical expansion or facility construction; |
| • | fluctuations in demand and prices for our products; |
| • | changes in industry standards in the data storage industry; |
| • | our ability to develop, introduce, and ship in a timely manner new products and product enhancements that meet customer requirements; |
| • | the timing of product releases or upgrades or announcements by us or our competitors; |
| • | any change in the competitive dynamics of our markets, including new entrants or discounting of product prices; |
| • | our ability to retain or hire employees; |
-16-
Table of Contents
| • | our ability to control costs, including our operating expenses; and |
| • | future accounting pronouncements and changes in accounting policies. |
The occurrence of any one of these risks could negatively affect our operating results in any particular quarter, which could cause the price of our common stock to decline.
We have incurred significant net losses during our limited operating history and may not consistently achieve or maintain profitability.
Prior to the three months ended March 31, 2011, we had incurred net losses in each quarter since our inception and again incurred net losses in the three months ended December 31, 2011, March 31, 2012, June 30, 2012, March 31, 2013, and June 30, 2013. We may incur losses in future periods as we continue to increase our expenses in all areas of our operations to support our growth. If our revenue does not increase to offset these expected increases in operating expenses, we will not be profitable. As of June 30, 2013, we had an accumulated deficit of $108.8 million.
Changes in our provision for income taxes or adverse outcomes resulting from examination of our income tax returns could adversely affect our results.
Our provision for income taxes is subject to volatility and could be adversely affected by several factors, many of which are outside of our control, including:
| • | changes in the valuation of our deferred tax assets and liabilities; |
| • | changes in the research and development tax credit laws; |
| • | an increase in non-deductible expenses for tax purposes, including certain stock-based compensation expense and impairment of goodwill; |
| • | transfer pricing adjustments; |
| • | earnings being lower than anticipated in countries that have lower tax rates and higher than anticipated in countries that have higher tax rates; |
| • | changes in the income allocation methods for state taxes; |
| • | a change in the pattern of stock option exercises by our employees; |
| • | tax assessments resulting from income tax audits or any related tax interest or penalties that could significantly affect our income tax provision for the period in which the settlement takes place; |
| • | a change in our decision to indefinitely reinvest foreign earnings; |
| • | changes in accounting principles; |
| • | the tax effects of purchase accounting for acquisitions and restructuring charges that may cause fluctuations between reporting periods; |
| • | imposition of withholding or other taxes on payments by subsidiaries or customers; or |
| • | changes in tax laws or related interpretations, accounting standards, regulations, and interpretations in multiple tax jurisdictions in which we operate. |
Significant judgment is required to determine the recognition and measurement attribute as prescribed in the income tax accounting standards. In addition, these standards apply to all income tax positions, including the potential recovery of previously paid taxes, which if settled unfavorably could adversely impact our provision for income taxes or additional paid-in capital.
-17-
Table of Contents
In evaluating our ability to recover our deferred tax assets, in full or in part, we consider all available positive and negative evidence, including our past operating results, our forecast of future market growth, forecasted earnings, and future taxable income, and prudent and feasible tax planning strategies. The assumptions utilized in determining future taxable income require significant judgment and are consistent with the plans and estimates we are using to manage the underlying businesses. Due to historical net losses incurred and the uncertainty of realizing the deferred tax assets, for all the periods presented, we have a full valuation allowance against our deferred tax assets. We will continue to assess the need for a valuation allowance on the deferred tax assets by evaluating both positive and negative evidence that may exist. To the extent that we generate positive income and expect, with reasonable certainty, to continue to generate positive income we may release all or a portion of our valuation allowance in a future period. This release would result in the recognition of certain deferred tax assets and a decrease to income tax expense for the period such release is made. The release of all or a portion of the valuation allowance will have a significant effect on our tax expense in the period it is released.
As a multinational corporation, we conduct our business in many countries and are subject to taxation in many jurisdictions. The taxation of our business is subject to the application of multiple and sometimes conflicting tax laws and regulations as well as multinational tax conventions. Our effective tax rate is dependent upon the availability of tax credits and carryforwards. The application of tax laws and regulations is subject to legal and factual interpretation, judgment and uncertainty. Tax laws themselves are subject to change as a result of changes in fiscal policy, changes in legislation, and the evolution of regulations and court rulings. Consequently, taxing authorities may impose tax assessments or judgments against us that could materially impact our tax liability and/or our effective income tax rate.
In addition, we may be subject to examination of our income tax returns by the Internal Revenue Service and other tax authorities. If tax authorities challenge the relative mix of our U.S. and international income, our future effective income tax rates could be adversely affected. While we regularly assess the likelihood of adverse outcomes from such examinations and the adequacy of our provision for income taxes, there can be no assurance that such provision is sufficient and that a determination by a tax authority will not have an adverse effect on our business, financial condition and results of operations.
Our sales cycles can be long and unpredictable, particularly with respect to large orders and OEM relationships, and our sales efforts require considerable time and expense. As a result, it can be difficult for us to predict when, if ever, a particular customer will choose to purchase our products, which may cause our operating results to fluctuate significantly.
Our sales efforts involve educating our customers about the use and benefits of our products, including their technical capabilities and cost saving potential. Customers often undertake an evaluation and testing process that can result in a lengthy sales cycle. We spend substantial time and resources on our sales efforts without any assurance that our efforts will produce any sales. In addition, product purchases are frequently subject to budget constraints, multiple approvals, and unplanned administrative, processing, and other delays. Additionally, a significant portion of our sales personnel have been with us for less than a year, and we continue to increase our number of sales personnel, which could further extend the sales cycle as these new personnel are typically not immediately productive. These factors, among others, could result in long and unpredictable sales cycles, particularly with respect to large orders.
We also sell to OEMs that incorporate our solutions into their products, which can require an extended evaluation, testing, and qualification process before our product is approved for inclusion in one of their product lines. We also may be required to customize our product to interoperate with an
-18-
Table of Contents
OEM’s product, which could further lengthen the sales cycle for OEM customers. In addition, an OEM may align the announcement of our products in conjunction with their fixed product release cycle and may further add delay when not aligned with the current cycle. The length of our sales cycle for an OEM makes us susceptible to the risk of delays or termination of orders if end-users decide to delay or withdraw funding for datacenter projects, which could occur for various reasons, including global economic cycles and capital market fluctuations.
As a result of these lengthy and uncertain sales cycles of our products, it is difficult for us to predict when customers may purchase and accept products from us and as a result, our operating results may vary significantly and may be adversely affected.
We compete with large storage and software providers and expect competition to intensify in the future from established competitors and new market entrants.
The market for data storage products is highly competitive, and we expect competition to intensify in the future. Our direct acceleration products compete with various traditional datacenter architectures, including high performance server and storage approaches. These may include offerings from traditional data storage providers, including storage array vendors such as EMC Corporation, which typically sell centralized storage products as well ashigh-performance storage approaches utilizing solid state disks, as well as vertically integrated appliance vendors such as Oracle or a number of all Flash or hybrid array startups. In addition, we may also compete with enterprise solid state disk vendors such as Huawei Technologies, Intel, LSI, Marvell Semiconductor, Micron Technology, OCZ Technology Group, Samsung Electronics, SanDisk, Seagate Technology, Toshiba, Western Digital, and other privately held companies. A number of new, privately held companies are currently attempting to enter our market, one or more of which may become significant competitors in the future.
Our shared acceleration products compete with proprietary integrated flash appliances from EMC, Dell, flash-based storage products by HP, NetApp, TMS by IBM, and other privately held companies.
Our virtualization acceleration products compete with solutions from Adaptec, EMC, LSI, Oracle, Sandisk, and Western Digital, as well as several open source software solutions and other software-based hardware cache solutions being developed by privately held companies.
Many of our current competitors have, and some of our potential competitors could have, longer operating histories, greater name recognition, larger customer bases, and significantly greater financial, technical, sales, marketing, and other resources than we have. Potential customers may prefer to purchase from their existing suppliers rather than a new supplier regardless of product performance or features. New start-up companies continue to innovate and may invent similar or superior products and technologies that may compete with our products and technology. Some of our competitors have made acquisitions of businesses that may allow them to offer more directly competitive and comprehensive solutions than they had previously offered. In addition, some of our competitors, including our OEM customers, may develop competing technologies and sell at zero or negative margins, through product bundling, closed technology platforms, or otherwise, to gain business. Our current and potential competitors may also establish cooperative relationships among themselves or with third parties. As a result, we cannot assure you that our products will continue to compete favorably, and any failure to do so could seriously harm our business, operating results, and financial condition.
Competitive factors could make it more difficult for us to sell our products, resulting in increased pricing pressure, reduced gross margins, increased sales and marketing expenses, longer customer sales cycles, and failure to increase, or the loss of, market share, any of which could seriously harm our business, operating results, and financial condition. Any failure to meet and address these competitive challenges could seriously harm our business and operating results.
-19-
Table of Contents
The market fornon-volatile storage memory products is developing, segmenting, and rapidly evolving, which makes it difficult to forecastend-user adoption rates and demand for our products.
The market for non-volatile storage class memory products is developing, segmenting, and rapidly evolving. Accordingly, our future financial performance will depend in large part on growth in this market and on our ability to adapt to emerging demands in this market. Sales of our products currently are dependent in large part upon demand in markets that require high performance data storage solutions such as computing, Internet, and financial services. It is difficult to predict with any precision end-user adoption rates, end-user demand for our products or the future growth rate and size of our market. The rapidly evolving nature of the technology in the data storage products market, as well as other factors that are beyond our control, reduce our ability to accurately evaluate our future outlook and forecast quarterly or annual performance. Our products may never reach mass adoption, and changes or advances in technologies could adversely affect the demand for our products. Further, although Flash-based data storage products have a number of advantages compared to other data storage alternatives, Flash-based storage devices have certain disadvantages as well, including a higher price per gigabyte of storage, potentially shortened product lifespan, more limited methods for data recovery and lower performance for certain uses, including sequential input/output transactions and increased utilization of host system resources than traditional storage, and may require end-users to modify or replace network systems originally made for traditional storage media. A reduction in demand for Flash-based data storage caused by lack of end-user acceptance, technological challenges, competing technologies, and products or otherwise would result in a lower revenue growth rate or decreased revenue, either of which could negatively impact our business and operating results.
If our industry experiences declines in average sales prices, it may result in declines in our revenue and gross profit.
The industry for data storage products is highly competitive and has historically been characterized by declines in average sales prices. It is possible that the market for decentralized storage solutions could experience similar trends. Our average sales prices could decline due to pricing pressure caused by several factors, including competition, the introduction of competing technologies, the worldwide supply of Flash-based or similar memory components, our manufacturing efficiencies, implementation of new manufacturing processes, and expansion of manufacturing capacity by component suppliers. If we are required to decrease our prices to be competitive and are not able to offset this decrease by improvements in our cost of goods, increases in volume of sales or the sales of new products with higher margins, our gross margins and operating results would likely be adversely affected.
Developments or improvements in storage system technologies may materially adversely affect the demand for our products.
Significant developments in data storage systems, such as advances in solid state storage drives or improvements in non-volatile memory, may materially and adversely affect our business and prospects in ways we do not currently anticipate. For example, improvements in existing data storage technologies, such as a significant increase in the speed of traditional interfaces for transferring data between storage and a server or the speed of traditional embedded controllers, could emerge as preferred alternative to our products especially if they are sold at lower prices. This could be the case even if such advances do not deliver all of the benefits of our products. Any failure by us to develop new or enhanced technologies or processes, or to react to changes or advances in existing technologies, could materially delay our development and introduction of new products, which could result in the loss of competitiveness of our products, decreased revenue, and a loss of market share to competitors.
-20-
Table of Contents
We derive substantially all of our revenue from our storage memory products, and a decline in demand for these products would cause our revenue to grow more slowly or to decline.
Our storage class memory products account for substantially all of our revenue and will continue to comprise a significant portion of our revenue for the foreseeable future. As a result, our revenue could be reduced by:
| • | the failure of our storage class memory products to achieve broad market acceptance; |
| • | any decline or fluctuation in demand for our storage class memory products, whether as a result of product obsolescence, technological change, customer budgetary constraints or other factors; |
| • | the introduction of products and technologies that serve as a replacement or substitute for, or represent an improvement over, these products; and |
| • | our inability to release enhanced versions of our products, including any related software, on a timely basis. |
If the storage markets grow more slowly than anticipated or if demand for our products declines, we may not be able to increase our revenue sufficiently to achieve and maintain profitability and our stock price would decline.
If we fail to develop and introduce new or enhanced products on a timely basis, including innovations in our software offerings, our ability to attract and retain customers could be impaired and our competitive position could be harmed.
We operate in a dynamic environment characterized by rapidly changing technologies and industry standards and technological obsolescence. To compete successfully, we must design, develop, market, and sell new or enhanced products that provide increasingly higher levels of performance, capacity, and reliability and meet the cost expectations of our customers. The introduction of new products by our competitors, the market acceptance of products based on new or alternative technologies, or the emergence of new industry standards could render our existing or future products obsolete. Our failure to anticipate or timely develop new or enhanced products or technologies in response to technological shifts could result in decreased revenue and harm our business. If we fail to introduce new or enhanced products that meet the needs of our customers or penetrate new markets in a timely fashion, we will lose market share and our operating results will be adversely affected.
In order to maintain or increase our gross margins, we will need to continue to create valuable software solutions to be integrated with our storage class memory products. Any new feature or application that we develop or acquire may not be introduced in a timely or cost-effective manner and may not achieve the broad market acceptance necessary to help increase our overall gross margins. If we are unable to successfully develop or acquire, and then market and sell our next generation products, our ability to increase our revenue and gross margin will be adversely affected.
Our products are highly technical and may contain undetected defects, which could cause data unavailability, loss or corruption that might, in turn, result in liability to our customers and harm to our reputation and business.
Our products are highly technical and complex and are often used to store information critical to our customers’ business operations. Our products may contain undetected errors, defects, or security vulnerabilities that could result in data unavailability, loss, or corruption or other harm to our customers. Some errors in our products may only be discovered after they have been installed and used by customers. Any errors, defects, or security vulnerabilities discovered in our products after commercial
-21-
Table of Contents
release could result in a loss of revenue or delay in revenue recognition, injury to our reputation, a loss of customers or increased service and warranty costs, any of which could adversely affect our business. In addition, we could face claims for product liability, tort, or breach of warranty. Many of our contracts with customers contain provisions relating to warranty disclaimers and liability limitations, which may be difficult to enforce. Defending a lawsuit, regardless of its merit, would be costly and might divert management’s attention and adversely affect the market’s perception of us and our products. In addition, our business liability insurance coverage could prove inadequate with respect to a claim and future coverage may be unavailable on acceptable terms or at all. These product-related issues could result in claims against us and our business could be adversely impacted.
Our products must interoperate with operating systems, software applications and hardware that are developed by others and if we are unable to devote the necessary resources to ensure that our products interoperate with such software and hardware, we may fail to increase, or we may lose, market share and we may experience a weakening demand for our products.
Our products must interoperate with our customers’ existing infrastructure, specifically their networks, servers, software, and operating systems, which may be manufactured by a wide variety of vendors and OEMs. When new or updated versions of these software operating systems or applications are introduced, we must sometimes develop updated versions of our software so that our products will interoperate properly. We may not accomplish these development efforts quickly, cost-effectively, or at all. These development efforts require capital investment and the devotion of engineering resources. If we fail to maintain compatibility with these applications, our customers may not be able to adequately utilize the data stored on our products, and we may, among other consequences, fail to increase, or we may lose, market share and experience a weakening in demand for our products, which would adversely affect our business, operating results, and financial condition.
Our products must conform to industry standards in order to be accepted by customers in our markets.
Generally, our products comprise only a part of a datacenter. The servers, network, software, and other components and systems of a datacenter must comply with established industry standards in order to interoperate and function efficiently together. We depend on companies that provide other components of the servers and systems in a datacenter to support prevailing industry standards. Often, these companies are significantly larger and more influential in driving industry standards than we are. Some industry standards may not be widely adopted or implemented uniformly, and competing standards may emerge that may be preferred by our customers. If larger companies do not support the same industry standards that we do, or if competing standards emerge, market acceptance of our products could be adversely affected, which would harm our business, operating results, and financial condition.
We rely on our key technical, sales and management personnel to grow our business, and the loss of one or more key employees or the inability to attract and retain qualified personnel could harm our business.
Our success and future growth depends to a significant degree on the skills and continued services of our key technical, sales, and management personnel. In particular, we are highly dependent on the services of our Chief Executive Officer, Shane Robison. Our employees generally work for us on an at-will basis, and we could experience difficulty in retaining members of our senior management team. We do not have “key person” life insurance policies that cover any of our officers or other key employees. The loss of the services of any of our key employees could disrupt our operations, delay the development and introduction of our products, and negatively impact our business, prospects, and operating results.
-22-
Table of Contents
We plan to hire additional personnel in all areas of our business, particularly for sales and research and development. Competition for these types of personnel is intense. We cannot assure you that we will be able to successfully attract or retain qualified personnel. Our inability to retain and attract the necessary personnel could adversely affect our business, operating results, and financial condition.
Our current research and development efforts may not produce successful products that result in significant revenue in the near future, if at all.
Developing our products and related enhancements is expensive. Our investments in research and development may not result in marketable products or may result in products that are more expensive than anticipated, take longer to generate revenue or generate less revenue, than we anticipate. Our future plans include significant investments in research and development and related product opportunities. We believe that we must continue to dedicate a significant amount of resources to our research and development efforts to maintain our competitive position. However, we may not receive significant revenue from these investments in the near future, if at all, which could adversely affect our business and operating results.
Our ability to sell our products is dependent in part on ease of use and the quality of our support offerings, and any failure to offerhigh-quality technical support would harm our business, operating results, and financial condition.
Although our products are designed to be interoperable with existing servers and systems, we may need to provide customized installation and configuration support to our customers before our products become fully operational in their environments. Once our products are deployed within our customers’ datacenters, they depend on our support organization to resolve any technical issues relating to our products. Our ability to provide effective support is largely dependent on our ability to attract, train, and retain qualified personnel. In addition, our sales process is highly dependent on our product and business reputation and on strong recommendations from our existing customers. Any failure to maintain high-quality installation and technical support, or a market perception that we do not maintain high-quality support, could harm our reputation, adversely affect our ability to sell our products to existing and prospective customers, and could harm our business, operating results, and financial condition.
If we fail to successfully maintain or grow our reseller and other channel partner relationships, our business and operating results could be adversely affected.
Our ability to maintain or grow our revenue will depend, in part, on our ability to maintain our arrangements with our existing channel partners and to establish and expand arrangements with new channel partners. Our channel partners may choose to discontinue offering our products or may not devote sufficient attention and resources toward selling our products. For example, our competitors may provide incentives to our existing and potential channel partners to use or purchase their products and services or to prevent or reduce sales of our products. The occurrence of any of these events could adversely affect our business and operating results.
We are exposed to the credit risk of some of our customers and to credit exposure in weakened markets, which could result in material losses.
Most of our sales are on an open credit basis. As a general matter, we monitor individual customer payment capability in granting open credit arrangements and may limit these open credit arrangements based on creditworthiness. We also maintain allowances we believe are adequate to cover exposure for doubtful accounts. Although we have programs in place that are designed to monitor and mitigate
-23-
Table of Contents
these risks, we cannot assure you these programs will be effective in reducing our credit risks, especially as we expand our business internationally. If we are unable to adequately control these risks, our business, operating results, and financial condition could be harmed.
We currently rely on contract manufacturers to manufacture our products, and our failure to manage our relationship with our contract manufacturers successfully could negatively impact our business.
We rely on several contract manufacturers to manufacture our products. We continue to evaluate other contract manufacturers. Our reliance on these contract manufacturers reduces our control over the assembly process, exposing us to risks, including reduced control over quality assurance, production costs, and product supply. If we fail to manage our relationships with these contract manufacturers effectively, or if these contract manufacturers experience delays, disruptions, capacity constraints, or quality control problems in their operations, our ability to ship products to our customers could be impaired and our competitive position and reputation could be harmed. If we are required to change contract manufacturers or assume internal manufacturing operations, we may lose revenue, incur increased costs, and damage our customer relationships. Qualifying a new contract manufacturer and commencing production is expensive and time-consuming. We may need to increase our component purchases, contract manufacturing capacity, and internal test and quality functions if we experience increased demand. The inability of these contract manufacturers to provide us with adequate supplies of high-quality products, could cause a delay in our order fulfillment, and our business, operating results, and financial condition would be adversely affected.
We rely on a limited number of suppliers, and in some casessingle-source suppliers, and any disruption or termination of these supply arrangements could delay shipments of our products and could materially and adversely affect our relationships with current and prospective customers.
We rely on a limited number of suppliers, and in some cases single-source suppliers, for several key components of our products, and we have not generally entered into agreements for the long-term purchase of these components. This reliance on a limited number of suppliers and the lack of any guaranteed sources of supply exposes us to several risks, including:
| • | the inability to obtain an adequate supply of key components, including non-volatile memory and reprogrammable controllers; |
| • | price volatility for the components of our products; |
| • | failure of a supplier to meet our quality, yield, or production requirements; |
| • | failure of a key supplier to remain in business or adjust to market conditions; and |
| • | consolidation among suppliers, resulting in some suppliers exiting the industry or discontinuing the manufacture of components. |
As a result of these risks, we cannot assure you that we will be able to obtain enough of these key components in the future or that the cost of these components will not increase. If our supply of certain components is disrupted or delayed, or if we need to replace our existing suppliers, there can be no assurance that additional supplies or components will be available when required or that supplies will be available on terms that are favorable to us, which could extend our lead times, increase the costs of our components and materially adversely affect our business, operating results, and financial condition. If we are successful in growing our business, we may not be able to continue to procure components at current prices, which would require us to enter into longer term contracts with component suppliers to obtain these components at competitive prices. This could increase our costs and decrease our gross margins, harming our operating results.
-24-
Table of Contents
Our results of operations could be affected by natural events in locations in which our customers or suppliers operate.
Several of our customers and suppliers have operations in locations that are subject to natural disasters, such as severe weather and geological events, which could disrupt the operations of those customers and suppliers. For example, in March 2011, the northern region of Japan experienced a severe earthquake followed by a tsunami. These geological events caused significant damage in that region and have adversely affected Japan’s infrastructure and economy. Some of our customers and suppliers are located in Japan and they have experienced, and may experience in the future, shutdowns as a result of these events, and their operations may be negatively impacted by these events. Our customers affected by this or a future natural disaster could postpone or cancel orders of our products, which could negatively impact our business. Moreover, should any of our key suppliers fail to deliver components to us as a result of this or a future natural disaster, we may be unable to purchase these components in necessary quantities or may be forced to purchase components in the open market at significantly higher costs. We may also be forced to purchase components in advance of our normal supply chain demand to avoid potential market shortages. In addition, if we are required to obtain one or more new suppliers for components or use alternative components in our solutions, we may need to conduct additional testing of our solutions to ensure those components meet our quality and performance standards, all of which could delay shipments to our customers and adversely affect our financial condition and results of operations.
To the extent we purchase excess or insufficient component inventory in connection with discontinuations by our vendors of components used in our products, our business or operating results may be adversely affected.
It is common in the storage and networking industries for component vendors to discontinue the manufacture of, or experience lack of supply on, certain types of components from time to time due to evolving technologies and changes in market demands. A supplier’s discontinuation or allocation of a particular type of component, such as a specific type of NAND Flash memory, may require us to make significant “last time” or higher cost purchases of component inventory that is being discontinued or limited by the vendor to ensure supply continuity until the transition to products based on next generation components or until we are able to secure an alternative supply. To the extent we purchase insufficient component inventory in connection with these discontinuations or allocations, we may experience delayed shipments, order cancellations or otherwise purchase more expensive components to meet customer demand, which could result in reduced gross margins. Alternatively, to the extent we purchase excess component inventory that we cannot use in our products due to obsolescence, we could be required to reduce or write-off the carrying value of inventory or be required to sell the components at or below our carrying value, which could reduce our gross margins.
Our business may be adversely affected if we encounter difficulties as we upgrade our enterprise resource planning system, or ERP, and other information technology systems.
We have substantially completed the upgrade of our ERP system and other information technology systems. Because we are in the process of upgrading and improving these systems, this upgrading and improvement poses a risk to our internal controls over financial reporting and to our business operations. Disruptions or difficulties in upgrading and improving these systems or the related procedures or controls could adversely affect both our internal and disclosure controls and harm our business, including our ability to forecast or make sales, manage our supply chain, and collect our receivables. Moreover, such a disruption could result in unanticipated costs or expenditures and a diversion of management’s attention and resources.
-25-
Table of Contents
We will need to maintain effective internal control over financial reporting in accordance with Section 404 of theSarbanes-Oxley Act and the failure to do so could have a material adverse effect on our business and stock price.
The Sarbanes-Oxley Act requires, among other things, that we maintain effective internal control over financial reporting and disclosure controls and procedures. We are required to perform system and process evaluation and testing of our internal control over financial reporting to allow management and our independent registered public accounting firm to report on the effectiveness of our internal control over financial reporting, as required by Section 404 of the Sarbanes-Oxley Act, or Section 404. Our compliance with Section 404 may require us to continue to incur substantial expense and expend significant management efforts. If we are unable to comply with the requirements of Section 404 in a timely manner, or if we or our independent registered public accounting firm notes or identifies deficiencies in our internal control over financial reporting that are deemed to be material weaknesses, the market price of our stock could decline and we could be subject to sanctions or investigations by the New York Stock Exchange, the SEC, or other regulatory authorities, which would require additional financial and management resources.
Third-party claims that we are infringing intellectual property, whether successful or not, could subject us to costly andtime-consuming litigation or expensive licenses, and our business could be harmed.
The storage and networking industries are characterized by the existence of a large number of patents, copyrights, trademarks and trade secrets and by frequent litigation based on allegations of infringement or other violations of intellectual property rights. We have in the past received and may in the future receive inquiries from other intellectual property holders and may become subject to claims that we infringe their intellectual property rights, particularly as we expand our presence in the market and face increasing competition. For example, on February 7, 2012, Entorian Technologies L.P., filed a lawsuit in the U.S. District Court for the District of Utah against our company. The complaint alleged that memory stacks included in some of our products infringe U.S. Patent No. 5,420,751, or the ‘751 patent, which expired in May 2012. Polystak, Inc. is our third-party supplier of the accused memory stack component. On March 1, 2012, Polystak filed a lawsuit against Entorian Technologies in the U.S. District Court for the Northern District of California. The complaint alleges that the ‘751 patent is invalid, and that Polystak’s memory stacks do not infringe the ‘751 patent. On March 8, 2012, Entorian Technologies dismissed the lawsuit against us in Utah. On March 9, 2012, Entorian Technologies filed a counterclaim against Polystak and us in the Northern District of California lawsuit. The counterclaim alleges infringement of the ‘751 patent by Polystak and us and seeks damages, but it does not seek an injunction. On September 4, 2012, the Court stayed this lawsuit pending reexamination of the ‘751 patent by the U.S. Patent Office. Based on our preliminary investigation, we do not believe that our products infringe any valid or enforceable claim of the ‘751 patent. Polystak has agreed to indemnify and defend us with respect to these lawsuits. Nevertheless, the costs associated with any actual, pending, or threatened litigation could negatively impact our operating results regardless of the actual outcome.
In addition, on May 18, 2011, Internet Machines LLC filed a lawsuit in U.S. District Court for the Eastern District of Texas against our company and 20 other companies. The complaint alleges that our products infringe U.S. Patent Nos. 7,454,552; 7,421,532; 7,814,259; and 7,945,722. On August 26, 2011, Internet Machines MC LLC amended its prior complaint filed in U.S. District Court for the Eastern District of Texas against PLX Technology, Inc. to add our company and several other companies as defendants. This complaint alleges that our products infringe U.S. Patent No. 7,539,190. These complaints seek both damages and a permanent injunction against us. The specific infringement allegations appear to focus on a PCI switch component that, while used in some of our products, is manufactured by a third-party supplier. This third-party supplier was found to infringe U.S. Patent
-26-
Table of Contents
Nos. 7,454,552 and 7,421,532 by a jury in a prior case. The judge has stayed the lawsuits against us pending the entry of a final non-appealable judgment in the prior case between the third-party supplier and Internet Machines. The third-party supplier has agreed to indemnify and defend us with respect to these lawsuits. Based upon our preliminary investigation of the patents identified in the complaints, we do not believe that our products infringe any valid or enforceable claim of these patents. Nevertheless, the costs associated with any actual, pending, or threatened litigation could negatively impact our operating results regardless of the actual outcome.
Moreover, on September 7, 2011, Solid State Storage Solutions, Inc., or S4, filed a lawsuit in U.S. District Court for the Eastern District of Texas against our company and eight other companies, alleging that our products infringed certain of the S4 patents. On February 25, 2013, the parties resolved this matter pursuant to a confidential agreement that releases us from past claims and includes a license to S4’s patent portfolio. Although we continue to dispute that our products infringe any valid claims of S4’s patents, the settlement enables us to avoid further legal defense costs and the diversion of management resources. On March 28, 2013, the U.S. District Court for the Eastern District of Texas approved the parties’ joint motion to dismiss the matter with prejudice.
We currently have a number of agreements in effect pursuant to which we have agreed to defend, indemnify, and hold harmless our customers, suppliers, and channel partners from damages and costs which may arise from the infringement by our products of third-party patents, trademarks, or other proprietary rights. The scope of these indemnity obligations varies, but may, in some instances, include indemnification for damages and expenses, including attorneys’ fees. Our insurance may not cover intellectual property infringement claims. A claim that our products infringe a third party’s intellectual property rights, if any, could harm our relationships with our customers, may deter future customers from purchasing our products and could expose us to costly litigation and settlement expenses. Even if we are not a party to any litigation between a customer and a third party relating to infringement by our products, an adverse outcome in any such litigation could make it more difficult for us to defend our products against intellectual property infringement claims in any subsequent litigation in which we are a named party. Any of these results could harm our brand and operating results.
Any intellectual property rights claim against us or our customers, suppliers, and channel partners, with or without merit, could be time-consuming, expensive to litigate or settle, could divert management resources and attention and could force us to acquire intellectual property rights and licenses, which may involve substantial royalty payments. Further, a party making such a claim, if successful, could secure a judgment that requires us to pay substantial damages. An adverse determination also could invalidate our intellectual property rights and prevent us from offering our products to our customers and may require that we procure or develop substitute products that do not infringe, which could require significant effort and expense. We may have to seek a license for the technology, which may not be available on reasonable terms or at all, may significantly increase our operating expenses or require us to restrict our business activities in one or more respects. Any of these events could seriously harm our business, operating results, and financial condition.
The success of our business depends in part on our ability to protect and enforce our intellectual property rights.
We rely on a combination of patent, copyright, service mark, trademark, and trade secret laws, as well as confidentiality procedures and contractual restrictions, to establish and protect our proprietary rights, all of which provide only limited protection. As of August 15, 2013, we had 55 issued patents and 139 patent applications in the United States and 4 issued patents and 54 patent applications in foreign countries. We cannot assure you that any patents will issue with respect to our currently pending patent applications in a manner that gives us the protection that we seek, if at all, or that any patents issued to us will not be challenged, invalidated, or circumvented. Our currently issued patents
-27-
Table of Contents
and any patents that may issue in the future with respect to pending or future patent applications may not provide sufficiently broad protection or they may not prove to be enforceable in actions against alleged infringers. We cannot be certain that the steps we have taken will prevent unauthorized use of our technology or the reverse engineering of our technology. Moreover, others may independently develop technologies that are competitive to ours or infringe our intellectual property.
Protecting against the unauthorized use of our intellectual property, products, and other proprietary rights is expensive and difficult. Litigation may be necessary in the future to enforce or defend our intellectual property rights or to determine the validity and scope of the proprietary rights of others. Any such litigation could result in substantial costs and diversion of management resources, either of which could harm our business, operating results, and financial condition. Further, many of our current and potential competitors have the ability to dedicate substantially greater resources to defending intellectual property infringement claims and to enforcing their intellectual property rights than we have. Accordingly, we may not be able to prevent third parties from infringing upon or misappropriating our intellectual property. Effective patent, trademark, service mark, copyright, and trade secret protection may not be available in every country in which our products are available. An inability to adequately protect and enforce our intellectual property and other proprietary rights could seriously harm our business, operating results, and financial condition.
Our use of open source andthird-party technology could impose limitations on our ability to commercialize our software.
We use open source software in our products. Although we monitor our use of open source software closely, the terms of many open source licenses have not been interpreted by U.S. courts, and there is a risk that such licenses could be construed in a manner that imposes unanticipated conditions or restrictions on our ability to market our products. In such event, we could be required to seek licenses from third parties in order to continue offering our products for certain uses, to license portions of our source code at no charge, to re-engineer our technology or to discontinue offering some of our software in the event re-engineering cannot be accomplished on a timely basis, any of which could adversely affect our business, operating results, and financial condition.
If we do not successfully integrate our recent acquisitions, or if we do not otherwise achieve the expected benefits of the acquisitions, our growth may be adversely affected and our operating results may be materially harmed.
Since 2011, we have acquired three businesses. If we fail to successfully integrate the businesses, operations, and technologies of these acquired companies and assets, we may not realize the potential benefits of those acquisitions. The integration of these acquisitions, particularly the integration of NexGen, may be time-consuming and will result in the incurrence of ongoing expenses. If our integration efforts are not successful, our results of operations could be harmed, employee morale could decline, key employees could leave, and customers could cancel existing orders or choose not to place new ones. Even if our integration efforts are successful, we may not achieve anticipated synergies or other benefits of these acquisitions, including the anticipated benefits from the acquired technologies. We must operate as a combined organization utilizing common information and communication systems, operating procedures, financial controls and human resources practices. We may encounter difficulties, costs and delays involved in integrating these operations, including the following:
| • | failure to successfully manage relationships with channel partners, customers, and other important relationships; |
| • | failure to maintain product development timelines and introduce new features in a timely manner; |
-28-
Table of Contents
| • | failure of customers to purchase the new products of the combined company; |
| • | difficulties in successfully integrating the employees of the acquired companies; |
| • | challenges encountered in managing larger, more geographically dispersed operations; |
| • | loss of key employees; |
| • | diversion of the attention of management from other ongoing business concerns; |
| • | potential incompatibility of technologies and systems; |
| • | potential impairment charges incurred to write down the carrying amount of intangible assets generated as a result of the acquisitions; and |
| • | potential incompatibility of business cultures. |
If we do not meet the expectations of our existing customers or those of the acquired companies, then these customers may cease doing business with us altogether, which would harm our results of operations and financial condition.
We may further expand through acquisitions of, or investments in, other companies, each of which may divert our management’s attention, resulting in additional dilution to our stockholders and consumption of resources that are necessary to sustain and grow our business.
Our business strategy may, from time to time, include acquiring other complementary products, technologies, or businesses. We also may enter into relationships with other businesses in order to expand our product offerings, which could involve preferred or exclusive licenses, additional channels of distribution or discount pricing or investments in other companies. Negotiating these transactions can be time-consuming, difficult, and expensive, and our ability to close these transactions may be subject to third-party approvals, such as government regulation, which are beyond our control. Consequently, we can make no assurance that these transactions, once undertaken and announced, will close.
These kinds of acquisitions or investments may result in unforeseen operating difficulties and expenditures. In particular, we may encounter difficulties assimilating or integrating the businesses, technologies, products, personnel, or operations of the acquired companies, particularly if the key personnel of the acquired business choose not to work for us, and we may have difficulty retaining the customers of any acquired business. Acquisitions may also disrupt our ongoing business, divert our resources and require significant management attention that would otherwise be available for development of our business. Any acquisition or investment could expose us to unknown liabilities. Moreover, we cannot assure you that the anticipated benefits of any acquisition or investment would be realized or that we would not be exposed to unknown liabilities. In connection with these types of transactions, we may issue additional equity securities that would dilute our stockholders, use cash that we may need in the future to operate our business, incur debt on terms unfavorable to us or that we are unable to repay, incur large charges or substantial liabilities, encounter difficulties integrating diverse business cultures, and become subject to adverse tax consequences, substantial depreciation or deferred compensation charges. These challenges related to acquisitions or investments could adversely affect our business, operating results, and financial condition.
Because ourlong-term success depends, in part, on our ability to expand the sales of our products to customers located outside of the United States, our business is susceptible to risks associated with international operations.
We currently maintain operations outside of the United States. We have been expanding and intend to continue to expand these operations in the future. We have limited experience operating in
-29-
Table of Contents
foreign jurisdictions. Our inexperience in operating our business outside of the United States increases the risk that our international expansion efforts may not be successful. In addition, conducting and expanding international operations subjects us to new risks that we have not generally faced in the United States. These include: exposure to foreign currency exchange rate risk; difficulties in managing and staffing international operations; the increased travel, infrastructure, and legal compliance costs associated with multiple international locations; potentially adverse tax consequences; the burdens of complying with a wide variety of foreign laws, including trade barriers, and different legal standards; increased financial accounting and reporting burdens and complexities; political, social and economic instability abroad, terrorist attacks, and security concerns in general; and reduced or varied protection for intellectual property rights in some countries. The occurrence of any one of these risks could negatively affect our international business and, consequently, our business, operating results, and financial condition generally.
Adverse economic conditions or reduced datacenter spending may adversely impact our revenues and profitability.
Our operations and performance depend in part on worldwide economic conditions and the impact these conditions have on levels of spending on datacenter technology. Our business depends on the overall demand for datacenter infrastructure and on the economic health of our current and prospective customers. Weak economic conditions, or a reduction in datacenter spending, would likely adversely impact our business, operating results, and financial condition in a number of ways, including by reducing sales, lengthening sales cycles, and lowering prices for our products and services.
Governmental regulations affecting the import or export of products could negatively affect our revenue.
The U.S. and various foreign governments have imposed controls, export license requirements, and restrictions on the import or export of some technologies, especially encryption technology. In addition, from time to time, governmental agencies have proposed additional regulation of encryption technology, such as requiring the escrow and governmental recovery of private encryption keys. Governmental regulation of encryption technology and regulation of imports or exports, or our failure to obtain required import or export approval for our products, could harm our international and domestic sales and adversely affect our revenue. In addition, failure to comply with such regulations could result in penalties, costs, and restrictions on export privileges, which would harm our operating results.
We might require additional capital to support business growth, and this capital might not be available on acceptable terms, or at all.
We intend to continue to make investments to support our business growth and may require additional funds to respond to business challenges, including the need to develop new products or enhance our existing products, enhance our operating infrastructure and acquire complementary businesses and technologies. Accordingly, we may need to engage in equity or debt financings to secure additional funds. If we raise additional funds through further issuances of equity or convertible debt securities, our stockholders could suffer significant dilution, and any new equity securities we issue could have rights, preferences, and privileges superior to those of holders of our common stock. Any debt financing in the future could involve additional restrictive covenants relating to our capital raising activities and other financial and operational matters, which may make it more difficult for us to obtain additional capital and to pursue business opportunities, including potential acquisitions. We may not be able to obtain additional financing on terms favorable to us, if at all. If we are unable to obtain adequate financing or financing on terms satisfactory to us, when we require it, our ability to continue to support our business growth and to respond to business challenges could be significantly limited, and our business, operating results, financial condition, and prospects could be adversely affected.
-30-
Table of Contents
Our business is subject to the risks of earthquakes and other natural catastrophic events, and to interruption byman-made problems such as computer viruses or terrorism.
Our two largest facilities and our current contract manufacturers are located in the San Francisco Bay and Salt Lake City areas, which have heightened risks of earthquakes. We may not have adequate business interruption insurance to compensate us for losses that may occur from a significant natural disaster, such as an earthquake, which could have a material adverse impact on our business, operating results and financial condition. In addition, acts of terrorism or malicious computer viruses could cause disruptions in our or our customers’ businesses or the economy as a whole. To the extent that these disruptions result in delays or cancellations of customer orders or the deployment of our products, our business, operating results, and financial condition would be adversely affected.
Failure to comply with governmental laws and regulations could harm our business.
Our business is subject to regulation by various federal, state, local, and foreign governmental agencies, including agencies responsible for monitoring and enforcing employment and labor laws, workplace safety, product safety, environmental laws, consumer protection laws, anti-bribery laws, import/export controls, federal securities laws and tax laws, and regulations. In certain jurisdictions, these regulatory requirements may be more stringent than in the United States. Noncompliance with applicable regulations or requirements could subject us to investigations, sanctions, mandatory product recalls, enforcement actions, disgorgement of profits, fines, damages, and civil and criminal penalties, or injunctions. If any governmental sanctions are imposed, or if we do not prevail in any possible civil or criminal litigation, our business, operating results, and financial condition could be materially adversely affected. In addition, responding to any action will likely result in a significant diversion of management’s attention and resources and an increase in professional fees. Enforcement actions and sanctions could harm our business, operating results, and financial condition.
Risks Related to Our Common Stock
The trading price of our common stock is likely to be volatile, and an active, liquid, and orderly market for our common stock may not be sustained.
Our common stock is currently traded on the New York Stock Exchange, but we can provide no assurance that there will be active trading on that market or any other market in the future. If there is not an active trading market or if the volume of trading is limited, the price of our common stock could decline and holders of our common stock may have difficulty selling their shares. In addition, the trading price of our common stock may be highly volatile and could be subject to wide fluctuations in response to various factors, some of which are beyond our control. For example, after opening at $19.00 per share at the IPO, our common stock has experienced an intra-day trading high of $41.74 per share and a low of $10.66 per share through August 15, 2013. Some of the factors affecting our volatility include:
| • | price and volume fluctuations in the overall stock market from time to time; |
| • | significant volatility in the market price and trading volume of technology companies in general, and of companies in our industry; |
| • | actual or anticipated changes in our results of operations or fluctuations in our operating results; |
| • | whether our operating results meet the expectations of securities analysts or investors; |
| • | actual or anticipated changes in the expectations of investors or securities analysts; |
| • | actual or anticipated developments in our competitors’ businesses or the competitive landscape generally; |
-31-
Table of Contents
| • | litigation involving us, our industry or both; |
| • | regulatory developments in the United States, foreign countries or both; |
| • | general economic conditions and trends; |
| • | major catastrophic events; |
| • | sales of large blocks of our stock; or |
| • | departures of key personnel. |
The stock markets in general, and market prices for the securities of technology-based companies like ours in particular, have from time to time experienced volatility that often has been unrelated to the operating performance of the underlying companies. A certain degree of stock price volatility can be attributed to being a newly public company. These broad market and industry fluctuations may adversely affect the market price of our common stock, regardless of our operating performance. In several recent situations where the market price of a stock has been volatile, holders of that stock have instituted securities class action litigation against the company that issued the stock. If any of our stockholders were to bring a lawsuit against us, the defense and disposition of the lawsuit could be costly and divert the time and attention of our management and harm our operating results.
If securities analysts do not publish research or reports about our business, or if they downgrade our stock, the price of our stock could decline.
The trading market for our common stock is likely to be influenced by any research and reports that securities or industry analysts publish about us or our business. In the event securities or industry analysts cover our company and one or more of these analysts downgrade our stock or publish inaccurate or unfavorable research about our business, our stock price would likely decline. If one or more of these analysts ceases coverage of our company or fails to publish reports on us regularly, demand for our stock could decrease, which could cause our stock price and trading volume to decline.
We have never paid dividends on our common stock and we do not anticipate paying any cash dividends in the foreseeable future.
We have never declared or paid any dividends on our common stock. We intend to retain any earnings to finance the operation and expansion of our business, and we do not anticipate paying any cash dividends in the future. As a result, you may only receive a return on your investment in our common stock if the market price of our common stock increases.
We will continue to incur increased costs as a result of being a public company.
As a public company, we are incurring and will continue to incur significant legal, accounting, and other expenses that we did not incur as a private company. In addition, new rules implemented by the SEC and the New York Stock Exchange, require changes in corporate governance practices of public companies. We expect these rules and regulations to continue to increase our legal and financial compliance costs and to make some activities more time-consuming and costly. We will continue to incur additional costs associated with our public company reporting requirements. We expect these rules and regulations to make it more difficult and more expensive for us to obtain director and officer liability insurance, and we may be required to accept reduced policy limits and coverage or incur substantially higher costs to obtain the same or similar coverage. As a result, it may be more difficult for us to attract and retain qualified people to serve on our board of directors or as executive officers.
-32-
Table of Contents
Provisions in our certificate of incorporation and bylaws and under Delaware law might discourage, delay, or prevent a change of control of our company or changes in our management and, therefore, depress the trading price of our common stock.
Our certificate of incorporation and bylaws contain provisions that could depress the trading price of our common stock by acting to discourage, delay, or prevent a change of control of our company or changes in our management that the stockholders of our company may deem advantageous. These provisions:
| • | establish a classified board of directors so that not all members of our board of directors are elected at one time; |
| • | authorize the issuance of “blank check” preferred stock that our board of directors could issue to increase the number of outstanding shares to discourage a takeover attempt; |
| • | prohibit stockholder action by written consent, which requires all stockholder actions to be taken at a meeting of our stockholders; |
| • | prohibit stockholders from calling a special meeting of our stockholders; |
| • | provide that the board of directors is expressly authorized to make, alter, or repeal our bylaws; and |
| • | establish advance notice requirements for nominations for elections to our board of directors or for proposing matters that can be acted upon by stockholders at stockholder meetings. |
Additionally, we are subject to Section 203 of the Delaware General Corporation Law, which generally prohibits a Delaware corporation from engaging in any of a broad range of business combinations with any “interested” stockholder for a period of three years following the date on which the stockholder became an “interested” stockholder and which may discourage, delay, or prevent a change of control of our company.
Any provision of our certificate of incorporation or bylaws or Delaware law that has the effect of delaying or deterring a change in control could limit the opportunity for our stockholders to receive a premium for their shares of our common stock, and could also affect the price that some investors are willing to pay for our common stock.
Part I. Item 1B.Unresolved Staff Comments
None.
Our headquarters occupy approximately 153,000 square feet in Salt Lake City, Utah under leases that expire in September 2021. We have an option to extend these leases to September 2026. Our principal office for sales and marketing occupies approximately 79,000 square feet in San Jose, California, under a lease that expires in March 2019. We lease space in locations throughout the United States and various international locations for operations and sales personnel. We believe that our current facilities are adequate to meet our ongoing needs and that, if we require additional space, we will be able to obtain additional facilities on commercially reasonable terms.
-33-
Table of Contents
Part I. Item 3.Legal Proceedings
On February 7, 2012, Entorian Technologies L.P., filed a lawsuit in the U.S. District Court for the District of Utah against our company. The complaint alleged that memory stacks included in some of our products infringe U.S. Patent No. 5,420,751, or the ‘751 patent, which expired in May 2012. Polystak, Inc. is our third-party supplier of the accused memory stack component. On March 1, 2012, Polystak filed a lawsuit against Entorian Technologies in the U.S. District Court for the Northern District of California. The complaint alleges that the ‘751 patent is invalid, and that Polystak’s memory stacks do not infringe the ‘751 patent. On March 8, 2012, Entorian Technologies dismissed the lawsuit against us in Utah. On March 9, 2012, Entorian Technologies filed a counterclaim against us and Polystak in the Northern District of California lawsuit. The counterclaim alleges that Fusion-io and Polystak infringe the ‘751 patent and seeks damages, but it does not seek an injunction. On September 4, 2012, the Court stayed this lawsuit pending reexamination of the ‘751 patent by the U.S. Patent Office. Polystak has agreed to indemnify and defend us with respect to these lawsuits.
On May 18, 2011, Internet Machines LLC filed a lawsuit in U.S. District Court for the Eastern District of Texas against us and 20 other companies. The complaint alleges that our products infringe U.S. Patent Nos. 7,454,552; 7,421,532; 7,814,259; and 7,945,722. On August 26, 2011, Internet Machines MC LLC amended its prior complaint filed in the U.S. District Court for the Eastern District of Texas against PLX Technology, Inc. to add our company and several other companies as defendants. This complaint alleges that our products infringe U.S. Patent No. 7,539,190. These complaints seek both damages and a permanent injunction against us. The specific infringement allegations appear to focus on a PCI switch component that, while used in some of our products, is manufactured by a third-party supplier. This third-party supplier was found to infringe the above identified U.S. Patent Nos. 7,454,552 and 7,421,532 by a jury in a prior case. The judge has stayed the lawsuits against us pending the entry of a final non-appealable judgment in the prior case between the third-party supplier and Internet Machines. The third-party supplier has agreed to indemnify and defend us with respect to these lawsuits.
Based on our preliminary investigations of the patents identified in the Entorian Technologies and Internet Machines complaints, we do not believe that our products infringe any valid or enforceable claim of the patents at issue in those complaints. Nevertheless, the costs associated with any actual, pending, or threatened litigation could negatively impact our operating results regardless of the actual outcome. In addition, we may, from time to time, be involved in various legal proceedings arising from the normal course of business activities, and an unfavorable resolution of any of these matters could materially affect our future results of operations, cash flows, or financial position.
Part I. Item 4.Mine Safety Disclosures
None.
-34-
Table of Contents
Part II. Item 5.Market for Registrant’s Common Equity, Related Stockholder Matters and Issuer Purchases of Equity Securities
Market for Our Common Stock
Our common stock began trading publicly on the New York Stock Exchange under the ticker symbol “FIO” on June 9, 2011. Prior to that time, there was no public market for our common stock. The following table sets forth, for the period indicated, the high and low sale prices of our common stock as reported by the New York Stock Exchange since our initial public offering, or IPO.
| High | Low | |||||||
Fiscal 2011 | ||||||||
Fourth Quarter (beginning June 9, 2011 through June 30, 2011) | $ | 36.98 | $ | 19.28 | ||||
Fiscal 2012 | ||||||||
First Quarter | $ | 35.67 | $ | 14.90 | ||||
Second Quarter | $ | 41.74 | $ | 16.83 | ||||
Third Quarter | $ | 33.87 | $ | 21.84 | ||||
Fourth Quarter | $ | 29.61 | $ | 17.45 | ||||
Fiscal 2013 | ||||||||
First Quarter | $ | 31.46 | $ | 17.70 | ||||
Second Quarter | $ | 32.63 | $ | 21.14 | ||||
Third Quarter | $ | 24.18 | $ | 15.10 | ||||
Fourth Quarter | $ | 20.20 | $ | 12.72 | ||||
On August 15, 2013, the closing stock price of our common stock was $10.80.
Holders of Record
As of August 15, 2013, there were approximately 52 holders of record of our common stock. This figure does not include a substantially greater number of “street name” holders or beneficial holders of our common stock whose shares are held of record by banks, brokers, and other financial institutions.
Stock Performance Graph and Cumulative Total Return
Notwithstanding any statement to the contrary in any of our previous or future filings with the SEC, the following information relating to the price performance of our common stock shall not be deemed to be “filed” with the SEC or to be “soliciting material” under the Securities Exchange Act of 1934, as amended, or the Exchange Act, and it shall not be deemed to be incorporated by reference into any of our filings under the Securities Act or the Exchange Act, except to the extent we specifically incorporate it by reference into such filing.
-35-
Table of Contents
The following graph shows a comparison from June 9, 2011 (the date our common stock commenced trading on the New York Stock Exchange) through June 30, 2013 of the cumulative total return assuming a $100 investment in our common stock, the S&P 500 Index and the S&P 500 Information Technology Sector Index. Data for the S&P 500 Index and the S&P 500 Information Technology Sector Index assume reinvestment of dividends. The comparisons in this graph below are based on historical data and are not intended to forecast or be indicative of future performance of our common stock.
Comparison of Cumulative Total Return amongFusion-io, Inc., The S&P 500
and The S&P 500 Information Technology Sector Index
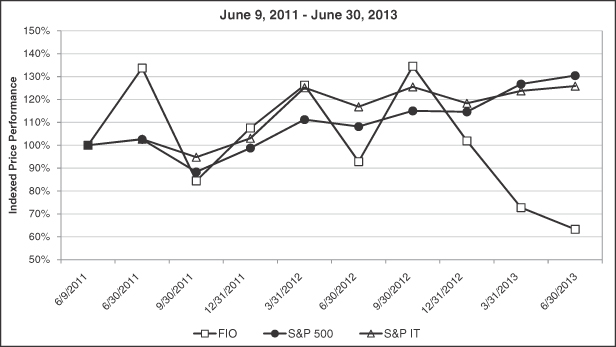
Dividend Policy
We have never declared or paid any cash dividend on our capital stock. We currently intend to retain any future earnings and do not expect to pay any dividends in the foreseeable future. Any future determination to declare cash dividends will be made at the discretion of our board of directors, subject to applicable laws, and will depend on our financial condition, results of operations, capital requirements, general business conditions, and other factors that our board of directors may deem relevant.
Equity Plan Information
Our equity plan information required by this item is incorporated by reference to the information in Part III, Item 12 of this annual report onForm 10-K.
Sales of Unregistered Securities
Acquisition of NexGen
In April 2013, in connection with the acquisition of NexGen we issued 339,627 shares of our common stock to stockholders of NexGen, which is subject to a repurchase right that lapses in 12
-36-
Table of Contents
equal quarterly installments. These shares were not registered under the Securities Act of 1933, as amended, or the Securities Act. In issuing these shares, we relied on the exemptions from registration under the Securities Act provided by Section 4(2) of the Securities Act and/or the private offering safe harbor provision of Rule 506 of Regulation D promulgated thereunder based and Regulation S promulgated by the SEC under the Securities Act, based in part on representations made by the intended recipients of such shares as to their status as accredited investors and non-U.S. persons and the determination that, in some cases, the transactions were exempt from registration as not involving an offer or sale within the meaning of the Securities Act.
Use of Proceeds from Registered Securities
Our initial public offering of common stock was made pursuant to a registration statement on Form S-1 (File No. 333-172683), which the SEC declared effective on June 8, 2011. As a result of the offering, we raised approximately $218.9 million in proceeds, net of underwriting discounts, commissions, and offering expenses. Through June 30, 2013, we used the net IPO proceeds to complete the acquisitions of IO Turbine, Inc., or IO Turbine, the ID7 Entities, and NexGen, and for working capital and general corporate purposes, including expansion of our sales organization and further development and expansion of our product offerings.
Purchases of Equity Securities by the Issuer and Affiliated Purchasers
None.
Trading Plans
Our Insider Trading Policy permits directors, officers, and other employees covered under the policy to establish, subject to certain conditions and limitations set forth in the policy, written trading plans which are intended to comply withRule 10b5-1 under the Securities Exchange Act, which permit automatic trading of common stock ofFusion-io, Inc. or trading of common stock by an independent person (such as a stockbroker) who is not aware of material, nonpublic information at the time of the trade. We are aware that certain of our directors and officers have entered into written trading plans, and we believe our directors and officers may establish such programs in the future.
-37-
Table of Contents
Part II. Item 6.Selected Financial Data
The following selected financial data should be read in conjunction with the consolidated financial statements and related notes thereto appearing elsewhere in this annual report onForm 10-K. We have derived the consolidated statement of operations data for fiscal years ended June 30, 2011, 2012, and 2013 and consolidated balance sheet data as of June 30, 2012 and 2013 from audited consolidated financial statements included elsewhere in this report. The consolidated statement of operations data for fiscal years ended June 30, 2009 and 2010 and consolidated balance sheet data as of June 30, 2009, 2010, and 2011 were derived from audited consolidated financial statements that are not included in this annual report onForm 10-K. You should read the following selected consolidated financial data with “Management’s Discussion and Analysis of Financial Condition and Results of Operations”, our consolidated financial statements, and the notes to consolidated financial statements, which are included in this annual report onForm 10-K.
SELECTED CONSOLIDATED FINANCIAL DATA
| Year Ended June 30, | ||||||||||||||||||||
| 2009 | 2010 | 2011 | 2012 | 2013 | ||||||||||||||||
| (In thousands, except for per share data) | ||||||||||||||||||||
Consolidated Statements of Operations Data: | ||||||||||||||||||||
Revenue | $ | 10,150 | $ | 36,216 | $ | 197,204 | $ | 359,349 | $ | 432,386 | ||||||||||
Gross profit | 5,150 | 20,198 | 113,161 | 200,304 | 254,471 | |||||||||||||||
Total operating expenses | 30,032 | 51,746 | 103,492 | 205,600 | 291,387 | |||||||||||||||
(Loss) income from operations | (24,882 | ) | (31,548 | ) | 9,669 | (5,296 | ) | (36,916 | ) | |||||||||||
Net (loss) income | $ | (25,573 | ) | $ | (31,716 | ) | $ | 4,555 | $ | (5,583 | ) | $ | (38,226 | ) | ||||||
Net (loss) income attributable to common stockholders | $ | (25,573 | ) | $ | (32,464 | ) | $ | 4,555 | $ | (5,583 | ) | $ | (38,226 | ) | ||||||
Net (loss) income per common share, basic | $ | (3.27 | ) | $ | (2.95 | ) | $ | 0.27 | $ | (0.06 | ) | $ | (0.40 | ) | ||||||
Net (loss) income per common share, diluted | $ | (3.27 | ) | $ | (2.95 | ) | $ | 0.06 | $ | (0.06 | ) | $ | (0.40 | ) | ||||||
| As of June 30, | ||||||||||||||||||||
| 2009 | 2010 | 2011 | 2012 | 2013 | ||||||||||||||||
| (In thousands) | ||||||||||||||||||||
Consolidated Balance Sheet Data: | ||||||||||||||||||||
Cash, cash equivalents, andshort-term investments(1),(2) | $ | 17,533 | $ | 21,193 | $ | 219,604 | $ | 321,239 | $ | 238,351 | ||||||||||
Inventories | 3,993 | 25,148 | 35,622 | 59,457 | 71,160 | |||||||||||||||
Working capital(1),(2) | 17,485 | 32,157 | 270,079 | 386,973 | 304,705 | |||||||||||||||
Total assets(1) | 28,216 | 59,452 | 317,286 | 541,020 | 607,448 | |||||||||||||||
Current andlong-term deferred revenue | 838 | 839 | 12,017 | 28,869 | 39,015 | |||||||||||||||
Current andlong-term notes payable and capital lease obligations | 279 | 444 | 108 | — | — | |||||||||||||||
Total liabilities | 7,067 | 21,048 | 42,842 | 80,097 | 117,031 | |||||||||||||||
Total stockholders’ (deficit) equity(1) | (35,647 | ) | (66,109 | ) | 274,444 | 460,923 | 490,417 | |||||||||||||
| (1) | The significant increase in this item from fiscal 2010 to 2011 was primarily due to our IPO, which was effective in June 2011, and the receipt of net proceeds of $218.9 million. The significant increase in this item from fiscal 2011 to 2012 was primarily due to our follow-on public offering of our common stock, which was effective in November 2011, and the receipt of net proceeds of $94.0 million. |
| (2) | The significant decrease in this item from fiscal 2012 to fiscal 2013 was primarily due to the cash consideration transferred of $5.9 million and $109.0 million related to our acquisitions of ID7 in March 2013 and NexGen in April 2013, respectively. |
-38-
Table of Contents
Part II. Item 7.Management’s Discussion and Analysis of Financial Condition and Results of Operations
The following discussion and analysis should be read together with our consolidated financial statements and the notes to those statements included elsewhere in this annual report onForm 10-K. This discussion containsforward-looking statements based on our current expectations, assumptions, estimates, and projections aboutFusion-io and our industry. Theseforward-looking statements involve risks and uncertainties. Our actual results could differ materially from those indicated in theseforward-looking statements as a result of certain factors, as more fully described in “Risk Factors” in Item 1A of thisForm 10-K, in this Item 7, and elsewhere in thisForm 10-K. We undertake no obligation to update publicly anyforward-looking statements for any reason, even if new information becomes available or other events occur in the future.
Overview
We provide solutions for enterprises, hyperscale datacenters, and small to medium enterprises that accelerate databases, virtualization, cloud computing, big data, information systems, and the applications that help drive business from the smallest e-tailers to some of the world’s largest data centers, social media leaders, and Fortune Global 500 businesses. Our integrated hardware and software platforms enable the acceleration of data away from legacy architectures and proprietary hardware. This core technology leverages flash memory to significantly increase datacenter and computer-based information system efficiency, with enterprise grade performance, reliability, availability, and manageability.
We were incorporated in December 2005 and we have experienced significant growth with revenue increasing from $197.2 million in fiscal 2011 to $359.3 million in fiscal 2012 and to $432.4 million in fiscal 2013. Our headcount increased from 441 employees as of June 30, 2011 to 669 employees as of June 30, 2012 and to 938 employees as of June 30, 2013.
We sell our products through our global direct sales force, OEMs, including Cisco, Dell, HP, and IBM, and other channel partners. Some of our OEMs and channel partners integrate our platform into their own proprietary product offerings. Our primary sales office is located in San Jose, California, and we also have additional sales presence in North America, Europe, and Asia.
Large purchases by a limited number of customers have accounted for a substantial majority of our revenue, and the composition of the group of our largest customers changes from period to period. Some of our customers make concentrated purchases to complete or upgrade specific large-scale data storage installations. These concentrated purchases are short-term in nature and are typically made on a purchase order basis rather than pursuant to long-term contracts. During fiscal 2011, 2012, and 2013, sales to the 10 largest customers in each period, including the applicable OEMs, accounted for approximately 92%, 91%, and 84% of revenue, respectively. Our direct customer Facebook, Apple, through a reseller, and OEM customer HP, each accounted for 30%, 25%, and 17% of our revenue, respectively, in fiscal 2012 and 29%, 15%, and 17% of our revenue, respectively, in fiscal 2013. As a result of our revenue concentrations, our quarterly and annual revenue and operating results are likely to fluctuate in the future and will be difficult to estimate. We expect that sales to a limited number of customers will continue to contribute materially to our revenue for the foreseeable future.
We anticipate that sales through OEMs and other channel partners will continue to constitute a substantial portion of our future revenue. In some cases, our products must be designed or qualified into the OEM’s products. If that fails to occur for a given product line of an OEM, we would likely be unable to sell our products to that OEM during the life cycle of that product, which would adversely affect our revenue. We expect that as we continue to expand our global presence and business overseas, we will increasingly depend on our OEM relationships in such markets.
-39-
Table of Contents
We believe that extending our platform differentiation through software and hardware innovation will be critical to achieving broader market acceptance and to maintaining or increasing our gross margins. In this regard, our ioTurbine virtualization acceleration software, ION Data Accelerator software, ioControl software, ioSphere management software, and specialized storage memory programming software interface extensions that allow Integrated Software Vendors to develop, integrate, and add significant value to applications using our platforms are important strategic investments that differentiate our products from hardware competitors. We invest in hardware qualification so that we can apply the value of our software to new non-volatile technologies as they become available. We also invest in new hardware controllers to ensure that our products are competitive in performance, reliability, power, and density. If we are unable to successfully develop or acquire hardware or software technology, and then market and sell additional functionality, our ability to increase our revenue and gross margins could be adversely affected.
Our ioMemory technology forms the basis of our hardware offering and is designed as a portfolio of upgradeable design modules, enabling faster time-to-market and increased extensibility, and it provides server-based storage class memory, low access latency, field upgradeability, deep error correction, self-healing protection, and native PCI-Express connectivity. Our second generation ioMemory technology supports the latest NAND geometries, significantly increases performance and capacity, improves reliability while retaining the ability to build storage systems of varying capacity, performance, and form factors. At the heart of the ioMemory technology is our proprietary field programmable data path controller. It connects a large array of non-volatile memory chips natively to the server’s PCI-Express 1.0 or 2.0 peripheral bus, and addresses the reliability issues of non-volatile memory with our Adaptive Flashback Protection advanced chip-level fault tolerance technology, which is capable of restoring, correcting, and resurrecting lost data in the flash-based storage sub-system. Our ioScale product is derived from our ioMemory platform and is specifically designed for the unique needs of the high-volume hyperscale market.
We outsource manufacturing of our hardware products using a limited number of contract manufacturers. We procure a majority of the components used in our products directly from third-party vendors and have them delivered to our contract manufacturers for manufacturing and assembly. Once our contract manufacturers perform sub-assembly and assembly quality tests, they are assembled to our specified configurations. We perform final manufacturing assurance tests, labeling, final configuration, including a final firmware installation and shipment to our customers.
As a consequence of the rapidly evolving nature of our business and our limited operating history, we believe that period-to-period comparisons of revenue and other operating results, including gross margin and operating expenses as a percentage of our revenue should not be relied upon as indications of future performance. Although we have experienced significant percentage growth in our revenue, we do not believe that our historical growth rates are likely to be sustainable or indicative of future growth.
Recent Developments
In April 2013, we acquired 100% of the stock of NexGen Storage, Inc., or NexGen, a developer of hybrid storage systems based in Louisville, Colorado. The acquisition of NexGen adds to our storage solution portfolio and expands our reach into small to medium enterprises. The consideration for the NexGen acquisition was $110.7 million, consisting of (i) $109.0 million in cash, (ii) $1.4 million in assumed stock options, and (iii) $0.3 million related to the elimination of intercompany balances. In addition, we agreed to pay $5.0 million in cash to one of the selling stockholders in 12 equal quarterly installments and 339,627 in shares of our common stock to another selling stockholder, which is subject to a repurchase right that lapses in 12 equal quarterly installments. The quarterly installments for both the cash and restricted stock amounts are subject to ongoing employment requirements. As
-40-
Table of Contents
such, the associated compensation expense will be recognized over the service period. We also assumed NexGen’s options and restricted stock units that were unvested at the time of the merger that were converted into unvested options to purchase 822,927 shares of our common stock and 84,808 of our restricted stock units. Subsequent to the acquisition, we will recognize over the underlying future service period up to approximately $23.7 million of compensation expense related to the fair value of the cash, restricted stock, and the assumed stock-based awards. The assets, liabilities and operating results of NexGen are reflected in our consolidated financial statements following the date of acquisition.
In March 2013, we acquired 100% of the stock of ID7 Ltd. and SCST Limited, together the ID7 Entities, for total cash consideration of approximately $5.9 million. The ID7 Entities, located in England and Wales, are the primary developers of the SCST storage subsystem enabling enhanced shared storage software functionality for any Linux server or appliance. In connection with the acquisition, we issued 135,131 shares of our common stock to the former shareholders of the ID7 Entities, which is subject to a repurchase right, that lapse 25% after one year and the remaining 75% in 12 equal quarterly installments thereafter. Subsequent to the acquisition, we will recognize over the underlying future service period up to approximately $2.4 million of stock-based compensation expense related to the fair value of the restricted stock awards. The assets, liabilities and operating results of the ID7 Entities are reflected in our consolidated financial statements following the date of acquisition.
Components of Consolidated Statements of Operations
Revenue
We derive revenue primarily from the sale of our storage class memory products and support services. We sell our solutions through our global direct sales force, OEMs, and other channel partners. We provide our support services pursuant to support contracts, which involve hardware support, software support, and software upgrades on a when-and-if available basis for a period of one to five years. Revenue from support services for fiscal 2011, 2012, and 2013 represented $4.5 million, $14.6 million, and $34.8 million, respectively. For all periods presented, our software revenue was not significant to our consolidated statement of operations.
Cost of Revenue
Cost of revenue consists primarily of material costs including amounts paid to our suppliers and contract manufacturers for hardware components and assembly of those components into our products. The largest portion of our cost of revenue consists of the cost of non-volatile memory components. Given the commodity nature of memory components, neither we nor our contract manufacturers generally enter into long-term supply contracts for our product components, which can cause our cost of revenue to fluctuate. Cost of revenue is recorded when the related product revenue is recognized. Cost of revenue also includes costs related to allocated personnel expenses related to customer support, warranty costs, costs of shipping, manufacturing operations, amortization of intangible assets, costs of licensed technology, and carrying value adjustments recorded for excess and obsolete inventory.
Operating Expenses
The largest component of our operating expenses is personnel costs, consisting of salaries, benefits, and incentive compensation for our employees, which includes stock-based compensation. Our headcount increased from 441 employees as of June 30, 2011 to 669 employees as of June 30, 2012, and to 938 employees as of June 30, 2013. As a result, operating expenses have increased significantly over these periods.
-41-
Table of Contents
Sales and Marketing
Sales and marketing expenses consist primarily of personnel costs, including incentive compensation, product demonstration expenses, travel-related costs, facilities-related costs, depreciation associated with sales and marketing acquired assets, contract labor and consulting expenses associated with sales and marketing activities, and amortization of intangible assets.
Research and Development
Research and development expenses consist primarily of personnel costs, including incentive compensation, depreciation associated with research and development acquired assets, contract labor and consulting services, amortization of intangible assets, facilities-related costs, travel-related costs, and prototype expenses. We expense research and development costs as incurred.
General and Administrative
General and administrative expenses consist primarily of personnel costs, including incentive compensation, legal expenses, depreciation expense, facilities-related expenses for our executive, finance, human resources, information technology, and legal organizations, consulting and professional services, and travel-related costs.
Other income (expense), net
Other income (expense), net consists of changes in the fair value of a derivative related to a repurchase of our common stock, interest expense, interest income, and transactional foreign currency gains and losses.
Trends in Our Business
Gross Margin
Our gross margin will vary due to product mix and pricing, customer demand, and cost of materials. We anticipate gross margin to decrease in fiscal 2014 compared to fiscal 2013 as a result of our growth strategy.
Sales and Marketing
We plan to continue to invest in sales by increasing our sales headcount. Our sales personnel are typically not immediately productive and therefore the increase in sales and marketing expense when we add new sales representatives is not immediately offset by increased revenue and may not result in increased revenue over the long-term. We expect sales and marketing expenses to increase in absolute dollars as we expect to continue hiring new sales representatives. We also expect to expand marketing activities to drive sales opportunities and brand awareness.
Research and Development
We expect to continue to devote substantial resources to the development of our products including the development of new products. We believe that these investments are necessary to maintain and improve our competitive position. We expect research and development expenses to increase in absolute dollars as we expect to continue to invest in additional engineering personnel and infrastructure required to support the development of new products and to enhance existing products.
-42-
Table of Contents
General and Administrative
While we expect personnel costs, including stock-based compensation expense, to be the primary component of general and administrative expenses, we also expect to continue to incur significant legal and accounting costs related to compliance with rules and regulations applicable to public companies. We expect that general and administrative expenses will continue to increase in absolute dollars primarily due to general growth of the business, infrastructure costs to support our growth, and in legal costs related to intellectual property.
Results of Operations for the Fiscal Years Ended June 30, 2011, 2012, and 2013
Revenue
The following table presents our revenue for the periods indicated and related changes as compared to the prior periods (dollars in thousands):
| Year Ended June 30, | Change in $ | Change in % | Year Ended June 30, | Change in $ | Change in % | |||||||||||||||||||||||||||
| 2011 | 2012 | 2012 | 2013 | |||||||||||||||||||||||||||||
Revenue | $ | 197,204 | $ | 359,349 | $ | 162,145 | 82 | % | $ | 359,349 | $ | 432,386 | $ | 73,037 | 20 | % | ||||||||||||||||
2011 Compared to 2012. Revenue increased $162.1 million from fiscal 2011 to fiscal 2012, primarily due to the increase in the overall volume of our products shipped.
2012 Compared to 2013. Revenue increased $73.0 million from fiscal 2012 to fiscal 2013, primarily due to the increase in the overall volume of our products shipped.
Revenue from our 10 largest customers, including the applicable OEMs, for each fiscal year was 92%, 91%, and 84% of revenue for fiscal 2011, 2012, and 2013, respectively. Our direct customer Facebook, Apple, through a reseller, and OEM customer HP, each accounted for 30%, 25%, and 17% of our revenue, respectively, in fiscal 2012 and 29%, 15%, and 17% of our revenue, respectively, in fiscal 2013. No other customer accounted for 10% or greater of revenue in fiscal 2012 and 2013. Revenue from customers with aship-to location in the United States accounted for 82%, 74%, and 60% of revenue for fiscal 2011, 2012, and 2013, respectively.
Cost of Revenue and Gross Margin
The following table presents our cost of revenue and gross margin for the periods indicated and related changes as compared to the prior periods (dollars in thousands):
| Year Ended June 30, | Change in $ | Change in % | Year Ended June 30, | Change in $ | Change in % | |||||||||||||||||||||||||||
| 2011 | 2012 | 2012 | 2013 | |||||||||||||||||||||||||||||
Cost of revenue | $ | 84,043 | $ | 159,045 | $ | 75,002 | 89 | % | $ | 159,045 | $ | 177,915 | $ | 18,870 | 12 | % | ||||||||||||||||
Gross profit | 113,161 | 200,304 | 87,143 | 77 | % | 200,304 | 254,471 | 54,167 | 27 | % | ||||||||||||||||||||||
Gross margin(1) | 57 | % | 56 | % | 56 | % | 59 | % | ||||||||||||||||||||||||
| (1) | We define gross margin as our gross profit expressed as a percentage of total revenues |
2011 Compared to 2012. Cost of revenue increased $75.0 million and gross profit increased $87.1 million from fiscal 2011 to fiscal 2012, primarily due to the increase in the volume of our products shipped. Our gross margin decreased from fiscal 2011 to fiscal 2012 due to higher raw material costs associated with the early stage of the ioDrive2 product lifecycle and also related to product mix.
-43-
Table of Contents
2012 Compared to 2013. Cost of revenue increased $18.9 million from fiscal 2012 to fiscal 2013 primarily due to the increase in the volume of our products shipped and for litigation settlement related expenses of $4.1 million. Our gross profit increased $54.2 million and our gross margin increased from fiscal 2012 to fiscal 2013 primarily due to the increase in the volume of our products shipped, lower raw material costs, and product mix, partially offset by litigation settlement related expenses of $4.1 million.
Operating Expenses
Sales and Marketing
The following table presents our sales and marketing expenses for the periods indicated and related changes as compared to the prior periods (dollars in thousands):
| Year Ended June 30, | Change in $ | Change in % | Year Ended June 30, | Change in $ | Change in % | |||||||||||||||||||||||||||
| 2011 | 2012 | 2012 | 2013 | |||||||||||||||||||||||||||||
Sales and marketing | $ | 55,698 | $ | 87,171 | $ | 31,473 | 57 | % | $ | 87,171 | $ | 126,508 | $ | 39,337 | 45 | % | ||||||||||||||||
2011 Compared to 2012. Sales and marketing expenses increased $31.5 million from fiscal 2011 to fiscal 2012, primarily due to an increase in sales and marketing personnel, as we hired additional employees to focus on acquiring new customers and expanding our business. This increase in headcount resulted in a $23.5 million increase inpersonnel-related costs, including a $3.0 million increase in sales commissions. The majority of the remaining increase in sales and marketing expenses from fiscal 2011 to fiscal 2012 was due to a $2.9 million increase in product demonstration expenses, a $2.0 million increase intravel-related costs, and a $0.5 million increase in consulting services.
2012 Compared to 2013. Sales and marketing expenses increased $39.3 million from fiscal 2012 to fiscal 2013, primarily due to an increase in sales and marketing personnel, as we hired additional employees to focus on acquiring new customers and expanding our business. This increase in headcount resulted in a $30.2 million increase in personnel-related costs, including a $13.3 million increase in sales commissions and a $3.7 million increase in stock-based compensation. The increase was also due to a $4.8 million increase in product demonstration costs and a $2.9 million increase in travel-related expenses.
Research and Development
The following table presents our research and development expenses for the periods indicated and related changes as compared to the prior periods (dollars in thousands):
| Year Ended June 30, | Change in $ | Change in % | Year Ended June 30, | Change in $ | Change in % | |||||||||||||||||||||||||||
| 2011 | 2012 | 2012 | 2013 | |||||||||||||||||||||||||||||
Research and development | $ | 27,238 | $ | 60,006 | $ | 32,768 | 120 | % | $ | 60,006 | $ | 95,458 | $ | 35,452 | 59 | % | ||||||||||||||||
2011 Compared to 2012. Research and development expenses increased $32.8 million from fiscal 2011 to fiscal 2012, primarily due to an increase in research and development personnel, resulting in a $22.5 million increase inpersonnel-related costs. The increase was also due to a $3.1 million increase in manufacturing costs for new product prototypes, a $2.3 million increase in amortization expense for an intangible asset for developed technology acquired in the IO Turbine acquisition, a $1.7 million increase in engineering outside services, and a $1.0 million increase in depreciation expense.
-44-
Table of Contents
2012 Compared to 2013. Research and development expenses increased $35.5 million from fiscal 2012 to fiscal 2013, primarily due to an increase in research and development personnel, resulting in a $30.5 million increase inpersonnel-related costs, which includes a $9.8 million increase in stock-based compensation. The increase was also due to a $2.4 million increase in contract labor and consulting expense and a $2.2 million increase in depreciation expense.
General and Administrative
The following table presents our general and administrative expenses for the periods indicated and related changes as compared to the prior periods (dollars in thousands):
| Year Ended June 30, | Change in $ | Change in % | Year Ended June 30, | Change in $ | Change in % | |||||||||||||||||||||||||||
| 2011 | 2012 | 2012 | 2013 | |||||||||||||||||||||||||||||
General and administrative | $ | 20,556 | $ | 58,423 | $ | 37,867 | 184 | % | $ | 58,423 | $ | 69,421 | $ | 10,998 | 19 | % | ||||||||||||||||
2011 Compared to 2012. General and administrative expenses increased $37.9 million from fiscal 2011 to fiscal 2012, primarily due to an increase instock-based compensation of $22.8 million, of which $5.2 million specifically related tonon-employee stock option awards and the significant increase in the fair value of these awards from period to period and $3.8 million related to the acceleration of vesting of certain restricted stock awards assumed in connection with the acquisition of IO Turbine. In addition, an increase in the number of general and administrative personnel contributed to the increased expense. These increases contributed to a $26.8 million increase inpersonnel-related costs. The majority of the remaining increase was due to a $2.9 million increase in legal and professional accounting services, a $1.3 million increase in acquisition related costs due to the acquisition of IO Turbine, a $1.1 million increase in rent expense, and a $0.9 million increase in consulting costs.
2012 Compared to 2013. General and administrative expenses increased $11.0 million from fiscal 2012 to fiscal 2013, primarily due to an increase of $3.2 million in legal fees principally for the S4 litigation, an increase of $2.8 million in litigation settlement related expenses, an increase of $2.5 million in depreciation expense, and an increase of $0.7 million in software related expenses.
Other Income (Expense), net
The following table presents our net other income (expense) for the periods indicated and related changes as compared to the prior periods (dollars in thousands):
| Year Ended June 30, | Change in $ | Change in % | Year Ended June 30, | Change in $ | Change in % | |||||||||||||||||||||||||||
| 2011 | 2012 | 2012 | 2013 | |||||||||||||||||||||||||||||
Other income (expense), net | $ | (3,420 | ) | $ | 328 | $ | 3,748 | 110 | % | $ | 328 | $ | 194 | $ | (134 | ) | 41 | % | ||||||||||||||
2011 Compared to 2012. Other income (expense), net changed by $3.7 million from fiscal 2011 to fiscal 2012, primarily due to a decrease in interest expense of $2.3 million, which was primarily the result of a change in the fair value of a preferred stock warrant, and a decrease of $1.1 million in other expense, which was primarily the result of a change in the fair value of a common stock repurchase derivative liability.
2012 Compared to 2013. Other income (expense), net changed by $0.1 million from fiscal 2012 to fiscal 2013, primarily due to the net change in the fair value of a common stock repurchase derivative liability during the first six months of fiscal 2012, which liability was paid in full in December 2011.
-45-
Table of Contents
Income Tax Expense
The following table presents our income tax expense for the periods indicated and related changes as compared to the prior periods (dollars in thousands):
| Year Ended June 30, | Change in | Year Ended June 30, | Change in | |||||||||||||||||||||||||||||
| 2011 | 2012 | $ | % | 2012 | 2013 | $ | % | |||||||||||||||||||||||||
Income tax expense | $ | 1,694 | $ | 615 | $ | (1,079 | ) | (64 | )% | $ | 615 | $ | 1,504 | $ | 889 | 145 | % | |||||||||||||||
2011 Compared to 2012. Income tax expense changed by $1.1 million, primarily due to a tax benefit we received in fiscal 2012 as a result of a partial reversal of the valuation allowance against our deferred tax assets as a result of a deferred tax liability recognized in connection with the acquisition of IO Turbine, as well as a tax provision benefit received related tostock-based awards. These were partially offset by state income taxes and foreign income taxes on current income in jurisdictions for which net operating loss carryforwards were not available as well as U.S. federal alternative minimum tax.
2012 Compared to 2013. Income tax expense changed by $0.9 million, primarily due to a tax benefit we received in fiscal 2012 as a result of a partial reversal of the valuation allowance against our deferred tax asset as a result of a deferred tax liability recognized in connection with the acquisition of IO Turbine. Without this tax benefit, the year over year change in income tax expense would have been a decrease primarily due to lower operating results. The provision for income taxes for fiscal 2013 was comprised of foreign income taxes as well as U.S. federal alternative minimum tax and state income taxes.
Selected Quarterly Results of Operations
The following table presents unaudited selected quarterly consolidated results of operations data for each of the quarters presented. The unaudited consolidated financial statements for each of these quarters were prepared on a basis consistent with our audited consolidated financial statements and include all adjustments, consisting of normal and recurring adjustments, that we consider necessary for a fair presentation of the financial position and results of operations as of and for such periods. You should read this table in conjunction with our consolidated financial statements and the related notes located elsewhere in this filing. The results of operations for any quarter are not necessarily indicative of the results of operations for any future periods.
| Quarter Ended | ||||||||||||||||||||||||||||||||
| Sep. 30, 2011 | Dec. 31, 2011 | Mar. 31, 2012 | June 30, 2012 | Sep. 30, 2012 | Dec. 31, 2012 | Mar. 31, 2013 | June 30, 2013 | |||||||||||||||||||||||||
| (In thousands, expect for gross margin and per share data) | ||||||||||||||||||||||||||||||||
Revenue | $ | 74,385 | $ | 84,131 | $ | 94,237 | $ | 106,596 | $ | 118,115 | $ | 120,569 | $ | 87,650 | $ | 106,052 | ||||||||||||||||
Gross profit | 47,031 | 42,925 | 49,057 | 61,291 | 70,121 | 74,559 | 48,259 | 61,532 | ||||||||||||||||||||||||
Gross margin(1) | 63.2 | % | 51.0 | % | 52.1 | % | 57.5 | % | 59.4 | % | 61.8 | % | 55.1 | % | 58.0 | % | ||||||||||||||||
Total operating expenses | 42,366 | 46,972 | 53,981 | 62,281 | 61,672 | 67,665 | 76,726 | 85,324 | ||||||||||||||||||||||||
Income (loss) from operations | 4,665 | (4,047 | ) | (4,924 | ) | (990 | ) | 8,449 | 6,894 | (28,467 | ) | (23,792 | ) | |||||||||||||||||||
Net income (loss) | $ | 7,189 | $ | (5,709 | ) | $ | (4,676 | ) | $ | (2,387 | ) | $ | 3,933 | $ | 1,732 | $ | (20,047 | ) | $ | (23,844 | ) | |||||||||||
Net income (loss) per common share, basic | $ | 0.09 | $ | (0.07 | ) | $ | (0.05 | ) | $ | (0.03 | ) | $ | 0.04 | $ | 0.02 | $ | (0.21 | ) | $ | (0.24 | ) | |||||||||||
Net income (loss) per common share, diluted | $ | 0.07 | $ | (0.07 | ) | $ | (0.05 | ) | $ | (0.03 | ) | $ | 0.04 | $ | 0.02 | $ | (0.21 | ) | $ | (0.24 | ) | |||||||||||
| (1) | We define gross margin as our gross profit expressed as a percentage of total revenues |
-46-
Table of Contents
With the exception of the three months ended March 31, 2013, revenue has increased sequentially in all of the quarters presented due to increases in the volume of products sold. The decrease in revenue in the second half of fiscal 2013 was principally due to a decrease in volume shipped to certain significant customers.
Gross margin decreased sequentially for the three months ended December 31, 2011 due to higher raw material costs from the early stage of ioDrive 2 product lifecycle and the lower gross margin mix of products sold. Gross margin increased sequentially for the three months ended June 30, 2012 due to lower raw material costs and the higher gross margin mix of products sold. Gross margin decreased sequentially for the three months ended March 31, 2013 due primarily to litigation settlement related expenses.
Operating expenses increased sequentially in all quarters, with the exception of the three months ended September 30, 2012, as we continued to add headcount and incurred related costs to accommodate our growth.
Liquidity and Capital Resources
Primary sources of liquidity
As of June 30, 2013, our principal sources of liquidity consisted of cash and cash equivalents of $238.4 million and net accounts receivable of $69.1 million. In June 2011, we completed an initial public offering of our common stock in which we issued and sold 12,600,607 shares and received net proceeds of approximately $218.9 million. In November 2011, we completed afollow-on public offering of our common stock in which we issued and sold 3,000,000 shares and received net proceeds of approximately $94.0 million. We had working capital of $304.7 million as of June 30, 2013.
Through June 30, 2013, we used the net IPO proceeds to complete the acquisitions of IO Turbine, the ID7 Entities, and NexGen, and for working capital and general corporate purposes, including expansion of our sales organization and further development and expansion of our product offerings.
Historically, our primary sources of liquidity have been from customer payments for our products and services, the issuance of common and convertible preferred stock and convertible notes, and proceeds from our revolving line of credit. The revolving line of credit matured on December 31, 2012.
Cash Flow Analysis
| Year Ended June 30, | ||||||||||||
| 2011 | 2012 | 2013 | ||||||||||
| (In thousands) | ||||||||||||
Net cash (used in) provided by: | ||||||||||||
Operating activities | $ | (9,857 | ) | $ | 34,768 | $ | 39,386 | |||||
Investing activities | (916 | ) | (41,574 | ) | (128,597 | ) | ||||||
Financing activities | 221,113 | 108,527 | 6,434 | |||||||||
Operating Activities
Our operating cash flow primarily depends on the timing and amount of cash receipts from our customers, inventory purchases, and payments for operating expenses.
Our net cash used in operating activities for fiscal 2011 was $9.9 million. During this period our operating cash outflows, which consisted primarily of purchases of inventory and investments made to hire additional headcount to support our current and anticipated growth, were partially offset by cash collections from our customers. Our net income for 2011 was $4.6 million. Significantnon-cash
-47-
Table of Contents
expenses included in net income werestock-based compensation of $8.6 million, depreciation and amortization expense of $4.5 million and thenon-cash expense recorded related to the convertible preferred stock warrant and the common stock repurchase derivative liability.
Our net cash provided by operating activities for fiscal 2012 was $34.8 million. During this period our operating cash inflows, which consisted primarily of cash collections from our customers, were partially offset by purchases of inventory and investments made to hire additional headcount to support our current and anticipated growth. Our net loss for 2012 was $5.6 million. Significantnon-cash expenses included in net income werestock-based compensation of $42.6 million, depreciation and amortization expense of $9.0 million, and thenon-cash expense recorded related to the convertible preferred stock warrant and the common stock repurchase derivative liability.
Our net cash provided by operating activities for fiscal 2013 was $39.4 million. During this period our operating cash inflows, which consisted primarily of cash collections from our customers, were partially offset by purchases of inventory and investments made to hire additional headcount to support our current and anticipated growth. Our net loss for 2013 was $38.2 million. Significantnon-cash expenses included in net income werestock-based compensation of $56.4 million and depreciation and amortization expense of $16.3 million.
Investing Activities
Cash flows from investing activities primarily relate to purchases of computer equipment, leasehold improvements, and property and equipment to support our growth. Investing activities also include cash used for business acquisitions.
In fiscal 2011, our net cash used in investing activities was $0.9 million and was primarily due to the cash used for the purchase of property and equipment of $13.0 million offset by net proceeds from the sale ofshort-term investments of $12.0 million and $0.1 million from the sale of property and equipment.
For fiscal 2012, our net cash used in investing activities was $41.6 million, including $24.0 million from purchases of property and equipment and $17.6 million for the acquisition of IO Turbine, net of cash acquired.
For fiscal 2013, our net cash used in investing activities was $128.6 million, including $114.2 million of cash paid for the acquisitions of NexGen and the ID7 Entities, net of cash acquired, and $14.4 million for purchases of property and equipment.
Financing Activities
Cash flows from financing activities primarily include net proceeds from our employee stock purchase plan, issuance of common stock, and exercise of stock options.
We generated $221.1 million of net cash from financing activities in fiscal 2011, primarily due to $219.2 million in net proceeds from the issuance of common stock, $11.0 million that we borrowed from a financial institution, $1.5 million in proceeds from the exercise of stock options and a $1.2 million tax benefit from the exercise of stock options and $0.7 million related to a change in restricted cash. These increases were offset by the repayment of $11.3 million of notes payable and capital lease obligations and $1.2 million in repurchases of common stock.
We generated $108.5 million in cash from financing activities in fiscal 2012, primarily due to the $94.0 million in net proceeds from the issuance of common stock through ourfollow-on public offering, $13.3 million in net proceeds from our employee stock purchase plan and exercise of stock options, and $2.5 million from a tax benefit from the exercise of stock options, all offset by the payout of a common stock repurchase derivative liability of $1.1 million.
-48-
Table of Contents
We generated $6.4 million in cash from financing activities in fiscal 2013, primarily due to net proceeds of $15.1 million from the exercise of stock options and our employee stock purchase plan, offset by $4.9 million of a change in restricted cash and $3.4 million in net issuance of restricted stock awards and restricted stock units, net of repurchases.
Revolving Line of Credit
In September 2010, we amended and restated our loan and security agreement, or the revolving line of credit, with a financial institution. The revolving line of credit allowed us to borrow up to a limit of $25.0 million. A sublimit of $6.0 million for letters of credit, certain cash management services, and foreign exchange forward contracts applied until May 2012. The total balance of letters of credit outstanding at June 30, 2012 was $3.2 million, which reduced the amount we had available to borrow under the revolving line of credit. Prior to May 2012, borrowings under the revolving line of credit would have accrued interest at a floating per annum rate equal to one-half of one percentage point (0.50%) above the prime rate as published in the Wall Street Journal. An unused commitment fee equal to 0.375% of the difference between the $25.0 million limit and the average daily balance of borrowings outstanding each quarter was due on the last day of such quarter. Prior to May 2012, the revolving line of credit was secured by substantially all of our assets. We could make advances against the revolving line of credit until its maturity date, at which time all unpaid principal and interest was due and payable.
In August 2011, we entered into an amendment to the revolving line of credit which provided for the consent of the financial institution with respect to the IO Turbine acquisition and certain amendments to provide us with further flexibility to consummate mergers and acquisitions permitted under the revolving line of credit.
In May 2012, we entered into a second amendment to the revolving line of credit. Pursuant to this amendment, the pricing on revolving line of credit was amended such that borrowings under the revolving line of credit accrued interest at a per annum rate equal to, at our option, a floating per annum rate equal to the prime rate as published in the Wall Street Journal, or the LIBOR rate (based on 1, 2, 3 or 6-month interest periods) plus a margin equal to two percent (2.00%) per annum. This amendment further provided for, among other things, (i) the reduction of the quarterly unused commitment fee to an amount equal to one-quarter of one percent (0.25%) per annum of the difference between the $25.0 million loan commitment and the average daily balance of borrowings outstanding on the last day of each quarter, (ii) the removal of the borrowing base formula and the sublimit restricting the issuance of letters of credit, cash management services and foreign exchange forward contracts, and (iii) the release of the financial institution’s security interest in all of our assets.
Under the terms of the revolving line of credit, we were required to maintain the following minimum financial covenants on a consolidated basis:
| • | A ratio of current assets to current liabilities plus, without duplication, any of our obligations to the financial institution, of at least 1.25 to 1.00. |
| • | A tangible net worth of at least $25.0 million, plus 25% of the net proceeds we received from the sale or issuance of our equity or subordinated debt, such increase to be measured as of the last day of the quarter in which we received such proceeds. |
In September 2012, we entered into a third amendment to the revolving line of credit. Pursuant to this amendment, the maturity date of the revolving line of credit was extended to December 2012.
As of June 30, 2013, we no longer had a revolving line of credit.
-49-
Table of Contents
Future Capital Requirements
Our future capital requirements will depend on many factors, including our rate of revenue growth, possible acquisitions of, or investments in, businesses, technologies, or other assets, the expansion of our sales and marketing activities, the timing and extent of spending to support product development efforts, and the expansion into new territories, the timing of new product introductions, the building of infrastructure to support our growth, the continued market acceptance of our products, and strategic investments in businesses.
We believe that our cash and cash equivalents will be sufficient to meet our working capital and capital expenditure requirements for at least the next 12 months. Although we are not currently a party to any material agreement or letter of intent regarding potential investments in, or acquisitions of, complementary businesses, applications, or technologies, we may enter into these types of arrangements, which could require us to seek additional equity or debt financing. If required, additional financing may not be available on terms that are favorable to us, if at all. If we raise additional funds through the issuance of equity or convertible debt securities, the percentage ownership of our stockholders will be reduced and these securities might have rights, preferences, and privileges senior to those of our current stockholders. We cannot assure you that additional financing will be available or that, if available, such financing can be obtained on terms favorable to our stockholders and us.
Off Balance Sheet Arrangements
During the periods presented, we did not have any relationships with unconsolidated entities or financial partnerships, such as entities often referred to as structured finance or special purpose entities, which would have been established for the purpose of facilitating off-balance sheet arrangements or other contractually narrow or limited purpose.
Contractual Obligations and Material Commitments
The following is a summary of our contractual obligations as of June 30, 2013 (in thousands):
| Payments Due by Period | ||||||||||||||||||||
| Total | Less Than 1 Year | 1 to 3 Years | 3 to 5 Years | After 5 Years | ||||||||||||||||
Operating lease obligations | $ | 50,596 | $ | 6,166 | $ | 13,215 | $ | 13,385 | $ | 17,830 | ||||||||||
Other contractual obligations(1) | 13,856 | 3,892 | 9,371 | 593 | — | |||||||||||||||
|
|
|
|
|
|
|
|
|
| |||||||||||
Total | $ | 64,452 | $ | 10,058 | $ | 22,586 | $ | 13,978 | $ | 17,830 | ||||||||||
|
|
|
|
|
|
|
|
|
| |||||||||||
| (1) | Relates to commitments resulting from our fiscal 2013 acquisitions and other agreements. |
As of June 30, 2013, we had fulfilled all of our raw materials purchase commitments that were outstanding as of the prior year and no outstanding commitment remained.
Operating lease payments primarily relate to our leases of office space with various expiration dates through 2021. During fiscal 2012 and 2013, we entered into new leases to expand our primary office facilities in Salt Lake City, Utah and San Jose, California. The term of the Salt Lake City leases includes an initial lease term that ends in September 2021, plus the option to extend the leases for an additional five years, and the term for the San Jose lease includes an initial lease term that ends in March 2019. These leases include periods of free rent during the first year beginning with the lease effective date and increasing rental rates over the term of the leases. Certain of our leases of office space required us to provide the lessor letters of credit in aggregate of $3.4 million.
-50-
Table of Contents
Indemnification
We have agreed to indemnify our officers and directors for certain events or occurrences, while the officer or director is or was serving at our request in such capacity. The maximum amount of potential future indemnification is unlimited; however, we have a director and officer insurance policy that provides corporate reimbursement coverage that limits our exposure and enables us to recover a portion of any future amounts paid. We are unable to reasonably estimate the maximum amount that could be payable under these arrangements since these obligations are not capped but are conditional to the unique facts and circumstances involved. Accordingly, we had no liabilities recorded for these agreements as of June 30, 2012 and June 30, 2013.
Many of our agreements with customers and channel partners, including OEMs and resellers, generally include certain provisions for indemnifying the channel partners and customers against liabilities if our products infringe a third party’s intellectual property rights. To date, we have not incurred any material costs as a result of such indemnification provisions and have not accrued any liabilities related to such obligations in our consolidated financial statements.
Critical Accounting Policies and Estimates
Our consolidated financial statements are prepared in accordance with U.S. generally accepted accounting principles, or GAAP. The preparation of these consolidated financial statements requires us to make estimates and assumptions that affect the reported amounts of assets, liabilities, revenue, expenses, and related disclosures. These estimates and assumptions are often based on judgments that we believe to be reasonable under the circumstances at the time made, but all such estimates and assumptions are inherently uncertain and unpredictable. Actual results may differ from those estimates and assumptions, and it is possible that other professionals, applying their own judgment to the same facts and circumstances, could develop and support alternative estimates and assumptions that would result in material changes to our operating results and financial condition. We evaluate our estimates and assumptions on an ongoing basis. Our estimates are based on historical experience and various other assumptions that we believe to be reasonable under the circumstances. Our actual results could differ from these estimates.
We believe that the assumptions and estimates associated with revenue recognition,stock-based compensation, business combinations and impairment oflong-lived and intangible assets including goodwill, inventory valuation, warranty liability, and income taxes have the greatest potential impact on our consolidated financial statements. Therefore, we consider these to be our critical accounting policies and estimates. For further information on all of our significant accounting policies, see Note 1 of the accompanying notes to our consolidated financial statements.
Revenue Recognition
We derive our revenue primarily from sales of products and support services and enter intomultiple-element arrangements in the normal course of business with our customers and channel partners. In all of our arrangements, we do not recognize revenue until we can determine that persuasive evidence of an arrangement exists, delivery has occurred, the fee is fixed or determinable, and we deem collection to be reasonably assured. In making these judgments, we evaluate these criteria as follows:
| • | Evidence of an Arrangement — We consider anon-cancelable agreement or purchase order signed by a customer to be persuasive evidence of an arrangement. |
| • | Delivery has Occurred — We consider delivery to have occurred when product has been delivered to the customer based on applicable shipping terms, and nopost-delivery |
-51-
Table of Contents
obligations exist other than ongoing support obligations under sold support services. In instances where customer acceptance is required, delivery is deemed to have occurred when customer acceptance has been achieved. |
| • | Fees are Fixed or Determinable — We consider the fee to be fixed or determinable unless the fee is subject to refund or adjustment or is not payable within normal payment terms. If the fee is subject to refund or adjustment, we recognize revenue net of estimated returns or if a reasonable estimate cannot be made, when the right to a refund or adjustment lapses. |
| • | Collection is Reasonably Assured — We conduct a credit worthiness assessment on all our customers. Generally we do not require collateral. We continue to evaluate collectability by reviewing our customers’ credit worthiness including a review of past transaction history. Payment terms are typically 30 to 45 days, except for certain customers that can have up to 75 days from the date of invoice. Collection is reasonably assured if, based upon our evaluation, we expect that the customer will be able to pay amounts under the arrangement as payments become due. If we determine that collection is not reasonably assured, revenue is deferred and recognized upon the receipt of cash. |
Some of our revenue arrangements are multiple-element arrangements because they are comprised of sales of both products and support services. For multiple-element arrangements, we evaluate whether each deliverable should be accounted for as separate units of accounting. A deliverable constitutes a separate unit of accounting when it hasstand-alone value, and for an arrangement where a general right of return exists relative to a delivered item, delivery, or performance of the undelivered item must be considered probable and substantially in our control.Stand-alone value exists if the product or service is sold separately by us or by another vendor or could be resold by the customer. Where the aforementioned criteria for a separate unit of accounting are not met, the deliverable is combined with the undelivered element(s) and treated as a single unit of accounting for the purposes of allocation of the arrangement consideration and revenue recognition.
Ourmultiple-element arrangements typically include two elements: ioMemory hardware, which includes embedded VSL virtualization software, and support services. We have determined that our ioMemory hardware and the embedded VSL virtualization software are considered a single unit of accounting because the hardware and software individually do not have standalone value and are never sold separately. Support services are considered a separate unit of accounting as they are sold separately and have standalone value.
We allocate arrangement consideration at the inception of an arrangement to all deliverables based on the relative selling price method in accordance with the selling price hierarchy, which includes:(1) vendor-specific objective evidence, or VSOE, if available;(2) third-party evidence, or TPE, ifvendor-specific objective evidence is not available; and (3) best estimate of selling price, or BESP, if neither VSOE nor TPE is available.
| • | VSOE — We determine VSOE based on our historical pricing and discounting practices for the specific product or support service when sold separately. In determining VSOE, we require that a substantial majority of the selling prices for products or support services fall within a reasonably narrow pricing range. We have historically priced certain of our ioMemory products within a narrow range and have used VSOE to allocate the selling price of deliverables for these specific sales. |
| • | TPE — When VSOE cannot be established for deliverables in multiple element arrangements, we apply judgment with respect to whether we can establish selling price based on TPE. TPE is determined based on competitor prices for similar deliverables when sold separately. Generally, our products differ from those of our peers such that the comparable pricing of |
-52-
Table of Contents
support services with similar functionality cannot be obtained. Furthermore, we are unable to reliably determine what similar competitor services’ selling prices are on astand-alone basis. As a result, we have not been able to establish selling price based on TPE. |
| • | BESP — When we are unable to establish selling price using VSOE or TPE, we use BESP in our allocation of arrangement consideration. The objective of BESP is to determine the price at which we would transact a sale if the product or support service was sold on astand-alone basis. We determine BESP for deliverables by considering multiple factors including, but not limited to, prices we charge for similar offerings, sales volume, geographies, market conditions, competitive landscape, and pricing practices. |
Our agreements with certain customers, including certain OEMs and other channel partners, contain provisions for sales returns, price protection, stock rotation rights, and rebates in limited circumstances. In limited circumstances and on an infrequent basis, even if we are not obligated to accept returned products, we may determine it is in our best interest to accept returns in order to maintain good relationships with our customers. We recognize revenue net of the effects of these estimated obligations at the time revenue is recorded.
We estimate product returns based upon our periodic analysis of historical returns as a percentage of revenue as well as known future returns. We periodically assess the accuracy of our historical estimates and to date the actual results have been reasonably consistent with our estimates. While we believe we have sufficient experience and knowledge of the market and customer buying patterns to reasonably estimate such returns, actual market conditions or customer behavior could differ from our expectations and as a result, our actual results could change materially.
Our price protection obligations with certain OEMs and other channel partners require us to notify them of any decreases in pricing and to provide them with a refund or credit for any units of our product that they have on hand as of the date of the pricing change. Historically, most of our sales to our OEMs and other channel partners have an identifiedend-user at the time we ship our products and thus the amount of inventory carried by our OEMs and other channel partners at any given time is limited. To date, we have not issued refunds or credits to our OEMs and other channel partners for price protection.
Certain of our contracts allow for rebates that are based on a fixed percentage of our sales to the customer or sales to theend-user or a fixed dollar amount per unit. In addition, certain of our contracts allow for stock rotation rights that are limited by an amount equal to a fixed percentage of our sales to the customer. We recognize the amount of the rebates and stock rotation rights as a reduction of revenues when the underlying revenue is recognized.
Deferred revenue primarily represents customer billings in excess of revenue recognized, primarily for support services. Support services are typically billed in advance on an annual basis or at the inception of a multiple year support contract and revenue is recognized ratably over the support period of one to five years.
We also sell stand-alone software products. Our software products are sold with software maintenance services. VSOE of fair value for software maintenance services will be established by the rates charged in stand-alone sales of software maintenance contracts within a reasonably narrow pricing range. As we have not established VSOE of fair value on the software maintenance services due to lack of renewal history, we recognize revenue ratably for the entire arrangement fee, once the services have commenced, over the longest delivery period. During the years ended June 30, 2011, 2012, and 2013, our software revenue was not significant to our consolidated statements of operations.
Shipping and handling costs are included in cost of sales.
-53-
Table of Contents
Business Combinations and Impairment ofLong-lived and Intangible Assets, Including Goodwill
When we acquire businesses, we allocate the fair value of the consideration transferred to tangible assets and liabilities and identifiable intangible assets acquired. Any residual consideration is recorded as goodwill. The allocation of the consideration transferred requires management to make significant estimates in determining the fair values of assets acquired and liabilities assumed, especially with respect to intangible assets. These estimates are based on the application of valuation models using historical experience and information obtained from the management of the acquired company and our understanding of the future projections. These estimates can include, but are not limited to, the cash flows that an asset is expected to generate in the future, the appropriate weighted-average cost of capital, and the cost savings expected to be derived from acquiring an asset. These estimates are inherently uncertain, unpredictable, and subject to refinement. In addition, unanticipated events and circumstances may occur which may affect the accuracy or validity of such estimates.
Periodically we assess potential impairment of our long-lived assets, which include property, equipment, and acquired intangible assets. We perform an impairment review whenever events or changes in circumstances indicate that the carrying value may not be recoverable. Factors we consider important which could trigger an impairment review include, but are not limited to, significant under-performance relative to historical or projected future operating results, significant changes in the manner of our use of the acquired assets or our overall business strategy, and significant industry or economic trends. When we determine that the carrying value of a long-lived asset may not be recoverable based upon the existence of one or more of the above indicators, we determine the recoverability by comparing the carrying amount of the asset to net future undiscounted cash flows that the asset is expected to generate. We recognize an impairment charge equal to the amount by which the carrying amount exceeds the fair market value of the asset. We amortize intangible assets on a straight-line basis over their estimated useful lives, or if appropriate, using a method that better represents the pattern of usage.
We test goodwill for impairment annually as of April 1, or whenever events or changes in circumstances indicate that goodwill may be impaired. We initially assess qualitative factors to determine whether the existence of events or circumstances leads to a determination that it is more-likely-than-not that the fair value of a reporting unit is less than its carrying amount. If, after assessing the totality of events or circumstances, we determine it is more-likely-than-not that the fair value of a reporting unit is less than its carrying amount, then we perform a first step by comparing the book value of net assets to the fair value of our single reporting unit. If the fair value is determined to be less than the book value, a second step is performed to compute the amount of impairment as the difference between the estimated fair value of goodwill and the carrying value. No impairment of long-lived assets or goodwill was recorded during fiscal 2011, 2012, or 2013.
-54-
Table of Contents
Stock-Based Compensation
Stock-based compensation cost for each award is estimated at the grant date based on the award’s fair value as calculated by anoption-pricing model and is recognized as expense over the requisite service period. We use theBlack-Scholes-Mertonoption-pricing model which requires various highly judgmental assumptions including the estimated fair value of our common stock, volatility over the expected life of the option, stock option exercise and cancellation behaviors,risk-free interest rate, and expected dividends. We estimated the fair value of each employee option granted using the following assumptions for the periods presented.
| Year Ended June 30, | ||||||||||||
| 2011 | 2012 | 2013 | ||||||||||
Expected volatility | 48-60 | % | 59-60 | % | 61-65 | % | ||||||
Expected term (in years) | 3.2-7.0 | 5.2-6.6 | 3.9-5.7 | |||||||||
Risk-free interest rate | 0.6-2.7 | % | 1.0-2.0 | % | 0.6-1.4 | % | ||||||
Expected dividends | — | — | — | |||||||||
| • | Volatility — As we do not have a trading history for our common stock of sufficient length for purposes of the Black-Scholes-Merton option pricing model, the expected stock price volatility for our common stock was estimated by taking the average historic price volatility for a group of companies we consider our peers based on a number of factors including, but not limited to, similarity to us with respect to industry, business model, stage of growth, financial risk, or other factors, along with considering the future plans of our company to determine the appropriate volatility over the expected life of the option. We used the daily price of these peers over a period equivalent to the expected term of the stock option grants. We did not rely on implied volatilities of traded options in our peers’ common stock because the volume of activity was relatively low. We intend to continue to consistently apply this process using the same or similar public companies until a sufficient amount of historical information regarding the volatility of our own common stock share price becomes available, or unless circumstances change such that the identified companies are no longer similar to us, in which case, more suitable companies whose share prices are publicly available would be utilized in the calculation. |
| • | Expected Life — The expected life was based on the simplified method allowed under SEC guidance, which is calculated as the average of the option’s contractual term andweighted-average vesting period. We use this method as we have limited historical stock option data that is sufficient to derive a reasonable estimate of the expected life of an option. |
| • | Dividend Yield — We have never declared or paid any cash dividends and do not presently plan to pay cash dividends in the foreseeable future. Consequently, we used an expected dividend yield of zero. |
| • | Risk-free Interest Rate — Therisk-free interest rate was determined by reference to the U.S. Treasury rates with the remaining term approximating the expected option life assumed at the date of grant. |
In addition, we are required to estimate the expected forfeiture rate and only recognize expense for those options expected to vest. We estimate the forfeiture rate based on our historical experience. Further, to the extent our actual forfeiture rate is different from our estimate,stock-based compensation expense is adjusted accordingly. If any of the assumptions used in theBlack-Scholes-Mertonstock-option model change significantly, the fair value andstock-based compensation expense on future grants is impacted accordingly andstock-based compensation expense may differ materially in the future from that recorded in the current period.
-55-
Table of Contents
Prior to June 9, 2011, the date our common stock began trading on the New York Stock Exchange, the fair value of common stock had been determined by the board of directors at each grant date based on a variety of factors, including periodic valuations of our common stock, our financial position, historical financial performance, projected financial performance, valuations of publicly traded peer companiesarm’s-length sales of our common stock, and the illiquid nature of common stock. Since our IPO, we determine the fair value of our common stock based on the closing price as quoted on the New York Stock Exchange, of our common stock on the stock option grant date.
Inventory Valuation
Inventories consist of raw materials, work in progress, and finished goods and are stated at the lower of cost (using thefirst-in,first-out method) or market value. Our finished goods consist of manufactured finished goods.
We assess the valuation of all inventories, including raw materials, work in progress and finished goods, on a periodic basis. Inventory carrying value adjustments are established to reduce the carrying amounts of our inventories to their estimated net realizable values. Carrying value adjustments are based on historical usage, expected demand and market conditions. Inherent in our estimates of market value in determining inventory valuation are estimates related to economic trends, future demand for our products and technological obsolescence of our products. For example, because our revenue often is comprised of large, concentrated sales to a limited number of customers, we may carry high levels of inventory prior to shipment. In addition, in circumstances where a supplier discontinues the production of a key raw material component, such as a specific type of NAND Flash memory, we may be required to make significant “last-time” purchases in order to ensure supply continuity until the transition is made to products based on next generation components. If a significant order were canceled after we had purchased the related inventory, or if estimates of “last-time” purchases exceed actual demand, we may be required to record additional inventory carrying value adjustments.
Warranty Liability
We provide our customers a standard limited product warranty of up to five years. Our standard warranty requires us to repair or replace defective products during such warranty period at no cost to the customer. We estimate the costs that may be incurred under our standard limited warranty and record a liability in the amount of such costs at the time product sales are recognized. Factors that affect our warranty liability include the number of installed units, identified warranty issues, historical experience, and management’s judgment regarding anticipated rates of warranty claims and cost per claim. We assess the adequacy of our recorded warranty liability each period and make adjustments to the liability as necessary based on actual experience.
Income Taxes
Significant judgment is required in determining our provision for income taxes and evaluating our uncertain tax positions. Historically, the effective tax rate has been volatile and difficult to forecast due to the valuation allowance against our deferred tax assets, stock-based compensation, our ability to use tax credits and other adjustments. We expect this volatility to continue in our effective tax rate.
In evaluating our ability to recover our deferred tax assets, in full or in part, we consider all available positive and negative evidence, including our past operating results, our forecast of future market growth, forecasted earnings, future taxable income, and prudent and feasible tax planning strategies. Due to historical net losses incurred and the uncertainty of realizing the deferred tax assets, for all the periods presented, we have a full valuation allowance against our deferred tax assets. To the
-56-
Table of Contents
extent that we generate positive income and expect, with reasonable certainty, to continue to generate positive income we may release all or a portion of our valuation allowance in a future period. This release would result in the recognition of certain deferred tax assets and a decrease to income tax expense for the period such release is made.
Recently Issued and Adopted Accounting Pronouncements
For information with respect to recent accounting pronouncements and the impact of these pronouncements on our consolidated financial statements, see Note 1 “Description of Business and Summary of Significant Accounting Policies – Recently Issued and Adopted Accounting Pronouncements” in the notes to consolidated financial statements.
Segments
Operating segments are defined in accounting standards as components of an enterprise about which separate financial information is available and is regularly evaluated by management, namely the chief operating decision maker of an organization, in order to make operating and resource allocation decisions. We have concluded that we operate in one business segment, which is the development, marketing, and sale of storage class memory products. Substantially all of our revenue for all periods presented in the accompanying consolidated statements of operations has been from sales of the ioMemory product lines and related customer support services.
Certain Relationships and Related Party Transactions
For a discussion of certain relationships and related party transactions, see Note 11 “Related Party Transactions” in the notes to consolidated financial statements.
Part II. Item 7A.Quantitative and Qualitative Disclosures About Market Risk
Foreign Currency Risk
Our international sales and marketing operations incur expenses that are denominated in foreign currencies. Although our international operations are currently immaterial compared to our operations in the United States, we expect to continue to expand our international operations which will increase our potential exposure to fluctuations in foreign currencies. Our exposures are to fluctuations in exchange rates primarily for the U.S. dollar versus the euro and the British pound. Changes in currency exchange rates could adversely affect our consolidated results of operations or financial position. Additionally, our international sales and marketing operations maintain cash balances denominated in foreign currencies. In order to decrease the inherent risk associated with translation of foreign cash balances into our reporting currency, we have not maintained material excess cash balances in foreign currencies. As of June 30, 2013, we had approximately $3.4 million of cash in foreign accounts. To date, we have not hedged our exposure to changes in foreign currency exchange rates and, as a result, could incur unanticipated translation gains and losses. Through June 30, 2013, all of our sales were billed in U.S. dollars and therefore not subject to direct foreign currency risk.
Part II. Item 8.Consolidated Financial Statements and Supplementary Data
The Consolidated Financial Statements and Schedule listed in the Index to Financial Statements, Schedules and Exhibits on pageF-1 are filed as part of this report.
Part II. Item 9.Changes in and Disagreements with Accountants on Accounting and Financial Disclosure
None.
-57-
Table of Contents
Part II. Item 9A.Controls and Procedures
Evaluation of Disclosure Controls and Procedures
As required by Rule 13a-15(b) under the Securities Exchange Act of 1934, as amended, or the Exchange Act, our management, including our Chief Executive Officer and Chief Financial Officer, evaluated the effectiveness of our disclosure controls and procedures, as defined in Rule 13a-15(e) under the Exchange Act. Based upon that evaluation, our Chief Executive Officer and Chief Financial Officer concluded that, as of the end of the period covered by this report, our disclosure controls and procedures were effective.
Management’s Report on Internal Control over Financial Reporting
Our management is responsible for establishing and maintaining effective internal control over financial reporting and for the assessment of the effectiveness of internal control over financial reporting. Our internal control over financial reporting is a process designed, as defined inRule 13a-15(F) under the Exchange Act, to provide reasonable assurance regarding the reliability of financial reporting and the preparation of consolidated financial statements for external purposes in accordance with U.S. generally accepted accounting principles.
In connection with the preparation of our annual consolidated financial statements, our management has undertaken an assessment of the effectiveness of our internal control over financial reporting based on criteria established in Internal Control — Integrated Framework issued by the Committee of Sponsoring Organizations of the Treadway Commission (1992 framework), or the COSO Framework. Management’s assessment included evaluation of elements such as the design and operating effectiveness of key financial reporting controls, process documentation, accounting practices, and our overall control environment. Based on this assessment, management has concluded that our internal control over financial reporting was effective as of June 30, 2013. We reviewed the results of management’s assessment with the Audit Committee of our Board of Directors.
Because of its inherent limitations, internal control over financial reporting may not prevent or detect misstatements. Projections of any evaluation of effectiveness to future periods are subject to the risk that controls may become inadequate because of changes in conditions, or that the degree of compliance with the policies or procedures may deteriorate.
Our independent registered public accounting firm, Ernst & Young LLP, independently assessed the effectiveness of our internal control over financial reporting and has issued an attestation report on our internal control over financial reporting.
Changes in Internal Control over Financial Reporting
During the fourth quarter of fiscal 2013, we did not make any changes in our internal control over financial reporting that have materially affected, or are reasonably likely to materially affect, our internal control over financial reporting.
Limitations on Controls
Management does not expect that our disclosure controls and procedures or our internal control over financial reporting will prevent or detect all errors and fraud. Any control system, no matter how well designed and operated, is based upon certain assumptions and can provide only reasonable, not absolute, assurance that its objectives will be met. Further, no evaluation of controls can provide absolute assurance that misstatements due to error or fraud will not occur or that all control issues and instances of fraud, if any, within the Company have been detected.
-58-
Table of Contents
Part II. Item 9B.Other Information
None.
We are incorporating by reference the information required by Part III of this report onForm 10-K from our proxy statement relating to our 2013 annual meeting of stockholders (the “2013 Proxy Statement”), which will be filed with the SEC within 120 days after the end of fiscal 2013.
Part III. Item 10.Directors, Executive Officers, and Corporate Governance
The information required by this item is included under the captions “Election of Directors — Nominees,” “Election of Directors — Board Meetings and Committees,” “Information Concerning Executive Officers,” and “Section 16(a) Beneficial Ownership Reporting Compliance” in the 2013 Proxy Statement and incorporated herein by reference.
Part III. Item 11.Executive Compensation
The information required by this item is included under the captions “Election of Directors — Compensation ofNon-Employee Directors,” “Election of Directors — Compensation Committee Interlocks and Insider Participation,” “Compensation Discussion and Analysis,” “Compensation Committee Report,” and “Executive Compensation” in the 2013 Proxy Statement and incorporated herein by reference.
Part III. Item 12.Security Ownership of Certain Beneficial Owners and Management and Related Stockholder Matters
The information required by this item is included under the captions “Security Ownership of Certain Beneficial Owners and Management” and “Equity Compensation Plan Information” in the 2013 Proxy Statement and incorporated herein by reference.
Part III. Item 13.Certain Relationships and Related Transactions, and Director Independence
The information required by this item is included under the captions “Certain Relationships and Related Person Transactions” and “Election of Directors — Board Meetings and Committees” in the 2013 Proxy Statement and incorporated herein by reference.
Part III. Item 14.Principal Accounting Fees and Services
The information required by this item is included under the caption “Ratification of Appointment of the Independent Registered Public Accounting Firm” under the subheading of “Fees Paid to Ernst & Young, LLP” in the 2013 Proxy Statement and incorporated herein by reference.
Part IV. Item 15.Exhibits, Consolidated Financial Statements, and Financial Statement Schedules
(a)(1)Consolidated Financial Statements
We have filed the consolidated financial statements listed in the Index to Consolidated Financial Statements, Schedules, and Exhibits on pageF-1 as a part of this annual report onForm 10-K.
(a)(2)Financial Statement Schedules
All financial statement schedules have been omitted because they are not applicable, not material, or the required information is shown in the consolidated financial statements or the notes thereto.
-59-
Table of Contents
(a)(3)Exhibits
The exhibits listed below are filed as part of this annual report onForm 10-K.
| Incorporated by Reference | ||||||||||||||||||||
Exhibit | Exhibit Description | Filed Herewith | Form | File No. | Exhibit No. | Filing Date | ||||||||||||||
| 2.1 | Agreement and Plan of Reorganization, dated as of August 4, 2011¸ by and between the Registrant, IO Turbine, Inc. and certain other parties | 8-K | 001-35188 | 2.1 | 08/05/2011 | |||||||||||||||
| 2.2 | Agreement and Plan of Merger, dated as of April 24, 2013, by and between Fusion-io, Inc., NexGen Storage, Inc. and certain other parties | 8-K | 001-35188 | 2.1 | 04/24/2013 | |||||||||||||||
| 3.1 | Amended and Restated Certificate of Incorporation of the Registrant | 10-K | 001-35188 | 3.1 | 09/02/2011 | |||||||||||||||
| 3.2 | Amended and Restated Bylaws of the Registrant | 10-K | 001-35188 | 3.2 | 09/02/2011 | |||||||||||||||
| 4.1 | Specimen common stock certificate of the Registrant | S-1/A | 333-172683 | 4.1 | 05/23/2011 | |||||||||||||||
| 10.1A* | Form of Indemnification Agreement by and between the Registrant and certain of its directors and officers | S-1/A | 333-172683 | 10.1A | 05/23/2011 | |||||||||||||||
| 10.1B* | Form of Indemnification Agreement by and between the Registrant and certain of its directors affiliated with investment funds and such investment funds | S-1/A | 333-172683 | 10.1B | 05/23/2011 | |||||||||||||||
| 10.2* | 2006 Stock Option Plan and Form of Stock Option Agreement under 2006 Stock Option Plan | S-1 | 333-172683 | 10.2 | 03/09/2011 | |||||||||||||||
| 10.3* | 2008 Stock Incentive Plan and Form of Stock Option Agreement under 2008 Stock Incentive Plan | S-1 | 333-172683 | 10.3 | 03/09/2011 | |||||||||||||||
| 10.4* | 2010 Executive Stock Incentive Plan and Related Forms | S-1 | 333-172683 | 10.4 | 03/09/2011 | |||||||||||||||
| 10.5* | 2011 Equity Incentive Plan and Related Forms | S-1/A | 333-172683 | 10.5 | 05/23/2011 | |||||||||||||||
| 10.6* | 2011 Employee Stock Purchase Plan and Form of Purchase Agreement under 2011 Employee Stock Purchase Plan | S-1/A | 333-172683 | 10.6 | 05/23/2011 | |||||||||||||||
| 10.7* | Form ofNon-Plan Stock Option Agreement between the Registrant and certain of its officers | S-1 | 333-172683 | 10.7 | 03/09/2011 | |||||||||||||||
| 10.8* | Form of Involuntary Termination Severance Agreement between the Registrant and certain of its officers | S-1 | 333-172683 | 10.10 | 03/09/2011 | |||||||||||||||
-60-
Table of Contents
| Incorporated by Reference | ||||||||||||||||||||
Exhibit | Exhibit Description | Filed Herewith | Form | File No. | Exhibit No. | Filing Date | ||||||||||||||
| 10.8A* | Involuntary Termination Severance Agreement between the Registrant and Dennis P. Wolf, dated as of August 11, 2010 | S-1/A | 333-172683 | 10.10A | 04/18/2011 | |||||||||||||||
| 10.9 | Lease Agreement between the Registrant and NOP Cottonwood 2825, LLC, dated May 28, 2010 (Building 10) | S-1 | 333-172683 | 10.12 | 03/09/2011 | |||||||||||||||
| 10.9A | First Amendment to Lease Agreement between Registrant and NOP Cottonwood 2825, LLC, dated August 16, 2011 (Building 10) | 10-Q/A | 001-35188 | 10.2 | 11/16/2011 | |||||||||||||||
| 10.9B | Second Amendment to Lease Agreement between Registrant and NOP Cottonwood 2825, LLC, dated December 2, 2011 (Building 10) | 10-Q | 001-35188 | 10.1 | 02/09/2012 | |||||||||||||||
| 10.9C | Third Amendment to Lease Agreement between Registrant and NOP Cottonwood 2825, LLC, dated March 15, 2013 (Building 10) | 10-Q | 001-35188 | 10.12C | 05/07/2013 | |||||||||||||||
| 10.10 | Lease Agreement between the Registrant and NOP Cottonwood 2855, LLC, dated May 28, 2010 (Building 11) | S-1 | 333-172683 | 10.13 | 03/09/2011 | |||||||||||||||
| 10.10A | First Amendment to Lease Agreement between Registrant and NOP Cottonwood 2855, LLC, dated September 6, 2011 (Building 11) | 10-Q/A | 001-35188 | 10.3 | 11/16/2011 | |||||||||||||||
| 10.10B | Second Amendment to Lease Agreement between Registrant and NOP Cottonwood 2855, LLC, dated July 10, 2012 (Building 11) | 10-K | 001-35188 | 10.13B | 08/27/2012 | |||||||||||||||
| 10.11* | Offer Letter between the Registrant and Dennis Wolf, dated November 4, 2009 | S-1/A | 333-172683 | 10.16 | 05/06/2011 | |||||||||||||||
| 10.12* | Offer Letter between the Registrant and Jim Dawson, dated April 1, 2008 | S-1/A | 333-172683 | 10.17 | 05/06/2011 | |||||||||||||||
| 10.13* | Offer Letter between the Registrant and Lance Smith, dated April 29, 2008 as supplemented by an Offer Letter dated December 26, 2008 | S-1/A | 333-172683 | 10.18 | 05/06/2011 | |||||||||||||||
| 10.14* | Executive Incentive Compensation Plan, adopted by the Registrant on May 16, 2011 | S-1/A | 333-172683 | 10.19 | 05/23/2011 | |||||||||||||||
| 10.15* | IO Turbine, Inc. 2009 Equity Incentive Plan | 10-K | 001-35188 | 10.20 | 09/02/2011 | |||||||||||||||
-61-
Table of Contents
| Incorporated by Reference | ||||||||||||||||||||
Exhibit | Exhibit Description | Filed Herewith | Form | File No. | Exhibit No. | Filing Date | ||||||||||||||
| 10.16 | Office Lease, dated as of January 13, 2012 and executed on January 20, 2012, by and between the Registrant and LaSalle Montague, Inc. | 10-Q | 001-35188 | 10.1 | 05/10/2012 | |||||||||||||||
| 10.17* | Offer Letter, dated as of August 4, 2011, between the Registrant and Richard W. Boberg | 8-K | 001-35188 | 10.1 | 09/14/2012 | |||||||||||||||
| 10.18* | NexGen Storage, Inc. 2010 Equity Incentive Plan and Related Forms | S-8 | 333-188406 | 4.2 | 05/07/2013 | |||||||||||||||
| 10.19* | Form of Acknowledgment and Agreement by and between the Registrant and each of James L. Dawson, Shawn J. Lindquist, Lance L. Smith, and Dennis P. Wolf | X | ||||||||||||||||||
| 10.20* | Letter Agreement between the Registrant and Shane Robison, dated May 29, 2013 | 8-K | 001-35188 | 10.1 | 05/31/2013 | |||||||||||||||
| 10.21* | Involuntary Termination Severance Agreement between the Registrant and Shane Robison, effective as of May 7, 2013 | 8-K | 001-35188 | 10.2 | 05/31/2013 | |||||||||||||||
| 10.22* | Separation Agreement and Release of Claims between the Registrant and David A. Flynn, dated May 30, 2013 | 8-K | 001-35188 | 10.3 | 05/31/2013 | |||||||||||||||
| 10.23* | Separation Agreement and Release of Claims between the Registrant and Rick C. White, dated May 30, 2013 | 8-K | 001-35188 | 10.4 | 05/31/2013 | |||||||||||||||
| 21.1 | Subsidiaries of the Registrant | X | ||||||||||||||||||
| 23.1 | Consent of Ernst & Young LLP Independent Registered Public Accounting Firm | X | ||||||||||||||||||
| 31.1 | Certification of the Chief Executive Officer pursuant to Section 302 of theSarbanes-Oxley Act of 2002 | X | ||||||||||||||||||
| 31.2 | Certification of the Chief Financial Officer pursuant to Section 302 of theSarbanes-Oxley Act of 2002 | X | ||||||||||||||||||
| 32.1 | Certification of the Chief Executive Officer pursuant to Section 906 of theSarbanes-Oxley Act of 2002 | X | ||||||||||||||||||
| 32.2 | Certification of the Chief Financial Officer pursuant to Section 906 of theSarbanes-Oxley Act of 2002 | X | ||||||||||||||||||
-62-
Table of Contents
| Incorporated by Reference | ||||||||||||
Exhibit | Exhibit Description | Filed Herewith | Form | File No. | Exhibit No. | Filing Date | ||||||
| 101.INS** | XBRL Instance Document | |||||||||||
| 101.SCH** | XBRL Taxonomy Schema Linkbase Document | |||||||||||
| 101.CAL** | XBRL Taxonomy Calculation Linkbase Document | |||||||||||
| 101.DEF** | XBRL Taxonomy Definition Linkbase Document | |||||||||||
| 101.LAB** | XBRL Taxonomy Labels Linkbase Document | |||||||||||
| 101.PRE** | XBRL Taxonomy Presentation Linkbase Document | |||||||||||
| * | Indicates a management contract or compensatory plan or arrangement. |
| ** | Pursuant to Rule 406T of Regulation S T, the Interactive Data Files on Exhibit 101 hereto are deemed not filed or part of a registration statement or prospectus for purposes of Sections 11 or 12 of the Securities Act of 1933, as amended, are deemed not filed for purposes of Section 18 of the Securities and Exchange Act of 1934, as amended, and otherwise are not subject to liability under those sections. |
-63-
Table of Contents
SIGNATURES
Pursuant to the requirements of the Section 13 or 15(d) Securities Exchange Act of 1934, the Registrant has duly caused this report to be signed on its behalf by the undersigned hereunto duly authorized.
| FUSION-IO, INC. | ||
| By: | /s/ SHANE ROBISON | |
| Shane Robison | ||
| Chief Executive Officer | ||
August 28, 2013
Pursuant to the requirements of the Securities Exchange Act of 1934, this report has been signed below by the following persons on behalf of the Registrant and in the capacities indicated on August 28, 2013.
Signature | Title | |
/s/ SHANE ROBISON | Chief Executive Officer and Director | |
| Shane Robison | (Principal Executive Officer) | |
/s/ DENNIS P. WOLF | Chief Financial Officer and Executive Vice President | |
| Dennis P. Wolf | (Principal Financial and Accounting Officer) | |
/s/ FOREST BASKETT, Ph.D. | Director | |
| Forest Baskett, Ph.D. | ||
/s/ H. RAYMOND BINGHAM | Director | |
| H. Raymond Bingham | ||
/s/ DANA L. EVAN | Director | |
| Dana L. Evan | ||
/s/ JOHN F. OLSEN | Director | |
| John F. Olsen | ||
/s/ SCOTT D. SANDELL | Director | |
| Scott D. Sandell | ||
-64-
Table of Contents
INDEX TO CONSOLIDATED FINANCIAL STATEMENTS
| Page | ||||
| F-2 | ||||
| F-4 | ||||
| F-5 | ||||
| F-6 | ||||
Consolidated Statements of Convertible Preferred Stock and Stockholders’ (Deficit) Equity | F-7 | |||
| F-9 | ||||
| F-10 | ||||
F-1
Table of Contents
REPORT OF INDEPENDENT REGISTERED PUBLIC ACCOUNTING FIRM
The Board of Directors and Stockholders of
Fusion-io, Inc.
We have audited the accompanying consolidated balance sheets of Fusion-io, Inc. as of June 30, 2012 and 2013, and the related consolidated statements of operations, comprehensive income (loss), convertible preferred stock and stockholders’ (deficit) equity, and cash flows for each of the three years in the period ended June 30, 2013. These financial statements are the responsibility of the Company’s management. Our responsibility is to express an opinion on these financial statements based on our audits.
We conducted our audits in accordance with the standards of the Public Company Accounting Oversight Board (United States). Those standards require that we plan and perform the audit to obtain reasonable assurance about whether the financial statements are free of material misstatement. An audit includes examining, on a test basis, evidence supporting the amounts and disclosures in the financial statements. An audit also includes assessing the accounting principles used and significant estimates made by management, as well as evaluating the overall financial statement presentation. We believe that our audits provide a reasonable basis for our opinion.
In our opinion, the financial statements referred to above present fairly, in all material respects, the consolidated financial position of Fusion-io, Inc. as of June 30, 2012 and 2013, and the consolidated results of its operations and its cash flows for each of the three years in the period ended June 30, 2013, in conformity with U.S. generally accepted accounting principles.
We also have audited, in accordance with the standards of the Public Company Accounting Oversight Board (United States), Fusion-io, Inc.’s internal control over financial reporting as of June 30, 2013, based on criteria established in Internal Control-Integrated Framework issued by the Committee of Sponsoring Organizations of the Treadway Commission (1992 framework) and our report dated August 28, 2013 expressed an unqualified opinion thereon.
/s/ Ernst & Young LLP
Salt Lake City, Utah
August 28, 2013
F-2
Table of Contents
REPORT OF INDEPENDENT REGISTERED PUBLIC ACCOUNTING FIRM
The Board of Directors and Stockholders of
Fusion-io, Inc.
We have audited Fusion-io, Inc.’s internal control over financial reporting as of June 30, 2013, based on criteria established in Internal Control — Integrated Framework issued by the Committee of Sponsoring Organizations of the Treadway Commission (1992 framework) (the “COSO criteria”). Fusion-io, Inc.’s management is responsible for maintaining effective internal control over financial reporting, and for its assessment of the effectiveness of internal control over financial reporting included in the accompanying Management’s Annual Report on Internal Control Over Financial Reporting. Our responsibility is to express an opinion on the Company’s internal control over financial reporting based on our audit.
We conducted our audit in accordance with the standards of the Public Company Accounting Oversight Board (United States). Those standards require that we plan and perform the audit to obtain reasonable assurance about whether effective internal control over financial reporting was maintained in all material respects. Our audit included obtaining an understanding of internal control over financial reporting, assessing the risk that a material weakness exists, testing and evaluating the design and operating effectiveness of internal control based on the assessed risk, and performing such other procedures as we considered necessary in the circumstances. We believe that our audit provides a reasonable basis for our opinion.
A company’s internal control over financial reporting is a process designed to provide reasonable assurance regarding the reliability of financial reporting and the preparation of financial statements for external purposes in accordance with generally accepted accounting principles. A company’s internal control over financial reporting includes those policies and procedures that (1) pertain to the maintenance of records that, in reasonable detail, accurately and fairly reflect the transactions and dispositions of the assets of the company; (2) provide reasonable assurance that transactions are recorded as necessary to permit preparation of financial statements in accordance with generally accepted accounting principles, and that receipts and expenditures of the company are being made only in accordance with authorizations of management and directors of the company; and (3) provide reasonable assurance regarding prevention or timely detection of unauthorized acquisition, use or disposition of the company’s assets that could have a material effect on the financial statements.
Because of its inherent limitations, internal control over financial reporting may not prevent or detect misstatements. Also, projections of any evaluation of effectiveness to future periods are subject to the risk that controls may become inadequate because of changes in conditions or that the degree of compliance with the policies or procedures may deteriorate.
In our opinion, Fusion-io, Inc. maintained, in all material respects, effective internal control over financial reporting as of June 30, 2013, based on the COSO criteria.
We also have audited, in accordance with the standards of the Public Company Accounting Oversight Board (United States), the consolidated balance sheets of Fusion-io, Inc. as of June 30, 2012 and 2013, and the related consolidated statements of operations, comprehensive income (loss), convertible preferred stock and stockholders’ (deficit) equity, and cash flows for each of the three years in the period ended June 30, 2013 and our report dated August 28, 2013 expressed an unqualified opinion thereon.
/s/ Ernst & Young LLP
Salt Lake City, Utah
August 28, 2013
F-3
Table of Contents
CONSOLIDATED BALANCE SHEETS
(In thousands, except share and per share data)
| June 30, | ||||||||
| 2012 | 2013 | |||||||
Assets | ||||||||
Current assets: | ||||||||
Cash and cash equivalents | $ | 321,239 | $ | 238,351 | ||||
Accounts receivable, net of allowances of $953 and $1,990 as of June 30, 2012 and 2013, respectively | 56,720 | 69,107 | ||||||
Inventories | 59,457 | 71,160 | ||||||
Prepaid expenses and other current assets | 9,224 | 9,530 | ||||||
|
|
|
| |||||
Total current assets | 446,640 | 388,148 | ||||||
Property and equipment, net | 31,245 | 35,272 | ||||||
Restricted cash | — | 4,860 | ||||||
Intangible assets, net | 8,164 | 28,268 | ||||||
Goodwill | 54,777 | 149,467 | ||||||
Other assets | 194 | 1,433 | ||||||
|
|
|
| |||||
Total assets | $ | 541,020 | $ | 607,448 | ||||
|
|
|
| |||||
Liabilities and Stockholders’ Equity | ||||||||
Current liabilities: | ||||||||
Accounts payable | $ | 9,765 | $ | 14,170 | ||||
Accrued and other current liabilities | 29,187 | 44,425 | ||||||
Deferred revenue | 20,715 | 24,848 | ||||||
|
|
|
| |||||
Total current liabilities | 59,667 | 83,443 | ||||||
Deferred revenue, less current portion | 8,154 | 14,167 | ||||||
Other liabilities | 12,276 | 19,421 | ||||||
Commitments and contingencies | ||||||||
Stockholders’ equity: | ||||||||
Preferred stock, $0.0002 par value; 10,000,000 shares authorized as of June 30, 2012 and 2013; no shares issued and outstanding as of June 30, 2012 and 2013 | — | — | ||||||
Common stock, $0.0002 par value; 500,000,000 shares authorized as of June 30, 2012 and 2013; 93,391,415 and 98,522,795 shares issued and outstanding as of June 30, 2012 and 2013, respectively | 19 | 20 | ||||||
Additionalpaid-in capital | 531,478 | 599,292 | ||||||
Accumulated other comprehensive loss | (15 | ) | (110 | ) | ||||
Accumulated deficit | (70,559 | ) | (108,785 | ) | ||||
|
|
|
| |||||
Total stockholders’ equity | 460,923 | 490,417 | ||||||
|
|
|
| |||||
Total liabilities and stockholders’ equity | $ | 541,020 | $ | 607,448 | ||||
|
|
|
| |||||
See accompanying notes to consolidated financial statements
F-4
Table of Contents
CONSOLIDATED STATEMENTS OF OPERATIONS
(In thousands, except per share data)
| Year Ended June 30, | ||||||||||||
| 2011 | 2012 | 2013 | ||||||||||
Revenue | $ | 197,204 | $ | 359,349 | $ | 432,386 | ||||||
Cost of revenue | 84,043 | 159,045 | 177,915 | |||||||||
|
|
|
|
|
| |||||||
Gross profit | 113,161 | 200,304 | 254,471 | |||||||||
Operating expenses: | ||||||||||||
Sales and marketing | 55,698 | 87,171 | 126,508 | |||||||||
Research and development | 27,238 | 60,006 | 95,458 | |||||||||
General and administrative | 20,556 | 58,423 | 69,421 | |||||||||
|
|
|
|
|
| |||||||
Total operating expenses | 103,492 | 205,600 | 291,387 | |||||||||
|
|
|
|
|
| |||||||
Income (loss) from operations | 9,669 | (5,296 | ) | (36,916 | ) | |||||||
Other income (expense): | ||||||||||||
Interest income | 35 | 384 | 343 | |||||||||
Interest expense | (2,455 | ) | (177 | ) | (119 | ) | ||||||
Other (expense) income | (1,000 | ) | 121 | (30 | ) | |||||||
|
|
|
|
|
| |||||||
Income (loss) before income taxes | 6,249 | (4,968 | ) | (36,722 | ) | |||||||
Income tax expense | (1,694 | ) | (615 | ) | (1,504 | ) | ||||||
|
|
|
|
|
| |||||||
Net income (loss) | $ | 4,555 | $ | (5,583 | ) | $ | (38,226 | ) | ||||
|
|
|
|
|
| |||||||
Net income (loss) per common share: | ||||||||||||
Basic | $ | 0.27 | $ | (0.06 | ) | $ | (0.40 | ) | ||||
Diluted | $ | 0.06 | $ | (0.06 | ) | $ | (0.40 | ) | ||||
Weighted average number of shares: | ||||||||||||
Basic | 16,762 | 87,674 | 96,203 | |||||||||
Diluted | 81,654 | 87,674 | 96,203 | |||||||||
See accompanying notes to consolidated financial statements
F-5
Table of Contents
CONSOLIDATED STATEMENTS OF COMPREHENSIVE INCOME (LOSS)
(In thousands)
(unaudited)
| Year Ended June 30, | ||||||||||||
| 2011 | 2012 | 2013 | ||||||||||
Net income (loss) | $ | 4,555 | $ | (5,583 | ) | $ | (38,226 | ) | ||||
Reclassification of unrealized gain into net income (loss) on available for sale securities | (4 | ) | — | — | ||||||||
Foreign currency translation adjustment | 17 | (30 | ) | (95 | ) | |||||||
|
|
|
|
|
| |||||||
Comprehensive income (loss) | $ | 4,568 | $ | (5,613 | ) | $ | (38,321 | ) | ||||
|
|
|
|
|
| |||||||
See accompanying notes to consolidated financial statements
F-6
Table of Contents
CONSOLIDATED STATEMENTS OF CONVERTIBLE PREFERRED STOCK AND
STOCKHOLDERS’ (DEFICIT) EQUITY
(In thousands, except share data)
| Stockholders’ (Deficit) Equity | ||||||||||||||||||||||||||||||||
| Convertible Preferred Stock | Common Stock | Additional Paid-in Capital | Accumulated Other Comprehensive Income (Loss) | Accumulated Deficit | Total Stockholders’ (Deficit) Equity | |||||||||||||||||||||||||||
| Shares | Amount | Shares | Amount | |||||||||||||||||||||||||||||
Balance as of June 30, 2010 | 52,489,072 | $ | 104,513 | 13,610,481 | $ | 3 | $ | 2,738 | $ | 2 | $ | (68,852 | ) | $ | (66,109 | ) | ||||||||||||||||
Issuance of common stock, net of issuance costs of $3,789 | — | — | 12,660,607 | 2 | 219,168 | — | — | 219,170 | ||||||||||||||||||||||||
Exercise of stock options | — | — | 2,541,909 | 1 | 1,545 | — | — | 1,546 | ||||||||||||||||||||||||
Exercise of common stock warrant | — | — | 12,500 | — | 25 | — | — | 25 | ||||||||||||||||||||||||
Conversion of convertible preferred stock into common stock | (52,489,072 | ) | (104,513 | ) | 52,489,072 | 10 | 104,503 | — | — | 104,513 | ||||||||||||||||||||||
Reclassification of convertible preferred stock warrant liability upon conversion to common stock warrant | — | — | — | — | 2,280 | — | — | 2,280 | ||||||||||||||||||||||||
Repurchase of common stock | — | — | (165,000 | ) | — | (661 | ) | — | (679 | ) | (1,340 | ) | ||||||||||||||||||||
Stock-based compensation | — | — | — | — | 8,637 | — | — | 8,637 | ||||||||||||||||||||||||
Income tax benefit from stock option exercises | — | — | — | — | 1,154 | — | — | 1,154 | ||||||||||||||||||||||||
Foreign currency translation adjustment | — | — | — | — | — | 17 | — | 17 | ||||||||||||||||||||||||
Reclassification of unrealized gain into net income on available for sale securities | — | — | — | — | — | (4 | ) | — | (4 | ) | ||||||||||||||||||||||
Net income | — | — | — | — | — | — | 4,555 | 4,555 | ||||||||||||||||||||||||
|
|
|
|
|
|
|
|
|
|
|
|
|
|
|
| |||||||||||||||||
Balance as of June 30, 2011 | — | $ | — | 81,149,569 | $ | 16 | $ | 339,389 | $ | 15 | $ | (64,976 | ) | $ | 274,444 | |||||||||||||||||
Issuance of common stock, net of issuance costs of $1,063 | — | — | 3,000,000 | 1 | 93,976 | — | — | 93,977 | ||||||||||||||||||||||||
Exercise of stock options | — | — | 7,128,528 | 1 | 8,209 | — | — | 8,210 | ||||||||||||||||||||||||
Issuance of restricted stock awards and restricted stock units, net of repurchases | — | — | 45,390 | — | (44 | ) | — | — | (44 | ) | ||||||||||||||||||||||
Issuance of common stock under employee stock purchase plan | — | — | 148,938 | — | 2,405 | — | — | 2,405 | ||||||||||||||||||||||||
Exercise of common stock warrant | — | — | 121,839 | — | — | — | — | — | ||||||||||||||||||||||||
Issuance of common stock to former IO Turbine stockholders | — | — | 1,633,315 | 1 | 43,485 | — | — | 43,486 | ||||||||||||||||||||||||
Estimated fair value of stock options assumed in connection with business acquisition | — | — | — | — | 884 | — | — | 884 | ||||||||||||||||||||||||
Vesting of common shares subject to repurchase | — | — | 163,836 | — | 17 | — | — | 17 | ||||||||||||||||||||||||
Stock-based compensation | — | — | — | — | 40,657 | — | — | 40,657 | ||||||||||||||||||||||||
Foreign currency translation adjustment | — | — | — | — | — | (30 | ) | — | (30 | ) | ||||||||||||||||||||||
F-7
Table of Contents
FUSION-IO, INC.
CONSOLIDATED STATEMENTS OF CONVERTIBLE PREFERRED STOCK AND
STOCKHOLDERS’ (DEFICIT) EQUITY – (Continued)
(In thousands, except share data)
| Stockholders’ (Deficit) Equity | ||||||||||||||||||||||||||||||||
| Convertible Preferred Stock | Common Stock | Additional Paid-in Capital | Accumulated Other Comprehensive Income (Loss) | Accumulated Deficit | Total Stockholders’ (Deficit) Equity | |||||||||||||||||||||||||||
| Shares | Amount | Shares | Amount | |||||||||||||||||||||||||||||
Income tax benefit from stock option exercises | — | — | — | — | 2,500 | — | — | 2,500 | ||||||||||||||||||||||||
Net loss | — | — | — | — | — | — | (5,583 | ) | (5,583 | ) | ||||||||||||||||||||||
|
|
|
|
|
|
|
|
|
|
|
|
|
|
|
| |||||||||||||||||
Balance as of June 30, 2012 | — | $ | — | 93,391,415 | $ | 19 | $ | 531,478 | $ | (15 | ) | $ | (70,559 | ) | $ | 460,923 | ||||||||||||||||
Exercise of stock options | — | — | 4,183,681 | 1 | 8,443 | — | — | 8,444 | ||||||||||||||||||||||||
Issuance of restricted stock awards and restricted stock units, net of repurchases | — | — | 336,116 | — | (3,352 | ) | — | — | (3,352 | ) | ||||||||||||||||||||||
Issuance of common stock under employee stock purchase plan | — | — | 423,467 | — | 7,215 | — | — | 7,215 | ||||||||||||||||||||||||
Estimated fair value of stock options assumed in connection with business acquisitions | — | — | — | — | 1,418 | — | — | 1,418 | ||||||||||||||||||||||||
Vesting of common shares subject to repurchase | — | — | 188,116 | — | 12 | — | — | 12 | ||||||||||||||||||||||||
Stock-based compensation | — | — | — | — | 53,955 | — | — | 53,955 | ||||||||||||||||||||||||
Foreign currency translation adjustment | — | — | — | — | — | (95 | ) | — | (95 | ) | ||||||||||||||||||||||
Income tax benefit from stock option exercises | — | — | — | — | 123 | — | — | 123 | ||||||||||||||||||||||||
Net loss | — | — | — | — | — | — | (38,226 | ) | (38,226 | ) | ||||||||||||||||||||||
|
|
|
|
|
|
|
|
|
|
|
|
|
|
|
| |||||||||||||||||
Balance as of June 30, 2013 | — | $ | — | 98,522,795 | $ | 20 | $ | 599,292 | $ | (110 | ) | $ | (108,785 | ) | $ | 490,417 | ||||||||||||||||
|
|
|
|
|
|
|
|
|
|
|
|
|
|
|
| |||||||||||||||||
See accompanying notes to consolidated financial statements
F-8
Table of Contents
CONSOLIDATED STATEMENTS OF CASH FLOWS
(In thousands)
| Year Ended June 30, | ||||||||||||
| 2011 | 2012 | 2013 | ||||||||||
Operating activities: | ||||||||||||
Net income (loss) | $ | 4,555 | $ | (5,583 | ) | $ | (38,226 | ) | ||||
Adjustments to reconcile net income (loss) to net cash (used in) provided by operating activities: | ||||||||||||
Depreciation and amortization | 4,547 | 9,009 | 16,292 | |||||||||
Stock-based compensation | 8,637 | 42,645 | 56,426 | |||||||||
Excess tax benefit from stock-based awards | (1,154 | ) | (2,500 | ) | (123 | ) | ||||||
Deferred taxes | — | (2,782 | ) | (247 | ) | |||||||
Othernon-cash items | 3,185 | (26 | ) | 11 | ||||||||
Changes in operating assets and liabilities: | ||||||||||||
Accounts receivable, net | (38,793 | ) | (12,346 | ) | (12,271 | ) | ||||||
Inventories | (10,474 | ) | (23,835 | ) | (10,591 | ) | ||||||
Prepaid expenses and other assets | (2,549 | ) | (5,430 | ) | (1,049 | ) | ||||||
Accounts payable | (593 | ) | (249 | ) | 4,094 | |||||||
Accrued and other liabilities | 11,604 | 19,013 | 15,261 | |||||||||
Deferred revenue | 11,178 | 16,852 | 9,809 | |||||||||
|
|
|
|
|
| |||||||
Net cash (used in) provided by operating activities | (9,857 | ) | 34,768 | 39,386 | ||||||||
Investing activities: | ||||||||||||
Proceeds from the sale ofshort-term investments | 11,964 | — | — | |||||||||
Business acquisitions, net of cash acquired | — | (17,578 | ) | (114,157 | ) | |||||||
Proceeds from the sale of property and equipment | 152 | 1 | — | |||||||||
Purchases of property and equipment | (13,032 | ) | (23,997 | ) | (14,440 | ) | ||||||
|
|
|
|
|
| |||||||
Net cash used in investing activities | (916 | ) | (41,574 | ) | (128,597 | ) | ||||||
Financing activities: | ||||||||||||
Repurchases of common stock | (1,223 | ) | (1,067 | ) | — | |||||||
Proceeds from a loan from a financial institution | 11,000 | — | — | |||||||||
Repayment of notes payable and capital lease obligations | (11,254 | ) | (110 | ) | (623 | ) | ||||||
Proceeds from exercises of stock options | 1,546 | 8,210 | 8,444 | |||||||||
Issuance of restricted awards and restricted stock units, net of repurchases | — | (44 | ) | (3,352 | ) | |||||||
Proceeds from issuance of common stock, net of issuance costs | 219,170 | 93,977 | — | |||||||||
Proceeds from exercise of common stock warrant | 25 | — | — | |||||||||
Proceeds from issuance of common stock under employee stock purchase plan | — | 5,061 | 6,702 | |||||||||
Excess tax benefit from stock option exercises | 1,154 | 2,500 | 123 | |||||||||
Change in restricted cash | 695 | — | (4,860 | ) | ||||||||
|
|
|
|
|
| |||||||
Net cash provided by financing activities | 221,113 | 108,527 | 6,434 | |||||||||
Effect of exchange rate changes on cash and cash equivalents | 45 | (86 | ) | (111 | ) | |||||||
|
|
|
|
|
| |||||||
Net increase (decrease) in cash and cash equivalents | 210,385 | 101,635 | (82,888 | ) | ||||||||
Cash and cash equivalents at the beginning of period | 9,219 | 219,604 | 321,239 | |||||||||
|
|
|
|
|
| |||||||
Cash and cash equivalents at the end of period | $ | 219,604 | $ | 321,239 | $ | 238,351 | ||||||
|
|
|
|
|
| |||||||
Supplemental disclosure of cash flow information: | ||||||||||||
Cash paid for interest | $ | 427 | $ | 146 | $ | 99 | ||||||
Supplemental disclosure of noncash investing and financing activities: | ||||||||||||
Conversion of convertible preferred stock to common stock | $ | 104,513 | $ | — | $ | — | ||||||
Reclassification of convertible preferred stock warrant liability upon conversion to common stock warrant | $ | 2,280 | $ | — | $ | — | ||||||
Vesting of common shares subject to repurchase | $ | — | $ | 17 | $ | 12 | ||||||
See accompanying notes to consolidated financial statements
F-9
Table of Contents
NOTES TO CONSOLIDATED FINANCIAL STATEMENTS
1. Description of Business and Summary of Significant Accounting Policies
Fusion-io, Inc. (the “Company” or “Fusion-io”) provides an enterprise storage class memory platform and storage solution portfolio, based on the Company’s ioMemory technology with virtual storage layer (“VSL”) software and direct acceleration, shared acceleration, and virtualization acceleration products. The Company was originally incorporated in the state of Nevada in December 2005 and in June 2010 was reincorporated in the state of Delaware as Fusion-io, Inc. The Company sells its products and services through its global direct sales force, original equipment manufacturers (“OEMs”), and other channel partners.
Basis of Presentation
The consolidated financial statements include the accounts of the Company and its wholly owned subsidiaries. All intercompany balances and transactions have been eliminated in the consolidated financial statements.
Segment and Geographic Information
Operating segments are defined in accounting standards as components of an enterprise about which separate financial information is available and is regularly evaluated by management, namely the chief operating decision maker of an organization, in order to make operating and resource allocation decisions. The Company has concluded it operates in one business segment, which is the development, marketing, and sale of storage memory platforms. Substantially all of the Company’s revenue for all periods presented in the accompanying consolidated statements of operations has been from sales of the ioMemory product lines and related customer support services. The Company’s headquarters and most of its operations are located in the United States; however, it conducts sales activities through sales offices in Europe and Asia. Revenue recognized from sales with aship-to location outside of the United States was 18%, 26%, and 40% for fiscal years 2011, 2012, and 2013, respectively. No country outside of the United States accounted for 10% or greater of revenue for all periods presented.Long-lived assets located outside of the United States were not material for all periods for which a consolidated balance sheet is presented.
Use of Estimates
The preparation of financial statements in conformity with U.S. generally accepted accounting principles (“U.S. GAAP”) requires management to make estimates and assumptions that affect the reported amounts of assets and liabilities and disclosure of contingent assets and liabilities at the date of the financial statements and the reported amounts of revenue and expenses during the reporting period. On an on-going basis, the Company evaluates its significant estimates, including those related to revenue recognition, sales returns, accounting for business combinations and impairment of long-lived and intangible assets including goodwill, determination of fair value of stock options, valuation of inventory, product warranty, and income taxes. The Company also uses estimates in determining the useful lives of property and equipment and intangible assets and in its provisions for doubtful accounts. Actual results could differ from those estimates.
Revenue Recognition
The Company derives its revenue primarily from sales of products and support services and enters intomultiple-element arrangements in the normal course of business with its customers and
F-10
Table of Contents
FUSION-IO, INC.
NOTES TO CONSOLIDATED FINANCIAL STATEMENTS – (Continued)
channel partners. In all arrangements, the Company does not recognize revenue until it can determine that persuasive evidence of an arrangement exists, delivery has occurred, the fee is fixed or determinable, and collection is deemed to be reasonably assured. In making these judgments, the Company evaluates these criteria as follows:
| • | Evidence of an Arrangement — The Company considers anon-cancelable agreement or purchase order signed by a customer to be persuasive evidence of an arrangement. |
| • | Delivery has Occurred — The Company considers delivery to have occurred when product has been delivered to the customer based on applicable shipping terms, and no post-delivery obligations exist other than ongoing support obligations under sold support services. In instances where customer acceptance is required, delivery is deemed to have occurred when customer acceptance has been achieved. |
| • | Fees are Fixed or Determinable — The Company considers the fee to be fixed or determinable unless the fee is subject to refund or adjustment or is not payable within normal payment terms. If the fee is subject to refund or adjustment, the Company recognizes revenue net of estimated returns or if a reasonable estimate cannot be made, when the right to a refund or adjustment lapses. |
| • | Collection is Reasonably Assured — The Company conducts a credit worthiness assessment on all of its customers. Generally the Company does not require collateral. The Company continues to evaluate collectability by reviewing its customers’ credit worthiness including a review of past transaction history. Payment terms are typically 30 to 45 days, except for certain customers that can have up to 75 days from the date of invoice. Collection is reasonably assured if, based upon the Company’s evaluation, it expects that the customer will be able to pay amounts under the arrangement as payments become due. If the Company determines that collection is not reasonably assured, revenue is deferred and recognized upon the receipt of cash. |
Some of the Company’s revenue arrangements are multiple-element arrangements because they are comprised of sales of both products and support services. Formultiple-element arrangements, the Company evaluates whether each deliverable should be accounted for as separate units of accounting. A deliverable constitutes a separate unit of accounting when it hasstand-alone value, and for an arrangement where a general right of return exists relative to a delivered item, delivery, or performance of the undelivered item must be considered probable and substantially in the Company’s control.Stand-alone value exists if the product or service is sold separately by the Company or by another vendor or could be resold by the customer. Where the aforementioned criteria for a separate unit of accounting are not met, the deliverable is combined with the undelivered element(s) and treated as a single unit of accounting for the purposes of allocation of the arrangement consideration and revenue recognition.
The Company’smultiple-element arrangements typically include two elements: ioMemory hardware, which includes embedded VSL virtualization software, and support services. The Company has determined that its ioMemory hardware and the embedded VSL virtualization software are considered a single unit of accounting because the hardware and software individually do not have standalone value and are never sold separately. Support services are considered a separate unit of accounting as they are sold separately and have standalone value.
The Company allocates arrangement consideration at the inception of an arrangement to all deliverables based on the relative selling price method in accordance with the selling price hierarchy,
F-11
Table of Contents
FUSION-IO, INC.
NOTES TO CONSOLIDATED FINANCIAL STATEMENTS – (Continued)
which includes:(1) vendor-specific objective evidence (“VSOE”), if available;(2) third-party evidence (“TPE”), ifvendor-specific objective evidence is not available; and (3) best estimate of selling price (“BESP”), if neither VSOE nor TPE is available.
| • | VSOE — The Company determines VSOE based on its historical pricing and discounting practices for the specific product or support service when sold separately. In determining VSOE, the Company requires that a substantial majority of the selling prices for products or support services fall within a reasonably narrow pricing range. The Company has priced certain of its ioMemory products within a narrow range and has used VSOE to allocate the selling price of deliverables for these specific sales. |
| • | TPE — When VSOE cannot be established for deliverables in multiple element arrangements, the Company applies judgment with respect to whether it can establish selling price based on TPE. TPE is determined based on competitor prices for similar deliverables when sold separately. Generally, the Company’s products differ from those of its peers such that the comparable pricing of support services with similar functionality cannot be obtained. Furthermore, the Company is unable to reliably determine what similar competitor services’ selling prices are on astand-alone basis. As a result, the Company has not been able to establish selling price based on TPE. |
| • | BESP — When the Company is unable to establish selling price using VSOE or TPE, it uses BESP in its allocation of arrangement consideration. The objective of BESP is to determine the price at which it would transact a sale if the product or support service was sold on astand-alone basis. The Company determines BESP for deliverables by considering multiple factors including, but not limited to, prices it charges for similar offerings, sales volume, geographies, market conditions, competitive landscape, and pricing practices. |
The Company’s agreements with certain customers, including certain OEMs and other channel partners, contain provisions for sales returns, price protection, stock rotation rights, and rebates in limited circumstances. In limited circumstances and on an infrequent basis, even if the Company is not obligated to accept returned products, the Company may determine it is in its best interest to accept returns in order to maintain good relationships with its customers. The Company recognizes revenue net of the effects of these estimated obligations at the time revenue is recorded.
The Company estimates product returns based upon its periodic analysis of historical returns as a percentage of revenue as well as known future returns. The Company periodically assesses the accuracy of its historical estimates and to date the actual results have been reasonably consistent with its estimates. While the Company believes it has sufficient experience and knowledge of the market and customer buying patterns to reasonably estimate such returns, actual market conditions or customer behavior could differ from its expectations and as a result, its actual results could change materially.
The Company’s price protection obligations with certain OEMs and other channel partners require it to notify them of any decreases in pricing and to provide them with a refund or credit for any units of the Company’s product that they have on hand as of the date of the pricing change. Historically, most of the Company’s sales to its OEMs and other channel partners have an identifiedend-user at the time it ships its products and thus the amount of inventory carried by its OEMs and other channel partners at any given time is limited. To date, the Company has not issued refunds or credits to its OEMs and other channel partners for price protection.
F-12
Table of Contents
FUSION-IO, INC.
NOTES TO CONSOLIDATED FINANCIAL STATEMENTS – (Continued)
Certain of the Company’s contracts allow for rebates that are based on a fixed percentage of its sales to the customer or sales to theend-user or a fixed dollar amount per unit. In addition, certain of the Company’s contracts allow for stock rotation rights that are limited by an amount equal to a fixed percentage of its sales to the customer. The Company recognizes the amount of the rebates and stock rotation rights as a reduction of revenues when the underlying revenue is recognized.
Deferred revenue primarily represents customer billings in excess of revenue recognized, primarily for support services. Support services are typically billed in advance on an annual basis or at the inception of a multiple year support contract and revenue is recognized ratably over the support period of one to five years.
The Company also sells stand-alone software products. These software products are sold with software maintenance services. VSOE of fair value for software maintenance services will be established by the rates charged in stand-alone sales of software maintenance contracts within a reasonably narrow pricing range. As the Company has not established VSOE of fair value on the software maintenance services due to lack of renewal history, revenue is recognized ratably for the entire arrangement fee, once the services have commenced, over the longest delivery period. During the years ended June 30, 2011, 2012, and 2013, the Company’s software revenue was not significant to its consolidated statements of operations.
Shipping and handling costs are included in cost of sales.
Cash and Cash Equivalents
Cash consists of deposits with financial institutions, and cash equivalents consist of money market funds.
Concentrations of Credit Risk and Significant Customers and Suppliers
Financial instruments that potentially subject the Company to a concentration of credit risk consist principally of cash, cash equivalents, and accounts receivable. The Company deposits cash with ahigh-credit-quality financial institution, which at times may exceed federally insured amounts. The Company has policies that limit its investments as to types of investments, maturity, liquidity, credit quality, concentration, and diversification of issuers. The Company performs initial and ongoing credit evaluations of its customers’ financial condition and will limit the amount of credit as deemed necessary, but generally does not require collateral.
The customers accounting for 10% or greater of revenue were as follows:
| Year Ended June 30, | ||||||||||||
| 2011 | 2012 | 2013 | ||||||||||
Customer A | 36 | % | 30 | % | 29 | % | ||||||
Customer B | 24 | % | 25 | % | 15 | % | ||||||
Customer C | 14 | % | 17 | % | 17 | % | ||||||
F-13
Table of Contents
FUSION-IO, INC.
NOTES TO CONSOLIDATED FINANCIAL STATEMENTS – (Continued)
The customers accounting for 10% or greater of accounts receivable, net were as follows:
| As of June 30, | ||||||||
| 2012 | 2013 | |||||||
Customer A | 30 | % | 39 | % | ||||
Customer B | 18 | % | * | |||||
Customer C | 19 | % | 13 | % | ||||
Customer D | 10 | % | * | |||||
Customer E | * | 10 | % | |||||
| * | Indicates less than 10% of total accounts receivable, net. |
As a consequence of the concentration of the Company’s customers and typically, a small number of large purchases by these customers, revenue, gross margin, and operating results may fluctuate significantly from period to period.
The Company relies on a limited number of suppliers for its contract manufacturing and certain raw material components. The Company believes that other vendors would be able to provide similar products and services; however, the qualification of such vendors may require substantialstart-up time. In order to mitigate any adverse impacts from a disruption of supply, the Company attempts to maintain an adequate supply of criticalsingle-sourced raw materials.
Accounts Receivable
Accounts receivable balances are recorded at the invoiced amount and arenon-interest-bearing. The Company maintains an allowance for doubtful accounts to reserve for potential uncollectible receivables. Allowances are made based upon a specific review of all significant outstanding invoices. For those invoices not specifically reserved, allowances are provided based upon a percentage of aged outstanding invoices. In determining these percentages, the Company analyzes its historical collection experience and current economic trends. Provisions are recorded in general and administrative expenses. The Company writes off accounts receivable balances to the allowance for doubtful accounts when it becomes likely that they will not be collected. Accounts receivable balances are considered past due when not paid in accordance with the contractual terms of the related arrangement. As of June 30, 2012 and 2013, the Company’s allowance for doubtful accounts was not considered significant.
The Company records a sales allowance to provide for estimated future product returns and price adjustments. In the period revenue is recognized, allowances are provided for estimated future product returns based on historical product return rates. If reliable estimates of future returns cannot be made, revenue is not recognized until the rights of return expire. The Company also provides allowances for rebates, discounts, and stock rotation rights based on programs in existence at the time revenue is recognized. The Company evaluates the estimate of sales allowances on a regular basis and adjusts the amount reserved accordingly.
F-14
Table of Contents
FUSION-IO, INC.
NOTES TO CONSOLIDATED FINANCIAL STATEMENTS – (Continued)
The changes in the Company’s sales allowances were as follows (in thousands):
| Year Ended June 30, | ||||||||||||
| 2011 | 2012 | 2013 | ||||||||||
Balance at beginning of period | $ | 912 | $ | 2,064 | $ | 953 | ||||||
Additions | 7,942 | 5,418 | 5,182 | |||||||||
Returns | (6,790 | ) | (6,529 | ) | (4,145 | ) | ||||||
|
|
|
|
|
| |||||||
Balance at end of period | $ | 2,064 | $ | 953 | $ | 1,990 | ||||||
|
|
|
|
|
| |||||||
Inventories
Inventories are stated at the lower of cost (using thefirst-in,first-out method) or market value. The Company periodically assesses the recoverability of all inventories, including raw materials,work-in-process, and finished goods to determine whether adjustments are required to record inventory at the lower of cost or market value. Inventory that the Company determines to be obsolete or in excess of forecasted usage is reduced to its estimated realizable value based on assumptions about future demand and market conditions. If actual demand is lower than the forecasted demand, additional inventorywrite-downs may be required.
Property and Equipment
Property and equipment are stated at historical cost less accumulated depreciation. Property and equipment acquired through the acquisition of a business are recorded at their estimated fair value at the date of acquisition. Repairs and maintenance costs are expensed as incurred if repairs and maintenance do not extend the useful life or improve the related assets. Depreciation and amortization, including amortization of leasehold improvements, is computed using thestraight-line method over the estimated useful lives of the assets, after consideration of the lease term. The estimated useful life of each asset category is as follows:
Computer equipment | 3 years | |
Software | 3 years | |
Property and equipment | 3 years | |
Furniture and fixtures | 5 years | |
Leasehold improvements | Shorter of useful life or remaining lease term |
Long-Lived Assets and Goodwill
Periodically the Company assesses potential impairment of its long-lived assets, which include property, equipment, and acquired intangible assets. The Company performs an impairment review whenever events or changes in circumstances indicate that the carrying value may not be recoverable. Factors the Company considers important which could trigger an impairment review include, but are not limited to, significant under-performance relative to historical or projected future operating results, significant changes in the manner of its use of acquired assets or its overall business strategy, and significant industry or economic trends. When the Company determines that the carrying value of a long-lived asset may not be recoverable based upon the existence of one or more of the above indicators, the Company determines the recoverability by comparing the carrying amount of the asset to net future undiscounted cash flows that the asset is expected to generate and recognizes an
F-15
Table of Contents
FUSION-IO, INC.
NOTES TO CONSOLIDATED FINANCIAL STATEMENTS – (Continued)
impairment charge equal to the amount by which the carrying amount exceeds the fair market value of the asset. The Company generally amortizes intangible assets on a straight-line basis over their estimated useful lives or, if appropriate, using a method that better represents the pattern of usage.
The Company tests goodwill for impairment annually as of April 1, or whenever events or changes in circumstances indicate that goodwill may be impaired. The Company initially assesses qualitative factors to determine whether the existence of events or circumstances leads to a determination that it is more-likely-than-not that the fair value of a reporting unit is less than its carrying amount. If, after assessing the totality of events or circumstances, the Company determines it is more-likely-than-not that the fair value of a reporting unit is less than its carrying amount, then the Company performs a first step by comparing the book value of net assets to the fair value of the Company’s single reporting unit. If the fair value is determined to be less than the book value, a second step is performed to compute the amount of impairment as the difference between the estimated fair value of goodwill and the carrying value.
There was no impairment of long-lived assets or goodwill during the years ended June 30, 2012 and 2013.
Product Warranty
The Company provides its customers a standard limited product warranty of up to five years. The standard warranty requires the Company to repair or replace defective products at no cost to the customer during such warranty period. The Company estimates the costs that may be incurred under its standard limited warranty and records a liability in the amount of such costs at the time product sales are recognized. Factors that affect the Company’s warranty liability include the number of installed units, identified warranty issues, historical experience, and management’s judgment regarding anticipated rates of warranty claims and cost per claim. The Company assesses the adequacy of its recorded warranty liability each period and makes adjustments to the liability as necessary based on actual experience.
The following table presents the changes in the product warranty liability (in thousands):
| Year Ended June 30, | ||||||||||||
| 2011 | 2012 | 2013 | ||||||||||
Balance at beginning of period | $ | 153 | $ | 666 | $ | 2,825 | ||||||
Warranty costs accrued | 1,280 | 4,930 | 6,293 | |||||||||
Warranty claims | (767 | ) | (2,771 | ) | (3,877 | ) | ||||||
|
|
|
|
|
| |||||||
Balance at end of period | $ | 666 | $ | 2,825 | $ | 5,241 | ||||||
|
|
|
|
|
| |||||||
Warranty costs accrued includes amounts accrued for products at the time of shipment, adjustments for changes in estimated costs for warranties on products shipped in the period, and changes in estimated costs for warranties on products shipped in prior periods. It is not practicable for the Company to determine the amounts applicable to each of these components.
Restricted Cash
As of June 30, 2012 and June 30, 2013, the Company had restricted cash of approximately $0 and $4,860,000. Approximately $3,360,000 relates to letters of credit for purposes of securing the
F-16
Table of Contents
FUSION-IO, INC.
NOTES TO CONSOLIDATED FINANCIAL STATEMENTS – (Continued)
Company’s obligations under facility leases which are collateralized by a portion of the Company’s cash through the term of the leases, the latest of which ends September 2021. In addition, the Company retained $1,500,000 as partial security for indemnification obligations of shareholders as part of the acquisition of ID7 Ltd. and SCST Limited (together, the “ID7 Entities”) (see Note 4). This restricted cash amount, less any indemnification claims, will be paid in September 2014.
Foreign Currency
The functional currency of the Company’s international subsidiaries is the local currency. For those subsidiaries, expenses denominated in the functional currency are translated into U.S. dollars using average exchange rates in effect during the period and assets and liabilities are translated usingperiod-end exchange rates. The foreign currency translation adjustments are included in accumulated other comprehensive loss as a separate component of stockholders’ equity. Foreign currency transaction gains or losses are recorded in other income (expense), net. Foreign currency transaction gains and losses for all periods presented were not material.
Stock-based Compensation
The Company recordsstock-based compensation expense related to employeestock-based awards based on the estimated fair value of the awards as determined on the date of grant. The Company utilizes theBlack-Scholes-Merton option pricing model to estimate the fair value of employee stock options. TheBlack-Scholes-Merton model requires the input of highly subjective and complex assumptions, including the estimated fair value of the Company’s common stock on the date of grant prior to the stock being publicly traded, the expected term of the stock option, and the expected volatility of the Company’s common stock over the period equal to the expected term of the grant. The Company estimates forfeitures at the date of grant and revises the estimates, if necessary, in subsequent periods if actual forfeitures differ from those estimates.
The Company accounts for stock options and warrants to purchase shares of stock that are issued tonon-employees based on the estimated fair value of such instruments using theBlack-Scholes-Merton option pricing model. The measurement ofstock-based compensation expense for these instruments is variable and subject to periodic adjustments to the estimated fair value until the awards vest or, in the case of the convertible preferred stock warrant which was outstanding in 2010 and until the initial public offering (“IPO”) in 2011, each reporting period until the warrant was exercised or converted to a warrant to purchase shares of common stock. Any resulting change in the estimated fair value is recognized in the Company’s consolidated statements of operations during the period in which the related services are rendered.
Income Taxes
Deferred tax assets and liabilities are accounted for using the liability method and represent the future tax consequences attributable to differences between financial statement carrying amounts of existing assets and liabilities and their respective tax bases. Deferred tax assets and liabilities are measured using enacted tax rates that are expected to be in effect when these temporary differences are expected to reverse. A valuation allowance is provided when it is more likely than not that some portion of the deferred tax assets will not be realized.
F-17
Table of Contents
FUSION-IO, INC.
NOTES TO CONSOLIDATED FINANCIAL STATEMENTS – (Continued)
Advertising
The Company expenses advertising costs as incurred. Advertising expense was $12,000, $120,000, and $259,000 for fiscal years 2011, 2012, and 2013, respectively.
Research and Development
Research and development expenses consist primarily of personnel costs, including incentive compensation, depreciation associated with research and development equipment, contract labor and consulting services, amortization of intangible assets, facilities-related costs, travel-related costs, and prototype expenses. Research and development costs are expensed as incurred.
Software Development Costs
The Company expenses software development costs as incurred until technological feasibility is attained, including research and development costs associated withstand-alone software products and software embedded in hardware products. Technological feasibility is attained when the Company has completed the planning, design, and testing phase of development of its software and the software has been determined viable for its intended use, which typically occurs when beta testing commences. The period of time between when beta testing commences and when the software is available for general release to customers has historically been short with immaterial amounts of software development costs incurred during this period. Accordingly, the Company has not capitalized any software development costs to date.
In accounting for the development of computer software developed or obtained for internal use, the Company capitalizes qualifying computer software costs, which are incurred during the application development stage, and amortizes them over the software’s estimated useful life. For the years ended June 30, 2012 and 2013, the Company capitalized approximately $1,956,000 and $0 related to the development and implementation of an enterprise resource planning system. For the years ended June 30, 2011, 2012, and 2013, the Company recognized depreciation expense of $0, $107,000, and $507,000 related to its enterprise resource planning system.
Presentation of Certain Taxes
The Company collects various taxes from customers and remits these amounts to the applicable taxing authorities. The Company’s accounting policy is to exclude these taxes from revenue and cost of revenue.
Net Income (Loss) Per Share
Basic net income (loss) per share is computed using the weighted-average number of common shares outstanding during the period, less weighted-average common shares subject to repurchase. Diluted net income (loss) per share is computed using the weighted-average number of common shares outstanding and potentially dilutive common shares outstanding during the period that have a dilutive effect on net income (loss) per share. Potentially dilutive common shares result from the assumed exercise of outstanding stock options, assumed vesting of outstanding restricted stock subject to vesting provisions, common stock warrants, restricted stock awards (“RSAs”), and restricted stock units (“RSUs”). In a net loss position, diluted net loss per share is computed using only the weighted-average number of common shares outstanding during the period, less weighted-average common shares subject to repurchase, as any additional common shares would be anti-dilutive.
F-18
Table of Contents
FUSION-IO, INC.
NOTES TO CONSOLIDATED FINANCIAL STATEMENTS – (Continued)
The following table presents the reconciliation of the numerator and denominator used in the calculation of basic and diluted net income (loss) per share (in thousands):
| Year Ended June 30, | ||||||||||||
| 2011 | 2012 | 2013 | ||||||||||
Numerator: | ||||||||||||
Net income (loss) attributable to common stockholders | $ | 4,555 | $ | (5,583 | ) | $ | (38,226 | ) | ||||
Denominator: | ||||||||||||
Weighted-average common shares outstanding | 17,247 | 87,933 | 96,658 | |||||||||
Lessweighted-average common shares outstanding subject to repurchase | (485 | ) | (259 | ) | (455 | ) | ||||||
|
|
|
|
|
| |||||||
Weighted-average shares, basic | 16,762 | 87,674 | 96,203 | |||||||||
|
|
|
|
|
| |||||||
Dilution due to stock options and common stock warrant | 64,892 | — | — | |||||||||
|
|
|
|
|
| |||||||
Weighted-average shares, diluted | 81,654 | 87,674 | 96,203 | |||||||||
|
|
|
|
|
| |||||||
The followingweighted-average common stock equivalents wereanti-dilutive and therefore were excluded from the calculation of diluted net income (loss) per share (in thousands):
| Year Ended June 30, | ||||||||||||
| 2011 | 2012 | 2013 | ||||||||||
Stock options | 8,846 | 18,452 | 12,151 | |||||||||
Common stock subject to repurchase | — | 134 | 173 | |||||||||
Warrant – common | — | 39 | — | |||||||||
|
|
|
|
|
| |||||||
Total | 8,846 | 18,625 | 12,324 | |||||||||
|
|
|
|
|
| |||||||
Recently Issued and Adopted Accounting Pronouncements
In February 2013, the Financial Accounting Standards Board (the “FASB”) issued new guidance which improves the reporting of reclassifications out of accumulated other comprehensive income (loss) (“AOCI”). The new guidance requires that the effect of significant reclassifications out of AOCI be reported on the respective line items in net income (loss) if an amount is reclassified in its entirety to net income (loss). For those items not reclassified in its entirety to net income (loss), an entity must cross-reference to disclosures where additional details about the effects of the reclassifications are disclosed. Furthermore, information about amounts reclassified out of AOCI must be shown by component. The Company will adopt this guidance in the first quarter of fiscal year 2014. The Company does not expect the adoption of this guidance to have a material impact on the Company’s results of operations, financial position, or cash flows.
F-19
Table of Contents
FUSION-IO, INC.
NOTES TO CONSOLIDATED FINANCIAL STATEMENTS – (Continued)
2. Balance Sheet Components
Cash and Cash Equivalents
Cash and cash equivalents were as follows (in thousands):
| June 30, 2012 | ||||||||||||||||
| Amortized Cost | Unrealized Gains | Unrealized Losses | Estimated Fair Value | |||||||||||||
Cash and cash equivalents: | ||||||||||||||||
Cash | $ | 54,295 | $ | — | $ | — | $ | 54,295 | ||||||||
Money market funds | 266,944 | — | — | 266,944 | ||||||||||||
|
|
|
|
|
|
|
| |||||||||
Total cash and cash equivalents | $ | 321,239 | $ | — | $ | — | $ | 321,239 | ||||||||
|
|
|
|
|
|
|
| |||||||||
| June 30, 2013 | ||||||||||||||||
| Amortized Cost | Unrealized Gains | Unrealized Losses | Estimated Fair Value | |||||||||||||
Cash and cash equivalents: | ||||||||||||||||
Cash | $ | 36,107 | $ | — | $ | — | $ | 36,107 | ||||||||
Money market funds | 202,244 | — | — | 202,244 | ||||||||||||
|
|
|
|
|
|
|
| |||||||||
Total cash and cash equivalents | $ | 238,351 | $ | — | $ | — | $ | 238,351 | ||||||||
|
|
|
|
|
|
|
| |||||||||
Restricted cash: | ||||||||||||||||
Cash | $ | 4,860 | $ | — | $ | — | $ | 4,860 | ||||||||
Inventories
Inventories consisted of the following (in thousands):
| June 30, | ||||||||
| 2012 | 2013 | |||||||
Raw materials | $ | 20,263 | $ | 32,067 | ||||
Work in progress | 30,065 | 25,497 | ||||||
Finished goods | 9,129 | 13,596 | ||||||
|
|
|
| |||||
| $ | 59,457 | $ | 71,160 | |||||
|
|
|
| |||||
Property and Equipment
Property and equipment consisted of the following (in thousands):
| June 30, | ||||||||
| 2012 | 2013 | |||||||
Computer equipment | $ | 14,904 | $ | 21,866 | ||||
Software | 4,076 | 4,674 | ||||||
Property and equipment | 5,682 | 10,625 | ||||||
Furniture and fixtures | 3,759 | 4,294 | ||||||
Leasehold improvements | 12,520 | 15,446 | ||||||
Construction in progress | 329 | 203 | ||||||
|
|
|
| |||||
| 41,270 | 57,108 | |||||||
Less accumulated depreciation and amortization | (10,025 | ) | (21,836 | ) | ||||
|
|
|
| |||||
| $ | 31,245 | $ | 35,272 | |||||
|
|
|
| |||||
F-20
Table of Contents
FUSION-IO, INC.
NOTES TO CONSOLIDATED FINANCIAL STATEMENTS – (Continued)
Depreciation expense (including amortization of leasehold improvements) was $4,547,000, $6,673,000, and $11,802,000 for the fiscal years ended June 30, 2011, 2012, and 2013, respectively.
During the fiscal year ended June 30, 2010, the Company capitalized leasehold improvements primarily related to its corporate offices of $1,047,000. The leasehold improvements were originally amortized over the remaining period of the related facility lease that was to end in July 2015. In December 2010, the Company entered into a termination agreement related to this lease resulting in the lease terminating on April 30, 2011. The net book value of the related leasehold improvements of $1,335,000 as of December 31, 2010 was amortized on astraight-line basis over the remaining lease term ending April 30, 2011.
During the fiscal years ended June 30, 2011, 2012, and 2013, the Company capitalized leasehold improvements of $3,358,000, $7,252,000, and $2,926,000, respectively, related to its various offices which are being amortized over the related lease terms, with the latest ending in September 2021.
Accrued and Other Current Liabilities
Accrued and other current liabilities consisted of the following (in thousands):
| June 30, | ||||||||
| 2012 | 2013 | |||||||
Accrued compensation | $ | 19,034 | $ | 25,146 | ||||
Accrued warranty expense | 2,825 | 5,241 | ||||||
Accrued other liabilities | 7,328 | 14,038 | ||||||
|
|
|
| |||||
| $ | 29,187 | $ | 44,425 | |||||
|
|
|
| |||||
Long-term Other Liabilities
Long-term other liabilities consisted of the following (in thousands):
| June 30, | ||||||||
| 2012 | 2013 | |||||||
Long-term deferred tax liability | $ | 4,026 | $ | 4,900 | ||||
Long-term deferred rent | 8,250 | 9,209 | ||||||
Long-term other liabilities | — | 5,312 | ||||||
|
|
|
| |||||
| $ | 12,276 | $ | 19,421 | |||||
|
|
|
| |||||
3. Fair Value Measurements
Assets Measured and Recorded at Fair Value on a Recurring Basis
The Company measures and records certain financial assets at fair value on a recurring basis. Fair value is based on the price that would be received from selling an asset or paid to transfer a liability in an orderly transaction between market participants at the measurement date.
F-21
Table of Contents
FUSION-IO, INC.
NOTES TO CONSOLIDATED FINANCIAL STATEMENTS – (Continued)
The Company’s financial instruments that are measured at fair value on a recurring basis consist of money market funds. The following three levels of inputs are used to measure the fair value of financial instruments:
| Level 1: | Quoted prices in active markets for identical assets or liabilities. The Company classifies its money market funds as Level 1 instruments as they are traded in active markets with sufficient volume and frequency of transactions. | |
| Level 2: | Observable prices that are based on inputs not quoted on active markets, but corroborated by market data. | |
| Level 3: | Unobservable inputs are used when little or no market data is available. | |
The fair value of the Company’s money market funds was as follows (in thousands):
| Fair Value Measurements at June 30, 2012 Using | ||||||||||||||||
Description | Level 1 | Level 2 | Level 3 | Total | ||||||||||||
Cash equivalents: | ||||||||||||||||
Money market funds | $ | 266,944 | $ | — | $ | — | $ | 266,944 | ||||||||
| Fair Value Measurements at June 30, 2013 Using | ||||||||||||||||
Description | Level 1 | Level 2 | Level 3 | Total | ||||||||||||
Cash equivalents: | ||||||||||||||||
Money market funds | $ | 202,244 | $ | — | $ | — | $ | 202,244 | ||||||||
Fair Value of Other Financial Instruments
The carrying amounts of the Company’s accounts receivable, accounts payable, accrued liabilities, and other liabilities approximate their fair values due to the short-term nature of these assets and liabilities.
4. Acquisitions
NexGen Storage, Inc.
On April 24, 2013, the Company acquired 100% of the stock of NexGen Storage, Inc., (“NexGen”), a developer of hybrid storage systems based in Louisville, Colorado, pursuant to the Merger Agreement dated April 24, 2013. The consideration transferred was $110,737,000, consisting of (i) $108,973,000 in cash, (ii) $1,418,000 in assumed stock options, and (iii) $346,000 related to the elimination of intercompany balances. Of the cash consideration, $17,854,000 of cash was deposited in escrow as partial security for the indemnification obligations of the NexGen stockholders pursuant to the Merger Agreement. This amount, less any indemnification claims, will be distributed promptly following April 24, 2014.
In addition, the Company agreed to pay $5,000,000 in cash to one of the selling stockholders in 12 equal quarterly installments and issue 339,627 in shares of the Company’s common stock to another selling stockholder, which is subject to a repurchase right that lapses in 12 equal quarterly installments. The quarterly installments for both the cash and restricted stock amounts are subject to ongoing employment requirements.
F-22
Table of Contents
FUSION-IO, INC.
NOTES TO CONSOLIDATED FINANCIAL STATEMENTS – (Continued)
The Company also assumed NexGen’s options and restricted stock units that were unvested at the time of the merger that were converted into unvested options to purchase 822,927 shares of the Company’s common stock and 84,808 of the Company’s restricted stock units. The fair value of the assumed options was estimated using the Black-Scholes-Merton option pricing model with market assumptions. Option pricing models require the use of highly subjective market assumptions, including expected stock price volatility, which if changed, can materially affect fair value estimates. The more significant assumptions used in estimating the fair value of these stock options include expected volatility of 65.0%, expected option term of between 3.9 years and 5.7 years and a risk-free interest rate of 0.70%. The fair value of the assumed restricted stock units and the common stock was $16.63 and is based on the closing trading price of the Company’s common stock on the date of acquisition.
Subsequent to the acquisition, the Company will recognize over the underlying future service period up to approximately $23,701,000 of compensation expense related to the fair value of the cash, restricted stock, and the assumed stock-based awards.
Preliminary Allocation of Consideration Transferred
Pursuant to the Company’s business combinations accounting policy, the total consideration transferred for NexGen was allocated to the preliminary net tangible and intangible assets based upon their preliminary fair values as set forth below. The acquisition of NexGen adds to the Company’s software solutions and expands the Company’s reach into small to medium enterprise markets. These factors contributed to consideration transferred in excess of the fair value of the NexGen net tangible and intangible assets acquired, and as a result, the Company has recorded goodwill in connection with this transaction.
The Company’s preliminary allocation of consideration transferred for NexGen is as follows (in thousands):
Total assets | $ | 3,777 | ||
Total liabilities | (1,973 | ) | ||
|
| |||
Net acquired tangible assets | $ | 1,804 | ||
Developed technology (weighted-average useful life of 4 years) | 15,000 | |||
Trade names (weighted-average useful life of 2 years) | 520 | |||
Customer relationships (weighted-average useful life of 6 years) | 390 | |||
|
| |||
Total identifiable intangible assets | $ | 15,910 | ||
Goodwill | 93,023 | |||
|
| |||
Total fair value of consideration transferred | $ | 110,737 | ||
|
|
The preliminary allocation of the consideration transferred is subject to potential adjustments primarily related to accrued liabilities and the assessment of tax-related matters that could have a material impact on the consolidated financial statements. The Company expects the allocation of the consideration transferred to be final within the measurement period (up to one year from the acquisition date).
The Company recorded revenue associated with NexGen of approximately $1,546,000 from the date of acquisition through June 30, 2013. Operating expenses associated with NexGen were approximately $4,490,000 from the date of acquisition through June 30, 2013, of which $1,532,000 related to stock-based compensation expense.
F-23
Table of Contents
FUSION-IO, INC.
NOTES TO CONSOLIDATED FINANCIAL STATEMENTS – (Continued)
ID7 Entities
On March 13, 2013, the Company acquired 100% of the stock of the ID7 Entities for total cash consideration of approximately $5,869,000. The ID7 Entities, located in England and Wales, are the primary developers of the SCST storage subsystem enabling enhanced shared storage software functionality for any Linux server or appliance. Accordingly, the assets, liabilities, and operating results of the ID7 Entities are reflected in the Company’s consolidated financial statements following the date of acquisition. Of the cash consideration, the Company retained $1,500,000 as partial security for indemnification obligations of shareholders as part of this acquisition. This restricted cash amount, less any indemnification claims, will be paid in September 2014. In connection with the acquisition, the Company issued 135,131 shares of its common stock to the former shareholders of the ID7 Entities, which is subject to a repurchase right, that lapse 25% after one year and the remaining 75% in 12 equal quarterly installments thereafter. Subsequent to the acquisition, the Company will recognize over the underlying future service period up to approximately $2,367,000 of stock-based compensation expense related to the fair value of the restricted stock awards. The fair value of the common stock was $17.52 and is based on the closing trading price of the Company’s common stock on the date of acquisition.
Preliminary Allocation of Consideration Transferred
Pursuant to the Company’s business combinations accounting policy, the total consideration transferred for ID7 Entities was allocated to the preliminary net liabilities assumed and intangible assets acquired based upon their preliminary fair values as set forth below. The acquisition of the ID7 Entities is an important part of the Company’s strategy as they are the primary developers of the SCST storage subsystem enabling enhanced shared storage software functionality for any Linux server or appliance. These factors contributed to consideration transferred in excess of the fair value of the net liabilities assumed and intangible assets acquired, and as a result, the Company has recorded goodwill in connection with this transaction.
The Company’s preliminary allocation of consideration transferred for ID7 Entities is as follows (in thousands):
Total assets | $ | 76 | ||
Total liabilities | (645 | ) | ||
|
| |||
Net assumed liabilities | $ | (569 | ) | |
Developed technology (weighted-average useful life of 4 years) | 5,900 | |||
Goodwill | 1,667 | |||
Deferred income tax liability | (1,129 | ) | ||
|
| |||
Total fair value of consideration transferred | $ | 5,869 | ||
|
|
The preliminary allocation of the consideration transferred is subject to potential adjustments primarily related to accrued liabilities and the assessment of tax-related matters that could have a material impact on the consolidated financial statements. The Company expects the allocation of the consideration transferred to be final within the measurement period (up to one year from the acquisition date). Subsequent to the acquisition date, the Company identified approximately $140,000 in deferred tax assets that were not previously recorded in conjunction with the acquisition of ID7 Entities. The Company determined that the adjustment related to facts and circumstances that existed at the
F-24
Table of Contents
FUSION-IO, INC.
NOTES TO CONSOLIDATED FINANCIAL STATEMENTS – (Continued)
acquisition date. As a result of this new information, the acquisition date net deferred tax liability was retrospectively decreased by $140,000 with a corresponding decrease to goodwill. The adjustment did not impact the Company’s results from operations and is reflected above in the Company’s preliminary allocation of consideration transferred.
The Company assumed notes payable of approximately $623,000 as part of the acquisition of the ID7 Entities, which were paid in full in March 2013.
Operating results of the ID7 Entities subsequent to the date of acquisition are not separately disclosed as the results were not material to the Company’s consolidated statements of operations.
IO Turbine, Inc.
On August 11, 2011, the Company acquired 100% of the stock of IO Turbine, Inc. (“IO Turbine”) pursuant to the Agreement and Plan of Reorganization dated August 4, 2011. IO Turbine was a provider of caching solutions for virtual environments, based in San Jose, California. Accordingly, the assets, liabilities, and operating results of IO Turbine are reflected in the Company’s condensed consolidated financial statements following the date of acquisition. The fair value of the consideration transferred was approximately $65,568,000, which consisted of (i) cash of approximately $21,199,000, (ii) approximately $43,485,000 in common stock valued at $28.40 per share, the closing sale price of the Company’s common stock on the closing date of the acquisition, and (iii) approximately $884,000 in assumed stock options attributable to pre-acquisition service. In addition, subsequent to the acquisition, the Company has been recognizing and will continue to recognize up to approximately $26,421,000 of stock-based compensation expense related to the fair value of assumed restricted stock awards and stock options, of which approximately $3,795,000 were expensed immediately in connection with the acceleration of vesting of certain restricted stock awards and the remainder will continue to be recognized over the underlying future service period of the assumed stock awards and stock options. At the time of acquisition, IO Turbine stockholders holding RSAs had the option to receive cash and/or shares of the Company’s common stock for their unvested RSAs based on a fixed value determined at the acquisition date. As a result, the Company: (i) issued approximately 414,000 shares of its common stock that remain subject to forfeiture based on the original vesting schedule applicable to such awards and (ii) will pay up to approximately $4,631,000 in cash in accordance with the original vesting schedule applicable to such awards. Of this total cash amount, approximately $4,037,000 had been paid through June 30, 2013.
Approximately $3,628,000 of cash and 278,974 shares of common stock were deposited in escrow and were held for one year from the date of acquisition as partial security for indemnification obligations of the IO Turbine stockholders pursuant to the Merger Agreement, before being released in full from escrow in August 2012. The Company did not make any claims for indemnification against the IO Turbine stockholders pursuant to the Merger Agreement.
The fair value of the assumed options was estimated using theBlack-Scholes-Merton option pricing model with market assumptions. Option pricing models require the use of highly subjective market assumptions, including expected stock price volatility, which if changed, can materially affect fair value estimates. The more significant assumptions used in estimating the fair value of these stock options include expected volatility of 60%, expected option term of between 5.2 years and 5.9 years and arisk-free interest rate of 2.0%.
F-25
Table of Contents
FUSION-IO, INC.
NOTES TO CONSOLIDATED FINANCIAL STATEMENTS – (Continued)
Allocation of Consideration Transferred
Pursuant to the Company’s business combinations accounting policy, the total consideration transferred for IO Turbine was allocated to the net tangible and intangible assets based upon their fair values as set forth below. The acquisition of IO Turbine is a key part of the Company’s strategy to enable enterprise customers to increase the utilization, performance, and efficiency of their datacenter resources, and extract greater value from their information assets. These factors contributed to consideration transferred in excess of the fair value of the IO Turbine net tangible and intangible assets acquired, and as a result, the Company has recorded goodwill in connection with this transaction. The excess of the consideration transferred over the net tangible assets and intangible asset was recorded as goodwill.
The Company’s allocation of consideration transferred for IO Turbine was as follows (in thousands):
Total assets | $ | 3,899 | ||
Total liabilities | (826 | ) | ||
|
| |||
Net acquired tangible assets | $ | 3,073 | ||
Developed technology (weighted-average useful life of 4 years) | 10,500 | |||
Goodwill | 54,777 | |||
Deferred income tax liability | (2,782 | ) | ||
|
| |||
Total fair value of consideration transferred | $ | 65,568 | ||
|
|
Operating expenses associated with IO Turbine were approximately $20,306,000 for the fiscal year ended June 30, 2012. Stock-based compensation expense related to IO Turbine was approximately $12,282,000 for the fiscal year ended June 30, 2012.
Unaudited pro forma financial information
Unaudited Pro forma information related to the acquisition of the ID7 Entities has not been included as it was not material to the Company’s consolidated statements of operations. The following unaudited pro forma financial information is based on the combined historical financial statements of the Company, IO Turbine, and NexGen after giving effect to the Company’s acquisition of IO Turbine and NexGen as if they had occurred as of July 1, 2011 and includes pro forma adjustments related to the amortization of acquired intangible assets, stock-based compensation expense, and depreciation expense (in thousands, except per share data):
| Year Ended June 30, | ||||||||
| 2012 | 2013 | |||||||
Revenue | $ | 358,811 | $ | 433,799 | ||||
Loss from operations | (25,744 | ) | (55,941 | ) | ||||
Net loss | (25,692 | ) | (57,148 | ) | ||||
Net loss per share, basic | $ | (0.29 | ) | $ | (0.60 | ) | ||
Net loss per share, diluted | $ | (0.29 | ) | $ | (0.60 | ) | ||
The amounts in the table above do not includenon-recurring expense of approximately $3,795,000 related to the acceleration of vesting on certainstock-based awards that was recorded by the Company asstock-based compensation expense in the year ended June 30, 2012.
F-26
Table of Contents
FUSION-IO, INC.
NOTES TO CONSOLIDATED FINANCIAL STATEMENTS – (Continued)
Acquisition related expenses
Acquisition related expenses totaled approximately $1,326,000 and $710,000 for the fiscal years ended June 30, 2012 and 2013, respectively, and were recorded in general and administrative expenses. Of the total acquisition related expenses, $450,000 related to a prepaid royalty fee, paid by the Company to IO Turbine in fiscal year 2011, which was expensed by the Company upon completion of the acquisition of IO Turbine in fiscal year 2012.
5. Goodwill and Intangible Assets
Changes in the carrying amount of Goodwill consisted of the following (in thousands):
| Year Ended June 30, | ||||||||
| 2012 | 2013 | |||||||
Balance at beginning of period | $ | — | $ | 54,777 | ||||
Current period acquisitions | 54,777 | 94,690 | ||||||
|
|
|
| |||||
Balance at end of period | $ | 54,777 | $ | 149,467 | ||||
|
|
|
| |||||
The Company’s goodwill related to the acquisitions of IO Turbine and NexGen is not deductible for income tax purposes. The Company’s goodwill related to the acquisition of the ID7 Entities is deductible for income tax purposes.
The Company’s intangible assets and related accumulated amortization consisted of the following as of June 30, 2013 (in thousands):
| Weighted- Average Useful Life | Cost | Accumulated Amortization | Net | |||||||||||
Developed technology | 4 years | $ | 31,400 | $ | (6,108 | ) | $ | 25,292 | ||||||
Licensed technology | 3 years | 2,784 | (657 | ) | 2,127 | |||||||||
Trade names | 2 years | 520 | (49 | ) | 471 | |||||||||
Customer relationships | 6 years | 390 | (12 | ) | 378 | |||||||||
|
|
|
|
|
| |||||||||
Total intangible assets | 4 years | $ | 35,094 | $ | (6,826 | ) | $ | 28,268 | ||||||
|
|
|
|
|
| |||||||||
Amortization expense related to intangible assets was $2,336,000 and $4,490,000 for the fiscal years ended June 30, 2012 and 2013, respectively. Estimated amortization expense in future periods for intangible assets subject to amortization is as follows (in thousands):
Fiscal Year Ending June 30, | Amount | |||
2014 | $ | 8,890 | ||
2015 | 8,804 | |||
2016 | 6,257 | |||
2017 | 4,200 | |||
2018 | 65 | |||
Thereafter | 52 | |||
|
| |||
Total | $ | 28,268 | ||
|
| |||
F-27
Table of Contents
FUSION-IO, INC.
NOTES TO CONSOLIDATED FINANCIAL STATEMENTS – (Continued)
6.Long-term Obligations
Loan and Security Agreement
In September 2010, the Company amended and restated its loan and security agreement (the “Revolving Line of Credit”) with a financial institution. The Revolving Line of Credit allowed the Company to borrow up to a limit of $25,000,000. A sublimit of $6,000,000 for letters of credit, certain cash management services, and foreign exchange forward contracts applied until May 2012. The total balance of letters of credit outstanding at June 30, 2012 was $3,183,000, which reduced the amount the Company had available to borrow under the Revolving Line of Credit. Prior to May 2012, borrowings under the Revolving Line of Credit would have accrued interest at a floating per annum rate equal to one-half of one percentage point (0.50%) above the prime rate as published in the Wall Street Journal. An unused commitment fee equal to 0.375% of the difference between the $25,000,000 limit and the average daily balance of borrowings outstanding each quarter was due on the last day of such quarter. Prior to May 2012, the Revolving Line of Credit was secured by substantially all of the Company’s assets. The Company could make advances against the Revolving Line of Credit until its maturity date, at which time all unpaid principal and interest was due and payable.
In August 2011, the Company entered into an amendment to the Revolving Line of Credit which provided for the consent of the financial institution with respect to the acquisition of IO Turbine and certain amendments to provide the Company with further flexibility to consummate mergers and acquisitions permitted under the Revolving Line of Credit.
In May 2012, the Company entered into a second amendment to the Revolving Line of Credit. Pursuant to this amendment, the pricing on revolving line of credit was amended such that borrowings under the Revolving Line of Credit accrued interest at a per annum rate equal to, at the Company’s option, a floating per annum rate equal to the prime rate as published in the Wall Street Journal, or the LIBOR rate (based on 1, 2, 3 or 6-month interest periods) plus a margin equal to two percent (2.00%) per annum. This amendment further provided for, among other things, (i) the reduction of the quarterly unused commitment fee to an amount equal to one-quarter of one percent (0.25%) per annum of the difference between the $25,000,000 loan commitment and the average daily balance of borrowings outstanding on the last day of each quarter, (ii) the removal of the borrowing base formula and the sublimit restricting the issuance of letters of credit, cash management services and foreign exchange forward contracts, and (iii) the release of the financial institution’s security interest in all of the Company’s assets.
Under the terms of the Revolving Line of Credit, the Company was required to maintain the following minimum financial covenants on a consolidated basis:
| • | A ratio of current assets to current liabilities plus, without duplication, any of the Company’s obligations to the financial institution, of at least 1.25 to 1.00. |
| • | A tangible net worth of at least $25,000,000, plus 25% of the net proceeds the Company received from the sale or issuance of its equity or subordinated debt, such increase to be measured as of the last day of the quarter in which the Company received such proceeds. |
In September 2012, the Company entered into a third amendment to the Revolving Line of Credit. Pursuant to this amendment, the maturity date of the Revolving Line of Credit was extended to December 2012.
As of June 30, 2013, the Company no longer had a revolving line of credit.
F-28
Table of Contents
FUSION-IO, INC.
NOTES TO CONSOLIDATED FINANCIAL STATEMENTS – (Continued)
7. Income Taxes
The domestic and foreign components of income (loss) before income taxes were as follows (in thousands):
| Year Ended June 30, | ||||||||||||
| 2011 | 2012 | 2013 | ||||||||||
Domestic | $ | 5,802 | $ | (5,924 | ) | $ | (38,594 | ) | ||||
Foreign | 447 | 956 | 1,872 | |||||||||
|
|
|
|
|
| |||||||
Income (loss) before income taxes | $ | 6,249 | $ | (4,968 | ) | $ | (36,722 | ) | ||||
|
|
|
|
|
| |||||||
Income tax expense consisted of the following components (in thousands):
| Year Ended June 30, | ||||||||||||
| 2011 | 2012 | 2013 | ||||||||||
Current: | ||||||||||||
Federal | $ | — | $ | — | $ | — | ||||||
State | 428 | 213 | 559 | |||||||||
Foreign | 112 | 684 | 1,072 | |||||||||
|
|
|
|
|
| |||||||
Total current tax expense | 540 | 897 | 1,631 | |||||||||
Deferred: | ||||||||||||
Federal | — | (2,782 | ) | — | ||||||||
State | — | — | — | |||||||||
Foreign | — | — | (247 | ) | ||||||||
|
|
|
|
|
| |||||||
Total deferred tax benefit | — | (2,782 | ) | (247 | ) | |||||||
|
|
|
|
|
| |||||||
Tax expense attributable to employee stock plans | 1,154 | 2,500 | 120 | |||||||||
|
|
|
|
|
| |||||||
Total income tax expense | $ | 1,694 | $ | 615 | $ | 1,504 | ||||||
|
|
|
|
|
| |||||||
Income tax expense differed from the amounts computed by applying the statutory federal income tax rate of 34% to income (loss) before income taxes as a result of the following (in thousands):
| Year Ended June 30, | ||||||||||||
| 2011 | 2012 | 2013 | ||||||||||
Federal tax expense (benefit) at statutory rate | $ | 2,125 | $ | (1,689 | ) | $ | (12,486 | ) | ||||
State tax expense, net of federal tax effect | 700 | 1,929 | 465 | |||||||||
Rate differential on foreign income taxes | (40 | ) | 359 | 436 | ||||||||
Current year research tax credits | (618 | ) | (1,366 | ) | (3,764 | ) | ||||||
Stock-based compensation | 1,970 | 4,943 | 4,630 | |||||||||
Change in valuation allowance | (3,306 | ) | (4,057 | ) | 11,722 | |||||||
Other, net | 863 | 496 | 501 | |||||||||
|
|
|
|
|
| |||||||
Income tax expense | $ | 1,694 | $ | 615 | $ | 1,504 | ||||||
|
|
|
|
|
| |||||||
F-29
Table of Contents
FUSION-IO, INC.
NOTES TO CONSOLIDATED FINANCIAL STATEMENTS – (Continued)
Significant components of the Company’s deferred income tax assets and liabilities were as follows (in thousands):
| June 30, | ||||||||
| 2012 | 2013 | |||||||
Deferred tax assets: | ||||||||
Net operating loss carryforwards | $ | 2,662 | $ | 8,708 | ||||
Tax credit carryforwards | 4,015 | 9,053 | ||||||
Accruals and allowances | 13,626 | 15,150 | ||||||
Stock-based compensation | 10,690 | 17,245 | ||||||
|
|
|
| |||||
Total deferred tax assets | 30,993 | 50,156 | ||||||
Valuation allowance | (21,722 | ) | (37,620 | ) | ||||
|
|
|
| |||||
| 9,271 | 12,536 | |||||||
Deferred tax liabilities: | ||||||||
Fixed asset basis differences | (7,222 | ) | (6,640 | ) | ||||
Intangible asset basis differences | (2,049 | ) | (6,897 | ) | ||||
|
|
|
| |||||
Deferred tax assets, net | $ | — | $ | (1,001 | ) | |||
|
|
|
| |||||
The Company does not provide for U.S. income taxes on the undistributed earnings of foreign subsidiaries which are intended to be indefinitely reinvested in operations outside the U.S. As of June 30, 2013 the cumulative amount of earnings upon which U.S. income taxes have not been provided is approximately $2,260,000. As of June 30, 2013, the amount of unrecognized deferred tax liability related to these earnings is estimated to be approximately $249,000.
As of June 30, 2013, the Company had federal and state net operating loss carryforwards (“NOLs”) of $20,268,000 and $46,074,000, respectively. The federal and state NOLs begin to expire in 2027 and 2014, respectively, if not utilized. The Company also had gross federal and state research and development tax credit carryforwards of $6,583,000 and $2,821,000, respectively, which begin to expire in 2027 and 2020, respectively, if not utilized. On January 2, 2013, the research and development tax credit was reinstated retroactive to January 1, 2012. Consequently, the increase in the amount of Federal research and development tax credit carryforwards from June 30, 2012 to June 30, 2013 includes the amount of credits generated from January 1, 2012 through June 30, 2013.
The Company maintained a full valuation allowance against its U.S deferred tax assets at June 30, 2011, 2012, and 2013 due to the uncertainty of realizing future tax benefits from its deferred tax assets due to historical losses. The valuation allowance decreased by $3,306,000 and $4,057,000, and increased by $15,898,000 during the fiscal years ended June 30, 2011, 2012, and 2013, respectively. The increase in the valuation allowance for the year ended June 30, 2013 is primarily due to operating losses.
Utilization of the net operating loss carryforwards and credits may be subject to a substantial annual limitation due to the ownership change limitations provided by the Internal Revenue Code of 1986, as amended, and similar state provisions. The annual limitation may result in the expiration of net operating losses and credits before utilization. If an ownership change has occurred in the past or occurs in the future, the utilization of net operating loss and credit carryforwards could be significantly reduced. A study was performed to determine if any ownership changes as defined by the Internal Revenue Code of 1986 have occurred since the Company’s inception. Additional studies were
F-30
Table of Contents
FUSION-IO, INC.
NOTES TO CONSOLIDATED FINANCIAL STATEMENTS – (Continued)
performed to determine any ownership changes and the potential annual limitations that could apply to the net operating losses and credits attributable to companies acquired by the Company. These studies calculated the amount of annual limitation related to such ownership changes and projected the expected usage of both net operating loss and credit carryforwards, by year. Based on the results of these studies, the Company does not expect the limitations imposed by the ownership changes to limit the usage of the net operating loss carryforward amounts before expiration. Approximately $112,000 of federal R&D credits are expected to expire unused.
The Company recognizes the tax benefit from an uncertain tax position only if it is more likely than not that the tax position will be sustained on examination by taxing authorities, based solely on the technical merits of the position. The tax benefits recognized in the financial statements from such a position should be measured based on the largest benefit that has greater than 50% likelihood to be sustained upon ultimate settlement. As of June 30, 2013, the Company’s unrecognized tax benefits were $6,047,000.
The Company recognizes accrued interest and penalties related to uncertain tax positions as part of income tax expense. As of June 30, 2013, the Company had $30,000 of accrued interest and penalties.
During the fiscal year ended June 30, 2013, the aggregate changes in the total gross amount of unrecognized tax benefits were as follows (in thousands):
Balance as of June 30, 2012 | $ | 2,709 | ||
Decrease of unrecognized tax benefits taken in prior years | (39 | ) | ||
Increase in unrecognized tax benefits related to current year | 3,377 | |||
|
| |||
Balance as of June 30, 2013 | $ | 6,047 | ||
|
|
The total amount of unrecognized tax benefits that, if recognized, would affect the effective tax rate is $1,041,000.
The Company does not anticipate any significant change within fiscal year 2014 of its uncertain tax positions, and the Company does not anticipate any events which could cause a change to these uncertainties. The Company files tax returns in the U.S. on a Federal basis and in many U.S. state and foreign jurisdictions. The Company is open for examinations in its major tax jurisdictions for the 2008 and forward tax years. There are no ongoing income tax examinations by taxing authorities at this time.
In addition to the net operating loss carryforwards as described above, as of June 30, 2013, the Company has federal and state net operating loss carryforwards associated with stock option tax deductions greater than deductions claimed for book purposes of approximately $257,149,000 and $182,263,000, respectively. The Company also had $537,000 of state research and development tax credit carryforwards associated with stock option tax deductions greater than deductions claimed for book purposes. These benefits will be recorded directly to equity in the period they reduce current taxes payable.
The Company paid income taxes in U.S. state and foreign jurisdictions of $568,000, $265,000, and $658,000 during the fiscal years ended June 30, 2011, 2012, and 2013, respectively.
F-31
Table of Contents
FUSION-IO, INC.
NOTES TO CONSOLIDATED FINANCIAL STATEMENTS – (Continued)
8. Convertible Preferred Stock and Stockholders’ (Deficit) Equity
Convertible Preferred Stock
In conjunction with the Company’s IPO of its common stock, which closed on June 14, 2011, all shares of convertible preferred stock outstanding automatically converted into 52,489,072 shares of common stock.
Public Offerings
In June 2011, the Company completed an IPO, of its common stock, in which the Company issued and sold 12,600,607 shares, including 1,845,000 shares sold pursuant to the full exercise by the underwriters of theirover-allotment option, at an issuance price of $19.00 per share. After deducting underwriting discounts and commissions and approximately $3,789,000 in offering costs, the net proceeds received by the Company were approximately $218,864,000.
In November 2011, the Company completed afollow-on public offering of its common stock in which the Company issued and sold 3,000,000 shares at an issuance price of $33.00 per share. After deducting underwriting discounts and commissions and approximately $1,063,000 in offering costs, the net proceeds received by the Company were approximately $93,977,000.
Equity Incentive Plans
In March 2008, the Company adopted the 2008 Equity Incentive Plan (the “2008 Plan”) and in July 2010 the Company adopted the 2010 Executive Stock Incentive Plan (the “2010 Plan”). In January 2011, the Company’s board of directors and stockholders authorized an additional 3,000,000 shares of common stock for future issuance under the 2008 Plan and 2010 Plan. In June 2011, the Company’s board of directors determined that no future awards would be issued under the 2008 and 2010 Plans; however, the respective Plan will continue to govern the terms and conditions of the awards previously granted.
In June 2011, the Company adopted the 2011 Equity Incentive Plan (the “2011 Plan”) and reserved a total of 12,132,430 shares of common stock for issuance under the 2011 Plan. The shares reserved for issuance under the 2011 Plan include shares returned as the result of expiration or termination of options from the previous Plans and othernon-plan awards made prior to the Company’s initial public offering (which may not exceed 25,867,172 shares). As of June 30, 2013, 7,338,004 shares were subject to awards and outstanding under the 2011 Plan. The number of shares available to be issued for future awards under the 2011 Plan as of June 30, 2013 was 9,904,820. In addition, the 2011 Plan provides for annual increases in the number of shares available for issuance on the first day of each fiscal year beginning July 1, 2012 equal to the lesser of:
| • | 5% of the outstanding shares of the Company’s common stock on the first day of the fiscal year; |
| • | 10,000,000 shares; and |
| • | such other amount as may be determined by the Company’s Board of Directors or a committee thereof |
The Stock Plans provide for the grant of incentive stock options to employees and for the grant of nonstatutory stock options and awards of restricted or unrestricted shares of common stock to
F-32
Table of Contents
FUSION-IO, INC.
NOTES TO CONSOLIDATED FINANCIAL STATEMENTS – (Continued)
employees, consultants, and advisors. Generally stock options granted under the Stock Plans vest over a period of 48 months and have a contractual life of 10 years from the date of grant. Grants of incentive stock options generally must be at an exercise price not less than the fair value of the underlying common stock on the date of grant.
In August 2011, in connection with the Company’s acquisition of IO Turbine, the Company assumed stock options and restricted stock awards previously granted by IO Turbine pursuant to the IO Turbine, Inc. 2009 Equity Incentive Plan. The stock options were converted to options to purchase shares of the Company’s common stock. These stock options generally have a 48 month vesting schedule and have an exercise price equal to the grant date fair market value. The restricted stock awards were converted to restricted shares of the Company’s common stock. These restricted stock awards generally have a 24 to 48 month vesting schedule, with the majority of the shares vesting over a 24 month vesting schedule from the date the Company acquired IO Turbine.
In March 2013, in connection with the Company’s acquisition of the ID7 Entities, the Company assumed stock awards previously granted by the ID7 Entities. The stock awards were converted to restricted shares of the Company’s common stock. These restricted stock awards have a 48 month vesting schedule from the date the Company acquired the ID7 Entities.
In April 2013, in connection with the Company’s acquisition of NexGen, the Company assumed the unvested portions of the then outstanding stock options and restricted stock units previously granted by NexGen pursuant to the NexGen Storage, Inc. 2010 Equity Incentive Plan. In addition, the Company assumed a restricted stock award previously granted by NexGen. The stock options were converted to options to purchase shares of the Company’s common stock, the restricted stock units were converted to restricted stock units of the Company, and the restricted stock award was converted to restricted shares of the Company’s common stock. The stock options generally have a 48 month vesting schedule and have an exercise price equal to the grant date fair market value. The restricted stock units generally have a 36 to 48 month vesting schedule from the date the Company acquired NexGen. The restricted stock award has a 36 month vesting schedule from the date the Company acquired NexGen.
F-33
Table of Contents
FUSION-IO, INC.
NOTES TO CONSOLIDATED FINANCIAL STATEMENTS – (Continued)
Stock option activity for all the Stock Plans for the fiscal years ended June 30, 2011, 2012 and 2013 was as follows:
| Number of Shares Subject to Outstanding Options | Weighted- Average Exercise Price Per Share | Weighted- Average Contractual Term (in Years) | Aggregate Intrinsic Value(1) | |||||||||||||
| (in thousands) | ||||||||||||||||
Outstanding as of June 30, 2010 | 18,412,840 | $ | 0.77 | |||||||||||||
Granted | 10,166,575 | 4.67 | ||||||||||||||
Exercised | (2,541,909 | ) | 0.61 | |||||||||||||
Canceled | (1,309,575 | ) | 2.30 | |||||||||||||
|
| |||||||||||||||
Outstanding as of June 30, 2011 | 24,727,931 | 2.31 | ||||||||||||||
Granted | 2,654,650 | 22.48 | ||||||||||||||
Assumed | 264,792 | 1.24 | ||||||||||||||
Exercised | (7,128,528 | ) | 1.15 | |||||||||||||
Canceled | (633,439 | ) | 8.28 | |||||||||||||
|
| |||||||||||||||
Outstanding as of June 30, 2012 | 19,885,406 | 5.21 | ||||||||||||||
Granted | 1,387,050 | 21.57 | ||||||||||||||
Assumed | 822,927 | 1.14 | ||||||||||||||
Exercised | (4,183,681 | ) | 2.02 | |||||||||||||
Canceled | (646,398 | ) | 10.10 | |||||||||||||
|
| |||||||||||||||
Outstanding as of June 30, 2013 | 17,265,304 | $ | 6.92 | 7.4 | $ | 126,318 | ||||||||||
|
| |||||||||||||||
Vested and expected to vest as of June 30, 2013 | 16,274,196 | $ | 6.68 | 7.4 | $ | 123,042 | ||||||||||
|
| |||||||||||||||
Vested and exercisable as of June 30, 2013 | 9,874,534 | $ | 4.81 | 6.9 | $ | 93,134 | ||||||||||
|
| |||||||||||||||
| (1) | The aggregate intrinsic value is equal to the difference between the exercise price of the underlying stock option awards and the fair value of the Company’s common stock as of June 30, 2013. |
Employee Stock Options
Additional per share information related to stock options granted to employees was as follows:
| Year Ended June 30, | ||||||||||||
| 2011 | 2012 | 2013 | ||||||||||
Weighted-average grant date fair value — granted | $ | 3.22 | $ | 12.38 | $ | 11.36 | ||||||
Weighted-average grant date fair value — assumed in connection with acquisitions | — | 27.31 | 15.93 | |||||||||
Weighted-average grant date fair value — forfeited | 2.33 | 6.84 | 5.83 | |||||||||
The aggregate intrinsic value of stock options exercised during the fiscal years ended June 30, 2011, 2012, and 2013 was approximately $33,570,000, $190,748,000, and $85,678,000, respectively, which was the difference between the exercise price of the underlying stock option awards and the estimated fair value of the Company’s common stock on the date of exercise.
The Company recordedstock-based compensation expense related to employee stock options of approximately $4,924,000, $17,022,000, and $21,688,000 for the fiscal years ended June 30, 2011,
F-34
Table of Contents
FUSION-IO, INC.
NOTES TO CONSOLIDATED FINANCIAL STATEMENTS – (Continued)
2012, and 2013, respectively. As of June 30, 2013, there was approximately $46,367,000 of total unrecognized compensation expense related to unvested stock options, which is expected to be recognized over aweighted-average service period of 2.4 years.
The Company estimates the fair value of stock options granted to employees using theBlack-Scholes-Merton pricing model and a single option award approach, which requires the input of several highly subjective and complex assumptions. Therisk-free interest rate for the expected term of the option is based on the yield available on United States Treasury Zero Coupon issues with an equivalent expected term. The expected option term used in theBlack-Scholes-Merton pricing model is calculated using the simplified method. The simplified method defines the expected term as the average of the option’s contractual term and the option’sweighted-average vesting period. The Company utilizes this method as it has limited historical stock option data that is sufficient to derive a reasonable estimate of the expected stock option term. The computation of estimated expected volatility is based on the volatility of comparable companies from a representative peer group selected based on industry data.
The following table presents the assumptions used in theBlack-Scholes-Merton pricing model related to employee stock options:
| Year Ended June 30, | ||||||||||||
| 2011 | 2012 | 2013 | ||||||||||
Expected volatility | 48-60 | % | 59-60 | % | 61-65 | % | ||||||
Expected term (in years) | 3.2-7.0 | 5.2-6.6 | 3.9-5.7 | |||||||||
Risk-free interest rate | 0.6-2.7 | % | 1.0-2.0 | % | 0.6-1.4 | % | ||||||
Expected dividends | — | — | — | |||||||||
In December 2011, the Company accelerated the vesting of 12,500 stock options in connection with the resignation of Christopher J. Schaepe from the Board of Directors of the Company. As a result of the acceleration, the Company recorded approximately $199,000 of employee relatedstock-based compensation expense for the year ended June 30, 2012.
The Company accelerated the vesting of 948,982 stock options in connection with the resignation of the Company’s former Chief Executive Officer and Chief Marketing Officer on May 7, 2013. As a result of the acceleration, the Company recorded an additional $2,905,000 ofstock-based compensation expense for the year ended June 30, 2013.
On May 30, 2013, the Company entered into separation agreements with its former Chief Executive Officer and Chief Marketing Officer in that they will provide advisory services to the Company for the 12-month period following the date of their respective resignation. In conjunction with their continued services, the vesting of their awards has been modified such that all awards will be vested in full at the completion of the12-month period, subject to their executing (and not revoking) a supplemental release at the end of the 12-month term. As a result, the Company modified the vesting of 1,176,249 stock options and 267,500 RSUs during the period and recorded an additional net stock-based compensation expense of $554,000 for the year ended June 30, 2013. As of June 30, 2013, there was approximately $8,993,000 of unrecognized compensation expense related to the modified awards, which is expected to be recognized ratably through May 2014.
F-35
Table of Contents
FUSION-IO, INC.
NOTES TO CONSOLIDATED FINANCIAL STATEMENTS – (Continued)
The following table summarizes the Black-Scholes inputs used in calculating the fair value and incremental expense to be recognized in connection with the equity award modification for stock options:
| Pre-Modification | Post-Modification | |||||||
Expected volatility | 48-63 | % | 55 | % | ||||
Expected term (in years) | 5.4-7.0 | 1.2 | ||||||
Risk-free interest rate | 0.7-2.7 | % | 0.1 | % | ||||
Expected dividends | — | — | ||||||
Non-employee Stock Options
The Company from time to time grants options to purchase common stock tonon-employees for advisory and consulting services. The Company estimates the fair value of these stock options using theBlack-Scholes-Merton option pricing formula at each balance sheet date and records expense ratably over the vesting period of each stock option award. The Company recordedstock-based compensation expense related to thesenon-employee stock options of $3,235,000, $8,474,000, and $5,710,000 for the fiscal years ended June 30, 2011, 2012, and 2013, respectively.
The following table presents the assumptions used in theBlack-Scholes-Merton pricing model related tonon-employee stock options:
| Year Ended June 30, | ||||||||||||
| 2011 | 2012 | 2013 | ||||||||||
Expected volatility | 48-63 | % | 59-62 | % | 60-65 | % | ||||||
Expected term (in years) | 7.1-10.0 | 6.3-9.7 | 5.8-8.7 | |||||||||
Risk-free interest rate | 2.1-3.4 | % | 1.6-2.4 | % | 1.3-2.0 | % | ||||||
Expected dividends | — | — | — | |||||||||
Restricted Stock Units and Restricted Stock Awards
The following table summarizes activity during the fiscal years ended June 30, 2011, 2012, and 2013 related to RSUs and RSAs:
| Number of Shares | Weighted- Average Grant-Date Fair Value | |||||||
Unvested RSUs and RSAs at June 30, 2011 | — | $ | — | |||||
Granted | 1,807,503 | 23.71 | ||||||
Assumed in connection with acquisitions | 916,202 | 28.40 | ||||||
Vested | (211,996 | ) | 28.54 | |||||
Accelerated vesting in connection with acquisitions | (502,514 | ) | 28.40 | |||||
Forfeited | (12,779 | ) | 28.40 | |||||
Canceled | (38,850 | ) | 22.41 | |||||
|
| |||||||
Unvested RSUs and RSAs at June 30, 2012 | 1,957,566 | 24.17 | ||||||
Granted | 2,435,524 | 20.28 | ||||||
Assumed in connection with acquisitions | 559,566 | 16.84 | ||||||
Vested | (697,885 | ) | 24.68 | |||||
Forfeited | (4,965 | ) | 28.40 | |||||
Canceled | (111,960 | ) | 24.71 | |||||
|
| |||||||
Unvested RSUs and RSAs at June 30, 2013 | 4,137,846 | $ | 20.78 | |||||
|
| |||||||
F-36
Table of Contents
FUSION-IO, INC.
NOTES TO CONSOLIDATED FINANCIAL STATEMENTS – (Continued)
The Company recordedstock-based compensation expense related to RSUs and RSAs of approximately $399,000, $16,253,000, and $25,769,000 for the fiscal years ended June 30, 2011, 2012, and 2013, respectively. Of thestock-based compensation expense recognized during the year ended June 30, 2012, approximately $3,795,000 was due to accelerated vesting of certain RSAs assumed in connection with the IO Turbine acquisition, of which, approximately $793,000 related to awards that were settled in cash at the time of acquisition. At June 30, 2013, there was approximately $71,391,000 of total unrecognized compensation cost related to unvested RSUs and RSAs. This unrecognized compensation cost is equal to the fair value of RSUs and RSAs expected to vest and will be recognized over aweighted-average period of 3.0 years.
Repurchases of Vested Restricted Stock Units
The Company is required to withhold minimum statutory taxes related to the vesting of RSUs, including the forfeiting of a portion of the newly vested award that has a current value equal to the withholding obligation. The Company is then required to remit the amount of taxes owed by the employee to the appropriate taxing authority. As a result of such forfeitures, the Company effectively repurchased a total of 2,070 and 173,657 shares of common stock related to employee tax withholding obligations for the fiscal years ended June 30, 2012 and 2013, respectively. The Company has recorded approximately $44,000 and $3,352,000 as a financing activity for these forfeitures in the consolidated statement of cash flows for the years ended June 30, 2012 and 2013, respectively.
Employee Stock Purchase Plan
The Company’s 2011 Employee Stock Purchase Plan (the “ESPP”) became effective in June 2011. The ESPP allows eligible employees to purchase shares of the Company’s common stock at a discount through payroll deductions of up to 15% of their eligible compensation, subject to plan limitations. A participant may purchase a maximum of 1,500 shares during the offering period. Generally, the ESPP provides forsix-month offering periods, and at the end of each offering period, employees are able to purchase shares at 85% of the lower of the fair market value of the Company’s common stock on the first trading day of the offering period or on the last day of the offering period. At the effective date, a total of 500,000 shares of common stock were reserved for future issuance under this plan. In addition, the ESPP provides for annual increases in the number of shares available for issuance on the first day of each fiscal year beginning July 1, 2012 equal to the lesser of:
| • | 1% of the outstanding shares of the Company’s common stock on the first day of the year; |
| • | 2,000,000 shares; and |
| • | such other amount as may be determined by the Company’s Board of Directors or a committee thereof |
The Company recordedstock-based compensation expense related to its ESPP of approximately $79,000, $1,689,000, and $3,259,000 for the fiscal years ended June 30, 2011, 2012 and 2013, respectively. During the year ended June 30, 2013, the Company issued 423,467 shares of common stock under the ESPP. At June 30, 2013, a total of 863,879 shares of common stock were reserved for future issuance under the ESPP.
F-37
Table of Contents
FUSION-IO, INC.
NOTES TO CONSOLIDATED FINANCIAL STATEMENTS – (Continued)
The following table presents the assumptions used in theBlack-Scholes-Merton pricing model related to the ESPP:
| Year Ended June 30, | ||||||||||||
| 2011 | 2012 | 2013 | ||||||||||
Expected volatility | 47 | % | 47-60 | % | 44-53 | % | ||||||
Expected term (in years) | 0.7 | 0.5-0.7 | 0.5-0.5 | |||||||||
Risk-free interest rate | 0.2 | % | 0.1-0.2 | % | 0.1-0.1 | % | ||||||
Expected dividends | — | — | — | |||||||||
Stock-based Compensation Expense
Totalstock-based compensation expense was classified as follows in the accompanying consolidated statement of operations (in thousands):
| Year Ended June 30, | ||||||||||||
| 2011 | 2012 | 2013 | ||||||||||
Cost of revenue | $ | 31 | $ | 216 | $ | 373 | ||||||
Sales and marketing | 1,803 | 6,089 | 9,676 | |||||||||
Research and development | 1,545 | 9,111 | 18,907 | |||||||||
General and administrative | 5,258 | 28,022 | 27,470 | |||||||||
|
|
|
|
|
| |||||||
Total stock-based compensation | $ | 8,637 | $ | 43,438 | $ | 56,426 | ||||||
|
|
|
|
|
| |||||||
Warrants
In connection with the execution of the September 2008 loan and security agreement, the Company issued the financial institution a fully vested warrant to purchase 125,800 shares of Series A convertible preferred stock at $1.093 per share. In conjunction with the initial public offering of the Company’s common stock in June 2011, the warrant converted to a warrant to purchase 125,800 shares of common stock at $1.093 per share. In October 2011, the Company issued 121,839 shares of common stock related to the net exercise of this common stock warrant.
The FASB has issued accounting guidance on the classification of freestanding warrants and other similar instruments on shares that are redeemable (either puttable or mandatorily redeemable). The guidance requires liability classification for certain warrants issued that are exercisable into convertible preferred stock. Liability classification requires the warrants to be remeasured to their fair value at each reporting period. The Company recorded $2,106,000 in interest expense in fiscal year 2011 related to the change in the fair value of the warrant liability. The Company utilized aBlack-Scholes-Merton option pricing model in order to determine the fair value of the preferred stock warrant, including the consideration of arisk-free interest rate, expected term and expected volatility. Upon conversion in June 2011 in conjunction with the Company’s IPO, the liability was reclassified toadditional-paid in capital and the Company no longer remeasured the warrant to fair value.
F-38
Table of Contents
FUSION-IO, INC.
NOTES TO CONSOLIDATED FINANCIAL STATEMENTS – (Continued)
The following table presents the assumptions used in theBlack-Scholes-Merton pricing model as of each date the warrant was revalued:
| June 30, 2011 | ||||
Expected volatility | 59 | % | ||
Expected term (in years) | 7.3 | |||
Risk free interest rate | 2.2 | % | ||
Expected dividends | — | |||
Common Stock and Shares of Common Stock Reserved for Future Issuance
Shares of common stock reserved for future issuance were as follows (in thousands):
| June 30, 2012 | June 30, 2013 | |||||||
Stock options outstanding | 19,885,406 | 17,265,304 | ||||||
RSUs and RSAs | 1,957,566 | 4,137,846 | ||||||
ESPP | 351,062 | 863,879 | ||||||
Shares available for future grants | 8,129,263 | 9,904,820 | ||||||
|
|
|
| |||||
| 30,323,297 | 32,171,849 | |||||||
|
|
|
| |||||
Issuance of Common Stock
In February 2011, the Company issued an aggregate of 60,000 shares of common stock for cash to two members of its board of directors. The purchase price of these shares was $5.12 per share.
In June 2011, the Company completed the initial public offering of its common stock in which the Company issued and sold 12,600,607 shares.
In August 2011, the Company issued an aggregate of 1,633,315 shares of common stock to former IO Turbine stockholders in conjunction with the acquisition of IO Turbine.
In October 2011, the Company issued 121,839 shares of common stock related to the net exercise of a common stock warrant.
In November 2011, the Company completed afollow-on public offering of its common stock in which the Company issued and sold 3,000,000 shares.
Repurchase of Common Stock
In May 2011, the Company repurchased a total 165,000 shares of common stock from two of its stockholders, in separate transactions, for a total purchase price of $1,222,500. The terms and conditions of the individual stock repurchases, including the purchase price, were established independently between the two stockholders and a third party buyer unaffiliated with the Company. The Company exercised itspre-existing right of first refusal to which the shares were subject and repurchased the shares on the same terms and conditions to which the stockholders and third party buyer had agreed.
F-39
Table of Contents
FUSION-IO, INC.
NOTES TO CONSOLIDATED FINANCIAL STATEMENTS – (Continued)
The terms of the repurchase transaction for 150,000 of such shares required the Company to pay additional consideration to one of the stockholders if a liquidity event occurred at any time prior to May 2, 2012 in which the price per share of the Company’s common stock was greater than $15.00. For this purpose, a liquidity event was defined as either a change of control or sale of substantially all of the assets of the Company or the initial public offering of common stock of the Company. The amount of the additional per share consideration payable was equal to half the difference between the applicable liquidity event price per share and $15.00. The liquidity event price per share was the closing per share sale price as of the first trading day following the December 5, 2011 expiration date of thelock-up period described in the underwriting section of the Company’sForm S-1 registration statement. In accordance with the terms of the repurchase transaction, the Company paid $1,066,500 in additional consideration to the stockholder on December 9, 2011. As this transaction was settled with a cash payment and the amount of settlement was indexed to the Company’s common stock price per share on December 6, 2011, this transaction was accounted for as a derivative instrument in accordance with ASC 815, Accounting for Derivative Instruments and Hedging Activities, and was recorded at fair value. The derivative agreement does not meet the hedge criteria and the Company recorded the change in fair value of the derivative of approximately $70,000 and $0 as other income in the consolidated statement of operations for the years ended June 30, 2012 and 2013, respectively.
9. Commitments and Contingencies
Letters of Credit
As of June 30, 2012 and 2013, the Company had a total of $3,183,000 and $3,360,000, respectively, in letters of credit outstanding with financial institutions. These outstanding letters of credit were issued for purposes of securing the Company’s obligations under facility leases. As of June 30, 2013, the letters of credit were collateralized by a portion of the Company’s cash. This is reflected as restricted cash on the consolidated balance sheet as of June 30, 2013.
Leases
Future minimum lease payments undernon-cancelable operating leases were as follows (in thousands):
Fiscal Year Ending June 30, | Amount | |||
2014 | $ | 6,166 | ||
2015 | 6,531 | |||
2016 | 6,684 | |||
2017 | 6,707 | |||
2018 | 6,678 | |||
Thereafter | 17,830 | |||
|
| |||
Total | $ | 50,596 | ||
|
| |||
Operating lease payments primarily relate to the Company’s leases of office space with various expiration dates through 2021. The terms of these leases often include tenant improvement allowances, periods of free rent, and increasing rental rates over time. The Company recognizes rent expense on a straight-line basis over the lease period and has accrued for rent expense recorded but not paid.
F-40
Table of Contents
FUSION-IO, INC.
NOTES TO CONSOLIDATED FINANCIAL STATEMENTS – (Continued)
During fiscal years 2011, 2012, and 2013, the Company entered into new leases to expand its primary office facilities in Salt Lake City, Utah. The term of these leases includes an initial lease term that ends in September 2021, plus the option for the Company to extend the leases for an additional five years. These leases include periods of free rent during the first year beginning with the lease effective date and increasing rental rates over the term of the leases.
In January 2012, the Company entered into a lease agreement to lease approximately 79,000 square feet of office space located in San Jose, California. The lease term is for 82 months and ends in March 2019. The lease provides for monthly payments of rent during the term as set forth in the lease. The lease also includes periods of free rent during the first year beginning with the lease effective date and increasing rental rates over the term of the lease. The lease also provides that the Company must pay taxes and operating expenses in addition to the base rent. The lease allowed for leasehold improvements up to $1,187,000, which is being recognized on a straight-line basis as a reduction to rent expense over the term of the lease.
The Company also leases certain equipment under operating leases that expire at various dates through 2018. These equipment leases typically include provisions that allow the Company at the end of the initial lease term to renew the lease, purchase the underlying equipment at the then fair market value, or return the equipment to the lessor.
Rent expense was $4,034,000, $5,428,000, and $7,248,000 for the fiscal years ended June 30, 2011, 2012, and 2013, respectively.
Purchase Commitments
As of June 30, 2013, the Company had fulfilled all of its raw materials purchase commitments that were outstanding as of the prior year and no outstanding commitment remained.
Indemnification
The Company has agreed to indemnify its officers and directors for certain events or occurrences, while the officer or director is or was serving at the Company’s request in such capacity. The maximum amount of potential future indemnification is unlimited; however, the Company has a director and officer insurance policy that provides corporate reimbursement coverage that limits its exposure and enables it to recover a portion of any future amounts paid. The Company is unable to reasonably estimate the maximum amount that could be payable under these arrangements since these obligations are not capped but are conditional to the unique facts and circumstances involved. Accordingly, the Company has no liabilities recorded for these agreements as of June 30, 2012 and 2013.
Many of the Company’s agreements with customers and channel partners, including OEMs and resellers, generally include certain provisions for indemnifying the channel partners and customers against liabilities if the Company’s products infringe a third party’s intellectual property rights. To date, the Company has not incurred any material costs as a result of such indemnification provisions and has not accrued any liabilities related to such obligations in the consolidated financial statements.
Employee Agreements
The Company has various agreements with selected employees pursuant to which if their employment is terminated by the Company without cause or by the employees for good reason, or
F-41
Table of Contents
FUSION-IO, INC.
NOTES TO CONSOLIDATED FINANCIAL STATEMENTS – (Continued)
following a change of control of the Company, the employees are entitled to receive certain benefits, including severance payments, accelerated vesting of stock and stock options, and certain insurance benefits.
Legal Matters
On February 7, 2012, Entorian Technologies L.P., filed a lawsuit in the U.S. District Court for the District of Utah against the Company. The complaint alleged that memory stacks included in some of the Company’s products infringe U.S. Patent No. 5,420,751, or the ‘751 patent, which expired in May 2012. Polystak, Inc. is the Company’s third-party supplier of the accused memory stack component. On March 1, 2012, Polystak filed a lawsuit against Entorian Technologies in the U.S. District Court for the Northern District of California. The complaint alleges that the ‘751 patent is invalid, and that Polystak’s memory stacks do not infringe the ‘751 patent. On March 8, 2012, Entorian Technologies dismissed the lawsuit against the Company in Utah. On March 9, 2012, Entorian Technologies filed a counterclaim against the Company and Polystak in the Northern District of California lawsuit. The counterclaim alleges that the Company and Polystak infringe the ‘751 patent and seeks damages, but it does not seek an injunction. On September 4, 2012, the Court stayed this lawsuit pending reexamination of the ‘751 patent by the U.S. Patent Office. Polystak has agreed to indemnify and defend the Company with respect to these lawsuits.
On September 7, 2011, Solid State Storage Solutions, Inc. (“S4”) filed a lawsuit in U.S. District Court for the Eastern District of Texas against the Company and eight other companies, alleging that the Company’s products infringed certain of the S4 patents. On February 22, 2013, the parties resolved this matter pursuant to a confidential agreement that releases the Company from past claims and includes a license to S4’s patent portfolio. The Company accounted for the settlement agreement as a multiple element arrangement and allocated the consideration paid to the identifiable elements based on their relative fair value. A portion of the settlement was allocated to alleged prior infringement and settlement costs, which were recorded as an approximate $4,052,000 expense to cost of revenue and an approximate $2,805,000 to general and administrative expense, respectively, on the Company’s consolidated statements of operations during the fiscal year ended June 30, 2013. The remaining portion was allocated to the licensing of intellectual property for future use to be amortized to cost of revenue using a method that reflects the pattern in which the economic benefits of the intangible asset is estimated to be used and imputed interest expense. Although the Company continues to dispute that its products infringe any valid claims of the patents, the settlement enables the Company to avoid further legal defense costs and the diversion of management resources. On March 28, 2013, the U.S. District Court for the Eastern District of Texas approved the parties’ joint motion to dismiss the matter with prejudice.
On May 18, 2011, Internet Machines LLC filed a lawsuit in U.S. District Court for the Eastern District of Texas against the Company and 20 other companies. The complaint alleges that the Company’s products infringe U.S. Patent Nos. 7,454,552; 7,421,532; 7,814,259; and 7,945,722. On August 26, 2011, Internet Machines MC LLC amended its prior complaint filed in the U.S. District Court for the Eastern District of Texas against PLX Technology, Inc. to add the Company and several other companies as defendants. This complaint alleges that the Company’s products infringe U.S. Patent No. 7,539,190. These complaints seek both damages and a permanent injunction against the Company. The specific infringement allegations appear to focus on a PCI switch component that, while used in some of the Company’s products, is manufactured by a third-party supplier. This third-party supplier was found to infringe the above identified U.S. Patent Nos. 7,454,552 and 7,421,532 by a jury
F-42
Table of Contents
FUSION-IO, INC.
NOTES TO CONSOLIDATED FINANCIAL STATEMENTS – (Continued)
in a prior case. The judge has stayed the lawsuits against the Company pending the entry of a final non-appealable judgment in the prior case between the third-party supplier and Internet Machines. The third-party supplier has agreed to indemnify and defend the Company with respect to these lawsuits.
Based on the Company’s preliminary investigations of the patents identified in the Entorian Technologies and Internet Machines complaints, the Company does not believe that its products infringe any valid or enforceable claim of the patents at issue in those complaints. With respect to these matters, the Company’s third-party suppliers have agreed to indemnify and defend the Company. As of June 30, 2013, the Company did not record a liability related to these matters as it determined that an unfavorable resolution is either not currently probable or that an amount or relevant range is not reasonably estimable. However, litigation is inherently unpredictable and it is possible that losses may occur. Any unfavorable resolution of any of these matters could materially affect the Company’s consolidated financial position, cash flows, or results of operations. All legal costs associated with litigation are expensed as incurred.
10. Employee Benefit Plans
The Company sponsors a 401(k) defined contribution plan covering all U.S. employees. Matching contributions and profit sharing contributions to the plan are at the discretion of the Company. The Company did not pay any matching contributions in any periods presented in the accompanying consolidated statements of operations.
11. Related Party Transactions
Prior to its IPO in June 2011, the Company issued and sold an aggregate of 52,489,072 shares of Series A, B, and C convertible preferred stock. All shares of convertible preferred stock outstanding automatically converted into 52,489,072 shares of common stock in conjunction with the IPO. Purchasers of the Company’s Series A, B and C convertible preferred stock include New Enterprise Associates 12, Limited Partnership (“NEA 12”) and Lightspeed Venture Partners VIII, L.P. (“Lightspeed VIII”). Both of these investors owned more than 5% of the Company’s outstanding capital stock as of June 30, 2011 and NEA 12 owned more than 5% of the Company’s outstanding capital stock as of June 30, 2012 and 2013. Forest Baskett and Scott Sandell, both of whom are members of the Company’s board of directors, are general partners of NEA 12. Christopher J. Schaepe, a member of the Company’s board of directors until his resignation on December 16, 2011, is a founding managing director of Lightspeed Venture Partners.
Immediately prior to the Company’s acquisition of IO Turbine in August 2011, Lightspeed Venture Partners, a venture capital firm, through certain of its related funds (including Lightspeed Venture Partners VIII L.P. and Lightspeed Venture Partners VII, L.P.) owned over 10% of the Company’s outstanding capital stock and over 25% of IO Turbine’s capital stock. Christopher J. Schaepe, a member of the Company’s board of directors until his resignation on December 16, 2011, is a founding managing director of Lightspeed. In connection with the acquisition, Lightspeed received 744,866 shares of the Company’s common stock.
F-43
Table of Contents
Fusion-io, Inc.
Index to Exhibits
| Incorporated by Reference | ||||||||||||||||||||
Exhibit | Exhibit Description | Filed | Form | File No. | Exhibit | Filing Date | ||||||||||||||
| 2.1 | Agreement and Plan of Reorganization, dated as of August 4, 2011¸ by and between the Registrant, IO Turbine, Inc. and certain other parties | 8-K | 001-35188 | 2.1 | 08/05/2011 | |||||||||||||||
| 2.2 | Agreement and Plan of Merger, dated as of April 24, 2013, by and between Fusion-io, Inc., NexGen Storage, Inc. and certain other parties | 8-K | 001-35188 | 2.1 | 04/24/2013 | |||||||||||||||
| 3.1 | Amended and Restated Certificate of Incorporation of the Registrant | 10-K | 001-35188 | 3.1 | 09/02/2011 | |||||||||||||||
| 3.2 | Amended and Restated Bylaws of the Registrant | 10-K | 001-35188 | 3.2 | 09/02/2011 | |||||||||||||||
| 4.1 | Specimen common stock certificate of the Registrant | S-1/A | 333-172683 | 4.1 | 05/23/2011 | |||||||||||||||
| 10.1A* | Form of Indemnification Agreement by and between the Registrant and certain of its directors and officers | S-1/A | 333-172683 | 10.1A | 05/23/2011 | |||||||||||||||
| 10.1B* | Form of Indemnification Agreement by and between the Registrant and certain of its directors affiliated with investment funds and such investment funds | S-1/A | 333-172683 | 10.1B | 05/23/2011 | |||||||||||||||
| 10.2* | 2006 Stock Option Plan and Form of Stock Option Agreement under 2006 Stock Option Plan | S-1 | 333-172683 | 10.2 | 03/09/2011 | |||||||||||||||
| 10.3* | 2008 Stock Incentive Plan and Form of Stock Option Agreement under 2008 Stock Incentive Plan | S-1 | 333-172683 | 10.3 | 03/09/2011 | |||||||||||||||
| 10.4* | 2010 Executive Stock Incentive Plan and Related Forms | S-1 | 333-172683 | 10.4 | 03/09/2011 | |||||||||||||||
| 10.5* | 2011 Equity Incentive Plan and Related Forms | S-1/A | 333-172683 | 10.5 | 05/23/2011 | |||||||||||||||
| 10.6* | 2011 Employee Stock Purchase Plan and Form of Purchase Agreement under 2011 Employee Stock Purchase Plan | S-1/A | 333-172683 | 10.6 | 05/23/2011 | |||||||||||||||
| 10.7* | Form ofNon-Plan Stock Option Agreement between the Registrant and certain of its officers | S-1 | 333-172683 | 10.7 | 03/09/2011 | |||||||||||||||
Table of Contents
| Incorporated by Reference | ||||||||||||||||||||
Exhibit | Exhibit Description | Filed | Form | File No. | Exhibit | Filing Date | ||||||||||||||
| 10.8* | Form of Involuntary Termination Severance Agreement between the Registrant and certain of its officers | S-1 | 333-172683 | 10.10 | 03/09/2011 | |||||||||||||||
| 10.8A* | Involuntary Termination Severance Agreement between the Registrant and Dennis P. Wolf, dated as of August 11, 2010 | S-1/A | 333-172683 | 10.10A | 04/18/2011 | |||||||||||||||
| 10.9 | Lease Agreement between the Registrant and NOP Cottonwood 2825, LLC, dated May 28, 2010 (Building 10) | S-1 | 333-172683 | 10.12 | 03/09/2011 | |||||||||||||||
| 10.9A | First Amendment to Lease Agreement between Registrant and NOP Cottonwood 2825, LLC, dated August 16, 2011 (Building 10) | 10-Q/A | 001-35188 | 10.2 | 11/16/2011 | |||||||||||||||
| 10.9B | Second Amendment to Lease Agreement between Registrant and NOP Cottonwood 2825, LLC, dated December 2, 2011 (Building 10) | 10-Q | 001-35188 | 10.1 | 02/09/2012 | |||||||||||||||
| 10.9C | Third Amendment to Lease Agreement between Registrant and NOP Cottonwood 2825, LLC, dated March 15, 2013 (Building 10) | 10-Q | 001-35188 | 10.12C | 05/07/2013 | |||||||||||||||
| 10.10 | Lease Agreement between the Registrant and NOP Cottonwood 2855, LLC, dated May 28, 2010 (Building 11) | S-1 | 333-172683 | 10.13 | 03/09/2011 | |||||||||||||||
| 10.10A | First Amendment to Lease Agreement between Registrant and NOP Cottonwood 2855, LLC, dated September 6, 2011 (Building 11) | 10-Q/A | 001-35188 | 10.3 | 11/16/2011 | |||||||||||||||
| 10.10B | Second Amendment to Lease Agreement between Registrant and NOP Cottonwood 2855, LLC, dated July 10, 2012 (Building 11) | 10-K | 001-35188 | 10.13B | 08/27/2012 | |||||||||||||||
| 10.11* | Offer Letter between the Registrant and Dennis Wolf, dated November 4, 2009 | S-1/A | 333-172683 | 10.16 | 05/06/2011 | |||||||||||||||
| 10.12* | Offer Letter between the Registrant and Jim Dawson, dated April 1, 2008 | S-1/A | 333-172683 | 10.17 | 05/06/2011 | |||||||||||||||
| 10.13* | Offer Letter between the Registrant and Lance Smith, dated April 29, 2008 as supplemented by an Offer Letter dated December 26, 2008 | S-1/A | 333-172683 | 10.18 | 05/06/2011 | |||||||||||||||
-2-
Table of Contents
| Incorporated by Reference | ||||||||||||||||||||||
Exhibit | Exhibit Description | Filed | Form | File No. | Exhibit | Filing Date | ||||||||||||||||
| 10.14* | Executive Incentive Compensation Plan, adopted by the Registrant on May 16, 2011 | S-1/A | 333-172683 | 10.19 | 05/23/2011 | |||||||||||||||||
| 10.15* | IO Turbine, Inc. 2009 Equity Incentive Plan | 10-K | 001-35188 | 10.20 | 09/02/2011 | |||||||||||||||||
| 10.16 | Office Lease, dated as of January 13, 2012 and executed on January 20, 2012, by and between the Registrant and LaSalle Montague, Inc. | 10-Q | 001-35188 | 10.1 | 05/10/2012 | |||||||||||||||||
| 10.17* | Offer Letter, dated as of August 4, 2011, between the Registrant and Richard W. Boberg | 8-K | 001-35188 | 10.1 | 09/14/2012 | |||||||||||||||||
| 10.18* | NexGen Storage, Inc. 2010 Equity Incentive Plan and Related Forms | S-8 | 333-188406 | 4.2 | 05/07/2013 | |||||||||||||||||
| 10.19* | Form of Acknowledgment and Agreement by and between the Registrant and each of James L. Dawson, Shawn J. Lindquist, Lance L. Smith, and Dennis P. Wolf | X | ||||||||||||||||||||
| 10.20* | Letter Agreement between the Registrant and Shane Robison, dated May 29, 2013 | 8-K | 001-35188 | 10.1 | 05/31/2013 | |||||||||||||||||
| 10.21* | Involuntary Termination Severance Agreement between the Registrant and Shane Robison, effective as of May 7, 2013 | 8-K | 001-35188 | 10.2 | 05/31/2013 | |||||||||||||||||
| 10.22* | Separation Agreement and Release of Claims between the Registrant and David A. Flynn, dated May 30, 2013 | 8-K | 001-35188 | 10.3 | 05/31/2013 | |||||||||||||||||
| 10.23* | Separation Agreement and Release of Claims between the Registrant and Rick C. White, dated May 30, 2013 | 8-K | 001-35188 | 10.4 | 05/31/2013 | |||||||||||||||||
| 21.1 | Subsidiaries of the Registrant | X | ||||||||||||||||||||
| 23.1 | Consent of Ernst & Young LLP Independent Registered Public Accounting Firm | X | ||||||||||||||||||||
| 31.1 | Certification of the Chief Executive Officer pursuant to Section 302 of theSarbanes-Oxley Act of 2002 | X | ||||||||||||||||||||
| 31.2 | Certification of the Chief Financial Officer pursuant to Section 302 of theSarbanes-Oxley Act of 2002 | X | ||||||||||||||||||||
-3-
Table of Contents
| Incorporated by Reference | ||||||||||||||
Exhibit | Exhibit Description | Filed | Form | File No. | Exhibit | Filing Date | ||||||||
| 32.1 | Certification of the Chief Executive Officer pursuant to Section 906 of theSarbanes-Oxley Act of 2002 | X | ||||||||||||
| 32.2 | Certification of the Chief Financial Officer pursuant to Section 906 of theSarbanes-Oxley Act of 2002 | X | ||||||||||||
| 101.INS** | XBRL Instance Document | |||||||||||||
| 101.SCH** | XBRL Taxonomy Schema Linkbase Document | |||||||||||||
| 101.CAL** | XBRL Taxonomy Calculation Linkbase Document | |||||||||||||
| 101.DEF** | XBRL Taxonomy Definition Linkbase Document | |||||||||||||
| 101.LAB** | XBRL Taxonomy Labels Linkbase Document | |||||||||||||
| 101.PRE** | XBRL Taxonomy Presentation Linkbase Document | |||||||||||||
| * | Indicates a management contract or compensatory plan or arrangement. |
| ** | Pursuant to Rule 406T of Regulation S T, the Interactive Data Files on Exhibit 101 hereto are deemed not filed or part of a registration statement or prospectus for purposes of Sections 11 or 12 of the Securities Act of 1933, as amended, are deemed not filed for purposes of Section 18 of the Securities and Exchange Act of 1934, as amended, and otherwise are not subject to liability under those sections. |
-4-