Exhibit 99.1
June 2013
This presentation contains “forward-looking” statements that are based on our beliefs and assumptions and on information currently available to us. Forward-looking statements include information concerning our possible or assumed future results of operations, business strategies, financing plans, competitive position, industry environment, potential growth opportunities, potential market opportunities and the effects of competition.
Forward-looking statements include all statements that are not historical facts and can be identified by terms such as “anticipates “ “believes “ “could “ “seeks “ “estimates “ “intends “ “may “ “plans “ “potential “ “predicts “ “projects “ “should “ “will,” “would” or similar expressions and the negatives of those terms. Forward-looking statements involve known and unknown risks, uncertainties and other factors that may cause our actual results, performance or achievements to be materially different from any future results performance or achievements expressed or implied by the forward-looking statements Forward-looking statements represent our beliefs and assumptions only as of the date of this presentation. You should read the documents that we file with the Securities and Exchange Commission (SEC), including the risks detailed from time to time therein, completely and with the understanding that our actual future results may be different from what we expect. Except as required by law we assume no obligation to update these forward-looking statements publicly or to update the reasons actual results could differ materially from those anticipated in the forward-looking statements, even if new information becomes available in the future.
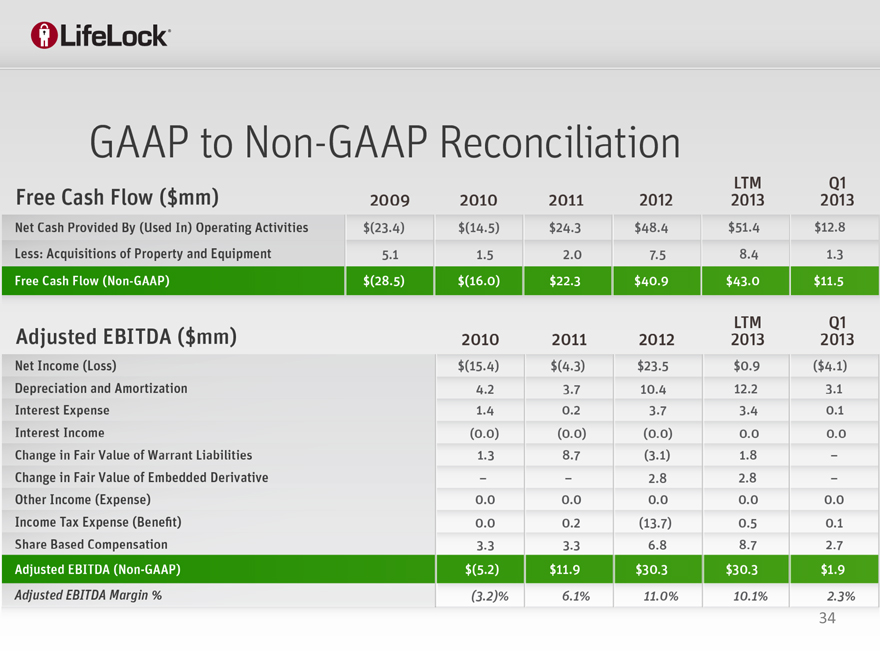
This presentation includes certain non-GAAP financial measures as defined by SEC rules. As required by Regulation G, we have provided a reconciliation of those measures to the most directly comparable GAAP measures which is available in the Appendix
TODD DAVIS
CO-FOUNDER CHARIMAN
& CHIEF EXECUTIVE OFFICER
VISION STATEMENT
Absolute knowledge of identities and convenient protection for cunsumers
And enterprises anytime anyhere.
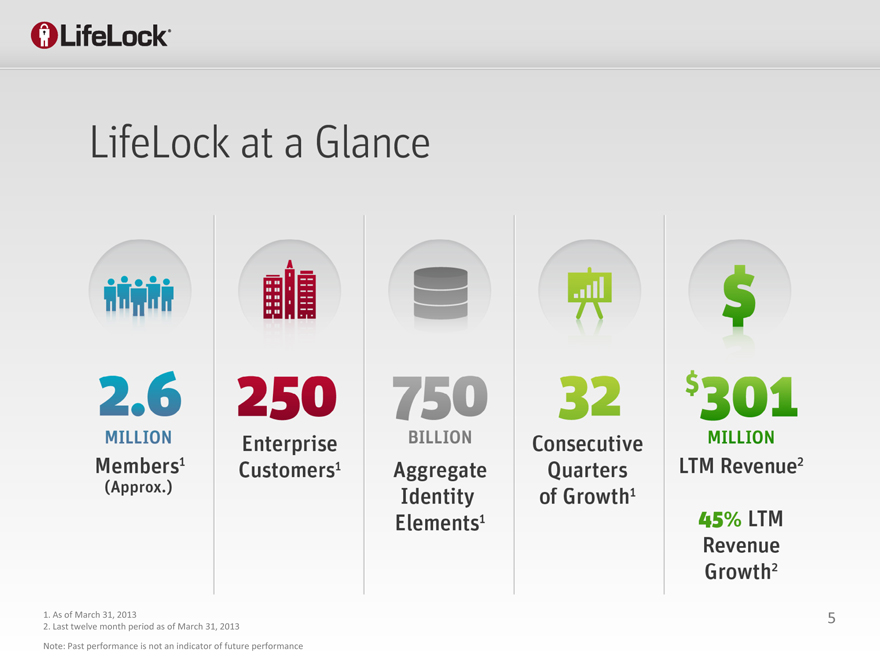
2.6 million
250 enterprises customers
750 billion aggregate identity Elements1
32 Consecutive Quarters of growth1
$301 Million LTM Revenue2
456% LTM Revenue Growth2
2. Last twelve month period as of March 31, 2013
Note: Past performance is not an indicator of future performance
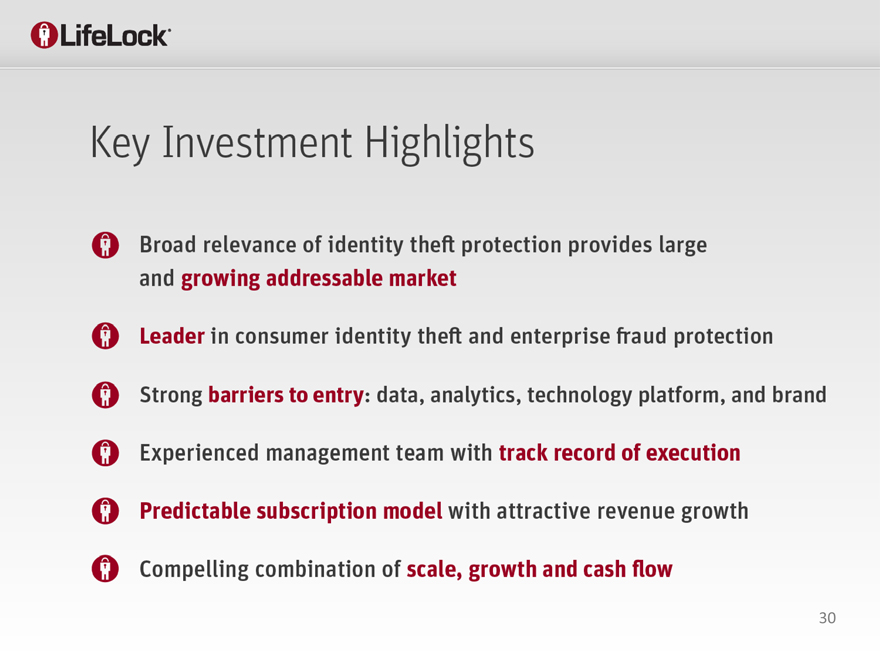
Key Investment Highlights
Broad releveance of identity theft protection provides large and growing addressable market
Leader in consumer identity theft and enterprise fraud protection
Strong Barriers to entry: data, analytics, technology platform and brand
6
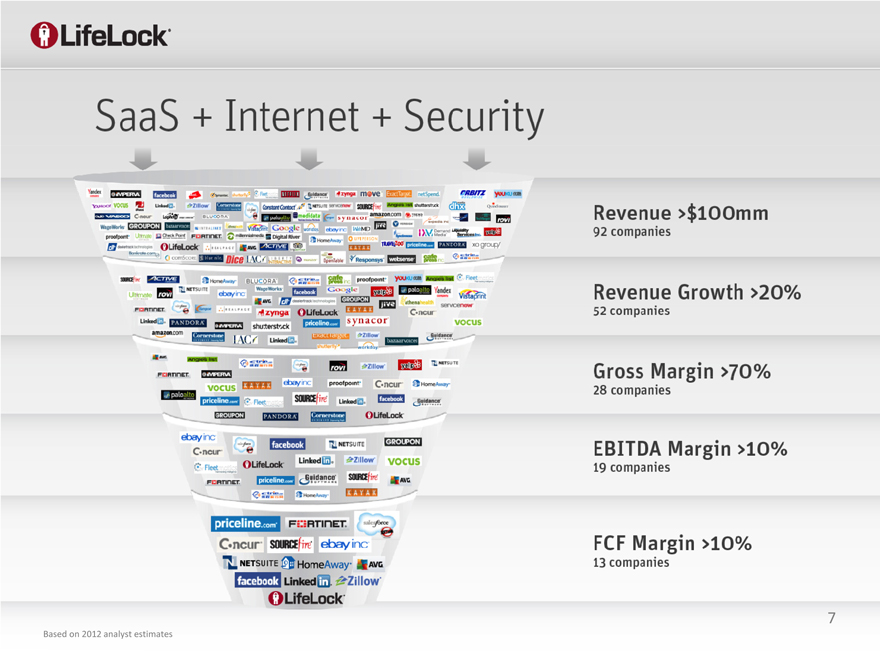
Revenue >100 million
Revenue Growth >20% 52 companies
92 companies
Gross Margin >70%
28 companies
EBITDA Margin >10%
19 companies
FCF margin >10%
13 companies
Based on 2012 analyst estimates
Note: Past performance is not an indicator of future performance
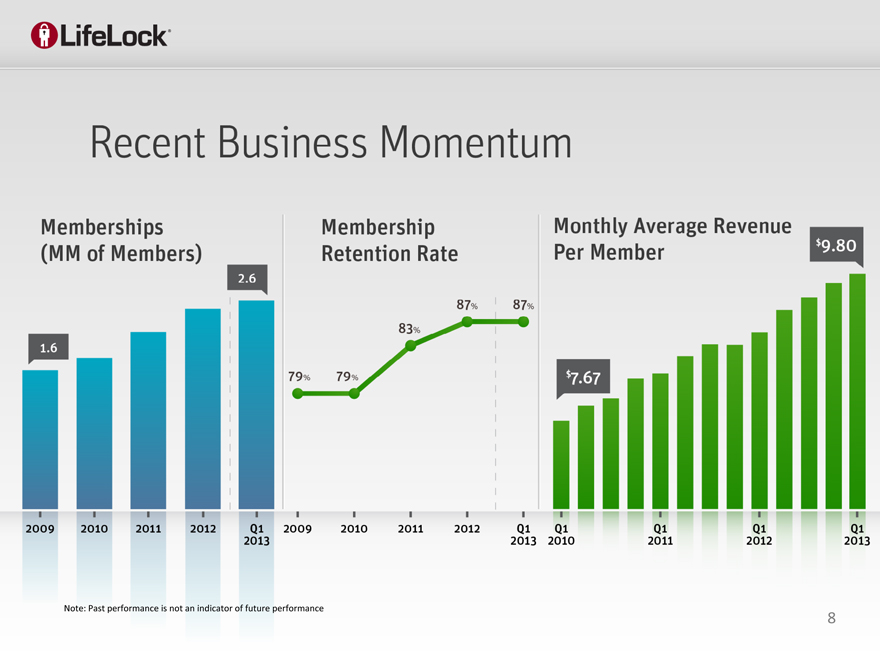
Memberships (MM of Members) 1.6
2.6
79%
2009
2010
2011
2012
Q12013
Q12012
Q12011
$7.67
$9.80
2009
2010
2011
2012
Membership Retention Rate
Monthly Average Revenue
Per Member
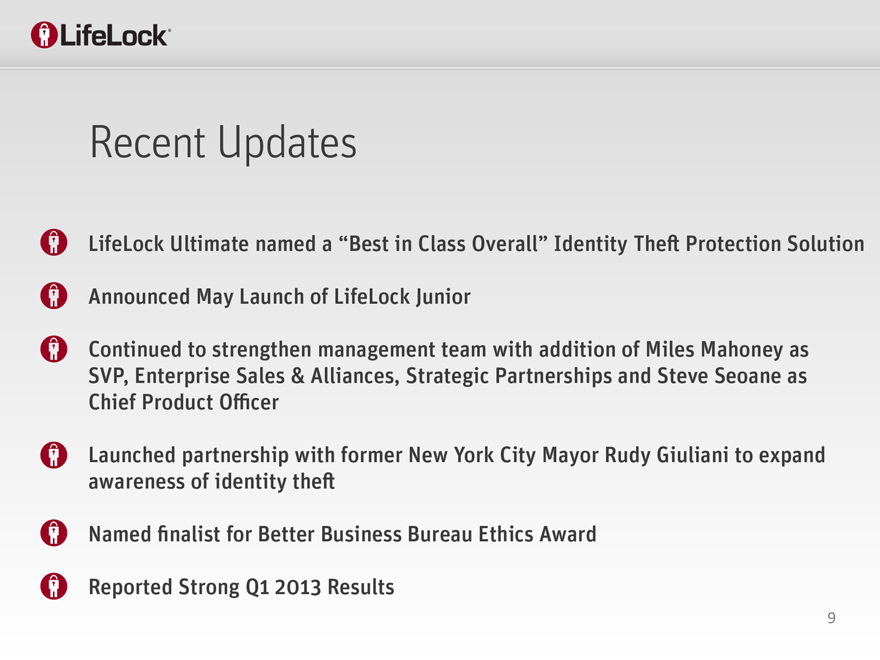
LifeLock Ultimate name a Best in Class Overall “ identity Theft Protection Solution
Announced May Launch of LifeLock Junior
Reported Strong Q1 2013 results
Named finalist for Better Business Bureau Ethics Award
9
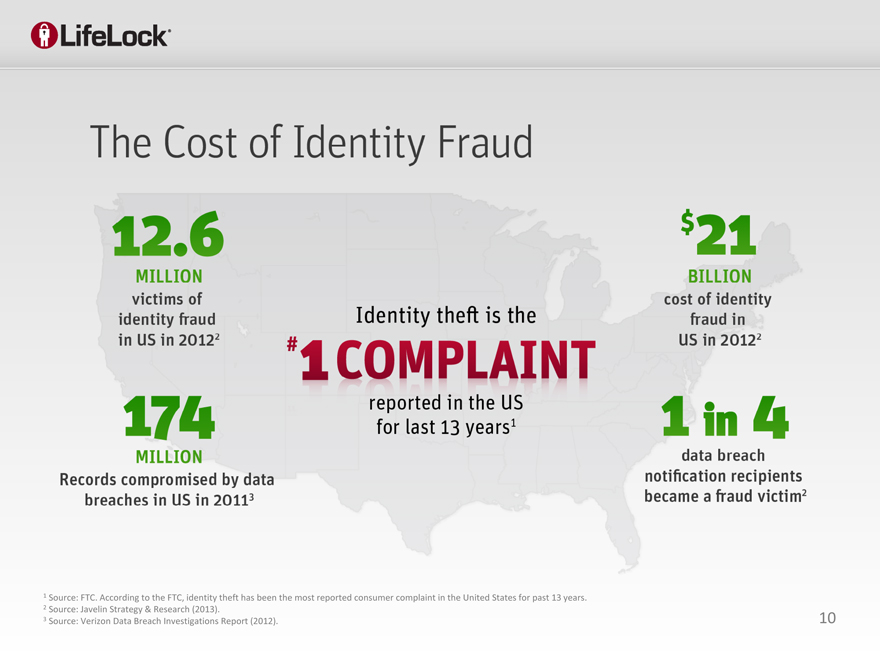
1 Source: FTC According to the FTC identity theft has been the most reported consumer complaint in the United States for past 13 years
2 | | Source: Javelin Strategy & Research (2013). |
3 | | Source: Verizon Data Breach Investigations Report (2012). |
10
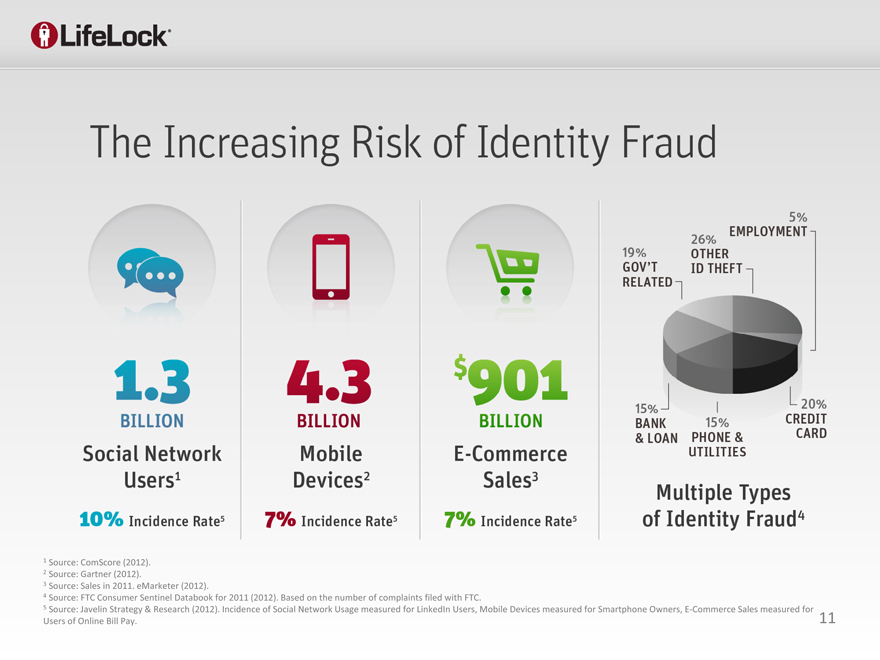
1 | | Source: ComScore (2012). |
2 | | Source: Gartner (2012). |
3 | | Source: Sales in 2011. eMarketer (2012). |
4 | | Source: FTC Consumer Sentinel Databook for 2011 (2012) Based on the number of complaints filed with FTC |
5 Source: Javelin Strategy & Research (2012). Incidence of Social Network Usage measured for LinkedIn Users, Mobile Devices measured for Smartphone Owners, E-Commerce Sales measured for Users of Online Bill Pay.
11
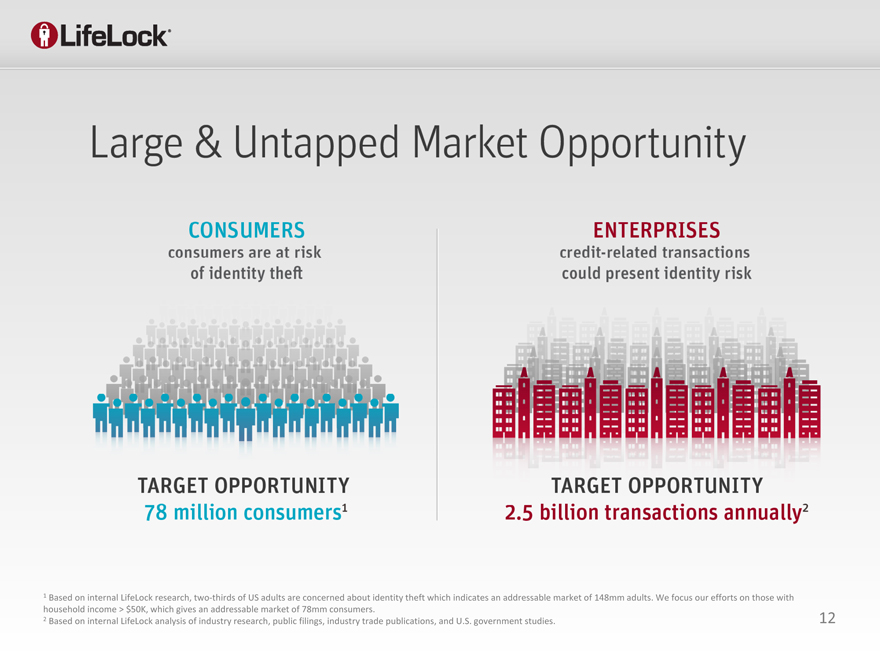
1 Based on internal LifeLock research two-thirds of US adults are concerned about identity theft which indicates an addressable market of 148mm adults We focus our efforts on those with household income > $50K, which gives an addressable market of 78mm consumers.
2 Based on internal LifeLock analysis of industry research, public filings, industry trade publications, and U.S. government studies.
12
13
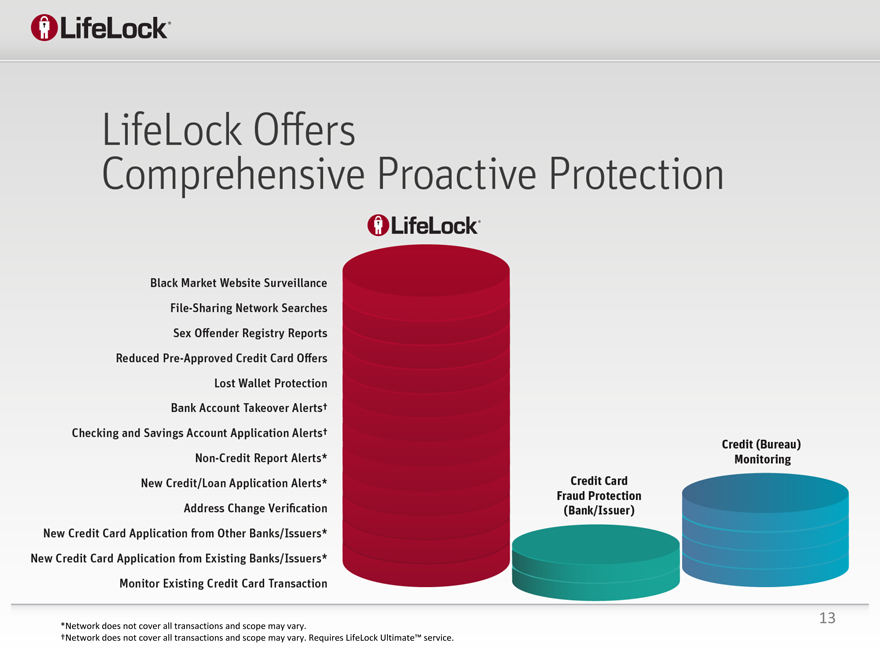
*Network does not cover all transactions and scope may vary.
†Network does not cover all transactions and scope may vary. Requires LifeLock Ultimate™ service.
LifeLocK Offers comprehensive Proactive Protection
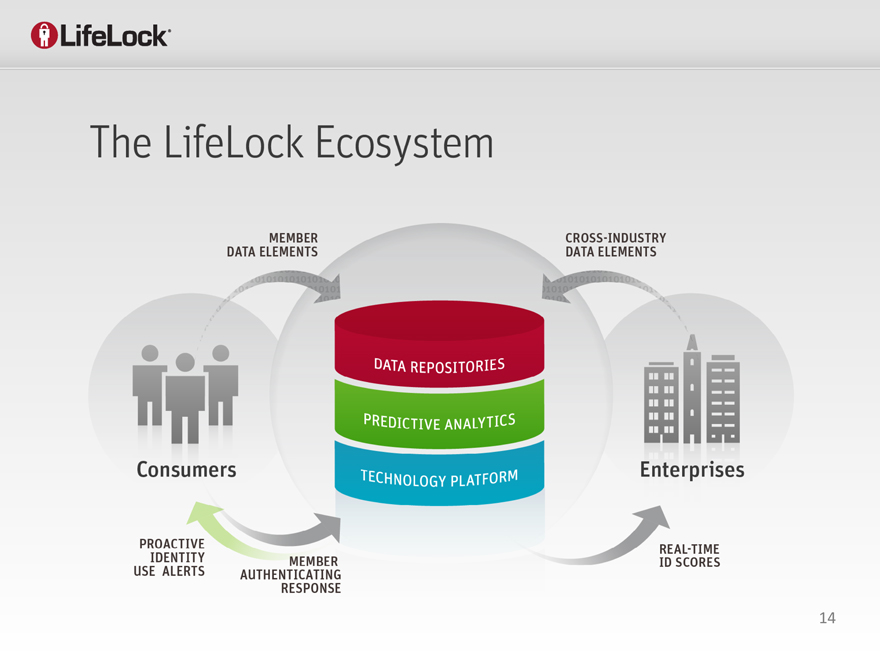
The LifeLock Ecosystem
Member DATA ELEMENTS
CROSS-INDUSTRY DATA-ELEMENTS
CONSUMERS
PROACTIVE IDENTITY USE ALERTS
ENTERPRISES
DATA REPOSITORIES
PREDICTDIVE ANALYTICS
TECHNOLOGY PLATFORM
14
15
OUR UNIQUE DATA REPOSITORIES
750 BILLION IDENTITY ELEMENTS
45 MILLION IDENTITY ELEMENTS
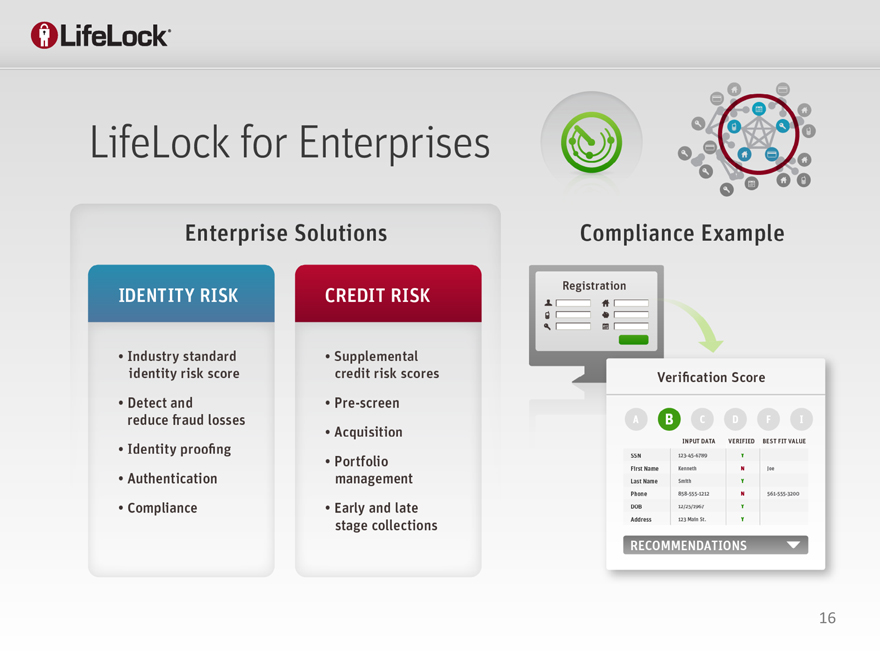
LIFELOCK FOR ENTERPRISES
COMPLIANCE EXAMPLE
IDENTITY RISK
CREDIT RISK
VERIFICATION SCROE
16
LIFELOCK FOR CONSUMERS
17
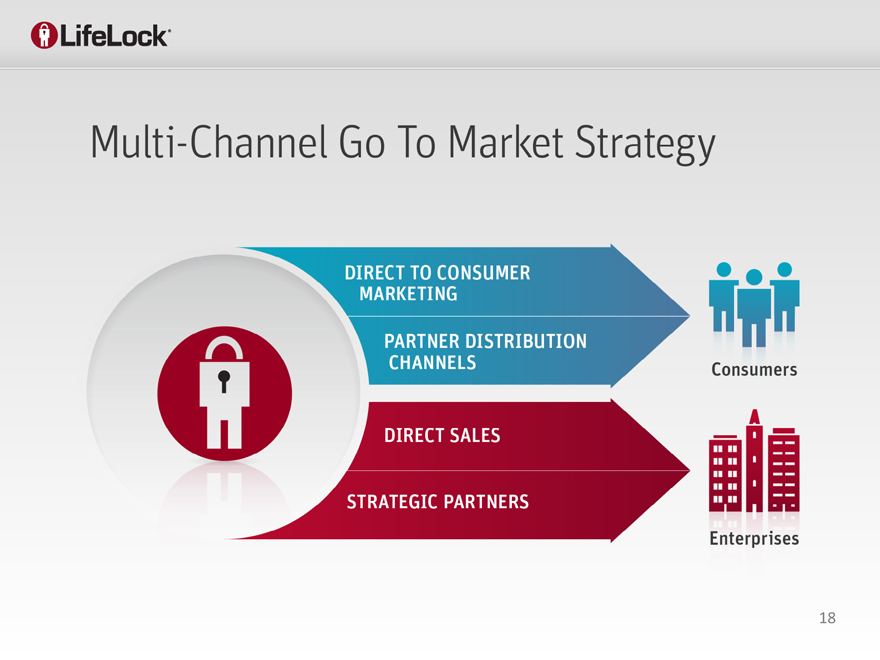
MULTI-CHANNEL GO TO MARKET STRATEGY
DIRECT TO CONSUMER MARKETING
PARTNERS DISTRIBUTION CHANNELS
DIRECT SALES
STRATEGIC PARTNERS
18
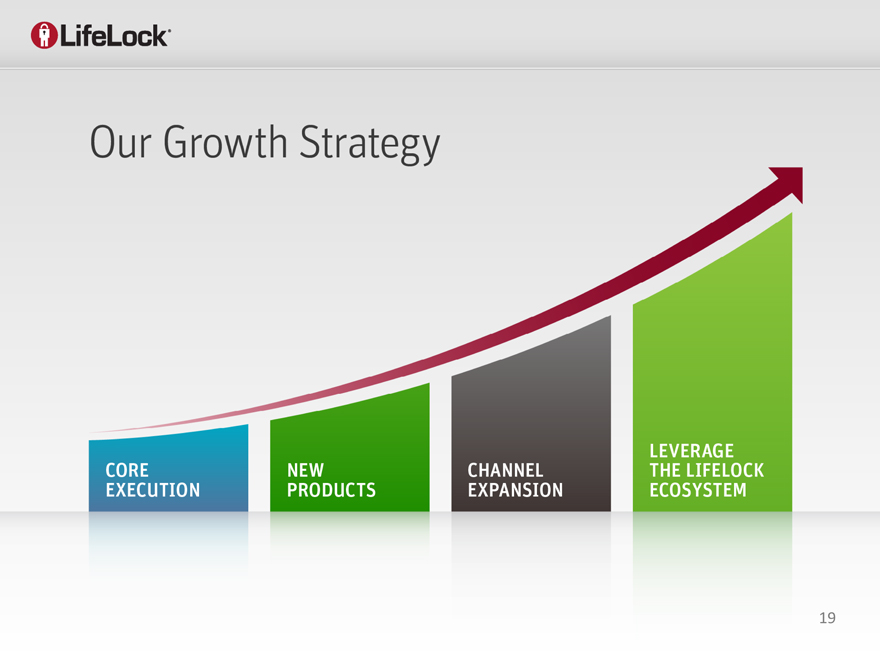
OUR GROWTH STRATEGY
CORE EXECTUTION
NEW PRODUCTS
CHANNEL EXPANSION
LEVERAGE THE LIFELOCK ECOSYSTEM
19
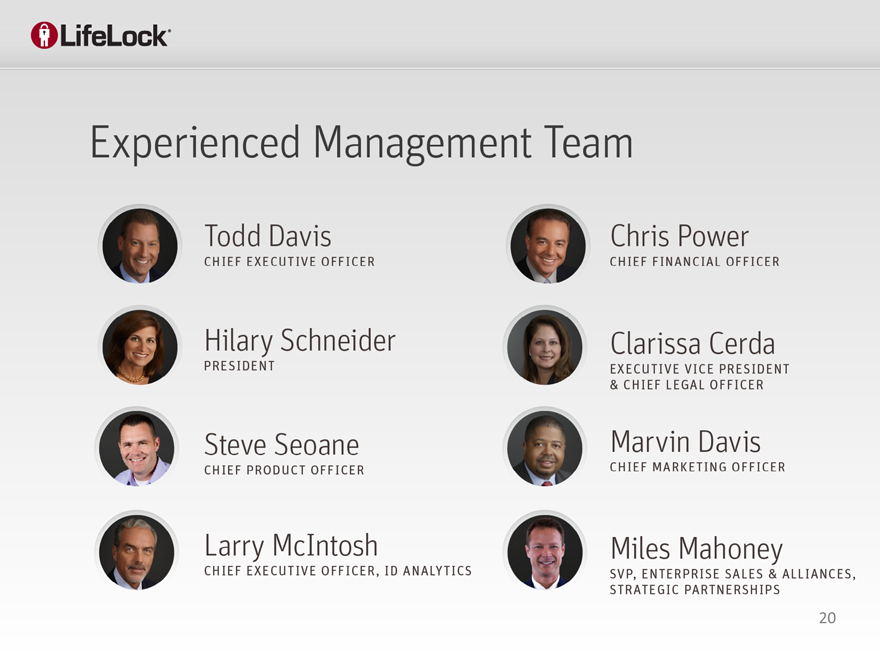
EXPERIENCED MANAGEMENT TEAM
20
CHRIS POWER
CHIEF FINANCIAL OFFICER
21
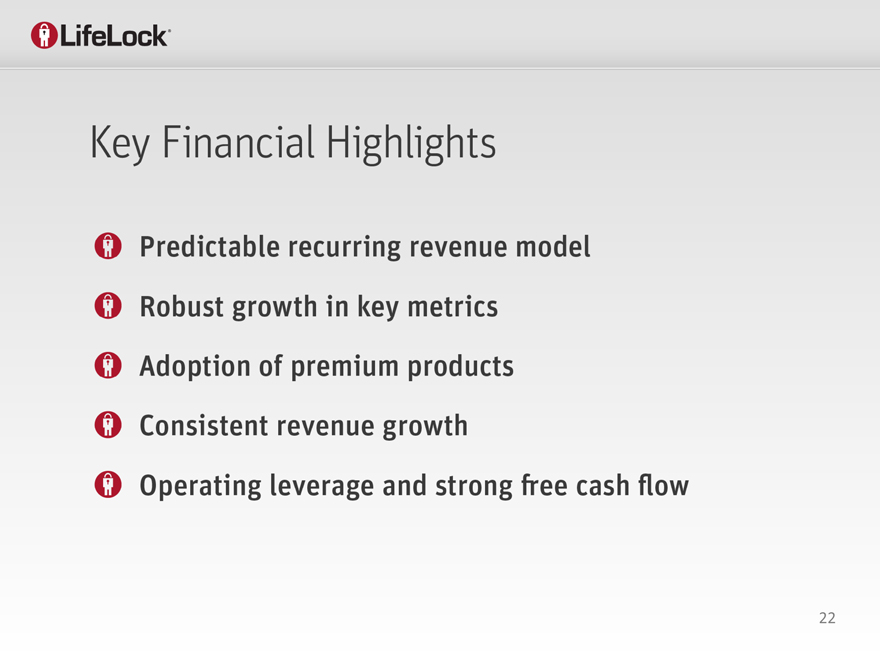
KEY FINANCIAL HIGHLIGHTS
22
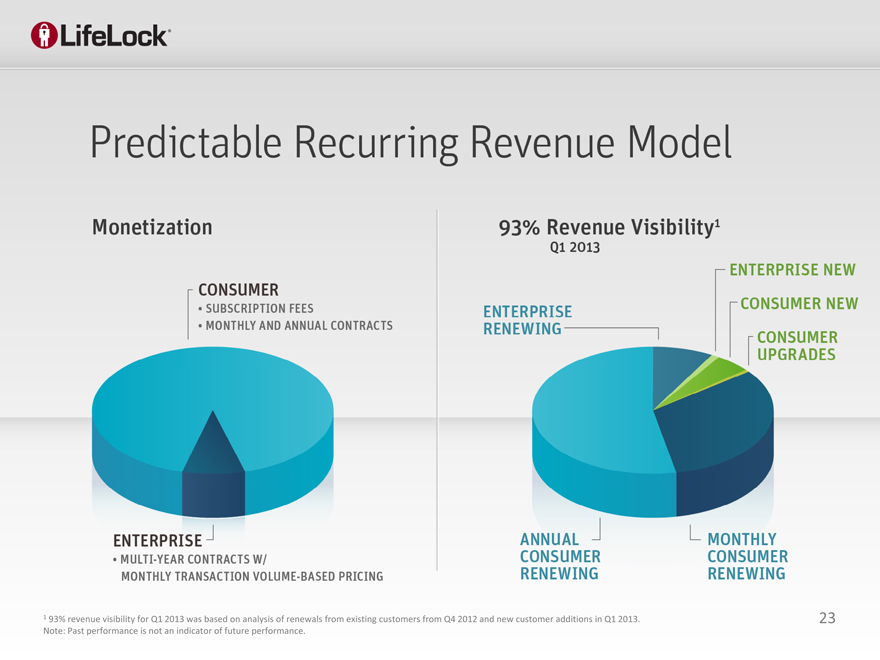
PREDICATABLE RECURRING REVENUE MODEL
1 93% revenue visibility for Q1 2013 was based on analysis of renewals from existing customers from Q4 2012 and new customer additions in Q1 2013.
23
Note: Past performance is not an indicator of future performance.
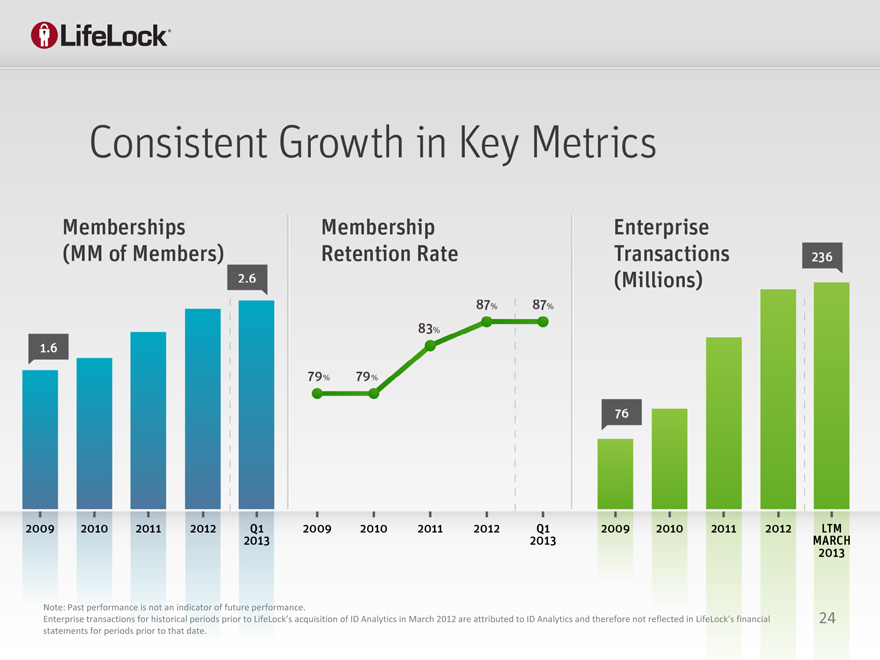
Note: Past performance is not an indicator of future performance
Enterprise transactions for historical periods prior to LifeLock’s acquisition of ID Analytics in March 2012 are attributed to ID Analytics and therefore not reflected in LifeLock’s financial 24 statements for periods prior to that date.
24
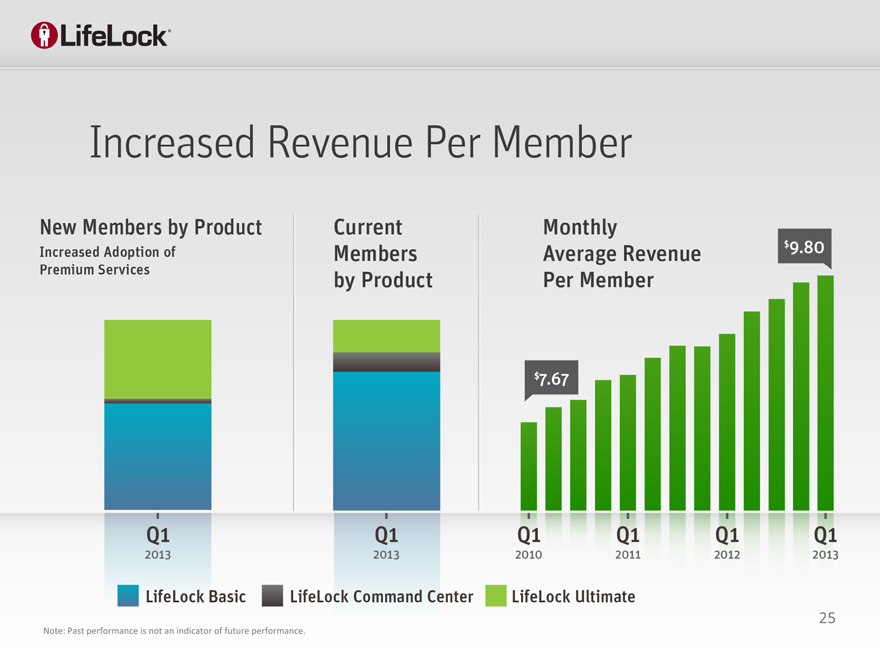
INCREASED REVENUE PER MEMBER
25
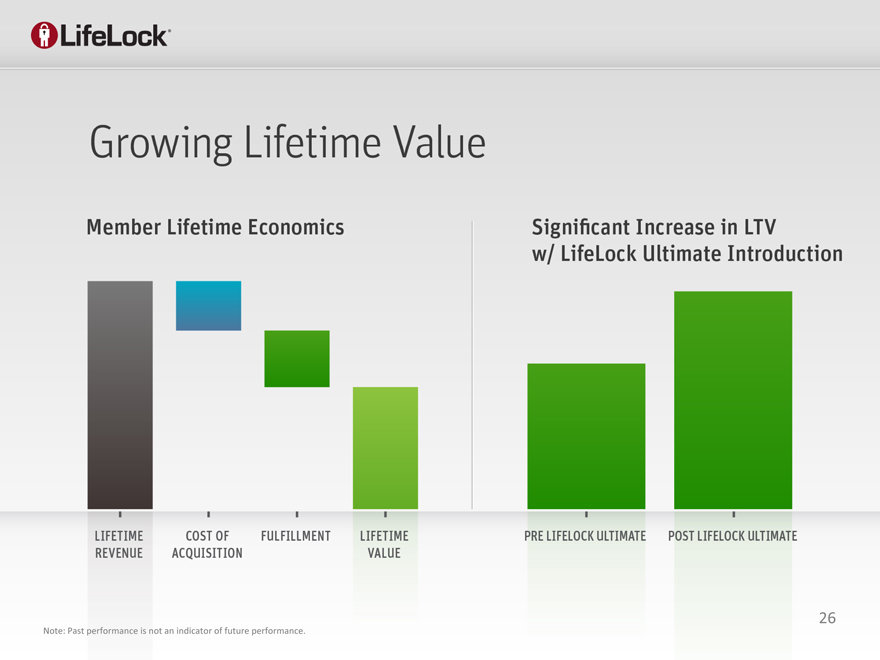
GROWING LIFETIME VALUE
Note: Past performance is not an indicator of future performance.
26
Note: Past performance is not an indicator of future performance.
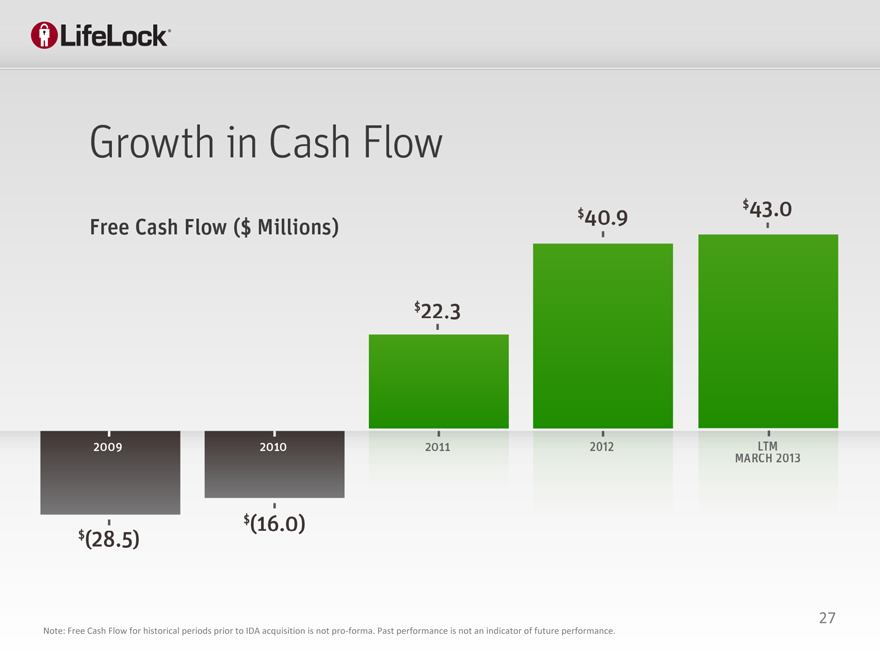
GROWTH IN CASH FLOW
FREE CASH FLOW ($ IN MILLIONS
27
Note: Free Cash Flow for historical periods prior to IDA acquisition is not pro-forma. Past performance is not an indicator of future performance.
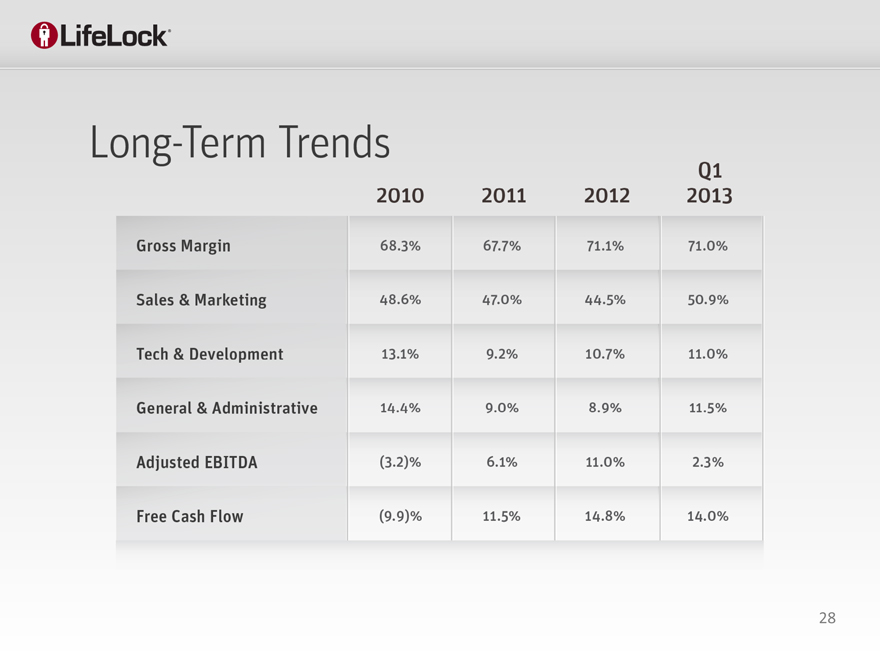
Long term
28
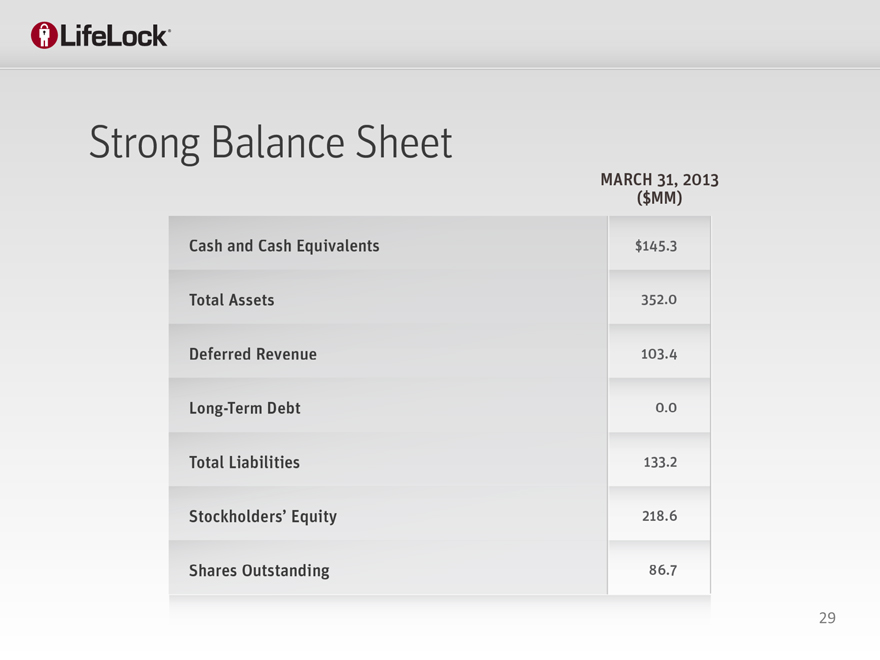
Strong balance sheet
29
Key investment highlights
30
Appendix
31
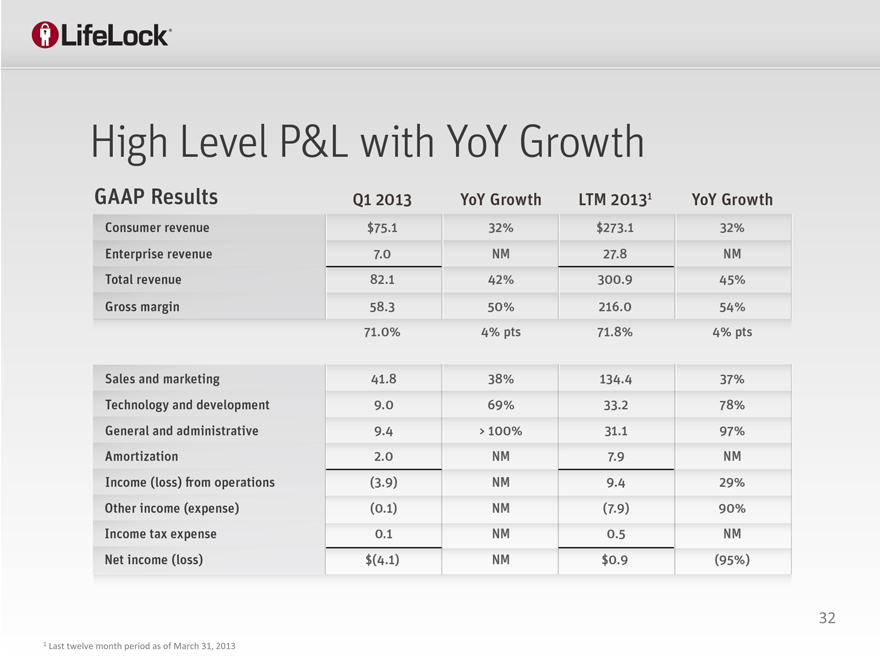
High level P&L with YoY Growth
32
1 | | Last twelve month period as of March 31, 2013 |
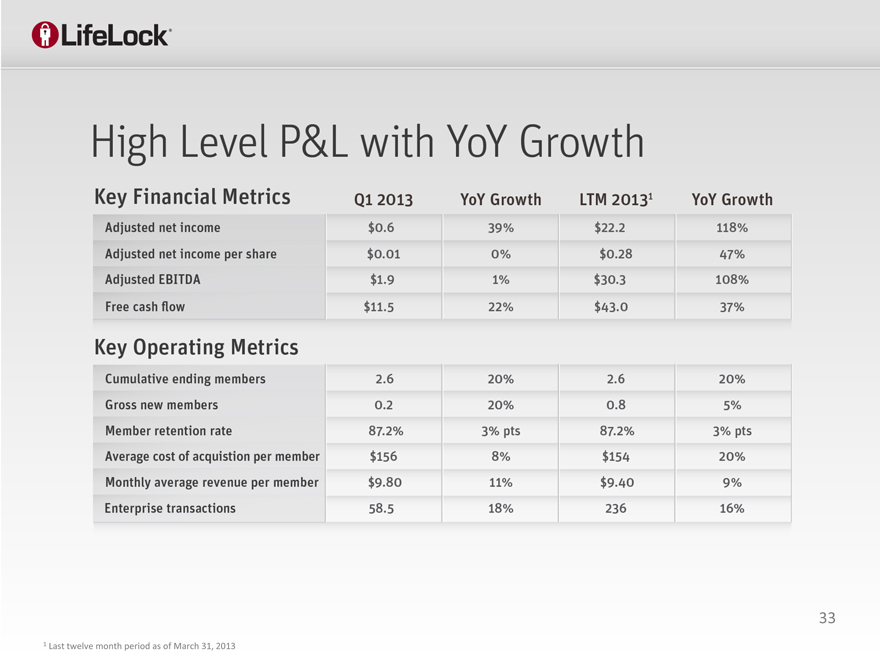
High level P&L with YoY Growth
33
1 | | Last twelve month period as of March 31, 2013 |
GAAP to Non-GAAP reconciliation
34
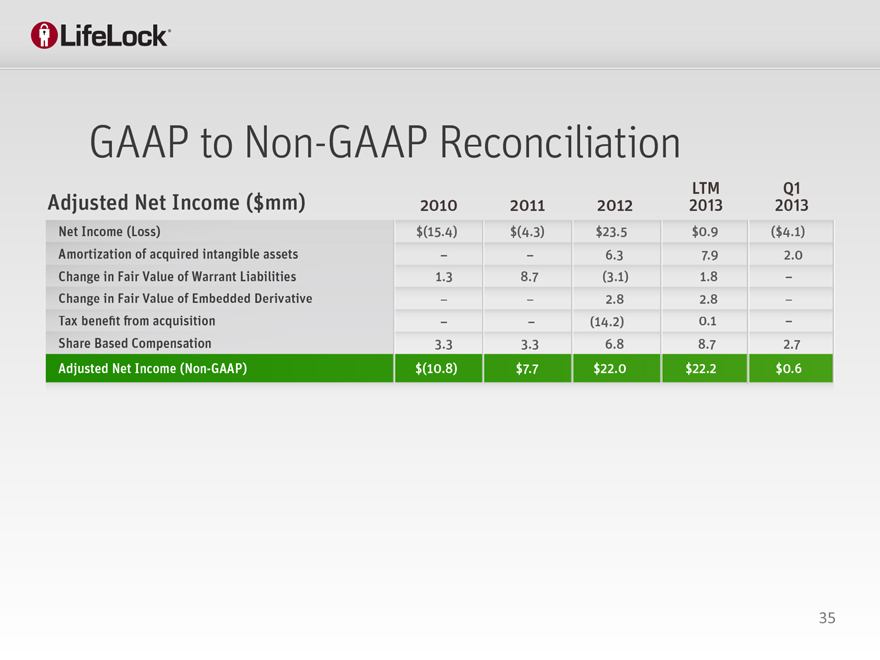
GAAP to Non-GAAP reconciliation
35
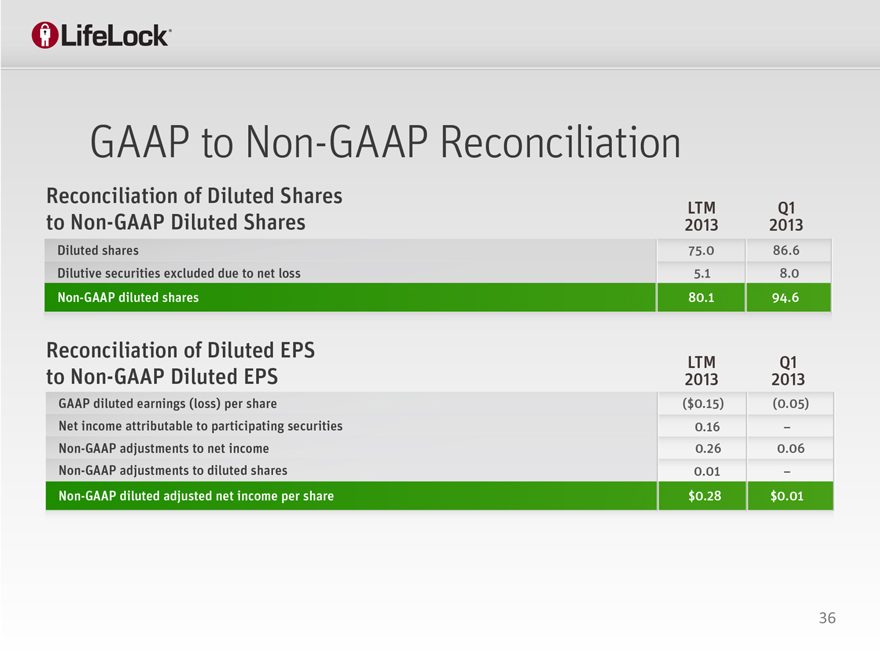
GAAP to Non-GAAP reconciliation
36

