 1 ©2014 LifeLock Inc. 1-800-LifeLock LifeLock.com LIFELOCK MAY 2014 EXHIBIT 99.1 |
 Safe Harbor Statement ©2014 LifeLock Inc. 1-800-LifeLock LifeLock.com 2 This presentation contains “forward-looking” statements that are based on our beliefs and assumptions and on information currently available to us. Forward-looking statements include information concerning our possible or assumed future results of operations, financial goals, business strategies, financing plans, competitive position, product development, membership growth, strategic and enterprise opportunities and partnerships, marketing and advertising plans, industry environment, potential growth opportunities, potential market opportunities and the effects of competition. Forward-looking statements include all statements that are not historical facts and can be identified by terms such as “anticipates,” “believes,” “could,” “seeks,” “estimates,” “intends,” “may,” “plans,” “potential,” “predicts,” “projects,” “should,” “will,” “would” or similar expressions and the negatives of those terms. Forward-looking statements involve known and unknown risks, uncertainties and other factors that may cause our actual results, performance or achievements to be materially different from any future results, performance or achievements expressed or implied by the forward-looking statements. Forward-looking statements represent our beliefs and assumptions only as of the date of this presentation. You should read the documents that we file with the Securities and Exchange Commission (SEC), including the risks detailed from time to time therein, completely and with the understanding that our actual future results may be different from what we expect. Except as required by law, we assume no obligation to update these forward-looking statements publicly, or to update the reasons actual results could differ materially from those anticipated in the forward-looking statements, even if new information becomes available in the future. This presentation includes certain non-GAAP financial measures as defined by SEC rules. As required by Regulation G, we have provided a reconciliation of those measures to the most directly comparable GAAP measures, which is available in the Appendix. |
 Recent Business Highlights ©2014 LifeLock Inc. 1-800-LifeLock LifeLock.com 3 • Recorded the 36th consecutive quarter of sequential growth in revenue and cumulative ending members. • Added approximately 344,000 gross new members in the first quarter of 2014 and ended the quarter with approximately 3.22 million members. • Achieved a retention rate of 87.5% for the first quarter of 2014, compared with 87.2% for the first quarter of 2013. • Increased monthly average revenue per member by 10% to $10.81 for the first quarter of 2014 from $9.80 for the first quarter of 2013. • Launched a partnership with Vivint TM , one of the largest home automation services providers in North America, that will provide VivintTM customers the ability to bundle their new or existing service package with LifeLock’s identity theft protection offerings. • Exceeded Q1 guidance on top and bottom line. Raised full year guidance on revenue, Adj EBITDA, Adj EPS and free cash flow. |
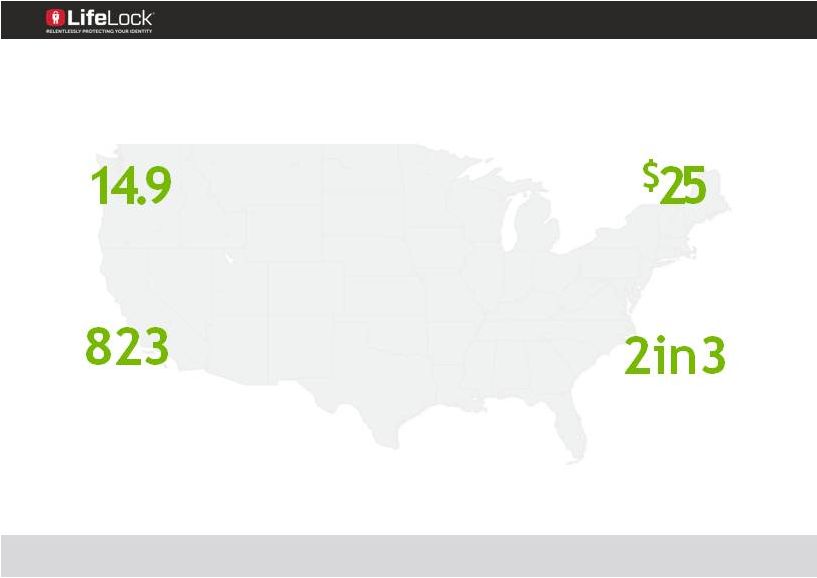 The Cost of Identity Fraud ©2014 LifeLock Inc. 1-800-LifeLock LifeLock.com 4 MILLION US victims of identity fraud in 12 month period** BILLION cost of identity fraud in US in 2012 *** MILLION number of records exposed by data breach in 2013 **** data breach notification recipients became a fraud victim ** Identity theft is the #1 COMPLAINT reported in the US for the last 14 years * * Colleen Tressler, ‘Identity theft tops list of consumer complaints for 14th consecutive year,” Federal Trade Commission, Feb 27, 2014. ** Q32013; Identity Theft Tracking Study; a commissioned survey conducted July/August by Forrester Consulting on behalf of LifeLock for period ending July/August 2013. *** The Bureau of Justice Statistics bulletin, Victims of Identity Theft, 2012 (December 2013) **** Online Trust Alliance, 2014 Data Protection & Breach (2014) |
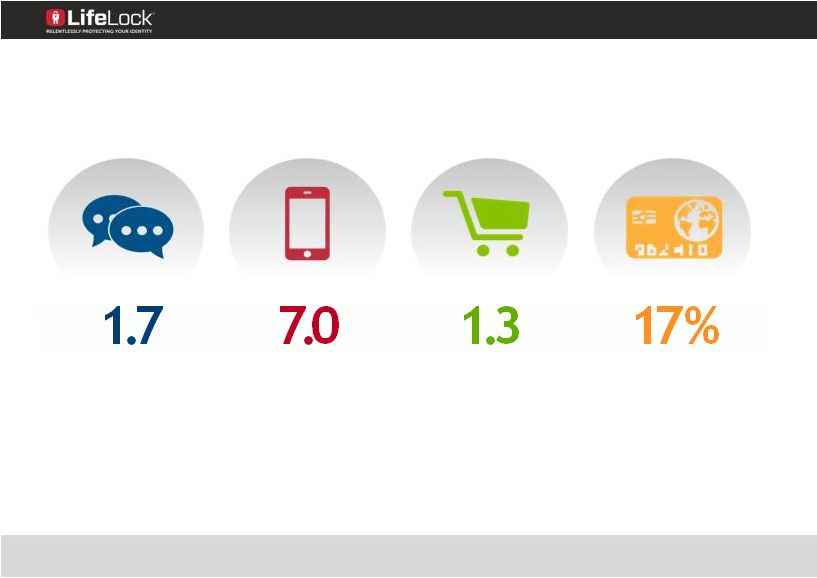 The Increasing Risk of Identity Fraud ©2014 LifeLock Inc. 1-800-LifeLock LifeLock.com 5 *2013 estimated users eMarketer (2013). **Forrester research custom forecast for LifeLock (2013). ***2013 sales estimate. eMarketer (2013). ****FTC Consumer Sentinel Data Book for 2013 (2014). Based on the number of complaints filed with FTC. ***** A commissioned survey conducted by Forrester Consulting on behalf of LifeLock, Q4 2013. Incidence of social network usage, mobile devices for smart phone users, e-commerce sales. BILLION Social Network Users * 7% Incidence Rate ***** BILLION Mobile Devices** 8% Incidence Rate ***** TRILLION E-Commerce Sales *** 7% Incidence Rate ***** OF ALL Reported Claims **** |
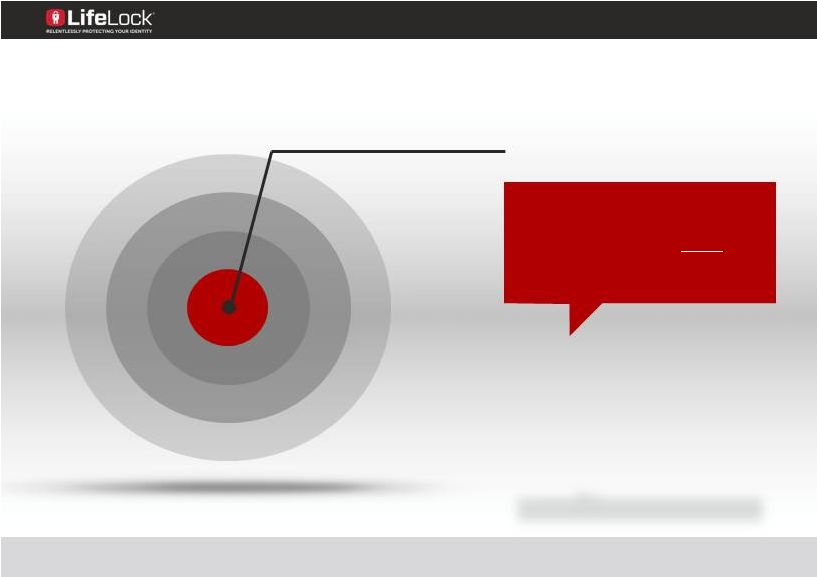
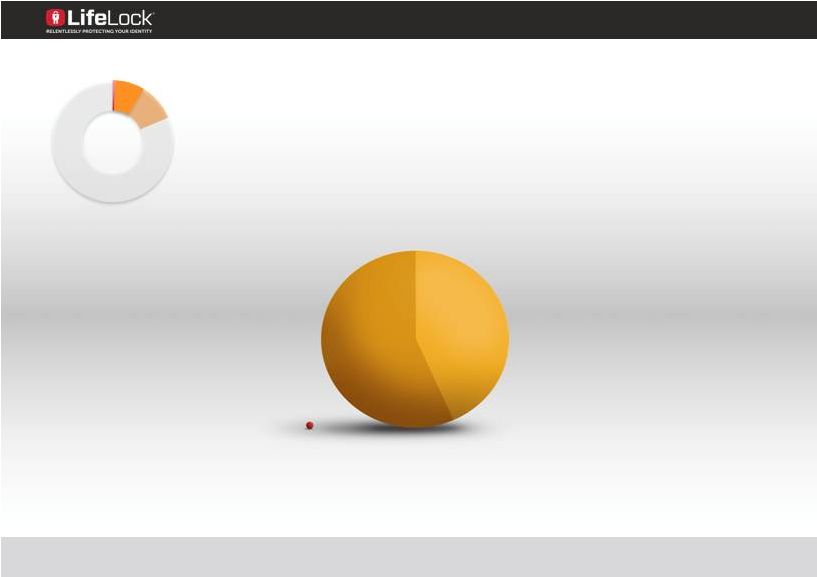 Concerned About Security – 78 Million ©2014 LifeLock Inc. 1-800-LifeLock LifeLock.com 6 30+ Million are doing something 40+ Million are doing nothing Current Market Share 3 Million |
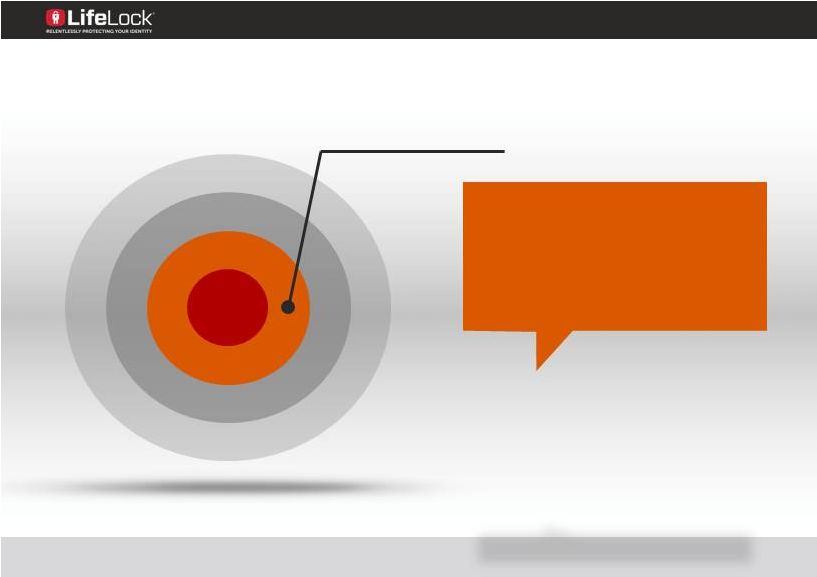
 Adults in US ©2014 LifeLock Inc. 1-800-LifeLock LifeLock.com 7 240 Million Income of $50K Plus |
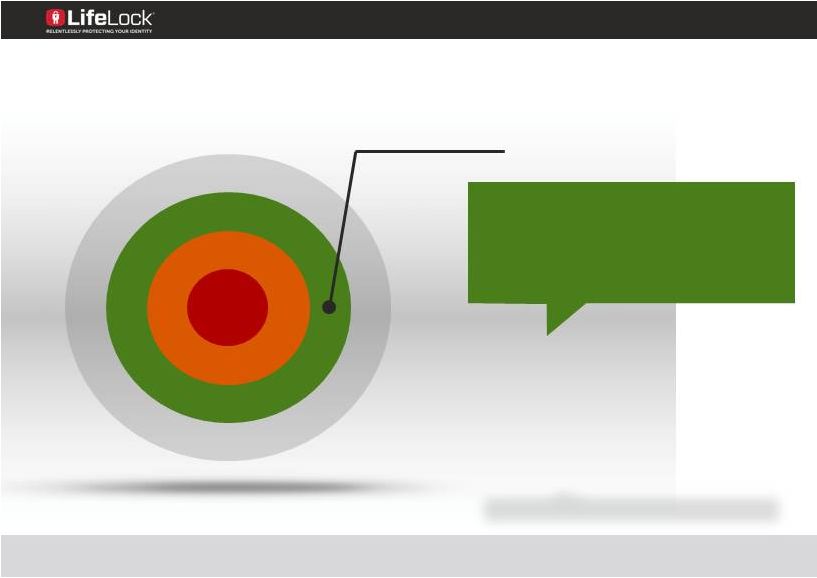
 Enterprise Market Opportunity ©2014 LifeLock Inc. 1-800-LifeLock LifeLock.com 8 216 Million Transactions in 2013 3.4 Billion Target Opportunity |
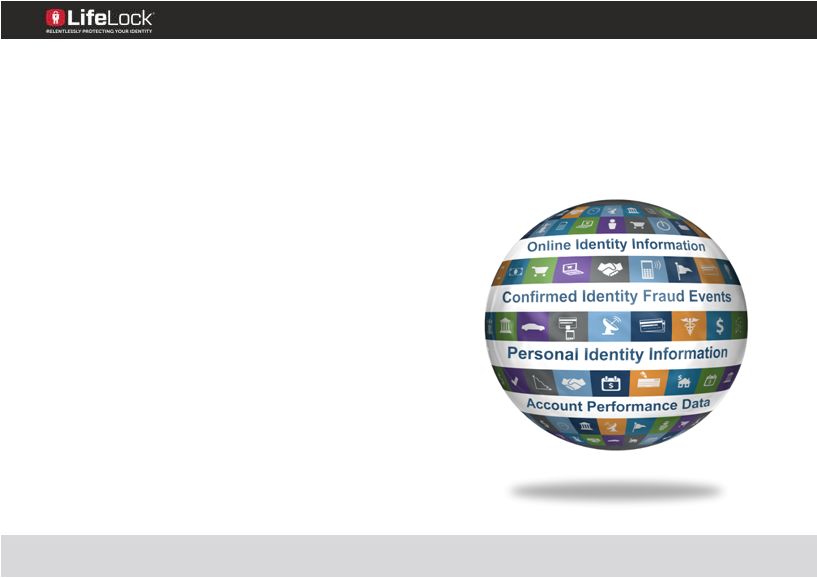
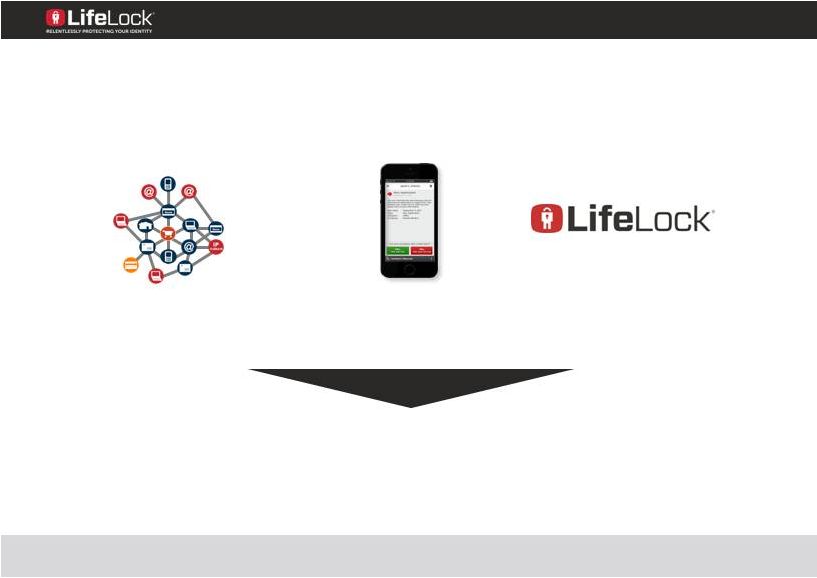
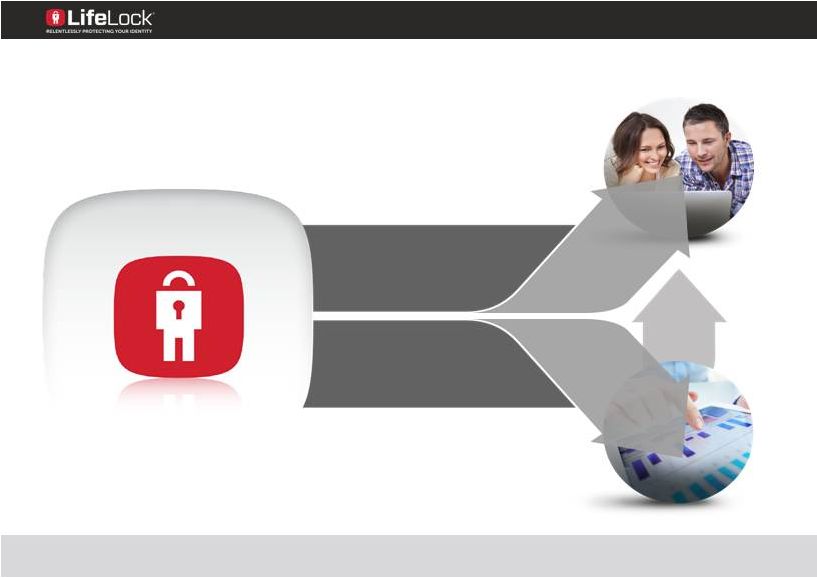
 Proactive Identity Use Alerts The LifeLock Ecosystem ©2014 LifeLock Inc. 1-800-LifeLock LifeLock.com 9 Real-time ID Scores Technology Platform Predictive Analytics Data Repository Data growth builds momentum Member Data Elements & Authenticating Responses Cross-Industry Data Elements |
 ©2014 LifeLock Inc. 1-800-LifeLock LifeLock.com 10 Growth Strategy Take advantage of our unique ecosystem Expand data inputs Evolve targeting and messaging Leverage mobile Grow partner channel Long Term Vision – Identity Bureau |
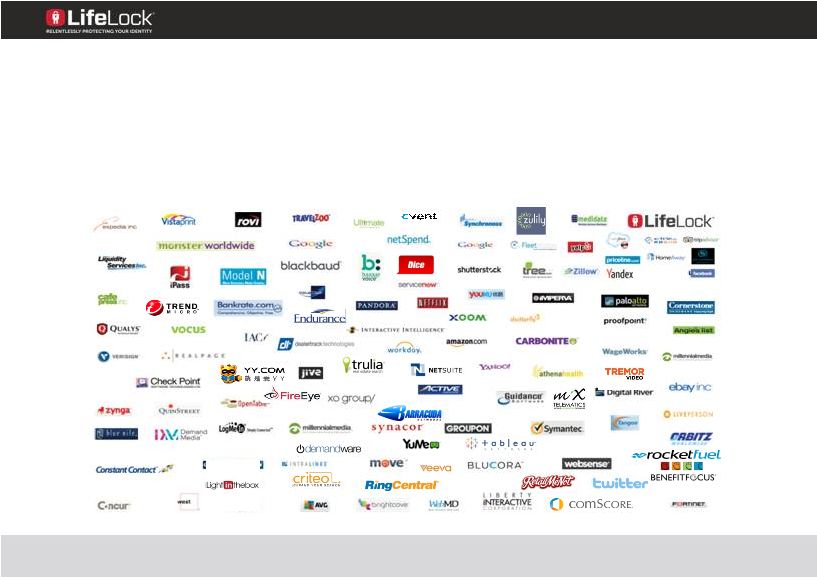
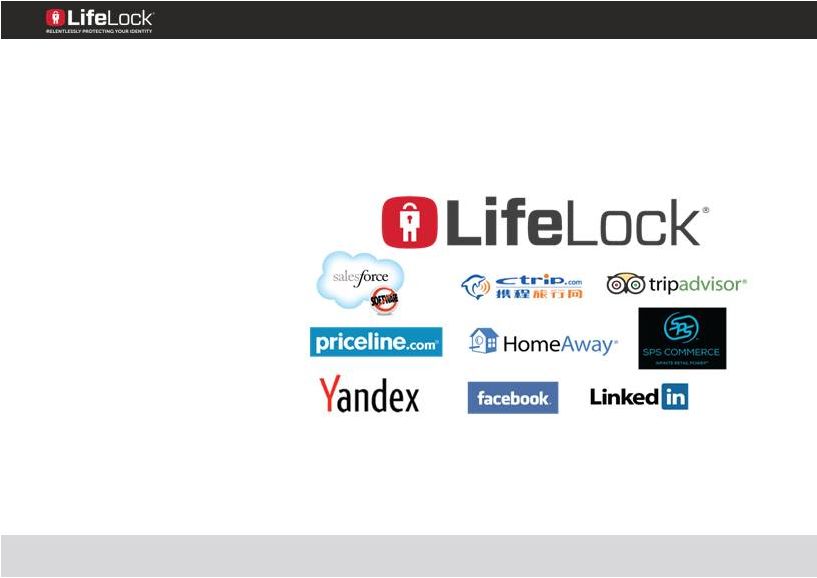
 IDA Market: Leading Enterprises across a wide range of industries ©2014 LifeLock Inc. 1-800-LifeLock LifeLock.com 11 Wireless Providers 4 of the Top 5 Carriers Credit Card Issuers 7 of the Top 10 Issuers Retail Card Issuers Over 75% Market Share Alternative Lenders Auto Lenders Alternative Payments |
 Superior Performance From Differentiated Data ©2014 LifeLock Inc. 1-800-LifeLock LifeLock.com • Over 1 trillion data elements • Over 2 billion high-value consumer events • Unique data others don’t see • Over 3.3 million known identity frauds • Can score 100% of US adult population ID Network: A real-time, cross-industry network of consumer behavioral data 12 |
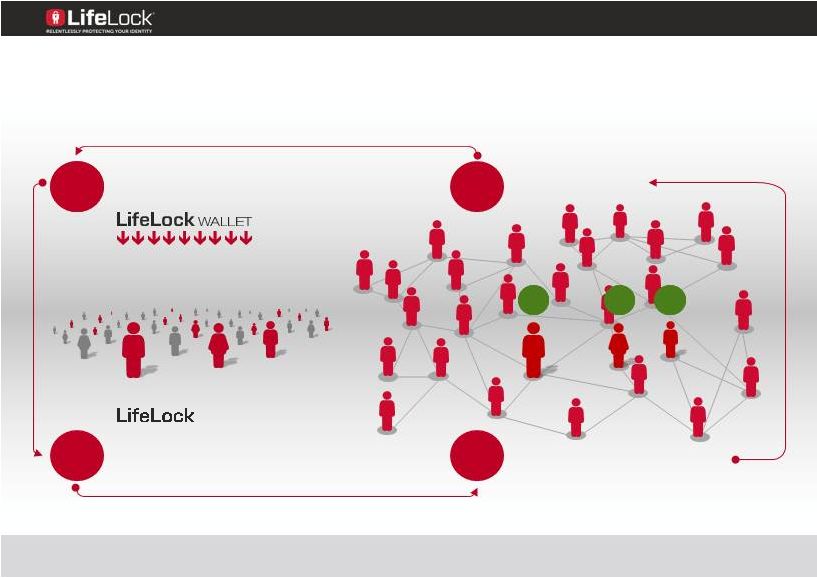
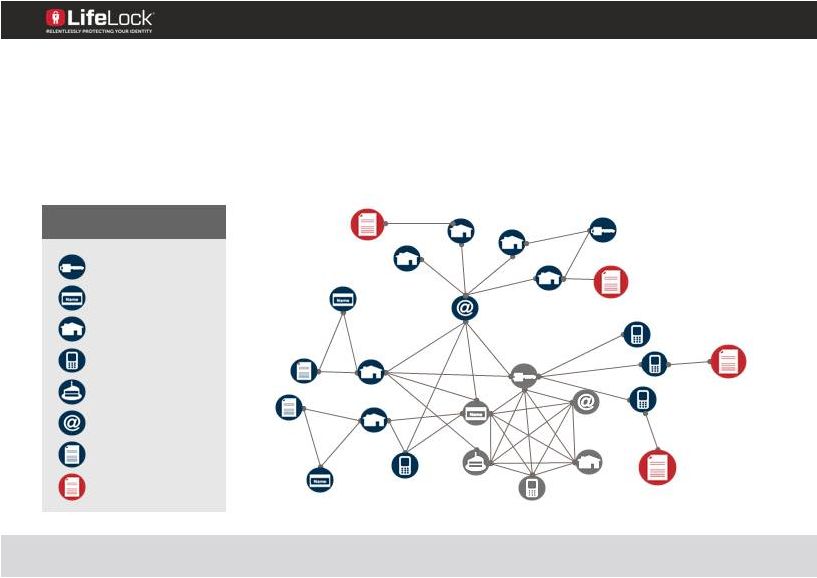 A broad network of identity behavioral connections and linkages provides deep insight into identity risk 13 Visibility into unusual identity behavior such as high velocity Uncovering Risk - Name - Phone - Date of Birth - Email Address - Address - SSN - Fraud Application - Application Legend ©2014 LifeLock Inc. 1-800-LifeLock LifeLock.com 20 9 41 17 Confirmed fraud connected to identity elements 3 |
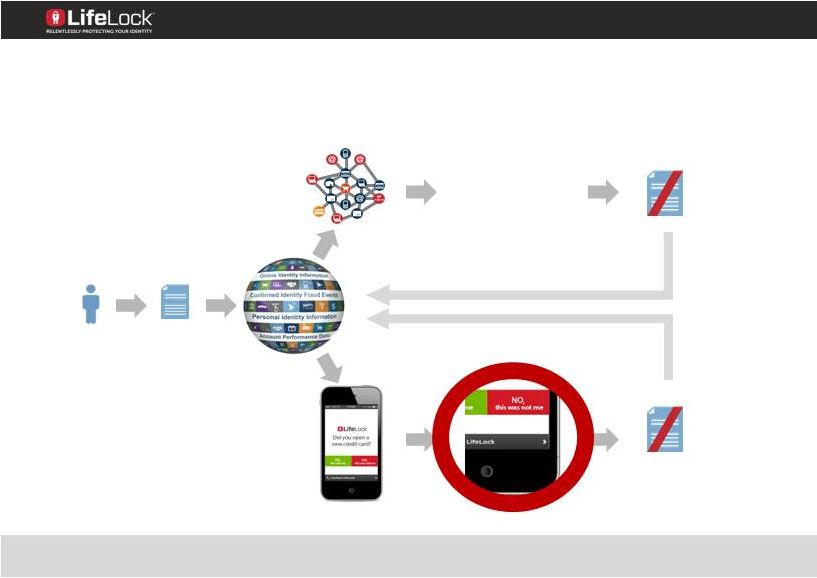 ©2014 LifeLock Inc. 1-800-LifeLock LifeLock.com 14 Enable the Enterprise, Empower the Consumer ID Score: 721 |
 ©2014 LifeLock Inc. 1-800-LifeLock LifeLock.com 15 Growth Strategy: 3.4 Billion Alertable Transactions Expand the Core 580 Million Penetrate Adjacent Markets 360 Million Establish eCommerce Market 2.5 Billion Market Opportunity |
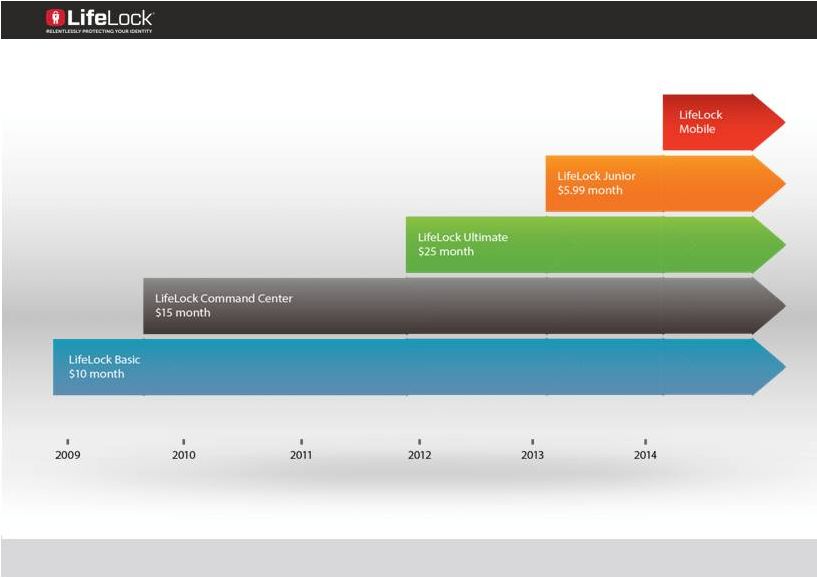 Product Evolution ©2014 LifeLock Inc. 1-800-LifeLock LifeLock.com 16 |
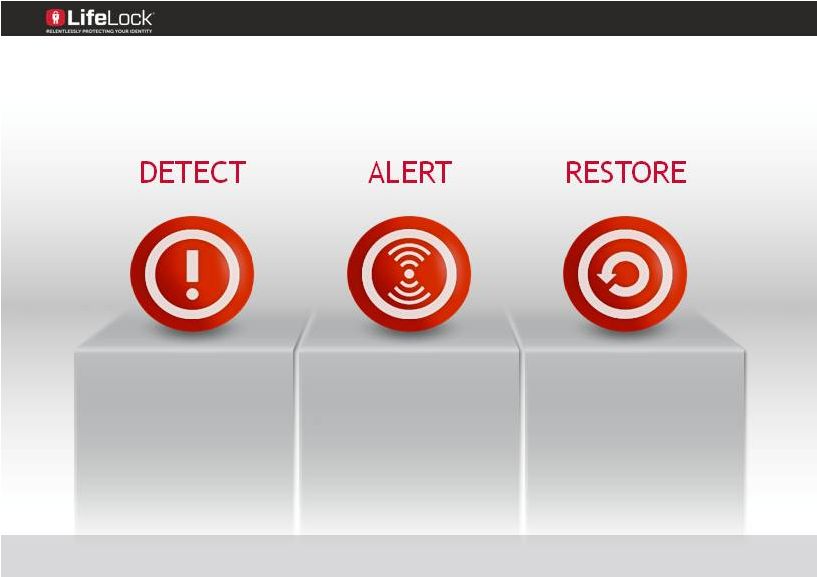 LifeLock Consumer -3 Layers of Protection 17 ©2014 LifeLock Inc. 1-800-LifeLock LifeLock.com Proactive alerts that empower consumers 24x7 Certified resolution specialists to handle your case Monitor over a trillion data points every minute of every day |
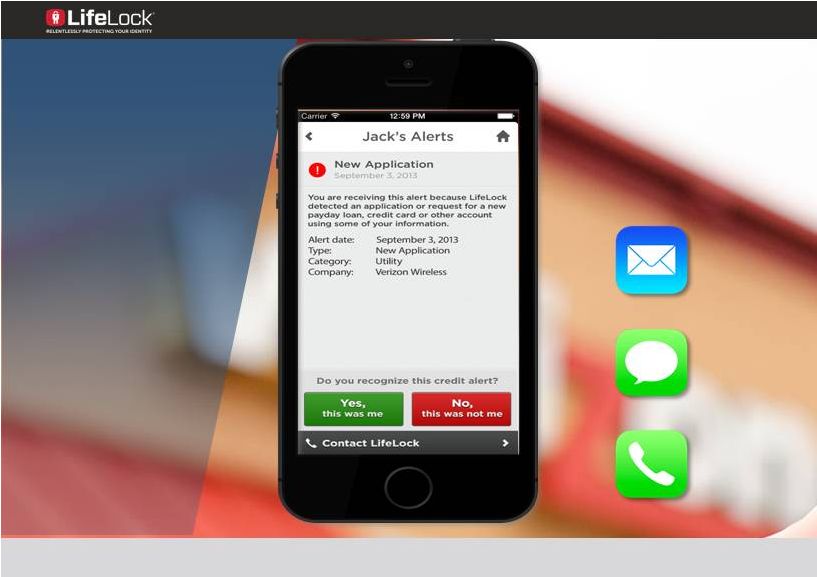 ©2014 LifeLock Inc. 1-800-LifeLock LifeLock.com Live free in an always connected world 18 email SMS / TEXT Integrated Voice Response |
 Priorities 19 ©2014 LifeLock Inc. 1-800-LifeLock LifeLock.com REACH CONVERSION Members VIRALITY MONETIZATION Continuum Process 1 2 3 4 $ $ $ |
 Myth #1: “My credit card protects me” 20 • Narrow Visibility • Card Fraud Not Identity Protection Credit Card |
 Myth #2: “I can do this by myself” 21 DIY • Limited DIY Steps • Not Realistic • Not Real Time • Not Effective |
 Myth #3: “Credit monitoring is good enough” 22 Credit Monitoring • Not Comprehensive • Speed Matters • Reactive Not Proactive |
 The LifeLock Difference… 23 Unique Data Superior Technology Trusted Brand Growth, Retention, Customer Satisfaction |
 Multi-Channel GTM Strategy ©2014 LifeLock Inc. 1-800-LifeLock LifeLock.com 24 Direct To Consumer Marketing Partner Distribution Channels |
 25 Television: A More Diverse Mix |
 Shifting Media Spend Towards Digital 26 2012 2013 2014 (est) Online Offline $ |
 Educate, Educate, Educate 27 |
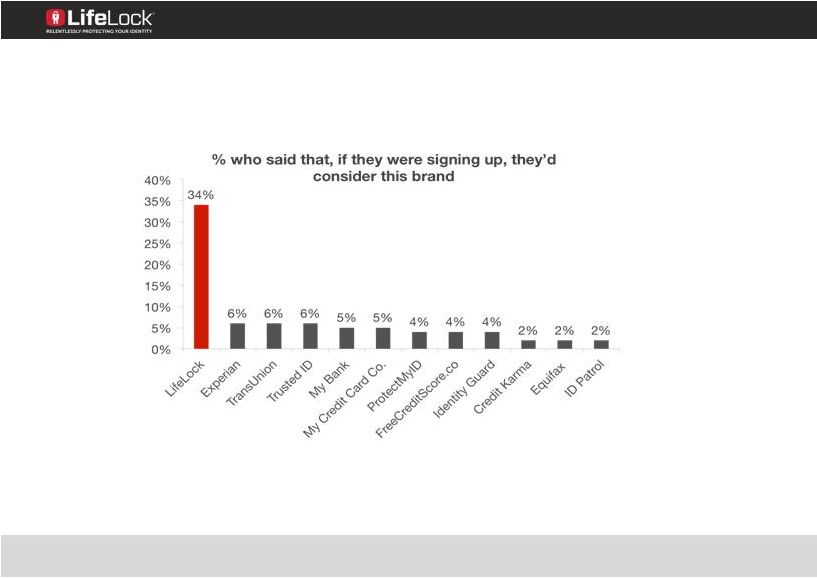 A commissioned survey conducted in January 2014 by MSI International on behalf of LifeLock. Base: Total Respondents (aware) Q10b. Imagine you were signing up for Security Identity Protection service. Which number best describes how likely you would be to consider the following companies? (10-point scale: 10=extremely likely to consider; 1=not at all likely to consider) Brand Leadership 28 |
 Top Decile Net Promoter Score ©2014 LifeLock Inc. 1-800-LifeLock LifeLock.com 29 Member Retention – 87.5% |
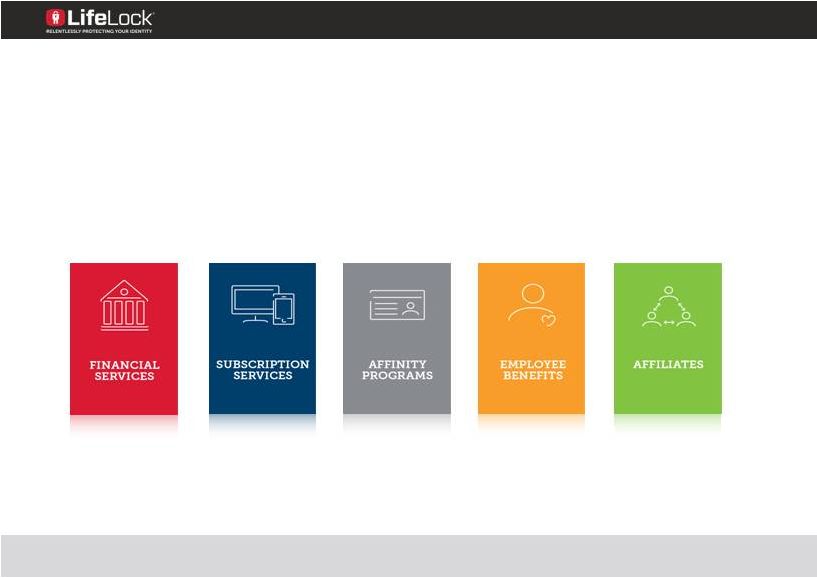
 Partner Overview ©2014 LifeLock Inc. 1-800-LifeLock LifeLock.com 30 Co-Marketing Embedded Affiliates Employee Benefits Breach Direct Response |
 2014 Partner Channel Growth ©2014 LifeLock Inc. 1-800-LifeLock LifeLock.com 31 Strategic partner investments in 2014. |
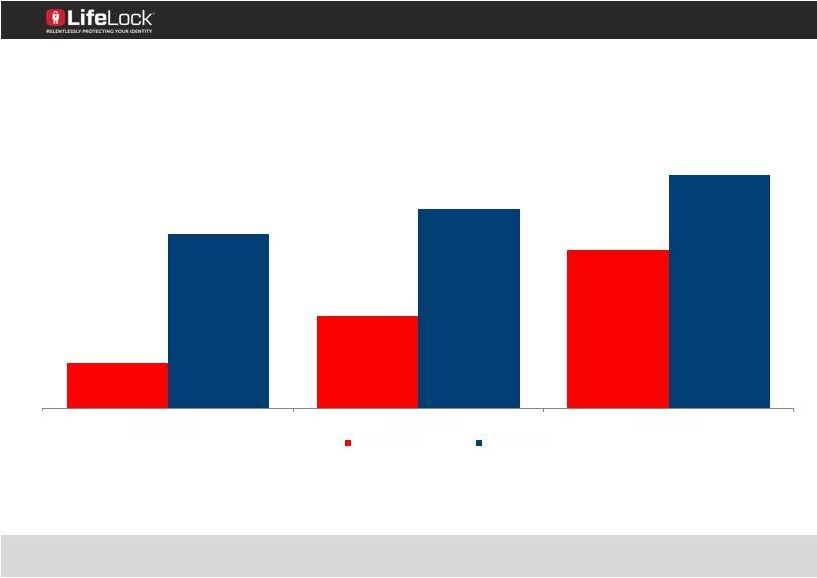
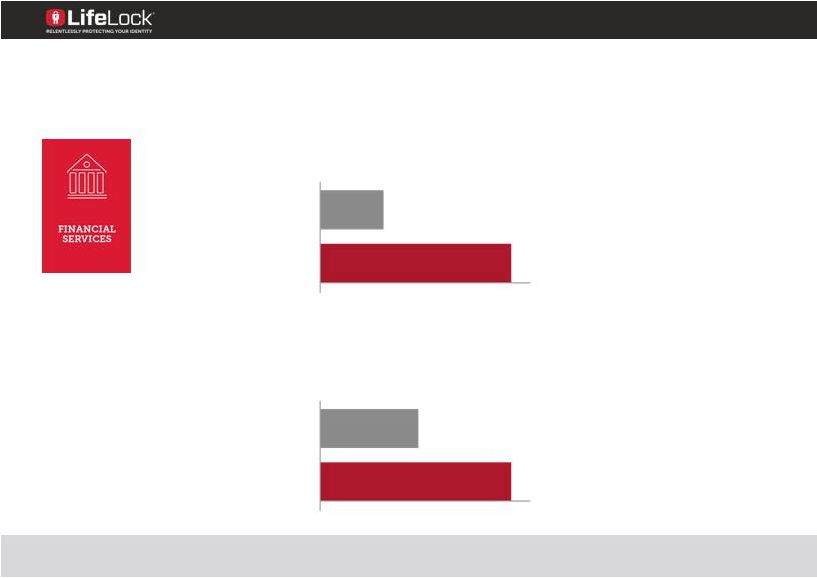 ©2014 LifeLock Inc. 1-800-LifeLock LifeLock.com 32 Profile: Mid-Size Community Bank Bank had $2.5 billion in assets Overview: A commercial bank displaced a credit monitoring offer with LifeLock. Financial Services Case Study Credit Monitoring # of Members LifeLock 1055 3738 LTV Revenue per Member Credit Monitoring LifeLock $415 $810 |
 ©2014 LifeLock Inc. 1-800-LifeLock LifeLock.com 33 Team Tenure Experience Don Beck Ten Months Involver, Postini, Adobe Seth Greenberg Eleven Months Intuit, eHobbies Mike Hargis Seven Months CareerBuilder, GE Villi Iltchev Ten Months Salesforce, HP, Merrill Lynch Larry McIntosh Eight Years Pepsi, McAfee Jill Nash Eleven Months Levi Strauss, Yahoo!, Gap Inc. Charles Schwab Steve Seoane Three Years ID Analytics, LexisNexis, Capital One Connie Suoo Four Years Gateway, Experian |
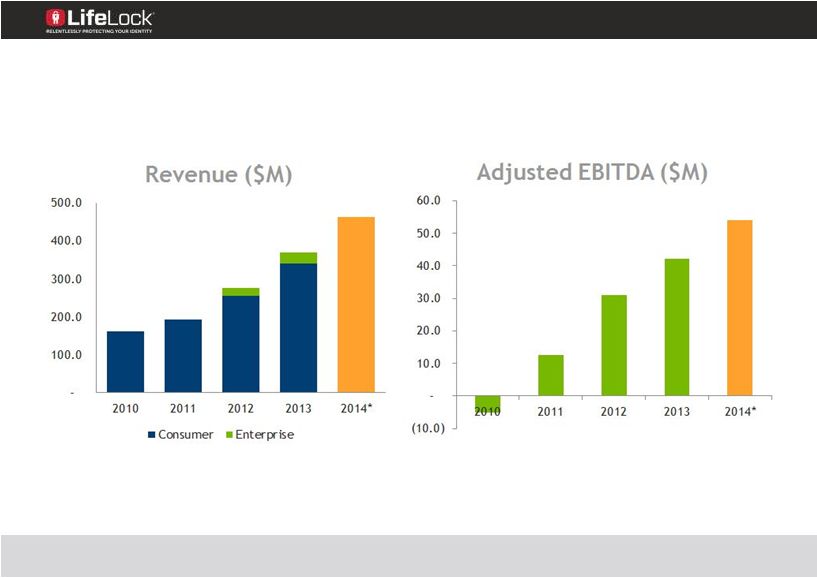 34 ©2014 LifeLock Inc. 1-800-LifeLock LifeLock.com * 2014 Revenue and Adjusted EBITDA figures are based on the mid-point of the guidance provided in our Earnings Results call on April 30, 2014 for the full year ending December 31, 2014 Revenue and Adjusted EBITDA |
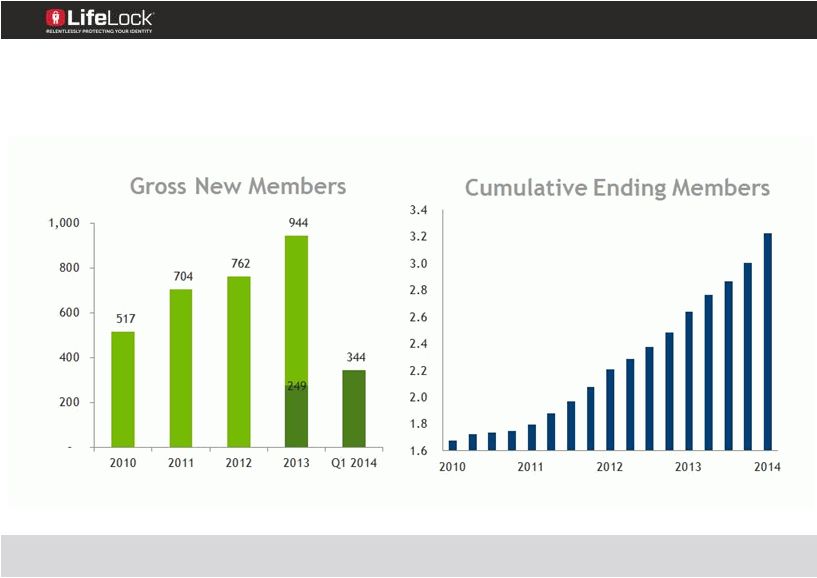 35 ©2014 LifeLock Inc. 1-800-LifeLock LifeLock.com Member Metrics |
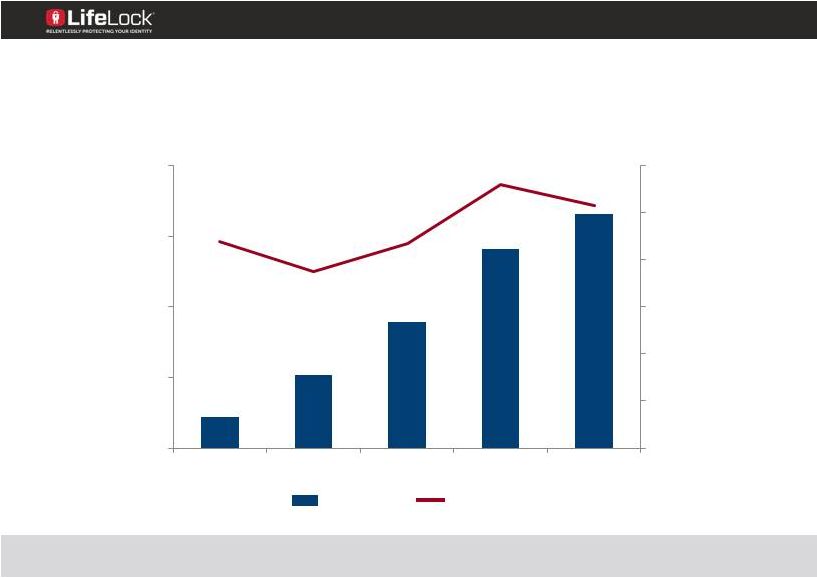 Revenue per Member ©2014 LifeLock Inc. 1-800-LifeLock LifeLock.com 36 Rev/Mbr YOY Growth Rev/Member YOY Growth 0% 2% 4% 6% 8% 10% 12% 7.50 8.50 9.50 10.50 11.50 2010 2011 2012 2013 Q1 2014 |
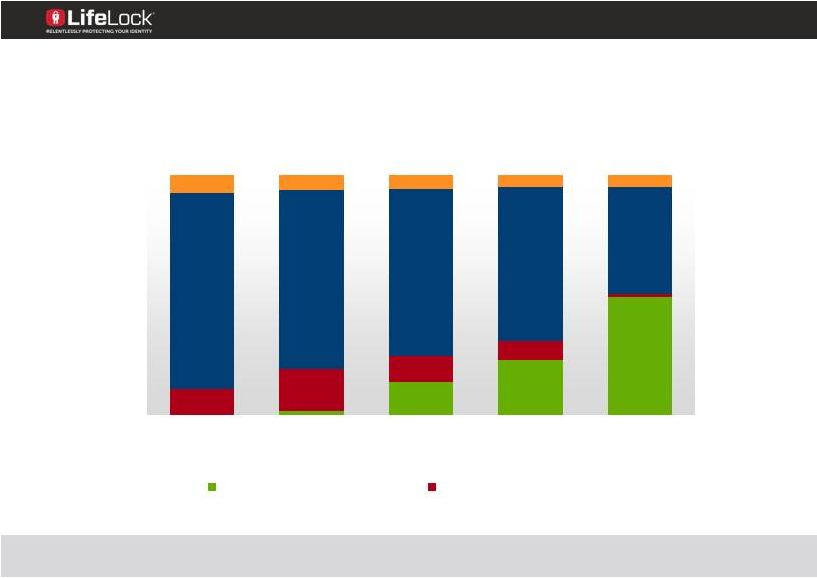 Product Mix ©2014 LifeLock Inc. 1-800-LifeLock LifeLock.com 37 0% 10% 20% 30% 40% 50% 60% 70% 80% 90% 100% 2010 2011 2012 2013 2013 GNM LifeLock Ultimate LifeLock Command Center |
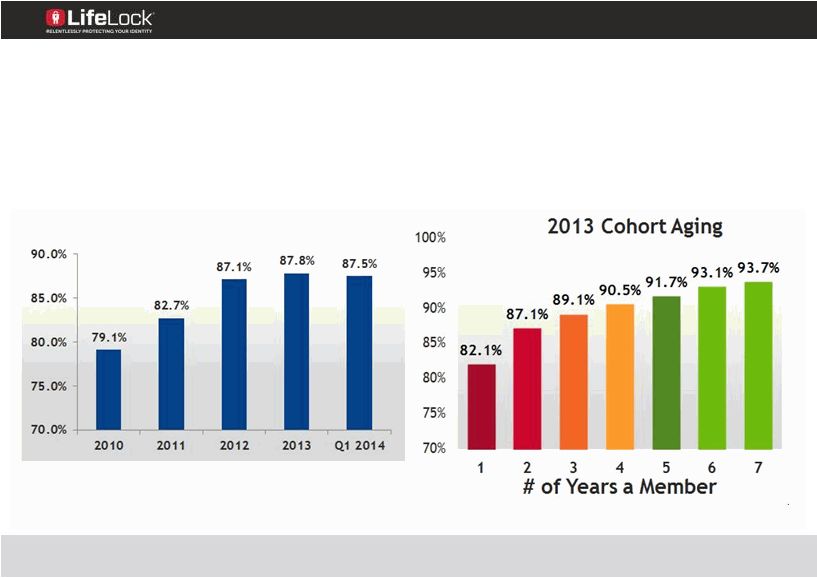 38 ©2014 LifeLock Inc. 1-800-LifeLock LifeLock.com Annual Retention Rate |
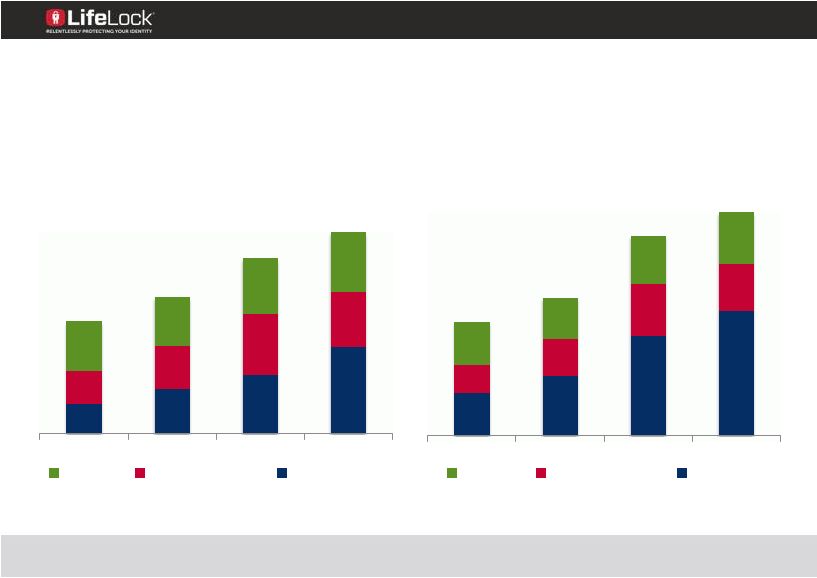 ©2014 LifeLock Inc. 1-800-LifeLock LifeLock.com 39 Growing Lifetime Value Member Base New Members 2010 2011 2012 2013 COA Fulfillment Net LTV 2010 2011 2012 2013 COA Fulfillment Net LTV |
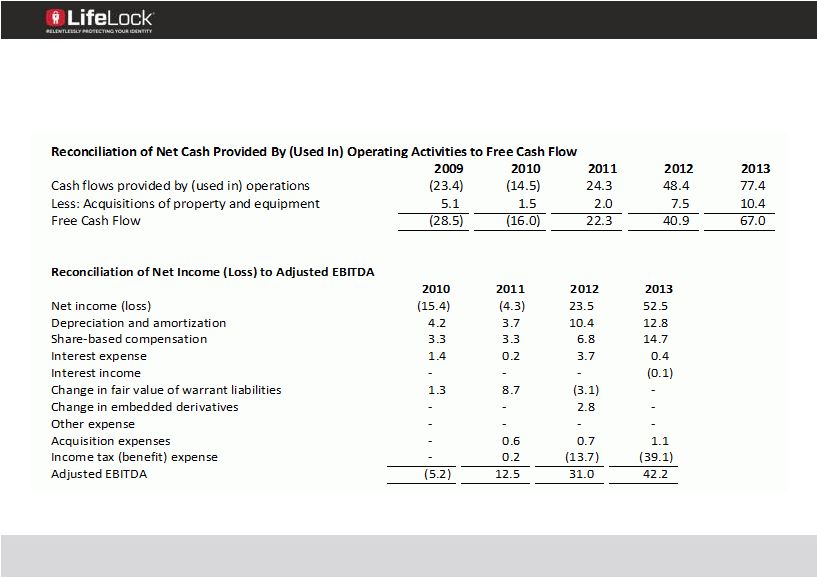
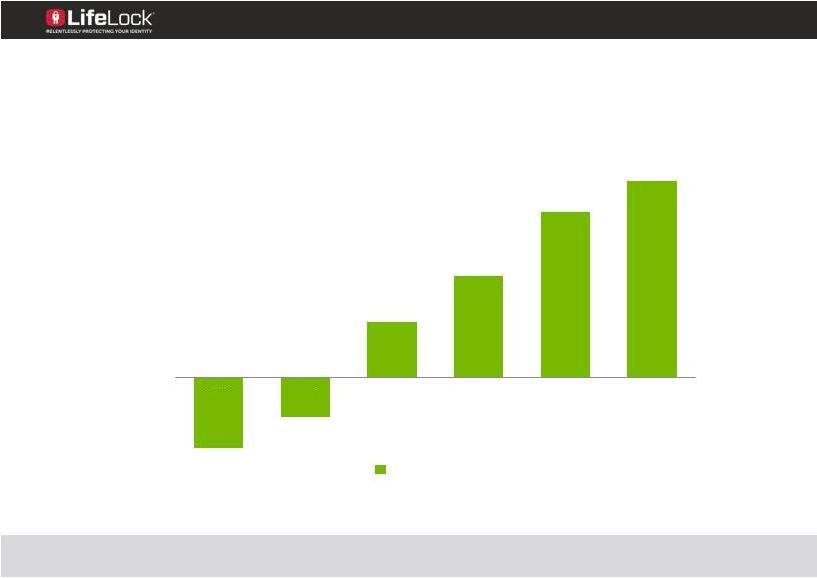 Free Cash Flow ©2014 LifeLock Inc. 1-800-LifeLock LifeLock.com 40 * 2014 Free Cash Flow is based on the mid-point of the guidance provided in our Earnings Results call on April 30, 2014 for the full year ending December 31, 2014 $(30.0) $(10.0) $10.0 $30.0 $50.0 $70.0 $90.0 2009 2010 2011 2012 2013 2014* Free Cash Flow |
 Strong Balance Sheet ©2014 LifeLock Inc. 1-800-LifeLock LifeLock.com 41 Dec 31, 2013 $Millions Mar 31, 2014 $Millions Cash and Marketable Securities 172.6 191.2 Goodwill & Intangible Assets 205.3 203.1 Deferred Tax Assets 49.1 52.7 Total Other Assets 36.3 40.0 Deferred Revenue 119.1 136.3 Debt - - Total Other Liabilities 42.0 44.0 Stockholder’s Equity 302.2 306.7 |
 ©2014 LifeLock Inc. 1-800-LifeLock LifeLock.com 42 Long Term Goals 2010 2011 2012 2013 LT Goals Adj GM% 68% 68% 71% 73% 75% - 77% Adj S&M 48% 47% 44% 44% 36% - 39% Adj T&D 13% 9% 10% 10% 9% - 10% Adj G&A 13% 8% 7% 9% 7% - 8% Adj EBITDA (3.2)% 6.4% 11.2% 11.4% 20% - 25% FCF (10)% 12% 15% 18% 18 – 23% 1 1 These goals are forward-looking, are subject to significant business, economic, regulatory, competitive, and other uncertainties and contingencies, many of which are beyond the control of the Company and its management, and are based upon assumptions with respect to future decisions, which are subject to change. Actual results will vary and those variations may be material. For discussion of some of the important factors that could cause these variations, please consult the “Risk Factors” section in our filings with the Securities and Exchange Commission from time to time, including our Form 10-K for the year ended December 31, 2013 . Nothing in this presentation should be regarded as a representation by any person that these goals will be achieved and the Company undertakes no duty to update its goals. |
 SaaS + Internet + Security (128 companies) ©2014 LifeLock Inc. 1-800-LifeLock LifeLock.com 43 Revenue >$100mm 115 companies |
 ©2014 LifeLock Inc. 1-800-LifeLock LifeLock.com 44 SaaS + Internet + Security Revenue >$100mm Revenue Growth >20% Gross Margin >70% EBITDA Margin >10% FCF Margin >10% 10 companies |
 Key Investment Highlights ©2014 LifeLock Inc. 1-800-LifeLock LifeLock.com 45 Large and growing addressable market Leader in consumer identity theft and enterprise fraud protection Industry leading service offering Strong barriers to entry: data, analytics, technology platform, and brand Experienced management team with track record of execution Predictable subscription model Compelling combination of growth, profitability, and cash flow |
 ©2014 LifeLock Inc. 1-800-LifeLock LifeLock.com 46 Appendix |
 GAAP to Non-GAAP Reconciliations ©2014 LifeLock Inc. 1-800-LifeLock LifeLock.com 47 |
 GAAP to Non-GAAP Reconciliations ©2014 LifeLock Inc. 1-800-LifeLock LifeLock.com 48 Reconciliation of Cost of Services to Adjusted Cost of Services 2010 2011 2012 2013 Cost of services 43.1 51.4 79.9 100.2 Share-based compensation (0.2) (0.3) (0.6) (0.9) Adjusted Cost of Services 42.9 51.1 79.3 99.3 Reconciliation of Gross Profit to Adjusted Gross Profit 2010 2011 2012 2013 Gross Profit 110.8 131.3 19 6.5 269.4 Share-based compensation 0.2 0.3 0.6 0.9 Adjusted Gross Profit 111.0 131.6 19 7.2 270.4 |
 GAAP to Non-GAAP Reconciliations ©2014 LifeLock Inc. 1-800-LifeLock LifeLock.com 49 Reconciliation of Technology and Development Expenses to Adjusted Technology and Development Expenses 2010 201 1 2012 2013 Technology and development expenses 21.3 17.7 29.5 40 .9 Share-based compensation (0.8) (0.8) (1.7) (3.8 ) Acquisition related expenses - - - - Adjusted technology and development expenses 20.5 16.9 27.8 37 .1 Reconciliation of Sales and Marketing Expenses to Adjusted Sales and Marketing Expenses 20 10 201 1 2012 2013 Sales and marketing expenses 78.8 9 1.2 12 3.0 162 .9 Share-based compensation (0.7) (0.7) (1 .1) (1.9) Adjusted sales and marketing expenses 78.1 9 0.5 12 1.9 161 .0 |
 GAAP to Non-GAAP Reconciliations ©2014 LifeLock Inc. 1-800-LifeLock LifeLock.com 50 Reconciliation of General and Adm inistrative Expenses to Adjusted General and Administrative Expenses 2010 2011 2012 2013 General and administrative expenses 23.3 17.5 24.6 44.1 Share-based compensation (1.5) (1.5) (3.3) (8.1) Acquisition related expenses - (0.6) (0.7) (1.0) Adjusted general and administrative expenses 21.8 15.4 20.6 34.9 |
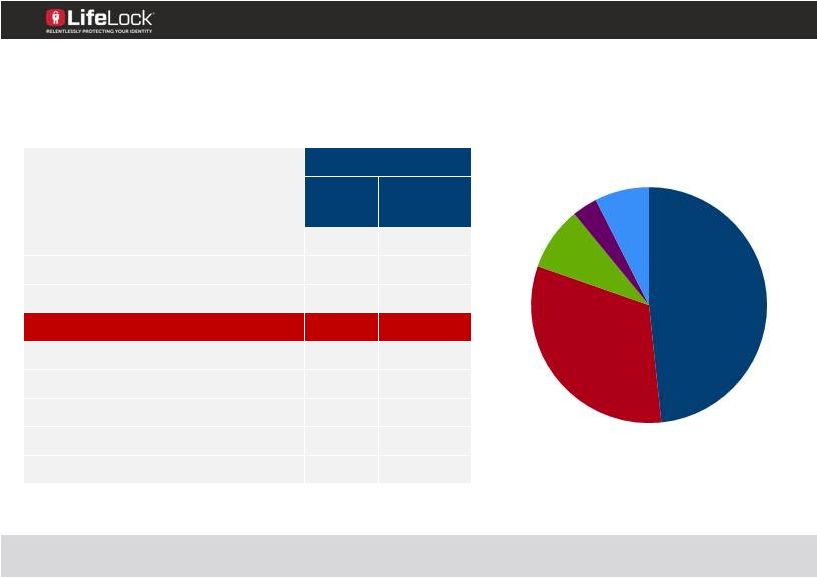 Components of Profit and Loss ©2014 LifeLock Inc. 1-800-LifeLock LifeLock.com 51 Cost of Service 2013 $M % of Rev Consumer revenue 340.1 92.0% Enterprise revenue 29.5 8.0% Total revenue 369.7 100.0% Adj COS 99.3 26.9% Adj GM 270.4 73.1% Adj S&M 161.0 43.5% Adj T&D 37.1 10.0% Adj G&A 34.9 9.4% Adj EBITDA 42.2 11.4% Credit Card Fees Enterprise Depn/Other Member Services Fulfillment Partners (incl Insurance) |
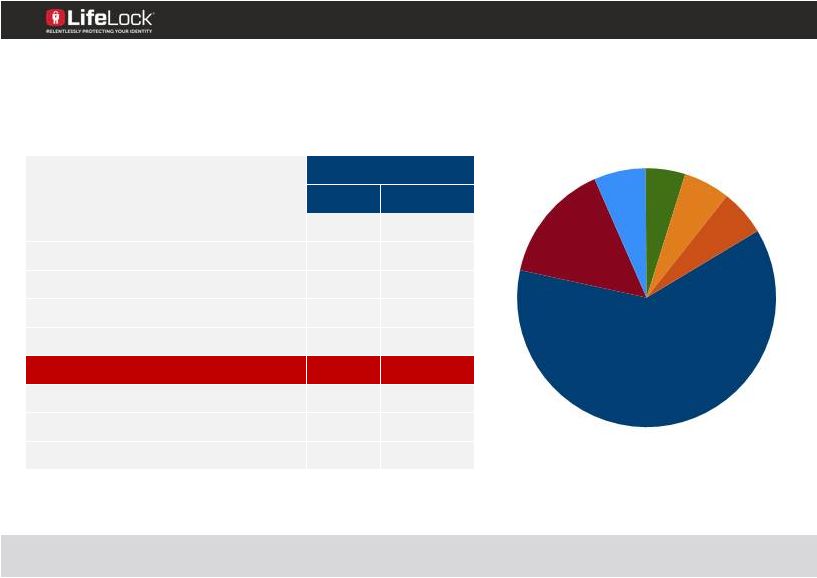 Components of Profit and Loss ©2014 LifeLock Inc. 1-800-LifeLock LifeLock.com 52 Sales and Marketing 2013 $M % of Rev Consumer revenue 340.1 92.0% Enterprise revenue 29.5 8.0% Total revenue 369.7 100.0% Adj COS 99.3 26.9% Adj GM 270.4 73.1% Adj S&M 161.0 43.5% Adj T&D 37.1 10.0% Adj G&A 34.9 9.4% Adj EBITDA 42.2 11.4% Production Media Enterprise Personnel Depn/ Other Commissions |