UNITED STATES
SECURITIES AND EXCHANGE COMMISSION
Washington, D.C. 20549
FORM N-CSR
CERTIFIED SHAREHOLDER REPORT OF REGISTERED MANAGEMENT INVESTMENT
COMPANIES
Investment Company Act file number 811-21993
RevenueShares ETF Trust
(Exact name of registrant as specified in charter)
One Commerce Square,
2005 Market Street Suite 2020
Philadelphia, Pennsylvania 19103
(Address of principal executive offices) (Zip code)
Vincent T. Lowry
One Commerce Square,
2005 Market Street Suite 2020
Philadelphia, Pennsylvania 19103
(Name and address of agent for service)
Registrant's telephone number, including area code: 1-877-738-8870
Date of fiscal year end: June 30
Date of reporting period: July 1, 2011 – June 30, 2012
Form N-CSR is to be used by management investment companies to file reports with the Commission not later than 10 days after the transmission to stockholders of any report that is required to be transmitted to stockholders under Rule 30e-1 under the Investment Company Act of 1940 (17 CFR 270.30e-1). The Commission may use the information provided on Form N-CSR in its regulatory, disclosure review, inspection, and policymaking roles.
A registrant is required to disclose the information specified by Form N-CSR, and the Commission will make this information public. A registrant is not required to respond to the collection of information contained in Form N-CSR unless the Form displays a currently valid Office of Management and Budget ("OMB") control number. Please direct comments concerning the accuracy of the information collection burden estimate and any suggestions for reducing the burden to Secretary, Securities and Exchange Commission, 450 Fifth Street, NW, Washington, DC 20549-0609. The OMB has reviewed this collection of information under the clearance requirements of 44 U.S.C. § 3507.
RevenueShares™ ETF Trust
Annual Report to Shareholders
June 30, 2012
Would you prefer to receive materials like this electronically?
See inside front cover for details.
![]()
Receive investor materials electronically:
Shareholders may sign up for electronic delivery of investor materials. By doing so, you will receive the information faster and help us reduce the impact on the environment of providing these materials. To enroll in electronic delivery,
| 1. | Go to www.icsdelivery.com |
| 2. | Select the first letter of your brokerage firm’s name. |
| 3. | From the list that follows, select your brokerage firm. If your brokerage firm is not listed, electronic delivery may not be available. Please contact your brokerage firm. |
| 4. | Complete the information requested, including the e-mail address where you would like to receive notifications for electronic documents. |
Your information will be kept confidential and will not be used for any purpose other than electronic delivery. If you change your mind, you can cancel electronic delivery at any time and revert to physical delivery of your materials, Just go to www.icsdelivery.com, perform the first three steps above and follow the instructions for cancelling electronic delivery. If you have any questions, please contact your brokerage firm.
Table of Contents
| 1 |
August 2012
Dear Shareholder:
As the RevenueShares Fiscal Year ended June 30, 2012, five of the RevenueShares ETFs experienced negative returns during the period, while the Large Cap Revenue Weighted S&P 500 returned +2.59%, net of fees: The global equity markets were negatively impacted by the European banking and political turmoil as well as a slower growth rate experienced in China.
Total NAV Returns for the Fiscal Year ended June 30, 2012:
| • | RWL, RevenueShares Large Cap Fund +2.59% vs. S&P 500 Index, +5.45% |
| • | RWK, RevenueShares Mid Cap Fund -2.72% vs. S&P 400 Index, -2.33% |
| • | RWJ, RevenueShares Small Cap Fund -1.75% vs. S&P 600 Index, +1.43% |
| • | RTR, RevenueShares ADR Index Fund -16.3% vs. S&P ADR Index, -12.57% |
| • | RWW, RevenueShares Financial Sector Index Fund -5.95% vs. S&P Financial Sector Index, -2.68% |
| • | RWV, RevenueShares Navellier Overall A-100 Index Fund -7.61% vs. Navellier Market Cap Index, -7.84% |
The third quarter of 2011 and second quarter of 2012 were periods of significant market volatility on the downside. The RevenueShares Mid and Small Cap Funds were most affected by the July/August 2011 downturn, as they experienced their most difficult quarter since 2008. Both the actual and feared slow down in global economic activity during the 3rd quarter of 2011 affected the RevenueShares Mid and Small Cap S&P Revenue Weighted Funds, primarily due the Mid Cap Fund’s exposure to energy and the Small Cap Fund’s exposure to certain health care companies. The RevenueShares Large Cap Fund pulled through this period, despite significant underweighting to technology, versus the cap weighted S&P 500. The Fund experienced a strong rally from the fourth quarter 2011 through the third quarter of 2012, producing a positive return for the fiscal year.
The RevenueShares ADR Fund, which has about a 20% exposure to emerging markets as well as China, experienced a significant downturn with a -16.3% return for the fiscal year. The ongoing European banking and political turmoil has weighed heavily on investor confidence on a global scale. Negative investor behavior continued through the second quarter of 2012, as global markets once again experienced downward volatility during the 2nd quarter 2012. The Financial Sector fund had a significant weighting to money center and global based banks during the period which resulted in a very difficult 3rd quarter 2011, however, the Fund rallied significantly since the 3rd quarter 2011 downturn.
The RevenueShares Large Cap Fund not only trailed in the technology sector, but experienced head winds in the consumer discretion sector as well. This sector typically underperforms during periods of economic slowdown and during expansions this sector is typically a leader.
The RevenueShares Mid Cap Fund has been has been a solid performer for the past three years, but experienced a setback as a result of the Fund’s energy and technology holdings during the fiscal year.
The RevenueShares Small Cap Fund has been a very strong performer for the past three years. However, the Funds technology and health care holdings trimmed its returns for the fiscal year.
The RevenueShares ADR Fund, which has exposure to both developed and emerging markets, experienced a significant downturn primarily due to its China and other emerging market holdings. We believe these two asset classes will perform well over the long term and are very comfortable with the Fund’s exposure to this market.
The RevenueShares Financial Sector Fund has significant weightings to large money centers and global banks. We believe as economic conditions improve the money center banks will experience solid earnings growth over the next several years.
The RevenueShares Navellier Overall A-100 Fund has a growth and momentum bias to its holdings and we expect this Fund to respond very well in an earnings expansion environment.
| 2 |
Letter To Shareholders — concluded
Both the economy and equity markets face challenges going forward, however, VTL Associates believes that the valuations in the equity markets are compelling, and with the low interest rate environment, we believe that equities will be the best performing asset class over the next 12 months.

Vincent T. Lowry
C.E.O. and Chief Investment Officer
VTL Associates, LLC
An investment in the Funds is subject to investment risk, including the possible loss of principal amount invested. Fund returns may not match the return of their respective Index, known as non-correlation risk, due to operating expenses incurred by the Funds. The alternative weighting approach employed by the Funds (i.e., using revenues as a weighting measure), while designed to enhance potential returns, may not produce the desired results. The risks associated with each specific fund are detailed in the prospectus and could include factors such as increased volatility risk, small and medium capitalization stock risk, concentration risk, non-diversification risk, financials sector risk, American Depositary Receipt risk, currency exchange risk, foreign market risk, growth style investing risk, portfolio turnover risk, and/or special risks of exchange-traded funds.
The S&P 500® Index is a broad-based, unmanaged measurement of changes in stock market conditions based on the average of 500 widely held common stocks. The S&P MidCap 400™ Index consists of 400 domestic mid cap stocks selected for market size, liquidity and industry group representation. The S&P SmallCap 600TM Index consists of 600 domestic small cap stocks selected for market size, liquidity and industry group representation. The S&P 500® Financials Index is a stock market index comprised of large cap companies that Standard & Poor’s® deems to be part of the Financials sector of the U.S. economy, using Global Industry Classification Standards. S&P® ADR Index is a U.S. dollar denominated index of the non-U.S. companies contained in the S&P® Global 1200 Ex U.S. Index. The S&P® Global 1200 Ex U.S. Index is a free-float weighted global index covering 29 countries and approximately 70% of the world’s capital markets. The Russell 3000 Index measures the performance of the 3000 largest U.S. companies based on total market capitalization, which represents approximately 98% of the investable U.S. equity market. One cannot invest directly in an index.
RevenueShares ETFs are not sponsored, endorsed, sold or promoted by Standard & Poor’s. Standard & Poor’s makes no representation regarding the advisability of investing in RevenueShares ETFs.
The views in this letter were those of the Fund manager as of the publication of the report and may not necessarily reflect his views on the date this letter is first published or anytime thereafter. These views are intended to assist shareholders in understanding the Funds’ present investment methodology and do not constitute investment advice.
A Fund’s per share net asset value or “NAV” is the value of one share of a Fund as calculated in accordance with the standard formula for valuing mutual fund shares. The NAV return is based on the NAV of a Fund and the market return is based on the market price per share of a Fund. The price used to calculate market return (“Market Price”) is determined by using the mean of the bid and offer on the primary stock exchange on which the shares of the Fund are listed for trading when the Fund’s NAV is calculated at market close. Market and NAV returns assume that dividends and capital gain distributions have been reinvested in the Fund at Market Price and NAV, respectively. Price to earnings ratio is the value of a company’s stock price relative to company earnings.
| 3 |
Management Discussion of Fund Performance
June 30, 2012
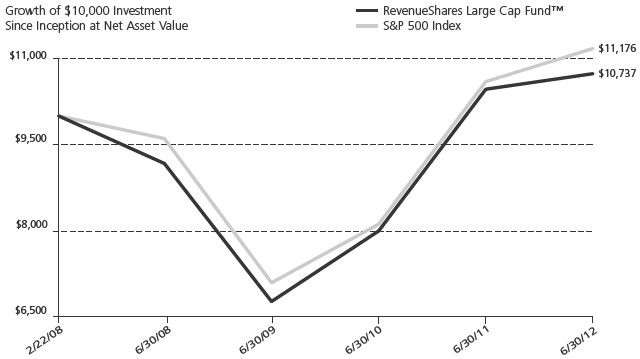
RevenueShares Large Cap Fund™ (Ticker: RWL)
The Fund seeks to achieve its investment objective of outperforming the total return performance of the S&P 500 Index (“S&P 500”) by investing in the constituent securities of the S&P 500 in the same proportions as the RevenueShares Large Cap Index. The S&P 500 is a stock market index comprised of a representative sample of common stocks of 500 leading companies in leading industries of the United States economy selected by Standard & Poor’s®. Under normal circumstances, the Fund will invest at least 80% of its net assets in the securities of large capitalization companies included in the S&P 500 and generally expects to be substantially invested at such times, with at least 95% of its net assets invested in these securities. The Fund defines large capitalization companies as companies that are included in the S&P 500 at the time of purchase. The Fund will provide shareholders with at least 60 days’ notice prior to any change in this policy.
The RevenueShares Large Cap Fund not only trailed in the technology sector, but experienced head winds in the consumer discretion sector as well. This sector typically underperforms during periods of economic slowdown and during expansions this sector is typically a leader.
Among the top and bottom performing Fund holdings for the fiscal year 6/30/2012, the top three performers were Motorola Mobility (+81.39%), Expedia (+77.74%), Apple Inc (+73.98%), while the bottom three performers in this group were Netflix (–73.93%) Alpha Natural Resource, (–80.83%), and First Solar (–88.61%).
| 4 |
Management Discussion of Fund Performance — continued
| Cumulative Total Return | Average Annual Total Return | |||||||
| Fund Performance History (%) | As of June 30, 2012 | As of June 30, 2012 | ||||||
| Since Inception | Since Inception | |||||||
| 1 Year | (February 22, 2008) | 1 Year | (February 22, 2008) | |||||
| Index | ||||||||
| RevenueShares Large Cap Index™ | 3.16 | % | 11.16 | % | 3.16 | % | 2.30 | % |
| S&P 500 Index | 5.45 | % | 11.76 | % | 5.45 | % | 2.59 | % |
| Fund | ||||||||
| NAV Return | 2.59 | % | 6.90 | % | 2.59 | % | 1.54 | % |
| Market Price | 2.57 | % | 8.76 | % | 2.57 | % | 1.95 | % |
Performance data quoted represents past performance and is no guarantee of future results. Current performance may be lower or higher than the performance data quoted. Investment return and principal value will fluctuate so that an investor’s shares, when redeemed, may be worth more or less than original cost. As stated in the current prospectus, the Large Cap Fund’s annual operating expense ratio (gross) is 0.73% and the net expense ratio is 0.49%. (Actual expenses can be referenced in the Financial Highlights section later in this report.) The Fund’s advisor has contractually agreed to waive a portion of its fees and/or reimburse expenses to the extent necessary to keep the Fund’s expenses from exceeding the net expense ratio. This agreement is in effect until October 31, 2012. The performance table and graph do not reflect the deduction of taxes that a shareholder would pay on Fund distributions or the redemption of Fund shares. For the Fund’s most recent month end performance please visit www.revenuesharesetfs.com.
Performance reflects reinvestment of all dividend and capital gains distributions. During this period, some of the Fund’s fees were waived and/or expenses reimbursed; otherwise, the Fund’s performance would have been lower.
Index returns reflect the reinvestment of dividends but do not reflect any management fees, transaction costs or other expenses that would be incurred by a portfolio or fund, or brokerage commissions on transactions in Fund shares. Such fees, expenses and commissions reduce Fund returns. RevenueShares Large Cap Index™ returns became publicly available on January 3, 2006. Index returns do not represent Fund returns. One cannot invest directly in an index.
| 5 |
Management Discussion of Fund Performance — continued
June 30, 2012
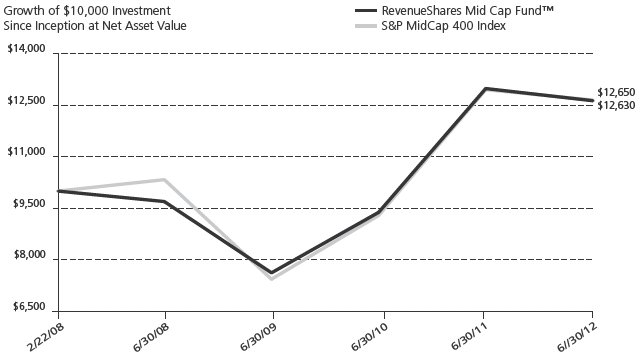
RevenueShares Mid Cap Fund™ (Ticker: RWK)
The Fund seeks to achieve its investment objective of outperforming the total return performance of the S&P MidCap 400 Index (“S&P MidCap 400”) by investing in the constituent securities of the S&P MidCap 400 in the same proportions as the RevenueShares Mid Cap. The S&P MidCap 400 is a stock market index comprised of common stock of 400 mid-sized companies selected by Standard & Poor’s®. Under normal circumstances, the Fund will invest at least 80% of its net assets in the securities of mid capitalization companies included in the S&P MidCap 400 Index and generally expects to be substantially invested at such times, with at least 95% of its net assets invested in these securities. The Fund defines mid capitalization companies as companies that are included in the S&P MidCap 400 at the time of purchase. The Fund will provide shareholders with at least 60 days’ notice prior to any change in this policy.
The RevenueShares Mid Cap Fund has been a solid performer for the past three years, but experienced a setback as a result of the Fund’s energy and technology holdings during the fiscal year.
Among the top and bottom performing Fund holdings for the fiscal year 6/30/2012, the top three performers were Regeneron Pharmaceuticals (+111.69%), Fortune Brands (+81.40%), Monster Beverage Corp. (+75.91%), while the bottom three performers in this group were Arch Coal (–74.74%), Green Mountain Coffee Roasters (–76.50%), and Patriot Coal Corp (–94.91%).
| 6 |
Management Discussion of Fund Performance — continued
| Cumulative Total Return | Average Annual Total Return | |||||||
| Fund Performance History (%) | As of June 30, 2012 | As of June 30, 2012 | ||||||
| Since Inception | Since Inception | |||||||
| 1 Year | (February 22, 2008) | 1 Year | (February 22, 2008) | |||||
| Index | ||||||||
| RevenueShares Mid Cap Index™ | -1.53 | % | 30.43 | % | -1.53 | % | 6.29 | % |
| S&P MidCap 400 Index | -2.33 | % | 26.50 | % | -2.33 | % | 5.54 | % |
| Fund | ||||||||
| NAV Return | -2.72 | % | 25.39 | % | -2.72 | % | 5.34 | % |
| Market Price | -2.80 | % | 26.95 | % | -2.80 | % | 5.63 | % |
Performance data quoted represents past performance and is no guarantee of future results. Current performance may be lower or higher than the performance data quoted. Investment return and principal value will fluctuate so that an investor’s shares, when redeemed, may be worth more or less than original cost. As stated in the current prospectus, the Mid Cap Fund’s annual operating expense ratio (gross) is 0.81% and the net expense ratio is 0.54%. (Actual expenses can be referenced in the Financial Highlights section later in this report.) The Fund’s advisor has contractually agreed to waive a portion of its fees and/or reimburse expenses to the extent necessary to keep the Fund’s expenses from exceeding the net expense ratio. This agreement is in effect until October 31, 2012. The performance table and graph do not reflect the deduction of taxes that a shareholder would pay on Fund distributions or the redemption of Fund Shares. For the Fund’s most recent month end performance please visit www.revenuesharesetfs.com.
Performance reflects reinvestment of all dividend and capital gains distributions. During this period, some of the Fund’s fees were waived and/or expenses reimbursed; otherwise, the Fund’s performance would have been lower.
Index returns reflect the reinvestment of dividends but do not reflect any management fees, transaction costs or other expenses that would be incurred by a portfolio or fund, or brokerage commissions on transactions in Fund shares. Such fees, expenses and commissions reduce returns. RevenueShares Mid Cap Index™ returns became publicly available on January 3, 2006. Index returns do not represent Fund returns. One cannot invest directly in an index.
| 7 |
Management Discussion of Fund Performance — continued
June 30, 2012
RevenueShares Small Cap Fund™ (Ticker: RWJ)
The Fund seeks to achieve its investment objective of outperforming the total return performance of the S&P Small Cap 600 Index (“S&P Small Cap 600”) by investing in the constituent securities of the S&P Small Cap 600 in the same proportions as the RevenueShares Small Cap. The S&P Small Cap 600 is a stock market index comprised of 600 common stocks of small-cap companies selected by Standard & Poor’s® based on inclusion criteria to ensure that they are investable and financially viable. Under normal circumstances, the Fund will invest at least 80% of its net assets in the securities of small capitalization companies included in the S&P SmallCap 600 Index and generally expects to be substantially invested at such times, with at least 95% of its net assets invested in these securities. The Fund defines small capitalization companies as companies that are included in the S&P Small Cap 600 at the time of purchase. The Fund will provide shareholders with at least 60 days’ notice prior to any change in this policy.
The RevenueShares Small Cap Fund has been a very strong performer for the past three years. However, the Funds technology and health care holdings trimmed its returns for the fiscal year.
Among the top and bottom performing Fund holdings for the fiscal year 6/30/2012, the top three performers were Multimedia Games Inc. (+207.69%), Arctic Cat Inc. (+172.22%), Questor Pharmaceutical (+120.91%), while the bottom three performers in this group were Nci Inc. (–82.17%), Thq Inc, (–85.08%), and Savient Pharmaceutical (–92.78%).
| 8 |
Management Discussion of Fund Performance — continued
| Cumulative Total Return | Average Annual Total Return | |||||||
| Fund Performance History (%) | As of June 30, 2012 | As of June 30, 2012 | ||||||
| Since Inception | Since Inception | |||||||
| 1 Year | (February 22, 2008) | 1 Year | (February 22, 2008) | |||||
| Index | ||||||||
| RevenueShares Small Cap Index™ | -1.07 | % | 43.55 | % | -1.07 | % | 8.68 | % |
| S&P SmallCap 600 Index | 1.43 | % | 27.75 | % | 1.43 | % | 5.78 | % |
| Fund | ||||||||
| NAV Return | -1.75 | % | 38.13 | % | -1.75 | % | 7.70 | % |
| Market Price | -1.67 | % | 39.55 | % | -1.67 | % | 7.96 | % |
Performance data quoted represents past performance and is no guarantee of future results. Current performance may be lower or higher than the performance data quoted. Investment return and principal value will fluctuate so that an investor’s shares, when redeemed, may be worth more or less than original cost. As stated in the current prospectus, the Small Cap Fund’s annual operating expense ratio (gross) is 0.83% and the net expense ratio is 0.54%. (Actual expenses can be referenced in the Financial Highlights section later in this report.) The Fund’s advisor has contractually agreed to waive a portion of its fees and/or reimburse expenses to the extent necessary to keep the Fund’s expenses from exceeding the net expense ratio. This agreement is in effect until October 31, 2012. The performance table and graph do not reflect the deduction of taxes that a shareholder would pay on Fund distributions or the redemption of Fund shares. For the Fund’s most recent month end performance please visit www.revenuesharesetfs.com.
Performance reflects reinvestment of all dividend and capital gains distributions. During this period, some of the Fund’s fees were waived and/or expenses reimbursed; otherwise, the Fund’s performance would have been lower.
Index returns reflect the reinvestment of dividends but do not reflect any management fees, transaction costs or other expenses that would be incurred by a portfolio or fund, or brokerage commissions on transactions in Fund shares. Such fees, expenses and commissions reduce returns. RevenueShares Small Cap Index™ returns became publicly available on January 3, 2006. Index returns do not represent Fund returns. One cannot invest directly in an index.
| 9 |
Management Discussion of Fund Performance — continued
June 30, 2012
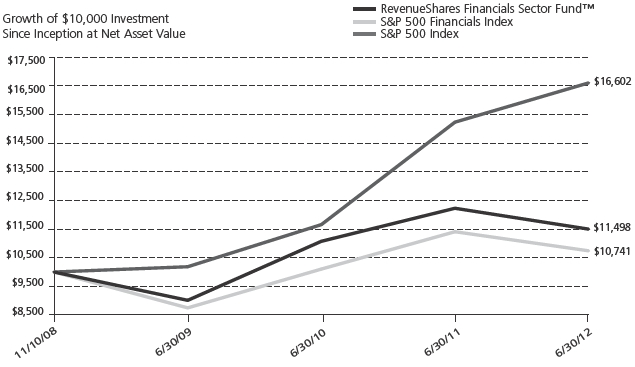
RevenueShares Financials Sector Fund™ (Ticker: RWW)
The Fund seeks to achieve its investment objective of outperforming the total return performance of the S&P 500® Financials Index by investing in the constituent securities of the S&P 500® Financials Index in the same proportions as the RevenueShares Financials Sector Index. The S&P 500® Financials Index is a stock market index comprised of large cap companies that Standard & Poor’s® deems to be part of the Financials sector of the United States economy, using the Global Industry Classification Standard. It is a subset of the S&P 500® Index and includes companies involved in activities such as: banking; mortgage finance; consumer finance; specialized finance; investment banking and brokerage; asset management and custody; corporate lending; insurance; financial investment; and real estate, including real estate investment trusts (“REITs”). Under normal circumstances, the Fund will invest at least 80% of its net assets in Financials companies included in the S&P 500® Financials Index and generally expects to be substantially invested at such times, with at least 95% of its net assets invested in these securities. The Fund defines Financials companies as companies that are included in the S&P 500® Financials Index at the time of purchase. The Fund will provide shareholders with at least 60 days’ notice prior to any change in this policy.
The RevenueShares Financial Sector Fund has significant weightings to large money centers and global banks. We believe as economic conditions improve the money center banks will experience solid earnings growth over the next several years.
Among the top and bottom performing Fund holdings for the fiscal year 6/30/2012, the top three performers were Simon Property Group Inc. (+37.88%), Cincinnati Financial Corp. (+37.27%), Discovery Financial Services (+30.82%), while the bottom three performers in this group were Leucadia National (–36.91%), E*TRADE Financial Corp. (–41.73%), and Genworth Financial (–44.94%).
| 10 |
Management Discussion of Fund Performance — continued
| Cumulative Total Return | Average Annual Total Return | |||||||
| Fund Performance History (%) | As of June 30, 2012 | As of June 30, 2012 | ||||||
| Since Inception | Since Inception | |||||||
| 1 Year | (November 10, 2008) | 1 Year | (November 10, 2008) | |||||
| Index | ||||||||
| RevenueShares Financials Sector Index™ | -5.44 | % | 23.10 | % | -5.44 | % | 5.88 | % |
| S&P 500 Financials Index | -2.68 | % | 11.02 | % | -2.68 | % | 3.84 | % |
| S&P 500 Index | 5.45 | % | 60.62 | % | 5.45 | % | 13.92 | % |
| Fund | ||||||||
| NAV Return | -5.95 | % | 33.45 | % | -5.95 | % | 8.27 | % |
| Market Price | -5.93 | % | 32.94 | % | -5.93 | % | 8.16 | % |
Performance data quoted represents past performance and is no guarantee of future results. Current performance may be lower or higher than the performance data quoted. Investment return and principal value will fluctuate so that an investor’s shares, when redeemed, may be worth more or less than original cost. As stated in the current prospectus, the Financials Sector Fund’s annual operating expense ratio (gross) is 1.03% and the net expense ratio is 0.49%. (Actual expenses can be referenced in the Financial Highlights section later in this report.) The Fund’s advisor has contractually agreed to waive a portion of its fees and/or reimburse expenses to the extent necessary to keep the Fund’s expenses from exceeding the net expense ratio. This agreement is in effect until October 31, 2012. The performance table and graph do not reflect the deduction of taxes that a shareholder would pay on Fund distributions or the redemption of Fund shares. For the Fund’s most recent month end performance please visit www.revenuesharesetfs.com.
Performance reflects reinvestment of all dividend and capital gains distributions. During this period, some of the Fund’s fees were waived and/or expenses reimbursed; otherwise, the Fund’s performance would have been lower. Index returns reflect the reinvestment of dividends but do not reflect any management fees, transaction costs or other expenses that would be incurred by a portfolio or fund, or brokerage commissions on transactions in Fund shares. Such fees, expenses and commissions reduce returns. RevenueShares Financials Sector Index™ returns became publicly available on October 1, 2008. Index returns do not represent Fund returns. One cannot invest directly in an index.
| 11 |
Management Discussion of Fund Performance — continued
June 30, 2012
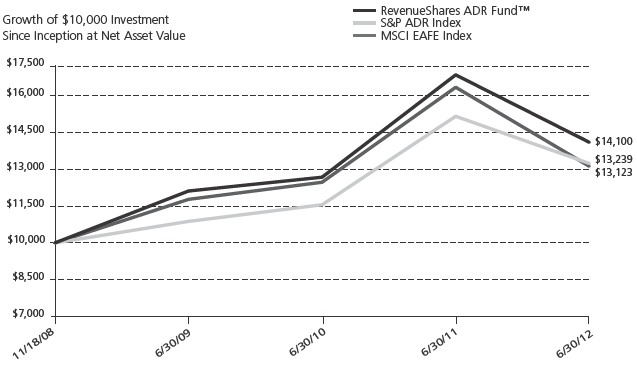
RevenueShares ADR Fund™ (Ticker: RTR)
The Fund seeks to achieve its investment objective of outperforming the total return performance of the S&P ADR Index by investing in the constituent securities of the S&P ADR Index in the same proportions as the RevenueShares ADR Index. The RevenueShares ADR Index is constructed using a rules-driven methodology, which re-weights the constituent securities of the S&P ADR Index according to the revenue earned by the companies in that index, subject to certain tax diversification requirements. The RevenueShares ADR Index generally contains the same securities as the S&P ADR Index, but in different proportions. Constituent securities that are added to or removed from the S&P ADR Index during a calendar quarter are generally added to and removed from the RevenueShares ADR Index on a quarterly basis. The S&P ADR Index is a U.S. dollar denominated version of the S&P Global 1200 Ex U.S. Index and is based on the non-U.S. stocks of the S&P Global 1200. American Depositary Receipts (“ADRs”) are certificates that represent a U.S. dollar denominated equity ownership in a foreign company and offer U.S. investors the same economic benefits enjoyed by the shareholders of that company. Typically, ADRs are listed and traded on U.S. exchanges and trade in U.S. dollars just like any other U.S.-domiciled security. Since not all foreign companies offer ADR programs, the S&P ADR Index is made up of those companies from the S&P Global 1200 who make available ADRs that are offered or listed on a U.S. exchange, global shares or, in the case of Canadian equities, ordinary shares, all of which are traded on a U.S. exchange. Under normal circumstances, the Fund will invest at least 80% of its net assets in ADRs included in the S&P ADR Index and generally expects to be substantially invested at such times, with at least 95% of its net assets invested in these securities. The Fund will provide shareholders with at least 60 days’ notice prior to any change in this policy.
The RevenueShares ADR Fund, which has exposure to both developed and emerging markets, experienced a significant downturn primarily due to its China and other emerging market holdings. We believe these two asset classes will perform well over the long term and are very comfortable with the Fund’s exposure to this market.
Among the top and bottom performing Fund holdings for the fiscal year 6/30/2012, the top three performers were Credicorp Ltd. (+48.80%), Ecopetrol S A (+46.44%), Asmld Holdings Nv (+40.49%), while the bottom three performers in this group were Alcatel-Lucent (–71.75%), Research in Motion Limited (–74.38%), and National Bank of Greece S A. (–76.08%).
| 12 |
Management Discussion of Fund Performance — continued
| Cumulative Total Return | Average Annual Total Return | |||||||
| Fund Performance History (%) | As of June 30, 2012 | As of June 30, 2012 | ||||||
| Since Inception | Since Inception | |||||||
| 1 Year | (November 18, 2008) | 1 Year | (November 18, 2008) | |||||
| Index | ||||||||
| RevenueShares ADR Index™ | -15.75 | % | 49.50 | % | -15.75 | % | 11.77 | % |
| S&P ADR Index | -12.57 | % | 32.53 | % | -12.57 | % | 11.38 | % |
| MSCI EAFE Index (net) | -13.36 | % | 41.58 | % | -13.36 | % | 10.39 | % |
| Fund | ||||||||
| NAV Return | -16.30 | % | 56.60 | % | -16.30 | % | 13.24 | % |
| Market Price | -16.32 | % | 56.29 | % | -16.32 | % | 13.17 | % |
Performance data quoted represents past performance and is no guarantee of future results. Current performance may be lower or higher than the performance data quoted. Investment return and principal value will fluctuate so that an investor’s shares, when redeemed, may be worth more or less than original cost. As stated in the current prospectus, the ADR Fund’s annual operating expense ratio (gross) is 0.99% and the net expense ratio is 0.49%. (Actual expenses can be referenced in the Financial Highlights section later in this report.) The Fund’s advisor has contractually agreed to waive a portion of its fees and/or reimburse expenses to the extent necessary to keep the Fund’s expenses from exceeding the net expense ratio. This agreement is in effect until October 31, 2012. The performance table and graph do not reflect the deduction of taxes that a shareholder would pay on Fund distributions or the redemption of Fund shares. For the Fund’s most recent month end performance please visit www.revenuesharesetfs.com.
Performance reflects reinvestment of all dividend and capital gains distributions. During this period, some of the Fund’s fees were waived and/or expenses reimbursed; otherwise, the Fund’s performance would have been lower. Index returns reflect the reinvestment of dividends but do not reflect any management fees, transaction costs or other expenses that would be incurred by a portfolio or fund, or brokerage commissions on transactions in Fund shares. Such fees, expenses and commissions reduce returns. RevenueShares ADR Index™ returns became publicly available on October 1, 2008. Index returns do not represent Fund returns. One cannot invest directly in an index.
The MSCI EAFE Index (Europe, Australasia, Far East) adjusts the market capitalization of index constituents for free float and targets for index inclusion 85% of free float-adjusted market capitalization in each industry group in developed market countries, excluding the U.S. and Canada.
| 13 |
Management Discussion of Fund Performance — continued
June 30, 2012
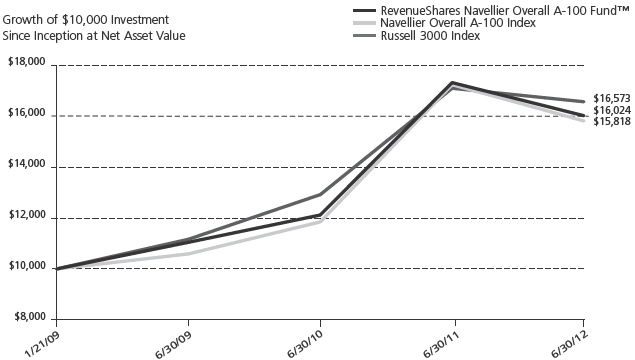
RevenueShares Navellier Overall A-100 Fund™ (Ticker: RWV)
The Fund seeks to achieve its investment objective of outperforming the total return performance of the Navellier Overall A-100 Index by investing in the constituent securities of the Navellier Overall A-100 Index in the same proportions as the RevenueShares Navellier Overall A-100 Index. The Navellier Overall A-100 Index is constructed from companies that are traded on the New York Stock Exchange, Nasdaq Stock Exchange or American Stock Exchange that have over 2,500 shares traded daily, a closing price over $1, and companies that have been public for at least one year. This universe of companies is narrowed through a combination of quantitative and fundamental screens to select the top 100 of the total universe. This is accomplished by implementing a multi-factor model that encompasses nine factors, one of which is quantitative based and eight that are fundamental. The quantitative factor begins with a computer-driven analysis based on Modern Portfolio Theory. The Index calculates reward (alpha) and risk (standard deviation) characteristics for the universe of approximately 4,800 stocks. Trailing 52-week “alphas” (measure of return independent of the market) are divided by trailing 52-week “standard deviations” (measure of volatility or risk) to create a “reward/risk” ratio. This factor has the highest weight in the Navellier Overall A-100 Index.
The RevenueShares Navellier Overall A- 100 Fund has a growth and momentum bias to its holdings and we expect this Fund to respond very well in an earnings expansion environment.
Among the top and bottom performing Fund holdings for the fiscal year 6/30/2012, the top three performers were Akorn Inc. (+125.28%), Spectrum Inc (+97.46%), Monster Beverage Corp. (+75.91%), while the bottom three performers in this group were Fuwei Films Holdings (–58.66%), Travelzoo Inc (–62.90%), and Diamonds Foods Inc. (–64.56%).
| 14 |
Management Discussion of Fund Performance — concluded
| Cumulative Total Return | Average Annual Total Return | |||||||
| Fund Performance History (%) | As of June 30, 2012 | As of June 30, 2012 | ||||||
| Since Inception | Since Inception | |||||||
| 1 Year | (January 21, 2009) | 1 Year | (January 21, 2009) | |||||
| Index | ||||||||
| RevenueShares Navellier Overall A-100 Index™ | -6.71 | % | 60.90 | % | -6.71 | % | 14.84 | % |
| Navellier Overall A-100 Index | -7.84 | % | 58.92 | % | -7.84 | % | 12.13 | % |
| Russell 3000 Index | 3.84 | % | 77.61 | % | 3.84 | % | 18.19 | % |
| Fund | ||||||||
| NAV Return | -7.61 | % | 57.83 | % | -7.61 | % | 14.22 | % |
| Market Price | -7.93 | % | 57.60 | % | -7.93 | % | 14.17 | % |
Performance data quoted represents past performance and is no guarantee of future results. Current performance may be lower or higher than the performance data quoted. Investment return and principal value will fluctuate so that an investor’s shares, when redeemed, may be worth more or less than original cost. As stated in the current prospectus, the Navellier Overall A-100 Fund’s annual operating expense ratio (gross) is 1.60% and the net expense ratio is 0.60%. (Actual expenses can be referenced in the Financial Highlights section later in this report.) The Fund’s advisor has contractually agreed to waive a portion of its fees and/or reimburse expenses to the extent necessary to keep the Fund’s expenses from exceeding the net expense ratio. This agreement is in effect until October 31, 2012. The performance table and graph do not reflect the deduction of taxes that a shareholder would pay on Fund distributions or the redemption of Fund shares. For the Fund’s most recent month end performance please visit www.revenuesharesetfs.com.
Performance reflects reinvestment of all dividend and capital gains distributions. During this period, some of the Fund’s fees were waived and/or expenses reimbursed; otherwise, the Fund’s performance would have been lower. Index returns reflect the reinvestment of dividends but do not reflect any management fees, transaction costs or other expenses that would be incurred by a portfolio or fund, or brokerage commissions on transactions in Fund shares. Such fees, expenses and commissions reduce returns. RevenueShares Navellier Overall A-100 Index™ returns became publicly available on December 31, 2008. Index returns do not represent Fund returns. One cannot invest directly in an index.
The Russell 3000 Index measures the performance of the largest 3000 U.S. companies representing approximately 98% of the investable U.S. equity market.
| 15 |
As a shareholder of a RevenueShares ETF, you incur two types of costs: (1) transaction costs for purchasing and selling shares and (2) ongoing costs, including advisory fees and other fund expenses. The following examples are intended to help you understand your ongoing costs (in dollars and cents) of investing in the Funds and to compare these costs with the ongoing costs of investing in other funds.
The actual and hypothetical expense examples below are based on an investment of $1,000 held for the entire six-month period from January 1, 2012 to June 30, 2012.
Actual expenses
The first line under each Fund in the table below provides information about actual account values and actual expenses. You may use the information in this line, together with the amount you invested, to estimate the expenses that you paid over the period. Simply divide your account value by $1,000 (for example, an $8,600 account value divided by $1,000 = 8.6), then multiply the result by the number in the first line for your Fund under the heading entitled “Expenses Paid During the Six Month Period” to estimate the expenses you paid on your account during this period.
Hypothetical example for comparison purposes
The second line under each Fund in the table provides information about hypothetical account values and hypothetical expenses based on each Fund’s actual expense ratio and an assumed rate of return of 5% per year before expenses, which is not the Fund’s actual return. The hypothetical account values and expenses may not be used to estimate the actual ending account balance or expenses you paid for the period. You may use this information to compare the ongoing costs of investing in your Fund and other funds. To do so, compare this 5% hypothetical example with the 5% hypothetical examples that appear in the shareholder reports of the other funds.
Please note that the expenses shown in the table are meant to highlight your ongoing costs only and do not reflect any transactional costs, such as brokerage commissions paid on purchases and sales of Fund shares. Therefore, the second line under each Fund in the table is useful in comparing ongoing Fund costs only and will not help you determine the relative total costs of owning different funds. In addition, if these transactional costs were included, your costs would have been higher.
| Beginning | Ending | Annualized | Expenses Paid | |||||
| Account | Account | Expense Ratios | During the | |||||
| Value | Value | for the Six Month | Six Month | |||||
| 1/1/2012 | 6/30/2012 | Period | Period† | |||||
| RevenueShares Large Cap Fund | ||||||||
| Actual | $ | 1,000.00 | $ | 1,087.15 | 0.49 | % | $ | 2.54 |
| Hypothetical (5% return before expenses) | $ | 1,000.00 | $ | 1,022.43 | 0.49 | % | $ | 2.46 |
| RevenueShares Mid Cap Fund | ||||||||
| Actual | $ | 1,000.00 | $ | 1,063.58 | 0.54 | % | $ | 2.77 |
| Hypothetical (5% return before expenses) | $ | 1,000.00 | $ | 1,022.18 | 0.54 | % | $ | 2.72 |
| RevenueShares Small Cap Fund | ||||||||
| Actual | $ | 1,000.00 | $ | 1,052.26 | 0.54 | % | $ | 2.76 |
| Hypothetical (5% return before expenses) | $ | 1,000.00 | $ | 1,022.18 | 0.54 | % | $ | 2.72 |
| RevenueShares Financials Sector Fund | ||||||||
| Actual | $ | 1,000.00 | $ | 1,156.67 | 0.49 | % | $ | 2.63 |
| Hypothetical (5% return before expenses) | $ | 1,000.00 | $ | 1,022.43 | 0.49 | % | $ | 2.46 |
| RevenueShares ADR Fund | ||||||||
| Actual | $ | 1,000.00 | $ | 1,002.52 | 0.49 | % | $ | 2.44 |
| Hypothetical (5% return before expenses) | $ | 1,000.00 | $ | 1,022.43 | 0.49 | % | $ | 2.46 |
| RevenueShares Navellier Overall A-100 Fund | ||||||||
| Actual | $ | 1,000.00 | $ | 1,060.86 | 0.60 | % | $ | 3.07 |
| Hypothetical (5% return before expenses) | $ | 1,000.00 | $ | 1,021.88 | 0.60 | % | $ | 3.02 |
| † | Expenses are calculated using each Fund’s annualized expense ratio, multiplied by the average account value for the period, multiplied by 182/366 (to reflect the six-month period). |
| 16 |
Schedule of Investments Summary Tables
(Unaudited)
| RevenueShares Large Cap Fund | RevenueShares Mid Cap Fund | RevenueShares Small Cap Fund | ||||||
| % of | % of | % of | ||||||
| Industry | Net Assets | Industry | Net Assets | Industry | Net Assets | |||
| Automobiles & Components | 1.9 | % | Automobiles & Components | 0.3 | % | Automobiles & Components | 0.6 | % |
| Banks | 1.9 | Banks | 2.0 | Banks | 2.7 | |||
| Capital Goods | 8.5 | Capital Goods | 14.8 | Capital Goods | 11.7 | |||
| Commercial & Professional Services | 0.6 | Commercial & Professional Services | 4.0 | Commercial & Professional Services | 5.9 | |||
| Consumer Durables & Apparel | 1.0 | Consumer Durables & Apparel | 2.9 | Consumer Durables & Apparel | 4.9 | |||
| Consumer Services | 1.1 | Consumer Services | 2.1 | Consumer Services | 5.0 | |||
| Diversified Financials | 5.7 | Diversified Financials | 1.3 | Diversified Financials | 1.5 | |||
| Energy | 17.1 | Energy | 6.6 | Energy | 3.2 | |||
| Food & Staples Retailing | 8.7 | Food & Staples Retailing | 4.1 | Food & Staples Retailing | 4.0 | |||
| Food, Beverage & Tobacco | 4.7 | Food, Beverage & Tobacco | 3.0 | Food, Beverage & Tobacco | 2.9 | |||
| Health Care Equipment & Services | 7.3 | Health Care Equipment & Services | 9.2 | Health Care Equipment & Services | 8.5 | |||
| Household & Personal Products | 1.5 | Household & Personal Products | 0.7 | Household & Personal Products | 0.6 | |||
| Insurance | 5.8 | Insurance | 5.3 | Insurance | 2.5 | |||
| Materials | 3.6 | Materials | 7.8 | Materials | 7.9 | |||
| Media | 2.9 | Media | 1.4 | Media | 1.4 | |||
| Money Market Fund | 2.8 | Money Market Fund | 4.9 | Money Market Fund | 4.1 | |||
| Pharmaceuticals, Biotechnology | Pharmaceuticals, Biotechnology | Pharmaceuticals, Biotechnology | ||||||
| & Life Sciences | 3.5 | & Life Sciences | 1.2 | & Life Sciences | 1.4 | |||
| Real Estate Investment Trusts | 0.4 | Real Estate Investment Trusts | 1.5 | Real Estate Investment Trusts | 1.3 | |||
| Retailing | 5.8 | Real Estate Management | Real Estate Management | |||||
| Semiconductors & Semiconductor | & Development | 0.3 | & Development | 0.0 | † | |||
| Equipment | 1.2 | Retailing | 7.4 | Retailing | 10.8 | |||
| Software & Services | 4.0 | Semiconductors & Semiconductor | Semiconductors & Semiconductor | |||||
| Technology Hardware & Equipment | 4.9 | Equipment | 1.2 | Equipment | 2.5 | |||
| Telecommunication Services | 3.0 | Software & Services | 3.7 | Software & Services | 4.4 | |||
| Transportation | 1.7 | Technology Hardware & Equipment | 11.3 | Technology Hardware & Equipment | 10.0 | |||
| Utilities | 3.2 | Telecommunication Services | 0.6 | Telecommunication Services | 0.8 | |||
| Total Investments | 102.8 | Transportation | 3.5 | Transportation | 2.1 | |||
| Liabilities in Excess of Other Assets | (2.8 | ) | Utilities | 4.3 | Utilities | 3.4 | ||
| Net Assets | 100.0 | % | Total Investments | 105.4 | Total Investments | 104.1 | ||
| Liabilities in Excess of Other Assets | (5.4 | ) | Liabilities in Excess of Other Assets | (4.1 | ) | |||
| Net Assets | 100.0 | % | Net Assets | 100.0 | % | |||
| RevenueShares Financial Sector Fund | RevenueShares ADR Fund | RevenueShares Navellier Overall | ||||||
| A-100 Fund | ||||||||
| % of | % of | % of | ||||||
| Industry | Net Assets | Industry | Net Assets | Industry | Net Assets | |||
| Capital Markets | 11.5 | % | Automobiles & Components | 5.4 | % | Banks | 1.6 | % |
| Commercial Banks | 13.4 | Banks | 12.3 | Capital Goods | 6.8 | |||
| Consumer Finance | 4.7 | Capital Goods | 3.0 | Commercial & Professional Services | 1.1 | |||
| Diversified Financial Services | 25.1 | Consumer Durables & Apparel | 3.1 | Consumer Durables & Apparel | 6.6 | |||
| Insurance | 41.8 | Consumer Services | 0.3 | Consumer Services | 2.5 | |||
| Money Market Fund | 0.0 | † | Diversified Financials | 3.8 | Diversified Financials | 0.8 | ||
| Paper & Forest Products | 0.5 | Energy | 35.5 | Energy | 3.4 | |||
| Real Estate Investment Trusts | 2.2 | Food & Staples Retailing | 0.5 | Food & Staples Retailing | 2.9 | |||
| Real Estate Management | Food, Beverage & Tobacco | 3.1 | Food, Beverage & Tobacco | 9.1 | ||||
| & Development | 0.4 | Health Care Equipment & Services | 0.3 | Health Care Equipment & Services | 1.3 | |||
| Thrifts & Mortgage Finance | 0.3 | Insurance | 4.3 | Household & Personal Products | 1.7 | |||
| Total Investments | 99.9 | Materials | 7.3 | Insurance | 8.2 | |||
| Other Assets in Excess of Liabilities | 0.1 | Media | 0.8 | Materials | 1.7 | |||
| Net Assets | 100.0 | % | Money Market Fund | 2.5 | Media | 2.0 | ||
| Pharmaceuticals, Biotechnology | Money Market Fund | 3.0 | ||||||
| & Life Sciences | 3.2 | Pharmaceuticals, Biotechnology | ||||||
| Real Estate | 0.3 | & Life Sciences | 4.4 | |||||
| Semiconductors & Semiconductor | Real Estate | 1.6 | ||||||
| Equipment | 0.5 | Retailing | 26.7 | |||||
| Software & Services | 0.3 | Semiconductors & Semiconductor | ||||||
| Technology Hardware & Equipment | 2.6 | Equipment | 0.1 | |||||
| Telecommunication Services | 10.6 | Software & Services | 8.7 | |||||
| Transportation | 0.4 | Technology Hardware & Equipment | 8.8 | |||||
| Utilities | 2.0 | Transportation | 0.3 | |||||
| Total Investments | 102.1 | Total Investments | 103.3 | |||||
| Liabilities in Excess of Other Assets | (2.1 | ) | Liabilities in Excess of Other Assets | (3.3 | ) | |||
| Net Assets | 100.0 | % | Net Assets | 100.0 | % | |||
| † | Less than 0.05% |
| 17 |
RevenueShares Large Cap Fund
June 30, 2012
| Investments | Shares | Value | ||||
| COMMON STOCKS—100.0% | ||||||
| Automobiles & Components—1.9% | ||||||
| BorgWarner, Inc.*(a) | 1,588 | $ | 104,157 | |||
| Ford Motor Co. | 197,614 | 1,895,118 | ||||
| Goodyear Tire & Rubber Co.* | 29,843 | 352,446 | ||||
| Harley-Davidson, Inc. | 1,628 | 74,449 | ||||
| Johnson Controls, Inc. | 21,589 | 598,231 | ||||
| Total Automobiles & Components | 3,024,401 | |||||
| Banks—1.9% | ||||||
| BB&T Corp. | 5,196 | 160,297 | ||||
| Comerica, Inc. | 1,349 | 41,428 | ||||
| Fifth Third Bancorp | 8,163 | 109,384 | ||||
| First Horizon National Corp. | 3,083 | 26,668 | ||||
| Hudson City Bancorp, Inc. | 6,178 | 39,354 | ||||
| Huntington Bancshares, Inc. | 7,546 | 48,294 | ||||
| KeyCorp | 10,109 | 78,244 | ||||
| M&T Bank Corp. | 836 | 69,028 | ||||
| People's United Financial, Inc. | 1,687 | 19,586 | ||||
| PNC Financial Services Group, Inc. | 4,273 | 261,123 | ||||
| Regions Financial Corp. | 18,556 | 125,253 | ||||
| SunTrust Banks, Inc. | 6,675 | 161,735 | ||||
| U.S. Bancorp | 10,432 | 335,493 | ||||
| Wells Fargo & Co. | 42,522 | 1,421,936 | ||||
| Zions Bancorporation | 2,215 | 43,015 | ||||
| Total Banks | 2,940,838 | |||||
| Capital Goods—8.5% | ||||||
| 3M Co. | 5,240 | 469,504 | ||||
| Boeing Co. | 14,128 | 1,049,710 | ||||
| Caterpillar, Inc. | 10,028 | 851,478 | ||||
| Cooper Industries PLC, Class A | 1,223 | 83,384 | ||||
| Cummins, Inc. | 2,840 | 275,224 | ||||
| Danaher Corp. | 4,479 | 233,266 | ||||
| Deere & Co. | 6,186 | 500,262 | ||||
| Dover Corp. | 2,253 | 120,783 | ||||
| Eaton Corp.(a) | 6,272 | 248,559 | ||||
| Emerson Electric Co. | 8,019 | 373,525 | ||||
| Fastenal Co. | 1,037 | 41,802 | ||||
| Flowserve Corp. | 629 | 72,178 | ||||
| Fluor Corp. | 7,226 | 356,531 | ||||
| General Dynamics Corp. | 7,799 | 514,422 | ||||
| General Electric Co. | 113,505 | 2,365,444 | ||||
| Goodrich Corp. | 958 | 121,570 | ||||
| Honeywell International, Inc. | 10,003 | 558,568 | ||||
| Illinois Tool Works, Inc. | 4,998 | 264,344 | ||||
| Ingersoll-Rand PLC | 5,773 | 243,505 | ||||
| Jacobs Engineering Group, Inc.* | 4,340 | 164,312 | ||||
| Joy Global, Inc. | 1,139 | 64,615 | ||||
| L-3 Communications Holdings, Inc. | 3,292 | 243,641 | ||||
| Lockheed Martin Corp.(a) | 8,736 | 760,731 | ||||
| Masco Corp. | 8,430 | 116,924 | ||||
| Northrop Grumman Corp. | 6,754 | 430,838 | ||||
| PACCAR, Inc. | 5,711 | 223,814 | ||||
| Pall Corp. | 771 | 42,259 | ||||
| Parker Hannifin Corp. | 2,311 | 177,670 | ||||
| Precision Castparts Corp. | 560 | 92,114 | ||||
| Quanta Services, Inc.* | 2,858 | 68,792 | ||||
| Raytheon Co. | 7,233 | 409,315 | ||||
| Rockwell Automation, Inc. | 1,297 | 85,680 | ||||
| Investments | Shares | Value | ||||
| Rockwell Collins, Inc. | 1,522 | $ | 75,111 | |||
| Roper Industries, Inc. | 422 | 41,601 | ||||
| Snap-On, Inc. | 725 | 45,131 | ||||
| Textron, Inc. | 6,757 | 168,047 | ||||
| Tyco International Ltd. | 5,036 | 266,153 | ||||
| United Technologies Corp. | 12,008 | 906,964 | ||||
| W.W. Grainger, Inc. | 649 | 124,115 | ||||
| Xylem, Inc./NY | 2,414 | 60,760 | ||||
| Total Capital Goods | 13,312,646 | |||||
| Commercial & Professional Services—0.6% | ||||||
| Avery Dennison Corp. | 3,661 | 100,092 | ||||
| Cintas Corp. | 1,686 | 65,096 | ||||
| Dun & Bradstreet Corp. | 398 | 28,326 | ||||
| Equifax, Inc. | 648 | 30,197 | ||||
| Iron Mountain, Inc. | 1,456 | 47,990 | ||||
| Pitney Bowes, Inc.(a) | 5,604 | 83,892 | ||||
| R.R. Donnelley & Sons Co.(a) | 14,995 | 176,491 | ||||
| Republic Services, Inc. | 4,914 | 130,024 | ||||
| Robert Half International, Inc. | 1,980 | 56,568 | ||||
| Stericycle, Inc.* | 282 | 25,851 | ||||
| Waste Management, Inc. | 6,315 | 210,921 | ||||
| Total Commercial & Professional Services | 955,448 | |||||
| Consumer Durables & Apparel—1.0% | ||||||
| Coach, Inc. | 1,037 | 60,644 | ||||
| D.R. Horton, Inc. | 3,266 | 60,029 | ||||
| Fossil, Inc.*(a) | 500 | 38,270 | ||||
| Harman International Industries, Inc. | 1,508 | 59,717 | ||||
| Hasbro, Inc.(a) | 1,924 | 65,166 | ||||
| Leggett & Platt, Inc. | 2,754 | 58,192 | ||||
| Lennar Corp., Class A | 1,751 | 54,123 | ||||
| Mattel, Inc. | 3,017 | 97,871 | ||||
| Newell Rubbermaid, Inc. | 5,003 | 90,754 | ||||
| NIKE, Inc., Class B | 3,128 | 274,576 | ||||
| Pulte Group, Inc.* | 6,684 | 71,519 | ||||
| Ralph Lauren Corp., Class A | 592 | 82,916 | ||||
| Stanley Black & Decker, Inc. | 2,504 | 161,157 | ||||
| VF Corp. | 956 | 127,578 | ||||
| Whirlpool Corp. | 4,773 | 291,917 | ||||
| Total Consumer Durables & Apparel | 1,594,429 | |||||
| Consumer Services—1.1% | ||||||
| Apollo Group, Inc., Class A* | 2,250 | 81,428 | ||||
| Carnival Corp.(a) | 6,924 | 237,285 | ||||
| Chipotle Mexican Grill, Inc., Class A* | 81 | 30,776 | ||||
| Darden Restaurants, Inc. | 2,249 | 113,867 | ||||
| DeVry, Inc. | 1,225 | 37,938 | ||||
| H&R Block, Inc. | 3,313 | 52,942 | ||||
| International Game Technology | 2,002 | 31,531 | ||||
| Marriott International, Inc., Class A | 4,835 | 189,532 | ||||
| McDonald's Corp. | 4,673 | 413,701 | ||||
| Starbucks Corp. | 3,245 | 173,023 | ||||
| Starwood Hotels & Resorts | ||||||
| Worldwide, Inc. | 1,603 | 85,023 | ||||
| Wyndham Worldwide Corp. | 1,259 | 66,400 | ||||
| Wynn Resorts Ltd. | 773 | 80,176 | ||||
| Yum! Brands, Inc. | 2,862 | 184,370 | ||||
| Total Consumer Services | 1,777,992 | |||||
The accompanying notes are an integral part of these financial statements.
| 18 |
Schedule of Investments — continued
RevenueShares Large Cap Fund
June 30, 2012
| Investments | Shares | Value | ||||
| Diversified Financials—5.7% | ||||||
| American Express Co. | 8,692 | $ | 505,961 | |||
| Ameriprise Financial, Inc. | 3,173 | 165,821 | ||||
| Bank of America Corp. | 219,881 | 1,798,627 | ||||
| Bank of New York Mellon Corp. | 11,509 | 252,623 | ||||
| BlackRock, Inc., Class A | 844 | 143,328 | ||||
| Capital One Financial Corp. | 5,354 | 292,650 | ||||
| Charles Schwab Corp. | 6,051 | 78,239 | ||||
| Citigroup, Inc. | 56,623 | 1,552,036 | ||||
| CME Group, Inc., Class A | 189 | 50,673 | ||||
| Discover Financial Services | 3,840 | 132,787 | ||||
| E*Trade Financial Corp.* | 4,596 | 36,952 | ||||
| Federated Investors, Inc., Class B | 670 | 14,639 | ||||
| Franklin Resources, Inc. | 1,015 | 112,655 | ||||
| Goldman Sachs Group, Inc. | 6,363 | 609,957 | ||||
| IntercontinentalExchange, Inc.* | 150 | 20,397 | ||||
| Invesco Ltd. | 2,942 | 66,489 | ||||
| JPMorgan Chase & Co. | 49,962 | 1,785,142 | ||||
| Legg Mason, Inc. | 1,694 | 44,671 | ||||
| Leucadia National Corp. | 1,355 | 28,821 | ||||
| Moody's Corp. | 1,009 | 36,879 | ||||
| Morgan Stanley | 46,121 | 672,905 | ||||
| NASDAQ OMX Group, Inc. | 2,397 | 54,340 | ||||
| Northern Trust Corp. | 1,459 | 67,143 | ||||
| NYSE Euronext | 2,829 | 72,366 | ||||
| SLM Corp. | 5,845 | 91,825 | ||||
| State Street Corp. | 3,609 | 161,106 | ||||
| T. Rowe Price Group, Inc. | 708 | 44,576 | ||||
| Total Diversified Financials | 8,893,608 | |||||
| Energy—17.1% | ||||||
| Alpha Natural Resources, Inc.*(a) | 10,594 | 92,274 | ||||
| Anadarko Petroleum Corp. | 3,249 | 215,084 | ||||
| Apache Corp. | 2,978 | 261,736 | ||||
| Baker Hughes, Inc. | 7,345 | 301,880 | ||||
| Cabot Oil & Gas Corp. | 413 | 16,272 | ||||
| Cameron International Corp.* | 2,370 | 101,223 | ||||
| Chesapeake Energy Corp.(a) | 9,852 | 183,247 | ||||
| Chevron Corp. | 34,781 | 3,669,396 | ||||
| ConocoPhillips | 64,172 | 3,585,931 | ||||
| Consol Energy, Inc.(a) | 3,133 | 94,742 | ||||
| Denbury Resources, Inc.* | 2,356 | 35,599 | ||||
| Devon Energy Corp. | 2,846 | 165,040 | ||||
| Diamond Offshore Drilling, Inc.(a) | 886 | 52,389 | ||||
| EOG Resources, Inc. | 1,378 | 124,172 | ||||
| EQT Corp. | 484 | 25,957 | ||||
| Exxon Mobil Corp. | 77,480 | 6,629,964 | ||||
| FMC Technologies, Inc.* | 1,809 | 70,967 | ||||
| Halliburton Co. | 12,166 | 345,393 | ||||
| Helmerich & Payne, Inc. | 827 | 35,958 | ||||
| Hess Corp. | 13,396 | 582,056 | ||||
| Kinder Morgan, Inc./Delaware | 3,993 | 128,655 | ||||
| Marathon Oil Corp. | 19,334 | 494,370 | ||||
| Marathon Petroleum Corp. | 26,228 | 1,178,162 | ||||
| Murphy Oil Corp. | 9,915 | 498,625 | ||||
| Nabors Industries Ltd.* | 6,406 | 92,246 | ||||
| National Oilwell Varco, Inc. | 3,176 | 204,661 | ||||
| Newfield Exploration Co.* | 1,495 | 43,819 | ||||
| Investments | Shares | Value | ||||
| Noble Corp. | 1,260 | $ | 40,988 | |||
| Noble Energy, Inc. | 654 | 55,472 | ||||
| Occidental Petroleum Corp. | 4,270 | 366,238 | ||||
| Peabody Energy Corp. | 4,872 | 119,461 | ||||
| Phillips 66* | 88,779 | 2,951,014 | ||||
| Pioneer Natural Resources Co. | 416 | 36,695 | ||||
| QEP Resources, Inc. | 1,661 | 49,780 | ||||
| Range Resources Corp. | 284 | 17,571 | ||||
| Rowan Cos. PLC, Class A* | 521 | 16,844 | ||||
| Schlumberger Ltd. | 9,011 | 584,904 | ||||
| Southwestern Energy Co.* | 1,569 | 50,098 | ||||
| Spectra Energy Corp. | 2,986 | 86,773 | ||||
| Sunoco, Inc. | 13,832 | 657,020 | ||||
| Tesoro Corp.* | 18,253 | 455,595 | ||||
| Valero Energy Corp. | 75,494 | 1,823,180 | ||||
| Williams Cos., Inc. | 5,148 | 148,365 | ||||
| Wpx Energy, Inc.*(a) | 4,191 | 67,810 | ||||
| Total Energy | 26,757,626 | |||||
| Food & Staples Retailing—8.7% | ||||||
| Costco Wholesale Corp. | 14,556 | 1,382,820 | ||||
| CVS Caremark Corp. | 35,408 | 1,654,616 | ||||
| Kroger Co. | 55,001 | 1,275,473 | ||||
| Safeway, Inc. | 37,700 | 684,255 | ||||
| Sysco Corp. | 21,062 | 627,858 | ||||
| Walgreen Co. | 38,190 | 1,129,660 | ||||
| Wal-Mart Stores, Inc. | 95,984 | 6,692,004 | ||||
| Whole Foods Market, Inc. | 1,608 | 153,275 | ||||
| Total Food & Staples Retailing | 13,599,961 | |||||
| Food, Beverage & Tobacco—4.7% | ||||||
| Altria Group, Inc. | 7,595 | 262,407 | ||||
| Archer-Daniels-Midland Co. | 38,605 | 1,139,620 | ||||
| Beam, Inc. | 1,414 | 88,361 | ||||
| Brown-Forman Corp., Class B | 429 | 41,549 | ||||
| Campbell Soup Co.(a) | 3,701 | 123,539 | ||||
| Coca-Cola Co. | 9,553 | 746,949 | ||||
| Coca-Cola Enterprises, Inc. | 4,696 | 131,676 | ||||
| ConAgra Foods, Inc. | 7,753 | 201,035 | ||||
| Constellation Brands, Inc., Class A* | 2,630 | 71,168 | ||||
| Dean Foods Co.* | 12,046 | 205,143 | ||||
| Dr Pepper Snapple Group, Inc. | 2,153 | 94,194 | ||||
| General Mills, Inc. | 5,988 | 230,778 | ||||
| H.J. Heinz Co. | 3,056 | 166,185 | ||||
| Hershey Co. | 1,333 | 96,016 | ||||
| Hormel Foods Corp. | 4,140 | 125,939 | ||||
| J.M. Smucker Co. | 966 | 72,952 | ||||
| Kellogg Co. | 4,140 | 204,226 | ||||
| Kraft Foods, Inc., Class A | 21,496 | 830,176 | ||||
| Lorillard, Inc. | 533 | 70,329 | ||||
| McCormick & Co., Inc. | 963 | 58,406 | ||||
| Molson Coors Brewing Co., Class B | 1,350 | 56,173 | ||||
| Monster Beverage Corp.* | 1,709 | 121,681 | ||||
| PepsiCo, Inc. | 14,689 | 1,037,925 | ||||
| Philip Morris International, Inc. | 5,401 | 471,291 | ||||
| Reynolds American, Inc. | 3,087 | 138,514 | ||||
| Tyson Foods, Inc., Class A | 25,307 | 476,531 | ||||
| Total Food, Beverage & Tobacco | 7,262,763 | |||||
The accompanying notes are an integral part of these financial statements.
| 19 |
Schedule of Investments — continued
RevenueShares Large Cap Fund
June 30, 2012
| Investments | Shares | Value | ||||
| Health Care Equipment & Services—7.3% | ||||||
| Aetna, Inc. | 12,920 | $ | 500,908 | |||
| AmerisourceBergen Corp., Class A | 32,875 | 1,293,631 | ||||
| Baxter International, Inc. | 4,185 | 222,433 | ||||
| Becton Dickinson & Co. | 1,608 | 120,198 | ||||
| Boston Scientific Corp.*(a) | 21,332 | 120,952 | ||||
| C.R. Bard, Inc. | 429 | 46,092 | ||||
| Cardinal Health, Inc. | 37,321 | 1,567,482 | ||||
| CareFusion Corp.* | 2,178 | 55,931 | ||||
| Cerner Corp.* | 393 | 32,485 | ||||
| CIGNA Corp. | 7,627 | 335,588 | ||||
| Coventry Health Care, Inc. | 5,575 | 177,229 | ||||
| Covidien PLC | 3,274 | 175,159 | ||||
| DaVita, Inc.* | 1,133 | 111,272 | ||||
| DENTSPLY International, Inc. | 969 | 36,638 | ||||
| Edwards Lifesciences Corp.* | 253 | 26,135 | ||||
| Express Scripts Holding Co.* | 13,234 | 738,854 | ||||
| Hospira, Inc.* | 1,836 | 64,223 | ||||
| Humana, Inc. | 7,073 | 547,733 | ||||
| Intuitive Surgical, Inc.* | 48 | 26,582 | ||||
| Laboratory Corp. of America | ||||||
| Holdings*(a) | 963 | 89,183 | ||||
| McKesson Corp. | 18,693 | 1,752,469 | ||||
| Medtronic, Inc. | 6,428 | 248,957 | ||||
| Patterson Cos., Inc. | 1,534 | 52,877 | ||||
| Quest Diagnostics, Inc. | 2,023 | 121,178 | ||||
| St. Jude Medical, Inc. | 2,358 | 94,108 | ||||
| Stryker Corp. | 2,312 | 127,391 | ||||
| Tenet Healthcare Corp.* | 29,591 | 155,057 | ||||
| UnitedHealth Group, Inc. | 26,323 | 1,539,896 | ||||
| Varian Medical Systems, Inc.* | 710 | 43,147 | ||||
| WellPoint, Inc. | 13,291 | 847,833 | ||||
| Zimmer Holdings, Inc. | 1,100 | 70,796 | ||||
| Total Health Care Equipment & Services | 11,342,417 | |||||
| Household & Personal Products—1.5% | ||||||
| Avon Products, Inc. | 11,113 | 180,142 | ||||
| Clorox Co. | 1,131 | 81,952 | ||||
| Colgate-Palmolive Co. | 2,577 | 268,266 | ||||
| Estee Lauder Cos., Inc., Class A | 2,401 | 129,942 | ||||
| Kimberly-Clark Corp. | 3,989 | 334,158 | ||||
| Mead Johnson Nutrition Co., Class A | 654 | 52,654 | ||||
| Procter & Gamble Co. | 20,951 | 1,283,249 | ||||
| Total Household & Personal Products | 2,330,363 | |||||
| Insurance—5.8% | ||||||
| ACE Ltd. | 3,604 | 267,165 | ||||
| Aflac, Inc. | 7,954 | 338,761 | ||||
| Allstate Corp. | 14,708 | 516,104 | ||||
| American International Group, Inc.* | 33,309 | 1,068,886 | ||||
| AON PLC | 3,740 | 174,957 | ||||
| Assurant, Inc. | 3,710 | 129,256 | ||||
| Berkshire Hathaway, Inc., Class B* | 27,004 | 2,250,243 | ||||
| Chubb Corp. | 2,965 | 215,911 | ||||
| Cincinnati Financial Corp. | 1,602 | 60,988 | ||||
| Genworth Financial, Inc., Class A* | 29,594 | 167,502 | ||||
| Hartford Financial Services Group, Inc. | 20,030 | 353,129 | ||||
| Lincoln National Corp. | 7,866 | 172,030 | ||||
| Loews Corp. | 5,509 | 225,373 | ||||
| Marsh & McLennan Cos., Inc. | 5,700 | 183,711 | ||||
| MetLife, Inc. | 33,701 | 1,039,676 | ||||
| Principal Financial Group, Inc. | 5,632 | 147,727 | ||||
| Investments | Shares | Value | ||||
| Progressive Corp. | 11,484 | $ | 239,212 | |||
| Prudential Financial, Inc. | 14,719 | 712,841 | ||||
| Torchmark Corp. | 1,065 | 53,836 | ||||
| Travelers Cos., Inc. | 6,244 | 398,617 | ||||
| Unum Group | 8,136 | 155,642 | ||||
| XL Group PLC, Class A | 4,985 | 104,884 | ||||
| Total Insurance | 8,976,451 | |||||
| Materials—3.6% | ||||||
| Air Products & Chemicals, Inc. | 1,926 | 155,486 | ||||
| Airgas, Inc. | 761 | 63,932 | ||||
| Alcoa, Inc. | 43,301 | 378,884 | ||||
| Allegheny Technologies, Inc. | 2,517 | 80,267 | ||||
| Ball Corp. | 3,170 | 130,128 | ||||
| Bemis Co., Inc. | 2,596 | 81,359 | ||||
| CF Industries Holdings, Inc. | 492 | 95,320 | ||||
| Cliffs Natural Resources, Inc. | 1,989 | 98,038 | ||||
| Dow Chemical Co. | 27,731 | 873,526 | ||||
| E.I. du Pont de Nemours & Co. | 11,357 | 574,323 | ||||
| Eastman Chemical Co. | 2,216 | 111,620 | ||||
| Ecolab, Inc. | 1,544 | 105,810 | ||||
| FMC Corp. | 993 | 53,106 | ||||
| Freeport-McMoRan Copper | ||||||
| & Gold, Inc. | 9,920 | 337,974 | ||||
| International Flavors & Fragrances, Inc. | 764 | 41,867 | ||||
| International Paper Co. | 13,856 | 400,577 | ||||
| MeadWestvaco Corp. | 3,351 | 96,341 | ||||
| Monsanto Co. | 2,256 | 186,752 | ||||
| Mosaic Co. (The) | 2,828 | 154,861 | ||||
| Newmont Mining Corp. | 3,160 | 153,292 | ||||
| Nucor Corp. | 7,819 | 296,340 | ||||
| Owens-Illinois, Inc.* | 5,897 | 113,045 | ||||
| PPG Industries, Inc. | 2,183 | 231,660 | ||||
| Praxair, Inc. | 1,620 | 176,143 | ||||
| Sealed Air Corp. | 4,761 | 73,510 | ||||
| Sigma-Aldrich Corp. | 532 | 39,331 | ||||
| Titanium Metals Corp. | 1,406 | 15,902 | ||||
| United States Steel Corp.(a) | 18,745 | 386,147 | ||||
| Vulcan Materials Co. | 1,155 | 45,865 | ||||
| Weyerhaeuser Co. | 4,639 | 103,728 | ||||
| Total Materials | 5,655,134 | |||||
| Media—2.9% | ||||||
| Cablevision Systems Corp., Class A | 8,527 | 113,324 | ||||
| CBS Corp., Class B | 7,038 | 230,706 | ||||
| Comcast Corp., Class A | 25,418 | 812,614 | ||||
| DIRECTV, Class A* | 8,753 | 427,321 | ||||
| Discovery Communications, Inc., | ||||||
| Class A* | 1,234 | 66,636 | ||||
| Gannett Co., Inc. | 6,389 | 94,110 | ||||
| Interpublic Group of Cos., Inc. | 10,111 | 109,704 | ||||
| McGraw-Hill Cos., Inc. | 2,260 | 101,700 | ||||
| News Corp., Class A | 24,943 | 555,980 | ||||
| Omnicom Group, Inc. | 4,419 | 214,763 | ||||
| Scripps Networks Interactive, Inc., | ||||||
| Class A | 584 | 33,206 | ||||
| Time Warner Cable, Inc. | 3,848 | 315,921 | ||||
| Time Warner, Inc. | 12,084 | 465,234 | ||||
| Viacom, Inc., Class B | 4,601 | 216,339 | ||||
| Walt Disney Co. | 13,220 | 641,170 | ||||
| Washington Post Co., Class B | 183 | 68,409 | ||||
| Total Media | 4,467,137 | |||||
The accompanying notes are an integral part of these financial statements.
| 20 |
Schedule of Investments — continued
RevenueShares Large Cap Fund
June 30, 2012
| Investments | Shares | Value | ||||
| Pharmaceuticals, Biotechnology & Life Sciences—3.5% | ||||||
| Abbott Laboratories | 9,603 | $ | 619,105 | |||
| Alexion Pharmaceuticals, Inc.* | 124 | 12,313 | ||||
| Allergan, Inc. | 904 | 83,683 | ||||
| Amgen, Inc. | 3,331 | 243,296 | ||||
| Biogen IDEC, Inc.* | 313 | 45,191 | ||||
| Bristol-Myers Squibb Co. | 9,441 | 339,404 | ||||
| Celgene Corp.* | 1,081 | 69,357 | ||||
| Eli Lilly & Co. | 9,118 | 391,253 | ||||
| Forest Laboratories, Inc.* | 1,688 | 59,063 | ||||
| Gilead Sciences, Inc.* | 2,529 | 129,687 | ||||
| Johnson & Johnson | 15,088 | 1,019,345 | ||||
| Life Technologies Corp.* | 1,324 | 59,567 | ||||
| Merck & Co., Inc. | 19,149 | 799,471 | ||||
| Mylan, Inc.* | 4,397 | 93,964 | ||||
| PerkinElmer, Inc. | 1,111 | 28,664 | ||||
| Perrigo Co. | 363 | 42,809 | ||||
| Pfizer, Inc. | 47,093 | 1,083,139 | ||||
| Thermo Fisher Scientific, Inc. | 3,438 | 178,467 | ||||
| Waters Corp.* | 346 | 27,497 | ||||
| Watson Pharmaceuticals, Inc.* | 895 | 66,221 | ||||
| Total Pharmaceuticals, Biotechnology | ||||||
| & Life Sciences | 5,391,496 | |||||
| Real Estate Investment Trusts—0.4% | ||||||
| American Tower Corp., Class A | 536 | 37,472 | ||||
| Apartment Investment & | ||||||
| Management Co., Class A | 644 | 17,407 | ||||
| AvalonBay Communities, Inc. | 107 | 15,138 | ||||
| Boston Properties, Inc. | 263 | 28,501 | ||||
| Cbre Group, Inc., Class A* | 5,398 | 88,311 | ||||
| Equity Residential | 523 | 32,614 | ||||
| HCP, Inc. | 599 | 26,446 | ||||
| Health Care REIT, Inc. | 345 | 20,114 | ||||
| Host Hotels & Resorts, Inc. | 4,786 | 75,715 | ||||
| Kimco Realty Corp. | 767 | 14,596 | ||||
| Plum Creek Timber Co., Inc.(a) | 499 | 19,810 | ||||
| ProLogis, Inc. | 719 | 23,893 | ||||
| Public Storage | 195 | 28,160 | ||||
| Simon Property Group, Inc. | 439 | 68,335 | ||||
| Ventas, Inc. | 376 | 23,733 | ||||
| Vornado Realty Trust | 551 | 46,273 | ||||
| Total Real Estate Investment Trusts | 566,518 | |||||
| Retailing—5.8% | ||||||
| Abercrombie & Fitch Co., Class A | 1,584 | 54,078 | ||||
| Amazon.com, Inc.* | 3,068 | 700,578 | ||||
| AutoNation, Inc.*(a) | 5,686 | 200,602 | ||||
| AutoZone, Inc.* | 319 | 117,127 | ||||
| Bed Bath & Beyond, Inc.* | 1,810 | 111,858 | ||||
| Best Buy Co., Inc. | 39,071 | 818,928 | ||||
| Big Lots, Inc.* | 1,944 | 79,296 | ||||
| CarMax, Inc.* | 4,812 | 124,823 | ||||
| Dollar Tree, Inc.* | 1,614 | 86,833 | ||||
| Expedia, Inc. | 1,219 | 58,597 | ||||
| Family Dollar Stores, Inc. | 1,831 | 121,725 | ||||
| Gamestop Corp., Class A(a) | 8,049 | 147,780 | ||||
| Gap, Inc. | 8,264 | 226,103 | ||||
| Genuine Parts Co. | 3,078 | 185,450 | ||||
| Home Depot, Inc. | 20,032 | 1,061,496 | ||||
| JC Penney Co., Inc.(a) | 11,761 | 274,149 | ||||
| Investments | Shares | Value | ||||
| Kohl's Corp. | 6,331 | $ | 287,997 | |||
| Lowe's Cos., Inc. | 26,585 | 756,077 | ||||
| Ltd. Brands, Inc. | 3,322 | 141,285 | ||||
| Macy's, Inc. | 10,429 | 358,236 | ||||
| Netflix, Inc.*(a) | 683 | 46,765 | ||||
| Nordstrom, Inc. | 2,908 | 144,499 | ||||
| O'Reilly Automotive, Inc.*(a) | 894 | 74,890 | ||||
| priceline.com, Inc.* | 100 | 66,452 | ||||
| Ross Stores, Inc. | 1,790 | 111,821 | ||||
| Sears Holdings Corp.*(a) | 12,532 | 748,160 | ||||
| Sherwin-Williams Co. | 1,033 | 136,718 | ||||
| Staples, Inc. | 29,549 | 385,614 | ||||
| Target Corp. | 17,949 | 1,044,452 | ||||
| Tiffany & Co. | 870 | 46,067 | ||||
| TJX Cos., Inc. | 7,845 | 336,786 | ||||
| Tripadvisor, Inc.* | 220 | 9,832 | ||||
| Urban Outfitters, Inc.* | 1,210 | 33,384 | ||||
| Total Retailing | 9,098,458 | |||||
| Semiconductors & Semiconductor Equipment—1.2% | ||||||
| Advanced Micro Devices, Inc.* | 16,899 | 96,831 | ||||
| Altera Corp. | 989 | 33,468 | ||||
| Analog Devices, Inc. | 1,259 | 47,426 | ||||
| Applied Materials, Inc. | 15,245 | 174,708 | ||||
| Broadcom Corp., Class A | 3,343 | 112,993 | ||||
| First Solar, Inc.*(a) | 2,854 | 42,981 | ||||
| Intel Corp.(a) | 29,278 | 780,259 | ||||
| KLA-Tencor Corp. | 904 | 44,522 | ||||
| Lam Research Corp.*(a) | 1,288 | 48,609 | ||||
| Linear Technology Corp. | 764 | 23,936 | ||||
| LSI Corp.* | 4,713 | 30,022 | ||||
| Microchip Technology, Inc. | 654 | 21,634 | ||||
| Micron Technology, Inc.* | 23,438 | 147,894 | ||||
| NVIDIA Corp.* | 4,246 | 58,680 | ||||
| Teradyne, Inc.* | 1,527 | 21,470 | ||||
| Texas Instruments, Inc. | 7,610 | 218,331 | ||||
| Xilinx, Inc. | 1,096 | 36,793 | ||||
| Total Semiconductors & | ||||||
| Semiconductor Equipment | 1,940,557 | |||||
| Software & Services—4.0% | ||||||
| Accenture PLC, Class A | 6,850 | 411,617 | ||||
| Adobe Systems, Inc.* | 2,001 | 64,772 | ||||
| Akamai Technologies, Inc.* | 564 | 17,907 | ||||
| Autodesk, Inc.* | 851 | 29,777 | ||||
| Automatic Data Processing, Inc. | 2,713 | 151,006 | ||||
| BMC Software, Inc.* | 712 | 30,388 | ||||
| CA, Inc. | 2,582 | 69,946 | ||||
| Citrix Systems, Inc.* | 411 | 34,499 | ||||
| Cognizant Technology Solutions Corp., | ||||||
| Class A* | 1,500 | 90,000 | ||||
| Computer Sciences Corp. | 10,187 | 252,841 | ||||
| eBay, Inc.* | 3,934 | 165,267 | ||||
| Electronic Arts, Inc.* | 4,311 | 53,241 | ||||
| Fidelity National Information | ||||||
| Services, Inc. | 2,617 | 89,187 | ||||
| Fiserv, Inc.* | 951 | 68,681 | ||||
| Google, Inc., Class A* | 972 | 563,828 | ||||
| International Business Machines Corp. | 8,404 | 1,643,654 | ||||
| Intuit, Inc. | 1,022 | 60,656 | ||||
| Mastercard, Inc., Class A | 236 | 101,506 | ||||
The accompanying notes are an integral part of these financial statements.
| 21 |
Schedule of Investments — continued
RevenueShares Large Cap Fund
June 30, 2012
| Investments | Shares | Value | ||||
| Software & Services (continued) | ||||||
| Microsoft Corp. | 34,812 | $ | 1,064,899 | |||
| Oracle Corp. | 18,991 | 564,033 | ||||
| Paychex, Inc.(a) | 993 | 31,190 | ||||
| Red Hat, Inc.* | 239 | 13,499 | ||||
| SAIC, Inc. | 14,347 | 173,886 | ||||
| Salesforce.com, Inc.* | 181 | 25,025 | ||||
| Symantec Corp.* | 6,314 | 92,248 | ||||
| Total System Services, Inc. | 1,167 | 27,926 | ||||
| VeriSign, Inc. | 279 | 12,156 | ||||
| Visa, Inc., Class A | 1,142 | 141,186 | ||||
| Western Union Co. | 5,021 | 84,554 | ||||
| Yahoo!, Inc.* | 5,169 | 81,825 | ||||
| Total Software & Services | 6,211,200 | |||||
| Technology Hardware & Equipment—4.9% | ||||||
| Agilent Technologies, Inc. | 2,496 | 97,943 | ||||
| Amphenol Corp., Class A | 1,090 | 59,863 | ||||
| Apple, Inc.* | 2,688 | 1,569,792 | ||||
| Cisco Systems, Inc. | 38,409 | 659,483 | ||||
| Corning, Inc. | 9,192 | 118,853 | ||||
| Dell, Inc.* | 77,443 | 969,586 | ||||
| EMC Corp.* | 11,960 | 306,535 | ||||
| F5 Networks, Inc.* | 171 | 17,025 | ||||
| FLIR Systems, Inc. | 1,230 | 23,985 | ||||
| Harris Corp. | 2,128 | 89,057 | ||||
| Hewlett-Packard Co. | 95,222 | 1,914,914 | ||||
| Jabil Circuit, Inc. | 12,175 | 247,518 | ||||
| JDS Uniphase Corp.* | 2,492 | 27,412 | ||||
| Juniper Networks, Inc.* | 4,237 | 69,105 | ||||
| Lexmark International, Inc., Class A(a) | 2,521 | 67,008 | ||||
| Molex, Inc. | 2,210 | 52,907 | ||||
| Motorola Solutions, Inc. | 2,693 | 129,560 | ||||
| NetApp, Inc.* | 2,475 | 78,755 | ||||
| QUALCOMM, Inc. | 3,799 | 211,528 | ||||
| SanDisk Corp.* | 2,267 | 82,700 | ||||
| Seagate Technology PLC | 6,481 | 160,275 | ||||
| TE Connectivity Ltd. | 6,505 | 207,575 | ||||
| Teradata Corp.* | 486 | 34,997 | ||||
| Western Digital Corp.* | 4,828 | 147,157 | ||||
| Xerox Corp. | 45,485 | 357,967 | ||||
| Total Technology Hardware & Equipment | 7,701,500 | |||||
| Telecommunication Services—3.0% | ||||||
| AT&T, Inc. | 55,653 | 1,984,586 | ||||
| CenturyLink, Inc. | 5,015 | 198,042 | ||||
| Crown Castle International Corp.* | 547 | 32,087 | ||||
| Frontier Communications Corp.(a) | 21,510 | 82,383 | ||||
| MetroPCS Communications, Inc.* | 12,267 | 74,215 | ||||
| Sprint Nextel Corp.* | 166,740 | 543,573 | ||||
| Verizon Communications, Inc. | 39,443 | 1,752,847 | ||||
| Windstream Corp. | 6,450 | 62,307 | ||||
| Total Telecommunication Services | 4,730,040 | |||||
| Transportation—1.7% | ||||||
| CH Robinson Worldwide, Inc. | 2,671 | 156,334 | ||||
| CSX Corp. | 8,106 | 181,250 | ||||
| Expeditors International of | ||||||
| Washington, Inc. | 2,451 | 94,976 | ||||
| FedEx Corp. | 6,560 | 600,962 | ||||
| Norfolk Southern Corp. | 2,357 | 169,162 | ||||
| Investments | Shares | Value | ||||
| Ryder System, Inc. | 2,155 | $ | 77,602 | |||
| Southwest Airlines Co. | 24,716 | 227,881 | ||||
| Union Pacific Corp. | 2,524 | 301,138 | ||||
| United Parcel Service, Inc., Class B | 10,511 | 827,846 | ||||
| Total Transportation | 2,637,151 | |||||
| Utilities—3.2% | ||||||
| AES Corp.* | 21,659 | 277,885 | ||||
| AGL Resources, Inc. | 901 | 34,914 | ||||
| Ameren Corp. | 3,583 | 120,174 | ||||
| American Electric Power Co., Inc. | 5,980 | 238,602 | ||||
| CenterPoint Energy, Inc. | 6,407 | 132,433 | ||||
| CMS Energy Corp. | 4,384 | 103,024 | ||||
| Consolidated Edison, Inc. | 3,346 | 208,088 | ||||
| Dominion Resources, Inc. | 4,330 | 233,820 | ||||
| DTE Energy Co. | 2,363 | 140,197 | ||||
| Duke Energy Corp.* | 10,039 | 231,499 | ||||
| Edison International | 4,424 | 204,389 | ||||
| Entergy Corp. | 2,654 | 180,180 | ||||
| Exelon Corp. | 8,213 | 308,973 | ||||
| FirstEnergy Corp. | 5,022 | 247,032 | ||||
| Integrys Energy Group, Inc. | 1,342 | 76,320 | ||||
| NextEra Energy, Inc. | 3,477 | 239,252 | ||||
| NiSource, Inc. | 3,960 | 98,010 | ||||
| Northeast Utilities | 1,899 | 73,700 | ||||
| NRG Energy, Inc.* | 8,697 | 150,980 | ||||
| Oneok, Inc. | 5,139 | 217,431 | ||||
| Pepco Holdings, Inc.(a) | 4,999 | 97,830 | ||||
| PG&E Corp. | 5,187 | 234,815 | ||||
| Pinnacle West Capital Corp. | 994 | 51,430 | ||||
| PPL Corp. | 5,877 | 163,439 | ||||
| Public Service Enterprise Group, Inc. | 5,485 | 178,263 | ||||
| SCANA Corp. | 1,499 | 71,712 | ||||
| Sempra Energy | 2,239 | 154,222 | ||||
| Southern Co. | 5,951 | 275,531 | ||||
| TECO Energy, Inc. | 2,913 | 52,609 | ||||
| Wisconsin Energy Corp. | 1,823 | 72,136 | ||||
| Xcel Energy, Inc. | 5,939 | 168,727 | ||||
| Total Utilities | 5,037,617 | |||||
| Total Common Stocks | ||||||
| (Cost $137,737,145) | 156,205,751 | |||||
| INVESTMENT OF CASH COLLATERAL | ||||||
| FOR SECURITIES LOANED—2.8% | ||||||
| Dreyfus Institutional Preferred | ||||||
| Money Market Fund— | ||||||
| Prime Shares, 0.16%(b) | ||||||
| (Cost $4,432,320) | 4,432,320 | 4,432,320 | ||||
| Total Investments—102.8% | ||||||
| (Cost $142,169,465) | 160,638,071 | |||||
| Liabilities in Excess of Other Assets—(2.8)% | (4,354,321 | ) | ||||
| Net Assets—100.0% | $ | 156,283,750 | ||||
| REIT – Real Estate Investment Trusts |
| * | Non-income producing security |
| (a) | All or a portion of security is on loan. The aggregate market value of the securities on loan is $4,424,471; cash collateral of $4,432,320 (included in liabilities) was received with which the Fund purchased highly liquid short-term investments. |
| (b) | Rate shown represents annualized 7-day yield as of June 30, 2012. |
The accompanying notes are an integral part of these financial statements.
| 22 |
RevenueShares Mid Cap Fund
June 30, 2012
| Investments | Shares | Value | ||||
| COMMON STOCKS—100.5% | ||||||
| Automobiles & Components—0.3% | ||||||
| Gentex Corp. | 4,919 | $ | 102,659 | |||
| Thor Industries, Inc. | 10,014 | 274,484 | ||||
| Total Automobiles & Components | 377,143 | |||||
| Banks—2.0% | ||||||
| Associated Banc-Corp. | 8,841 | 116,613 | ||||
| Astoria Financial Corp. | 8,909 | 87,308 | ||||
| BancorpSouth, Inc.(a) | 6,380 | 92,638 | ||||
| Bank of Hawaii Corp.(a) | 1,529 | 70,257 | ||||
| Cathay General Bancorp | 3,453 | 57,009 | ||||
| City National Corp. | 2,600 | 126,308 | ||||
| Commerce Bancshares, Inc. | 3,196 | 121,128 | ||||
| Cullen/Frost Bankers, Inc. | 1,757 | 101,010 | ||||
| East West Bancorp, Inc. | 5,282 | 123,916 | ||||
| First Niagara Financial Group, Inc. | 16,292 | 124,634 | ||||
| FirstMerit Corp. | 5,252 | 86,763 | ||||
| Fulton Financial Corp. | 9,867 | 98,571 | ||||
| Hancock Holding Co. | 2,441 | 74,304 | ||||
| International Bancshares Corp. | 3,406 | 66,485 | ||||
| New York Community Bancorp, Inc.(a) | 18,747 | 234,900 | ||||
| Prosperity Bancshares, Inc. | 1,103 | 46,359 | ||||
| Signature Bank* | 1,084 | 66,091 | ||||
| SVB Financial Group* | 1,701 | 99,883 | ||||
| Synovus Financial Corp. | 88,795 | 175,814 | ||||
| TCF Financial Corp. | 13,558 | 155,646 | ||||
| Trustmark Corp. | 2,514 | 61,543 | ||||
| Valley National Bancorp | 8,271 | 87,673 | ||||
| Washington Federal, Inc. | 4,391 | 74,164 | ||||
| Webster Financial Corp. | 4,523 | 97,968 | ||||
| Westamerica Bancorporation(a) | 640 | 30,202 | ||||
| Total Banks | 2,477,187 | |||||
| Capital Goods—14.8% | ||||||
| Acuity Brands, Inc. | 3,472 | 176,760 | ||||
| Aecom Technology Corp.* | 52,171 | 858,213 | ||||
| AGCO Corp.* | 21,534 | 984,750 | ||||
| Alliant Techsystems, Inc. | 10,815 | 546,915 | ||||
| AMETEK, Inc. | 6,069 | 302,904 | ||||
| BE Aerospace, Inc.* | 5,975 | 260,869 | ||||
| Carlisle Cos., Inc. | 6,322 | 335,192 | ||||
| CLARCOR, Inc. | 2,354 | 113,369 | ||||
| Crane Co. | 7,164 | 260,626 | ||||
| Donaldson Co., Inc. | 6,679 | 222,878 | ||||
| Esterline Technologies Corp.* | 2,831 | 176,513 | ||||
| Exelis, Inc. | 63,947 | 630,517 | ||||
| Fortune Brands Home & Security, Inc.* | 15,850 | 352,980 | ||||
| Gardner Denver, Inc. | 4,837 | 255,926 | ||||
| GATX Corp. | 3,502 | 134,827 | ||||
| General Cable Corp.* | 19,818 | 514,079 | ||||
| Graco, Inc. | 2,018 | 92,989 | ||||
| Granite Construction, Inc. | 8,464 | 220,995 | ||||
| Harsco Corp. | 17,417 | 354,958 | ||||
| Hubbell, Inc., Class B | 3,949 | 307,785 | ||||
| Huntington Ingalls Industries, Inc.* | 17,831 | 717,519 | ||||
| IDEX Corp. | 4,813 | 187,611 | ||||
| ITT Corp. | 67,069 | 1,180,414 | ||||
| KBR, Inc. | 40,476 | 1,000,162 | ||||
| Kennametal, Inc. | 7,521 | 249,321 | ||||
| Lennox International, Inc. | 8,315 | 387,728 | ||||
| Investments | Shares | Value | ||||
| Lincoln Electric Holdings, Inc. | 6,292 | $ | 275,527 | |||
| MSC Industrial Direct Co., Inc., Class A | 3,090 | 202,550 | ||||
| Nordson Corp. | 2,438 | 125,045 | ||||
| Oshkosh Corp.* | 39,261 | 822,518 | ||||
| Pentair, Inc. | 9,114 | 348,884 | ||||
| Regal-Beloit Corp. | 4,520 | 281,415 | ||||
| Shaw Group, Inc.* | 25,053 | 684,197 | ||||
| SPX Corp. | 8,790 | 574,163 | ||||
| Terex Corp.* | 33,832 | 603,225 | ||||
| Timken Co. | 11,910 | 545,359 | ||||
| Trinity Industries, Inc. | 12,215 | 305,131 | ||||
| Triumph Group, Inc. | 4,372 | 246,012 | ||||
| United Rentals, Inc.*(a) | 7,549 | 256,968 | ||||
| URS Corp. | 29,869 | 1,041,831 | ||||
| Valmont Industries, Inc. | 2,317 | 280,287 | ||||
| Wabtec Corp. | 2,607 | 203,372 | ||||
| Watsco, Inc. | 4,414 | 325,753 | ||||
| Woodward, Inc. | 4,575 | 180,438 | ||||
| Total Capital Goods | 18,129,475 | |||||
| Commercial & Professional Services—4.0% | ||||||
| Brink's Co. | 18,523 | 429,363 | ||||
| Clean Harbors, Inc.* | 3,373 | 190,305 | ||||
| Copart, Inc.* | 3,836 | 90,875 | ||||
| Corporate Executive Board Co. | 1,276 | 52,163 | ||||
| Corrections Corp. of America | 6,980 | 205,561 | ||||
| Deluxe Corp. | 6,180 | 154,129 | ||||
| FTI Consulting, Inc.* | 5,726 | 164,623 | ||||
| Herman Miller, Inc. | 9,713 | 179,885 | ||||
| HNI Corp. | 7,900 | 203,425 | ||||
| Korn/Ferry International* | 6,094 | 87,449 | ||||
| Manpower, Inc. | 63,322 | 2,320,751 | ||||
| Mine Safety Appliances Co. | 3,171 | 127,601 | ||||
| Monster Worldwide, Inc.*(a) | 12,770 | 108,545 | ||||
| Rollins, Inc. | 5,914 | 132,296 | ||||
| Towers Watson & Co., Class A | 5,716 | 342,388 | ||||
| Waste Connections, Inc. | 5,447 | 162,974 | ||||
| Total Commercial & Professional Services | 4,952,333 | |||||
| Consumer Durables & Apparel—2.9% | ||||||
| Carter's, Inc.* | 4,035 | 212,241 | ||||
| Deckers Outdoor Corp.*(a) | 2,779 | 122,304 | ||||
| Hanesbrands, Inc.* | 17,477 | 484,637 | ||||
| KB Home(a) | 16,623 | 162,905 | ||||
| MDC Holdings, Inc.(a) | 3,203 | 104,642 | ||||
| Mohawk Industries, Inc.* | 8,829 | 616,529 | ||||
| NVR, Inc.* | 369 | 313,650 | ||||
| Polaris Industries, Inc. | 3,769 | 269,408 | ||||
| PVH Corp. | 5,265 | 409,564 | ||||
| Tempur-Pedic International, Inc.*(a) | 2,600 | 60,814 | ||||
| Toll Brothers, Inc.* | 6,013 | 178,767 | ||||
| Tupperware Brands Corp. | 5,099 | 279,221 | ||||
| Under Armour, Inc., Class A* | 1,420 | 134,162 | ||||
| Warnaco Group, Inc.* | 6,120 | 260,590 | ||||
| Total Consumer Durables & Apparel | 3,609,434 | |||||
| Consumer Services—2.1% | ||||||
| Bally Technologies, Inc.* | 1,700 | 79,322 | ||||
| Bob Evans Farms, Inc. | 4,662 | 187,412 | ||||
| Brinker International, Inc. | 9,548 | 304,295 | ||||
| Cheesecake Factory, Inc.* | 5,882 | 187,989 | ||||
The accompanying notes are an integral part of these financial statements.
| 23 |
Schedule of Investments — continued
RevenueShares Mid Cap Fund
June 30, 2012
| Investments | Shares | Value | ||||
| Consumer Services (continued) | ||||||
| International Speedway Corp., Class A | 2,635 | $ | 68,984 | |||
| ITT Educational Services, Inc.*(a) | 2,950 | 179,213 | ||||
| Life Time Fitness, Inc.* | 2,378 | 110,601 | ||||
| Matthews International Corp., Class A | 2,924 | 95,001 | ||||
| Panera Bread Co., Class A* | 1,253 | 174,718 | ||||
| Regis Corp.(a) | 14,239 | 255,732 | ||||
| Scientific Games Corp., Class A* | 10,639 | 90,964 | ||||
| Service Corp. International | 20,575 | 254,513 | ||||
| Sotheby's(a) | 2,953 | 98,512 | ||||
| Strayer Education, Inc.(a) | 753 | 82,092 | ||||
| Wendy's Co. (The) | 57,288 | 270,399 | ||||
| WMS Industries, Inc.* | 4,313 | 86,044 | ||||
| Total Consumer Services | 2,525,791 | |||||
| Diversified Financials—1.3% | ||||||
| Affiliated Managers Group, Inc.* | 1,737 | 190,115 | ||||
| Apollo Investment Corp. | 3,259 | 25,029 | ||||
| CBOE Holdings, Inc. | 1,998 | 55,305 | ||||
| Eaton Vance Corp.(a) | 5,272 | 142,080 | ||||
| Greenhill & Co., Inc.(a) | 790 | 28,163 | ||||
| Janus Capital Group, Inc. | 14,505 | 113,429 | ||||
| Jefferies Group, Inc. | 28,850 | 374,762 | ||||
| MSCI, Inc., Class A* | 2,943 | 100,121 | ||||
| Raymond James Financial, Inc. | 10,458 | 358,082 | ||||
| SEI Investments Co. | 5,160 | 102,632 | ||||
| Waddell & Reed Financial, Inc., Class A | 4,297 | 130,113 | ||||
| Total Diversified Financials | 1,619,831 | |||||
| Energy—6.6% | ||||||
| Arch Coal, Inc.(a) | 65,949 | 454,389 | ||||
| Atwood Oceanics, Inc.* | 1,768 | 66,901 | ||||
| Bill Barrett Corp.* | 4,577 | 98,039 | ||||
| CARBO Ceramics, Inc.(a) | 796 | 61,077 | ||||
| Cimarex Energy Co. | 3,676 | 202,621 | ||||
| Dresser-Rand Group, Inc.* | 5,128 | 228,401 | ||||
| Dril-Quip, Inc.*(a) | 950 | 62,311 | ||||
| Forest Oil Corp.* | 11,845 | 86,824 | ||||
| Helix Energy Solutions Group, Inc.* | 8,782 | 144,113 | ||||
| Hollyfrontier Corp. | 40,841 | 1,446,997 | ||||
| Northern Oil and Gas, Inc.* | 730 | 11,636 | ||||
| Oceaneering International, Inc. | 4,931 | 235,998 | ||||
| Oil States International, Inc.* | 5,000 | 331,000 | ||||
| Patterson-UTI Energy, Inc. | 17,264 | 251,364 | ||||
| Plains Exploration & Production Co.* | 5,766 | 202,848 | ||||
| Quicksilver Resources, Inc.*(a) | 27,805 | 150,703 | ||||
| SM Energy Co. | 2,795 | 137,262 | ||||
| Superior Energy Services, Inc.* | 10,556 | 213,548 | ||||
| Tidewater, Inc. | 2,501 | 115,946 | ||||
| Unit Corp.* | 3,315 | 122,290 | ||||
| World Fuel Services Corp.(a) | 89,374 | 3,398,893 | ||||
| Total Energy | 8,023,161 | |||||
| Food & Staples Retailing—4.1% | ||||||
| Harris Teeter Supermarkets, Inc. | 12,362 | 506,718 | ||||
| SUPERVALU, Inc.(a) | 869,891 | 4,506,036 | ||||
| Total Food & Staples Retailing | 5,012,754 | |||||
| Food, Beverage & Tobacco—3.0% | ||||||
| Flowers Foods, Inc. | 12,757 | 296,345 | ||||
| Investments | Shares | Value | ||||
| Green Mountain Coffee Roasters, Inc.* | 11,682 | $ | 254,434 | |||
| Hillshire Brands Co. | 5,660 | 164,083 | ||||
| Ingredion, Inc. | 13,147 | 651,039 | ||||
| Lancaster Colony Corp.(a) | 1,704 | 121,342 | ||||
| Post Holdings, Inc.* | 3,366 | 103,505 | ||||
| Ralcorp Holdings, Inc.* | 7,602 | 507,357 | ||||
| Smithfield Foods, Inc.* | 60,600 | 1,310,778 | ||||
| Tootsie Roll Industries, Inc. | 2,409 | 57,479 | ||||
| Universal Corp. | 5,748 | 266,305 | ||||
| Total Food, Beverage & Tobacco | 3,732,667 | |||||
| Health Care Equipment & Services—9.2% | ||||||
| Allscripts Healthcare Solutions, Inc.* | 14,041 | 153,468 | ||||
| AMERIGROUP Corp.* | 10,648 | 701,810 | ||||
| Catalyst Health Solutions, Inc.* | 5,766 | 538,775 | ||||
| Community Health Systems, Inc.* | 59,324 | 1,662,852 | ||||
| Cooper Cos., Inc. | 1,752 | 139,739 | ||||
| Gen-Probe, Inc.* | 731 | 60,088 | ||||
| Health Management Associates, Inc., | ||||||
| Class A* | 85,482 | 671,034 | ||||
| Health Net, Inc.* | 54,775 | 1,329,389 | ||||
| Henry Schein, Inc.* | 11,419 | 896,277 | ||||
| Hill-Rom Holdings, Inc. | 5,415 | 167,053 | ||||
| HMS Holdings Corp.*(a) | 1,332 | 44,369 | ||||
| Hologic, Inc.* | 10,494 | 189,312 | ||||
| IDEXX Laboratories, Inc.*(a) | 1,368 | 131,506 | ||||
| LifePoint Hospitals, Inc.* | 9,695 | 397,301 | ||||
| Lincare Holdings, Inc.(a) | 7,507 | 255,388 | ||||
| Masimo Corp.* | 2,135 | 47,781 | ||||
| Mednax, Inc.* | 2,659 | 182,248 | ||||
| Omnicare, Inc. | 21,555 | 673,163 | ||||
| Owens & Minor, Inc. | 30,494 | 934,031 | ||||
| ResMed, Inc.* | 4,008 | 125,050 | ||||
| STERIS Corp. | 4,028 | 126,358 | ||||
| Teleflex, Inc. | 2,724 | 165,919 | ||||
| Thoratec Corp.* | 1,321 | 44,359 | ||||
| Universal Health Services, Inc., Class B | 19,362 | 835,664 | ||||
| VCA Antech, Inc.* | 7,452 | 163,795 | ||||
| WellCare Health Plans, Inc.* | 12,173 | 645,169 | ||||
| Total Health Care Equipment & Services | 11,281,898 | |||||
| Household & Personal Products—0.7% | ||||||
| Church & Dwight Co., Inc. | 5,433 | 301,369 | ||||
| Energizer Holdings, Inc.* | 6,734 | 506,733 | ||||
| Total Household & Personal Products | 808,102 | |||||
| Insurance—5.3% | ||||||
| Alleghany Corp.* | 304 | 103,284 | ||||
| American Financial Group, Inc. | 12,718 | 498,927 | ||||
| Arthur J. Gallagher & Co. | 6,291 | 220,625 | ||||
| Aspen Insurance Holdings Ltd. | 7,839 | 226,547 | ||||
| Brown & Brown, Inc. | 4,095 | 111,671 | ||||
| Everest Re Group Ltd. | 4,848 | 501,720 | ||||
| Fidelity National Financial, Inc., Class A | 30,121 | 580,130 | ||||
| First American Financial Corp. | 24,397 | 413,773 | ||||
| Hanover Insurance Group, Inc. | 10,367 | 405,661 | ||||
| HCC Insurance Holdings, Inc. | 7,962 | 250,007 | ||||
| Kemper Corp. | 9,091 | 279,548 | ||||
| Mercury General Corp. | 6,827 | 284,481 | ||||
| Old Republic International Corp. | 45,607 | 378,082 | ||||
The accompanying notes are an integral part of these financial statements.
| 24 |
Schedule of Investments — continued
RevenueShares Mid Cap Fund
June 30, 2012
| Investments | Shares | Value | ||||
| Insurance (continued) | ||||||
| Protective Life Corp. | 13,148 | $ | 386,683 | |||
| Reinsurance Group of America, Inc., | ||||||
| Class A | 17,772 | 945,648 | ||||
| StanCorp Financial Group, Inc. | 8,469 | 314,708 | ||||
| W.R. Berkley Corp. | 14,479 | 563,523 | ||||
| Total Insurance | 6,465,018 | |||||
| Materials—7.8% | ||||||
| Albemarle Corp. | 4,849 | 289,194 | ||||
| Aptargroup, Inc. | 4,825 | 246,316 | ||||
| Ashland, Inc. | 9,629 | 667,386 | ||||
| Cabot Corp. | 8,410 | 342,287 | ||||
| Carpenter Technology Corp. | 3,724 | 178,156 | ||||
| Commercial Metals Co. | 58,896 | 744,445 | ||||
| Compass Minerals International, Inc. | 1,765 | 134,634 | ||||
| Cytec Industries, Inc. | 5,439 | 318,943 | ||||
| Domtar Corp. | 7,848 | 602,020 | ||||
| Greif, Inc., Class A | 10,591 | 434,231 | ||||
| Intrepid Potash, Inc.*(a) | 2,279 | 51,870 | ||||
| Louisiana-Pacific Corp.*(a) | 14,045 | 152,810 | ||||
| Martin Marietta Materials, Inc.(a) | 2,751 | 216,834 | ||||
| Minerals Technologies, Inc. | 1,764 | 112,508 | ||||
| NewMarket Corp. | 1,090 | 236,094 | ||||
| Olin Corp. | 9,993 | 208,754 | ||||
| Packaging Corp. of America | 10,035 | 283,388 | ||||
| Reliance Steel & Aluminum Co. | 16,955 | 856,228 | ||||
| Rock-Tenn Co., Class A | 7,373 | 402,197 | ||||
| Royal Gold, Inc. | 283 | 22,187 | ||||
| RPM International, Inc. | 13,841 | 376,475 | ||||
| Scotts Miracle-Gro Co., Class A(a) | 7,692 | 316,295 | ||||
| Sensient Technologies Corp. | 4,265 | 156,653 | ||||
| Silgan Holdings, Inc. | 8,196 | 349,887 | ||||
| Sonoco Products Co. | 15,818 | 476,913 | ||||
| Steel Dynamics, Inc. | 56,230 | 660,703 | ||||
| Valspar Corp. | 8,344 | 437,977 | ||||
| Worthington Industries, Inc. | 14,340 | 293,540 | ||||
| Total Materials | 9,568,925 | |||||
| Media—1.4% | ||||||
| AMC Networks, Inc., Class A* | 3,150 | 111,983 | ||||
| Cinemark Holdings, Inc. | 11,270 | 257,519 | ||||
| DreamWorks Animation SKG, Inc., | ||||||
| Class A* | 4,561 | 86,933 | ||||
| John Wiley & Sons, Inc., Class A | 3,926 | 192,335 | ||||
| Lamar Advertising Co., Class A*(a) | 4,222 | 120,749 | ||||
| Meredith Corp. | 4,874 | 155,676 | ||||
| New York Times Co., Class A* | 36,614 | 285,589 | ||||
| Scholastic Corp. | 7,579 | 213,425 | ||||
| Valassis Communications, Inc.* | 11,926 | 259,390 | ||||
| Total Media | 1,683,599 | |||||
| Pharmaceuticals, Biotechnology & Life Sciences—1.2% | ||||||
| Bio-Rad Laboratories, Inc., Class A* | 2,187 | 218,722 | ||||
| Charles River Laboratories | ||||||
| International, Inc.* | 3,622 | 118,657 | ||||
| Covance, Inc.* | 4,994 | 238,963 | ||||
| Endo Health Solutions, Inc.* | 8,625 | 267,202 | ||||
| Medicis Pharmaceutical Corp., Class A | 2,330 | 79,570 | ||||
| Mettler-Toledo International, Inc.* | 1,545 | 240,788 | ||||
| Regeneron Pharmaceuticals, Inc.* | 425 | 48,543 | ||||
| Techne Corp. | 434 | 32,203 | ||||
| Investments | Shares | Value | ||||
| United Therapeutics Corp.* | 1,613 | $ | 79,650 | |||
| Vertex Pharmaceuticals, Inc.* | 1,676 | 93,722 | ||||
| Total Pharmaceuticals, Biotechnology | ||||||
| & Life Sciences | 1,418,020 | |||||
| Real Estate Investment Trusts—1.5% | ||||||
| Alexandria Real Estate Equities, Inc. | 857 | 62,321 | ||||
| American Campus Communities, Inc. | 945 | 42,506 | ||||
| BioMed Realty Trust, Inc., Class A | 2,526 | 47,186 | ||||
| BRE Properties, Inc. | 822 | 41,116 | ||||
| Camden Property Trust | 1,058 | 71,595 | ||||
| Corporate Office Properties Trust | 2,747 | 64,582 | ||||
| Duke Realty Corp. | 10,421 | 152,564 | ||||
| Equity One, Inc. | 1,576 | 33,411 | ||||
| Essex Property Trust, Inc. | 331 | 50,948 | ||||
| Federal Realty Investment Trust | 593 | 61,725 | ||||
| Highwoods Properties, Inc. | 1,538 | 51,754 | ||||
| Home Properties, Inc. | 1,017 | 62,403 | ||||
| Hospitality Properties Trust | 5,339 | 132,247 | ||||
| Liberty Property Trust | 2,041 | 75,190 | ||||
| Macerich Co. | 1,484 | 87,630 | ||||
| Mack-Cali Realty Corp. | 2,841 | 82,588 | ||||
| National Retail Properties, Inc. | 984 | 27,837 | ||||
| Omega Healthcare Investors, Inc. | 1,393 | 31,343 | ||||
| Potlatch Corp. | 1,924 | 61,453 | ||||
| Rayonier, Inc. | 3,477 | 156,117 | ||||
| Realty Income Corp. | 1,059 | 44,234 | ||||
| Regency Centers Corp. | 1,162 | 55,276 | ||||
| Senior Housing Properties Trust | 2,039 | 45,511 | ||||
| SL Green Realty Corp. | 1,716 | 137,692 | ||||
| Taubman Centers, Inc. | 954 | 73,611 | ||||
| UDR, Inc. | 2,931 | 75,737 | ||||
| Weingarten Realty Investors | 2,321 | 61,135 | ||||
| Total Real Estate Investment Trusts | 1,889,712 | |||||
| Real Estate Management & Development—0.3% | ||||||
| Jones Lang LaSalle, Inc. | 5,014 | 352,835 | ||||
| Retailing—7.4% | ||||||
| Aaron's, Inc. | 7,791 | 220,563 | ||||
| Advance Auto Parts, Inc. | 9,606 | 655,321 | ||||
| Aeropostale, Inc.* | 14,636 | 260,960 | ||||
| American Eagle Outfitters, Inc. | 16,881 | 333,062 | ||||
| ANN, Inc.* | 8,348 | 212,790 | ||||
| Ascena Retail Group, Inc.* | 15,896 | 295,984 | ||||
| Barnes & Noble, Inc.*(a) | 49,908 | 821,486 | ||||
| Chico's FAS, Inc. | 14,226 | 211,114 | ||||
| Collective Brands, Inc.* | 16,962 | 363,326 | ||||
| Dick's Sporting Goods, Inc. | 10,477 | 502,896 | ||||
| Foot Locker, Inc. | 18,128 | 554,354 | ||||
| Guess?, Inc.(a) | 8,875 | 269,534 | ||||
| HSN, Inc. | 8,495 | 342,773 | ||||
| LKQ Corp.* | 8,855 | 295,757 | ||||
| Office Depot, Inc.* | 555,985 | 1,200,928 | ||||
| PetSmart, Inc. | 8,791 | 599,370 | ||||
| RadioShack Corp.(a) | 65,301 | 250,756 | ||||
| Rent-A-Center, Inc., Class A | 8,707 | 293,774 | ||||
| Saks, Inc.*(a) | 28,503 | 303,557 | ||||
| Signet Jewelers Ltd. | 8,358 | 367,836 | ||||
| Tractor Supply Co. | 4,825 | 400,764 | ||||
| Williams-Sonoma, Inc. | 10,468 | 366,066 | ||||
| Total Retailing | 9,122,971 | |||||
The accompanying notes are an integral part of these financial statements.
| 25 |
Schedule of Investments — continued
RevenueShares Mid Cap Fund
June 30, 2012
| Investments | Shares | Value | ||||
| Semiconductors & Semiconductor Equipment—1.2% | ||||||
| Atmel Corp.* | 28,888 | $ | 193,550 | |||
| Cree, Inc.*(a) | 4,434 | 113,821 | ||||
| Cypress Semiconductor Corp.* | 7,570 | 100,075 | ||||
| Fairchild Semiconductor | ||||||
| International, Inc., Class A* | 12,293 | 173,331 | ||||
| Integrated Device Technology, Inc.* | 11,620 | 65,304 | ||||
| International Rectifier Corp.* | 6,006 | 120,060 | ||||
| Intersil Corp., Class A | 7,893 | 84,060 | ||||
| MEMC Electronic Materials, Inc.* | 143,962 | 312,397 | ||||
| RF Micro Devices, Inc.* | 27,988 | 118,949 | ||||
| Semtech Corp.* | 1,905 | 46,330 | ||||
| Silicon Laboratories, Inc.*(a) | 1,354 | 51,317 | ||||
| Skyworks Solutions, Inc.* | 5,121 | 140,162 | ||||
| Total Semiconductors & | ||||||
| Semiconductor Equipment | 1,519,356 | |||||
| Software & Services—3.7% | ||||||
| ACI Worldwide, Inc.* | 1,203 | 53,185 | ||||
| Acxiom Corp.* | 8,795 | 132,893 | ||||
| Advent Software, Inc.* | 1,275 | 34,565 | ||||
| Alliance Data Systems Corp.*(a) | 2,538 | 342,630 | ||||
| ANSYS, Inc.*(a) | 1,104 | 69,673 | ||||
| AOL, Inc.* | 9,092 | 255,303 | ||||
| Broadridge Financial Solutions, Inc. | 11,090 | 235,884 | ||||
| Cadence Design Systems, Inc.* | 10,998 | 120,868 | ||||
| Compuware Corp.* | 10,644 | 98,883 | ||||
| Concur Technologies, Inc.* | 522 | 35,548 | ||||
| Convergys Corp. | 16,931 | 250,071 | ||||
| CoreLogic, Inc.* | 9,078 | 166,218 | ||||
| DST Systems, Inc. | 4,743 | 257,592 | ||||
| Equinix, Inc.* | 961 | 168,800 | ||||
| Factset Research Systems, Inc.(a) | 807 | 75,003 | ||||
| Fair Isaac Corp. | 1,557 | 65,830 | ||||
| Gartner, Inc.* | 3,585 | 154,334 | ||||
| Global Payments, Inc. | 4,548 | 196,610 | ||||
| Informatica Corp.* | 1,888 | 79,976 | ||||
| Jack Henry & Associates, Inc. | 3,024 | 104,389 | ||||
| Lender Processing Services, Inc. | 10,097 | 255,252 | ||||
| Mantech International Corp., Class A | 8,713 | 204,494 | ||||
| Mentor Graphics Corp.* | 6,117 | 91,755 | ||||
| MICROS Systems, Inc.* | 2,005 | 102,656 | ||||
| NeuStar, Inc., Class A* | 2,039 | 68,103 | ||||
| Parametric Technology Corp.* | 5,457 | 114,379 | ||||
| Quest Software, Inc.* | 3,371 | 93,882 | ||||
| Rackspace Hosting, Inc.* | 2,328 | 102,292 | ||||
| Rovi Corp.* | 3,425 | 67,199 | ||||
| Solera Holdings, Inc. | 1,670 | 69,789 | ||||
| Synopsys, Inc.* | 5,641 | 166,015 | ||||
| TIBCO Software, Inc.* | 3,474 | 103,942 | ||||
| ValueClick, Inc.* | 3,393 | 55,611 | ||||
| VeriFone Systems, Inc.* | 3,846 | 127,264 | ||||
| Wright Express Corp.* | 927 | 57,214 | ||||
| Total Software & Services | 4,578,102 | |||||
| Investments | Shares | Value | ||||
| Technology Hardware & Equipment—11.3% | ||||||
| ADTRAN, Inc. | 2,511 | $ | 75,807 | |||
| Arrow Electronics, Inc.* | 65,604 | 2,152,467 | ||||
| Avnet, Inc.* | 83,377 | 2,573,014 | ||||
| Ciena Corp.*(a) | 11,633 | 190,432 | ||||
| Diebold, Inc. | 8,015 | 295,834 | ||||
| Ingram Micro, Inc., Class A* | 223,986 | 3,913,035 | ||||
| Itron, Inc.* | 6,502 | 268,143 | ||||
| National Instruments Corp. | 3,979 | 106,876 | ||||
| NCR Corp.* | 25,927 | 589,321 | ||||
| Plantronics, Inc. | 2,323 | 77,588 | ||||
| Polycom, Inc.* | 14,320 | 150,646 | ||||
| QLogic Corp.* | 4,452 | 60,948 | ||||
| Riverbed Technology, Inc.* | 4,312 | 69,639 | ||||
| Tech Data Corp.* | 53,348 | 2,569,773 | ||||
| Tellabs, Inc. | 43,514 | 144,902 | ||||
| Trimble Navigation Ltd.* | 3,377 | 155,376 | ||||
| Vishay Intertechnology, Inc.* | 29,845 | 281,438 | ||||
| Zebra Technologies Corp., Class A* | 3,169 | 108,887 | ||||
| Total Technology Hardware & Equipment | 13,784,126 | |||||
| Telecommunication Services—0.6% | ||||||
| Telephone & Data Systems, Inc. | 26,394 | 561,928 | ||||
| tw Telecom, Inc., Class A* | 5,821 | 149,367 | ||||
| Total Telecommunication Services | 711,295 | |||||
| Transportation—3.5% | ||||||
| Alaska Air Group, Inc.* | 12,709 | 456,253 | ||||
| Alexander & Baldwin Holdings, Inc.* | 19,479 | 1,037,257 | ||||
| Con-Way, Inc. | 15,112 | 545,694 | ||||
| JB Hunt Transport Services, Inc. | 7,673 | 457,311 | ||||
| JetBlue Airways Corp.*(a) | 87,946 | 466,114 | ||||
| Kansas City Southern | 3,142 | 218,558 | ||||
| Kirby Corp.* | 3,327 | 156,635 | ||||
| Landstar System, Inc. | 5,226 | 270,289 | ||||
| UTi Worldwide, Inc. | 32,304 | 471,961 | ||||
| Werner Enterprises, Inc. | 8,671 | 207,150 | ||||
| Total Transportation | 4,287,222 | |||||
| Utilities—4.3% | ||||||
| Alliant Energy Corp. | 8,706 | 396,732 | ||||
| Aqua America, Inc. | 3,240 | 80,870 | ||||
| Atmos Energy Corp. | 13,937 | 488,771 | ||||
| Black Hills Corp. | 4,821 | 155,092 | ||||
| Cleco Corp. | 2,974 | 124,403 | ||||
| Energen Corp. | 3,930 | 177,361 | ||||
| Great Plains Energy, Inc. | 11,913 | 255,057 | ||||
| Hawaiian Electric Industries, Inc. | 11,870 | 338,532 | ||||
| IDACORP, Inc. | 2,716 | 114,289 | ||||
| MDU Resources Group, Inc. | 20,136 | 435,139 | ||||
| National Fuel Gas Co. | 4,201 | 197,363 | ||||
| NV Energy, Inc. | 18,421 | 323,841 | ||||
| OGE Energy Corp. | 7,795 | 403,703 | ||||
| PNM Resources, Inc. | 9,932 | 194,071 | ||||
| Questar Corp. | 6,452 | 134,589 | ||||
The accompanying notes are an integral part of these financial statements.
| 26 |
Schedule of Investments — continued
RevenueShares Mid Cap Fund
June 30, 2012
| Investments | Shares | Value | ||||
| Utilities (continued) | ||||||
| UGI Corp. | 22,294 | $ | 656,113 | |||
| Vectren Corp. | 8,272 | 244,190 | ||||
| Westar Energy, Inc. | 7,816 | 234,089 | ||||
| WGL Holdings, Inc. | 7,416 | 294,786 | ||||
| Total Utilities | 5,248,991 | |||||
| Total Common Stocks | ||||||
| (Cost $108,819,208) | 123,179,948 | |||||
| INVESTMENT OF CASH COLLATERAL | ||||||
| FOR SECURITIES LOANED—4.9% | ||||||
| Dreyfus Institutional Preferred | ||||||
| Money Market Fund— | ||||||
| Prime Shares, 0.16%(b) | ||||||
| (Cost $5,937,980) | 5,937,980 | 5,937,980 | ||||
| Total Investments—105.4% | ||||||
| (Cost $114,757,188) | 129,117,928 | |||||
| Liabilities in Excess of Other Assets—(5.4)% | (6,560,469 | ) | ||||
| Net Assets—100.0% | $ | 122,557,459 | ||||
| * | Non-income producing security |
| (a) | All or a portion of security is on loan. The aggregate market value of the securities on loan is $5,939,386; cash collateral of $5,937,980 (included in liabilities) was received with which the Fund purchased highly liquid short-term investments. |
| (b) | Rate shown represents annualized 7-day yield as of June 30, 2012. |
The accompanying notes are an integral part of these financial statements.
| 27 |
RevenueShares Small Cap Fund
June 30, 2012
| Investments | Shares | Value | ||||
| COMMON STOCKS—100.0% | ||||||
| Automobiles & Components—0.6% | ||||||
| Drew Industries, Inc.* | 4,541 | $ | 126,467 | |||
| Spartan Motors, Inc. | 17,963 | 94,126 | ||||
| Standard Motor Products, Inc. | 12,500 | 176,000 | ||||
| Superior Industries International, Inc. | 9,253 | 151,472 | ||||
| Winnebago Industries, Inc.* | 9,675 | 98,588 | ||||
| Total Automobiles & Components | 646,653 | |||||
| Banks—2.7% | ||||||
| Bank Mutual Corp. | 5,432 | 23,955 | ||||
| Bank of the Ozarks, Inc. | 1,673 | 50,324 | ||||
| BBCN Bancorp, Inc.* | 3,146 | 34,260 | ||||
| Boston Private Financial Holdings, Inc. | 8,470 | 75,637 | ||||
| Brookline Bancorp, Inc. | 3,156 | 27,931 | ||||
| City Holding Co. | 1,044 | 35,172 | ||||
| Columbia Banking System, Inc. | 2,546 | 47,916 | ||||
| Community Bank System, Inc. | 2,623 | 71,136 | ||||
| CVB Financial Corp. | 5,510 | 64,191 | ||||
| Dime Community Bancshares | 3,147 | 41,824 | ||||
| First BanCorp*(a) | 42,962 | 170,129 | ||||
| First Commonwealth Financial Corp. | 8,872 | 59,709 | ||||
| First Financial Bancorp | 5,802 | 92,716 | ||||
| First Financial Bankshares, Inc. | 1,272 | 43,960 | ||||
| First Midwest Bancorp, Inc. | 8,040 | 88,279 | ||||
| FNB Corp. | 9,407 | 102,254 | ||||
| Glacier Bancorp, Inc. | 4,778 | 74,011 | ||||
| Hanmi Financial Corp.* | 3,056 | 32,027 | ||||
| Home BancShares, Inc. | 1,401 | 42,843 | ||||
| Independent Bank Corp. | 1,748 | 51,059 | ||||
| National Penn Bancshares, Inc. | 9,831 | 94,083 | ||||
| NBT Bancorp, Inc. | 3,062 | 66,109 | ||||
| Northwest Bancshares, Inc. | 7,425 | 86,947 | ||||
| Old National Bancorp | 8,273 | 99,359 | ||||
| Oritani Financial Corp. | 1,669 | 24,017 | ||||
| PacWest Bancorp | 2,774 | 65,661 | ||||
| Pinnacle Financial Partners, Inc.* | 2,489 | 48,560 | ||||
| PrivateBancorp, Inc. | 7,885 | 116,383 | ||||
| Provident Financial Services, Inc. | 4,095 | 62,858 | ||||
| S&T Bancorp, Inc. | 2,402 | 44,365 | ||||
| Simmons First National Corp., Class A | 1,579 | 36,712 | ||||
| Sterling Bancorp, Class N | 2,889 | 28,832 | ||||
| Susquehanna Bancshares, Inc. | 14,970 | 154,191 | ||||
| Texas Capital Bancshares, Inc.* | 1,620 | 65,432 | ||||
| Tompkins Financial Corp. | 1,018 | 38,358 | ||||
| TrustCo Bank Corp. | 6,649 | 36,303 | ||||
| UMB Financial Corp. | 3,050 | 156,251 | ||||
| Umpqua Holdings Corp. | 9,295 | 122,322 | ||||
| United Bankshares, Inc.(a) | 2,868 | 74,224 | ||||
| United Community Banks, Inc.* | 7,821 | 67,026 | ||||
| ViewPoint Financial Group, Inc. | 1,955 | 30,576 | ||||
| Wilshire Bancorp, Inc.* | 5,979 | 32,765 | ||||
| Wintrust Financial Corp. | 4,194 | 148,887 | ||||
| Total Banks | 2,929,554 | |||||
| Capital Goods—11.7% | ||||||
| A.O. Smith Corp. | 6,640 | 324,630 | ||||
| AAON, Inc. | 2,680 | 50,518 | ||||
| AAR Corp. | 27,912 | 376,254 | ||||
| Actuant Corp., Class A | 10,081 | 273,800 | ||||
| Aegion Corp., Class A* | 10,896 | 194,929 | ||||
| Investments | Shares | Value | ||||
| Aerovironment, Inc.* | 2,249 | $ | 59,171 | |||
| Albany International Corp., Class A | 10,560 | 197,578 | ||||
| American Science & Engineering, Inc. | 1,043 | 58,877 | ||||
| Apogee Enterprises, Inc. | 7,611 | 122,309 | ||||
| Applied Industrial Technologies, Inc. | 11,676 | 430,261 | ||||
| Astec Industries, Inc.* | 6,073 | 186,320 | ||||
| AZZ, Inc. | 1,352 | 82,824 | ||||
| Barnes Group, Inc. | 10,170 | 247,029 | ||||
| Belden, Inc. | 11,773 | 392,630 | ||||
| Brady Corp., Class A | 9,401 | 258,621 | ||||
| Briggs & Stratton Corp. | 24,424 | 427,176 | ||||
| Cascade Corp. | 1,585 | 74,574 | ||||
| Ceradyne, Inc. | 4,011 | 102,882 | ||||
| CIRCOR International, Inc. | 1,276 | 43,499 | ||||
| Comfort Systems USA, Inc. | 24,819 | 248,686 | ||||
| Cubic Corp. | 5,654 | 271,844 | ||||
| Curtiss-Wright Corp. | 12,719 | 394,925 | ||||
| Dycom Industries, Inc.* | 11,014 | 204,971 | ||||
| EMCOR Group, Inc. | 39,495 | 1,098,751 | ||||
| Encore Wire Corp. | 9,254 | 247,822 | ||||
| EnerSys* | 10,878 | 381,491 | ||||
| EnPro Industries, Inc.* | 5,265 | 196,753 | ||||
| ESCO Technologies, Inc. | 3,937 | 143,464 | ||||
| Federal Signal Corp.* | 31,650 | 184,836 | ||||
| Franklin Electric Co., Inc. | 3,207 | 163,974 | ||||
| GenCorp, Inc.* | 28,721 | 186,974 | ||||
| Gibraltar Industries, Inc.* | 14,372 | 149,181 | ||||
| Griffon Corp. | 41,379 | 355,032 | ||||
| II-VI, Inc.* | 5,627 | 93,802 | ||||
| John Bean Technologies Corp. | 13,805 | 187,334 | ||||
| Kaman Corp. | 9,511 | 294,270 | ||||
| Kaydon Corp. | 4,200 | 89,838 | ||||
| Lawson Products, Inc. | 7,004 | 64,787 | ||||
| Lindsay Corp. | 1,537 | 99,751 | ||||
| Lydall, Inc.* | 6,007 | 81,215 | ||||
| Moog, Inc., Class A* | 11,528 | 476,683 | ||||
| Mueller Industries, Inc. | 11,741 | 500,049 | ||||
| National Presto Industries, Inc. | 1,296 | 90,422 | ||||
| NCI Building Systems, Inc.* | 18,445 | 199,759 | ||||
| Orbital Sciences Corp.* | 21,641 | 279,602 | ||||
| Orion Marine Group, Inc.* | 8,352 | 58,130 | ||||
| Powell Industries, Inc.* | 2,752 | 102,815 | ||||
| Quanex Building Products Corp. | 9,187 | 164,264 | ||||
| Robbins & Myers, Inc. | 3,238 | 135,413 | ||||
| Simpson Manufacturing Co., Inc. | 4,120 | 121,581 | ||||
| Standex International Corp. | 2,878 | 122,516 | ||||
| Teledyne Technologies, Inc.* | 6,079 | 374,770 | ||||
| Tennant Co. | 3,516 | 140,464 | ||||
| Toro Co. | 4,926 | 361,027 | ||||
| Universal Forest Products, Inc. | 9,168 | 357,369 | ||||
| Vicor Corp. | 8,232 | 57,130 | ||||
| Watts Water Technologies, Inc., Class A(a) | 8,207 | 273,621 | ||||
| Total Capital Goods | 12,859,198 | |||||
| Commercial & Professional Services—5.9% | ||||||
| ABM Industries, Inc. | 38,664 | 756,268 | ||||
| CDI Corp. | 12,540 | 205,656 | ||||
| Consolidated Graphics, Inc.* | 7,184 | 208,695 | ||||
| Dolan Co.* | 7,871 | 52,972 | ||||
| Encore Capital Group, Inc.* | 3,075 | 91,081 | ||||
| Exponent, Inc.* | 1,048 | 55,366 | ||||
The accompanying notes are an integral part of these financial statements.
| 28 |
Schedule of Investments — continued
RevenueShares Small Cap Fund
June 30, 2012
| Investments | Shares | Value | ||||
| Commercial & Professional Services (continued) | ||||||
| G&K Services, Inc., Class A | 5,525 | $ | 172,325 | |||
| Geo Group, Inc.* | 14,525 | 330,008 | ||||
| Healthcare Services Group, Inc.(a) | 8,757 | 169,711 | ||||
| Heidrick & Struggles International, Inc. | 6,503 | 113,802 | ||||
| Insperity, Inc. | 14,565 | 393,983 | ||||
| Interface, Inc. | 17,850 | 243,296 | ||||
| Kelly Services, Inc., Class A | 71,831 | 927,338 | ||||
| Mobile Mini, Inc.* | 5,138 | 73,987 | ||||
| Navigant Consulting, Inc.* | 13,187 | 166,684 | ||||
| On Assignment, Inc.* | 6,668 | 106,421 | ||||
| Portfolio Recovery Associates, Inc.* | 1,033 | 94,272 | ||||
| Resources Connection, Inc. | 8,755 | 107,686 | ||||
| Sykes Enterprises, Inc.* | 12,409 | 198,048 | ||||
| Tetra Tech, Inc.* | 12,554 | 327,408 | ||||
| TrueBlue, Inc.* | 17,100 | 264,708 | ||||
| UniFirst Corp. | 3,706 | 236,258 | ||||
| United Stationers, Inc. | 38,174 | 1,028,789 | ||||
| Viad Corp. | 9,823 | 196,460 | ||||
| Total Commercial & Professional Services | 6,521,222 | |||||
| Consumer Durables & Apparel—4.9% | ||||||
| American Greetings Corp., Class A | 21,901 | 320,193 | ||||
| Arctic Cat, Inc.* | 2,725 | 99,626 | ||||
| Blyth, Inc. | 4,598 | 158,907 | ||||
| Brunswick Corp. | 33,759 | 750,125 | ||||
| Callaway Golf Co. | 31,289 | 184,918 | ||||
| Crocs, Inc.* | 11,942 | 192,863 | ||||
| Ethan Allen Interiors, Inc. | 6,679 | 133,112 | ||||
| Fifth & Pacific Cos., Inc.*(a) | 35,474 | 380,636 | ||||
| Helen of Troy Ltd.* | 4,285 | 145,219 | ||||
| Iconix Brand Group, Inc.*(a) | 4,295 | 75,034 | ||||
| iRobot Corp.* | 4,082 | 90,416 | ||||
| Jakks Pacific, Inc.(a) | 7,979 | 127,744 | ||||
| K-Swiss, Inc., Class A* | 15,550 | 47,894 | ||||
| La-Z-Boy, Inc., Class Z* | 19,972 | 245,456 | ||||
| M/I Homes, Inc.* | 7,554 | 130,835 | ||||
| Maidenform Brands, Inc.* | 6,259 | 124,679 | ||||
| Meritage Homes Corp.* | 5,253 | 178,287 | ||||
| Movado Group, Inc. | 2,750 | 68,805 | ||||
| Oxford Industries, Inc. | 2,446 | 109,336 | ||||
| Perry Ellis International, Inc.* | 7,555 | 156,766 | ||||
| Quiksilver, Inc.* | 144,665 | 337,069 | ||||
| Ryland Group, Inc. | 7,322 | 187,297 | ||||
| Skechers U.S.A., Inc., Class A*(a) | 13,829 | 281,697 | ||||
| Standard Pacific Corp.* | 29,345 | 181,646 | ||||
| Steven Madden Ltd.* | 4,570 | 145,097 | ||||
| Sturm Ruger & Co., Inc. | 1,538 | 61,751 | ||||
| True Religion Apparel, Inc. | 2,777 | 80,477 | ||||
| Universal Electronics, Inc.* | 7,406 | 97,537 | ||||
| Wolverine World Wide, Inc. | 7,134 | 276,657 | ||||
| Total Consumer Durables & Apparel | 5,370,079 | |||||
| Consumer Services—5.0% | ||||||
| American Public Education, Inc.* | 1,541 | 49,312 | ||||
| Biglari Holdings, Inc.* | 364 | 140,646 | ||||
| BJ's Restaurants, Inc.*(a) | 2,938 | 111,644 | ||||
| Boyd Gaming Corp.*(a) | 59,256 | 426,643 | ||||
| Buffalo Wild Wings, Inc.* | 1,691 | 146,508 | ||||
| Capella Education Co.* | 2,569 | 89,298 | ||||
| Career Education Corp.* | 66,553 | 445,240 | ||||
| Investments | Shares | Value | ||||
| CEC Entertainment, Inc. | 4,702 | $ | 171,012 | |||
| Coinstar, Inc.*(a) | 5,143 | 353,118 | ||||
| Corinthian Colleges, Inc.* | 138,397 | 399,967 | ||||
| Cracker Barrel Old Country Store, Inc. | 8,024 | 503,907 | ||||
| DineEquity, Inc.* | 4,960 | 221,414 | ||||
| Hillenbrand, Inc. | 9,431 | 173,342 | ||||
| Interval Leisure Group, Inc. | 4,656 | 88,511 | ||||
| Jack in the Box, Inc.* | 16,515 | 460,438 | ||||
| Lincoln Educational Services Corp. | 9,289 | 60,379 | ||||
| Marcus Corp. | 5,316 | 73,148 | ||||
| Monarch Casino & Resort, Inc.* | 3,175 | 29,019 | ||||
| Multimedia Games Holding Co., Inc.* | 1,764 | 24,696 | ||||
| Papa John's International, Inc.* | 5,059 | 240,657 | ||||
| Peet's Coffee & Tea, Inc.*(a) | 1,091 | 65,504 | ||||
| Pinnacle Entertainment, Inc.* | 23,020 | 221,452 | ||||
| Red Robin Gourmet Burgers, Inc.* | 5,788 | 176,592 | ||||
| Ruby Tuesday, Inc.* | 34,658 | 236,021 | ||||
| Ruth's Hospitality Group, Inc.* | 11,495 | 75,867 | ||||
| Shuffle Master, Inc.* | 3,189 | 44,008 | ||||
| Sonic Corp.* | 11,636 | 116,593 | ||||
| Texas Roadhouse, Inc. | 11,802 | 217,511 | ||||
| Universal Technical Institute, Inc. | 7,201 | 97,286 | ||||
| Total Consumer Services | 5,459,733 | |||||
| Diversified Financials—1.5% | ||||||
| Calamos Asset Management, | ||||||
| Inc., Class A | 6,406 | 73,349 | ||||
| Cash America International, Inc. | 6,746 | 297,094 | ||||
| Ezcorp, Inc., Class A* | 7,264 | 170,413 | ||||
| Financial Engines, Inc.* | 1,279 | 27,435 | ||||
| First Cash Financial Services, Inc.* | 2,576 | 103,478 | ||||
| Interactive Brokers Group, Inc., Class A | 17,742 | 261,162 | ||||
| Investment Technology Group, Inc.* | 12,389 | 113,979 | ||||
| Piper Jaffray Cos.* | 4,856 | 113,776 | ||||
| Prospect Capital Corp. | 3,050 | 34,739 | ||||
| Stifel Financial Corp.* | 9,355 | 289,069 | ||||
| SWS Group, Inc. | 14,124 | 75,281 | ||||
| Virtus Investment Partners, Inc.* | 503 | 40,743 | ||||
| World Acceptance Corp.* | 1,392 | 91,594 | ||||
| Total Diversified Financials | 1,692,112 | |||||
| Energy—3.2% | ||||||
| Approach Resources, Inc.* | 781 | 19,947 | ||||
| Basic Energy Services, Inc.* | 21,413 | 220,982 | ||||
| Bristow Group, Inc. | 5,976 | 243,044 | ||||
| Cloud Peak Energy, Inc.* | 11,500 | 194,465 | ||||
| Comstock Resources, Inc.* | 5,049 | 82,905 | ||||
| Contango Oil & Gas Co.* | 686 | 40,611 | ||||
| Exterran Holdings, Inc.* | 42,411 | 540,740 | ||||
| GeoResources, Inc.* | 6,307 | 230,899 | ||||
| Gulf Island Fabrication, Inc. | 1,925 | 54,304 | ||||
| Gulfport Energy Corp.* | 2,227 | 45,943 | ||||
| Hornbeck Offshore Services, Inc. | 1,995 | 77,366 | ||||
| ION Geophysical Corp.* | 13,639 | 89,881 | ||||
| Lufkin Industries, Inc. | 3,049 | 165,622 | ||||
| Matrix Service Co.* | 10,965 | 124,453 | ||||
| Overseas Shipholding Group, Inc. | 18,771 | 208,546 | ||||
| OYO Geospace Corp.* | 397 | 35,726 | ||||
| PDC Energy, Inc.* | 3,187 | 78,145 | ||||
| Penn Virginia Corp. | 8,360 | 61,362 | ||||
The accompanying notes are an integral part of these financial statements.
| 29 |
Schedule of Investments — continued
RevenueShares Small Cap Fund
June 30, 2012
| Investments | Shares | Value | ||||
| Energy (continued) | ||||||
| Petroquest Energy, Inc.* | 6,853 | $ | 34,265 | |||
| Pioneer Drilling Co.* | 15,930 | 126,962 | ||||
| SEACOR Holdings, Inc.* | 4,968 | 444,040 | ||||
| Stone Energy Corp.* | 6,689 | 169,499 | ||||
| Swift Energy Co.* | 6,632 | 123,422 | ||||
| TETRA Technologies, Inc.* | 10,578 | 75,421 | ||||
| Total Energy | 3,488,550 | |||||
| Food & Staples Retailing—4.0% | ||||||
| Andersons, Inc. | 20,412 | 870,776 | ||||
| Casey's General Stores, Inc.(a) | 19,044 | 1,123,406 | ||||
| Nash Finch Co. | 47,138 | 1,012,524 | ||||
| Spartan Stores, Inc. | 28,288 | 512,862 | ||||
| United Natural Foods, Inc.* | 16,247 | 891,310 | ||||
| Total Food & Staples Retailing | 4,410,878 | |||||
| Food, Beverage & Tobacco—2.9% | ||||||
| Alliance One International, Inc.* | 126,064 | 436,181 | ||||
| B&G Foods, Inc., Class A | 3,901 | 103,767 | ||||
| Boston Beer Co., Inc., Class A*(a) | 830 | 100,430 | ||||
| Calavo Growers, Inc. | 3,882 | 99,302 | ||||
| Cal-Maine Foods, Inc. | 4,802 | 187,758 | ||||
| Darling International, Inc.* | 20,560 | 339,034 | ||||
| Diamond Foods, Inc.(a) | 9,741 | 173,779 | ||||
| Hain Celestial Group, Inc.* | 3,926 | 216,087 | ||||
| J&J Snack Foods Corp. | 2,478 | 146,450 | ||||
| Sanderson Farms, Inc. | 7,407 | 339,389 | ||||
| Seneca Foods Corp., Class A* | 9,608 | 258,455 | ||||
| Snyders-Lance, Inc. | 11,833 | 298,547 | ||||
| TreeHouse Foods, Inc.* | 6,817 | 424,631 | ||||
| Total Food, Beverage & Tobacco | 3,123,810 | |||||
| Health Care Equipment & Services—8.5% | ||||||
| Abaxis, Inc.* | 781 | 28,897 | ||||
| Air Methods Corp.* | 1,372 | 134,799 | ||||
| Align Technology, Inc.*(a) | 2,551 | 85,356 | ||||
| Almost Family, Inc.* | 3,152 | 70,416 | ||||
| Amedisys, Inc.* | 12,709 | 158,227 | ||||
| AMN Healthcare Services, Inc.* | 30,357 | 180,017 | ||||
| Amsurg Corp.* | 5,004 | 150,020 | ||||
| Analogic Corp. | 1,421 | 88,102 | ||||
| Bio-Reference Labs, Inc.* | 4,207 | 110,560 | ||||
| Cantel Medical Corp. | 2,237 | 60,958 | ||||
| Centene Corp.* | 33,148 | 999,744 | ||||
| Chemed Corp.(a) | 4,384 | 264,969 | ||||
| Computer Programs & Systems, Inc. | 614 | 35,133 | ||||
| CONMED Corp. | 5,165 | 142,916 | ||||
| Corvel Corp.* | 1,580 | 77,420 | ||||
| Cross Country Healthcare, Inc.* | 22,817 | 99,710 | ||||
| CryoLife, Inc.* | 4,837 | 25,298 | ||||
| Cyberonics, Inc.* | 830 | 37,300 | ||||
| Ensign Group, Inc. | 5,237 | 148,050 | ||||
| Gentiva Health Services, Inc.* | 54,990 | 381,081 | ||||
| Greatbatch, Inc.* | 5,157 | 117,115 | ||||
| Haemonetics Corp.* | 1,854 | 137,400 | ||||
| Hanger, Inc.* | 7,371 | 188,992 | ||||
| Healthways, Inc.* | 18,431 | 147,079 | ||||
| ICU Medical, Inc.* | 1,135 | 60,586 | ||||
| Integra LifeSciences Holdings Corp.* | 4,121 | 153,219 | ||||
| Invacare Corp. | 22,917 | 353,609 | ||||
| Investments | Shares | Value | ||||
| IPC The Hospitalist Co., Inc.* | 2,070 | $ | 93,812 | |||
| Kindred Healthcare, Inc.* | 96,828 | 951,819 | ||||
| Landauer, Inc. | 439 | 25,168 | ||||
| LHC Group, Inc.* | 7,474 | 126,759 | ||||
| Magellan Health Services, Inc.* | 12,999 | 589,245 | ||||
| Medidata Solutions, Inc.* | 1,212 | 39,596 | ||||
| Meridian Bioscience, Inc. | 1,504 | 30,772 | ||||
| Merit Medical Systems, Inc.* | 5,247 | 72,461 | ||||
| Molina Healthcare, Inc.* | 39,325 | 922,565 | ||||
| MWI Veterinary Supply, Inc.* | 3,022 | 310,571 | ||||
| Natus Medical, Inc.* | 4,042 | 46,968 | ||||
| Neogen Corp.* | 761 | 35,158 | ||||
| NuVasive, Inc.* | 4,480 | 113,613 | ||||
| Omnicell, Inc.* | 3,270 | 47,873 | ||||
| Palomar Medical Technologies, Inc.* | 2,233 | 18,981 | ||||
| PharMerica Corp.* | 39,135 | 427,354 | ||||
| PSS World Medical, Inc.* | 18,852 | 395,703 | ||||
| Quality Systems, Inc. | 10,645 | 292,844 | ||||
| SurModics, Inc.* | 737 | 12,750 | ||||
| Symmetry Medical, Inc.* | 8,812 | 75,607 | ||||
| West Pharmaceutical Services, Inc. | 4,667 | 235,637 | ||||
| Total Health Care Equipment & Services | 9,302,229 | |||||
| Household & Personal Products—0.6% | ||||||
| Central Garden and Pet Co., Class A* | 33,262 | 362,223 | ||||
| Inter Parfums, Inc. | 6,218 | 107,385 | ||||
| Medifast, Inc.* | 2,906 | 57,190 | ||||
| Prestige Brands Holdings, Inc.* | 4,297 | 67,936 | ||||
| WD-40 Co. | 1,316 | 65,550 | ||||
| Total Household & Personal Products | 660,284 | |||||
| Insurance—2.5% | ||||||
| AMERISAFE, Inc.* | 10,426 | 270,555 | ||||
| eHealth, Inc.* | 2,016 | 32,478 | ||||
| Employers Holdings, Inc. | 4,985 | 89,929 | ||||
| Horace Mann Educators Corp. | 10,973 | 191,808 | ||||
| Infinity Property & Casualty Corp. | 3,620 | 208,765 | ||||
| Meadowbrook Insurance Group, Inc. | 18,295 | 160,813 | ||||
| National Financial Partners Corp.* | 15,229 | 204,069 | ||||
| Navigators Group, Inc.* | 3,108 | 155,555 | ||||
| Presidential Life Corp. | 5,945 | 58,439 | ||||
| ProAssurance Corp. | 1,635 | 145,662 | ||||
| RLI Corp. | 1,768 | 120,578 | ||||
| Safety Insurance Group, Inc. | 3,084 | 125,334 | ||||
| Selective Insurance Group, Inc. | 18,075 | 314,686 | ||||
| Stewart Information Services Corp. | 21,922 | 336,503 | ||||
| Tower Group, Inc. | 11,387 | 237,647 | ||||
| United Fire Group, Inc. | 6,034 | 128,705 | ||||
| Total Insurance | 2,781,526 | |||||
| Materials—7.9% | ||||||
| A. Schulman, Inc. | 21,948 | 435,668 | ||||
| A.M. Castle & Co.* | 19,422 | 206,262 | ||||
| AK Steel Holding Corp.(a) | 229,850 | 1,349,220 | ||||
| AMCOL International Corp. | 6,540 | 185,147 | ||||
| American Vanguard Corp. | 2,160 | 57,434 | ||||
| Balchem Corp. | 1,786 | 58,242 | ||||
| Buckeye Technologies, Inc. | 6,226 | 177,379 | ||||
| Calgon Carbon Corp.* | 7,989 | 113,604 | ||||
| Century Aluminum Co.* | 15,934 | 116,796 | ||||
| Clearwater Paper Corp.* | 11,328 | 386,511 | ||||
The accompanying notes are an integral part of these financial statements.
| 30 |
Schedule of Investments — continued
RevenueShares Small Cap Fund
June 30, 2012
| Investments | Shares | Value | ||||
| Materials (continued) | ||||||
| Deltic Timber Corp. | 440 | $ | 26,831 | |||
| Eagle Materials, Inc. | 2,718 | 101,490 | ||||
| Globe Specialty Metals, Inc. | 9,359 | 125,691 | ||||
| H.B. Fuller Co. | 9,528 | 292,510 | ||||
| Hawkins, Inc. | 1,513 | 57,766 | ||||
| Haynes International, Inc. | 1,908 | 97,194 | ||||
| Headwaters, Inc.* | 27,048 | 139,297 | ||||
| Innophos Holdings, Inc. | 2,984 | 168,477 | ||||
| Kaiser Aluminum Corp. | 4,928 | 255,468 | ||||
| KapStone Paper and Packaging Corp.* | 10,337 | 163,841 | ||||
| Koppers Holdings, Inc. | 8,730 | 296,820 | ||||
| Kraton Performance Polymers, Inc.* | 13,712 | 300,430 | ||||
| LSB Industries, Inc.* | 5,412 | 167,285 | ||||
| Materion Corp. | 13,266 | 305,516 | ||||
| Myers Industries, Inc. | 8,274 | 141,982 | ||||
| Neenah Paper, Inc. | 5,134 | 137,026 | ||||
| Olympic Steel, Inc. | 15,310 | 251,390 | ||||
| OM Group, Inc.* | 14,287 | 271,453 | ||||
| PolyOne Corp. | 41,872 | 572,809 | ||||
| Quaker Chemical Corp. | 2,969 | 137,198 | ||||
| RTI International Metals, Inc.* | 4,453 | 100,771 | ||||
| Schweitzer-Mauduit International, Inc. | 2,309 | 157,335 | ||||
| Stepan Co. | 3,729 | 351,197 | ||||
| SunCoke Energy, Inc.* | 21,863 | 320,293 | ||||
| Texas Industries, Inc. | 3,471 | 135,404 | ||||
| Tredegar Corp. | 10,849 | 157,961 | ||||
| Wausau Paper Corp. | 22,412 | 218,069 | ||||
| Zep, Inc. | 9,310 | 127,826 | ||||
| Total Materials | 8,665,593 | |||||
| Media—1.4% | ||||||
| Arbitron, Inc. | 2,323 | 81,305 | ||||
| Digital Generation, Inc.* | 4,139 | 51,200 | ||||
| E.W. Scripps Co., Class A* | 15,817 | 152,001 | ||||
| Harte-Hanks, Inc. | 19,837 | 181,310 | ||||
| Live Nation Entertainment, Inc.* | 117,046 | 1,074,482 | ||||
| Total Media | 1,540,298 | |||||
| Pharmaceuticals, Biotechnology & Life Sciences—1.4% | ||||||
| Affymetrix, Inc.* | 12,081 | 56,660 | ||||
| Akorn, Inc.*(a) | 1,561 | 24,617 | ||||
| Arqule, Inc.* | 1,327 | 7,869 | ||||
| Cambrex Corp.* | 4,426 | 41,649 | ||||
| Cubist Pharmaceuticals, Inc.* | 3,446 | 130,638 | ||||
| Emergent Biosolutions, Inc.* | 3,526 | 53,419 | ||||
| Enzo Biochem, Inc.* | 9,849 | 16,448 | ||||
| Hi-Tech Pharmacal Co., Inc.* | 1,125 | 36,450 | ||||
| Luminex Corp.* | 1,439 | 35,241 | ||||
| Medicines Co.* | 4,232 | 97,082 | ||||
| Momenta Pharmaceuticals, Inc.* | 3,866 | 52,268 | ||||
| Par Pharmaceutical Cos., Inc.* | 5,355 | 193,530 | ||||
| PAREXEL International Corp.* | 9,815 | 277,078 | ||||
| Questcor Pharmaceuticals, Inc.* | 4,680 | 249,163 | ||||
| Salix Pharmaceuticals Ltd.* | 1,876 | 102,129 | ||||
| Savient Pharmaceuticals, Inc.*(a) | 1,772 | 957 | ||||
| Spectrum Pharmaceuticals, Inc.* | 2,482 | 38,620 | ||||
| ViroPharma, Inc.* | 4,360 | 103,332 | ||||
| Total Pharmaceuticals, Biotechnology | ||||||
| & Life Sciences | 1,517,150 | |||||
| Investments | Shares | Value | ||||
| Real Estate Investment Trusts—1.3% | ||||||
| Acadia Realty Trust | 1,309 | $ | 30,343 | |||
| Cedar Realty Trust, Inc. | 6,087 | 30,739 | ||||
| Colonial Properties Trust | 3,400 | 75,276 | ||||
| Cousins Properties, Inc. | 5,100 | 39,525 | ||||
| DiamondRock Hospitality Co. | 12,431 | 126,796 | ||||
| EastGroup Properties, Inc. | 663 | 35,338 | ||||
| Entertainment Properties Trust | 1,381 | 56,773 | ||||
| Extra Space Storage, Inc. | 2,068 | 63,281 | ||||
| Franklin Street Properties Corp. | 2,667 | 28,217 | ||||
| Getty Realty Corp. | 1,138 | 21,793 | ||||
| Healthcare Realty Trust, Inc. | 2,445 | 58,289 | ||||
| Inland Real Estate Corp. | 4,078 | 34,174 | ||||
| Kilroy Realty Corp. | 1,471 | 71,211 | ||||
| Kite Realty Group Trust | 4,029 | 20,105 | ||||
| LaSalle Hotel Properties | 4,842 | 141,096 | ||||
| Lexington Realty Trust | 7,958 | 67,404 | ||||
| LTC Properties, Inc. | 467 | 16,943 | ||||
| Medical Properties Trust, Inc. | 3,071 | 29,543 | ||||
| Mid-America Apartment | ||||||
| Communities, Inc. | 1,283 | 87,552 | ||||
| Parkway Properties, Inc. | 4,438 | 50,771 | ||||
| Pennsylvania Real Estate | ||||||
| Investment Trust | 6,431 | 96,336 | ||||
| Post Properties, Inc. | 1,230 | 60,208 | ||||
| PS Business Parks, Inc. | 858 | 58,104 | ||||
| Sabra Health Care REIT, Inc. | 939 | 16,066 | ||||
| Saul Centers, Inc. | 766 | 32,838 | ||||
| Sovran Self Storage, Inc. | 783 | 39,220 | ||||
| Tanger Factory Outlet Centers | 1,891 | 60,606 | ||||
| Universal Health Realty Income Trust | 135 | 5,607 | ||||
| Urstadt Biddle Properties, Inc., Class A | 920 | 18,188 | ||||
| Total Real Estate Investment Trusts | 1,472,342 | |||||
| Real Estate Management & Development—0.0% | ||||||
| Forestar Group, Inc.* | 1,545 | 19,791 | ||||
| Retailing—10.8% | ||||||
| Big 5 Sporting Goods Corp. | 27,389 | 207,061 | ||||
| Blue Nile, Inc.*(a) | 2,333 | 69,313 | ||||
| Brown Shoe Co., Inc. | 40,813 | 526,896 | ||||
| Buckle, Inc. | 4,731 | 187,206 | ||||
| Cabela's, Inc.*(a) | 14,339 | 542,158 | ||||
| Cato Corp., Class A | 6,102 | 185,867 | ||||
| Children's Place Retail Stores, Inc.*(a) | 7,435 | 370,486 | ||||
| Christopher & Banks Corp. | 80,195 | 94,630 | ||||
| Coldwater Creek, Inc.* | 65,865 | 35,962 | ||||
| Finish Line, Inc., Class A | 12,560 | 262,630 | ||||
| Fred's, Inc., Class A | 23,709 | 362,511 | ||||
| Genesco, Inc.* | 5,330 | 320,599 | ||||
| Group 1 Automotive, Inc. | 23,303 | 1,062,850 | ||||
| Haverty Furniture Cos., Inc. | 10,877 | 121,496 | ||||
| Hibbett Sports, Inc.* | 2,251 | 129,905 | ||||
| HOT Topic, Inc. | 14,727 | 142,705 | ||||
| Jos. A. Bank Clothiers, Inc.*(a) | 3,908 | 165,934 | ||||
| Kirkland's, Inc.* | 6,835 | 76,894 | ||||
| Lithia Motors, Inc., Class A | 21,079 | 485,871 | ||||
| Lumber Liquidators Holdings, Inc.*(a) | 3,916 | 132,322 | ||||
| MarineMax, Inc.* | 10,070 | 95,766 | ||||
| Men's Wearhouse, Inc. | 13,901 | 391,174 | ||||
| Monro Muffler Brake, Inc. | 3,805 | 126,478 | ||||
| Nutrisystem, Inc. | 7,453 | 86,157 | ||||
The accompanying notes are an integral part of these financial statements.
| 31 |
Schedule of Investments — continued
RevenueShares Small Cap Fund
June 30, 2012
| Investments | Shares | Value | ||||
| Retailing (continued) | ||||||
| OfficeMax, Inc.* | 295,292 | $ | 1,494,177 | |||
| Pep Boys-Manny, Moe & Jack | 41,212 | 407,999 | ||||
| PetMed Express, Inc. | 3,812 | 46,354 | ||||
| Pool Corp. | 8,933 | 361,429 | ||||
| rue21, Inc.* | 4,373 | 110,374 | ||||
| Select Comfort Corp.* | 6,467 | 135,290 | ||||
| Sonic Automotive, Inc., Class A | 104,650 | 1,430,565 | ||||
| Stage Stores, Inc. | 16,185 | 296,509 | ||||
| Stein Mart, Inc.* | 30,264 | 240,599 | ||||
| Tuesday Morning Corp.* | 37,585 | 161,240 | ||||
| Vitamin Shoppe, Inc.* | 2,968 | 163,032 | ||||
| VOXX International Corp., Class A* | 12,220 | 113,890 | ||||
| Zale Corp.* | 137,979 | 371,163 | ||||
| Zumiez, Inc.*(a) | 7,814 | 309,434 | ||||
| Total Retailing | 11,824,926 | |||||
| Semiconductors & Semiconductor Equipment—2.5% | ||||||
| Advanced Energy Industries, Inc.* | 7,852 | 105,374 | ||||
| ATMI, Inc.* | 3,716 | 76,438 | ||||
| Brooks Automation, Inc. | 14,825 | 139,948 | ||||
| Cabot Microelectronics Corp. | 2,889 | 84,388 | ||||
| Ceva, Inc.* | 621 | 10,936 | ||||
| Cirrus Logic, Inc.* | 6,886 | 205,754 | ||||
| Cohu, Inc. | 7,088 | 72,014 | ||||
| Cymer, Inc.* | 2,034 | 119,904 | ||||
| Diodes, Inc.* | 6,585 | 123,600 | ||||
| DSP Group, Inc.* | 6,438 | 40,817 | ||||
| Entropic Communications, Inc.* | 12,127 | 68,396 | ||||
| Exar Corp.* | 3,695 | 30,151 | ||||
| GT Advanced Technologies, Inc.* | 10,875 | 57,420 | ||||
| Hittite Microwave Corp.* | 1,030 | 52,654 | ||||
| Kopin Corp.* | 7,898 | 27,169 | ||||
| Kulicke & Soffa Industries, Inc.* | 18,999 | 169,471 | ||||
| Micrel, Inc. | 5,564 | 53,025 | ||||
| Microsemi Corp.* | 8,095 | 149,677 | ||||
| MKS Instruments, Inc. | 6,098 | 176,415 | ||||
| Monolithic Power Systems, Inc.* | 1,901 | 37,773 | ||||
| Nanometrics, Inc.* | 2,919 | 44,836 | ||||
| Pericom Semiconductor Corp.* | 3,632 | 32,688 | ||||
| Power Integrations, Inc. | 1,486 | 55,428 | ||||
| Rubicon Technology, Inc.* | 2,837 | 28,937 | ||||
| Rudolph Technologies, Inc.* | 4,438 | 38,699 | ||||
| Sigma Designs, Inc.* | 8,851 | 56,469 | ||||
| Standard Microsystems Corp.* | 2,106 | 77,690 | ||||
| STR Holdings, Inc.* | 7,057 | 32,180 | ||||
| Supertex, Inc.* | 888 | 16,739 | ||||
| Tessera Technologies, Inc. | 3,739 | 57,468 | ||||
| TriQuint Semiconductor, Inc.* | 31,710 | 174,405 | ||||
| Ultratech, Inc.* | 1,245 | 39,218 | ||||
| Veeco Instruments, Inc.* | 6,173 | 212,104 | ||||
| Volterra Semiconductor Corp.* | 1,084 | 25,420 | ||||
| Total Semiconductors & | ||||||
| Semiconductor Equipment | 2,693,605 | |||||
| Software & Services—4.4% | ||||||
| Blackbaud, Inc. | 2,755 | 70,721 | ||||
| Blucora, Inc.* | 3,323 | 40,939 | ||||
| Bottomline Technologies, Inc.* | 1,826 | 32,959 | ||||
| CACI International, Inc., Class A* | 13,101 | 720,817 | ||||
| Cardtronics, Inc.* | 4,105 | 124,012 | ||||
| Investments | Shares | Value | ||||
| CIBER, Inc.* | 50,945 | $ | 219,573 | |||
| CommVault Systems, Inc.* | 1,287 | 63,797 | ||||
| comScore, Inc.* | 2,579 | 42,450 | ||||
| CSG Systems International, Inc.* | 8,349 | 144,271 | ||||
| DealerTrack Holdings, Inc.* | 2,175 | 65,489 | ||||
| Digital River, Inc.* | 4,984 | 82,834 | ||||
| Ebix, Inc. | 1,783 | 35,571 | ||||
| EPIQ Systems, Inc. | 4,518 | 55,346 | ||||
| ExlService Holdings, Inc.* | 2,958 | 72,885 | ||||
| Forrester Research, Inc. | 1,661 | 56,241 | ||||
| Heartland Payment Systems, Inc. | 14,200 | 427,136 | ||||
| Higher One Holdings, Inc.*(a) | 3,118 | 38,102 | ||||
| iGate Corp.* | 7,047 | 119,940 | ||||
| Interactive Intelligence Group, Inc.* | 1,441 | 40,651 | ||||
| j2 Global, Inc. | 2,438 | 64,412 | ||||
| JDA Software Group, Inc.* | 4,519 | 134,169 | ||||
| Liquidity Services, Inc.* | 5,746 | 294,138 | ||||
| LivePerson, Inc.* | 1,439 | 27,427 | ||||
| LogMeIn, Inc.* | 736 | 22,463 | ||||
| Manhattan Associates, Inc.* | 1,389 | 63,491 | ||||
| MAXIMUS, Inc. | 3,894 | 201,515 | ||||
| MicroStrategy, Inc., Class A* | 2,542 | 330,104 | ||||
| Monotype Imaging Holdings, Inc.* | 1,607 | 26,949 | ||||
| NCI, Inc., Class A* | 5,719 | 23,162 | ||||
| Netscout Systems, Inc.* | 2,595 | 56,026 | ||||
| OpenTable, Inc.*(a) | 589 | 26,511 | ||||
| Opnet Technologies, Inc. | 1,030 | 27,388 | ||||
| Perficient, Inc.* | 4,350 | 48,851 | ||||
| Progress Software Corp.* | 5,398 | 112,656 | ||||
| QuinStreet, Inc.* | 3,794 | 35,132 | ||||
| Sourcefire, Inc.* | 553 | 28,424 | ||||
| Stamps.com, Inc.* | 841 | 20,748 | ||||
| Synchronoss Technologies, Inc.* | 2,225 | 41,096 | ||||
| Take-Two Interactive Software, Inc.* | 18,507 | 175,076 | ||||
| TeleTech Holdings, Inc.* | 14,456 | 231,296 | ||||
| Tyler Technologies, Inc.* | 1,464 | 59,072 | ||||
| United Online, Inc. | 28,374 | 119,738 | ||||
| VASCO Data Security | ||||||
| International, Inc.* | 2,961 | 24,221 | ||||
| Virtusa Corp.* | 2,849 | 38,034 | ||||
| Websense, Inc.* | 3,920 | 73,422 | ||||
| XO Group, Inc.* | 2,671 | 23,692 | ||||
| Total Software & Services | 4,782,947 | |||||
| Technology Hardware & Equipment—10.0% | ||||||
| 3D Systems Corp.* | 1,319 | 45,031 | ||||
| Agilysys, Inc.* | 9,529 | 82,616 | ||||
| Anixter International, Inc. | 21,651 | 1,148,586 | ||||
| Arris Group, Inc.* | 15,791 | 219,653 | ||||
| Avid Technology, Inc.* | 19,315 | 143,510 | ||||
| Badger Meter, Inc. | 1,419 | 53,283 | ||||
| Bel Fuse, Inc., Class B | 3,760 | 66,214 | ||||
| Benchmark Electronics, Inc.* | 32,718 | 456,416 | ||||
| Black Box Corp. | 7,649 | 219,526 | ||||
| Brightpoint, Inc.* | 200,499 | 1,084,700 | ||||
| Checkpoint Systems, Inc.* | 20,526 | 178,781 | ||||
| Cognex Corp. | 1,980 | 62,667 | ||||
| Comtech Telecommunications Corp. | 4,971 | 142,071 | ||||
| CTS Corp. | 12,344 | 116,280 | ||||
| Daktronics, Inc. | 12,367 | 85,456 | ||||
| Digi International, Inc.* | 3,985 | 40,806 | ||||
The accompanying notes are an integral part of these financial statements.
| 32 |
Schedule of Investments — continued
RevenueShares Small Cap Fund
June 30, 2012
| Investments | Shares | Value | ||||
| Technology Hardware & Equipment (continued) | ||||||
| DTS, Inc.* | 698 | $ | 18,204 | |||
| Electro Scientific Industries, Inc. | 4,042 | 47,776 | ||||
| FARO Technologies, Inc.* | 1,052 | 44,268 | ||||
| FEI Co.* | 3,086 | 147,634 | ||||
| Harmonic, Inc.* | 25,117 | 106,998 | ||||
| Insight Enterprises, Inc.* | 67,457 | 1,135,301 | ||||
| Intermec, Inc.* | 24,298 | 150,648 | ||||
| Intevac, Inc.* | 2,482 | 18,665 | ||||
| Littelfuse, Inc. | 2,274 | 129,368 | ||||
| Measurement Specialties, Inc.* | 1,541 | 50,098 | ||||
| Mercury Computer Systems, Inc.* | 3,447 | 44,570 | ||||
| Methode Electronics, Inc. | 10,018 | 85,253 | ||||
| MTS Systems Corp. | 2,291 | 88,318 | ||||
| NETGEAR, Inc.* | 6,891 | 237,808 | ||||
| Newport Corp.* | 8,175 | 98,264 | ||||
| Novatel Wireless, Inc.* | 33,540 | 83,515 | ||||
| Oplink Communications, Inc.* | 2,857 | 38,655 | ||||
| OSI Systems, Inc.* | 1,986 | 125,793 | ||||
| Park Electrochemical Corp. | 1,682 | 43,530 | ||||
| PC-Tel, Inc. | 2,190 | 14,169 | ||||
| Plexus Corp.* | 15,061 | 424,720 | ||||
| Pulse Electronics Corp. | 38,915 | 76,663 | ||||
| Radisys Corp.* | 9,735 | 61,136 | ||||
| Rofin-Sinar Technologies, Inc.* | 5,671 | 107,352 | ||||
| Rogers Corp.* | 2,568 | 101,718 | ||||
| ScanSource, Inc.* | 15,364 | 470,753 | ||||
| Stratasys, Inc.*(a) | 613 | 30,374 | ||||
| Super Micro Computer, Inc.* | 11,381 | 180,503 | ||||
| Symmetricom, Inc.* | 7,043 | 42,188 | ||||
| Synaptics, Inc.* | 4,050 | 115,952 | ||||
| SYNNEX Corp.* | 58,077 | 2,003,076 | ||||
| TTM Technologies, Inc.* | 30,883 | 290,609 | ||||
| ViaSat, Inc.*(a) | 4,237 | 160,032 | ||||
| Total Technology Hardware & Equipment | 10,919,507 | |||||
| Telecommunication Services—0.8% | ||||||
| Atlantic Tele-Network, Inc. | 2,856 | 96,333 | ||||
| Cbeyond, Inc.* | 15,863 | 107,393 | ||||
| Cincinnati Bell, Inc.* | 80,378 | 299,006 | ||||
| General Communication, Inc., | ||||||
| Class A* | 16,607 | 138,004 | ||||
| Lumos Networks Corp. | 4,061 | 38,376 | ||||
| Neutral Tandem, Inc.* | 3,986 | 52,535 | ||||
| NTELOS Holdings Corp. | 5,748 | 108,350 | ||||
| USA Mobility, Inc. | 3,744 | 48,148 | ||||
| Total Telecommunication Services | 888,145 | |||||
| Investments | Shares | Value | ||||
| Transportation—2.1% | ||||||
| Allegiant Travel Co., Class A* | 2,097 | $ | 146,119 | |||
| Arkansas Best Corp. | 20,698 | 260,795 | ||||
| Forward Air Corp. | 3,095 | 99,875 | ||||
| Heartland Express, Inc. | 7,228 | 103,433 | ||||
| HUB Group, Inc., Class A* | 13,590 | 491,958 | ||||
| Knight Transportation, Inc. | 9,781 | 156,398 | ||||
| Old Dominion Freight Line, Inc.* | 8,132 | 352,034 | ||||
| SkyWest, Inc. | 101,143 | 660,464 | ||||
| Total Transportation | 2,271,076 | |||||
| Utilities—3.4% | ||||||
| ALLETE, Inc. | 4,444 | 185,759 | ||||
| American States Water Co. | 2,189 | 86,641 | ||||
| Avista Corp. | 11,710 | 312,657 | ||||
| CH Energy Group, Inc. | 3,016 | 198,121 | ||||
| El Paso Electric Co. | 5,546 | 183,905 | ||||
| Laclede Group, Inc. | 8,175 | 325,447 | ||||
| New Jersey Resources Corp. | 13,595 | 592,878 | ||||
| Northwest Natural Gas Co. | 3,534 | 168,218 | ||||
| NorthWestern Corp. | 6,223 | 228,384 | ||||
| Piedmont Natural Gas Co., Inc. | 8,908 | 286,749 | ||||
| South Jersey Industries, Inc. | 3,604 | 183,696 | ||||
| Southwest Gas Corp. | 8,249 | 360,069 | ||||
| UIL Holdings Corp. | 8,533 | 305,993 | ||||
| UNS Energy Corp. | 7,877 | 302,556 | ||||
| Total Utilities | 3,721,073 | |||||
| Total Common Stocks | ||||||
| (Cost $101,624,277) | 109,562,281 | |||||
| INVESTMENT OF CASH COLLATERAL | ||||||
| FOR SECURITIES LOANED—4.1% | ||||||
| Dreyfus Institutional Preferred | ||||||
| Money Market Fund— | ||||||
| Prime Shares, 0.16%(b) | ||||||
| (Cost $4,526,261) | 4,526,261 | 4,526,261 | ||||
| Total Investments—104.1% | ||||||
| (Cost $106,150,538) | 114,088,542 | |||||
| Liabilities in Excess of Other Assets—(4.1)% | (4,487,536 | ) | ||||
| Net Assets—100.0% | $ | 109,601,006 | ||||
| * | Non-income producing security |
| (a) | All or a portion of security is on loan. The aggregate market value of the securities on loan is $4,456,793; cash collateral of $4,526,261 (included in liabilities) was received with which the Fund purchased highly liquid short-term investments. |
| (b) | Rate shown represents annualized 7-day yield as of June 30, 2012. |
The accompanying notes are an integral part of these financial statements.
| 33 |
RevenueShares Financials Sector Fund
June 30, 2012
| Investments | Shares | Value | ||||
| COMMON STOCKS—99.9% | ||||||
| Capital Markets—11.5% | ||||||
| Ameriprise Financial, Inc. | 1,427 | $ | 74,575 | |||
| Bank of New York Mellon Corp. | 5,174 | 113,569 | ||||
| BlackRock, Inc. | 380 | 64,532 | ||||
| Charles Schwab Corp. | 2,720 | 35,169 | ||||
| E*Trade Financial Corp.* | 2,067 | 16,619 | ||||
| Federated Investors, Inc., Class B | 301 | 6,577 | ||||
| Franklin Resources, Inc. | 456 | 50,611 | ||||
| Goldman Sachs Group, Inc. | 2,866 | 274,735 | ||||
| Invesco Ltd. | 1,323 | 29,900 | ||||
| Legg Mason, Inc. | 757 | 19,962 | ||||
| Morgan Stanley | 20,751 | 302,757 | ||||
| Northern Trust Corp. | 656 | 30,189 | ||||
| State Street Corp. | 1,623 | 72,451 | ||||
| T. Rowe Price Group, Inc. | 314 | 19,769 | ||||
| Total Capital Markets | 1,111,415 | |||||
| Commercial Banks—13.4% | ||||||
| BB&T Corp. | 2,336 | 72,066 | ||||
| Comerica, Inc. | 608 | 18,672 | ||||
| Fifth Third Bancorp | 3,670 | 49,178 | ||||
| First Horizon National Corp. | 1,386 | 11,989 | ||||
| Huntington Bancshares, Inc. | 3,393 | 21,715 | ||||
| KeyCorp | 4,546 | 35,186 | ||||
| M&T Bank Corp. | 374 | 30,881 | ||||
| PNC Financial Services Group, Inc. | 1,922 | 117,454 | ||||
| Regions Financial Corp. | 8,349 | 56,356 | ||||
| SunTrust Banks, Inc. | 3,001 | 72,714 | ||||
| U.S. Bancorp | 4,695 | 150,991 | ||||
| Wells Fargo & Co. | 19,132 | 639,774 | ||||
| Zions Bancorporation | 996 | 19,342 | ||||
| Total Commercial Banks | 1,296,318 | |||||
| Consumer Finance—4.7% | ||||||
| American Express Co. | 3,914 | 227,834 | ||||
| Capital One Financial Corp. | 2,407 | 131,567 | ||||
| Discover Financial Services | 1,726 | 59,685 | ||||
| SLM Corp. | 2,628 | 41,286 | ||||
| Total Consumer Finance | 460,372 | |||||
| Diversified Financial Services—25.1% | ||||||
| Bank of America Corp. | 98,933 | 809,272 | ||||
| Citigroup, Inc. | 25,477 | 698,325 | ||||
| CME Group, Inc., Class A | 84 | 22,521 | ||||
| IntercontinentalExchange, Inc.* | 72 | 9,791 | ||||
| JPMorgan Chase & Co. | 22,480 | 803,210 | ||||
| Leucadia National Corp. | 609 | 12,953 | ||||
| Moody's Corp. | 446 | 16,301 | ||||
| NASDAQ OMX Group, Inc. | 1,073 | 24,325 | ||||
| NYSE Euronext | 1,272 | 32,538 | ||||
| Total Diversified Financial Services | 2,429,236 | |||||
| Insurance—41.8% | ||||||
| ACE Ltd. | 1,621 | 120,165 | ||||
| Aflac, Inc. | 3,581 | 152,515 | ||||
| Allstate Corp. | 6,619 | 232,261 | ||||
| American International Group, Inc.* | 14,987 | 480,933 | ||||
| AON PLC | 1,682 | 78,684 | ||||
| Assurant, Inc. | 1,668 | 58,113 | ||||
| Berkshire Hathaway, Inc., Class B* | 12,151 | 1,012,543 | ||||
| Chubb Corp. | 1,333 | 97,069 | ||||
| Cincinnati Financial Corp. | 716 | 27,258 | ||||
| Genworth Financial, Inc., Class A* | 13,316 | 75,369 | ||||
| Investments | Shares | Value | ||||
| Hartford Financial Services Group, Inc. | 9,012 | $ | 158,882 | |||
| Lincoln National Corp. | 3,537 | 77,354 | ||||
| Loews Corp. | 2,477 | 101,334 | ||||
| Marsh & McLennan Cos., Inc. | 2,563 | 82,605 | ||||
| MetLife, Inc. | 15,163 | 467,778 | ||||
| Principal Financial Group, Inc. | 2,532 | 66,414 | ||||
| Progressive Corp.(a) | 5,164 | 107,566 | ||||
| Prudential Financial, Inc. | 6,623 | 320,752 | ||||
| Torchmark Corp. | 475 | 24,011 | ||||
| Travelers Cos., Inc. | 2,813 | 179,582 | ||||
| Unum Group | 3,658 | 69,977 | ||||
| XL Group PLC | 2,241 | 47,151 | ||||
| Total Insurance | 4,038,316 | |||||
| Paper & Forest Products—0.5% | ||||||
| Weyerhaeuser Co. | 2,083 | 46,576 | ||||
| Real Estate Investment Trusts—2.2% | ||||||
| American Tower Corp. | 241 | 16,848 | ||||
| Apartment Investment & | ||||||
| Management Co., Class A | 285 | 7,704 | ||||
| AvalonBay Communities, Inc. | 48 | 6,791 | ||||
| Boston Properties, Inc. | 114 | 12,354 | ||||
| Equity Residential | 231 | 14,405 | ||||
| HCP, Inc. | 265 | 11,700 | ||||
| Health Care REIT, Inc. | 151 | 8,803 | ||||
| Host Hotels & Resorts, Inc. | 2,152 | 34,045 | ||||
| Kimco Realty Corp. | 345 | 6,565 | ||||
| Plum Creek Timber Co., Inc. | 221 | 8,774 | ||||
| ProLogis, Inc. | 322 | 10,700 | ||||
| Public Storage | 87 | 12,564 | ||||
| Simon Property Group, Inc. | 197 | 30,665 | ||||
| Ventas, Inc. | 169 | 10,667 | ||||
| Vornado Realty Trust | 247 | 20,743 | ||||
| Total Real Estate Investment Trusts | 213,328 | |||||
| Real Estate Management & Development—0.4% | ||||||
| Cbre Group, Inc., Class A* | 2,427 | 39,706 | ||||
| Thrifts & Mortgage Finance—0.3% | ||||||
| Hudson City Bancorp, Inc. | 2,777 | 17,689 | ||||
| People's United Financial, Inc. | 782 | 9,079 | ||||
| Total Thrifts & Mortgage Finance | 26,768 | |||||
| Total Common Stocks | ||||||
| (Cost $11,340,065) | 9,662,035 | |||||
| INVESTMENT OF CASH COLLATERAL | ||||||
| FOR SECURITIES LOANED—0.0%† | ||||||
| Dreyfus Institutional Preferred | ||||||
| Money Market Fund— | ||||||
| Prime Shares, 0.16%(b) | ||||||
| (Cost $425) | 425 | 425 | ||||
| Total Investments—99.9% | ||||||
| (Cost $11,340,490) | 9,662,460 | |||||
| Other Assets in Excess of Liabilities—0.1% | 4,872 | |||||
| Net Assets—100.0% | $ | 9,667,332 | ||||
PLC – Public Limited Company
REIT – Real Estate Investment Trust
| * | Non-income producing security |
| † | Less than 0.05% |
| (a) | All or a portion of security is on loan. The aggregate market value of the securities on loan is $417; cash collateral of $425 (included in liabilities) was received with which the Fund purchased highly liquid short-term investments. | |
| (b) | Rate shown represents annualized 7-day yield as of June 30, 2012. |
The accompanying notes are an integral part of these financial statements.
| 34 |
RevenueShares ADR Fund
June 30, 2012
| Investments | Shares | Value | ||||
| COMMON STOCKS—98.4% | ||||||
| Automobiles & Components—5.4% | ||||||
| Honda Motor Co. Ltd.(a) | 17,042 | $ | 590,676 | |||
| Magna International, Inc. | 3,928 | 154,999 | ||||
| Toyota Motor Corp.(a) | 15,245 | 1,226,917 | ||||
| Total Automobiles & Components | 1,972,592 | |||||
| Banks—12.3% | ||||||
| Banco Bilbao Vizcaya Argentaria SA(a) | 22,776 | 161,026 | ||||
| Banco Bradesco SA(a) | 32,561 | 484,182 | ||||
| Banco de Chile(a) | 293 | 24,756 | ||||
| Banco Santander Chile(a) | 362 | 28,051 | ||||
| Banco Santander SA(a) | 54,808 | 359,540 | ||||
| Bancolombia SA(a) | 452 | 27,952 | ||||
| Bank of Montreal | 1,950 | 107,757 | ||||
| Bank of Nova Scotia | 2,893 | 149,828 | ||||
| Barclays PLC(a) | 25,220 | 259,766 | ||||
| Canadian Imperial Bank of Commerce | 1,323 | 93,060 | ||||
| Credicorp Ltd. | 144 | 18,128 | ||||
| HSBC Holdings PLC(a) | 10,836 | 478,193 | ||||
| Itau Unibanco Holding SA(a) | 30,077 | 418,672 | ||||
| KB Financial Group, Inc.(a) | 110 | 3,596 | ||||
| Lloyds Banking Group PLC*(a) | 164,891 | 316,591 | ||||
| Mitsubishi UFJ Financial | ||||||
| Group, Inc.(a) | 65,995 | 313,476 | ||||
| Mizuho Financial Group, Inc.(a) | 49,312 | 164,209 | ||||
| National Bank of Greece SA*(a) | 26,672 | 45,609 | ||||
| Royal Bank of Canada | 3,534 | 181,012 | ||||
| Royal Bank of Scotland | ||||||
| Group PLC*(a)(b) | 38,436 | 261,365 | ||||
| Shinhan Financial Group Co., Ltd.(a) | 121 | 8,589 | ||||
| Sumitomo Mitsui Financial | ||||||
| Group, Inc.(a) | 30,214 | 200,621 | ||||
| Toronto-Dominion Bank | 2,016 | 157,712 | ||||
| Westpac Banking Corp.(a) | 2,345 | 255,159 | ||||
| Total Banks | 4,518,850 | |||||
| Capital Goods—3.0% | ||||||
| ABB Ltd.*(a) | 13,004 | 212,225 | ||||
| Embraer SA(a) | 1,235 | 32,764 | ||||
| Koninklijke Philips Electronics NV | 9,068 | 178,368 | ||||
| Kubota Corp.(a) | 1,481 | 68,289 | ||||
| Nidec Corp.(a) | 2,219 | 42,583 | ||||
| Siemens AG(a) | 6,745 | 567,052 | ||||
| Total Capital Goods | 1,101,281 | |||||
| Consumer Durables & Apparel—3.1% | ||||||
| Gildan Activewear, Inc. | 342 | 9,412 | ||||
| Luxottica Group SpA(a) | 1,444 | 50,439 | ||||
| Panasonic Corp.(a) | 74,735 | 605,353 | ||||
| Sony Corp.(a) | 33,718 | 480,144 | ||||
| Total Consumer Durables & Apparel | 1,145,348 | |||||
| Consumer Services—0.3% | ||||||
| Carnival PLC(a) | 2,496 | 85,688 | ||||
| Intercontinental Hotels Group PLC(a) | 404 | 9,736 | ||||
| Tim Hortons, Inc. | 318 | 16,740 | ||||
| Total Consumer Services | 112,164 | |||||
| Diversified Financials—3.8% | ||||||
| Credit Suisse Group AG(a) | 13,278 | 243,386 | ||||
| Deutsche Bank AG | 10,422 | 376,964 | ||||
| Investments | Shares | Value | ||||
| ING Groep NV*(a) | 59,939 | $ | 400,393 | |||
| Nomura Holdings, Inc.(a) | 28,168 | 103,940 | ||||
| ORIX Corp.(a) | 660 | 30,670 | ||||
| UBS AG* | 20,350 | 238,298 | ||||
| Total Diversified Financials | 1,393,651 | |||||
| Energy—35.5% | ||||||
| BP PLC(a) | 45,710 | 1,853,083 | ||||
| Cameco Corp. | 656 | 14,399 | ||||
| Canadian Natural Resources Ltd. | 2,875 | 77,194 | ||||
| Cenovus Energy, Inc. | 2,909 | 92,506 | ||||
| China Petroleum & Chemical Corp.(a) | 20,158 | 1,797,892 | ||||
| CNOOC Ltd.(a) | 1,058 | 212,923 | ||||
| Ecopetrol SA(a) | 3,460 | 193,033 | ||||
| Enbridge, Inc. | 3,032 | 121,037 | ||||
| Encana Corp. | 2,097 | 43,681 | ||||
| Enerplus Corp. | 499 | 6,422 | ||||
| ENI SpA(a) | 20,998 | 892,835 | ||||
| Imperial Oil Ltd. | 3,909 | 163,084 | ||||
| Nexen, Inc. | 2,255 | 38,087 | ||||
| Penn West Petroleum Ltd. | 1,273 | 17,045 | ||||
| PetroChina Co. Ltd.(a) | 12,822 | 1,655,833 | ||||
| Petroleo Brasileiro SA, Class A(a) | 42,706 | 774,687 | ||||
| Royal Dutch Shell PLC, Class A(a) | 19,776 | 1,333,496 | ||||
| Royal Dutch Shell PLC, Class B(a) | 19,067 | 1,333,355 | ||||
| Statoil ASA(a) | 28,819 | 687,621 | ||||
| Suncor Energy, Inc. | 7,689 | 222,597 | ||||
| Talisman Energy, Inc. | 4,118 | 47,192 | ||||
| Tenaris SA(a) | 1,664 | 58,190 | ||||
| Total SA(a) | 29,441 | 1,323,373 | ||||
| TransCanada Corp. | 1,181 | 49,484 | ||||
| Total Energy | 13,009,049 | |||||
| Food & Staples Retailing—0.5% | ||||||
| Delhaize Group SA(a) | 4,725 | 173,455 | ||||
| Food, Beverage & Tobacco—2.9% | ||||||
| Anheuser-Busch InBev NV(a) | 3,137 | 249,862 | ||||
| BRF—Brasil Foods SA(a) | 5,204 | 79,049 | ||||
| British American Tobacco PLC(a) | 1,375 | 140,415 | ||||
| Diageo PLC(a) | 932 | 96,061 | ||||
| Fomento Economico Mexicano | ||||||
| SAB de CV(a) | 1,126 | 100,496 | ||||
| Unilever NV | 5,723 | 190,862 | ||||
| Unilever PLC(a) | 5,640 | 190,237 | ||||
| Total Food, Beverage & Tobacco | 1,046,982 | |||||
| Health Care Equipment & Services—0.3% | ||||||
| Fresenius Medical Care AG | ||||||
| & Co. KGaA(a) | 1,071 | 75,602 | ||||
| Smith & Nephew PLC(a) | 504 | 25,195 | ||||
| Total Health Care Equipment & Services | 100,797 | |||||
| Insurance—4.3% | ||||||
| Aegon NV, Class G | 50,328 | 232,515 | ||||
| Aviva PLC(a) | 36,341 | 311,806 | ||||
| China Life Insurance Co. Ltd.(a) | 8,314 | 328,320 | ||||
| Manulife Financial Corp. | 24,030 | 261,687 | ||||
| Prudential PLC(a) | 14,070 | 326,424 | ||||
| Sun Life Financial, Inc. | 5,415 | 117,830 | ||||
| Total Insurance | 1,578,582 | |||||
The accompanying notes are an integral part of these financial statements.
| 35 |
Schedule of Investments — continued
RevenueShares ADR Fund
June 30, 2012
| Investments | Shares | Value | ||||
| Materials—6.4% | ||||||
| Agnico-Eagle Mines Ltd. | 258 | $ | 10,439 | |||
| Agrium, Inc. | 1,052 | 93,070 | ||||
| ArcelorMittal(b) | 33,440 | 510,629 | ||||
| Barrick Gold Corp. | 2,065 | 77,582 | ||||
| BHP Billiton Ltd.(a) | 2,826 | 184,538 | ||||
| BHP Billiton PLC(a) | 3,216 | 183,923 | ||||
| Cemex SAB de CV*(a) | 14,674 | 98,756 | ||||
| Cia de Minas Buenaventura SA(a) | 232 | 8,811 | ||||
| Cia Siderurgica Nacional SA(a) | 9,000 | 51,030 | ||||
| CRH PLC(a) | 7,334 | 141,106 | ||||
| Eldorado Gold Corp. | 496 | 6,111 | ||||
| Gerdau SA(a) | 13,836 | 121,203 | ||||
| Goldcorp, Inc. | 794 | 29,838 | ||||
| IAMGOLD Corp. | 738 | 8,708 | ||||
| Kinross Gold Corp. | 2,532 | 20,636 | ||||
| POSCO(a) | 2,406 | 193,539 | ||||
| Potash Corp. of Saskatchewan, Inc. | 1,138 | 49,719 | ||||
| Randgold Resources Ltd.(a) | 74 | 6,661 | ||||
| Rio Tinto PLC(a) | 6,986 | 334,001 | ||||
| Silver Wheaton Corp. | 151 | 4,053 | ||||
| Sociedad Quimica y Minera de Chile SA(a) 221 | 12,303 | |||||
| Southern Copper Corp. | 1,252 | 39,450 | ||||
| Syngenta AG(a) | 1,132 | 77,474 | ||||
| Teck Resources Ltd., Class B | 2,024 | 62,623 | ||||
| Yamana Gold, Inc. | 785 | 12,089 | ||||
| Total Materials | 2,338,292 | |||||
| Media—0.8% | ||||||
| Grupo Televisa SAB(a) | 1,397 | 30,007 | ||||
| Pearson PLC(a) | 2,740 | 54,389 | ||||
| Shaw Communications, Inc., Class B | 1,443 | 27,287 | ||||
| Thomson Reuters Corp. | 2,722 | 77,441 | ||||
| WPP PLC(a) | 1,474 | 89,708 | ||||
| Total Media | 278,832 | |||||
| Pharmaceuticals, Biotechnology & Life Sciences—3.2% | ||||||
| AstraZeneca PLC(a) | 4,195 | 187,726 | ||||
| Elan Corp. PLC*(a) | 480 | 7,003 | ||||
| GlaxoSmithKline PLC(a) | 5,310 | 241,977 | ||||
| Novartis AG(a) | 5,899 | 329,754 | ||||
| Novo Nordisk A/S(a) | 512 | 74,414 | ||||
| QIAGEN NV* | 401 | 6,697 | ||||
| Sanofi(a) | 7,197 | 271,902 | ||||
| Shire PLC(a) | 271 | 23,412 | ||||
| Valeant Pharmaceuticals | ||||||
| International, Inc.* | 328 | 14,691 | ||||
| Total Pharmaceuticals, Biotechnology | ||||||
| & Life Sciences | 1,157,576 | |||||
| Real Estate—0.3% | ||||||
| Brookfield Asset Management, Inc., | ||||||
| Class A | 3,110 | 102,941 | ||||
| Semiconductors & Semiconductor Equipment—0.5% | ||||||
| Advantest Corp.(a) | 445 | 7,018 | ||||
| ARM Holdings PLC(a) | 181 | 4,306 | ||||
| ASML Holding NV, Class G | 841 | 43,244 | ||||
| STMicroelectronics NV, Class Y | 8,822 | 47,992 | ||||
| Investments | Shares | Value | ||||
| Taiwan Semiconductor | ||||||
| Manufacturing Co. Ltd.(a) | 5,619 | $ | 78,441 | |||
| United Microelectronics Corp.(a) | 8,893 | 19,298 | ||||
| Total Semiconductors & | ||||||
| Semiconductor Equipment | 200,299 | |||||
| Software & Services—0.3% | ||||||
| SAP AG(a) | 1,861 | 110,469 | ||||
| Technology Hardware & Equipment—2.6% | ||||||
| Alcatel-Lucent*(a) | 67,367 | 109,808 | ||||
| Canon, Inc.(a)(b) | 6,156 | 245,871 | ||||
| Kyocera Corp.(a) | 1,012 | 86,425 | ||||
| Nokia OYJ(a) | 109,619 | 226,911 | ||||
| Research In Motion Ltd.*(b) | 11,104 | 82,059 | ||||
| Telefonaktiebolaget LM Ericsson(a) | 20,632 | 188,370 | ||||
| Total Technology Hardware | ||||||
| & Equipment | 939,444 | |||||
| Telecommunication Services—10.6% | ||||||
| America Movil SAB de CV, Series R(a) | 12,133 | 316,186 | ||||
| BCE, Inc. | 2,756 | 113,547 | ||||
| BT Group PLC(a) | 5,524 | 183,286 | ||||
| China Mobile Ltd.(a) | 8,855 | 484,103 | ||||
| Chunghwa Telecom Co. Ltd.(a) | 1,197 | 37,622 | ||||
| France Telecom SA(a) | 27,443 | 359,778 | ||||
| Nippon Telegraph & Telephone | ||||||
| Corp.(a) | 31,767 | 735,088 | ||||
| NTT DoCoMo, Inc.(a) | 17,536 | 291,974 | ||||
| Oi SA(a)(b) | 2,940 | 36,280 | ||||
| Portugal Telecom SGPS SA(a)(b) | 11,609 | 51,660 | ||||
| Rogers Communications, Inc., Class B | 1,917 | 69,414 | ||||
| Telecom Italia SpA(a) | 24,369 | 240,035 | ||||
| Telefonica SA(a) | 37,540 | 491,774 | ||||
| TELUS Corp., Class A | 1,016 | 59,416 | ||||
| Vodafone Group PLC(a) | 14,684 | 413,795 | ||||
| Total Telecommunication Services | 3,883,958 | |||||
| Transportation—0.4% | ||||||
| Canadian National Railway Co. | 622 | 52,484 | ||||
| Canadian Pacific Railway Ltd. | 423 | 30,989 | ||||
| Lan Airlines SA(a)(b) | 1,185 | 30,929 | ||||
| Ryanair Holdings PLC*(a) | 962 | 29,245 | ||||
| Total Transportation | 143,647 | |||||
| Utilities—1.9% | ||||||
| Centrais Eletricas Brasileiras SA, | ||||||
| Class C(a) | 16,191 | 113,823 | ||||
| Cia Energetica de Minas Gerais(a) | 2,970 | 54,707 | ||||
| CPFL Energia SA(a) | 1,714 | 42,833 | ||||
| Empresa Nacional de Electricidad SA(a) | 556 | 28,373 | ||||
| Enersis SA(a) | 4,026 | 75,286 | ||||
| National Grid PLC(a) | 2,471 | 130,938 | ||||
| TransAlta Corp. | 820 | 13,915 | ||||
| Veolia Environnement SA(a) | 17,472 | 220,497 | ||||
| Total Utilities | 680,372 | |||||
| Total Common Stocks | ||||||
| (Cost $40,878,708) | 35,988,581 | |||||
The accompanying notes are an integral part of these financial statements.
| 36 |
Schedule of Investments — continued
RevenueShares ADR Fund
June 30, 2012
| Investments | Shares | Value | ||||
| PREFERRED STOCKS—1.2% | ||||||
| Food, Beverage & Tobacco—0.2% | ||||||
| Cia de Bebidas das Americas(a) | 2,378 | $ | 91,149 | |||
| Materials—0.9% | ||||||
| Vale SA, Class B(a) | 16,757 | 326,929 | ||||
| Utilities—0.1% | ||||||
| Cia Paranaense de Energia-Copel | ||||||
| Preference B(a) | 1,221 | 26,471 | ||||
| Total Preferred Stocks | ||||||
| (Cost $537,440) | 444,549 | |||||
| INVESTMENT OF CASH COLLATERAL | ||||||
| FOR SECURITIES LOANED—2.5% | ||||||
| Dreyfus Institutional Preferred | ||||||
| Money Market Fund— | ||||||
| Prime Shares, 0.16%(c) | ||||||
| (Cost $913,653) | 913,653 | 913,653 | ||||
| Total Investments—102.1% | ||||||
| (Cost $42,329,801) | 37,346,783 | |||||
| Liabilities in Excess of Other Assets—(2.1)% | (759,750 | ) | ||||
| Net Assets—100.0% | $ | 36,587,033 | ||||
| % of | |||||
| Country | Value | Net Assets | |||
| Australia | $ | 439,697 | 1.2 | % | |
| Belgium | 423,317 | 1.2 | |||
| Brazil | 2,653,779 | 7.3 | |||
| Canada | 3,084,376 | 8.4 | |||
| Chile | 199,698 | 0.5 | |||
| China | 1,984,153 | 5.4 | |||
| Colombia | 220,985 | 0.6 | |||
| Denmark | 74,414 | 0.2 | |||
| Finland | 226,911 | 0.6 | |||
| France | 2,285,358 | 6.2 | |||
| Germany | 1,130,087 | 3.1 | |||
| Greece | 45,609 | 0.1 | |||
| Hong Kong | 2,494,918 | 6.8 | |||
| Ireland | 200,766 | 0.6 | |||
| Italy | 1,183,309 | 3.2 | |||
| Japan | 5,193,254 | 14.2 | |||
| Jersey Islands | 96,369 | 0.3 | |||
| Luxembourg | 568,819 | 1.6 | |||
| Mexico | 545,445 | 1.5 | |||
| Netherlands | 3,718,930 | 10.2 | |||
| Norway | 687,621 | 1.9 | |||
| Peru | 26,939 | 0.1 | |||
| Portugal | 51,660 | 0.1 | |||
| South Korea | 205,724 | 0.6 | |||
| Spain | 1,012,340 | 2.8 | |||
| Sweden | 188,370 | 0.5 | |||
| Switzerland | 1,149,129 | 3.1 | |||
| Taiwan | 135,361 | 0.4 | |||
| United Kingdom | 6,088,901 | 16.6 | |||
| United States | 1,030,544 | 2.8 | |||
| Total Investments | 37,346,783 | 102.1 | |||
| Liabilities in Excess of Other Assets | (759,750 | ) | (2.1 | ) | |
| Net Assets | $ | 36,587,033 | 100.0 | % | |
| PLC | – Public Limited Company |
| * | Non-income producing security |
| (a) | American Depositary Receipt |
| (b) | All or a portion of security is on loan. The aggregate market value of the securities on loan is $906,377; cash collateral of $913,653 (included in liabilities) was received with which the Fund purchased highly liquid short-term investments. |
| (c) | Rate shown represents annualized 7-day yield as of June 30, 2012. |
The accompanying notes are an integral part of these financial statements.
| 37 |
RevenueShares Navellier Overall A-100 Fund
June 30, 2012
| Investments | Shares | Value | ||||
| COMMON STOCKS—100.3% | ||||||
| Banks—1.6% | ||||||
| Access National Corp. | 742 | $ | 9,720 | |||
| Bank of The Ozarks, Inc. | 584 | 17,567 | ||||
| Heartland Financial USA, Inc. | 1,374 | 32,976 | ||||
| Horizon Bancorp | 398 | 10,467 | ||||
| Monarch Financial Holdings, Inc. | 1,290 | 12,706 | ||||
| Peoples Bancorp, Inc. | 619 | 13,606 | ||||
| Texas Capital Bancshares, Inc.* | 666 | 26,900 | ||||
| Total Banks | 123,942 | |||||
| Capital Goods—6.8% | ||||||
| Chart Industries, Inc.* | 556 | 38,230 | ||||
| DXP Enterprises, Inc.* | 415 | 17,218 | ||||
| Edac Technologies Corp.* | 1,170 | 13,198 | ||||
| Generac Holdings, Inc. | 1,148 | 27,621 | ||||
| Goodrich Corp. | 523 | 66,369 | ||||
| Sypris Solutions, Inc. | 6,798 | 47,382 | ||||
| Transdigm Group, Inc.* | 455 | 61,106 | ||||
| W.W. Grainger, Inc. | 1,290 | 246,700 | ||||
| Total Capital Goods | 517,824 | |||||
| Commercial & Professional Services—1.1% | ||||||
| Hudson Technologies, Inc.* | 1,481 | 6,102 | ||||
| Mistras Group, Inc.* | 736 | 19,342 | ||||
| Verisk Analytics, Inc., Class A* | 1,132 | 55,762 | ||||
| Total Commercial & Professional Services | 81,206 | |||||
| Consumer Durables & Apparel—6.6% | ||||||
| Arctic Cat, Inc.* | 419 | 15,319 | ||||
| LeapFrog Enterprises, Inc., Class A* | 5,662 | 58,092 | ||||
| Lululemon Athletica, Inc.* | 785 | 46,810 | ||||
| Polaris Industries, Inc. | 1,440 | 102,931 | ||||
| Smith & Wesson Holding Corp.* | 2,059 | 17,110 | ||||
| Sturm Ruger & Co., Inc. | 551 | 22,123 | ||||
| VF Corp. | 1,809 | 241,411 | ||||
| Total Consumer Durables & Apparel | 503,796 | |||||
| Consumer Services—2.5% | ||||||
| Cedar Fair LP | 1,623 | 48,641 | ||||
| Domino's Pizza, Inc. | 1,651 | 51,032 | ||||
| Multimedia Games Holding Co., Inc.* | 1,275 | 17,850 | ||||
| Papa John's International, Inc.* | 1,191 | 56,656 | ||||
| Shuffle Master, Inc.* | 836 | 11,537 | ||||
| Total Consumer Services | 185,716 | |||||
| Diversified Financials—0.8% | ||||||
| Main Street Capital Corp. | 599 | 14,496 | ||||
| Marketaxess Holdings, Inc. | 595 | 15,851 | ||||
| Ocwen Financial Corp., Class A* | 1,616 | 30,348 | ||||
| Total Diversified Financials | 60,695 | |||||
| Energy—3.4% | ||||||
| Ecopetrol SA(a) | 4,201 | 234,374 | ||||
| TGC Industries, Inc.* | 2,224 | 21,595 | ||||
| Total Energy | 255,969 | |||||
| Food & Staples Retailing—2.9% | ||||||
| Susser Holdings Corp.* | 5,957 | 221,422 | ||||
| Food, Beverage & Tobacco—9.1% | ||||||
| Boston Beer Co., Inc., Class A*(b) | 547 | 66,187 | ||||
| Investments | Shares | Value | ||||
| British American Tobacco PLC(a) | 5,249 | $ | 536,028 | |||
| Monster Beverage Corp.* | 1,178 | 83,873 | ||||
| Total Food, Beverage & Tobacco | 686,088 | |||||
| Health Care Equipment & Services—1.3% | ||||||
| Healthstream, Inc.* | 680 | 17,680 | ||||
| Intuitive Surgical, Inc.* | 126 | 69,778 | ||||
| Mediware Information Systems* | 942 | 13,753 | ||||
| Total Health Care Equipment & Services | 101,211 | |||||
| Household & Personal Products—1.7% | ||||||
| Nu Skin Enterprises, Inc., Class A | 1,163 | 54,545 | ||||
| USANA Health Sciences, Inc.* | 1,763 | 72,494 | ||||
| Total Household & Personal Products | 127,039 | |||||
| Insurance—8.2% | ||||||
| Allied World Assurance Co. | ||||||
| Holdings AG | 2,836 | 225,377 | ||||
| Amtrust Financial Services, Inc. | 1,813 | 53,864 | ||||
| Eastern Insurance Holdings, Inc. | 1,073 | 18,241 | ||||
| Homeowners Choice, Inc. | 871 | 15,330 | ||||
| ProAssurance Corp. | 202 | 17,996 | ||||
| White Mountains Insurance Group Ltd. | 559 | 291,658 | ||||
| Total Insurance | 622,466 | |||||
| Materials—1.7% | ||||||
| American Vanguard Corp. | 737 | 19,597 | ||||
| Arabian American Development Co.*(b) | 1,559 | 15,107 | ||||
| H.B. Fuller Co. | 782 | 24,007 | ||||
| Schweitzer-Mauduit International, Inc. | 251 | 17,103 | ||||
| Terra Nitrogen Co. LP | 198 | 41,936 | ||||
| U.S. Lime & Minerals, Inc.* | 252 | 11,761 | ||||
| Total Materials | 129,511 | |||||
| Media—2.0% | ||||||
| Beasley Broadcasting Group, Inc., | ||||||
| Class A* | 2,055 | 12,104 | ||||
| Madison Square Garden Co. | ||||||
| (The), Class A* | 3,787 | 141,785 | ||||
| Total Media | 153,889 | |||||
| Pharmaceuticals, Biotechnology & Life Sciences—4.4% | ||||||
| Akorn, Inc.*(b) | 1,260 | 19,870 | ||||
| Alexion Pharmaceuticals, Inc.* | 443 | 43,990 | ||||
| Biogen IDEC, Inc.* | 1,251 | 180,619 | ||||
| Cambrex Corp.* | 3,842 | 36,153 | ||||
| Jazz Pharmaceuticals PLC* | 455 | 20,480 | ||||
| Questcor Pharmaceuticals, Inc.* | 285 | 15,174 | ||||
| Spectrum Pharmaceuticals, Inc.* | 898 | 13,973 | ||||
| Total Pharmaceuticals, Biotechnology | ||||||
| & Life Sciences | 330,259 | |||||
| Real Estate—1.6% | ||||||
| Altisource Portfolio Solutions SA* | 368 | 26,949 | ||||
| Extra Space Storage, Inc.(d) | 1,519 | 46,481 | ||||
| Simon Property Group, Inc.(d) | 290 | 45,142 | ||||
| Total Real Estate | 118,572 | |||||
| Retailing—26.7% | ||||||
| America's Car-Mart, Inc.* | 562 | 21,834 | ||||
| Asbury Automotive Group, Inc.* | 21,800 | 516,442 | ||||
| AutoZone, Inc.* | 722 | 265,097 | ||||
The accompanying notes are an integral part of these financial statements.
| 38 |
Schedule of Investments — continued
RevenueShares Navellier Overall A-100 Fund
June 30, 2012
| Investments | Shares | Value | ||||
| Retailing (continued) | ||||||
| Bed Bath & Beyond, Inc.* | 4,871 | $ | 301,028 | |||
| Dillard's, Inc., Class A | 898 | 57,185 | ||||
| Genesco, Inc.* | 402 | 24,180 | ||||
| Lithia Motors, Inc., Class A | 3,740 | 86,207 | ||||
| Macy's, Inc. | 5,200 | 178,620 | ||||
| O'Reilly Automotive, Inc.*(b) | 2,113 | 177,006 | ||||
| Sally Beauty Holdings, Inc.* | 5,119 | 131,763 | ||||
| Select Comfort Corp.* | 1,818 | 38,033 | ||||
| Stamps.com, Inc.* | 544 | 13,420 | ||||
| Tractor Supply Co. | 1,708 | 141,866 | ||||
| Ulta Salon Cosmetics & Fragrance, Inc. | 793 | 74,050 | ||||
| Total Retailing | 2,026,731 | |||||
| Semiconductors & Semiconductor Equipment—0.1% | ||||||
| Silicon Motion Technology Corp.*(a) | 760 | 10,724 | ||||
| Software & Services—8.7% | ||||||
| Alliance Data Systems Corp.*(b) | 909 | 122,715 | ||||
| Blucora, Inc.* | 1,026 | 12,640 | ||||
| Cardtronics, Inc.* | 1,026 | 30,995 | ||||
| Fair Isaac Corp. | 734 | 31,034 | ||||
| IAC/InterActiveCorp | 518 | 23,621 | ||||
| Liquidity Services, Inc.* | 624 | 31,943 | ||||
| Manhattan Associates, Inc.* | 452 | 20,661 | ||||
| Mastercard, Inc., Class A | 487 | 209,464 | ||||
| NetEase, Inc.*(a) | 2,499 | 147,066 | ||||
| Solarwinds, Inc.* | 511 | 22,259 | ||||
| Top Image Systems Ltd.* | 884 | 3,898 | ||||
| Total Software & Services | 656,296 | |||||
| Investments | Shares | Value | ||||
| Technology Hardware & Equipment—8.8% | ||||||
| Apple, Inc.* | 927 | $ | 541,368 | |||
| Key Tronic Corp.* | 4,590 | 37,822 | ||||
| Micronetics, Inc.* | 373 | 5,490 | ||||
| Seagate Technology PLC | 3,355 | 82,969 | ||||
| Total Technology Hardware & Equipment | 667,649 | |||||
| Transportation—0.3% | ||||||
| Copa Holdings SA, Class A | 302 | 24,909 | ||||
| Total Common Stocks | ||||||
| (Cost $6,976,001) | 7,605,914 | |||||
| INVESTMENT OF CASH COLLATERAL | ||||||
| FOR SECURITIES LOANED—3.0% | ||||||
| Dreyfus Institutional Preferred | ||||||
| Money Market Fund— | ||||||
| Prime Shares, 0.16%(c) | ||||||
| (Cost $232,353) | 232,353 | 232,353 | ||||
| Total Investments—103.3% | ||||||
| (Cost $7,208,354) | 7,838,267 | |||||
| Liabilities in Excess of Other Assets—(3.3)% | (252,808 | ) | ||||
| Net Assets—100.0% | $ | 7,585,459 | ||||
PLC – Public Limited Company
| * | Non-income producing security |
| (a) | American Depositary Receipt |
| (b) | All or a portion of security is on loan. The aggregate market value of the securities on loan is $233,882; cash collateral of $232,353 (included in liabilities) was received with which the Fund purchased highly liquid short-term investments. |
| (c) | Rate shown represents annualized 7-day yield as of June 30, 2012. |
| (d) | Real Estate Investment Trust |
The accompanying notes are an integral part of these financial statements.
| 39 |
Statements Of Assets And Liabilities
June 30, 2012
| RevenueShares | ||||||||||||||||||
| RevenueShares | RevenueShares | RevenueShares | RevenueShares | Navellier | ||||||||||||||
| Large Cap | Mid Cap | Small Cap | Financials | RevenueShares | Overall A-100 | |||||||||||||
| Fund | Fund | Fund | Sector Fund | ADR Fund | Fund | |||||||||||||
| ASSETS: | ||||||||||||||||||
| Investments at value | ||||||||||||||||||
| (including securities | ||||||||||||||||||
| on loan) (Note 5)1 | $ | 160,638,071 | $ | 129,117,928 | $ | 114,088,542 | $ | 9,662,460 | $ | 37,346,783 | $ | 7,838,267 | ||||||
| Cash | 489,514 | 1,234,352 | 276,287 | 5,969 | 63,203 | 9,050 | ||||||||||||
| Receivables: | ||||||||||||||||||
| Expense reimbursement | ||||||||||||||||||
| due from Adviser | — | — | — | 7,973 | 2,225 | 6,325 | ||||||||||||
| Dividends | 185,778 | 106,075 | 83,108 | 5,829 | 195,428 | 1,488 | ||||||||||||
| Investment securities sold | 466,025 | 348,062 | 3,627,704 | — | — | 165,401 | ||||||||||||
| Securities lending income, | ||||||||||||||||||
| net (Note 2) | 1,264 | 2,376 | 1,303 | — | 200 | 5 | ||||||||||||
| Prepaid expenses | 6,853 | 6,604 | 6,492 | 5,746 | 6,030 | 3,539 | ||||||||||||
| Total Assets | 161,787,505 | 130,815,397 | 118,083,436 | 9,687,977 | 37,613,869 | 8,024,075 | ||||||||||||
| LIABILITIES: | ||||||||||||||||||
| Payables: | ||||||||||||||||||
| Collateral for securities | ||||||||||||||||||
| on loan (Note 2) | 4,432,320 | 5,937,980 | 4,526,261 | 425 | 913,653 | 232,353 | ||||||||||||
| Investment securities | ||||||||||||||||||
| purchased | 942,416 | 2,216,521 | 490,699 | — | 74,745 | 182,342 | ||||||||||||
| Capital shares redeemed | — | — | 3,371,005 | — | — | — | ||||||||||||
| Advisory fees (Note 3) | 33,158 | 20,443 | 18,391 | — | — | — | ||||||||||||
| Compliance Officer fees | 2,600 | 2,035 | 2,113 | 795 | 1,123 | 617 | ||||||||||||
| Trustee fees | 1,015 | 594 | 612 | 94 | 331 | 96 | ||||||||||||
| Other accrued expenses | 92,246 | 80,365 | 73,349 | 19,331 | 36,984 | 23,208 | ||||||||||||
| Total Liabilities | 5,503,755 | 8,257,938 | 8,482,430 | 20,645 | 1,026,836 | 438,616 | ||||||||||||
| NET ASSETS | $ | 156,283,750 | $ | 122,557,459 | $ | 109,601,006 | $ | 9,667,332 | $ | 36,587,033 | $ | 7,585,459 | ||||||
| NET ASSETS CONSIST OF: | ||||||||||||||||||
| Paid-in capital | $ | 142,215,972 | $ | 109,201,669 | $ | 102,111,698 | $ | 12,298,272 | $ | 44,177,909 | $ | 8,478,745 | ||||||
| Undistributed net investment | ||||||||||||||||||
| income (loss) | 688,718 | — | 249,977 | 13,975 | 142,122 | 12,737 | ||||||||||||
| Accumulated net realized | ||||||||||||||||||
| gain (loss) on investments | (5,089,546 | ) | (1,004,950 | ) | (698,673 | ) | (966,885 | ) | (2,749,980 | ) | (1,535,936 | ) | ||||||
| Net unrealized appreciation | ||||||||||||||||||
| (depreciation) on | ||||||||||||||||||
| investments | 18,468,606 | 14,360,740 | 7,938,004 | (1,678,030 | ) | (4,983,018 | ) | 629,913 | ||||||||||
| NET ASSETS | $ | 156,283,750 | $ | 122,557,459 | $ | 109,601,006 | $ | 9,667,332 | $ | 36,587,033 | $ | 7,585,459 | ||||||
| Shares outstanding | ||||||||||||||||||
| (unlimited number of | ||||||||||||||||||
| shares of beneficial interest | ||||||||||||||||||
| authorized, without | ||||||||||||||||||
| par value) | 6,201,400 | 4,101,400 | 3,251,400 | 350,000 | 1,150,000 | 200,000 | ||||||||||||
| Net asset value, per share | $ | 25.20 | $ | 29.88 | $ | 33.71 | $ | 27.62 | $ | 31.81 | $ | 37.93 | ||||||
| Investments at cost | $ | 142,169,465 | $ | 114,757,188 | $ | 106,150,538 | $ | 11,340,490 | $ | 42,329,801 | $ | 7,208,354 | ||||||
| 1 Market value of | ||||||||||||||||||
| securities on loan: | $ | 4,424,471 | $ | 5,939,386 | $ | 4,456,793 | $ | 417 | $ | 906,377 | $ | 233,882 |
The accompanying notes are an integral part of these financial statements.
| 40 |
Year Ended June 30, 2012
| RevenueShares | ||||||||||||||||||
| RevenueShares | RevenueShares | RevenueShares | RevenueShares | Navellier | ||||||||||||||
| Large Cap | Mid Cap | Small Cap | Financials | RevenueShares | Overall A-100 | |||||||||||||
| Fund | Fund | Fund | Sector Fund | ADR Fund | Fund | |||||||||||||
| INVESTMENT INCOME: | ||||||||||||||||||
| Dividend income | $ | 3,659,711 | $ | 1,684,826 | $ | 1,309,773 | $ | 127,522 | $ | 1,659,666 | $ | 170,022 | ||||||
| Foreign withholding tax | — | — | — | — | (182,047 | ) | (1,530 | ) | ||||||||||
| Securities lending income, | ||||||||||||||||||
| net (Note 2) | 1,264 | 2,376 | 1,303 | — | 200 | 5 | ||||||||||||
| Total Income | 3,660,975 | 1,687,202 | 1,311,076 | 127,522 | 1,477,819 | 168,497 | ||||||||||||
| EXPENSES: | ||||||||||||||||||
| Advisory fees (Note 3) | 745,410 | 643,818 | 570,848 | 38,941 | 256,523 | 56,896 | ||||||||||||
| BNY Fund Services fees | 282,672 | 242,651 | 239,004 | 21,586 | 101,507 | 31,450 | ||||||||||||
| Professional fees | 83,779 | 70,280 | 58,412 | 19,015 | 36,021 | 18,391 | ||||||||||||
| Compliance fees | 33,606 | 26,465 | 23,455 | 8,710 | 14,264 | 9,225 | ||||||||||||
| Principal Financial Officer fees | 17,050 | 14,038 | 12,700 | 5,618 | 8,188 | 5,739 | ||||||||||||
| Printing and Postage | 44,400 | 36,827 | 30,631 | 4,563 | 16,789 | 3,729 | ||||||||||||
| Trustees fees | 13,412 | 9,814 | 8,692 | 656 | 4,272 | 797 | ||||||||||||
| NYSE Listing fees | 4,943 | 4,942 | 4,940 | 4,952 | 4,950 | 278 | ||||||||||||
| Other expenses | 10,116 | 10,891 | 12,052 | 7,590 | 8,278 | 7,675 | ||||||||||||
| Total Expenses | 1,235,388 | 1,059,726 | 960,734 | 111,631 | 450,792 | 134,180 | ||||||||||||
| Less expense waivers and | ||||||||||||||||||
| reimbursements (Note 3) | (423,713 | ) | (364,402 | ) | (344,218 | ) | (69,229 | ) | (241,299 | ) | (77,284 | ) | ||||||
| Net Expenses | 811,675 | 695,324 | 616,516 | 42,402 | 209,493 | 56,896 | ||||||||||||
| Net Investment Income | 2,849,300 | 991,878 | 694,560 | 85,120 | 1,268,326 | 111,601 | ||||||||||||
| NET REALIZED AND UNREALIZED | ||||||||||||||||||
| GAIN (LOSS) ON INVESTMENTS: | ||||||||||||||||||
| Net realized gain (loss) | ||||||||||||||||||
| on investments | (2,315,376 | ) | 1,760,977 | (126,426 | ) | (634,923 | ) | (2,468,964 | ) | (1,555,905 | ) | |||||||
| Net realized gain (loss) on | ||||||||||||||||||
| in-kind redemptions | 9,762,524 | 5,900,516 | 5,652,820 | (329,147 | ) | 2,257,580 | 884,718 | |||||||||||
| Total net realized gain (loss) | 7,447,148 | 7,661,493 | 5,526,394 | (964,070 | ) | (211,384 | ) | (671,187 | ) | |||||||||
| Net change in unrealized | ||||||||||||||||||
| appreciation (depreciation) | ||||||||||||||||||
| on investments | (9,224,638 | ) | (13,900,467 | ) | (13,168,974 | ) | (270,013 | ) | (11,591,153 | ) | (307,826 | ) | ||||||
| Net realized and unrealized | ||||||||||||||||||
| gain (loss) on investments | (1,777,490 | ) | (6,238,974 | ) | (7,642,580 | ) | (1,234,083 | ) | (11,802,537 | ) | (979,013 | ) | ||||||
| Net Increase (Decrease) in | ||||||||||||||||||
| Net Assets Resulting | ||||||||||||||||||
| From Operations | $ | 1,071,810 | $ | (5,247,096 | ) | $ | (6,948,020 | ) | $ | (1,148,963 | ) | $ | (10,534,211 | ) | $ | (867,412 | ) | |
The accompanying notes are an integral part of these financial statements.
| 41 |
Statements of Changes in Net Assets
| RevenueShares | RevenueShares | RevenueShares | |||||||||||||||||
| Large Cap Fund | Mid Cap Fund | Small Cap Fund | |||||||||||||||||
| Year Ended | Year Ended | Year Ended | Year Ended | Year Ended | Year Ended | ||||||||||||||
| June 30, | June 30, | June 30, | June 30, | June 30, | June 30, | ||||||||||||||
| 2012 | 2011 | 2012 | 2011 | 2012 | 2011 | ||||||||||||||
| OPERATIONS: | |||||||||||||||||||
| Net investment income | $ | 2,849,300 | $ | 3,158,543 | $ | 991,878 | $ | 800,643 | $ | 694,560 | $ | 537,272 | |||||||
| Net realized gain (loss) | |||||||||||||||||||
| on investments | 7,447,148 | 7,035,281 | 7,661,493 | 9,122,464 | 5,526,394 | 13,656,528 | |||||||||||||
| Net change in unrealized | |||||||||||||||||||
| appreciation (depreciation) | |||||||||||||||||||
| on investments | (9,224,638 | ) | 35,293,707 | (13,900,467 | ) | 29,195,993 | (13,168,974 | ) | 21,053,552 | ||||||||||
| Net increase (decrease) | |||||||||||||||||||
| in net assets resulting | |||||||||||||||||||
| from operations | 1,071,810 | 45,487,531 | (5,247,096 | ) | 39,119,100 | (6,948,020 | ) | 35,247,352 | |||||||||||
| DISTRIBUTIONS TO | |||||||||||||||||||
| SHAREHOLDERS FROM: | |||||||||||||||||||
| Net investment income | (2,947,099 | ) | (2,871,609 | ) | (955,245 | ) | (762,231 | ) | (525,064 | ) | (543,364 | ) | |||||||
| Realized gains | — | — | (3,004,099 | ) | — | — | — | ||||||||||||
| Total distributions | |||||||||||||||||||
| to shareholders | (2,947,099 | ) | (2,871,609 | ) | (3,959,344 | ) | (762,231 | ) | (525,064 | ) | (543,364 | ) | |||||||
| SHAREHOLDER TRANSACTIONS: | |||||||||||||||||||
| Proceeds from shares sold | 4,872,841 | 48,640,531 | 15,756,545 | 30,030,204 | 19,561,410 | 27,782,757 | |||||||||||||
| Cost of shares redeemed | (48,014,378 | ) | (28,676,563 | ) | (28,227,159 | ) | (24,422,486 | ) | (33,504,188 | ) | (40,788,847 | ) | |||||||
| Net increase (decrease) in | |||||||||||||||||||
| net assets resulting from | |||||||||||||||||||
| shareholder transactions | (43,141,537 | ) | 19,963,968 | (12,470,614 | ) | 5,607,718 | (13,942,778 | ) | (13,006,090 | ) | |||||||||
| Increase (Decrease) in | |||||||||||||||||||
| net assets | (45,016,826 | ) | 62,579,890 | (21,677,054 | ) | 43,964,587 | (21,415,862 | ) | 21,697,898 | ||||||||||
| NET ASSETS: | |||||||||||||||||||
| Beginning of year | 201,300,576 | 138,720,686 | 144,234,513 | 100,269,926 | 131,016,868 | 109,318,970 | |||||||||||||
| End of year | $ | 156,283,750 | $ | 201,300,576 | $ | 122,557,459 | $ | 144,234,513 | $ | 109,601,006 | $ | 131,016,868 | |||||||
| Undistributed net investment | |||||||||||||||||||
| income (loss) included in | |||||||||||||||||||
| net assets at end of year | $ | 688,718 | $ | 786,517 | $ | — | $ | 188,715 | $ | 249,977 | $ | 80,481 | |||||||
| CHANGES IN SHARES | |||||||||||||||||||
| OUTSTANDING: | |||||||||||||||||||
| Shares outstanding, | |||||||||||||||||||
| beginning of year | 8,051,400 | 7,151,400 | 4,551,400 | 4,351,400 | 3,801,400 | 4,301,400 | |||||||||||||
| Shares sold | 200,000 | 2,150,000 | 550,000 | 1,050,000 | 550,000 | 850,000 | |||||||||||||
| Shares redeemed | (2,050,000 | ) | (1,250,000 | ) | (1,000,000 | ) | (850,000 | ) | (1,100,000 | ) | (1,350,000 | ) | |||||||
| Shares outstanding, | |||||||||||||||||||
| end of year | 6,201,400 | 8,051,400 | 4,101,400 | 4,551,400 | 3,251,400 | 3,801,400 | |||||||||||||
The accompanying notes are an integral part of these financial statements.
| 42 |
Statements of Changes in Net Assets — concluded
| RevenueShares | RevenueShares | |||||||||||||||||
| Financials Sector Fund | RevenueShares ADR Fund | Navellier Overall A-100 Fund | ||||||||||||||||
| Year Ended | Year Ended | Year Ended | Year Ended | Year Ended | Year Ended | |||||||||||||
| June 30, | June 30, | June 30, | June 30, | June 30, | June 30, | |||||||||||||
| 2012 | 2011 | 2012 | 2011 | 2012 | 2011 | |||||||||||||
| OPERATIONS: | ||||||||||||||||||
| Net investment income | $ | 85,120 | $ | 321,350 | $ | 1,268,326 | $ | 1,552,721 | $ | 111,601 | $ | 103,630 | ||||||
| Net realized gain (loss) | ||||||||||||||||||
| on investments | (964,070 | ) | 1,121,942 | (211,384 | ) | 946,612 | (671,187 | ) | 2,925,409 | |||||||||
| Net change in unrealized | ||||||||||||||||||
| appreciation (depreciation) | ||||||||||||||||||
| on investments | (270,013 | ) | 18,835 | (11,591,153 | ) | 12,828,518 | (307,826 | ) | 515,010 | |||||||||
| Net increase (decrease) in | ||||||||||||||||||
| net assets resulting | ||||||||||||||||||
| from operations | (1,148,963 | ) | 1,462,127 | (10,534,211 | ) | 15,327,851 | (867,412 | ) | 3,544,049 | |||||||||
| DISTRIBUTIONS TO | ||||||||||||||||||
| SHAREHOLDERS FROM: | ||||||||||||||||||
| Net investment income | (98,921 | ) | (309,165 | ) | (1,906,146 | ) | (1,346,857 | ) | (101,716 | ) | (111,815 | ) | ||||||
| Realized gains | — | — | (280,536 | ) | — | (110,327 | ) | — | ||||||||||
| Total distributions to | ||||||||||||||||||
| shareholders | (98,921 | ) | (309,165 | ) | (2,186,682 | ) | (1,346,857 | ) | (212,043 | ) | (111,815 | ) | ||||||
| SHAREHOLDER TRANSACTIONS: | ||||||||||||||||||
| Proceeds from shares sold | 1,326,786 | 3,124,104 | — | 15,646,588 | 5,602,571 | 7,050,083 | ||||||||||||
| Cost of shares redeemed | (2,291,797 | ) | (16,968,366 | ) | (22,408,571 | ) | (5,552,019 | ) | (7,433,585 | ) | (10,374,496 | ) | ||||||
| Net increase (decrease) in | ||||||||||||||||||
| net assets resulting from | ||||||||||||||||||
| shareholder transactions | (965,011 | ) | (13,844,262 | ) | (22,408,571 | ) | 10,094,569 | (1,831,014 | ) | (3,324,413 | ) | |||||||
| Increase (Decrease) in | ||||||||||||||||||
| net assets | (2,212,895 | ) | (12,691,300 | ) | (35,129,464 | ) | 24,075,563 | (2,910,469 | ) | 107,821 | ||||||||
| NET ASSETS: | ||||||||||||||||||
| Beginning of year | 11,880,227 | 24,571,527 | 71,716,497 | 47,640,934 | 10,495,928 | 10,388,107 | ||||||||||||
| End of year | $ | 9,667,332 | $ | 11,880,227 | $ | 36,587,033 | $ | 71,716,497 | $ | 7,585,459 | $ | 10,495,928 | ||||||
| Undistributed net investment | ||||||||||||||||||
| income (loss) included in | ||||||||||||||||||
| net assets at end of year | $ | 13,975 | $ | 27,776 | $ | 142,122 | $ | 773,393 | $ | 12,737 | $ | 2,854 | ||||||
| CHANGES IN SHARES | ||||||||||||||||||
| OUTSTANDING: | ||||||||||||||||||
| Shares outstanding, | ||||||||||||||||||
| beginning of year | 400,000 | 900,000 | 1,800,000 | 1,550,000 | 250,000 | 350,000 | ||||||||||||
| Shares sold | 50,000 | 100,000 | — | 400,000 | 150,000 | 200,000 | ||||||||||||
| Shares redeemed | (100,000 | ) | (600,000 | ) | (650,000 | ) | (150,000 | ) | (200,000 | ) | (300,000 | ) | ||||||
| Shares outstanding, | ||||||||||||||||||
| end of year | 350,000 | 400,000 | 1,150,000 | 1,800,000 | 200,000 | 250,000 | ||||||||||||
The accompanying notes are an integral part of these financial statements.
| 43 |
RevenueShares Large Cap Fund
For a share outstanding throughout each period presented.
| For the Period | ||||||||||||||||
| Year Ended June 30, | February 22, 20081 | |||||||||||||||
| Through | ||||||||||||||||
| 2012 | 2011 | 2010 | 20092 | June 30, 20082 | ||||||||||||
| Per Share Operating Performance: | ||||||||||||||||
| Net asset value, beginning of period | $ | 25.00 | $ | 19.40 | $ | 16.63 | $ | 22.87 | $ | 25.00 | ||||||
| Net investment income3 | 0.41 | 0.39 | 0.29 | 0.33 | 0.15 | |||||||||||
| Net realized and unrealized gain (loss) | ||||||||||||||||
| on investments | 0.21 | 7 | 5.57 | 2.74 | (6.34 | ) | (2.23 | ) | ||||||||
| Total gain (loss) from investment operations | 0.62 | 5.96 | 3.03 | (6.01 | ) | (2.08 | ) | |||||||||
| Less Distributions from: | ||||||||||||||||
| Net investment income | (0.42 | ) | (0.36 | ) | (0.26 | ) | (0.23 | ) | (0.05 | ) | ||||||
| Net asset value, end of period | $ | 25.20 | $ | 25.00 | $ | 19.40 | $ | 16.63 | $ | 22.87 | ||||||
| Total Return at Net Asset Value4 | 2.59 | % | 30.97 | % | 18.21 | % | (26.27 | )% | (8.31 | )% | ||||||
| Total Return at Market Value4 | 2.57 | % | 30.94 | % | 17.99 | % | (26.52 | )% | (8.19 | )% | ||||||
| Ratios/Supplemental Data: | ||||||||||||||||
| Net assets, end of period (000's omitted) | $ | 156,284 | $ | 201,301 | $ | 138,721 | $ | 53,233 | $ | 32,048 | ||||||
| Ratio to average net assets of: | ||||||||||||||||
| Expenses, net of expense waivers | ||||||||||||||||
| and reimbursements | 0.49 | % | 0.49 | % | 0.49 | % | 0.49 | % | 0.49 | %5 | ||||||
| Expenses, prior to expense waivers | ||||||||||||||||
| and reimbursements | 0.75 | % | 0.73 | % | 0.85 | % | 1.89 | % | 2.32 | %5 | ||||||
| Net investment income, net of waivers | ||||||||||||||||
| and reimbursements | 1.72 | % | 1.68 | % | 1.44 | % | 2.05 | % | 1.87 | %5 | ||||||
| Portfolio turnover rate6 | 29.05 | % | 12.73 | % | 6.72 | % | 23.67 | % | 0.88 | % | ||||||
| 1 | Commencement of operations. |
| 2 | On November 6, 2008, there was a 2 for 1 stock split. Historical per share amounts have been adjusted to reflect the 2 for 1 split on a retroactive basis. |
| 3 | Based on average daily shares outstanding. |
| 4 | Net asset value total return is calculated assuming an initial investment made at the net asset value at the beginning of the period, reinvestment of all dividends and distributions at net asset value during the period and redemption on the last day of the period at net asset value. Market value total return is calculated assuming an initial investment made at the market value at the beginning of the period, reinvestment of all dividends, and distributions at market value during the period, and sale at the market value on the last day of the period. Market value is determined by trading that occurs on the NYSE Arca, and may be greater or less than net asset value, depending on the 4 p.m. mean of the bid and offer prices for a share of the Fund. Total return calculated for a period of less than one year is not annualized. The total return would have been lower if certain expenses had not been reimbursed/waived by the Adviser. Prior to June 30, 2010, the total return at market value reported in these Financial Highlights was calculated based on the Fund’s closing price on the NYSE Arca. |
| 5 | Annualized for periods less than one year. |
| 6 | Portfolio turnover rate is not annualized and excludes the value of portfolio securities received or delivered as a result of in-kind creations or redemptions of the Funds’ capital shares. |
| 7 | The amount of net gain from securities (both realized and unrealized) per share does not accord with the amounts reported in the Statement of Operations due to the timing of purchases and redemptions of Fund shares during the year. |
The accompanying notes are an integral part of these financial statements.
| 44 |
Financial Highlights — continued
RevenueShares Mid Cap Fund
For a share outstanding throughout each period presented.
| For the Period | ||||||||||||||||
| Year Ended June 30, | February 22, 20081 | |||||||||||||||
| Through | ||||||||||||||||
| 2012 | 2011 | 2010 | 20092 | June 30, 20082 | ||||||||||||
| Per Share Operating Performance: | ||||||||||||||||
| Net asset value, beginning of period | $ | 31.69 | $ | 23.04 | $ | 18.84 | $ | 24.17 | $ | 25.00 | ||||||
| Net investment income3 | 0.23 | 0.18 | 0.17 | 0.18 | 0.08 | |||||||||||
| Net realized and unrealized gain (loss) | ||||||||||||||||
| on investments | (1.15 | ) | 8.64 | 4.18 | (5.36 | ) | (0.84 | ) | ||||||||
| Total gain (loss) from investment operations | (0.92 | ) | 8.82 | 4.35 | (5.18 | ) | (0.76 | ) | ||||||||
| Less Distributions from: | ||||||||||||||||
| Net investment income | (0.22 | ) | (0.17 | ) | (0.15 | ) | (0.15 | ) | (0.07 | ) | ||||||
| Realized gains | (0.67 | ) | — | — | — | — | ||||||||||
| Total distributions | (0.89 | ) | (0.17 | ) | (0.15 | ) | (0.15 | ) | (0.07 | ) | ||||||
| Net asset value, end of period | $ | 29.88 | $ | 31.69 | $ | 23.04 | $ | 18.84 | $ | 24.17 | ||||||
| Total Return at Net Asset Value4 | (2.72 | )% | 38.40 | % | 23.07 | % | (21.39 | )% | (3.02 | )% | ||||||
| Total Return at Market Value4 | (2.80 | )% | 38.42 | % | 22.86 | % | (21.71 | )% | (2.44 | )% | ||||||
| Ratios/Supplemental Data: | ||||||||||||||||
| Net assets, end of period (000's omitted) | $ | 122,557 | $ | 144,235 | $ | 100,270 | $ | 30,166 | $ | 4,869 | ||||||
| Ratio to average net assets of: | ||||||||||||||||
| Expenses, net of expense waivers | ||||||||||||||||
| and reimbursements | 0.54 | % | 0.54 | % | 0.54 | % | 0.54 | % | 0.54 | %5 | ||||||
| Expenses, prior to expense waivers | ||||||||||||||||
| and reimbursements | 0.82 | % | 0.81 | % | 0.89 | % | 2.02 | % | 4.93 | %5 | ||||||
| Net investment income, net of waivers | ||||||||||||||||
| and reimbursements | 0.77 | % | 0.61 | % | 0.71 | % | 1.12 | % | 0.89 | %5 | ||||||
| Portfolio turnover rate6 | 55.02 | % | 38.03 | % | 14.51 | % | 35.25 | % | 1.07 | % | ||||||
| 1 | Commencement of operations. |
| 2 | On November 6, 2008, there was a 2 for 1 stock split. Historical per share amounts have been adjusted to reflect the 2 for 1 split on a retroactive basis. |
| 3 | Based on average daily shares outstanding. |
| 4 | Net asset value total return is calculated assuming an initial investment made at the net asset value at the beginning of the period, reinvestment of all dividends and distributions at net asset value during the period and redemption on the last day of the period at net asset value. Market value total return is calculated assuming an initial investment made at the market value at the beginning of the period, reinvestment of all dividends, and distributions at market value during the period, and sale at the market value on the last day of the period. Market value is determined by trading that occurs on the NYSE Arca, and may be greater or less than net asset value, depending on the 4 p.m. mean of the bid and offer prices for a share of the Fund. Total return calculated for a period of less than one year is not annualized. The total return would have been lower if certain expenses had not been reimbursed/waived by the Adviser. Prior to June 30, 2010, the total return at market value reported in these Financial Highlights was calculated based on the Fund’s closing price on the NYSE Arca. |
| 5 | Annualized for periods less than one year. |
| 6 | Portfolio turnover rate is not annualized and excludes the value of portfolio securities received or delivered as a result of in-kind creations or redemptions of the Funds’ capital shares. |
The accompanying notes are an integral part of these financial statements.
| 45 |
Financial Highlights — continued
RevenueShares Small Cap Fund
For a share outstanding throughout each period presented.
| For the Period | ||||||||||||||||
| Year Ended June 30, | February 22, 20081 | |||||||||||||||
| Through | ||||||||||||||||
| 2012 | 2011 | 2010 | 20092 | June 30, 20082 | ||||||||||||
| Per Share Operating Performance: | ||||||||||||||||
| Net asset value, beginning of period | $ | 34.47 | $ | 25.41 | $ | 20.04 | $ | 23.35 | $ | 25.00 | ||||||
| Net investment income3 | 0.20 | 0.14 | 0.07 | 0.11 | 0.08 | |||||||||||
| Net realized and unrealized gain (loss) | ||||||||||||||||
| on investments | (0.81 | ) | 9.06 | 5.35 | (3.32 | ) | (1.67 | ) | ||||||||
| Total gain (loss) from investment operations | (0.61 | ) | 9.20 | 5.42 | (3.21 | ) | (1.59 | ) | ||||||||
| Less Distributions from: | ||||||||||||||||
| Net investment income | (0.15 | ) | (0.14 | ) | (0.05 | ) | (0.10 | ) | (0.06 | ) | ||||||
| Net asset value, end of period | $ | 33.71 | $ | 34.47 | $ | 25.41 | $ | 20.04 | $ | 23.35 | ||||||
| Total Return at Net Asset Value4 | (1.75 | )% | 36.26 | % | 27.07 | % | (13.67 | )% | (6.36 | )% | ||||||
| Total Return at Market Value4 | (1.67 | )% | 36.10 | % | 26.88 | % | (13.67 | )% | (6.10 | )% | ||||||
| Ratios/Supplemental Data: | ||||||||||||||||
| Net assets, end of period (000's omitted) | $ | 109,601 | $ | 131,017 | $ | 109,319 | $ | 32,099 | $ | 4,702 | ||||||
| Ratio to average net assets of: | ||||||||||||||||
| Expenses, net of expense waivers | ||||||||||||||||
| and reimbursements | 0.54 | % | 0.54 | % | 0.54 | % | 0.54 | % | 0.54 | %5 | ||||||
| Expenses, prior to expense waivers | ||||||||||||||||
| and reimbursements | 0.84 | % | 0.83 | % | 0.89 | % | 2.20 | % | 5.03 | %5 | ||||||
| Net investment income, net of waivers | ||||||||||||||||
| and reimbursements | 0.61 | % | 0.44 | % | 0.25 | % | 0.62 | % | 0.85 | %5 | ||||||
| Portfolio turnover rate6 | 47.80 | % | 33.72 | % | 16.33 | % | 32.38 | % | 6.44 | % | ||||||
| 1 | Commencement of operations. |
| 2 | On November 6, 2008, there was a 2 for 1 stock split. Historical per share amounts have been adjusted to reflect the 2 for 1 split on a retroactive basis. |
| 3 | Based on average daily shares outstanding. |
| 4 | Net asset value total return is calculated assuming an initial investment made at the net asset value at the beginning of the period, reinvestment of all dividends and distributions at net asset value during the period and redemption on the last day of the period at net asset value. Market value total return is calculated assuming an initial investment made at the market value at the beginning of the period, reinvestment of all dividends, and distributions at market value during the period, and sale at the market value on the last day of the period. Market value is determined by trading that occurs on the NYSE Arca, and may be greater or less than net asset value, depending on the 4 p.m. mean of the bid and offer prices for a share of the Fund. Total return calculated for a period of less than one year is not annualized. The total return would have been lower if certain expenses had not been reimbursed/waived by the Adviser. Prior to June 30, 2010, the total return at market value reported in these Financial Highlights was calculated based on the Fund’s closing price on the NYSE Arca. |
| 5 | Annualized for periods less than one year. |
| 6 | Portfolio turnover rate is not annualized and excludes the value of portfolio securities received or delivered as a result of in-kind creations or redemptions of the Funds’ capital shares. |
The accompanying notes are an integral part of these financial statements.
| 46 |
Financial Highlights — continued
RevenueShares Financials Sector Fund
For a share outstanding throughout each period presented.
| For the Period | ||||||||||||
| Year Ended June 30, | November 10, 20081 | |||||||||||
| Through | ||||||||||||
| 2012 | 2011 | 2010 | June 30, 2009 | |||||||||
| Per Share Operating Performance: | ||||||||||||
| Net asset value, beginning of period | $ | 29.70 | $ | 27.30 | $ | 22.36 | $ | 25.00 | ||||
| Net investment income3 | 0.26 | 0.46 | 0.15 | 0.19 | ||||||||
| Net realized and unrealized gain (loss) on investments | (2.05 | ) | 2.41 | 4.96 | (2.69 | ) | ||||||
| Total gain (loss) from investment operations | (1.79 | ) | 2.87 | 5.11 | (2.50 | ) | ||||||
| Less Distributions from: | ||||||||||||
| Net investment income | (0.29 | ) | (0.47 | ) | (0.17 | ) | (0.14 | ) | ||||
| Net asset value, end of period | $ | 27.62 | $ | 29.70 | $ | 27.30 | $ | 22.36 | ||||
| Total Return at Net Asset Value4 | (5.95 | )% | 10.40 | % | 22.87 | % | (9.87 | )% | ||||
| Total Return at Market Value4 | (5.93 | )% | 10.29 | % | 23.00 | % | (10.03 | )% | ||||
| Ratios/Supplemental Data: | ||||||||||||
| Net assets, end of period (000's omitted) | $ | 9,667 | $ | 11,880 | $ | 24,572 | $ | 5,590 | ||||
| Ratio to average net assets of: | ||||||||||||
| Expenses, net of expense waivers and reimbursements | 0.49 | % | 0.49 | % | 0.49 | % | 0.49 | %5 | ||||
| Expenses, prior to expense waivers and reimbursements | 1.29 | % | 1.03 | % | 1.11 | % | 3.14 | %5 | ||||
| Net investment income, net of waivers and reimbursements | 0.98 | % | 1.52 | % | 0.51 | % | 1.60 | %5 | ||||
| Portfolio turnover rate6 | 26.17 | % | 15.99 | % | 1.76 | % | 19.26 | % | ||||
| 1 | Commencement of operations. |
| 2 | On November 6, 2008, there was a 2 for 1 stock split. Historical per share amounts have been adjusted to reflect the 2 for 1 split on a retroactive basis. |
| 3 | Based on average daily shares outstanding. |
| 4 | Net asset value total return is calculated assuming an initial investment made at the net asset value at the beginning of the period, reinvestment of all dividends and distributions at net asset value during the period and redemption on the last day of the period at net asset value. Market value total return is calculated assuming an initial investment made at the market value at the beginning of the period, reinvestment of all dividends, and distributions at market value during the period, and sale at the market value on the last day of the period. Market value is determined by trading that occurs on the NYSE Arca, and may be greater or less than net asset value, depending on the 4 p.m. mean of the bid and offer prices for a share of the Fund. Total return calculated for a period of less than one year is not annualized. The total return would have been lower if certain expenses had not been reimbursed/waived by the Adviser. Prior to June 30, 2010, the total return at market value reported in these Financial Highlights was calculated based on the Fund’s closing price on the NYSE Arca. |
| 5 | Annualized for periods less than one year. |
| 6 | Portfolio turnover rate is not annualized and excludes the value of portfolio securities received or delivered as a result of in-kind creations or redemptions of the Funds’ capital shares. |
The accompanying notes are an integral part of these financial statements.
| 47 |
Financial Highlights — continued
RevenueShares ADR Fund
For a share outstanding throughout each period presented.
| For the Period | ||||||||||||
| Year Ended June 30, | November 18, 20081 | |||||||||||
| Through | ||||||||||||
| 2012 | 2011 | 2010 | June 30, 2009 | |||||||||
| Per Share Operating Performance: | ||||||||||||
| Net asset value, beginning of period | $ | 39.84 | $ | 30.74 | $ | 30.09 | $ | 25.00 | ||||
| Net investment income3 | 1.00 | 0.96 | 1.07 | 0.58 | ||||||||
| Net realized and unrealized gain (loss) on investments | (7.47 | ) | 9.01 | 0.40 | 4.68 | |||||||
| Total gain (loss) from investment operations | (6.47 | ) | 9.97 | 1.47 | 5.26 | |||||||
| Less Distributions from: | ||||||||||||
| Net investment income | (1.33 | ) | (0.87 | ) | (0.68 | ) | (0.17 | ) | ||||
| Realized gains | (0.23 | ) | — | (0.14 | ) | — | ||||||
| Total distributions | (1.56 | ) | (0.87 | ) | (0.82 | ) | (0.17 | ) | ||||
| Net asset value, end of period | $ | 31.81 | $ | 39.84 | $ | 30.74 | $ | 30.09 | ||||
| Total Return at Net Asset Value4 | (16.30 | )% | 32.89 | % | 4.64 | % | 21.15 | % | ||||
| Total Return at Market Value4 | (16.32 | )% | 32.90 | % | 4.55 | % | 21.18 | % | ||||
| Ratios/Supplemental Data: | ||||||||||||
| Net assets, end of period (000's omitted) | $ | 36,587 | $ | 71,716 | $ | 47,641 | $ | 7,522 | ||||
| Ratio to average net assets of: | ||||||||||||
| Expenses, net of expense waivers and reimbursements | 0.49 | % | 0.49 | % | 0.49 | % | 0.49 | %5 | ||||
| Expenses, prior to expense waivers and reimbursements | 1.05 | % | 0.99 | % | 1.08 | % | 3.52 | %5 | ||||
| Net investment income, net of waivers and reimbursements | 2.97 | % | 2.55 | % | 3.06 | % | 3.79 | %5 | ||||
| Portfolio turnover rate6 | 35.04 | % | 37.11 | % | 45.80 | % | 82.02 | % | ||||
| 1 | Commencement of operations. |
| 2 | On November 6, 2008, there was a 2 for 1 stock split. Historical per share amounts have been adjusted to reflect the 2 for 1 split on a retroactive basis. |
| 3 | Based on average daily shares outstanding. |
| 4 | Net asset value total return is calculated assuming an initial investment made at the net asset value at the beginning of the period, reinvestment of all dividends and distributions at net asset value during the period and redemption on the last day of the period at net asset value. Market value total return is calculated assuming an initial investment made at the market value at the beginning of the period, reinvestment of all dividends, and distributions at market value during the period, and sale at the market value on the last day of the period. Market value is determined by trading that occurs on the NYSE Arca, and may be greater or less than net asset value, depending on the 4 p.m. mean of the bid and offer prices for a share of the Fund. Total return calculated for a period of less than one year is not annualized. The total return would have been lower if certain expenses had not been reimbursed/waived by the Adviser. Prior to June 30, 2010, the total return at market value reported in these Financial Highlights was calculated based on the Fund’s closing price on the NYSE Arca. |
| 5 | Annualized for periods less than one year. |
| 6 | Portfolio turnover rate is not annualized and excludes the value of portfolio securities received or delivered as a result of in-kind creations or redemptions of the Funds’ capital shares. |
The accompanying notes are an integral part of these financial statements.
| 48 |
Financial Highlights — concluded
RevenueShares Navellier Overall A-100 Fund
For a share outstanding throughout each period presented.
| For the Period | ||||||||||||
| Year Ended June 30, | January 21, 20091 | |||||||||||
| Through | ||||||||||||
| 2012 | 2011 | 2010 | June 30, 2009 | |||||||||
| Per Share Operating Performance: | ||||||||||||
| Net asset value, beginning of period | $ | 41.98 | $ | 29.68 | $ | 27.52 | $ | 25.00 | ||||
| Net investment income3 | 0.44 | 0.39 | 0.10 | 0.09 | ||||||||
| Net realized and unrealized gain (loss) on investments | (3.67 | ) | 12.32 | 2.61 | 2.52 | |||||||
| Total gain (loss) from investment operations | (3.23 | ) | 12.71 | 2.71 | 2.61 | |||||||
| Less Distributions from: | ||||||||||||
| Net investment income | (0.38 | ) | (0.41 | ) | (0.07 | ) | (0.09 | ) | ||||
| Realized gains | (0.44 | ) | — | (0.48 | ) | — | ||||||
| Total distributions | (0.82 | ) | (0.41 | ) | (0.55 | ) | (0.09 | ) | ||||
| Net asset value, end of period | $ | 37.93 | $ | 41.98 | $ | 29.68 | $ | 27.52 | ||||
| Total Return at Net Asset Value4 | (7.61 | )% | 43.05 | % | 9.70 | % | 10.48 | % | ||||
| Total Return at Market Value4 | (7.93 | )% | 43.22 | % | 9.81 | % | 10.69 | % | ||||
| Ratios/Supplemental Data: | ||||||||||||
| Net assets, end of period (000's omitted) | $ | 7,585 | $ | 10,496 | $ | 10,388 | $ | 5,504 | ||||
| Ratio to average net assets of: | ||||||||||||
| Expenses, net of expense waivers and reimbursements | 0.60 | % | 0.60 | % | 0.60 | % | 0.60 | %5 | ||||
| Expenses, prior to expense waivers and reimbursements | 1.42 | % | 1.60 | % | 1.40 | % | 3.72 | %5 | ||||
| Net investment income, net of waivers and reimbursements | 1.18 | % | 1.06 | % | 0.32 | % | 0.81 | %5 | ||||
| Portfolio turnover rate6 | 154.06 | % | 190.44 | % | 182.12 | % | 32.48 | % | ||||
| 1 | Commencement of operations. |
| 2 | On November 6, 2008, there was a 2 for 1 stock split. Historical per share amounts have been adjusted to reflect the 2 for 1 split on a retroactive basis. |
| 3 | Based on average daily shares outstanding. |
| 4 | Net asset value total return is calculated assuming an initial investment made at the net asset value at the beginning of the period, reinvestment of all dividends and distributions at net asset value during the period and redemption on the last day of the period at net asset value. Market value total return is calculated assuming an initial investment made at the market value at the beginning of the period, reinvestment of all dividends, and distributions at market value during the period, and sale at the market value on the last day of the period. Market value is determined by trading that occurs on the NYSE Arca, and may be greater or less than net asset value, depending on the 4 p.m. mean of the bid and offer prices for a share of the Fund. Total return calculated for a period of less than one year is not annualized. The total return would have been lower if certain expenses had not been reimbursed/waived by the Adviser. Prior to June 30, 2010, the total return at market value reported in these Financial Highlights was calculated based on the Fund’s closing price on the NYSE Arca. |
| 5 | Annualized for periods less than one year. |
| 6 | Portfolio turnover rate is not annualized and excludes the value of portfolio securities received or delivered as a result of in-kind creations or redemptions of the Funds’ capital shares. |
The accompanying notes are an integral part of these financial statements.
| 49 |
1. Organization
The RevenueShares ETF Trust (the “Trust”) was organized as a Delaware statutory trust on December 15, 2006 and has authorized capital of unlimited shares. The Trust is an open-end management investment company, registered under the Investment Company Act of 1940, as amended (the “Act”), which is currently comprised of six active funds (collectively, the “Funds” and each individually a “Fund”). The RevenueShares Large Cap Fund, RevenueShares Mid Cap Fund and RevenueShares Small Cap Fund are diversified funds under the Act, the RevenueShares Financials Sector Fund, RevenueShares ADR Fund and RevenueShares Navellier Overall A-100 Fund are not diversified. Operations commenced on February 22, 2008 for the RevenueShares Large Cap Fund, RevenueShares Mid Cap Fund and RevenueShares Small Cap Fund, November 10, 2008 for the RevenueShares Financials Sector Fund, November 18, 2008 for the RevenueShares ADR Fund and January 21, 2009 for the RevenueShares Navellier Overall A-100 Fund.
The objective of the Funds (RevenueShares Large Cap Fund, RevenueShares Mid Cap Fund, RevenueShares Small Cap Fund, RevenueShares Financials Sector Fund, RevenueShares ADR Fund, and RevenueShares Navellier Overall A-100 Fund) is to outperform the total return performance of the Funds’ corresponding benchmarks (Standard & Poor’s (“S&P”) 500 Index, S&P MidCap 400 Index, S&P SmallCap 600 Index, S&P 500 Financials Index, S&P ADR Index, and the Navellier Overall A-100 Index, respectively).
2. Significant Accounting Policies
These financial statements are prepared in accordance with accounting principles generally accepted in the United States, which require management to make estimates and assumptions that affect the reported amount of assets and liabilities, the disclosure of contingent liabilities at the date of the financial statements, and the reported amount of increase and decrease in net assets from operations during the fiscal period. Actual amounts could differ from these estimates. The following summarizes the significant accounting policies of the Funds:
Investment Valuation — Security holdings traded on a national securities exchange are valued based on their last sale price. Price information on listed securities is taken from the exchange where the security is primarily traded. Securities regularly traded in an over the counter market are valued at the latest quoted sale price in such market or in the case of the NASDAQ, at the NASDAQ Official Closing Price. Other portfolio securities and assets for which market quotations are not readily available are valued based on fair value as determined in good faith and in accordance with procedures adopted by the Trust’s Board of Trustees (the “Board”).
The Net Asset Value (“NAV”) per share of each Fund is computed by dividing the value of the net assets of each Fund by the total number of outstanding shares of that Fund, rounded to the nearest cent. The Bank of New York Mellon Corp. calculates each Fund’s NAV at the close of the regular trading session on the NYSE, ordinarily 4:00 p.m., Eastern Time on each day that such exchange is open.
Investment Transactions — Investment transactions are accounted for on the trade date for financial reporting purposes. Realized gains and losses on sales of investment securities are calculated using the identified cost method.
Distributions to Shareholders — Each Fund shareholder is entitled to their share of a Fund’s income and net realized gains on investments. Each Fund pays out substantially all of its net earnings to its shareholders as “distributions.” Income dividends, if any, are generally distributed to shareholders quarterly. Net capital gains are distributed at least annually.
Investment Income — Dividend income is recorded on the ex-dividend date or, in the case of foreign securities, as soon as the information is available after the ex-dividend date. Interest income is accrued daily. The value of additional securities received as dividend payments is recorded as income and as an increase to the cost basis of such securities.
Securities Lending — Each Fund may lend portfolio securities to certain creditworthy borrowers, including the Funds’ securities lending agent. It is the Funds’ policy that, at origination, all loans are secured by collateral of at least 102% of the value of U.S. securities loaned and 105% of the value of foreign securities loaned. Collateral in the form of cash and /or high grade debt obligations, equivalent to at least 100% of the market value of securities loaned, is maintained at all times. The collateral can be invested in certain money market mutual funds which also have exposure to the fluctuations of the market. Each Fund receives compensation for lending its securities from interest or dividends earned on the cash or U.S. government securities held as collateral, net of fee rebates paid to the borrower plus reasonable administrative and custody fees. The dividend and interest income earned on the securities loaned is accounted for in the same manner as other dividend and interest income. The borrower pays to the Funds an amount equal to any dividends or interest received on loaned securities. Lending portfolio securities could result in a loss or delay in recovering the Fund’s securities if the borrower defaults.
1| 50 |
Notes to Financial Statements — continued
The securities lending income earned by the Funds is disclosed on the Statements of Operations. The value of loaned securities and related collateral outstanding at June 30, 2012 are shown in the Schedules of Investments and Statements of Assets and Liabilities. Therefore the value of the collateral held may be temporarily less than that required under the lending contract. As of June 30, 2012, the collateral consisted of an institutional money market fund.
Expenses — Expenses of the Trust which are directly identifiable to a specific Fund, are applied to that Fund. Expenses which are not readily identifiable to a specific Fund are allocated in such a manner as deemed equitable, taking into consideration the nature and type of expense and the relative net assets of each Fund.
3. Advisory Fees, Servicing Fees and Other Fees and Expenses
VTL Associates, LLC (the “Adviser”) has overall responsibility for the general management and administration of the Funds, subject to the supervision of the Board. For the services it provides to the Funds, the Adviser receives an advisory fee.
The RevenueShares Large Cap Fund, RevenueShares Mid Cap Fund, RevenueShares Small Cap Fund, RevenueShares Financials Sector Fund, RevenueShares ADR Fund and RevenueShares Navellier Overall A-100 Fund pay the Adviser an annualized fee of 0.45%, 0.50%, 0.50%, 0.45%, 0.60% and 0.60% respectively, based upon each Fund’s daily net assets.
The Trust and the Adviser have entered into a written fee waiver and expense reimbursement agreement pursuant to which the Adviser has agreed to waive a portion of its fees and/or reimburse expenses to the extent necessary to keep the net annual fund operating expenses for the RevenueShares Large Cap Fund, RevenueShares Mid Cap Fund, RevenueShares Small Cap Fund, RevenueShares Financials Sector Fund, RevenueShares ADR Fund, and RevenueShares Navellier Overall A-100 Fund from exceeding 0.49%, 0.54%, 0.54%, 0.49%, 0.49% and 0.60%, respectively, based upon each Fund’s daily net assets. Amounts waived and/or reimbursed pursuant to this agreement are not subject to subsequent recapture by the Adviser. This agreement will remain in effect and will be contractually binding until October 31, 2012, after which it may be terminated or revised.
| For the year ended June 30, 2012, the Adviser waived and reimbursed the following fees: | ||
| Fees Waived | ||
| and | ||
| Fund | Reimbursed | |
| RevenueShares Large Cap Fund | $423,713 | |
| RevenueShares Mid Cap Fund | 364,402 | |
| RevenueShares Small Cap Fund | 344,218 | |
| RevenueShares Financials Sector Fund | 69,229 | |
| RevenueShares ADR Fund | 241,299 | |
| RevenueShares Navellier Overall A-100 Fund | 77,284 | |
Pursuant to a Sub-Advisory Agreement between the Adviser and Index Management Solutions, LLC (the “Sub-Adviser”), an affiliate of the Adviser, the Sub-Adviser will be responsible for the day-to-day management of the Funds, subject to the supervision of the Adviser and the Board. In this regard, the Sub-Adviser will be responsible for implementing the investment strategy for each Fund with regard to its underlying index and for general administration, compliance and management services as may be agreed between the Adviser and Sub-Adviser from time to time. Out of the advisory fee, the Adviser pays all fees and expenses of the Sub-Adviser.
The Bank of New York Mellon Corp. serves as the administrator, custodian, fund accountant and transfer agent for each Fund.
Distribution — Foreside Fund Services, LLC serves as the Funds’ distributor (the “Distributor”). The Trust has adopted a distribution and services plan (“12b-1”) pursuant to rule 12b-1 under the 1940 Act. Each Fund is authorized to pay an amount up to a maximum annual rate of 0.25% of its average daily net assets for distribution related activities. No 12b-1 fees are currently paid by the Funds, and there are currently no plans to impose these fees.
Other Service Providers
Foreside Compliance Services, LLC (“FCS”), an affiliate of the Distributor, provides an Anti-Money Laundering Officer and Chief Compliance Officer as well as certain additional compliance support functions to the Funds. Foreside Management Services, LLC (“FMS”), an affiliate of the Distributor, provided a Principal Financial Officer to the Funds for the period ended February 28, 2012.
| 51 |
Notes to Financial Statements — continued
Neither the Distributor, FCS, FMS nor any of their officers or employees who serve as an officer of the Funds, has any role in determining the investment policies of, or which securities are to be purchased or sold by, the Trust or its Funds. Certain officers or employees of FCS and FMS are also officers of the Trust. FCS and FMS have agreed to waive 10% of their fees when aggregate net assets of the Trust are under $300,000,000 or until December 31, 2010. For the year ended June 30, 2012, FCS and FMS were not required to waive fees pursuant to this agreement.
Licensing Fee Agreements — The Adviser has entered into a licensing agreement for each Fund with RevenueShares Investor Services. The trademarks are owned by the Licensor. These trademarks have been licensed to the Adviser for use with the Funds. The Funds are not sponsored, endorsed, sold or promoted by the Licensor and the Licensor makes no representation regarding the advisability of investing in any of the Funds.
4. Creation and Redemption Transactions
As of June 30, 2012, there were an unlimited number of shares of beneficial interest without par value authorized by the Trust. Retail investors may only purchase and sell Fund shares at market prices on a national securities exchange through a broker-dealer. Such transactions may be subject to customary commission rates imposed by the broker-dealer, and market prices for a Fund’s shares may be at, above or below its NAV depending on the premium or discount at which the Fund’s shares trade.
Each Fund issues and redeems shares at NAV, only in large blocks typically consisting of 50,000 shares or more (“Creation Units”). Except when aggregated in Creation Units, shares of each Fund are not redeemable. Transactions in shares for each Fund are disclosed in detail in the Statements of Changes in Net Assets. The consideration for the purchase of Creation Units of a Fund generally consists of the in-kind contribution of a designated basket of equity securities constituting a portfolio sampling representation of the securities included in the relevant Fund’s underlying index and an amount of cash. Investors purchasing and redeeming Creation Units may be charged a transaction fee to offset transfer and other transaction costs associated with the issuance and redemption of Creation Units.
5. Fair Value Measurement
The authoritative guidance for fair value measurements and disclosures, Accounting Standards Codification™ Topic 820, establishes an authoritative framework for the measurement of fair value, and enhances disclosures about fair value measurements. Furthermore, Topic 820 establishes a hierarchy for inputs used in measuring fair value that maximizes the use of observable inputs and minimizes the use of unobservable inputs by requiring the most observable inputs be used when available. The Funds utilized various inputs in determining the value of each Fund’s investments. These inputs are summarized in the three broad levels as follows:
Level 1 — quoted prices in active markets for identical securities
Level 2 — other significant observable inputs (including quoted prices for similar securities, the intrinsic value of securities such as rights, warrants or options, etc.)
Level 3 — significant unobservable inputs (including the Fund’s own assumptions in determining the fair value of investments)
The inputs or methodology used for valuing securities are not necessarily an indication of the risk associated with investing in those securities. The following summarizes inputs used as of June 30, 2012 in valuing the Funds’ assets carried at fair value:
| Other | |||||||
| Quoted Prices in Active Markets (Level 1) | Significant | Significant | |||||
| Money | Observable | Unobservable | |||||
| Preferred | Market | Inputs | Inputs | ||||
| Fund | Common Stock | Stock | Funds | (Level 2) | (Level 3) | Total | |
| RevenueShares Large Cap Fund | $156,205,751 | $ — | $4,432,320 | $ — | $ — | $160,638,071 | |
| RevenueShares Mid Cap Fund | 123,179,948 | — | 5,937,980 | — | — | 129,117,928 | |
| RevenueShares Small Cap Fund | 109,562,281 | — | 4,526,261 | — | — | 114,088,542 | |
| RevenueShares Financials | |||||||
| Sector Fund | 9,662,035 | — | 425 | — | — | 9,662,460 | |
| RevenueShares ADR Fund | 35,988,581 | 444,549 | 913,653 | — | — | 37,346,783 | |
| RevenueShares Navellier | |||||||
| Overall A-100 Fund | 7,605,914 | — | 232,353 | — | — | 7,838,267 | |
| 52 |
Notes to Financial Statements — continued
At June 30, 2012, the Funds did not hold any Level 2 or Level 3 securities. Please refer to each Fund’s Schedule of Investments to view equity securities segregated by industry type.
The Funds’ policy is to disclose transfers between Levels based on valuations at the beginning of the reporting period. At June 30, 2012, there were no transfers between Level 1, 2, or 3, based on the valuation input Levels assigned to securities on June 30, 2011.
6. Investment Transactions
The cost of purchases and the proceeds from sales of investment securities (excluding in-kind purchases and redemptions and short-term investments) for the year ended June 30, 2012 were as follows:
| Fund | Purchases | Sales | ||
| RevenueShares Large Cap Fund | $50,094,087 | $48,672,434 | ||
| RevenueShares Mid Cap Fund | 71,838,593 | 74,034,899 | ||
| RevenueShares Small Cap Fund | 56,355,715 | 55,269,147 | ||
| RevenueShares Financials Sector Fund | 2,336,161 | 2,337,164 | ||
| RevenueShares ADR Fund | 15,457,217 | 15,464,937 | ||
| RevenueShares Navellier Overall A-100 Fund | 14,654,551 | 14,757,992 |
For the year ended June 30, 2012, the cost of in-kind purchases and the proceeds from in-kind redemptions were as follows:
| Fund | Purchases | Sales | ||
| RevenueShares Large Cap Fund | $ 4,858,717 | $47,892,240 | ||
| RevenueShares Mid Cap Fund | 15,756,099 | 28,203,845 | ||
| RevenueShares Small Cap Fund | 18,037,712 | 32,559,492 | ||
| RevenueShares Financials Sector Fund | 1,323,784 | 2,290,066 | ||
| RevenueShares ADR Fund | — | 22,420,967 | ||
| RevenueShares Navellier Overall A-100 Fund | 5,593,832 | 7,429,614 |
Gains and losses on in-kind redemptions are not recognized at the Fund level for tax purposes.
7. Trustee’s Fees
The Trust compensates each Trustee who is not an officer or employee of the Adviser. No Trustee of the Trust who is also an officer or employee of the Adviser receives any compensation from the Trust for services to the Trust.
8. Federal Income Tax
The Funds intend to continue to qualify as “regulated investment companies” under Subchapter M of the Internal Revenue Code of 1986 as amended (the “Internal Revenue Code”). If so qualified, the Funds will not be subject to Federal income tax to the extent they distribute substantially all of their net investment income and capital gains to shareholders.
At June 30, 2012, the aggregate gross unrealized appreciation and depreciation of investments for Federal income tax purposes were as follows:
| Net | ||||||||||
| Gross | Gross | Unrealized | ||||||||
| Unrealized | Unrealized | Appreciation | ||||||||
| Fund | Cost | Appreciation | (Depreciation) | (Depreciation) | ||||||
| RevenueShares Large Cap Fund | $144,493,820 | $25,896,700 | $(9,752,449 | ) | $16,144,251 | |||||
| RevenueShares Mid Cap Fund | 116,222,861 | 19,664,461 | (6,769,394 | ) | 12,895,067 | |||||
| RevenueShares Small Cap Fund | 106,921,294 | 15,363,633 | (8,196,385 | ) | 7,167,248 | |||||
| RevenueShares Financials Sector Fund | 11,417,186 | 364,302 | (2,119,028 | ) | (1,754,726 | ) | ||||
| RevenueShares ADR Fund | 43,162,380 | 1,730,220 | (7,545,817 | ) | (5,815,597 | ) | ||||
| RevenueShares Navellier Overall A-100 Fund | 7,212,900 | 734,635 | (109,268 | ) | 625,367 | |||||
| 53 |
Notes to Financial Statements — continued
The differences between book basis and tax basis components of net assets are primarily attributable to tax deferral of losses on wash sales and mark to market of unrealized gains on passive foreign investment companies. At June 30, 2012, the components of accumulated earnings/loss on a tax-basis were as follows:
| Accumulated | Total | ||||||||||
| Undistributed | Undistributed | Net Unrealized | Accumulated | ||||||||
| Ordinary | Capital and | Appreciation | Earnings/ | ||||||||
| Fund | Income | Other Losses | (Depreciation) | (Losses) | |||||||
| RevenueShares Large Cap Fund | $688,718 | $(2,765,191 | ) | $16,144,251 | $14,067,778 | ||||||
| RevenueShares Mid Cap Fund | — | 460,723 | 12,895,067 | 13,355,790 | |||||||
| RevenueShares Small Cap Fund | 249,977 | 72,083 | 7,167,248 | 7,489,308 | |||||||
| RevenueShares Financials Sector Fund | 13,975 | (890,188 | ) | (1,754,726 | ) | (2,630,939 | ) | ||||
| RevenueShares ADR Fund | 147,561 | (1,922,840 | ) | (5,815,597 | ) | (7,590,876 | ) | ||||
| RevenueShares Navellier Overall A-100 Fund | 12,737 | (1,531,390 | ) | 625,367 | (893,286 | ) |
The tax character of distributions paid during the year ended June 30, 2012 and 2011 were as follows:
| 2012 | 2011 | |||||||
| Distributions | Distributions | |||||||
| Distributions | Paid From | Distributions | Paid From | |||||
| Paid From | Long-Term | Paid From | Long-Term | |||||
| Fund | Ordinary Income | Capital Gain | Ordinary Income | Capital Gain | ||||
| RevenueShares Large Cap Fund | $2,947,099 | $ — | $2,871,609 | $ — | ||||
| RevenueShares Mid Cap Fund | 1,623,906 | 2,335,438 | 762,231 | — | ||||
| RevenueShares Small Cap Fund | 525,064 | — | 543,364 | — | ||||
| RevenueShares Financials Sector Fund | 98,921 | — | 309,165 | — | ||||
| RevenueShares ADR Fund | 1,975,494 | 211,188 | 1,346,857 | — | ||||
| RevenueShares Navellier Overall A-100 Fund | 144,914 | 67,129 | 111,815 | — | ||||
At June 30, 2012, for Federal income tax purposes, the following Funds have capital loss carryforwards available to offset future capital gains through the years indicated. To the extent that these loss carryforwards are utilized, capital gains so offset will not be distributed to shareholders.
| Capital Loss | Capital Loss | Capital Loss | ||||||||||
| Available | Available | Available | Short-Term | Long-Term | ||||||||
| Through | Through | Through | Post-Effective | Post-Effective | ||||||||
| Fund | 2017 | 2018 | 2019 | No Expiration | No Expiration | Total | ||||||
| RevenueShares Large Cap Fund | $ — | $711,580 | $ — | $ — | $ — | $ 711,580 | ||||||
| RevenueShares Financial Sector Fund | 52,317 | 21,626 | 78,535 | 121,295 | 169,285 | 443,058 | ||||||
| Revenueshares ADR Fund | — | — | — | 169,705 | 87,800 | 257,505 | ||||||
| RevenueShares Navellier Overall A-100 Fund | — | — | — | 1,199,701 | — | 1,199,701 |
The Funds utilized capital loss carryforwards as follows to offset taxable capital gains realized during the year ended June 30, 2012 as follows:
| Capital Loss | ||
| Carryforward | ||
| Fund | Utilized | |
| RevenueShares Large Cap Fund | $2,697 |
Under the recently enacted Regulated Investment Company Modernization Act of 2010, the Funds will be permitted to carry forward capital losses incurred in taxable years beginning after December 22, 2010 for an unlimited period. However, any losses incurred during those future taxable years will be required to be utilized prior to the losses incurred in pre-enactment taxable years. As a result of this ordering rule, pre-enactment capital loss carryforwards may have an increased likelihood to expire unused. Additionally, post-enactment capital losses that are carried forward will retain their character as either short-term or long-term capital losses rather than being considered all short-term as under previous law.
| 54 |
Notes to Financial Statements — continued
Post-October losses represent losses realized on investment transactions from November 1, 2011 through June 30, 2012, that, in accordance with Federal income tax regulations, the Funds have elected to defer and treat as having arisen in the following fiscal year. During the year ended June 30, 2012, the Funds incurred and will elect to defer net capital losses as follows:
| Post-October | ||
| Fund | Capital Losses | |
| RevenueShares Large Cap Fund | $2,053,611 | |
| RevenueShares Financial Sector Fund | 447,130 | |
| RevenueShares ADR Fund | 1,665,335 | |
| RevenueShares Navellier Overall A-100 Fund | 331,689 |
For financial reporting purposes, capital accounts are adjusted to reflect the tax character of permanent book/tax differences. Reclassifications are primarily due to tax treatment of redemptions in kind. Results of operations and net assets were not affected by these reclassifications. At June 30, 2012, the effect of permanent book/tax reclassifications resulted in increases (decreases) to the components of net assets as follows:
| Accumulated | |||||||||
| Undistributed | Net Realized | ||||||||
| Net Investment | Gain/(Loss) on | Paid-in- | |||||||
| Fund | Income | Investments | Capital | ||||||
| RevenueShares Large Cap Fund | $ — | $(8,760,072 | ) | $8,760,072 | |||||
| RevenueShares Mid Cap Fund | (225,348 | ) | (5,350,203 | ) | 5,575,551 | ||||
| RevenueShares Small Cap Fund | — | (5,307,626 | ) | 5,307,626 | |||||
| RevenueShares Financials Sector Fund | — | 354,101 | (354,101 | ) | |||||
| RevenueShares ADR Fund | 6,549 | (1,229,162 | ) | 1,222,613 | |||||
| RevenueShares Navellier Overall A-100 Fund | (2 | ) | (863,813 | ) | 863,815 | ||||
Financial reporting rules prescribe a minimum threshold for financial statement recognition of the benefit of a tax position taken or expected to be taken in a tax return. Foreign taxes are provided for based on the Funds’ understanding of the tax rules and rates that exist in the foreign markets in which they invest. Taxes are accrued and applied to net investment income, net realized capital gains and net unrealized appreciation, as applicable, as the income is earned or capital gains are recorded. If applicable, the Funds will recognize expenses accrued related to unrecognized interest expense and penalties in “Other” expense on the Statements of Operations. Management has determined that there is no impact resulting from the application of this interpretation to the Funds’ financial statements.
Financial reporting rules require management of the Funds to analyze all open tax years, fiscal years 2008-2012, as defined by IRS statute of limitations, for all major jurisdictions, including Federal tax authorities and certain state tax authorities. As of and during the year ended June 30, 2012, the Funds did not have a liability for any unrecognized tax benefits. The Funds have no examination in progress and are not aware of any tax positions for which it is reasonably possible that the total amounts of unrecognized tax benefits will significantly change in the next twelve months.
9. Risks
Concentration Risk
The RevenueShares Financials Sector Fund and the RevenueShares ADR Fund may be adversely affected by the performance of the securities in a particular industry and may be subject to increased price volatility and may be more susceptible to adverse economic, market, political or regulatory occurrences affecting that market, industry, group of industries, sector or asset class than may be the case for a fund that was not concentrated in a particular industry.
Non-Diversification Risk
Each of the RevenueShares Financials Sector, RevenueShares ADR and RevenueShares Navellier Overall A-100 Funds are non-diversified and, as a result, may have greater volatility than other diversified funds. Because a non-diversified fund may invest a larger percentage of its assets in securities of a single company than diversified funds, the performance of that company can have a substantial impact on a Fund’s Share price. Each Fund intends to maintain the required level of diversification so as to qualify as a “regulated investment company” for purposes of the Internal Revenue Code in order to avoid liability for Federal income tax to the extent that its earnings are distributed to shareholders. Compliance with diversification requirements of the Internal Revenue Code could limit the investment flexibility of a Fund.
| 55 |
Notes to Financial Statements — concluded
Financial Sector Risk
Financial services companies are subject to extensive governmental regulation which may limit both the amounts and types of loans and other financial commitments they can make, and the interest rates and fees they can charge. Profitability is largely dependent on the availability and cost of capital funds, and can fluctuate significantly when interest rates change or due to increased competition. Credit losses resulting from financial difficulties of borrowers and financial losses associated with investment activities can negatively impact the sector. Insurance companies may be subject to severe price competition and adversely affected by natural disasters. Adverse economic, business or political developments affecting real estate could have a major effect on the value of real estate securities (which include REITs).
ADR Risk
The RevenueShares ADR Fund holds the securities of foreign companies in the form of ADRs, global shares or, in the case of Canadian equities, ordinary shares. Global shares are the actual (ordinary) shares of a non-U.S. company, which trade both in the home market and the U.S and are represented by the same share certificate in both the U.S. and the home market. Global shares may also be eligible to list on exchanges in addition to the United States and home country. ADRs are receipts typically issued by an American bank or trust company that evidence ownership of underlying securities issued by a foreign corporation. Generally, ADRs are designed for use in the U.S. securities markets. Separate registrars in the United States and home country are maintained. In most cases, purchases occurring on a U.S. exchange would be reflected on the U.S. Registrar.
The underlying securities of the ADRs in the Fund’s portfolio are usually denominated or quoted in currencies other than the U.S. dollar. Global shares may trade in their home market in currencies other than the U.S. dollar. Changes in foreign currency exchange rates affect the value of the ADR or global shares and, therefore, the value of the Fund’s portfolio. Generally, when the U.S. dollar rises in value against a foreign currency, a security denominated in that currency loses value because the currency is worth fewer U.S. dollars. Conversely, when the U.S. dollar decreases in value against a foreign currency, a security denominated in that currency gains value because the currency is worth more U.S. dollars. This risk, generally known as “currency risk,” means that a strong U.S. dollar will reduce returns for U.S. investors while a weak U.S. dollar will increase those returns.
In addition, although the ADRs, global shares and ordinary shares in which the Fund invests are listed on major U.S. exchanges, there can be no assurance that a market for these securities will be made or maintained or that any such market will be or remain liquid. The price at which the Fund’s securities may be sold and the value of the Fund’s Shares will be adversely affected if trading markets for the securities are limited or absent or if bid/ask spreads are wide.
Foreign Market Risk
Since global shares and the underlying securities of ADRs in the RevenueShares ADR Fund’s portfolio trade on foreign exchanges at times when the U.S. markets are not open for trading, the value of the ADRs representing those underlying securities may change materially at times when the U.S. markets are not open for trading, regardless of whether there is an active U.S. market for Shares of the Fund.
10. Subsequent Events
On July 5, 2012, the Funds declared quarterly income dividends with an ex-date of July 6, 2012 and payable date of July 12, 2012. The income dividend per share for each Fund was as follows:
| Income | ||
| Dividend | ||
| Fund | Per Share | |
| RevenueShares Large Cap Fund | $0.11136 | |
| RevenueShares Mid Cap Fund | 0.05537 | |
| RevenueShares Small Cap Fund | 0.07733 | |
| RevenueShares Financials Sector Fund | 0.04029 | |
| RevenueShares ADR Fund | 0.12996 | |
| RevenueShares Navellier Overall A-100 Fund | 0.06429 |
Management has evaluated events and transactions for potential recognition or disclosure in the financial statements through the date the financial statements were issued. Management has determined that, except as set forth above, there are no material events that would require disclosure in the Funds’ financial statements through this date.
| 56 |
Report of Independent Registered Public Accounting Firm
To the Board of Trustees of RevenueShares ETF Trust
and the Shareholders of the RevenueShares Large Cap Fund,
the RevenueShares Mid Cap Fund, the RevenueShares Small Cap Fund,
the RevenueShares Financials Sector Fund, the RevenueShares ADR Fund
and the RevenueShares Navellier Overall A-100 Fund
We have audited the accompanying statements of assets and liabilities of the RevenueShares Large Cap Fund, the RevenueShares Mid Cap Fund, the RevenueShares Small Cap Fund, the RevenueShares Financials Sector Fund, the RevenueShares ADR Fund, and the RevenueShares Navellier Overall A-100 Fund (the "Funds"), each a series of shares of the RevenueShares ETF Trust, including the schedules of investments, as of June 30, 2012, and the related statements of operations, the statements of changes in net assets and the financial highlights for the year then ended. These financial statements and financial highlights are the responsibility of the Funds’ management. Our responsibility is to express an opinion on these financial statements and financial highlights based on our audits. The statement of changes in net assets for the year ended June 30, 2011 and the financial highlights for each year or period presented through the year ended June 30, 2011 have been audited by other auditors, whose report dated August 29, 2011, expressed an unqualified opinion on such financial statements and financial highlights.
We conducted our audits in accordance with the standards of the Public Company Accounting Oversight Board (United States). Those standards require that we plan and perform the audits to obtain reasonable assurance about whether the financial statements and financial highlights are free of material misstatement. An audit includes examining, on a test basis, evidence supporting the amounts and disclosures in the financial statements. Our procedures included confirmation of securities owned as of June 30, 2012 by correspondence with the custodian and brokers. An audit also includes assessing the accounting principles used and significant estimates made by management, as well as evaluating the overall financial statement presentation. We believe that our audits provide a reasonable basis for our opinion.
In our opinion, the financial statements and financial highlights referred to above present fairly, in all material respects, the financial position of the RevenueShares Large Cap Fund, RevenueShares Mid Cap Fund, RevenueShares Small Cap Fund, RevenueShares Financials Sector Fund, RevenueShares ADR Fund, and RevenueShares Navellier Overall A-100 Fund as of June 30, 2012, and the results of their operations, the changes in their net assets and their financial highlights for the year then ended, in conformity with accounting principles generally accepted in the United States of America.
 | |
BBD, LLP |
Philadelphia, Pennsylvania
August 24, 2012
| 57 |
Trustees and Officers of The Revenueshares ETF Trust
(Unaudited)
Independent Trustees
| Number of | ||||||||||
| Portfolios in | ||||||||||
| Position(s) | Term of Office1 | Fund Complex2 | Other Directorships | |||||||
| Name and Year | Held with | and Length of | Principal Occupation(s) | Overseen by | Held by Trustee | |||||
| of Birth | Trust | Time Served | During Past 5 Years | Trustee | During Past 5 Years | |||||
| James C. McAuliffe Year of Birth: 1951 | Trustee | Since 2006 | Retired. Police Officer from 1971 to 2004. | 14 | Director, Officer Daniel Boyle Scholarship Fund, from 1992 to present. | |||||
| Christian W. Myers, III Year of Birth: 1952 | Trustee | Since 2006 | Firefighter from 1976 to present. | 14 | None | |||||
| John J. Kolodziej Year of Birth: 1956 | Trustee | Since 2007 | Controller, Diagnostic Imaging Inc., from August 2010 to 2012; Director of Finance, St. Francis Medical Center, from 2002 to 2009. | 14 | None | |||||
| John A. Reilly Year of Birth: 1931 | Trustee | Since 2010 | Retired. Firefighter from 1956 to 1988. | 14 | Trustee, Philadelphia Board of Pensions, from 1976 to present; Member of the Executive Board of National Conference on Public Employee Retirement Systems (NCPERS), from 1990 to present. | |||||
| Interested Trustees | ||||||||||
| Vincent T. Lowry3 Year of Birth: 1951 | Chairman and Trustee; President | Since 2006 | Chief Executive Officer and Chief Investment Officer, VTL, from 2004 to present; Managing Director, Smith Barney, Inc., from 1984 to 2004 | 14 | None | |||||
| Daniel J. Ledva4 Year of Birth: 1972 | Trustee | Since September 2011 | Senior Managing Director, Co-Founder and Principal, Kelson Group, from 2010 to present; Director, Marwood Group, from 2002 to 2010. | 14 | Trustee, Dr. Gene A. Carpenter Foundation, from 2008 to present. |
| 1 | Each Trustee holds office for an indefinite term. |
| 2 | The “Fund Complex” consists of the Trust, which consists of 14 Funds, only six of which are operating. |
| 3 | Mr. Lowry is considered to be an “interested person” of the Trust as defined in the 1940 Act due to his relationship with VTL, the Funds’ investment adviser. |
| 4 | Mr. Ledva is deemed to be an “interested person” of the Trust as defined in the 1940 Act because the Kelson Group and its affiliated broker-dealer, Kelson Capital LLC, are currently negotiating certain arrangements, including acting as a private placement agent, with VTL and/or the Trust. |
The Funds’ Statement of Additional Information (“SAI”) has additional information about the Funds’ Trustees and Officers and is available without charge upon request. Contact your financial representative for a free prospectus or SAI.
| 58 |
Trustees And Officers of The RevenueShares ETF Trust
(Unaudited) — concluded
Officers
| Position(s) | Term of Office1 | ||
| Name, Address and | Held with | and Length of | |
| Year of Birth | the Trust | Time Served | Principal Occupation(s) During Past 5 Years |
| Michael Gompers One Commerce 2005 Market Street Suite 2020 Philadelphia, PA 19103 Year of Birth: 1981 | Treasurer | Since March 2012 | Chief Operating Officer, VTL, from March 2007 to present; Chief Executive Officer and Chief Compliance Officer, IMS, from December 2009 to present; Analyst, VTL, from July 2005 – March 2007; Accountant, Gompers & Associates, PLLC from January 2005 – July 2005. |
| Patrick J. Keniston2 Three Canal Plaza Suite 100 Portland, ME 04101 Year of Birth: 1964 | Chief Compliance Officer | Since 2009 | Director, Foreside Compliance Services, LLC, from October 2008 to present; Vice President, Citi Fund Services Ohio, Inc., from 2005 to 2008; Attorney, Citigroup Global Transaction Services, from 2001 to 2005. |
| Jennifer Folgia One Commerce Square 2005 Market Street Suite 2020 Philadelphia, PA 19103 Year of Birth: 1973 | Secretary | Since 2006 | Operations Manager, VTL, from 2004 to present; Sales Assistant, Smith Barney, Inc., from 1994 to 2004. |
| 1 | Officers of the Trust are elected by the Trustees and serve at the pleasure of the Board. |
| 2 | The Funds’ Chief Compliance Officer also serves as an officer of other unaffiliated mutual funds and ETFs for which Foreside Fund Services, LLC, the Distributor, or its affiliates act as distributor or service provider. |
The Funds’ Statement of Additional Information (“SAI”) has additional information about the Funds’ Trustees and Officers and is available without charge upon request. Contact your financial representative for a free prospectus or SAI.
| 59 |
(Unaudited)
Change in Independent Registered Public Accounting Firm
On April 27, 2012, BBD, LLP was selected as the Trust’s independent registered public accounting firm for the 2012 fiscal year. The selection of BBD, LLP was recommended by the Trust’s Audit Committee, comprised of all non-interested Trustees, and was approved by the Board of Trustees. The reports of Ernst & Young, LLP, the predecessor independent registered public accounting firm, on the financial statements of the Funds for the fiscal years ended June 30, 2011 and June 30, 2010 did not contain any adverse opinion or disclaimer of opinion, nor were they qualified or modified as to uncertainty, audit scope or accounting principle. In addition, there were no disagreements between the Trust and Ernst & Young, LLP on accounting principles, financial statement disclosures or audit scope, which, if not resolved to the satisfaction of Ernst & Young, LLP, would have caused them to make reference to the disagreement in their reports on the financial statements for such years.
Proxy Voting Policies, Procedures and Record
A description of the Trust’s proxy voting policies and procedures that the Trust uses to determine how to vote proxies relating to portfolio securities, and each Fund’s proxy voting record for the most recent twelve-month period ended June 30 is available, without charge upon request, by calling (877)738-8870. This information is also available on the Securities and Exchange Commission’s (“SEC”) website at http://www.sec.gov.
Shareholder Reports and Quarterly Portfolio Disclosure
The RevenueShares ETF Trust files its complete schedule of portfolio holdings with the SEC for its first and third quarters on Form N-Q. Copies of the filings are available on the SEC’s website at http://www.sec.gov. You can also obtain copies of Form N-Q by (i) visiting the SEC’s Public Reference Room in Washington, DC (information on the operation of the Public Reference Room may be obtained by calling 1-800-SEC-0330); (ii) sending your request and a duplicating fee to the SEC’s Public Reference Room, Washington, DC 20549-0102; or (iii) sending your request electronically to the following email box address: <publicinfo@sec.gov>.
Premium/Discount Information
Information about the differences between the daily market price on the secondary market for the shares of a Fund and the Fund’s net asset value may be found on the Funds’ website at http://www.revenuesharesetfs.com.
Federal Tax Status of Dividends Declared during the Tax Year
Form 1099-DIV, Form 1042-S and other year-end tax information provide shareholders with actual calendar year amounts that should be included in their tax returns. Shareholders should consult their tax advisors.
For Federal income tax purposes, dividends and short-term capital gains are classified as ordinary income. The percentage of ordinary income distribution designated as qualifying for the corporate dividend received deduction (“DRD”), and the individual qualified dividend rate (“QDI”) is presented below:
| QDI | DRD | ||||
| RevenueShares Large Cap Fund | 100.00 | % | 100.00 | % | |
| RevenueShares Mid Cap Fund | 92.98 | % | 92.74 | % | |
| RevenueShares Small Cap Fund | 100.00 | % | 100.00 | % | |
| RevenueShares Financials Sector Fund | 100.00 | % | 100.00 | % | |
| RevenueShares ADR Fund | 91.89 | % | 2.85 | % | |
| RevenueShares Navellier Overall A-100 Fund | 89.36 | % | 65.22 | % | |
With respect to the taxable year ended June 30, 2012, the Funds hereby designate as capital gain dividends the amounts listed below, or, if subsequently determined to be different, the net capital gain of such year:
| RevenueShares | |||||
| RevenueShares | RevenueShares | Navellier | |||
| Mid Cap Fund | ADR Fund | Overall A-100 Fund | |||
| From long-term capital gains, subject to | |||||
| the 15% rate gains category | $2,335,438 | $211,188 | $67,129 |
RevenueShares ADR Fund in accordance with Section 853 of the Internal Revenue Code intends to elect to pass through to its shareholders the credit for taxes paid in foreign countries during its fiscal year ended June 30, 2012. In accordance with the current tax laws, the foreign income and foreign tax as of June 30, 2012 is as follows:
| Foreign | Foreign | |||
| Dividend | Taxes | |||
| Dollar Amount | $1,477,819 | $175,917 | ||
| 60 |
| Investment Adviser | Sub-Adviser |
| VTL Associates, LLC | Index Management Solutions, LLC |
| One Commerce Square | One Commerce Square |
| 2005 Market Street, Suite 2020 | 2005 Market Street, Suite 2020 |
| Philadelphia, Pennsylvania 19103 | Philadelphia, Pennsylvania 19103 |
| Distributor | Transfer Agent |
| Foreside Fund Services, LLC | The Bank of New York Mellon |
| Three Canal Plaza, Suite 100 | 101 Barclay Street |
| Portland, Maine 04101 | New York, New York 10286 |
| www.foreside.com | |
| Independent Registered Public Accounting Firm | |
| Custodian | |
| BBD, LLP | |
| The Bank of New York Mellon | 1835 Market Street, 26th Floor |
| 101 Barclay Street | Philadelphia, Pennsylvania 19103 |
| New York, New York 10286 | |
| Legal Counsel | |
| Stradley Ronon Stevens & Young, LLP | |
| 2600 One Commerce Square | |
| Philadelphia, Pennsylvania 19103 | |
| 61 |
RevenueShares™ ETF Trust
One Commerce Square, 2005 Market Street, Suite 2020
Philadelphia, PA 19103
This report is submitted for the general information of the shareholders of each Fund.
It is not authorized for distribution to prospective investors unless preceded or accompanied
by an effective prospectus, which includes information regarding the Funds’ risks, objectives,
fees and expenses, experience of their management, and other information.
DISTRIBUTOR
Foreside Fund Services, LLC
Three Canal Plaza, Suite 100
Portland, ME 04101
www.foreside.com

Item 2. Code of Ethics.
a). The Registrant has adopted a code of ethics that applies to the Registrant’s Principal Executive Officer, Principal Financial Officer or persons performing similar functions.
b). There have not been any changes to the Code of Ethics.
c). Not applicable.
d). During the period, Registrant granted no waivers from the provisions of its code of ethics that applies to the Registrant's Principal Executive Officer, Principal Financial Officer or persons performing similar functions.
e). Not applicable.
f). Attached.
Item 3. Audit Committee Financial Expert.
a). The Registrant’s Board of Trustees has one audit committee financial expert serving on its audit committee, an “independent” Trustee, John J. Kolodziej. Under applicable securities laws, a person who is determined to be an audit committee financial expert will not be deemed an “expert” for any purpose, including without limitation for the purposes of Section 11 of the Securities Act of 1933, as a result of being designated or identified as an audit committee financial expert. The designation or identification of a person as an audit committee financial expert does not impose on such person any duties, obligations, or liabilities that are greater than the duties, obligations, and liabilities imposed on such person as a member of the audit committee and Board of Trustees in the absence of such designation or identification.
Item 4. Principal Accountant Fees and Services.
a). Audit Fees: the aggregate fees billed in each of the last two fiscal years for professional services rendered by the principal accountant for the audit are as follows:
2012: $78,000
2011: $120,000
b). Audit-Related Fees: the aggregate fees billed in each of the last two fiscal years for assurance and related services by the principal accountant that are reasonably related to the performance of the audit of the Registrant’s financial statements and are not reported under paragraph (a) of this item are as follows:
2012: $ 0
2011: $ 0
c). Tax Fees, the aggregate fees billed in each of the previous last two fiscal years for professional services rendered by the principal accountant for tax compliance, tax advice, and tax planning are as follows:
2012: $12,000
2011: $19,800
d). All Other Fees, the aggregate fees billed in each of the last two fiscal years for products and services provided by the principal accountant, other than the services reported in paragraphs (a) and (c) of this Item are as follows:
2012: $ 0
2011: $ 0
e) Audit Committee Pre-Approval Policies and Procedures.
(i) Per Rule 2-01(c)(7)(A), the Audit Committee pre-approves all of the Audit, Audit-Related, Tax and Other Fees of the Registrant.
(ii) 100% of services described in each of Items 4(b) through (d) were approved by the audit committee pursuant to paragraph (c)(7)(A) of Rule 2-01 of Regulation S-X.
(f) No response required.
(g) The aggregate non-audit fees billed by the Registrant's accountant for services rendered to the Funds, the Advisor or any entity controlling, controlled by, or under common control with the Advisor that provides ongoing services to the Registrant (except for any sub-advisor whose role is primarily portfolio management and is subcontracted with or overseen by another investment advisor) that directly impacted the Funds for the last two fiscal years is as follows:
2012: $12,000
2011: $19,800
(h) Not applicable.
Item 5. Audit Committee of Listed Registrants.
(a) The Fund has a designated Audit Committee in accordance with Section 3(a)(58)(A) of the Securities and Exchange Act of 1934 (the “Exchange Act”) and all independent Trustees are members of such committee.
(b) Not applicable.
Item 6. Schedule of Investments.
(a) Schedule is included as part of the report to shareholders filed under Item 1 of this Form.
(b) Not applicable.
Item 7. Disclosure of Proxy Voting Policies and Procedures for Closed-End Management Investment Companies.
Not applicable.
Item 8. Portfolio Managers of Closed-End Management Investment Companies.
Not applicable.
Item 9. Purchases of Equity Securities by Closed-End Management Investment Company & Affiliated Purchasers.
Not applicable.
Item 10. Submission of Matters to a Vote of Security Holders.
Not applicable.
Item 11. Controls and Procedures.
| (a) | The Principal Executive Officer and Principal Financial Officer have evaluated the Registrant's disclosure controls and procedures within 90 days of the filing date of this report and have concluded that these controls and procedures are effective. |
| (b) | There were no significant changes in the Registrant's internal controls over financial reporting or in other factors that could significantly affect these controls during the second fiscal quarter of the period covered by this report. |
Item 12. Exhibits.
(a) Any code of ethics, or amendment thereto, that is the subject of the disclosure required by Item 2, to the extent that the Registrant intends to satisfy the Item 2 requirements through filing of an exhibit: Attached.
(b) Separate certifications for each Principal Executive Officer and Principal Financial Officer of the Registrant as required by Rule 30a-2(a) under the 1940 Act (17CFR 270.30a-(a)).
SIGNATURES
Pursuant to the requirements of the Securities Exchange Act of 1934 and the Investment Company Act of 1940, the Registrant has duly caused this report to be signed on its behalf by the undersigned, thereunto duly authorized.
Registrant: RevenueShares ETF Trust
By: /s/ Vincent T. Lowry
Vincent T. Lowry, Chief Executive Officer
Date: September 6, 2012
Pursuant to the requirements of the Securities Exchange Act of 1934 and the Investment Company Act of 1940, this report has been signed below by the following persons on behalf of the Registrant and in the capacities and on the dates indicated.
Registrant: RevenueShares ETF Trust
By: /s/ Vincent T. Lowry
Vincent T. Lowry, Chief Executive Officer
Date: September 6, 2012
By: /s/ Michael Gompers
Michael Gompers, Chief Financial Officer
Date: September 6, 2012