UNITED STATES
SECURITIES AND EXCHANGE COMMISSION
Washington, D.C. 20549
FORM N-CSR
CERTIFIED SHAREHOLDER REPORT OF REGISTERED MANAGEMENT
INVESTMENT COMPANIES
Investment Company Act file number 811-21993
Oppenheimer Revenue Weighted ETF Trust
(Exact name of registrant as specified in charter)
6803 South Tucson Way, Centennial, Colorado 80112-3924
(Address of principal executive offices) (Zip code)
Cynthia Lo Bessette
VTL Associates, LLC
225 Liberty Street, New York, New York 10281-1008
(Name and address of agent for service)
Registrant's telephone number, including area code: (303) 768-3200
Date of fiscal year end: June 30
Date of reporting period: June 30, 2017
Form N-CSR is to be used by management investment companies to file reports with the Commission not later than 10 days after the transmission to stockholders of any report that is required to be transmitted to stockholders under Rule 30e-1 under the Investment Company Act of 1940 (17 CFR 270.30e-1). The Commission may use the information provided on Form N-CSR in its regulatory, disclosure review, inspection, and policymaking roles.
A registrant is required to disclose the information specified by Form N-CSR, and the Commission will make this information public. A registrant is not required to respond to the collection of information contained in Form N-CSR unless the Form displays a currently valid Office of Management and Budget ("OMB") control number. Please direct comments concerning the accuracy of the information collection burden estimate and any suggestions for reducing the burden to Secretary, Securities and Exchange Commission, 450 Fifth Street, NW, Washington, DC 20549-0609. The OMB has reviewed this collection of information under the clearance requirements of 44 U.S.C. § 3507.
Item 1. Reports to Stockholders.
The Report to Shareholders is attached herewith.
Annual Report | 6/30/2017 | |||
 |
ETF Trust
1. | Go to www.icsdelivery.com |
2. | Select the first letter of your brokerage firm’s name. |
3. | From the list that follows, select your brokerage firm. If your brokerage firm is not listed, electronic delivery may not be available. Please contact your brokerage firm. |
4. | Complete the information requested, including the e-mail address where you would like to receive notifications for electronic documents. |
| 2 | ||||||
| 11 | ||||||
| 12 | ||||||
Schedules of Investments | ||||||
| 14 | ||||||
| 20 | ||||||
| 25 | ||||||
| 31 | ||||||
| 32 | ||||||
| 33 | ||||||
| 36 | ||||||
| 43 | ||||||
| 45 | ||||||
| 47 | ||||||
| 50 | ||||||
| 57 | ||||||
| 67 | ||||||
| 68 | ||||||
| 73 |
Market Overview | June 30, 2017 |
Oppenheimer Large Cap Revenue ETF (Ticker: RWL) | June 30, 2017 |
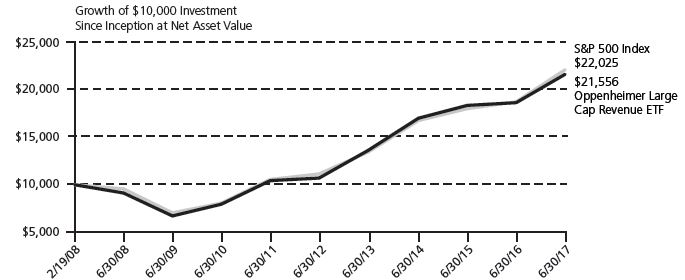 |
| Fund Performance History (%) | | Average Annual Total Return As of June 30, 2017 | ||||||||||||
| 1 Year | 5 Year | Since Inception* | ||||||||||||
Large Cap NAV Return | 15.96 | % | 15.04 | % | 8.58% | |||||||||
Large Cap Market Price Return | 15.98 | % | 15.06 | % | 8.58% | |||||||||
OFI Revenue Weighted Large Cap Index | 16.49 | % | 15.55 | % | 9.11% | |||||||||
S&P 500 Index | 17.90 | % | 14.63 | % | 8.80% | |||||||||
* | The since inception return is calculated from NAV performance inception on 2/19/08, as opposed to the exchange list inception of 2/22/08. NAV performance inception represents when the Fund’s NAV was struck for the first time. Exchange list inception represents when the Fund began trading. |
Oppenheimer Mid Cap Revenue ETF (Ticker: RWK) | June 30, 2017 |
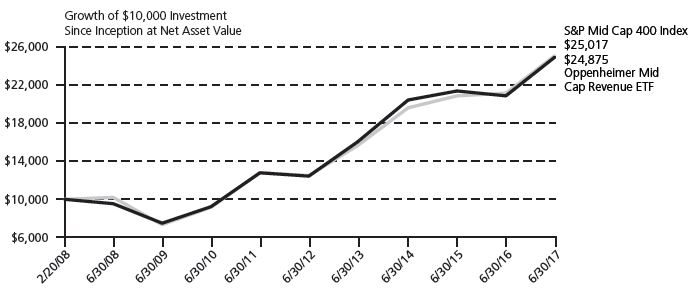 |
| Fund Performance History (%) | | Average Annual Total Return As of June 30, 2017 | ||||||||||||
| 1 Year | 5 Year | Since Inception* | ||||||||||||
Mid Cap NAV Return | 19.46 | % | 14.90 | % | 10.26% | |||||||||
Mid Cap Market Price Return | 19.45 | % | 14.91 | % | 10.26% | |||||||||
OFI Revenue Weighted Mid Cap Index | 20.04 | % | 15.54 | % | 11.00% | |||||||||
S&P Mid Cap 400 Index | 18.57 | % | 14.92 | % | 10.45% | |||||||||
* | The since inception return is calculated from NAV performance inception on 2/20/08, as opposed to the exchange list inception of 2/22/08. NAV performance inception represents when the Fund’s NAV was struck for the first time. Exchange list inception represents when the Fund began trading. |
Oppenheimer Small Cap Revenue ETF (Ticker: RWJ) | June 30, 2017 |
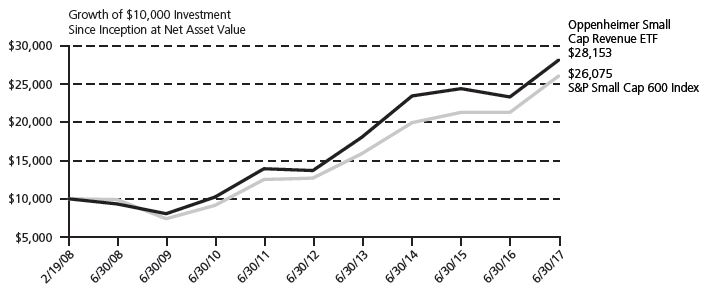 |
| Fund Performance History (%) | | Average Annual Total Return As of June 30, 2017 | ||||||||||||
| 1 Year | 5 Year | Since Inception* | ||||||||||||
Small Cap NAV Return | 20.75 | % | 15.51 | % | 11.72% | |||||||||
Small Cap Market Price Return | 20.76 | % | 15.51 | % | 11.72% | |||||||||
OFI Revenue Weighted Small Cap Index | 21.32 | % | 16.22 | % | 12.56% | |||||||||
S&P Small Cap 600 Index | 22.47 | % | 15.47 | % | 10.78% | |||||||||
* | The since inception return is calculated from NAV performance inception on 2/19/08, as opposed to the exchange list inception of 2/22/08. NAV performance inception represents when the Fund’s NAV was struck for the first time. Exchange list inception represents when the Fund began trading. |
Oppenheimer Financials Sector Revenue ETF (Ticker: RWW) | June 30, 2017 |
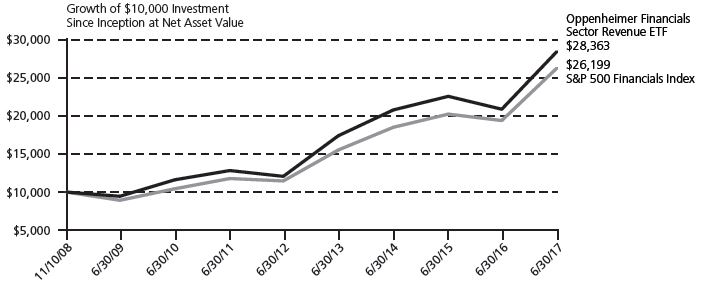 |
| Fund Performance History (%) | | Average Annual Total Return As of June 30, 2017 | ||||||||||||
| 1 Year | 5 Year | Since Inception* | ||||||||||||
Financials Sector NAV Return | 36.14 | % | 18.67 | % | 12.83% | |||||||||
Financials Sector Market Price Return | 36.20 | % | 18.68 | % | 12.82% | |||||||||
OFI Revenue Weighted Financials Sector Index | 36.81 | % | 19.27 | % | 13.44% | |||||||||
S&P 500 Financials Index | 35.37 | % | 18.00 | % | 7.25% | |||||||||
* | The since inception return is calculated from NAV performance inception on 11/10/08, as opposed to the exchange list inception of 11/12/08. NAV performance inception represents when the Fund’s NAV was struck for the first time. Exchange list inception represents when the Fund began trading. |
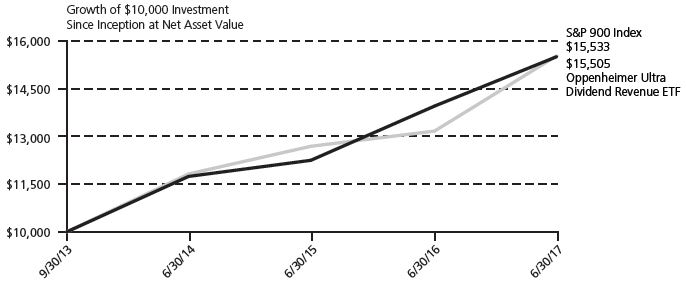
Oppenheimer Ultra Dividend Revenue ETF (Ticker: RDIV) | June 30, 2017 |
 |
| Fund Performance History (%) | | Average Annual Total Return As of June 30, 2017 | ||||||||
| 1 Year | Since Inception* | |||||||||
Ultra Dividend NAV Return | 11.10 | % | 12.41% | |||||||
Ultra Dividend Market Price Return | 11.18 | % | 12.43% | |||||||
OFI Revenue Weighted Ultra Dividend Index | 11.78 | % | 13.31% | |||||||
S&P 900 Index | 17.95 | % | 12.46% | |||||||
* | The since inception return is calculated from NAV performance inception on 9/30/13, as opposed to the exchange list inception of 10/1/13. NAV performance inception represents when the Fund’s NAV was struck for the first time. Exchange list inception represents when the Fund began trading. |
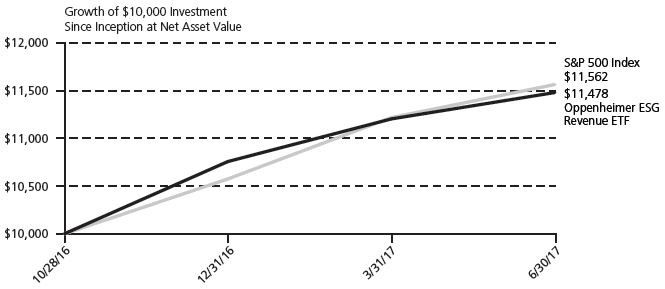
Oppenheimer ESG Revenue ETF (ESGL) | June 30, 2017 |
 |
| Fund Performance History (%) | | Average Annual Total Return As of June 30, 2017 | ||||
| Since Inception** | ||||||
ESG NAV Return | 14.78%* | |||||
ESG Market Price Return | 14.82%* | |||||
OFI Revenue Weighted ESG Index | 14.69% | |||||
S&P 500 Index | 15.62% | |||||
* | Not annualized. |
** | The since inception return is calculated from NAV performance inception on 10/28/16, as opposed to the exchange list inception of 10/31/16. NAV performance inception represents when the Fund’s NAV was struck for the first time. Exchange list inception represents when the Fund began trading. |
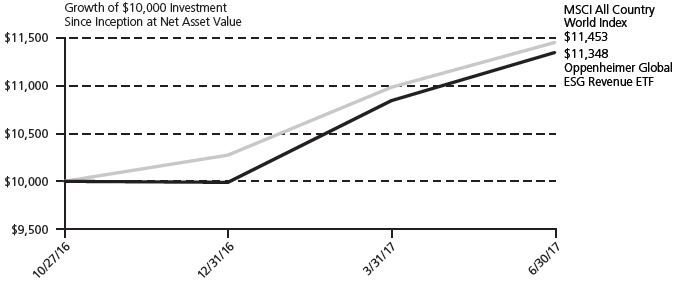
Oppenheimer Global ESG Revenue ETF (ESGF) | June 30, 2017 |
 |
| Fund Performance History (%) | | Average Annual Total Return As of June 30, 2017 | ||||
| Since Inception** | ||||||
Global ESG NAV Return | 13.49%* | |||||
Global ESG Market Price Return | 14.97%* | |||||
OFI Revenue Weighted Global ESG Index | 13.81% | |||||
MSCI All Country World Index | 14.53% | |||||
* | Not annualized. |
** | The since inception return is calculated from NAV performance inception on 10/27/16, as opposed to the exchange list inception of 10/31/16. NAV performance inception represents when the Fund’s NAV was struck for the first time. Exchange list inception represents when the Fund began trading. |
| Beginning Account Value 01/01/2017 | Ending Account Value 06/30/2017 | Annualized Expense Ratios for the Six Month Period | Expenses Paid During the Six Month Period1 | |||||
| Oppenheimer Large Cap Revenue ETF | ||||||||
| Actual | $1,000.00 | $1,071.70 | 0.39% | $2.00 | ||||
| Hypothetical (5% return before expenses) | $1,000.00 | $1,022.86 | 0.39% | $1.96 | ||||
| Oppenheimer Mid Cap Revenue ETF | ||||||||
| Actual | $1,000.00 | $1,042.80 | 0.39% | $1.98 | ||||
| Hypothetical (5% return before expenses) | $1,000.00 | $1,022.86 | 0.39% | $1.96 | ||||
| Oppenheimer Small Cap Revenue ETF | ||||||||
| Actual | $1,000.00 | $986.10 | 0.39% | $1.92 | ||||
| Hypothetical (5% return before expenses) | $1,000.00 | $1,022.86 | 0.39% | $1.96 | ||||
| Oppenheimer Financials Sector Revenue ETF | ||||||||
| Actual | $1,000.00 | $1,066.40 | 0.49% | $2.51 | ||||
| Hypothetical (5% return before expenses) | $1,000.00 | $1,022.36 | 0.49% | $2.46 | ||||
| Oppenheimer Ultra Dividend Revenue ETF | ||||||||
| Actual | $1,000.00 | $997.70 | 0.39% | $1.93 | ||||
| Hypothetical (5% return before expenses) | $1,000.00 | $1,022.86 | 0.39% | $1.96 | ||||
| Oppenheimer ESG Revenue ETF | ||||||||
| Actual | $1,000.00 | $1,067.20 | 0.40% | $2.05 | ||||
| Hypothetical (5% return before expenses) | $1,000.00 | $1,022.81 | 0.40% | $2.01 | ||||
| Oppenheimer Global ESG Revenue ETF | ||||||||
| Actual | $1,000.00 | $1,136.00 | 0.45% | $2.38 | ||||
| Hypothetical (5% return before expenses) | $1,000.00 | $1,022.56 | 0.45% | $2.26 |
| 1 | Expenses are calculated using each Fund’s annualized expense ratio, multiplied by the average account value for the period, multiplied by 181/365 (to reflect the six-month period). |
| Industry | | % of Net Assets | | ||||||||
Automobiles & Components | 3.4% | ||||||||||
Banks | 4.6 | ||||||||||
Capital Goods | 7.8 | ||||||||||
Commercial & Professional Services | 0.5 | ||||||||||
Consumer Durables & Apparel | 1.7 | ||||||||||
Consumer Services | 1.2 | ||||||||||
Diversified Financials | 5.0 | ||||||||||
Energy | 7.2 | ||||||||||
Food & Staples Retailing | 10.0 | ||||||||||
Food, Beverage & Tobacco | 3.7 | ||||||||||
Health Care Equipment & Services | 12.4 | ||||||||||
Household & Personal Products | 1.1 | ||||||||||
Insurance | 4.2 | ||||||||||
Materials | 2.9 | ||||||||||
Media | 2.9 | ||||||||||
Money Market Fund | 1.2 | ||||||||||
Pharmaceuticals, Biotechnology & Life Sciences | 3.7 | ||||||||||
Real Estate | 0.9 | ||||||||||
Retailing | 7.1 | ||||||||||
Semiconductors & Semiconductor Equipment | 1.6 | ||||||||||
Software & Services | 5.1 | ||||||||||
Technology Hardware & Equipment | 4.1 | ||||||||||
Telecommunication Services | 2.8 | ||||||||||
Transportation | 3.1 | ||||||||||
Utilities | 2.7 | ||||||||||
Total Investments | 100.9 | ||||||||||
Liabilities in Excess of Other Assets | (0.9 | ) | |||||||||
Net Assets | 100.0 | % | |||||||||
Revenue ETF
| Industry | | % of Net Assets | | ||||||||
Automobiles & Components | 1.3% | ||||||||||
Banks | 2.5 | ||||||||||
Capital Goods | 10.7 | ||||||||||
Commercial & Professional Services | 3.2 | ||||||||||
Consumer Durables & Apparel | 4.1 | ||||||||||
Consumer Services | 2.6 | ||||||||||
Diversified Financials | 1.1 | ||||||||||
Energy | 6.8 | ||||||||||
Food & Staples Retailing | 1.5 | ||||||||||
Food, Beverage & Tobacco | 3.1 | ||||||||||
Health Care Equipment & Services | �� | 8.1 | |||||||||
Household & Personal Products | 1.0 | ||||||||||
Insurance | 5.9 | ||||||||||
Materials | 9.7 | ||||||||||
Media | 1.8 | ||||||||||
Money Market Fund | 15.2 | ||||||||||
Pharmaceuticals, Biotechnology & Life Sciences | 1.5 | ||||||||||
Real Estate | 2.8 | ||||||||||
Retailing | 6.9 | ||||||||||
Semiconductors & Semiconductor Equipment | 1.3 | ||||||||||
Software & Services | 4.7 | ||||||||||
Technology Hardware & Equipment | 12.0 | ||||||||||
Telecommunication Services | 1.1 | ||||||||||
Transportation | 2.9 | ||||||||||
Utilities | 3.2 | ||||||||||
Total Investments | 115.0 | ||||||||||
Liabilities in Excess of Other Assets | (15.0 | ) | |||||||||
Net Assets | 100.0 | % | |||||||||
Revenue ETF
| Industry | | % of Net Assets | | ||||||||
Automobiles & Components | 2.0% | ||||||||||
Banks | 2.3 | ||||||||||
Capital Goods | 11.1 | ||||||||||
Commercial & Professional Services | 7.7 | ||||||||||
Consumer Durables & Apparel | 4.8 | ||||||||||
Consumer Services | 3.4 | ||||||||||
Diversified Financials | 4.4 | ||||||||||
Energy | 2.4 | ||||||||||
Food & Staples Retailing | 3.1 | ||||||||||
Food, Beverage & Tobacco | 2.4 | ||||||||||
Health Care Equipment & Services | 9.6 | ||||||||||
Household & Personal Products | 0.4 | ||||||||||
Insurance | 2.7 | ||||||||||
Materials | 6.3 | ||||||||||
Media | 1.4 | ||||||||||
Money Market Fund | 12.1 | ||||||||||
Pharmaceuticals, Biotechnology & Life Sciences | 1.3 | ||||||||||
Real Estate | 1.5 | ||||||||||
Retailing | 17.1 | ||||||||||
Semiconductors & Semiconductor Equipment | 1.0 | ||||||||||
Software & Services | 2.8 | ||||||||||
Technology Hardware & Equipment | 7.0 | ||||||||||
Telecommunication Services | 0.6 | ||||||||||
Transportation | 3.4 | ||||||||||
Utilities | 1.1 | ||||||||||
Total Investments | 111.9 | ||||||||||
Liabilities in Excess of Other Assets | (11.9 | ) | |||||||||
Net Assets | 100.0 | % | |||||||||
| Industry | | % of Net Assets | | ||||||||
Banks | 33.5% | ||||||||||
Capital Markets | 13.0 | ||||||||||
Consumer Finance | 6.4 | ||||||||||
Diversified Financial Services | 16.6 | ||||||||||
Insurance | 30.4 | ||||||||||
Total Investments | 99.9 | ||||||||||
Other Assets in Excess of Liabilities | 0.1 | ||||||||||
Net Assets | 100.0 | % | |||||||||
| Industry | | % of Net Assets | | ||||||||
Automobiles & Components | 10.1% | ||||||||||
Banks | 0.6 | ||||||||||
Commercial & Professional Services | 0.7 | ||||||||||
Consumer Durables & Apparel | 1.2 | ||||||||||
Diversified Financials | 1.1 | ||||||||||
Energy | 16.4 | ||||||||||
Insurance | 0.7 | ||||||||||
Materials | 7.4 | ||||||||||
Money Market Fund | 15.5 | ||||||||||
Real Estate | 9.6 | ||||||||||
Retailing | 25.0 | ||||||||||
Technology Hardware & Equipment | 2.2 | ||||||||||
Telecommunication Services | 14.9 | ||||||||||
Utilities | 9.6 | ||||||||||
Total Investments | 115.0 | ||||||||||
Liabilities in Excess of Other Assets | (15.0 | ) | |||||||||
Net Assets | 100.0 | % | |||||||||
| Industry | | % of Net Assets | | ||||||||
Automobiles & Components | 3.9% | ||||||||||
Banks | 2.0 | ||||||||||
Capital Goods | 10.7 | ||||||||||
Commercial & Professional Services | 0.4 | ||||||||||
Consumer Durables & Apparel | 2.3 | ||||||||||
Consumer Services | 1.8 | ||||||||||
Diversified Financials | 2.9 | ||||||||||
Energy | 4.6 | ||||||||||
Food & Staples Retailing | 7.0 | ||||||||||
Food, Beverage & Tobacco | 5.2 | ||||||||||
Health Care Equipment & Services | 8.0 | ||||||||||
Household & Personal Products | 2.3 | ||||||||||
Insurance | 3.6 | ||||||||||
Materials | 4.1 | ||||||||||
Media | 3.3 | ||||||||||
Money Market Fund | 0.3 | ||||||||||
Pharmaceuticals, Biotechnology & Life Sciences | 3.0 | ||||||||||
Real Estate | 1.1 | ||||||||||
Retailing | 5.5 | ||||||||||
Semiconductors & Semiconductor Equipment | 2.6 | ||||||||||
Software & Services | 8.2 | ||||||||||
Technology Hardware & Equipment | 3.4 | ||||||||||
Telecommunication Services | 5.4 | ||||||||||
Transportation | 3.7 | ||||||||||
Utilities | 4.6 | ||||||||||
Total Investments | 99.9 | ||||||||||
Other Assets in Excess of Liabilities | 0.1 | ||||||||||
Net Assets | 100.0 | % | |||||||||
Revenue ETF
| Industry | | % of Net Assets | | ||||||||
Automobiles & Components | 2.4% | ||||||||||
Banks | 12.3 | ||||||||||
Capital Goods | 16.1 | ||||||||||
Commercial & Professional Services | 1.5 | ||||||||||
Consumer Durables & Apparel | 4.1 | ||||||||||
Consumer Services | 1.3 | ||||||||||
Diversified Financials | 3.3 | ||||||||||
Energy | 7.3 | ||||||||||
Food & Staples Retailing | 5.9 | ||||||||||
Food, Beverage & Tobacco | 3.1 | ||||||||||
Health Care Equipment & Services | 1.3 | ||||||||||
Household & Personal Products | 1.7 | ||||||||||
Insurance | 4.8 | ||||||||||
Materials | 6.9 | ||||||||||
Media | 1.2 | ||||||||||
Money Market Fund | 0.9 | ||||||||||
Pharmaceuticals, Biotechnology & Life Sciences | 1.6 | ||||||||||
Real Estate | 0.9 | ||||||||||
Retailing | 2.6 | ||||||||||
Semiconductors & Semiconductor Equipment | 1.9 | ||||||||||
Software & Services | 5.4 | ||||||||||
Technology Hardware & Equipment | 8.7 | ||||||||||
Telecommunication Services | 0.9 | ||||||||||
Transportation | 1.9 | ||||||||||
Utilities | 2.6 | ||||||||||
Total Investments | 100.6 | ||||||||||
Liabilities in Excess of Other Assets | (0.6 | ) | |||||||||
Net Assets | 100.0 | % | |||||||||
| | Shares | | Value | ||||||||
COMMON STOCKS—99.7% | |||||||||||
Automobiles & Components—3.4% | |||||||||||
BorgWarner, Inc. | 13,633 | $ | 577,494 | ||||||||
Delphi Automotive PLC | 12,595 | 1,103,952 | |||||||||
Ford Motor Co. | 844,126 | 9,445,770 | |||||||||
General Motors Co. | 315,571 | 11,022,895 | |||||||||
Goodyear Tire & Rubber Co. (The) | 28,092 | 982,096 | |||||||||
Harley-Davidson, Inc.1 | 6,696 | 361,718 | |||||||||
Total Automobiles & Components | 23,493,925 | ||||||||||
Banks—4.6% | |||||||||||
Bank of America Corp. | 259,159 | 6,287,197 | |||||||||
BB&T Corp. | 16,940 | 769,245 | |||||||||
Citigroup, Inc. | 83,483 | 5,583,343 | |||||||||
Citizens Financial Group, Inc. | 10,386 | 370,573 | |||||||||
Comerica, Inc. | 2,602 | 190,570 | |||||||||
Fifth Third Bancorp | 16,459 | 427,276 | |||||||||
Huntington Bancshares, Inc. | 19,844 | 268,291 | |||||||||
JPMorgan Chase & Co. | 79,682 | 7,282,935 | |||||||||
KeyCorp | 20,254 | 379,560 | |||||||||
M&T Bank Corp. | 2,297 | 371,999 | |||||||||
People’s United Financial, Inc. | 5,387 | 95,134 | |||||||||
PNC Financial Services Group, Inc. (The) | 8,692 | 1,085,370 | |||||||||
Regions Financial Corp. | 26,310 | 385,178 | |||||||||
SunTrust Banks, Inc. | 10,619 | 602,310 | |||||||||
U.S. Bancorp | 28,249 | 1,466,688 | |||||||||
Wells Fargo & Co. | 112,019 | 6,206,973 | |||||||||
Zions Bancorporation | 3,771 | 165,585 | |||||||||
Total Banks | 31,938,227 | ||||||||||
Capital Goods—7.8% | |||||||||||
3M Co. | 9,212 | 1,917,846 | |||||||||
Acuity Brands, Inc.1 | 1,232 | 250,441 | |||||||||
Allegion PLC | 1,812 | 146,989 | |||||||||
AMETEK, Inc. | 4,017 | 243,310 | |||||||||
Arconic, Inc. | 30,075 | 681,199 | |||||||||
Boeing Co. (The) | 30,469 | 6,025,245 | |||||||||
Caterpillar, Inc. | 23,424 | 2,517,143 | |||||||||
Cummins, Inc. | 7,064 | 1,145,922 | |||||||||
Deere & Co. | 13,529 | 1,672,049 | |||||||||
Dover Corp. | 5,429 | 435,514 | |||||||||
Eaton Corp. PLC | 16,637 | 1,294,858 | |||||||||
Emerson Electric Co. | 15,306 | 912,544 | |||||||||
Fastenal Co.1 | 5,893 | 256,522 | |||||||||
Flowserve Corp. | 5,275 | 244,918 | |||||||||
Fluor Corp. | 27,857 | 1,275,293 | |||||||||
Fortive Corp. | 6,386 | 404,553 | |||||||||
Fortune Brands Home & Security, Inc. | 5,004 | 326,461 | |||||||||
General Dynamics Corp. | 9,849 | 1,951,087 | |||||||||
General Electric Co. | 264,055 | 7,132,126 | |||||||||
Honeywell International, Inc. | 18,700 | 2,492,523 | |||||||||
Illinois Tool Works, Inc. | 5,962 | 854,056 | |||||||||
Ingersoll-Rand PLC | 9,724 | 888,676 | |||||||||
Jacobs Engineering Group, Inc. | 12,146 | 660,621 | |||||||||
Johnson Controls International PLC | 51,991 | 2,254,330 | |||||||||
L3 Technologies, Inc. | 4,130 | 690,040 | |||||||||
Lockheed Martin Corp. | 10,926 | 3,033,167 | |||||||||
Masco Corp. | 12,298 | 469,907 | |||||||||
Northrop Grumman Corp. | 6,147 | 1,577,996 | |||||||||
| | Shares | | Value | ||||||||
PACCAR, Inc. | 16,691 | $ | 1,102,274 | ||||||||
Parker-Hannifin Corp. | 4,613 | 737,250 | |||||||||
Pentair PLC | 4,713 | 313,603 | |||||||||
Quanta Services, Inc.2 | 16,251 | 534,983 | |||||||||
Raytheon Co. | 9,572 | 1,545,687 | |||||||||
Rockwell Automation, Inc. | 2,401 | 388,866 | |||||||||
Rockwell Collins, Inc. | 3,179 | 334,049 | |||||||||
Roper Technologies, Inc. | 1,105 | 255,841 | |||||||||
Snap-on, Inc. | 1,546 | 244,268 | |||||||||
Stanley Black & Decker, Inc. | 5,242 | 737,707 | |||||||||
Textron, Inc. | 18,506 | 871,633 | |||||||||
TransDigm Group, Inc.1 | 794 | 213,483 | |||||||||
United Rentals, Inc.2 | 3,588 | 404,403 | |||||||||
United Technologies Corp. | 30,697 | 3,748,411 | |||||||||
W.W. Grainger, Inc.1 | 3,684 | 665,072 | |||||||||
Xylem, Inc. | 4,742 | 262,849 | |||||||||
Total Capital Goods | 54,115,715 | ||||||||||
Commercial & Professional Services—0.5% | |||||||||||
Cintas Corp. | 2,577 | 324,805 | |||||||||
Equifax, Inc. | 1,467 | 201,595 | |||||||||
IHS Markit Ltd.1,2 | 4,097 | 180,432 | |||||||||
Nielsen Holdings PLC | 10,577 | 408,907 | |||||||||
Republic Services, Inc. | 9,408 | 599,572 | |||||||||
Robert Half International, Inc. | 6,970 | 334,072 | |||||||||
Stericycle, Inc.1,2 | 2,931 | 223,694 | |||||||||
Verisk Analytics, Inc.2 | 1,541 | 130,014 | |||||||||
Waste Management, Inc. | 11,994 | 879,760 | |||||||||
Total Commercial & Professional Services | 3,282,851 | ||||||||||
Consumer Durables & Apparel—1.7% | |||||||||||
Coach, Inc. | 6,275 | 297,058 | |||||||||
D.R. Horton, Inc. | 24,892 | 860,516 | |||||||||
Garmin Ltd.1 | 3,757 | 191,720 | |||||||||
Hanesbrands, Inc.1 | 17,488 | 405,022 | |||||||||
Hasbro, Inc. | 2,963 | 330,404 | |||||||||
Leggett & Platt, Inc. | 4,617 | 242,531 | |||||||||
Lennar Corp., Class A | 13,620 | 726,218 | |||||||||
Mattel, Inc. | 16,481 | 354,836 | |||||||||
Michael Kors Holdings Ltd.2 | 8,307 | 301,129 | |||||||||
Mohawk Industries, Inc.2 | 2,379 | 574,981 | |||||||||
Newell Brands, Inc. | 17,841 | 956,634 | |||||||||
NIKE, Inc., Class B | 41,202 | 2,430,918 | |||||||||
PulteGroup, Inc. | 20,913 | 512,996 | |||||||||
PVH Corp. | 4,969 | 568,951 | |||||||||
Ralph Lauren Corp. | 5,952 | 439,258 | |||||||||
Under Armour, Inc., Class A1,2 | 7,190 | 156,454 | |||||||||
Under Armour, Inc., Class C1,2 | 7,679 | 154,809 | |||||||||
VF Corp.1 | 13,505 | 777,888 | |||||||||
Whirlpool Corp. | 6,816 | 1,306,082 | |||||||||
Total Consumer Durables & Apparel | 11,588,405 | ||||||||||
Consumer Services—1.2% | |||||||||||
Carnival Corp.1 | 16,157 | 1,059,414 | |||||||||
Chipotle Mexican Grill, Inc.1,2 | 582 | 242,170 | |||||||||
Darden Restaurants, Inc. | 5,000 | 452,200 | |||||||||
H&R Block, Inc. | 6,410 | 198,133 | |||||||||
Hilton Worldwide Holdings, Inc. | 10,601 | 655,672 | |||||||||
Marriott International, Inc., Class A | 11,532 | 1,156,775 | |||||||||
McDonald’s Corp. | 10,350 | 1,585,206 | |||||||||
Royal Caribbean Cruises Ltd. | 4,907 | 535,992 | |||||||||
| | Shares | | Value | ||||||||
Consumer Services (continued) | |||||||||||
Starbucks Corp. | 23,411 | $ | 1,365,095 | ||||||||
Wyndham Worldwide Corp. | 3,571 | 358,564 | |||||||||
Wynn Resorts Ltd. | 2,365 | 317,194 | |||||||||
Yum! Brands, Inc. | 5,585 | 411,950 | |||||||||
Total Consumer Services | 8,338,365 | ||||||||||
Diversified Financials—5.0% | |||||||||||
Affiliated Managers Group, Inc. | 875 | 145,127 | |||||||||
American Express Co. | 26,692 | 2,248,534 | |||||||||
Ameriprise Financial, Inc. | 5,864 | 746,429 | |||||||||
Bank of New York Mellon Corp. (The) | 20,371 | 1,039,328 | |||||||||
Berkshire Hathaway, Inc., Class B2 | 88,842 | 15,047,170 | |||||||||
BlackRock, Inc. | 1,722 | 727,390 | |||||||||
Capital One Financial Corp. | 21,999 | 1,817,557 | |||||||||
CBOE Holdings, Inc. | 607 | 55,480 | |||||||||
Charles Schwab Corp. (The) | 12,106 | 520,074 | |||||||||
CME Group, Inc. | 1,950 | 244,218 | |||||||||
Discover Financial Services | 11,239 | 698,953 | |||||||||
E*TRADE Financial Corp.2 | 3,619 | 137,631 | |||||||||
Franklin Resources, Inc. | 9,219 | 412,919 | |||||||||
Goldman Sachs Group, Inc. (The) | 11,529 | 2,558,285 | |||||||||
Intercontinental Exchange, Inc. | 5,818 | 383,523 | |||||||||
Invesco Ltd. | 8,849 | 311,396 | |||||||||
Leucadia National Corp. | 28,714 | 751,158 | |||||||||
Moody’s Corp. | 1,992 | 242,387 | |||||||||
Morgan Stanley | 57,689 | 2,570,622 | |||||||||
Nasdaq, Inc. | 3,402 | 243,209 | |||||||||
Navient Corp. | 19,449 | 323,826 | |||||||||
Northern Trust Corp. | 3,582 | 348,206 | |||||||||
Raymond James Financial, Inc. | 4,890 | 392,276 | |||||||||
S&P Global, Inc. | 2,490 | 363,515 | |||||||||
State Street Corp. | 7,755 | 695,856 | |||||||||
Synchrony Financial | 33,779 | 1,007,290 | |||||||||
T. Rowe Price Group, Inc.1 | 3,778 | 280,365 | |||||||||
Total Diversified Financials | 34,312,724 | ||||||||||
Energy—7.2% | |||||||||||
Anadarko Petroleum Corp. | 13,432 | 609,007 | |||||||||
Apache Corp.1 | 7,729 | 370,451 | |||||||||
Baker Hughes, Inc. | 10,722 | 584,456 | |||||||||
Cabot Oil & Gas Corp. | 3,826 | 95,956 | |||||||||
Chesapeake Energy Corp.1,2 | 80,801 | 401,581 | |||||||||
Chevron Corp. | 67,210 | 7,012,019 | |||||||||
Cimarex Energy Co. | 1,025 | 96,360 | |||||||||
Concho Resources, Inc.2 | 1,079 | 131,131 | |||||||||
ConocoPhillips | 36,734 | 1,614,827 | |||||||||
Devon Energy Corp. | 23,897 | 763,987 | |||||||||
EOG Resources, Inc. | 6,338 | 573,716 | |||||||||
EQT Corp.1 | 2,167 | 126,965 | |||||||||
Exxon Mobil Corp. | 164,114 | 13,248,923 | |||||||||
Halliburton Co. | 23,207 | 991,171 | |||||||||
Helmerich & Payne, Inc.1 | 1,756 | 95,421 | |||||||||
Hess Corp. | 7,471 | 327,753 | |||||||||
Kinder Morgan, Inc. | 45,129 | 864,672 | |||||||||
Marathon Oil Corp. | 21,964 | 260,273 | |||||||||
Marathon Petroleum Corp. | 71,728 | 3,753,526 | |||||||||
Murphy Oil Corp.1 | 5,059 | 129,662 | |||||||||
National Oilwell Varco, Inc. | 13,259 | 436,752 | |||||||||
Newfield Exploration Co.2 | 3,507 | 99,809 | |||||||||
| | Shares | | Value | ||||||||
Noble Energy, Inc. | 7,949 | $ | 224,957 | ||||||||
Occidental Petroleum Corp. | 11,737 | 702,694 | |||||||||
ONEOK, Inc.1 | 12,880 | 671,821 | |||||||||
Phillips 66 | 62,048 | 5,130,749 | |||||||||
Pioneer Natural Resources Co. | 1,871 | 298,574 | |||||||||
Range Resources Corp.1 | 4,272 | 98,982 | |||||||||
Schlumberger Ltd. | 26,792 | 1,763,985 | |||||||||
TechnipFMC PLC2 | 24,613 | 669,474 | |||||||||
Tesoro Corp. | 17,833 | 1,669,169 | |||||||||
Transocean Ltd.1,2 | 27,001 | 222,218 | |||||||||
Valero Energy Corp. | 75,427 | 5,088,305 | |||||||||
Williams Cos., Inc. (The) | 17,683 | 535,441 | |||||||||
Total Energy | 49,664,787 | ||||||||||
Food & Staples Retailing—10.0% | |||||||||||
Costco Wholesale Corp. | 42,964 | 6,871,232 | |||||||||
CVS Health Corp. | 143,023 | 11,507,631 | |||||||||
Kroger Co. (The) | 307,597 | 7,173,162 | |||||||||
Sysco Corp. | 62,908 | 3,166,160 | |||||||||
Walgreens Boots Alliance, Inc. | 90,212 | 7,064,502 | |||||||||
Wal-Mart Stores, Inc. | 421,814 | 31,922,883 | |||||||||
Whole Foods Market, Inc. | 31,420 | 1,323,096 | |||||||||
Total Food & Staples Retailing | 69,028,666 | ||||||||||
Food, Beverage & Tobacco—3.7% | |||||||||||
Altria Group, Inc. | 16,253 | 1,210,361 | |||||||||
Archer-Daniels-Midland Co. | 95,189 | 3,938,921 | |||||||||
Brown-Forman Corp., Class B1 | 3,895 | 189,297 | |||||||||
Campbell Soup Co. | 8,924 | 465,387 | |||||||||
Coca-Cola Co. (The) | 57,579 | 2,582,418 | |||||||||
Conagra Brands, Inc. | 14,321 | 512,119 | |||||||||
Constellation Brands, Inc., Class A | 2,606 | 504,860 | |||||||||
Dr Pepper Snapple Group, Inc. | 4,413 | 402,068 | |||||||||
General Mills, Inc. | 17,146 | 949,888 | |||||||||
Hershey Co. (The) | 4,169 | 447,626 | |||||||||
Hormel Foods Corp. | 17,607 | 600,575 | |||||||||
JM Smucker Co. (The) | 3,741 | 442,673 | |||||||||
Kellogg Co. | 11,219 | 779,272 | |||||||||
Kraft Heinz Co. (The) | 18,366 | 1,572,864 | |||||||||
McCormick & Co., Inc. | 2,683 | 261,619 | |||||||||
Molson Coors Brewing Co., Class B | 4,904 | 423,411 | |||||||||
Mondelez International, Inc., Class A | 36,121 | 1,560,066 | |||||||||
Monster Beverage Corp.2 | 3,872 | 192,361 | |||||||||
PepsiCo, Inc. | 34,404 | 3,973,318 | |||||||||
Philip Morris International, Inc. | 14,170 | 1,664,267 | |||||||||
Reynolds American, Inc. | 12,222 | 794,919 | |||||||||
Tyson Foods, Inc., Class A | 38,056 | 2,383,447 | |||||||||
Total Food, Beverage & Tobacco | 25,851,737 | ||||||||||
Health Care Equipment & Services—12.4% | |||||||||||
Abbott Laboratories | 29,656 | 1,441,578 | |||||||||
Aetna, Inc. | 26,888 | 4,082,405 | |||||||||
Align Technology, Inc.2 | 509 | 76,411 | |||||||||
AmerisourceBergen Corp.1 | 101,466 | 9,591,581 | |||||||||
Anthem, Inc. | 29,560 | 5,561,123 | |||||||||
Baxter International, Inc. | 11,343 | 686,705 | |||||||||
Becton Dickinson and Co.1 | 4,113 | 802,487 | |||||||||
Boston Scientific Corp.2 | 19,807 | 549,050 | |||||||||
C.R. Bard, Inc. | 773 | 244,353 | |||||||||
Cardinal Health, Inc. | 108,431 | 8,448,944 | |||||||||
| | Shares | | Value | ||||||||
Health Care Equipment & Services (continued) | |||||||||||
Centene Corp.2 | 36,605 | $ | 2,924,007 | ||||||||
Cerner Corp.2 | 4,777 | 317,527 | |||||||||
Cigna Corp. | 15,378 | 2,574,123 | |||||||||
Cooper Cos., Inc. (The) | 540 | 129,287 | |||||||||
Danaher Corp. | 13,022 | 1,098,927 | |||||||||
DaVita, Inc.2 | 14,508 | 939,538 | |||||||||
DENTSPLY SIRONA, Inc. | 3,915 | 253,849 | |||||||||
Edwards Lifesciences Corp.2 | 1,755 | 207,511 | |||||||||
Envision Healthcare Corp.1,2 | 5,371 | 336,601 | |||||||||
Express Scripts Holding Co.2 | 101,659 | 6,489,911 | |||||||||
HCA Holdings, Inc.2 | 31,899 | 2,781,593 | |||||||||
Henry Schein, Inc.2 | 4,107 | 751,663 | |||||||||
Hologic, Inc.2 | 4,143 | 188,009 | |||||||||
Humana, Inc. | 15,133 | 3,641,303 | |||||||||
IDEXX Laboratories, Inc.2 | 725 | 117,030 | |||||||||
Intuitive Surgical, Inc.2 | 201 | 188,009 | |||||||||
Laboratory Corp. of America Holdings2 | 4,433 | 683,303 | |||||||||
McKesson Corp. | 77,417 | 12,738,193 | |||||||||
Medtronic PLC | 21,448 | 1,903,510 | |||||||||
Patterson Cos., Inc.1 | 7,661 | 359,684 | |||||||||
Quest Diagnostics, Inc. | 4,489 | 498,997 | |||||||||
Stryker Corp. | 5,344 | 741,640 | |||||||||
UnitedHealth Group, Inc. | 67,127 | 12,446,688 | |||||||||
Universal Health Services, Inc., Class B | 5,477 | 668,632 | |||||||||
Varian Medical Systems, Inc.1,2 | 1,851 | 191,005 | |||||||||
Zimmer Biomet Holdings, Inc. | 3,946 | 506,666 | |||||||||
Total Health Care Equipment & Services | 85,161,843 | ||||||||||
Household & Personal Products—1.1% | |||||||||||
Church & Dwight Co., Inc. | 4,207 | 218,259 | |||||||||
Clorox Co. (The) | 2,707 | 360,681 | |||||||||
Colgate-Palmolive Co. | 12,743 | 944,639 | |||||||||
Coty, Inc., Class A | 21,871 | 410,300 | |||||||||
Estee Lauder Cos., Inc., (The), Class A | 7,598 | 729,256 | |||||||||
Kimberly-Clark Corp. | 8,914 | 1,150,886 | |||||||||
Procter & Gamble Co. (The) | 46,617 | 4,062,672 | |||||||||
Total Household & Personal Products | 7,876,693 | ||||||||||
Insurance—4.2% | |||||||||||
Aflac, Inc. | 18,449 | 1,433,118 | |||||||||
Allstate Corp. (The) | 26,164 | 2,313,944 | |||||||||
American International Group, Inc. | 53,931 | 3,371,766 | |||||||||
Aon PLC | 5,300 | 704,635 | |||||||||
Arthur J. Gallagher & Co. | 6,215 | 355,809 | |||||||||
Assurant, Inc. | 4,046 | 419,530 | |||||||||
Chubb Ltd. | 14,022 | 2,038,519 | |||||||||
Cincinnati Financial Corp. | 4,858 | 351,962 | |||||||||
Everest Re Group Ltd. | 1,514 | 385,449 | |||||||||
Hartford Financial Services Group, Inc. (The) | 22,677 | 1,192,130 | |||||||||
Lincoln National Corp. | 12,788 | 864,213 | |||||||||
Loews Corp. | 17,699 | 828,490 | |||||||||
Marsh & McLennan Cos., Inc. | 10,692 | 833,548 | |||||||||
MetLife, Inc. | 73,397 | 4,032,431 | |||||||||
Principal Financial Group, Inc. | 12,186 | 780,757 | |||||||||
Progressive Corp. (The) | 34,604 | 1,525,691 | |||||||||
Prudential Financial, Inc. | 34,409 | 3,720,989 | |||||||||
Torchmark Corp. | 3,310 | 253,215 | |||||||||
| | Shares | | Value | ||||||||
Travelers Cos., Inc. (The) | 13,774 | $ | 1,742,824 | ||||||||
Unum Group | 15,077 | 703,041 | |||||||||
Willis Towers Watson PLC1 | 3,442 | 500,673 | |||||||||
XL Group Ltd. | 15,865 | 694,887 | |||||||||
Total Insurance | 29,047,621 | ||||||||||
Materials—2.9% | |||||||||||
Air Products & Chemicals, Inc. | 3,863 | 552,641 | |||||||||
Albemarle Corp. | 1,656 | 174,774 | |||||||||
Avery Dennison Corp. | 4,619 | 408,181 | |||||||||
Ball Corp.1 | 15,215 | 642,225 | |||||||||
CF Industries Holdings, Inc.1 | 8,887 | 248,481 | |||||||||
Dow Chemical Co. (The) | 50,626 | 3,192,982 | |||||||||
E.I. du Pont de Nemours & Co. | 19,550 | 1,577,881 | |||||||||
Eastman Chemical Co. | 7,057 | 592,717 | |||||||||
Ecolab, Inc. | 6,322 | 839,246 | |||||||||
FMC Corp. | 2,607 | 190,441 | |||||||||
Freeport-McMoRan, Inc.2 | 53,339 | 640,601 | |||||||||
International Flavors & Fragrances, Inc. | 1,498 | 202,230 | |||||||||
International Paper Co. | 24,649 | 1,395,380 | |||||||||
LyondellBasell Industries NV, Class A | 24,660 | 2,081,057 | |||||||||
Martin Marietta Materials, Inc. | 1,083 | 241,054 | |||||||||
Monsanto Co. | 7,880 | 932,677 | |||||||||
Mosaic Co. (The) | 20,262 | 462,581 | |||||||||
Newmont Mining Corp. | 13,389 | 433,670 | |||||||||
Nucor Corp. | 20,304 | 1,174,993 | |||||||||
PPG Industries, Inc. | 8,497 | 934,330 | |||||||||
Praxair, Inc. | 5,106 | 676,800 | |||||||||
Sealed Air Corp. | 8,885 | 397,693 | |||||||||
Sherwin-Williams Co. (The) | 2,193 | 769,655 | |||||||||
Vulcan Materials Co. | 1,805 | 228,657 | |||||||||
WestRock Co. | 15,973 | 905,030 | |||||||||
Total Materials | 19,895,977 | ||||||||||
Media—2.9% | |||||||||||
CBS Corp., Class B | 13,446 | 857,586 | |||||||||
Charter Communications, Inc., Class A2 | 6,929 | 2,334,034 | |||||||||
Comcast Corp., Class A | 126,735 | 4,932,526 | |||||||||
Discovery Communications, Inc., Class A1,2 | 7,938 | 205,039 | |||||||||
Discovery Communications, Inc., Class C2 | 8,215 | 207,100 | |||||||||
DISH Network Corp., Class A2 | 14,697 | 922,384 | |||||||||
Interpublic Group of Cos., Inc. (The)1 | 20,646 | 507,892 | |||||||||
News Corp., Class A | 19,491 | 267,027 | |||||||||
News Corp., Class B1 | 18,886 | 267,237 | |||||||||
Omnicom Group, Inc. | 11,979 | 993,059 | |||||||||
Scripps Networks Interactive, Inc., Class A1 | 3,258 | 222,554 | |||||||||
Time Warner, Inc. | 19,213 | 1,929,177 | |||||||||
Twenty-First Century Fox, Inc., Class A | 32,816 | 930,005 | |||||||||
Twenty-First Century Fox, Inc., Class B | 33,213 | 925,646 | |||||||||
Viacom, Inc., Class B1 | 23,647 | 793,830 | |||||||||
Walt Disney Co. (The) | 33,570 | 3,566,812 | |||||||||
Total Media | 19,861,908 | ||||||||||
| | Shares | | Value | ||||||||
Pharmaceuticals, Biotechnology & Life Sciences—3.7% | |||||||||||
AbbVie, Inc. | 23,783 | $ | 1,724,505 | ||||||||
Agilent Technologies, Inc. | 4,588 | 272,114 | |||||||||
Alexion Pharmaceuticals, Inc.2 | 1,771 | 215,478 | |||||||||
Allergan PLC | 4,019 | 976,979 | |||||||||
Amgen, Inc. | 8,947 | 1,540,942 | |||||||||
Biogen, Inc.2 | 2,897 | 786,130 | |||||||||
Bristol-Myers Squibb Co. | 23,560 | 1,312,763 | |||||||||
Celgene Corp.2 | 6,191 | 804,025 | |||||||||
Eli Lilly & Co. | 16,844 | 1,386,261 | |||||||||
Gilead Sciences, Inc. | 28,758 | 2,035,491 | |||||||||
Illumina, Inc.2 | 902 | 156,515 | |||||||||
Incyte Corp.2 | 654 | 82,345 | |||||||||
Johnson & Johnson | 34,742 | 4,596,019 | |||||||||
Mallinckrodt PLC2 | 5,278 | 236,507 | |||||||||
Merck & Co., Inc. | 40,464 | 2,593,338 | |||||||||
Mettler-Toledo International, Inc.2 | 282 | 165,968 | |||||||||
Mylan NV2 | 20,122 | 781,136 | |||||||||
PerkinElmer, Inc. | 2,136 | 145,547 | |||||||||
Perrigo Co. PLC | 4,474 | 337,877 | |||||||||
Pfizer, Inc. | 102,624 | 3,447,140 | |||||||||
Regeneron Pharmaceuticals, Inc.2 | 676 | 332,011 | |||||||||
Thermo Fisher Scientific, Inc. | 6,895 | 1,202,971 | |||||||||
Vertex Pharmaceuticals, Inc.2 | 1,045 | 134,669 | |||||||||
Waters Corp.2 | 760 | 139,719 | |||||||||
Zoetis, Inc. | 5,119 | 319,323 | |||||||||
Total Pharmaceuticals, Biotechnology & Life Sciences | 25,725,773 | ||||||||||
Real Estate—0.9% | |||||||||||
Alexandria Real Estate Equities, Inc. | 517 | 62,283 | |||||||||
American Tower Corp. | 2,993 | 396,034 | |||||||||
Apartment Investment & Management Co., Class A | 1,437 | 61,748 | |||||||||
AvalonBay Communities, Inc. | 691 | 132,789 | |||||||||
Boston Properties, Inc. | 1,275 | 156,850 | |||||||||
CBRE Group, Inc., Class A2 | 24,099 | 877,204 | |||||||||
Crown Castle International Corp. | 2,530 | 253,455 | |||||||||
Digital Realty Trust, Inc. | 1,197 | 135,201 | |||||||||
Equinix, Inc. | 549 | 235,609 | |||||||||
Equity Residential | 2,341 | 154,108 | |||||||||
Essex Property Trust, Inc. | 337 | 86,700 | |||||||||
Extra Space Storage, Inc. | 899 | 70,122 | |||||||||
Federal Realty Investment Trust | 403 | 50,935 | |||||||||
GGP, Inc. | 6,887 | 162,258 | |||||||||
HCP, Inc. | 4,678 | 149,509 | |||||||||
Host Hotels & Resorts, Inc. | 18,831 | 344,042 | |||||||||
Iron Mountain, Inc. | 6,846 | 235,229 | |||||||||
Kimco Realty Corp. | 4,469 | 82,006 | |||||||||
Macerich Co. (The) | 1,178 | 68,395 | |||||||||
Mid-America Apartment Communities, Inc. | 721 | 75,979 | |||||||||
Prologis, Inc. | 3,020 | 177,093 | |||||||||
Public Storage | 815 | 169,952 | |||||||||
Realty Income Corp. | 1,275 | 70,354 | |||||||||
Regency Centers Corp. | 716 | 44,850 | |||||||||
Simon Property Group, Inc. | 2,305 | 372,857 | |||||||||
SL Green Realty Corp. | 1,086 | 114,899 | |||||||||
UDR, Inc. | 1,656 | 64,534 | |||||||||
Ventas, Inc. | 3,235 | 224,768 | |||||||||
| | Shares | | Value | ||||||||
Vornado Realty Trust | 1,821 | $ | 170,992 | ||||||||
Welltower, Inc. | 3,665 | 274,325 | |||||||||
Weyerhaeuser Co. | 12,673 | 424,546 | |||||||||
Total Real Estate | 5,899,626 | ||||||||||
Retailing—7.1% | |||||||||||
Advance Auto Parts, Inc.1 | 4,634 | 540,278 | |||||||||
Amazon.com, Inc.2 | 9,490 | 9,186,320 | |||||||||
AutoNation, Inc.1,2 | 32,536 | 1,371,718 | |||||||||
AutoZone, Inc.2 | 1,129 | 644,049 | |||||||||
Bed Bath & Beyond, Inc.1 | 21,834 | 663,754 | |||||||||
Best Buy Co., Inc. | 44,456 | 2,548,663 | |||||||||
CarMax, Inc.1,2 | 17,326 | 1,092,578 | |||||||||
Dollar General Corp. | 19,484 | 1,404,602 | |||||||||
Dollar Tree, Inc.2 | 18,276 | 1,277,858 | |||||||||
Expedia, Inc.1 | 3,981 | 592,970 | |||||||||
Foot Locker, Inc. | 9,498 | 468,061 | |||||||||
Gap, Inc. (The) | 43,069 | 947,087 | |||||||||
Genuine Parts Co. | 10,482 | 972,310 | |||||||||
Home Depot, Inc. (The) | 38,630 | 5,925,842 | |||||||||
Kohl’s Corp.1 | 32,110 | 1,241,694 | |||||||||
L Brands, Inc. | 15,453 | 832,762 | |||||||||
LKQ Corp.2 | 17,734 | 584,335 | |||||||||
Lowe’s Cos., Inc. | 51,816 | 4,017,294 | |||||||||
Macy’s, Inc. | 72,715 | 1,689,897 | |||||||||
Netflix, Inc.2 | 4,010 | 599,134 | |||||||||
Nordstrom, Inc.1 | 20,108 | 961,766 | |||||||||
O’Reilly Automotive, Inc.1,2 | 2,376 | 519,726 | |||||||||
Priceline Group, Inc. (The)2 | 389 | 727,632 | |||||||||
Ross Stores, Inc. | 13,550 | 782,242 | |||||||||
Signet Jewelers Ltd.1 | 6,847 | 433,004 | |||||||||
Staples, Inc. | 129,885 | 1,307,942 | |||||||||
Target Corp. | 80,105 | 4,188,690 | |||||||||
Tiffany & Co. | 2,818 | 264,526 | |||||||||
TJX Cos., Inc. (The) | 29,314 | 2,115,591 | |||||||||
Tractor Supply Co. | 7,909 | 428,747 | |||||||||
TripAdvisor, Inc.1,2 | 2,532 | 96,722 | |||||||||
Ulta Beauty, Inc.2 | 1,052 | 302,282 | |||||||||
Total Retailing | 48,730,076 | ||||||||||
Semiconductors & Semiconductor Equipment—1.6% | |||||||||||
Advanced Micro Devices, Inc.1,2 | 24,662 | 307,782 | |||||||||
Analog Devices, Inc. | 2,919 | 227,098 | |||||||||
Applied Materials, Inc. | 17,576 | 726,065 | |||||||||
Broadcom Ltd. | 4,201 | 979,043 | |||||||||
Intel Corp. | 109,683 | 3,700,704 | |||||||||
KLA-Tencor Corp. | 2,276 | 208,277 | |||||||||
Lam Research Corp. | 3,110 | 439,847 | |||||||||
Microchip Technology, Inc.1 | 2,675 | 206,457 | |||||||||
Micron Technology, Inc.2 | 30,868 | 921,718 | |||||||||
NVIDIA Corp. | 2,905 | 419,947 | |||||||||
Qorvo, Inc.1,2 | 2,709 | 171,534 | |||||||||
QUALCOMM, Inc. | 27,244 | 1,504,414 | |||||||||
Skyworks Solutions, Inc. | 2,099 | 201,399 | |||||||||
Texas Instruments, Inc. | 11,009 | 846,922 | |||||||||
Xilinx, Inc. | 2,320 | 149,222 | |||||||||
Total Semiconductors & Semiconductor Equipment | 11,010,429 | ||||||||||
| | Shares | | Value | ||||||||
Software & Services—5.1% | |||||||||||
Accenture PLC, Class A | 17,995 | $ | 2,225,622 | ||||||||
Activision Blizzard, Inc. | 7,485 | 430,911 | |||||||||
Adobe Systems, Inc.2 | 2,867 | 405,508 | |||||||||
Akamai Technologies, Inc.2 | 3,098 | 154,311 | |||||||||
Alliance Data Systems Corp. | 1,958 | 502,599 | |||||||||
Alphabet, Inc., Class A2 | 3,160 | 2,937,789 | |||||||||
Alphabet, Inc., Class C2 | 3,220 | 2,926,111 | |||||||||
ANSYS, Inc.2 | 536 | 65,220 | |||||||||
Autodesk, Inc.2 | 1,230 | 124,009 | |||||||||
Automatic Data Processing, Inc. | 7,650 | 783,819 | |||||||||
CA, Inc. | 8,115 | 279,724 | |||||||||
Citrix Systems, Inc.2 | 2,628 | 209,136 | |||||||||
Cognizant Technology Solutions Corp., Class A | 13,334 | 885,378 | |||||||||
CSRA, Inc. | 9,865 | 313,214 | |||||||||
DXC Technology Co. | 6,523 | 500,445 | |||||||||
eBay, Inc.2 | 17,016 | 594,199 | |||||||||
Electronic Arts, Inc.2 | 2,814 | 297,496 | |||||||||
Facebook, Inc., Class A2 | 12,944 | 1,954,285 | |||||||||
Fidelity National Information Services, Inc. | 6,930 | 591,822 | |||||||||
Fiserv, Inc.2 | 2,842 | 347,690 | |||||||||
Gartner, Inc.2 | 1,311 | 161,922 | |||||||||
Global Payments, Inc. | 2,512 | 226,884 | |||||||||
International Business Machines Corp. | 32,939 | 5,067,006 | |||||||||
Intuit, Inc. | 2,218 | 294,573 | |||||||||
Mastercard, Inc., Class A | 5,835 | 708,661 | |||||||||
Microsoft Corp. | 79,920 | 5,508,886 | |||||||||
Oracle Corp. | 53,625 | 2,688,757 | |||||||||
Paychex, Inc. | 3,274 | 186,422 | |||||||||
PayPal Holdings, Inc.2 | 13,791 | 740,163 | |||||||||
Red Hat, Inc.2 | 1,752 | 167,754 | |||||||||
salesforce.com, Inc.2 | 6,228 | 539,345 | |||||||||
Symantec Corp. | 9,061 | 255,973 | |||||||||
Synopsys, Inc.2 | 2,165 | 157,893 | |||||||||
Total System Services, Inc. | 4,965 | 289,211 | |||||||||
VeriSign, Inc.1,2 | 800 | 74,368 | |||||||||
Visa, Inc., Class A1 | 11,441 | 1,072,937 | |||||||||
Western Union Co. (The) | 18,308 | 348,767 | |||||||||
Total Software & Services | 35,018,810 | ||||||||||
Technology Hardware & Equipment—4.1% | |||||||||||
Amphenol Corp., Class A | 5,387 | 397,668 | |||||||||
Apple, Inc. | 97,832 | 14,089,765 | |||||||||
Cisco Systems, Inc. | 98,491 | 3,082,768 | |||||||||
Corning, Inc. | 21,172 | 636,219 | |||||||||
F5 Networks, Inc.2 | 1,017 | 129,220 | |||||||||
FLIR Systems, Inc. | 3,031 | 105,054 | |||||||||
Harris Corp. | 3,665 | 399,778 | |||||||||
Hewlett Packard Enterprise Co. | 127,958 | 2,122,823 | |||||||||
HP, Inc. | 150,456 | 2,629,971 | |||||||||
Juniper Networks, Inc. | 11,344 | 316,271 | |||||||||
Motorola Solutions, Inc. | 4,642 | 402,647 | |||||||||
NetApp, Inc. | 9,136 | 365,897 | |||||||||
Seagate Technology PLC1 | 16,965 | 657,394 | |||||||||
TE Connectivity Ltd. | 10,350 | 814,338 | |||||||||
Western Digital Corp. | 13,015 | 1,153,129 | |||||||||
Xerox Corp. | 23,715 | 681,332 | |||||||||
Total Technology Hardware & Equipment | 27,984,274 | ||||||||||
| | Shares | | Value | ||||||||
Telecommunication Services—2.8% | |||||||||||
AT&T, Inc. | 267,991 | $ | 10,111,300 | ||||||||
CenturyLink, Inc.1 | 41,093 | 981,301 | |||||||||
Level 3 Communications, Inc.2 | 8,201 | 486,319 | |||||||||
Verizon Communications, Inc. | 169,721 | 7,579,740 | |||||||||
Total Telecommunication Services | 19,158,660 | ||||||||||
Transportation—3.1% | |||||||||||
Alaska Air Group, Inc. | 4,585 | 411,550 | |||||||||
American Airlines Group, Inc.1 | 52,595 | 2,646,580 | |||||||||
C.H. Robinson Worldwide, Inc.1 | 12,416 | 852,731 | |||||||||
CSX Corp. | 13,589 | 741,416 | |||||||||
Delta Air Lines, Inc. | 49,112 | 2,639,279 | |||||||||
Expeditors International of Washington, Inc.1 | 6,961 | 393,157 | |||||||||
FedEx Corp. | 17,519 | 3,807,404 | |||||||||
JB Hunt Transport Services, Inc. | 4,722 | 431,496 | |||||||||
Kansas City Southern | 1,501 | 157,080 | |||||||||
Norfolk Southern Corp. | 5,437 | 661,683 | |||||||||
Southwest Airlines Co. | 21,829 | 1,356,454 | |||||||||
Union Pacific Corp. | 11,712 | 1,275,554 | |||||||||
United Continental Holdings, Inc.2 | 30,457 | 2,291,889 | |||||||||
United Parcel Service, Inc., Class B | 35,891 | 3,969,186 | |||||||||
Total Transportation | 21,635,459 | ||||||||||
Utilities—2.7% | |||||||||||
AES Corp. | 44,173 | 490,762 | |||||||||
Alliant Energy Corp. | 5,119 | 205,630 | |||||||||
Ameren Corp. | 6,979 | 381,542 | |||||||||
American Electric Power Co., Inc. | 14,445 | 1,003,494 | |||||||||
American Water Works Co., Inc. | 2,589 | 201,813 | |||||||||
CenterPoint Energy, Inc. | 18,517 | 506,996 | |||||||||
CMS Energy Corp. | 8,564 | 396,085 | |||||||||
Consolidated Edison, Inc.1 | 9,239 | 746,696 | |||||||||
Dominion Energy, Inc.1 | 9,742 | 746,530 | |||||||||
DTE Energy Co. | 6,547 | 692,607 | |||||||||
Duke Energy Corp. | 16,838 | 1,407,488 | |||||||||
Edison International | 9,289 | 726,307 | |||||||||
Entergy Corp. | 8,661 | 664,905 | |||||||||
Eversource Energy | 7,865 | 477,484 | |||||||||
Exelon Corp. | 56,584 | 2,040,985 | |||||||||
FirstEnergy Corp. | 30,594 | 892,121 | |||||||||
NextEra Energy, Inc. | 7,357 | 1,030,936 | |||||||||
NiSource, Inc. | 11,439 | 290,093 | |||||||||
NRG Energy, Inc. | 15,761 | 271,404 | |||||||||
PG&E Corp. | 16,653 | 1,105,260 | |||||||||
Pinnacle West Capital Corp. | 2,527 | 215,199 | |||||||||
PPL Corp. | 12,108 | 468,095 | |||||||||
Public Service Enterprise Group, Inc. | 13,344 | 573,926 | |||||||||
SCANA Corp. | 3,869 | 259,262 | |||||||||
Sempra Energy | 5,897 | 664,887 | |||||||||
Southern Co. (The) | 26,839 | 1,285,051 | |||||||||
WEC Energy Group, Inc.1 | 7,601 | 466,549 | |||||||||
Xcel Energy, Inc. | 15,183 | 696,596 | |||||||||
Total Utilities | 18,908,703 | ||||||||||
Total Common Stocks (Cost $596,332,108) | 687,531,254 | ||||||||||
| | Shares | | Value | |||||||
INVESTMENT OF CASH COLLATERAL | ||||||||||
FOR SECURITIES LOANED—1.2% | ||||||||||
Dreyfus Government Cash Management Money Market Fund—Institutional Shares, 0.91%3 (Cost $8,514,926) | 8,514,926 | $ | 8,514,926 | |||||||
Total Investments—100.9% (Cost $604,847,034) | 696,046,180 | |||||||||
Liabilities in Excess of Other Assets—(0.9)% | (6,542,060 | ) | ||||||||
Net Assets—100.0% | $ | 689,504,120 | ||||||||
| 1 | All or a portion of the security was on loan. The aggregate value of the securities on loan was $33,457,428; total value of the collateral held by the fund was $34,220,055. The total value of the collateral includes non-cash U.S. Treasury securities collateral having a value of $25,705,129 (Note 4). |
| 2 | Non-income producing security. |
| 3 | Rate shown represents annualized 7-day yield as of June 30, 2017. |
The accompanying notes are an integral part of these financial statements.
| | Shares | | Value | ||||||||
COMMON STOCKS—99.8% | |||||||||||
Automobiles & Components—1.3% | |||||||||||
Cooper Tire & Rubber Co.1 | 21,080 | $ | 760,988 | ||||||||
Dana, Inc. | 70,639 | 1,577,369 | |||||||||
Gentex Corp. | 23,666 | 448,944 | |||||||||
Thor Industries, Inc.1 | 14,427 | 1,507,910 | |||||||||
Total Automobiles & Components | 4,295,211 | ||||||||||
Banks—2.5% | |||||||||||
Associated Banc-Corp. | 11,849 | 298,595 | |||||||||
BancorpSouth, Inc. | 6,581 | 200,721 | |||||||||
Bank of Hawaii Corp.1 | 2,085 | 172,992 | |||||||||
Bank of the Ozarks | 4,625 | 216,774 | |||||||||
Cathay General Bancorp | 3,593 | 136,354 | |||||||||
Chemical Financial Corp. | 3,207 | 155,251 | |||||||||
Commerce Bancshares, Inc.1 | 5,462 | 310,405 | |||||||||
Cullen/Frost Bankers, Inc. | 3,022 | 283,796 | |||||||||
East West Bancorp, Inc. | 5,942 | 348,082 | |||||||||
F.N.B. Corp. | 16,836 | 238,398 | |||||||||
First Horizon National Corp. | 20,240 | 352,581 | |||||||||
Fulton Financial Corp. | 10,971 | 208,449 | |||||||||
Hancock Holding Co. | 5,316 | 260,484 | |||||||||
Home BancShares, Inc.1 | 4,988 | 124,201 | |||||||||
International Bancshares Corp. | 3,912 | 137,116 | |||||||||
MB Financial, Inc. | 5,659 | 249,222 | |||||||||
New York Community Bancorp, Inc.1 | 34,773 | 456,570 | |||||||||
PacWest Bancorp | 5,934 | 277,118 | |||||||||
Pinnacle Financial Partners, Inc. | 1,990 | 124,972 | |||||||||
Prosperity Bancshares, Inc. | 3,038 | 195,161 | |||||||||
Signature Bank2 | 2,477 | 355,524 | |||||||||
SVB Financial Group2 | 2,467 | 433,674 | |||||||||
Synovus Financial Corp. | 7,855 | 347,505 | |||||||||
TCF Financial Corp. | 22,630 | 360,722 | |||||||||
Texas Capital Bancshares, Inc.1,2 | 2,606 | 201,704 | |||||||||
Trustmark Corp. | 4,640 | 149,222 | |||||||||
UMB Financial Corp. | 3,548 | 265,603 | |||||||||
Umpqua Holdings Corp. | 16,991 | 311,955 | |||||||||
United Bankshares, Inc.1 | 3,195 | 125,244 | |||||||||
Valley National Bancorp1 | 19,394 | 229,043 | |||||||||
Washington Federal, Inc. | 4,470 | 148,404 | |||||||||
Webster Financial Corp. | 5,376 | 280,735 | |||||||||
Wintrust Financial Corp. | 3,906 | 298,575 | |||||||||
Total Banks | 8,255,152 | ||||||||||
Capital Goods—10.7% | |||||||||||
A.O. Smith Corp. | 12,731 | 717,137 | |||||||||
AECOM1,2 | 139,530 | 4,511,005 | |||||||||
AGCO Corp. | 28,746 | 1,937,193 | |||||||||
Carlisle Cos., Inc. | 10,145 | 967,833 | |||||||||
Crane Co. | 9,090 | 721,564 | |||||||||
Curtiss-Wright Corp. | 5,990 | 549,762 | |||||||||
Donaldson Co., Inc. | 12,610 | 574,259 | |||||||||
Dycom Industries, Inc.1,2 | 8,578 | 767,903 | |||||||||
EMCOR Group, Inc. | 30,567 | 1,998,470 | |||||||||
EnerSys | 8,052 | 583,367 | |||||||||
Esterline Technologies Corp.1,2 | 5,349 | 507,085 | |||||||||
GATX Corp.1 | 5,609 | 360,490 | |||||||||
Graco, Inc. | 3,158 | 345,106 | |||||||||
Granite Construction, Inc. | 13,196 | 636,575 | |||||||||
Hubbell, Inc. | 7,682 | 869,372 | |||||||||
| | Shares | | Value | ||||||||
Huntington Ingalls Industries, Inc. | 9,342 | $ | 1,739,107 | ||||||||
IDEX Corp. | 4,965 | 561,095 | |||||||||
ITT, Inc. | 15,834 | 636,210 | |||||||||
KBR, Inc.1 | 76,658 | 1,166,735 | |||||||||
Kennametal, Inc. | 12,800 | 478,976 | |||||||||
KLX, Inc.1,2 | 7,657 | 382,850 | |||||||||
Lennox International, Inc. | 5,141 | 944,093 | |||||||||
Lincoln Electric Holdings, Inc. | 6,297 | 579,891 | |||||||||
MSC Industrial Direct Co., Inc., Class A | 8,858 | 761,434 | |||||||||
Nordson Corp. | 4,064 | 493,045 | |||||||||
NOW, Inc.1,2 | 32,710 | 525,977 | |||||||||
Orbital ATK, Inc. | 11,676 | 1,148,451 | |||||||||
Oshkosh Corp. | 24,397 | 1,680,465 | |||||||||
Regal Beloit Corp. | 10,233 | 834,501 | |||||||||
Teledyne Technologies, Inc.2 | 4,305 | 549,533 | |||||||||
Terex Corp.1 | 31,847 | 1,194,263 | |||||||||
Timken Co. (The) | 15,226 | 704,203 | |||||||||
Toro Co. (The) | 8,775 | 608,020 | |||||||||
Trinity Industries, Inc. | 41,490 | 1,162,965 | |||||||||
Valmont Industries, Inc. | 4,379 | 655,098 | |||||||||
Wabtec Corp.1 | 9,063 | 829,265 | |||||||||
Watsco, Inc.1 | 7,333 | 1,130,749 | |||||||||
Woodward, Inc. | 7,718 | 521,582 | |||||||||
Total Capital Goods | 35,335,629 | ||||||||||
Commercial & Professional Services—3.2% | |||||||||||
Clean Harbors, Inc.2 | 12,805 | 714,903 | |||||||||
Copart, Inc.1,2 | 11,335 | 360,340 | |||||||||
Deluxe Corp.1 | 6,840 | 473,465 | |||||||||
Dun & Bradstreet Corp. (The) | 4,199 | 454,122 | |||||||||
FTI Consulting, Inc.2 | 13,326 | 465,877 | |||||||||
Herman Miller, Inc.1 | 18,940 | 575,776 | |||||||||
HNI Corp.1 | 14,080 | 561,370 | |||||||||
Manpowergroup, Inc. | 48,228 | 5,384,656 | |||||||||
MSA Safety, Inc. | 3,644 | 295,783 | |||||||||
Pitney Bowes, Inc. | 57,445 | 867,419 | |||||||||
Rollins, Inc.1 | 9,555 | 388,984 | |||||||||
Total Commercial & Professional Services | 10,542,695 | ||||||||||
Consumer Durables & Apparel—4.1% | |||||||||||
Brunswick Corp. | 19,554 | 1,226,623 | |||||||||
CalAtlantic Group, Inc.1 | 48,920 | 1,729,322 | |||||||||
Carter’s, Inc. | 9,525 | 847,249 | |||||||||
Deckers Outdoor Corp.1,2 | 6,743 | 460,277 | |||||||||
Helen of Troy Ltd.2 | 4,254 | 400,301 | |||||||||
Kate Spade & Co.2 | 19,347 | 357,726 | |||||||||
KB Home1 | 44,651 | 1,070,285 | |||||||||
NVR, Inc.1,2 | 635 | 1,530,737 | |||||||||
Polaris Industries, Inc.1 | 13,955 | 1,287,070 | |||||||||
Skechers U.S.A., Inc., Class A1,2 | 34,006 | 1,003,177 | |||||||||
Tempur Sealy International, Inc.1,2 | 16,670 | 890,011 | |||||||||
Toll Brothers, Inc. | 37,227 | 1,470,839 | |||||||||
TRI Pointe Group, Inc.1,2 | 49,473 | 652,549 | |||||||||
Tupperware Brands Corp.1 | 7,993 | 561,348 | |||||||||
Total Consumer Durables & Apparel | 13,487,514 | ||||||||||
Consumer Services—2.6% | |||||||||||
Adtalem Global Education, Inc.1 | 12,729 | 483,066 | |||||||||
Brinker International, Inc.1 | 22,564 | 859,688 | |||||||||
Buffalo Wild Wings, Inc.1,2 | 3,725 | 471,957 | |||||||||
| | Shares | | Value | ||||||||
Consumer Services (continued) | |||||||||||
Cheesecake Factory, Inc. (The)1 | 11,301 | $ | 568,440 | ||||||||
Churchill Downs, Inc.1 | 1,894 | 347,170 | |||||||||
Cracker Barrel Old Country Store, Inc.1 | 4,643 | 776,542 | |||||||||
Domino’s Pizza, Inc. | 3,168 | 670,127 | |||||||||
Dunkin’ Brands Group, Inc.1 | 3,829 | 211,054 | |||||||||
Graham Holdings Co., Class B | 1,073 | 643,424 | |||||||||
International Speedway Corp., Class A | 4,772 | 179,189 | |||||||||
Jack in the Box, Inc. | 3,964 | 390,454 | |||||||||
Panera Bread Co., Class A2 | 2,342 | 736,887 | |||||||||
Papa John’s International, Inc.1 | 5,763 | 413,553 | |||||||||
Service Corp. International | 24,479 | 818,823 | |||||||||
Sotheby’s1,2 | 4,513 | 242,213 | |||||||||
Texas Roadhouse, Inc. | 10,721 | 546,235 | |||||||||
Wendy’s Co. (The)1 | 22,954 | 356,017 | |||||||||
Total Consumer Services | 8,714,839 | ||||||||||
Diversified Financials—1.1% | |||||||||||
Eaton Vance Corp. | 7,330 | 346,856 | |||||||||
FactSet Research Systems, Inc.1 | 1,775 | 294,970 | |||||||||
Federated Investors, Inc., Class B1 | 10,749 | 303,659 | |||||||||
Janus Henderson Group PLC2 | 7,474 | 247,464 | |||||||||
Legg Mason, Inc. | 19,031 | 726,223 | |||||||||
MarketAxess Holdings, Inc. | 482 | 96,930 | |||||||||
MSCI, Inc. | 2,877 | 296,302 | |||||||||
SEI Investments Co. | 6,841 | 367,909 | |||||||||
SLM Corp.2 | 29,846 | 343,229 | |||||||||
Stifel Financial Corp.2 | 15,216 | 699,632 | |||||||||
Total Diversified Financials | 3,723,174 | ||||||||||
Energy—6.8% | |||||||||||
CONSOL Energy, Inc.1,2 | 35,839 | 535,435 | |||||||||
Diamond Offshore Drilling, Inc.1,2 | 32,992 | 357,303 | |||||||||
Dril-Quip, Inc.1,2 | 2,537 | 123,806 | |||||||||
Energen Corp.1,2 | 3,367 | 166,229 | |||||||||
Ensco PLC, Class A1 | 111,352 | 574,576 | |||||||||
Gulfport Energy Corp.1,2 | 11,122 | 164,049 | |||||||||
HollyFrontier Corp.1 | 117,942 | 3,239,867 | |||||||||
Matador Resources Co.1,2 | 3,069 | 65,585 | |||||||||
Nabors Industries Ltd. | 70,286 | 572,128 | |||||||||
Oceaneering International, Inc.1 | 22,383 | 511,228 | |||||||||
Oil States International, Inc.1,2 | 6,243 | 169,497 | |||||||||
Patterson-UTI Energy, Inc. | 12,347 | 249,286 | |||||||||
PBF Energy, Inc., Class A1 | 218,915 | 4,873,048 | |||||||||
QEP Resources, Inc.2 | 44,354 | 447,975 | |||||||||
Rowan Cos. PLC, Class A2 | 33,721 | 345,303 | |||||||||
SM Energy Co.1 | 21,367 | 353,197 | |||||||||
Southwestern Energy Co.1,2 | 110,814 | 673,749 | |||||||||
Superior Energy Services, Inc.1,2 | 36,801 | 383,834 | |||||||||
World Fuel Services Corp. | 218,523 | 8,402,209 | |||||||||
WPX Energy, Inc.2 | 26,551 | 256,483 | |||||||||
Total Energy | 22,464,787 | ||||||||||
Food & Staples Retailing—1.5% | |||||||||||
Casey’s General Stores, Inc.1 | 17,267 | 1,849,468 | |||||||||
Sprouts Farmers Market, Inc.1,2 | 48,271 | 1,094,304 | |||||||||
United Natural Foods, Inc.1,2 | 58,727 | 2,155,281 | |||||||||
Total Food & Staples Retailing | 5,099,053 | ||||||||||
| | Shares | | Value | ||||||||
Food, Beverage & Tobacco—3.1% | |||||||||||
Boston Beer Co., Inc. (The), Class A1,2 | 1,707 | $ | 225,580 | ||||||||
Dean Foods Co.1 | 111,781 | 1,900,277 | |||||||||
Flowers Foods, Inc.1 | 55,445 | 959,753 | |||||||||
Hain Celestial Group, Inc. (The)2 | 22,114 | 858,465 | |||||||||
Ingredion, Inc. | 13,161 | 1,568,923 | |||||||||
Lamb Weston Holdings, Inc. | 17,785 | 783,251 | |||||||||
Lancaster Colony Corp. | 2,411 | 295,637 | |||||||||
Post Holdings, Inc.1,2 | 15,686 | 1,218,018 | |||||||||
Snyder’s-Lance, Inc.1 | 15,558 | 538,618 | |||||||||
Tootsie Roll Industries, Inc.1 | 3,769 | 131,350 | |||||||||
TreeHouse Foods, Inc.1,2 | 21,130 | 1,726,110 | |||||||||
Total Food, Beverage & Tobacco | 10,205,982 | ||||||||||
Health Care Equipment & Services—8.1% | |||||||||||
ABIOMED, Inc.2 | 808 | 115,787 | |||||||||
Acadia Healthcare Co., Inc.1,2 | 16,230 | 801,438 | |||||||||
Allscripts Healthcare Solutions, Inc.1,2 | 33,645 | 429,310 | |||||||||
Globus Medical, Inc., Class A1,2 | 4,603 | 152,590 | |||||||||
Halyard Health, Inc.2 | 10,703 | 420,414 | |||||||||
HealthSouth Corp. | 20,318 | 983,391 | |||||||||
Hill-Rom Holdings, Inc. | 8,807 | 701,125 | |||||||||
LifePoint Health, Inc.1,2 | 25,986 | 1,744,960 | |||||||||
LivaNova PLC1,2 | 5,150 | 315,232 | |||||||||
Masimo Corp.2 | 2,025 | 184,640 | |||||||||
Medidata Solutions, Inc.2 | 2,696 | 210,827 | |||||||||
MEDNAX, Inc.1,2 | 15,106 | 911,949 | |||||||||
Molina Healthcare, Inc.1,2 | 69,652 | 4,818,525 | |||||||||
NuVasive, Inc.1,2 | 3,270 | 251,528 | |||||||||
Owens & Minor, Inc. | 78,002 | 2,510,884 | |||||||||
ResMed, Inc.1 | 6,907 | 537,848 | |||||||||
STERIS PLC | 8,384 | 683,296 | |||||||||
Teleflex, Inc. | 2,505 | 520,439 | |||||||||
Tenet Healthcare Corp.1,2 | 274,403 | 5,306,954 | |||||||||
VCA, Inc.2 | 7,385 | 681,709 | |||||||||
WellCare Health Plans, Inc.2 | 21,922 | 3,936,314 | |||||||||
West Pharmaceutical Services, Inc. | 4,131 | 390,462 | |||||||||
Total Health Care Equipment & Services | 26,609,622 | ||||||||||
Household & Personal Products—1.0% | |||||||||||
Avon Products, Inc.1,2 | 415,939 | 1,580,568 | |||||||||
Edgewell Personal Care Co.1,2 | 7,970 | 605,879 | |||||||||
Energizer Holdings, Inc. | 8,671 | 416,382 | |||||||||
Nu Skin Enterprises, Inc., Class A1 | 9,872 | 620,357 | |||||||||
Total Household & Personal Products | 3,223,186 | ||||||||||
Insurance—5.9% | |||||||||||
Alleghany Corp.2 | 2,663 | 1,583,952 | |||||||||
American Financial Group, Inc. | 16,685 | 1,657,988 | |||||||||
Aspen Insurance Holdings Ltd. | 14,218 | 708,767 | |||||||||
Brown & Brown, Inc. | 10,464 | 450,685 | |||||||||
CNO Financial Group, Inc. | 51,543 | 1,076,218 | |||||||||
First American Financial Corp. | 33,195 | 1,483,485 | |||||||||
Genworth Financial, Inc., Class A1,2 | 607,427 | 2,290,000 | |||||||||
Hanover Insurance Group, Inc. (The) | 14,585 | 1,292,669 | |||||||||
Kemper Corp.1 | 16,329 | 630,299 | |||||||||
Mercury General Corp. | 15,050 | 812,700 | |||||||||
Old Republic International Corp. | 74,936 | 1,463,500 | |||||||||
| | Shares | | Value | ||||||||
Insurance (continued) | |||||||||||
Primerica, Inc.1 | 5,403 | $ | 409,277 | ||||||||
Reinsurance Group of America, Inc. | 24,393 | 3,131,817 | |||||||||
RenaissanceRe Holdings Ltd. | 3,240 | 450,522 | |||||||||
W.R. Berkley Corp. | 28,334 | 1,959,863 | |||||||||
Total Insurance | 19,401,742 | ||||||||||
Materials—9.7% | |||||||||||
Allegheny Technologies, Inc.1 | 51,811 | 881,305 | |||||||||
AptarGroup, Inc.1 | 7,062 | 613,405 | |||||||||
Ashland Global Holdings, Inc.1 | 19,891 | 1,311,016 | |||||||||
Bemis Co., Inc. | 22,923 | 1,060,189 | |||||||||
Cabot Corp. | 12,206 | 652,166 | |||||||||
Carpenter Technology Corp. | 12,335 | 461,699 | |||||||||
Chemours Co. (The) | 38,787 | 1,470,803 | |||||||||
Commercial Metals Co. | 65,235 | 1,267,516 | |||||||||
Compass Minerals International, Inc.1 | 4,697 | 306,714 | |||||||||
Domtar Corp. | 35,909 | 1,379,624 | |||||||||
Eagle Materials, Inc. | 3,354 | 309,977 | |||||||||
Greif, Inc., Class A1 | 15,829 | 882,942 | |||||||||
Louisiana-Pacific Corp.2 | 25,191 | 607,355 | |||||||||
Minerals Technologies, Inc. | 5,846 | 427,927 | |||||||||
NewMarket Corp. | 1,160 | 534,157 | |||||||||
Olin Corp. | 51,302 | 1,553,424 | |||||||||
Owens-Illinois, Inc.2 | 76,403 | 1,827,560 | |||||||||
Packaging Corp. of America | 14,585 | 1,624,623 | |||||||||
PolyOne Corp. | 23,636 | 915,659 | |||||||||
Reliance Steel & Aluminum Co. | 32,053 | 2,333,779 | |||||||||
Royal Gold, Inc. | 1,464 | 114,441 | |||||||||
RPM International, Inc.1 | 22,865 | 1,247,286 | |||||||||
Scotts Miracle-Gro Co., (The)1 | 8,348 | 746,812 | |||||||||
Sensient Technologies Corp. | 4,382 | 352,882 | |||||||||
Silgan Holdings, Inc.1 | 29,733 | 944,915 | |||||||||
Sonoco Products Co. | 24,222 | 1,245,495 | |||||||||
Steel Dynamics, Inc. | 66,241 | 2,372,090 | |||||||||
United States Steel Corp.1 | 135,950 | 3,009,933 | |||||||||
Valvoline, Inc.1 | 21,987 | 521,532 | |||||||||
Worthington Industries, Inc. | 17,083 | 857,908 | |||||||||
Total Materials | 31,835,134 | ||||||||||
Media—1.8% | |||||||||||
AMC Networks, Inc., Class A1,2 | 12,892 | 688,562 | |||||||||
Cable One, Inc. | 300 | 213,270 | |||||||||
Cinemark Holdings, Inc.1 | 19,034 | 739,471 | |||||||||
John Wiley & Sons, Inc., Class A | 8,359 | 440,937 | |||||||||
Live Nation Entertainment, Inc.2 | 61,520 | 2,143,972 | |||||||||
Meredith Corp.1 | 7,514 | 446,707 | |||||||||
New York Times Co., (The), Class A | 23,121 | 409,242 | |||||||||
TEGNA, Inc.1 | 57,743 | 832,076 | |||||||||
Total Media | 5,914,237 | ||||||||||
Pharmaceuticals, Biotechnology & Life Sciences—1.5% | |||||||||||
Akorn, Inc.2 | 8,542 | 286,499 | |||||||||
Bio-Rad Laboratories, Inc., Class A2 | 2,469 | 558,759 | |||||||||
Bio-Techne Corp. | 1,268 | 148,990 | |||||||||
Bioverativ, Inc.2 | 4,402 | 264,868 | |||||||||
Catalent, Inc.2 | 13,949 | 489,610 | |||||||||
Charles River Laboratories International, Inc.2 | 4,831 | 488,656 | |||||||||
| | Shares | | Value | ||||||||
Endo International PLC2 | 98,091 | $ | 1,095,677 | ||||||||
INC Research Holdings, Inc., Class A2 | 6,869 | 401,837 | |||||||||
PAREXEL International Corp.2 | 7,606 | 661,037 | |||||||||
Prestige Brands Holdings, Inc.2 | 4,362 | 230,357 | |||||||||
United Therapeutics Corp.2 | 3,181 | 412,671 | |||||||||
Total Pharmaceuticals, Biotechnology & Life Sciences | 5,038,961 | ||||||||||
Real Estate—2.8% | |||||||||||
Alexander & Baldwin, Inc. | 2,389 | 98,857 | |||||||||
American Campus Communities, Inc. | 4,226 | 199,890 | |||||||||
Camden Property Trust | 2,631 | 224,977 | |||||||||
Care Capital Properties, Inc. | 3,452 | 92,168 | |||||||||
CoreCivic, Inc. | 16,545 | 456,311 | |||||||||
Corporate Office Properties Trust | 4,196 | 146,986 | |||||||||
Cousins Properties, Inc. | 9,875 | 86,801 | |||||||||
CyrusOne, Inc. | 2,526 | 140,824 | |||||||||
DCT Industrial Trust, Inc. | 1,920 | 102,605 | |||||||||
Douglas Emmett, Inc. | 5,200 | 198,692 | |||||||||
Duke Realty Corp. | 8,348 | 233,327 | |||||||||
Education Realty Trust, Inc.1 | 1,993 | 77,229 | |||||||||
EPR Properties | 1,729 | 124,263 | |||||||||
First Industrial Realty Trust, Inc. | 3,337 | 95,505 | |||||||||
GEO Group, Inc. (The) | 18,721 | 553,580 | |||||||||
Healthcare Realty Trust, Inc. | 3,040 | 103,816 | |||||||||
Highwoods Properties, Inc. | 3,343 | 169,523 | |||||||||
Hospitality Properties Trust | 17,774 | 518,112 | |||||||||
Jones Lang LaSalle, Inc. | 15,311 | 1,913,875 | |||||||||
Kilroy Realty Corp. | 2,300 | 172,845 | |||||||||
Lamar Advertising Co., Class A | 5,440 | 400,221 | |||||||||
LaSalle Hotel Properties | 10,309 | 307,208 | |||||||||
Liberty Property Trust | 4,670 | 190,116 | |||||||||
Life Storage, Inc.1 | 1,706 | 126,415 | |||||||||
Mack-Cali Realty Corp. | 5,802 | 157,466 | |||||||||
Medical Properties Trust, Inc. | 11,126 | 143,192 | |||||||||
National Retail Properties, Inc. | 3,597 | 140,643 | |||||||||
Omega Healthcare Investors, Inc.1 | 7,359 | 242,994 | |||||||||
Potlatch Corp. | 3,426 | 156,568 | |||||||||
Quality Care Properties, Inc.2 | 6,680 | 122,311 | |||||||||
Rayonier, Inc. | 7,570 | 217,789 | |||||||||
Senior Housing Properties Trust | 12,908 | 263,839 | |||||||||
Tanger Factory Outlet Centers, Inc.1 | 4,745 | 123,275 | |||||||||
Taubman Centers, Inc.1 | 3,031 | 180,496 | |||||||||
Uniti Group, Inc. | 7,787 | 195,765 | |||||||||
Urban Edge Properties | 3,831 | 90,910 | |||||||||
Washington Prime Group, Inc. | 26,276 | 219,930 | |||||||||
Weingarten Realty Investors | 4,752 | 143,035 | |||||||||
Total Real Estate | 9,132,359 | ||||||||||
Retailing—6.9% | |||||||||||
Aaron’s, Inc. | 21,299 | 828,531 | |||||||||
American Eagle Outfitters, Inc. | 81,864 | 986,461 | |||||||||
Big Lots, Inc.1 | 27,670 | 1,336,461 | |||||||||
Cabela’s, Inc.1,2 | 19,818 | 1,177,586 | |||||||||
Chico’s FAS, Inc.1 | 69,207 | 651,930 | |||||||||
Dick’s Sporting Goods, Inc.1 | 50,764 | 2,021,930 | |||||||||
Dillard’s, Inc., Class A | 29,837 | 1,721,297 | |||||||||
GameStop Corp., Class A1 | 105,395 | 2,277,586 | |||||||||
HSN, Inc. | 28,702 | 915,594 | |||||||||
| | Shares | | Value | ||||||||
Retailing (continued) | |||||||||||
Michaels Cos., Inc. (The)2 | 72,849 | $ | 1,349,163 | ||||||||
Murphy USA, Inc.1,2 | 37,614 | 2,787,574 | |||||||||
Office Depot, Inc. | 469,983 | 2,650,704 | |||||||||
Pool Corp. | 5,533 | 650,515 | |||||||||
Sally Beauty Holdings, Inc.1,2 | 52,396 | 1,061,019 | |||||||||
Urban Outfitters, Inc.1,2 | 50,795 | 941,739 | |||||||||
Williams-Sonoma, Inc.1 | 27,021 | 1,310,518 | |||||||||
Total Retailing | 22,668,608 | ||||||||||
Semiconductors & Semiconductor Equipment—1.3% | |||||||||||
Cirrus Logic, Inc.1,2 | 6,337 | 397,457 | |||||||||
Cree, Inc.1,2 | 16,004 | 394,499 | |||||||||
Cypress Semiconductor Corp.1 | 39,539 | 539,707 | |||||||||
First Solar, Inc.1,2 | 21,736 | 866,832 | |||||||||
Integrated Device Technology, Inc.2 | 7,737 | 199,537 | |||||||||
Microsemi Corp.2 | 9,498 | 444,506 | |||||||||
Monolithic Power Systems, Inc. | 1,089 | 104,980 | |||||||||
Silicon Laboratories, Inc.2 | 2,604 | 177,983 | |||||||||
Synaptics, Inc.1,2 | 7,916 | 409,336 | |||||||||
Teradyne, Inc. | 14,441 | 433,663 | |||||||||
Versum Materials, Inc. | 8,670 | 281,775 | |||||||||
Total Semiconductors & Semiconductor Equipment | 4,250,275 | ||||||||||
Software & Services—4.7% | |||||||||||
ACI Worldwide, Inc.2 | 11,590 | 259,268 | |||||||||
Acxiom Corp.2 | 8,576 | 222,804 | |||||||||
Blackbaud, Inc. | 27,258 | 2,337,373 | |||||||||
Broadridge Financial Solutions, Inc. | 12,919 | 976,160 | |||||||||
Cadence Design Systems, Inc.2 | 14,010 | 469,195 | |||||||||
Cars.com, Inc.1,2 | 8,780 | 233,811 | |||||||||
CDK Global, Inc. | 9,311 | 577,841 | |||||||||
CommVault Systems, Inc.2 | 2,993 | 168,955 | |||||||||
Convergys Corp. | 31,120 | 740,034 | |||||||||
CoreLogic, Inc.2 | 11,723 | 508,544 | |||||||||
DST Systems, Inc. | 6,809 | 420,115 | |||||||||
Fair Isaac Corp.1 | 1,776 | 247,592 | |||||||||
Fortinet, Inc.2 | 9,172 | 343,400 | |||||||||
j2 Global, Inc.1 | 2,759 | 234,763 | |||||||||
Jack Henry & Associates, Inc.1 | 3,513 | 364,895 | |||||||||
Leidos Holdings, Inc. | 39,187 | 2,025,576 | |||||||||
LogMeIn, Inc. | 1,058 | 110,561 | |||||||||
Manhattan Associates, Inc.2 | 3,310 | 159,079 | |||||||||
MAXIMUS, Inc. | 9,941 | 622,605 | |||||||||
NeuStar, Inc., Class A1,2 | 9,453 | 315,258 | |||||||||
PTC, Inc.2 | 5,204 | 286,844 | |||||||||
Sabre Corp.1 | 39,467 | 859,197 | |||||||||
Science Applications International Corp. | 15,724 | 1,091,560 | |||||||||
Take-Two Interactive Software, Inc.1,2 | 6,243 | 458,111 | |||||||||
Teradata Corp.1,2 | 20,774 | 612,625 | |||||||||
Tyler Technologies, Inc.1,2 | 1,190 | 209,047 | |||||||||
Ultimate Software Group, Inc. (The)1,2 | 1,025 | 215,312 | |||||||||
WebMD Health Corp.2 | 3,100 | 181,815 | |||||||||
WEX, Inc.1,2 | 2,700 | 281,529 | |||||||||
Total Software & Services | 15,533,869 | ||||||||||
| | Shares | | Value | ||||||||
Technology Hardware & Equipment—12.0% | |||||||||||
3D Systems Corp.1,2 | 7,909 | $ | 147,898 | ||||||||
ARRIS International PLC1,2 | 59,802 | 1,675,652 | |||||||||
Arrow Electronics, Inc.2 | 81,603 | 6,399,307 | |||||||||
Avnet, Inc. | 129,145 | 5,021,158 | |||||||||
Belden, Inc. | 7,947 | 599,442 | |||||||||
Brocade Communications Systems, Inc. | 48,307 | 609,151 | |||||||||
Ciena Corp.1,2 | 26,818 | 670,986 | |||||||||
Cognex Corp. | 1,619 | 137,453 | |||||||||
Coherent, Inc.2 | 1,369 | 308,011 | |||||||||
Diebold Nixdorf, Inc.1 | 38,407 | 1,075,396 | |||||||||
InterDigital, Inc. | 2,114 | 163,412 | |||||||||
IPG Photonics Corp.1,2 | 2,036 | 295,424 | |||||||||
Jabil, Inc. | 160,904 | 4,696,788 | |||||||||
Keysight Technologies, Inc.2 | 20,692 | 805,540 | |||||||||
Knowles Corp.1,2 | 12,851 | 217,439 | |||||||||
Littelfuse, Inc.1 | 1,784 | 294,360 | |||||||||
National Instruments Corp.1 | 8,283 | 333,142 | |||||||||
NCR Corp.2 | 43,434 | 1,773,845 | |||||||||
NetScout Systems, Inc.1,2 | 8,443 | 290,439 | |||||||||
Plantronics, Inc. | 4,192 | 219,284 | |||||||||
SYNNEX Corp. | 31,605 | 3,791,336 | |||||||||
Tech Data Corp.1,2 | 69,654 | 7,035,054 | |||||||||
Trimble, Inc.2 | 17,066 | 608,744 | |||||||||
VeriFone Systems, Inc.2 | 28,513 | 516,085 | |||||||||
ViaSat, Inc.1,2 | 5,962 | 394,685 | |||||||||
Vishay Intertechnology, Inc.1 | 36,619 | 607,875 | |||||||||
Zebra Technologies Corp., Class A2 | 8,921 | 896,739 | |||||||||
Total Technology Hardware & Equipment | 39,584,645 | ||||||||||
Telecommunication Services—1.1% | |||||||||||
Frontier Communications Corp.1 | 1,932,642 | 2,241,865 | |||||||||
Telephone & Data Systems, Inc.1 | 47,326 | 1,313,296 | |||||||||
Total Telecommunication Services | 3,555,161 | ||||||||||
Transportation—2.9% | |||||||||||
Avis Budget Group, Inc.1,2 | 97,741 | 2,665,397 | |||||||||
Genesee & Wyoming, Inc., Class A1,2 | 7,895 | 539,939 | |||||||||
JetBlue Airways Corp.2 | 74,413 | 1,698,849 | |||||||||
Kirby Corp.1,2 | 7,270 | 485,999 | |||||||||
Landstar System, Inc. | 9,530 | 815,768 | |||||||||
Old Dominion Freight Line, Inc. | 8,362 | 796,397 | |||||||||
Ryder System, Inc. | 26,765 | 1,926,545 | |||||||||
Werner Enterprises, Inc. | 17,824 | 523,134 | |||||||||
Total Transportation | 9,452,028 | ||||||||||
Utilities—3.2% | |||||||||||
Aqua America, Inc. | 6,173 | 205,561 | |||||||||
Atmos Energy Corp. | 9,389 | 778,818 | |||||||||
Black Hills Corp.1 | 6,124 | 413,186 | |||||||||
Great Plains Energy, Inc. | 23,287 | 681,843 | |||||||||
Hawaiian Electric Industries, Inc.1 | 18,737 | 606,704 | |||||||||
IDACORP, Inc.1 | 3,700 | 315,795 | |||||||||
MDU Resources Group, Inc. | 40,347 | 1,057,091 | |||||||||
National Fuel Gas Co. | 6,992 | 390,433 | |||||||||
New Jersey Resources Corp. | 13,057 | 518,363 | |||||||||
NorthWestern Corp. | 5,325 | 324,932 | |||||||||
OGE Energy Corp. | 16,436 | 571,808 | |||||||||
ONE Gas, Inc. | 5,295 | 369,644 | |||||||||
| | Shares | | Value | ||||||||
Utilities (continued) | |||||||||||
PNM Resources, Inc.1 | 9,107 | $ | 348,343 | ||||||||
Southwest Gas Holdings, Inc. | 8,018 | 585,795 | |||||||||
UGI Corp. | 30,434 | 1,473,310 | |||||||||
Vectren Corp. | 10,481 | 612,510 | |||||||||
Westar Energy, Inc. | 12,398 | 657,342 | |||||||||
WGL Holdings, Inc. | 7,257 | 605,452 | |||||||||
Total Utilities | 10,516,930 | ||||||||||
Total Common Stocks (Cost $289,437,218) | $ | 328,840,793 | |||||||||
| | Shares | | Value | ||||||||
INVESTMENT OF CASH COLLATERAL | |||||||||||
FOR SECURITIES LOANED—15.2% | |||||||||||
Dreyfus Government Cash Management Money Market Fund—Institutional Shares, 0.91%3 (Cost $49,958,289) | 49,958,289 | $ | 49,958,289 | ||||||||
Total Investments—115.0% (Cost $339,395,507) | 378,799,082 | ||||||||||
Liabilities in Excess of Other Assets—(15.0)% | (49,297,542 | ) | |||||||||
Net Assets—100.0% | $ | 329,501,540 | |||||||||
| 1 | All or a portion of the security was on loan. The aggregate value of the securities on loan was $99,887,453; total value of the collateral held by the fund was $102,589,175. The total value of the collateral includes non-cash U.S. Treasury securities collateral having a value of $52,630,886 (Note 4). |
| 2 | Non-income producing security. |
| 3 | Rate shown represents annualized 7-day yield as of June 30, 2017. |
The accompanying notes are an integral part of these financial statements.
| | Shares | | Value | ||||||||
COMMON STOCKS—99.8% | |||||||||||
Automobiles & Components—2.0% | |||||||||||
American Axle & Manufacturing Holdings, Inc.1,2 | 190,657 | $ | 2,974,249 | ||||||||
Cooper-Standard Holding, Inc.1,2 | 24,027 | 2,423,603 | |||||||||
Dorman Products, Inc.1,2 | 8,063 | 667,374 | |||||||||
Fox Factory Holding Corp.2 | 9,728 | 346,317 | |||||||||
Gentherm, Inc.1,2 | 18,062 | 700,806 | |||||||||
LCI Industries1 | 13,085 | 1,339,904 | |||||||||
Motorcar Parts of America, Inc.1,2 | 11,144 | 314,707 | |||||||||
Standard Motor Products, Inc. | 16,055 | 838,392 | |||||||||
Superior Industries International, Inc. | 27,316 | 561,344 | |||||||||
Winnebago Industries, Inc. | 29,222 | 1,022,770 | |||||||||
Total Automobiles & Components | 11,189,466 | ||||||||||
Banks—2.3% | |||||||||||
Ameris Bancorp | 5,469 | 263,606 | |||||||||
Astoria Financial Corp. | 18,082 | 364,352 | |||||||||
Banc of California, Inc.1 | 21,304 | 458,036 | |||||||||
Bank Mutual Corp. | 8,790 | 80,428 | |||||||||
Banner Corp. | 6,167 | 348,497 | |||||||||
BofI Holding, Inc.1,2 | 14,312 | 339,481 | |||||||||
Boston Private Financial Holdings, Inc. | 18,288 | 280,721 | |||||||||
Brookline Bancorp, Inc. | 13,780 | 201,188 | |||||||||
Central Pacific Financial Corp. | 4,757 | 149,703 | |||||||||
City Holding Co. | 2,188 | 144,124 | |||||||||
Columbia Banking System, Inc. | 7,887 | 314,297 | |||||||||
Community Bank System, Inc. | 5,700 | 317,889 | |||||||||
Customers Bancorp, Inc.2 | 8,912 | 252,031 | |||||||||
CVB Financial Corp. | 10,044 | 225,287 | |||||||||
Dime Community Bancshares, Inc. | 7,506 | 147,118 | |||||||||
Fidelity Southern Corp. | 9,636 | 220,279 | |||||||||
First BanCorp2 | 55,005 | 318,479 | |||||||||
First Commonwealth Financial Corp. | 16,155 | 204,845 | |||||||||
First Financial Bancorp1 | 10,200 | 282,540 | |||||||||
First Financial Bankshares, Inc.1 | 5,640 | 249,288 | |||||||||
First Midwest Bancorp, Inc. | 17,717 | 412,983 | |||||||||
Glacier Bancorp, Inc. | 9,244 | 338,423 | |||||||||
Great Western Bancorp, Inc. | 8,717 | 355,741 | |||||||||
Hanmi Financial Corp. | 5,446 | 154,939 | |||||||||
HomeStreet, Inc.1,2 | 15,102 | 417,948 | |||||||||
Hope Bancorp, Inc. | 20,284 | 378,297 | |||||||||
Independent Bank Corp. | 3,711 | 247,338 | |||||||||
LegacyTexas Financial Group, Inc. | 7,370 | 281,018 | |||||||||
LendingTree, Inc.1,2 | 1,884 | 324,425 | |||||||||
National Bank Holdings Corp., Class A | 4,440 | 147,008 | |||||||||
NBT Bancorp, Inc.1 | 7,823 | 289,060 | |||||||||
Northfield Bancorp, Inc. | 5,861 | 100,516 | |||||||||
Northwest Bancshares, Inc.1 | 19,625 | 306,346 | |||||||||
OFG Bancorp | 31,453 | 314,530 | |||||||||
Old National Bancorp1 | 28,457 | 490,883 | |||||||||
Opus Bank | 10,775 | 260,755 | |||||||||
Oritani Financial Corp. | 7,375 | 125,744 | |||||||||
Provident Financial Services, Inc. | 10,578 | 268,470 | |||||||||
S&T Bancorp, Inc.1 | 5,803 | 208,096 | |||||||||
ServisFirst Bancshares, Inc. | 4,740 | 174,859 | |||||||||
| | Shares | | Value | ||||||||
Simmons First National Corp., Class A1 | 6,085 | $ | 321,896 | ||||||||
Southside Bancshares, Inc.1 | 4,361 | 152,373 | |||||||||
Sterling Bancorp1 | 17,058 | 396,598 | |||||||||
Tompkins Financial Corp.1 | 2,414 | 190,030 | |||||||||
TrustCo Bank Corp. | 16,915 | 131,091 | |||||||||
United Community Banks, Inc. | 11,657 | 324,065 | |||||||||
Walker & Dunlop, Inc.2 | 10,101 | 493,232 | |||||||||
Westamerica Bancorporation1 | 2,358 | 132,142 | |||||||||
Total Banks | 12,900,995 | ||||||||||
Capital Goods—11.1% | |||||||||||
AAON, Inc.1 | 7,533 | 277,591 | |||||||||
AAR Corp. | 36,315 | 1,262,309 | |||||||||
Actuant Corp., Class A | 33,909 | 834,161 | |||||||||
Aegion Corp.2 | 44,166 | 966,352 | |||||||||
Aerojet Rocketdyne Holdings, Inc.1,2 | 63,744 | 1,325,875 | |||||||||
Aerovironment, Inc.2 | 5,266 | 201,161 | |||||||||
Alamo Group, Inc.1 | 6,767 | 614,511 | |||||||||
Albany International Corp., Class A1 | 11,280 | 602,352 | |||||||||
American Woodmark Corp.2 | 7,750 | 740,512 | |||||||||
Apogee Enterprises, Inc. | 14,646 | 832,479 | |||||||||
Applied Industrial Technologies, Inc. | 30,987 | 1,829,782 | |||||||||
Astec Industries, Inc. | 15,069 | 836,480 | |||||||||
Axon Enterprise, Inc.1,2 | 8,716 | 219,120 | |||||||||
AZZ, Inc.1 | 11,117 | 620,329 | |||||||||
Barnes Group, Inc. | 16,017 | 937,475 | |||||||||
Briggs & Stratton Corp. | 54,625 | 1,316,462 | |||||||||
Chart Industries, Inc.2 | 18,462 | 641,185 | |||||||||
CIRCOR International, Inc.1 | 6,539 | 388,286 | |||||||||
Comfort Systems USA, Inc. | 33,668 | 1,249,083 | |||||||||
Cubic Corp. | 22,962 | 1,063,141 | |||||||||
DXP Enterprises, Inc.2 | 18,938 | 653,361 | |||||||||
Encore Wire Corp. | 17,007 | 726,199 | |||||||||
Engility Holdings, Inc.2 | 51,461 | 1,461,492 | |||||||||
EnPro Industries, Inc. | 12,433 | 887,343 | |||||||||
ESCO Technologies, Inc. | 7,470 | 445,585 | |||||||||
Federal Signal Corp. | 30,494 | 529,376 | |||||||||
Franklin Electric Co., Inc.1 | 16,703 | 691,504 | |||||||||
General Cable Corp.1 | 163,406 | 2,671,688 | |||||||||
Gibraltar Industries, Inc.2 | 20,987 | 748,187 | |||||||||
Greenbrier Cos., Inc. (The)1 | 35,213 | 1,628,601 | |||||||||
Griffon Corp.1 | 61,002 | 1,338,994 | |||||||||
Harsco Corp.2 | 65,089 | 1,047,933 | |||||||||
Hillenbrand, Inc. | 30,924 | 1,116,356 | |||||||||
Insteel Industries, Inc. | 9,604 | 316,644 | |||||||||
John Bean Technologies Corp.1 | 11,730 | 1,149,540 | |||||||||
Kaman Corp. | 25,941 | 1,293,678 | |||||||||
Lindsay Corp.1 | 4,350 | 388,238 | |||||||||
Lydall, Inc.2 | 8,274 | 427,766 | |||||||||
Mercury Systems, Inc.2 | 7,278 | 306,331 | |||||||||
Moog, Inc., Class A2 | 25,595 | 1,835,673 | |||||||||
Mueller Industries, Inc. | 50,937 | 1,551,032 | |||||||||
MYR Group, Inc.2 | 28,186 | 874,330 | |||||||||
National Presto Industries, Inc.1 | 2,301 | 254,261 | |||||||||
Orion Group Holdings, Inc.2 | 58,697 | 438,467 | |||||||||
Patrick Industries, Inc.1,2 | 12,211 | 889,571 | |||||||||
PGT Innovations, Inc.2 | 27,977 | 358,106 | |||||||||
Powell Industries, Inc.1 | 10,676 | 341,525 | |||||||||
Proto Labs, Inc.1,2 | 3,413 | 229,524 | |||||||||
| | Shares | | Value | ||||||||
Capital Goods (continued) | |||||||||||
Quanex Building Products Corp.1 | 32,068 | $ | 678,238 | ||||||||
Raven Industries, Inc. | 5,752 | 191,542 | |||||||||
Simpson Manufacturing Co., Inc. | 14,913 | 651,847 | |||||||||
SPX Corp.2 | 43,085 | 1,084,019 | |||||||||
SPX FLOW, Inc.2 | 36,469 | 1,344,977 | |||||||||
Standex International Corp. | 5,967 | 541,207 | |||||||||
Tennant Co.1 | 8,190 | 604,422 | |||||||||
Titan International, Inc. | 79,138 | 950,447 | |||||||||
Trex Co., Inc.1,2 | 5,381 | 364,078 | |||||||||
Triumph Group, Inc. | 79,296 | 2,505,754 | |||||||||
Universal Forest Products, Inc. | 28,501 | 2,488,422 | |||||||||
Veritiv Corp.1,2 | 142,407 | 6,408,315 | |||||||||
Vicor Corp.1,2 | 7,655 | 137,025 | |||||||||
Wabash National Corp. | 61,167 | 1,344,451 | |||||||||
Watts Water Technologies, Inc., Class A | 16,293 | 1,029,718 | |||||||||
Total Capital Goods | 61,684,413 | ||||||||||
Commercial & Professional Services—7.7% | |||||||||||
ABM Industries, Inc. | 93,282 | 3,873,069 | |||||||||
Brady Corp., Class A | 23,190 | 786,141 | |||||||||
Brink’s Co. (The) | 34,063 | 2,282,221 | |||||||||
CDI Corp.2 | 72,576 | 424,570 | |||||||||
Essendant, Inc. | 248,856 | 3,690,534 | |||||||||
Exponent, Inc. | 3,904 | 227,603 | |||||||||
Healthcare Services Group, Inc.1 | 24,356 | 1,140,591 | |||||||||
Heidrick & Struggles International, Inc. | 20,783 | 452,030 | |||||||||
Insperity, Inc. | 29,311 | 2,081,081 | |||||||||
Interface, Inc. | 35,854 | 704,531 | |||||||||
Kelly Services, Inc., Class A | 171,844 | 3,857,898 | |||||||||
Korn/Ferry International | 36,245 | 1,251,540 | |||||||||
LSC Communications, Inc.1 | 126,563 | 2,708,448 | |||||||||
Matthews International Corp., Class A | 16,910 | 1,035,738 | |||||||||
Mobile Mini, Inc. | 12,828 | 382,916 | |||||||||
Multi-Color Corp. | 8,126 | 663,082 | |||||||||
Navigant Consulting, Inc.2 | 38,473 | 760,226 | |||||||||
On Assignment, Inc.1,2 | 33,665 | 1,822,960 | |||||||||
Resources Connection, Inc.1 | 32,408 | 443,990 | |||||||||
RR Donnelley & Sons Co.1 | 513,945 | 6,444,870 | |||||||||
Team, Inc.1,2 | 36,016 | 844,575 | |||||||||
Tetra Tech, Inc. | 43,590 | 1,994,243 | |||||||||
TrueBlue, Inc.2 | 74,226 | 1,966,989 | |||||||||
UniFirst Corp.1 | 7,916 | 1,113,781 | |||||||||
US Ecology, Inc.1 | 6,901 | 348,501 | |||||||||
Viad Corp. | 20,557 | 971,318 | |||||||||
WageWorks, Inc.2 | 4,172 | 280,358 | |||||||||
Total Commercial & Professional Services | 42,553,804 | ||||||||||
Consumer Durables & Apparel—4.8% | |||||||||||
Callaway Golf Co. | 54,249 | 693,302 | |||||||||
Cavco Industries, Inc.2 | 4,214 | 546,345 | |||||||||
Crocs, Inc.2 | 101,797 | 784,855 | |||||||||
Ethan Allen Interiors, Inc. | 19,271 | 622,453 | |||||||||
Fossil Group, Inc.1,2 | 237,391 | 2,456,997 | |||||||||
G-III Apparel Group Ltd.1,2 | 68,223 | 1,702,164 | |||||||||
Iconix Brand Group, Inc.1,2 | 6,970 | 48,163 | |||||||||
Installed Building Products, Inc.2 | 12,840 | 679,878 | |||||||||
iRobot Corp.1,2 | 5,204 | 437,864 | |||||||||
| | Shares | | Value | ||||||||
La-Z-Boy, Inc. | 40,636 | $ | 1,320,670 | ||||||||
LGI Homes, Inc.1,2 | 16,704 | 671,167 | |||||||||
M.D.C. Holdings, Inc. | 53,726 | 1,898,140 | |||||||||
M/I Homes, Inc.2 | 47,171 | 1,346,732 | |||||||||
Meritage Homes Corp.2 | 56,760 | 2,395,272 | |||||||||
Movado Group, Inc. | 18,327 | 462,757 | |||||||||
Nautilus, Inc.1,2 | 16,334 | 312,796 | |||||||||
Oxford Industries, Inc. | 12,153 | 759,441 | |||||||||
Perry Ellis International, Inc.2 | 33,501 | 651,929 | |||||||||
Steven Madden Ltd.2 | 27,278 | 1,089,756 | |||||||||
Sturm Ruger & Co., Inc.1 | 7,231 | 449,407 | |||||||||
TopBuild Corp.2 | 24,698 | 1,310,723 | |||||||||
Unifi, Inc.1,2 | 15,997 | 492,708 | |||||||||
Universal Electronics, Inc.2 | 7,287 | 487,136 | |||||||||
Vera Bradley, Inc.2 | 41,366 | 404,559 | |||||||||
Vista Outdoor, Inc.1,2 | 79,276 | 1,784,503 | |||||||||
William Lyon Homes, Class A1,2 | 45,703 | 1,103,270 | |||||||||
Wolverine World Wide, Inc. | 68,692 | 1,924,063 | |||||||||
Total Consumer Durables & Apparel | 26,837,050 | ||||||||||
Consumer Services—3.4% | |||||||||||
American Public Education, Inc.2 | 9,556 | 226,000 | |||||||||
Belmond Ltd., Class A2 | 30,706 | 408,390 | |||||||||
Biglari Holdings, Inc.1,2 | 1,508 | 602,808 | |||||||||
BJ’s Restaurants, Inc.2 | 18,829 | 701,380 | |||||||||
Bob Evans Farms, Inc. | 8,056 | 578,663 | |||||||||
Boyd Gaming Corp.1 | 65,699 | 1,629,992 | |||||||||
Capella Education Co. | 3,674 | 314,494 | |||||||||
Career Education Corp.2 | 50,295 | 482,832 | |||||||||
Chuy’s Holdings, Inc.1,2 | 10,231 | 239,405 | |||||||||
Dave & Buster’s Entertainment, Inc.1,2 | 10,939 | 727,553 | |||||||||
DineEquity, Inc.1 | 10,721 | 472,260 | |||||||||
El Pollo Loco Holdings, Inc.1,2 | 20,055 | 277,762 | |||||||||
Fiesta Restaurant Group, Inc.1,2 | 24,736 | 510,798 | |||||||||
ILG, Inc. | 42,159 | 1,158,951 | |||||||||
Marcus Corp. (The) | 12,967 | 391,603 | |||||||||
Marriott Vacations Worldwide Corp. | 11,079 | 1,304,552 | |||||||||
Monarch Casino & Resort, Inc.2 | 5,175 | 156,544 | |||||||||
Penn National Gaming, Inc.2 | 105,216 | 2,251,622 | |||||||||
Red Robin Gourmet Burgers, Inc.1,2 | 15,082 | 984,101 | |||||||||
Regis Corp.2 | 120,023 | 1,232,636 | |||||||||
Ruby Tuesday, Inc.2 | 294,623 | 592,192 | |||||||||
Ruth’s Hospitality Group, Inc. | 13,043 | 283,685 | |||||||||
Scientific Games Corp., Class A1,2 | 83,697 | 2,184,492 | |||||||||
Shake Shack, Inc., Class A1,2 | 5,709 | 199,130 | |||||||||
Sonic Corp.1 | 14,709 | 389,642 | |||||||||
Strayer Education, Inc. | 3,535 | 329,533 | |||||||||
Wingstop, Inc.1 | 2,326 | 71,873 | |||||||||
Total Consumer Services | 18,702,893 | ||||||||||
Diversified Financials—4.4% | |||||||||||
Apollo Commercial Real Estate Finance, Inc. | 10,946 | 203,048 | |||||||||
Capstead Mortgage Corp. | 14,109 | 147,157 | |||||||||
Donnelley Financial Solutions, Inc.2 | 32,432 | 744,639 | |||||||||
Encore Capital Group, Inc.1,2 | 19,033 | 764,175 | |||||||||
Enova International, Inc.2 | 38,271 | 568,324 | |||||||||
Evercore Partners, Inc., Class A1 | 16,525 | 1,165,012 | |||||||||
EZCORP, Inc., Class A2 | 60,736 | 467,667 | |||||||||
Financial Engines, Inc.1 | 8,546 | 312,784 | |||||||||
FirstCash, Inc. | 17,842 | 1,040,189 | |||||||||
| | Shares | | Value | ||||||||
Diversified Financials (continued) | |||||||||||
Green Dot Corp., Class A2 | 13,822 | $ | 532,562 | ||||||||
Greenhill & Co., Inc.1 | 11,692 | 235,009 | |||||||||
Interactive Brokers Group, Inc., Class A1 | 27,484 | 1,028,451 | |||||||||
INTL. FCStone, Inc.2 | �� | 365,333 | 13,794,974 | ||||||||
Investment Technology Group, Inc. | 15,577 | 330,855 | |||||||||
Piper Jaffray Cos. | 9,749 | 584,453 | |||||||||
PRA Group, Inc.1,2 | 16,364 | 620,196 | |||||||||
Virtus Investment Partners, Inc. | 2,196 | 243,646 | |||||||||
Waddell & Reed Financial, Inc., Class A | 47,676 | 900,123 | |||||||||
WisdomTree Investments, Inc.1 | 18,320 | 186,314 | |||||||||
World Acceptance Corp.1,2 | 5,455 | 408,634 | |||||||||
Total Diversified Financials | 24,278,212 | ||||||||||
Energy—2.4% | |||||||||||
Archrock, Inc. | 54,047 | 616,136 | |||||||||
Atwood Oceanics, Inc.1,2 | 57,340 | 467,321 | |||||||||
Bill Barrett Corp.1,2 | 15,831 | 48,601 | |||||||||
Bristow Group, Inc.1 | 115,474 | 883,376 | |||||||||
CARBO Ceramics, Inc.1,2 | 11,712 | 80,227 | |||||||||
Carrizo Oil & Gas, Inc.1,2 | 20,467 | 356,535 | |||||||||
Cloud Peak Energy, Inc.1,2 | 162,498 | 573,618 | |||||||||
Contango Oil & Gas Co.2 | 8,923 | 59,249 | |||||||||
Denbury Resources, Inc.2 | 514,285 | 786,856 | |||||||||
Era Group, Inc.2 | 19,930 | 188,538 | |||||||||
Exterran Corp.2 | 27,418 | 732,061 | |||||||||
Geospace Technologies Corp.1,2 | 3,406 | 47,105 | |||||||||
Green Plains, Inc.1 | 120,869 | 2,483,858 | |||||||||
Gulf Island Fabrication, Inc.1 | 15,816 | 183,466 | |||||||||
Helix Energy Solutions Group, Inc.2 | 40,128 | 226,322 | |||||||||
Matrix Service Co.2 | 83,770 | 783,250 | |||||||||
McDermott International, Inc.2 | 53,118 | 380,856 | |||||||||
Newpark Resources, Inc.1,2 | 22,505 | 165,412 | |||||||||
Noble Corp. PLC1 | 295,510 | 1,069,746 | |||||||||
Northern Oil and Gas, Inc.1,2 | 51,947 | 72,726 | |||||||||
PDC Energy, Inc.1,2 | 9,292 | 400,578 | |||||||||
Pioneer Energy Services Corp.2 | 77,503 | 158,881 | |||||||||
REX American Resources Corp.1,2 | 3,452 | 333,325 | |||||||||
SEACOR Holdings, Inc.1,2 | 17,457 | 598,775 | |||||||||
SRC Energy, Inc.1,2 | 15,226 | 102,471 | |||||||||
Tesco Corp.2 | 24,595 | 109,448 | |||||||||
TETRA Technologies, Inc.2 | 137,718 | 384,233 | |||||||||
U.S. Silica Holdings, Inc.1 | 14,803 | 525,358 | |||||||||
Unit Corp.1,2 | 26,076 | 488,403 | |||||||||
Total Energy | 13,306,731 | ||||||||||
Food & Staples Retailing—3.1% | |||||||||||
Andersons, Inc. (The) | 77,698 | 2,653,387 | |||||||||
SpartanNash Co. | 201,926 | 5,241,999 | |||||||||
SUPERVALU, Inc.2 | 2,809,610 | 9,243,617 | |||||||||
Total Food & Staples Retailing | 17,139,003 | ||||||||||
Food, Beverage & Tobacco—2.4% | |||||||||||
B&G Foods, Inc. | 27,154 | 966,682 | |||||||||
Calavo Growers, Inc.1 | 9,558 | 659,980 | |||||||||
Cal-Maine Foods, Inc.1,2 | 20,537 | 813,265 | |||||||||
Coca-Cola Bottling Co. Consolidated1 | 10,423 | 2,385,512 | |||||||||
Darling Ingredients, Inc.2 | 158,843 | 2,500,189 | |||||||||
| | Shares | | Value | ||||||||
J&J Snack Foods Corp.1 | 5,451 | $ | 719,914 | ||||||||
John B. Sanfilippo & Son, Inc.1 | 10,511 | 663,349 | |||||||||
Sanderson Farms, Inc.1 | 16,460 | 1,903,599 | |||||||||
Seneca Foods Corp., Class A2 | 29,294 | 909,579 | |||||||||
Universal Corp. | 22,773 | 1,473,413 | |||||||||
Total Food, Beverage & Tobacco | 12,995,482 | ||||||||||
Health Care Equipment & Services—9.6% | |||||||||||
Abaxis, Inc. | 3,245 | 172,050 | |||||||||
Aceto Corp. | 28,969 | 447,571 | |||||||||
Almost Family, Inc.2 | 8,040 | 495,666 | |||||||||
Amedisys, Inc.1,2 | 16,866 | 1,059,353 | |||||||||
AMN Healthcare Services, Inc.1,2 | 39,525 | 1,543,451 | |||||||||
Analogic Corp. | 5,617 | 408,075 | |||||||||
AngioDynamics, Inc.2 | 16,712 | 270,902 | |||||||||
Anika Therapeutics, Inc.1,2 | 1,683 | 83,039 | |||||||||
BioTelemetry, Inc.2 | 5,512 | 184,376 | |||||||||
Cantel Medical Corp. | 7,036 | 548,175 | |||||||||
Chemed Corp. | 5,687 | 1,163,162 | |||||||||
Community Health Systems, Inc.1,2 | 1,446,955 | 14,411,672 | |||||||||
Computer Programs & Systems, Inc.1 | 5,963 | 195,586 | |||||||||
CONMED Corp. | 11,123 | 566,606 | |||||||||
CorVel Corp.2 | 8,179 | 388,094 | |||||||||
Cross Country Healthcare, Inc.2 | 46,542 | 600,857 | |||||||||
CryoLife, Inc.1,2 | 7,289 | 145,416 | |||||||||
Diplomat Pharmacy, Inc.1,2 | 181,482 | 2,685,934 | |||||||||
Ensign Group, Inc. (The) | 61,122 | 1,330,626 | |||||||||
Haemonetics Corp.1,2 | 16,104 | 635,947 | |||||||||
HealthEquity, Inc.1,2 | 2,582 | 128,661 | |||||||||
HealthStream, Inc.1,2 | 5,827 | 153,367 | |||||||||
HMS Holdings Corp.2 | 18,800 | 347,800 | |||||||||
ICU Medical, Inc.1,2 | 2,344 | 404,340 | |||||||||
Inogen, Inc.2 | 1,708 | 162,977 | |||||||||
Integer Holdings Corp.2 | 24,564 | 1,062,393 | |||||||||
Integra LifeSciences Holdings Corp.1,2 | 14,201 | 774,097 | |||||||||
Invacare Corp. | 63,444 | 837,461 | |||||||||
Kindred Healthcare, Inc.1 | 467,525 | 5,446,666 | |||||||||
Landauer, Inc. | 2,110 | 110,353 | |||||||||
Lantheus Holdings, Inc.2 | 15,448 | 272,657 | |||||||||
LeMaitre Vascular, Inc.1 | 2,521 | 78,706 | |||||||||
LHC Group, Inc.2 | 10,492 | 712,302 | |||||||||
Magellan Health, Inc.2 | 51,492 | 3,753,767 | |||||||||
Meridian Bioscience, Inc.1 | 9,658 | 152,113 | |||||||||
Merit Medical Systems, Inc.2 | 13,359 | 509,646 | |||||||||
Natus Medical, Inc.1,2 | 8,945 | 333,648 | |||||||||
Neogen Corp.2 | 3,836 | 265,106 | |||||||||
Omnicell, Inc.2 | 11,562 | 498,322 | |||||||||
OraSure Technologies, Inc.2 | 5,744 | 99,141 | |||||||||
Orthofix International NV2 | 6,825 | 317,226 | |||||||||
PharMerica Corp.2 | 61,778 | 1,621,672 | |||||||||
Providence Service Corp. (The)2 | 24,383 | 1,234,024 | |||||||||
Quality Systems, Inc.2 | 22,402 | 385,538 | |||||||||
Quorum Health Corp.1,2 | 374,561 | 1,554,428 | |||||||||
Select Medical Holdings Corp.2 | 223,340 | 3,428,269 | |||||||||
Surmodics, Inc.2 | 2,167 | 61,001 | |||||||||
Tivity Health, Inc.1,2 | 10,028 | 399,616 | |||||||||
US Physical Therapy, Inc. | 4,259 | 257,244 | |||||||||
Varex Imaging Corp.1,2 | 13,745 | 464,581 | |||||||||
Total Health Care Equipment & Services | 53,163,680 | ||||||||||
| | Shares | | Value | ||||||||
Household & Personal Products—0.4% | |||||||||||
Central Garden & Pet Co.1,2 | 22,726 | $ | 722,460 | ||||||||
Central Garden & Pet Co., Class A2 | 23,936 | 718,559 | |||||||||
Inter Parfums, Inc. | 11,239 | 411,909 | |||||||||
Medifast, Inc. | 4,723 | 195,863 | |||||||||
WD-40 Co.1 | 2,512 | 277,199 | |||||||||
Total Household & Personal Products | 2,325,990 | ||||||||||
Insurance—2.7% | |||||||||||
American Equity Investment Life Holding Co. | 80,733 | 2,121,663 | |||||||||
AMERISAFE, Inc. | 5,085 | 289,591 | |||||||||
eHealth, Inc.1,2 | 7,834 | 147,279 | |||||||||
Employers Holdings, Inc. | 13,796 | 583,571 | |||||||||
HCI Group, Inc.1 | 4,123 | 193,699 | |||||||||
Horace Mann Educators Corp. | 21,454 | 810,961 | |||||||||
Infinity Property & Casualty Corp. | 12,039 | 1,131,666 | |||||||||
Maiden Holdings Ltd. | 185,267 | 2,056,464 | |||||||||
Navigators Group, Inc. (The) | 16,495 | 905,575 | |||||||||
ProAssurance Corp. | 10,922 | 664,058 | |||||||||
RLI Corp. | 10,499 | 573,455 | |||||||||
Safety Insurance Group, Inc. | 8,763 | 598,513 | |||||||||
Selective Insurance Group, Inc. | 32,842 | 1,643,742 | |||||||||
Stewart Information Services Corp. | 32,776 | 1,487,375 | |||||||||
United Fire Group, Inc. | 18,787 | 827,755 | |||||||||
United Insurance Holdings Corp.1 | 22,592 | 355,372 | |||||||||
Universal Insurance Holdings, Inc. | 20,200 | 509,040 | |||||||||
Total Insurance | 14,899,779 | ||||||||||
Materials—6.3% | |||||||||||
A. Schulman, Inc. | 61,299 | 1,961,568 | |||||||||
AdvanSix, Inc.2 | 31,910 | 996,868 | |||||||||
AK Steel Holding Corp.1,2 | 687,742 | 4,518,465 | |||||||||
American Vanguard Corp. | 12,792 | 220,662 | |||||||||
Balchem Corp. | 5,017 | 389,871 | |||||||||
Boise Cascade Co.2 | 98,426 | 2,992,150 | |||||||||
Calgon Carbon Corp. | 26,320 | 397,432 | |||||||||
Century Aluminum Co.1,2 | 65,883 | 1,026,457 | |||||||||
Clearwater Paper Corp.2 | 28,155 | 1,316,246 | |||||||||
Deltic Timber Corp.1 | 2,258 | 168,582 | |||||||||
Flotek Industries, Inc.1,2 | 23,286 | 208,177 | |||||||||
FutureFuel Corp. | 12,954 | 195,476 | |||||||||
H.B. Fuller Co.1 | �� | 30,255 | 1,546,333 | ||||||||
Hawkins, Inc. | 7,453 | 345,447 | |||||||||
Haynes International, Inc. | 8,224 | 298,613 | |||||||||
Ingevity Corp.2 | 11,954 | 686,160 | |||||||||
Innophos Holdings, Inc. | 11,676 | 511,876 | |||||||||
Innospec, Inc. | 10,628 | 696,665 | |||||||||
Kaiser Aluminum Corp.1 | 11,601 | 1,026,920 | |||||||||
KapStone Paper and Packaging Corp. | 107,460 | 2,216,900 | |||||||||
Koppers Holdings, Inc.2 | 30,125 | 1,089,019 | |||||||||
Kraton Corp.2 | 41,852 | 1,441,383 | |||||||||
LSB Industries, Inc.1,2 | 28,377 | 293,134 | |||||||||
Materion Corp. | 19,696 | 736,630 | |||||||||
Myers Industries, Inc. | 21,962 | 394,218 | |||||||||
Neenah Paper, Inc.1 | 8,659 | 694,885 | |||||||||
Olympic Steel, Inc. | 48,985 | 954,228 | |||||||||
PH Glatfelter Co. | 61,077 | 1,193,445 | |||||||||
Quaker Chemical Corp. | 3,881 | 563,638 | |||||||||
Rayonier Advanced Materials, Inc.1 | 38,351 | 602,878 | |||||||||
| | Shares | | Value | ||||||||
Schweitzer-Mauduit International, Inc. | 16,767 | $ | 624,235 | ||||||||
Stepan Co. | 14,967 | 1,304,224 | |||||||||
SunCoke Energy, Inc.1,2 | 95,344 | 1,039,250 | |||||||||
TimkenSteel Corp.1,2 | 53,675 | 824,985 | |||||||||
Tredegar Corp. | 37,800 | 576,450 | |||||||||
U.S. Concrete, Inc.1,2 | 12,984 | 1,019,893 | |||||||||
Total Materials | 35,073,363 | ||||||||||
Media—1.4% | |||||||||||
E.W. Scripps Co., (The), Class A1,2 | 38,046 | 677,599 | |||||||||
Gannett Co., Inc.1 | 236,794 | 2,064,844 | |||||||||
New Media Investment Group, Inc.1 | 69,661 | 939,030 | |||||||||
Scholastic Corp. | 28,394 | 1,237,694 | |||||||||
Time, Inc. | 166,462 | 2,388,730 | |||||||||
World Wrestling Entertainment, Inc., Class A1 | 26,426 | 538,298 | |||||||||
Total Media | 7,846,195 | ||||||||||
Pharmaceuticals, Biotechnology & Life Sciences—1.3% | |||||||||||
Acorda Therapeutics, Inc.1,2 | 22,465 | 442,560 | |||||||||
Albany Molecular Research, Inc.1,2 | 21,549 | 467,613 | |||||||||
AMAG Pharmaceuticals, Inc.1,2 | 25,662 | 472,181 | |||||||||
Amphastar Pharmaceuticals, Inc.1,2 | 11,579 | 206,801 | |||||||||
ANI Pharmaceuticals, Inc.2 | 2,366 | 110,729 | |||||||||
Cambrex Corp.1,2 | 6,441 | 384,850 | |||||||||
Cytokinetics, Inc.1,2 | 5,460 | 66,066 | |||||||||
Depomed, Inc.1,2 | 33,901 | 364,097 | |||||||||
Eagle Pharmaceuticals, Inc.1,2 | 2,386 | 188,232 | |||||||||
Emergent BioSolutions, Inc.1,2 | 11,779 | 399,426 | |||||||||
Enanta Pharmaceuticals, Inc.1,2 | 1,053 | 37,887 | |||||||||
Heska Corp.2 | 954 | 97,375 | |||||||||
Impax Laboratories, Inc.1,2 | 41,705 | 671,450 | |||||||||
Innoviva, Inc.1,2 | 9,303 | 119,078 | |||||||||
Lannett Co., Inc.1,2 | 26,702 | 544,721 | |||||||||
Ligand Pharmaceuticals, Inc.1,2 | 683 | 82,916 | |||||||||
Luminex Corp.1 | 10,325 | 218,064 | |||||||||
Medicines Co. (The)1,2 | 2,789 | 106,010 | |||||||||
MiMedx Group, Inc.1,2 | 13,163 | 197,050 | |||||||||
Momenta Pharmaceuticals, Inc.2 | 5,287 | 89,350 | |||||||||
Myriad Genetics, Inc.1,2 | 24,066 | 621,865 | |||||||||
Nektar Therapeutics1,2 | 5,361 | 104,808 | |||||||||
Phibro Animal Health Corp., Class A | 16,056 | 594,875 | |||||||||
Progenics Pharmaceuticals, Inc.1,2 | 7,582 | 51,482 | |||||||||
Repligen Corp.1,2 | 2,106 | 87,273 | |||||||||
SciClone Pharmaceuticals, Inc.2 | 11,389 | 125,279 | |||||||||
Spectrum Pharmaceuticals, Inc.1,2 | 15,077 | 112,324 | |||||||||
Sucampo Pharmaceuticals, Inc., Class A1,2 | 18,467 | 193,903 | |||||||||
Supernus Pharmaceuticals, Inc.1,2 | 4,294 | 185,071 | |||||||||
Total Pharmaceuticals, Biotechnology & Life Sciences | 7,343,336 | ||||||||||
Real Estate—1.5% | |||||||||||
Acadia Realty Trust | 7,369 | 204,858 | |||||||||
Agree Realty Corp. | 1,510 | 69,264 | |||||||||
American Assets Trust, Inc. | 5,360 | 211,130 | |||||||||
Armada Hoffler Properties, Inc.1 | 15,383 | 199,210 | |||||||||
CareTrust REIT, Inc. | 4,348 | 80,612 | |||||||||
CBL & Associates Properties, Inc. | 95,592 | 805,841 | |||||||||
Cedar Realty Trust, Inc. | 20,996 | 101,831 | |||||||||
Chatham Lodging Trust | 10,842 | 217,816 | |||||||||
| | Shares | | Value | ||||||||
Real Estate (continued) | |||||||||||
Chesapeake Lodging Trust | 18,279 | $ | 447,287 | ||||||||
CoreSite Realty Corp. | 2,902 | 300,444 | |||||||||
DiamondRock Hospitality Co. | 56,798 | 621,938 | |||||||||
EastGroup Properties, Inc.1 | 2,216 | 185,701 | |||||||||
Forestar Group, Inc.2 | 8,155 | 139,858 | |||||||||
Four Corners Property Trust, Inc. | 3,603 | 90,471 | |||||||||
Franklin Street Properties Corp. | 16,806 | 186,210 | |||||||||
Getty Realty Corp. | 3,266 | 81,977 | |||||||||
Government Properties Income Trust1 | 9,528 | 174,458 | |||||||||
Hersha Hospitality Trust | 17,852 | 330,440 | |||||||||
HFF, Inc., Class A | 11,954 | 415,641 | |||||||||
Independence Realty Trust, Inc. | 11,242 | 110,959 | |||||||||
Kite Realty Group Trust | 13,575 | 256,975 | |||||||||
Lexington Realty Trust | 30,048 | 297,776 | |||||||||
LTC Properties, Inc. | 2,462 | 126,522 | |||||||||
National Storage Affiliates Trust | 23,719 | 548,146 | |||||||||
Parkway, Inc. | 7,076 | 161,970 | |||||||||
Pennsylvania Real Estate Investment Trust1 | 26,020 | 294,546 | |||||||||
PS Business Parks, Inc. | 2,173 | 287,683 | |||||||||
Ramco-Gershenson Properties Trust | 11,974 | 154,465 | |||||||||
RE/MAX Holdings, Inc., Class A1 | 2,476 | 138,780 | |||||||||
Retail Opportunity Investments Corp.1 | 8,808 | 169,025 | |||||||||
Sabra Health Care REIT, Inc.1 | 8,203 | 197,692 | |||||||||
Saul Centers, Inc. | 2,703 | 156,720 | |||||||||
Summit Hotel Properties, Inc. | 18,459 | 344,260 | |||||||||
Universal Health Realty Income Trust | 704 | 55,996 | |||||||||
Urstadt Biddle Properties, Inc., Class A | 4,324 | 85,615 | |||||||||
Total Real Estate | 8,252,117 | ||||||||||
Retailing—17.1% | |||||||||||
Abercrombie & Fitch Co., Class A1 | 195,773 | 2,435,416 | |||||||||
Asbury Automotive Group, Inc.1,2 | 83,527 | 4,723,452 | |||||||||
Ascena Retail Group, Inc.1,2 | 2,293,249 | 4,930,485 | |||||||||
Barnes & Noble Education, Inc.1,2 | 133,012 | 1,413,918 | |||||||||
Barnes & Noble, Inc. | 404,604 | 3,074,990 | |||||||||
Big 5 Sporting Goods Corp.1 | 53,849 | 702,729 | |||||||||
Buckle, Inc. (The) | 41,077 | 731,171 | |||||||||
Caleres, Inc. | 70,008 | 1,944,822 | |||||||||
Cato Corp., (The), Class A1 | 39,505 | 694,893 | |||||||||
Children’s Place, Inc. (The)1 | 12,231 | 1,248,785 | |||||||||
Core-Mark Holding Co., Inc. | 312,398 | 10,327,878 | |||||||||
DSW, Inc., Class A1 | 115,843 | 2,050,421 | |||||||||
Express, Inc.2 | 208,808 | 1,409,454 | |||||||||
Finish Line, Inc., (The), Class A1 | 97,494 | 1,381,490 | |||||||||
Five Below, Inc.1,2 | 15,291 | 754,917 | |||||||||
Francesca’s Holdings Corp.2 | 32,078 | 350,933 | |||||||||
Fred’s, Inc., Class A1 | 144,435 | 1,333,135 | |||||||||
FTD Cos., Inc.1,2 | 42,457 | 849,140 | |||||||||
Genesco, Inc.2 | 60,984 | 2,067,358 | |||||||||
Group 1 Automotive, Inc.1 | 129,319 | 8,188,479 | |||||||||
Guess?, Inc.1 | 134,017 | 1,712,737 | |||||||||
Haverty Furniture Cos., Inc. | 24,075 | 604,282 | |||||||||
Hibbett Sports, Inc.1,2 | 31,946 | 662,880 | |||||||||
JC Penney Co., Inc.1,2 | 1,811,782 | 8,424,786 | |||||||||
Kirkland’s, Inc.2 | 46,635 | 479,408 | |||||||||
Lithia Motors, Inc., Class A1 | 97,438 | 9,181,583 | |||||||||
Lumber Liquidators Holdings, Inc.1,2 | 28,874 | 723,582 | |||||||||
MarineMax, Inc.2 | 41,205 | 805,558 | |||||||||
| | Shares | | Value | ||||||||
Monro Muffler Brake, Inc.1 | 15,787 | $ | 659,107 | ||||||||
Nutrisystem, Inc. | 8,357 | 434,982 | |||||||||
Ollie’s Bargain Outlet Holdings, Inc.1,2 | 15,988 | 681,089 | |||||||||
PetMed Express, Inc.1 | 4,731 | 192,079 | |||||||||
Rent-A-Center, Inc. | 173,652 | 2,035,201 | |||||||||
RH1,2 | 29,920 | 1,930,438 | |||||||||
Select Comfort Corp.2 | 30,946 | 1,098,274 | |||||||||
Shoe Carnival, Inc. | 36,837 | 769,157 | |||||||||
Shutterfly, Inc.1,2 | 17,383 | 825,693 | |||||||||
Sonic Automotive, Inc., Class A | 400,585 | 7,791,378 | |||||||||
Stein Mart, Inc.1 | 570,170 | 963,587 | |||||||||
Tailored Brands, Inc.1 | 221,389 | 2,470,701 | |||||||||
Tile Shop Holdings, Inc.1 | 12,004 | 247,883 | |||||||||
Vitamin Shoppe, Inc.2 | 81,331 | 947,506 | |||||||||
Zumiez, Inc.1,2 | 47,597 | 587,823 | |||||||||
Total Retailing | 94,843,580 | ||||||||||
Semiconductors & Semiconductor Equipment—1.0% | |||||||||||
Advanced Energy Industries, Inc.2 | 5,426 | 351,008 | |||||||||
Brooks Automation, Inc. | 18,740 | 406,471 | |||||||||
Cabot Microelectronics Corp. | 4,616 | 340,799 | |||||||||
CEVA, Inc.1,2 | 1,265 | 57,494 | |||||||||
Cohu, Inc. | 12,694 | 199,803 | |||||||||
Diodes, Inc.2 | 27,226 | 654,241 | |||||||||
DSP Group, Inc.2 | 8,351 | 96,872 | |||||||||
Kopin Corp.1,2 | 4,120 | 15,285 | |||||||||
Kulicke & Soffa Industries, Inc.2 | 25,742 | 489,613 | |||||||||
MaxLinear, Inc.1,2 | 9,884 | 275,665 | |||||||||
MKS Instruments, Inc. | 15,632 | 1,052,034 | |||||||||
Nanometrics, Inc.2 | 6,834 | 172,832 | |||||||||
Power Integrations, Inc. | 4,710 | 343,359 | |||||||||
Rambus, Inc.2 | 22,494 | 257,106 | |||||||||
Rudolph Technologies, Inc.2 | 7,671 | 175,282 | |||||||||
Semtech Corp.2 | 11,251 | 402,223 | |||||||||
Veeco Instruments, Inc.1,2 | 8,841 | 246,222 | |||||||||
Xperi Corp. | 6,456 | 192,389 | |||||||||
Total Semiconductors & Semiconductor Equipment | 5,728,698 | ||||||||||
Software & Services—2.8% | |||||||||||
8x8, Inc.2 | 12,635 | 183,839 | |||||||||
Agilysys, Inc.1,2 | 9,588 | 97,031 | |||||||||
Blucora, Inc.2 | 16,540 | 350,648 | |||||||||
Bottomline Technologies (de), Inc.1,2 | 9,998 | 256,849 | |||||||||
CACI International, Inc., Class A2 | 25,302 | 3,164,015 | |||||||||
Cardtronics PLC, Class A2 | 29,232 | 960,564 | |||||||||
CSG Systems International, Inc. | 13,700 | 555,946 | |||||||||
DHI Group, Inc.2 | 61,895 | 176,401 | |||||||||
Ebix, Inc.1 | 4,094 | 220,667 | |||||||||
ExlService Holdings, Inc.2 | 9,856 | 547,796 | |||||||||
Forrester Research, Inc. | 6,111 | 239,246 | |||||||||
Gigamon, Inc.1,2 | 5,660 | 222,721 | |||||||||
Liquidity Services, Inc.2 | 34,657 | 220,072 | |||||||||
LivePerson, Inc.2 | 14,296 | 157,256 | |||||||||
ManTech International Corp., Class A | 29,568 | 1,223,524 | |||||||||
MicroStrategy, Inc., Class A2 | 2,144 | 410,940 | |||||||||
Monotype Imaging Holdings, Inc. | 8,007 | 146,528 | |||||||||
NIC, Inc. | 11,860 | 224,747 | |||||||||
Perficient, Inc.2 | 19,920 | 371,309 | |||||||||
Progress Software Corp. | 10,309 | 318,445 | |||||||||
| | Shares | | Value | ||||||||
Software & Services (continued) | |||||||||||
Qualys, Inc.2 | 3,722 | $ | 151,858 | ||||||||
QuinStreet, Inc.2 | 25,782 | 107,511 | |||||||||
Shutterstock, Inc.1,2 | 8,581 | 378,250 | |||||||||
SPS Commerce, Inc.2 | 2,432 | 155,064 | |||||||||
Stamps.com, Inc.1,2 | 1,984 | 307,272 | |||||||||
Sykes Enterprises, Inc.2 | 33,067 | 1,108,736 | |||||||||
Synchronoss Technologies, Inc.1,2 | 44,850 | 737,782 | |||||||||
TeleTech Holdings, Inc.1 | 22,354 | 912,043 | |||||||||
TiVo Corp. | 28,788 | 536,896 | |||||||||
VASCO Data Security International, Inc.2 | 10,051 | 144,232 | |||||||||
Virtusa Corp.1,2 | 21,153 | 621,898 | |||||||||
XO Group, Inc.2 | 6,719 | 118,389 | |||||||||
Total Software & Services | 15,328,475 | ||||||||||
Technology Hardware & Equipment—7.0% | |||||||||||
ADTRAN, Inc. | 24,231 | 500,370 | |||||||||
Anixter International, Inc.2 | 72,572 | 5,675,130 | |||||||||
Applied Optoelectronics, Inc.1,2 | 3,632 | 224,421 | |||||||||
Badger Meter, Inc. | 7,257 | 289,191 | |||||||||
Bel Fuse, Inc., Class B | 14,021 | 346,319 | |||||||||
Benchmark Electronics, Inc.2 | 51,018 | 1,647,881 | |||||||||
Black Box Corp. | 79,013 | 675,561 | |||||||||
CalAmp Corp.1,2 | 13,130 | 266,933 | |||||||||
Comtech Telecommunications Corp. | 20,954 | 397,497 | |||||||||
Cray, Inc.1,2 | 24,669 | 453,910 | |||||||||
CTS Corp.1 | 13,602 | 293,803 | |||||||||
Daktronics, Inc. | 43,996 | 423,682 | |||||||||
Digi International, Inc.2 | 14,816 | 150,382 | |||||||||
Electro Scientific Industries, Inc.2 | 14,399 | 118,648 | |||||||||
Electronics For Imaging, Inc.1,2 | 14,690 | 696,012 | |||||||||
ePlus, Inc.2 | 13,029 | 965,449 | |||||||||
Fabrinet1,2 | 26,087 | 1,112,871 | |||||||||
FARO Technologies, Inc.1,2 | 6,715 | 253,827 | |||||||||
Harmonic, Inc.1,2 | 28,332 | 148,743 | |||||||||
II-VI, Inc.2 | 21,471 | 736,455 | |||||||||
Insight Enterprises, Inc.2 | 101,118 | 4,043,709 | |||||||||
Itron, Inc.2 | 21,316 | 1,444,159 | |||||||||
Lumentum Holdings, Inc.1,2 | 12,317 | 702,685 | |||||||||
Methode Electronics, Inc. | 14,390 | 592,868 | |||||||||
MTS Systems Corp.1 | 10,475 | 542,605 | |||||||||
NETGEAR, Inc.1,2 | 22,618 | 974,836 | |||||||||
Oclaro, Inc.1,2 | 44,628 | 416,826 | |||||||||
OSI Systems, Inc.1,2 | 9,128 | 685,969 | |||||||||
Park Electrochemical Corp. | 4,581 | 84,382 | |||||||||
Plexus Corp.2 | 36,084 | 1,896,936 | |||||||||
Rogers Corp.2 | 4,823 | 523,874 | |||||||||
Sanmina Corp.2 | 129,835 | 4,946,714 | |||||||||
ScanSource, Inc.2 | 66,763 | 2,690,549 | |||||||||
Super Micro Computer, Inc.1,2 | 69,832 | 1,721,359 | |||||||||
TTM Technologies, Inc.1,2 | 104,891 | 1,820,908 | |||||||||
Viavi Solutions, Inc.2 | 56,302 | �� | 592,860 | ||||||||
Total Technology Hardware & Equipment | 39,058,324 | ||||||||||
Telecommunication Services—0.6% | |||||||||||
ATN International, Inc. | 5,252 | 359,447 | |||||||||
Cincinnati Bell, Inc.2 | 46,532 | 909,701 | |||||||||
Cogent Communications Holdings, Inc. | 8,278 | 331,948 | |||||||||
| | Shares | | Value | ||||||||
Consolidated Communications Holdings, Inc. | 25,407 | $ | 545,488 | ||||||||
General Communication, Inc., Class A2 | 18,782 | 688,172 | |||||||||
Iridium Communications, Inc.1,2 | 28,369 | 313,477 | |||||||||
Lumos Networks Corp.2 | 8,733 | 156,059 | |||||||||
Spok Holdings, Inc. | 7,241 | 128,166 | |||||||||
Total Telecommunication Services | 3,432,458 | ||||||||||
Transportation—3.4% | |||||||||||
Allegiant Travel Co. | 7,168 | 971,981 | |||||||||
ArcBest Corp. | 99,011 | 2,039,627 | |||||||||
Atlas Air Worldwide Holdings, Inc.1,2 | 26,512 | 1,382,601 | |||||||||
Echo Global Logistics, Inc.2 | 63,728 | 1,268,187 | |||||||||
Forward Air Corp. | 13,773 | 733,825 | |||||||||
Hawaiian Holdings, Inc.2 | 39,318 | 1,845,980 | |||||||||
Heartland Express, Inc.1 | 20,523 | 427,289 | |||||||||
Hub Group, Inc., Class A2 | 73,469 | 2,817,536 | |||||||||
Knight Transportation, Inc.1 | 22,987 | 851,668 | |||||||||
Marten Transport Ltd. | 18,460 | 505,804 | |||||||||
Matson, Inc. | 48,417 | 1,454,447 | |||||||||
Roadrunner Transportation Systems, Inc.2 | 206,784 | 1,503,320 | |||||||||
Saia, Inc.2 | 18,163 | 931,762 | |||||||||
SkyWest, Inc. | 62,214 | 2,183,711 | |||||||||
Total Transportation | 18,917,738 | ||||||||||
Utilities—1.1% | |||||||||||
ALLETE, Inc.1 | 13,766 | 986,747 | |||||||||
American States Water Co.1 | 6,538 | 309,966 | |||||||||
Avista Corp. | 24,582 | 1,043,752 | |||||||||
California Water Service Group1 | 12,062 | 443,882 | |||||||||
El Paso Electric Co. | 12,464 | 644,389 | |||||||||
Northwest Natural Gas Co.1 | 8,710 | 521,293 | |||||||||
South Jersey Industries, Inc. | 22,599 | 772,208 | |||||||||
Spire, Inc. | 17,183 | 1,198,514 | |||||||||
Total Utilities | 5,920,751 | ||||||||||
Total Common Stocks (Cost $498,883,102) | 553,722,533 | ||||||||||
INVESTMENT OF CASH COLLATERAL | |||||||||||
FOR SECURITIES LOANED—12.1% | |||||||||||
Dreyfus Government Cash Management Money Market Fund—Institutional Shares, 0.91%3 (Cost $67,073,312) | 67,073,312 | 67,073,312 | |||||||||
Total Investments—111.9% (Cost $565,956,414) | 620,795,845 | ||||||||||
Liabilities in Excess of Other Assets—(11.9)% | (66,044,514 | ) | |||||||||
Net Assets—100.0% | $ | 554,751,331 | |||||||||
| 1 | All or a portion of the security was on loan. The aggregate value of the securities on loan was $131,465,633; total value of the collateral held by the fund was $134,916,392. The total value of the collateral includes non-cash U.S. Treasury securities collateral having a value of $67,843,080 (Note 4). |
| 2 | Non-income producing security. |
| 3 | Rate shown represents annualized 7-day yield as of June 30, 2017. |
The accompanying notes are an integral part of these financial statements.
| | Shares | | Value | ||||||||
COMMON STOCKS—99.9% | |||||||||||
Banks—33.5% | |||||||||||
Bank of America Corp. | 91,520 | $ | 2,220,275 | ||||||||
BB&T Corp. | 5,982 | 271,643 | |||||||||
Citigroup, Inc. | 29,490 | 1,972,291 | |||||||||
Citizens Financial Group, Inc. | 3,667 | 130,838 | |||||||||
Comerica, Inc. | 919 | 67,308 | |||||||||
Fifth Third Bancorp | 5,794 | 150,412 | |||||||||
Huntington Bancshares, Inc. | 7,005 | 94,708 | |||||||||
JPMorgan Chase & Co. | 28,143 | 2,572,270 | |||||||||
KeyCorp | 7,151 | 134,010 | |||||||||
M&T Bank Corp. | 805 | 130,370 | |||||||||
People’s United Financial, Inc. | 1,902 | 33,589 | |||||||||
PNC Financial Services Group, Inc. (The) | 3,071 | 383,476 | |||||||||
Regions Financial Corp. | 9,292 | 136,035 | |||||||||
SunTrust Banks, Inc. | 3,750 | 212,700 | |||||||||
U.S. Bancorp | 9,975 | 517,902 | |||||||||
Wells Fargo & Co. | 39,568 | 2,192,463 | |||||||||
Zions Bancorporation | 1,331 | 58,444 | |||||||||
Total Banks | 11,278,734 | ||||||||||
Capital Markets—13.0% | |||||||||||
Affiliated Managers Group, Inc. | 306 | 50,753 | |||||||||
Ameriprise Financial, Inc. | 2,077 | 264,381 | |||||||||
Bank of New York Mellon Corp. (The) | 7,196 | 367,140 | |||||||||
BlackRock, Inc. | 608 | 256,825 | |||||||||
CBOE Holdings, Inc. | 219 | 20,017 | |||||||||
Charles Schwab Corp. (The) | 4,274 | 183,611 | |||||||||
CME Group, Inc. | 678 | 84,913 | |||||||||
E*TRADE Financial Corp.1 | 1,279 | 48,640 | |||||||||
Franklin Resources, Inc. | 3,254 | 145,747 | |||||||||
Goldman Sachs Group, Inc. (The) | 4,071 | 903,355 | |||||||||
Intercontinental Exchange, Inc. | 2,056 | 135,531 | |||||||||
Invesco Ltd. | 3,125 | 109,969 | |||||||||
Moody’s Corp. | 704 | 85,663 | |||||||||
Morgan Stanley | 20,371 | 907,732 | |||||||||
Nasdaq, Inc. | 1,200 | 85,788 | |||||||||
Northern Trust Corp. | 1,266 | 123,068 | |||||||||
Raymond James Financial, Inc. | 1,731 | 138,861 | |||||||||
S&P Global, Inc. | 880 | 128,471 | |||||||||
State Street Corp. | 2,739 | 245,770 | |||||||||
T. Rowe Price Group, Inc.2 | 1,341 | 99,516 | |||||||||
Total Capital Markets | 4,385,751 | ||||||||||
Consumer Finance—6.4% | |||||||||||
American Express Co. | 9,433 | 794,636 | |||||||||
Capital One Financial Corp. | 7,769 | 641,875 | |||||||||
Discover Financial Services | 3,970 | 246,894 | |||||||||
Navient Corp. | 6,865 | 114,302 | |||||||||
Synchrony Financial | 11,925 | 355,604 | |||||||||
Total Consumer Finance | 2,153,311 | ||||||||||
| | Shares | | Value | ||||||||
Diversified Financial Services—16.6% | |||||||||||
Berkshire Hathaway, Inc., Class B1 | 31,380 | $ | 5,314,830 | ||||||||
Leucadia National Corp. | 10,143 | 265,341 | |||||||||
Total Diversified Financial Services | 5,580,171 | ||||||||||
Insurance—30.4% | |||||||||||
Aflac, Inc. | 6,519 | 506,396 | |||||||||
Allstate Corp. (The) | 9,245 | 817,628 | |||||||||
American International Group, Inc. | 19,050 | 1,191,006 | |||||||||
Aon PLC | 1,872 | 248,882 | |||||||||
Arthur J. Gallagher & Co. | 2,195 | 125,664 | |||||||||
Assurant, Inc. | 1,431 | 148,380 | |||||||||
Chubb Ltd. | 4,954 | 720,213 | |||||||||
Cincinnati Financial Corp. | 1,699 | 123,093 | |||||||||
Everest Re Group Ltd. | 534 | 135,951 | |||||||||
Hartford Financial Services Group, Inc. (The) | 8,012 | 421,191 | |||||||||
Lincoln National Corp. | 4,521 | 305,529 | |||||||||
Loews Corp. | 6,256 | 292,843 | |||||||||
Marsh & McLennan Cos., Inc. | 3,777 | 294,455 | |||||||||
MetLife, Inc. | 25,929 | �� | 1,424,539 | ||||||||
Principal Financial Group, Inc. | 4,305 | 275,821 | |||||||||
Progressive Corp. (The) | 12,224 | 538,956 | |||||||||
Prudential Financial, Inc. | 12,153 | 1,314,225 | |||||||||
Torchmark Corp. | 1,172 | 89,658 | |||||||||
Travelers Cos., Inc. (The) | 4,866 | 615,695 | |||||||||
Unum Group | 5,327 | 248,398 | |||||||||
Willis Towers Watson PLC | 1,217 | 177,025 | |||||||||
XL Group Ltd. | 5,606 | 245,543 | |||||||||
Total Insurance | 10,261,091 | ||||||||||
Total Investments—99.9% (Cost $27,000,073) | 33,659,058 | ||||||||||
Other Assets in Excess of Liabilities—0.1% | 39,699 | ||||||||||
Net Assets—100.0% | $ | 33,698,757 | |||||||||
| 1 | Non-income producing security. |
| 2 | All or a portion of the security was on loan. The aggregate value of the security on loan was $97,512; total value of the collateral held by the fund was $99,540. The total value of the collateral includes non-cash U.S. Treasury securities collateral having a value of $99,540 (Note 4). |
The accompanying notes are an integral part of these financial statements.
| | Shares | | Value | ||||||||
COMMON STOCKS—99.5% | |||||||||||
Automobiles & Components—10.1% | |||||||||||
Ford Motor Co.1 | 2,264,044 | $ | 25,334,652 | ||||||||
General Motors Co. | 745,347 | 26,034,971 | |||||||||
Total Automobiles & Components | 51,369,623 | ||||||||||
Banks—0.6% | |||||||||||
New York Community Bancorp, Inc.1 | 147,867 | 1,941,494 | |||||||||
PacWest Bancorp | 25,569 | 1,194,072 | |||||||||
Total Banks | 3,135,566 | ||||||||||
Commercial & Professional Services—0.7% | |||||||||||
Pitney Bowes, Inc.1 | 244,482 | 3,691,678 | |||||||||
Consumer Durables & Apparel—1.2% | |||||||||||
Mattel, Inc. | 274,263 | 5,904,882 | |||||||||
Diversified Financials—1.1% | |||||||||||
Navient Corp. | 333,729 | 5,556,588 | |||||||||
Energy—16.4% | |||||||||||
Helmerich & Payne, Inc.1 | 29,958 | 1,627,918 | |||||||||
HollyFrontier Corp.1 | 487,145 | 13,381,873 | |||||||||
Occidental Petroleum Corp. | 193,940 | 11,611,188 | |||||||||
ONEOK, Inc.1 | 213,777 | 11,150,608 | |||||||||
PBF Energy, Inc., Class A1 | 903,609 | 20,114,336 | |||||||||
Valero Energy Corp.1 | 384,553 | 25,941,946 | |||||||||
Total Energy | 83,827,869 | ||||||||||
Insurance—0.7% | |||||||||||
Mercury General Corp.1 | 64,030 | 3,457,620 | |||||||||
Materials—7.4% | |||||||||||
CF Industries Holdings, Inc.1 | 144,071 | 4,028,225 | |||||||||
Compass Minerals International, Inc.1 | 19,967 | 1,303,845 | |||||||||
Domtar Corp. | 152,690 | 5,866,350 | |||||||||
LyondellBasell Industries NV, Class A | 317,382 | 26,783,867 | |||||||||
Total Materials | 37,982,287 | ||||||||||
Real Estate—9.6% | |||||||||||
Care Capital Properties, Inc.1 | 14,721 | 393,051 | |||||||||
CoreCivic, Inc. | 69,735 | 1,923,291 | |||||||||
EPR Properties | 7,359 | 528,891 | |||||||||
GEO Group, Inc. (The) | 79,348 | 2,346,320 | |||||||||
HCP, Inc. | 80,918 | 2,586,139 | |||||||||
Hospitality Properties Trust | 75,849 | 2,210,998 | |||||||||
Host Hotels & Resorts, Inc. | 315,062 | 5,756,183 | |||||||||
Iron Mountain, Inc. | 117,678 | 4,043,416 | |||||||||
Kimco Realty Corp. | 75,613 | 1,387,499 | |||||||||
Lamar Advertising Co., Class A1 | 23,313 | 1,715,137 | |||||||||
LaSalle Hotel Properties | 43,976 | 1,310,485 | |||||||||
Life Storage, Inc.1 | 7,264 | 538,262 | |||||||||
Macerich Co. (The)1 | 20,214 | 1,173,625 | |||||||||
Medical Properties Trust, Inc. | 47,335 | 609,202 | |||||||||
National Retail Properties, Inc. | 15,292 | 597,917 | |||||||||
Omega Healthcare Investors, Inc.1 | 31,402 | 1,036,894 | |||||||||
Realty Income Corp. | �� | 21,998 | 1,213,850 | ||||||||
Senior Housing Properties Trust | 55,012 | 1,124,445 | |||||||||
Simon Property Group, Inc. | 39,996 | 6,469,753 | |||||||||
Tanger Factory Outlet Centers, Inc.1 | 20,858 | 541,891 | |||||||||
Taubman Centers, Inc. | 13,267 | 790,050 | |||||||||
Uniti Group, Inc. | 33,093 | 831,958 | |||||||||
| | Shares | | Value | ||||||||
Ventas, Inc. | 55,839 | $ | 3,879,694 | ||||||||
Washington Prime Group, Inc.1 | 111,446 | 932,803 | |||||||||
Weingarten Realty Investors | 20,046 | 603,385 | |||||||||
Welltower, Inc. | 63,300 | 4,738,005 | |||||||||
Total Real Estate | 49,283,144 | ||||||||||
Retailing—25.0% | |||||||||||
American Eagle Outfitters, Inc. | 340,947 | 4,108,411 | |||||||||
GameStop Corp., Class A1 | 461,147 | 9,965,387 | |||||||||
HSN, Inc. | 124,118 | 3,959,364 | |||||||||
Kohl’s Corp.1 | 552,519 | 21,365,910 | |||||||||
L Brands, Inc.1 | 265,416 | 14,303,268 | |||||||||
Macy’s, Inc. | 1,110,452 | 25,806,904 | |||||||||
Staples, Inc. | 2,287,237 | 23,032,477 | |||||||||
Target Corp. | 483,989 | 25,307,785 | |||||||||
Total Retailing | 127,849,506 | ||||||||||
Technology Hardware & Equipment—2.2% | |||||||||||
Seagate Technology PLC | 293,198 | 11,361,422 | |||||||||
Telecommunication Services—14.9% | |||||||||||
AT&T, Inc. | 656,147 | 24,756,426 | |||||||||
CenturyLink, Inc.1 | 741,005 | 17,695,200 | |||||||||
Frontier Communications Corp.1 | 7,853,938 | 9,110,568 | |||||||||
Verizon Communications, Inc. | 545,965 | 24,382,797 | |||||||||
Total Telecommunication Services | 75,944,991 | ||||||||||
Utilities—9.6% | |||||||||||
Entergy Corp. | 149,308 | 11,462,375 | |||||||||
FirstEnergy Corp. | 528,450 | 15,409,602 | |||||||||
Southern Co. (The) | 462,409 | 22,140,143 | |||||||||
Total Utilities | 49,012,120 | ||||||||||
Total Common Stocks (Cost $527,607,618) | 508,377,296 | ||||||||||
INVESTMENT OF CASH COLLATERAL FOR SECURITIES LOANED—15.5% | |||||||||||
Dreyfus Government Cash Management Money Market Fund—Institutional Shares, 0.91%2 (Cost $79,017,484) | 79,017,484 | 79,017,484 | |||||||||
Total Investments—115.0% (Cost $606,625,102) | 587,394,780 | ||||||||||
Liabilities in Excess of Other Assets—(15.0)% | (76,764,452 | ) | |||||||||
Net Assets—100.0% | $ | 510,630,328 | |||||||||
| 1 | All or a portion of the security was on loan. The aggregate value of the securities on loan was $131,529,845; total value of the collateral held by the fund was $134,731,140. The total value of the collateral includes non-cash U.S. Treasury securities collateral having a value of $55,713,656 (Note 4). |
| 2 | Rate shown represents annualized 7-day yield as of June 30, 2017. |
The accompanying notes are an integral part of these financial statements.
| | Shares | | Value | ||||||||
COMMON STOCKS—99.6% | |||||||||||
Automobiles & Components—3.9% | |||||||||||
BorgWarner, Inc. | 962 | $ | 40,750 | ||||||||
Delphi Automotive PLC | 894 | 78,359 | |||||||||
Ford Motor Co. | 62,376 | 697,987 | |||||||||
Goodyear Tire & Rubber Co. (The) | 1,988 | 69,501 | |||||||||
Total Automobiles & Components | 886,597 | ||||||||||
Banks—2.0% | |||||||||||
Bank of America Corp. | 18,423 | 446,942 | |||||||||
Comerica, Inc. | 186 | 13,623 | |||||||||
Total Banks | 460,565 | ||||||||||
Capital Goods—10.7% | |||||||||||
3M Co. | 657 | 136,781 | |||||||||
Arconic, Inc. | 2,171 | 49,173 | |||||||||
Cummins, Inc. | 503 | 81,597 | |||||||||
Deere & Co. | 964 | 119,141 | |||||||||
Dover Corp. | 387 | 31,045 | |||||||||
Eaton Corp. PLC | 1,185 | 92,228 | |||||||||
Emerson Electric Co. | 1,090 | 64,986 | |||||||||
Flowserve Corp. | 375 | 17,411 | |||||||||
Fluor Corp. | 1,979 | 90,599 | |||||||||
General Electric Co. | 18,789 | 507,491 | |||||||||
Illinois Tool Works, Inc. | 425 | 60,881 | |||||||||
Ingersoll-Rand PLC | 694 | 63,425 | |||||||||
Johnson Controls International PLC | 3,696 | 160,258 | |||||||||
Lockheed Martin Corp. | 778 | 215,981 | |||||||||
Northrop Grumman Corp. | 437 | 112,182 | |||||||||
Parker-Hannifin Corp. | 330 | 52,741 | |||||||||
Raytheon Co. | 681 | 109,968 | |||||||||
Rockwell Automation, Inc. | 172 | 27,857 | |||||||||
Rockwell Collins, Inc. | 227 | 23,853 | |||||||||
Stanley Black & Decker, Inc. | 374 | 52,633 | |||||||||
United Rentals, Inc.1 | 255 | 28,741 | |||||||||
United Technologies Corp. | 2,182 | 266,444 | |||||||||
W.W. Grainger, Inc. | 260 | 46,938 | |||||||||
Xylem, Inc. | 338 | 18,735 | |||||||||
Total Capital Goods | 2,431,089 | ||||||||||
Commercial & Professional Services—0.4% | |||||||||||
Nielsen Holdings PLC | 749 | 28,956 | |||||||||
Waste Management, Inc. | 854 | 62,641 | |||||||||
Total Commercial & Professional Services | 91,597 | ||||||||||
Consumer Durables & Apparel—2.3% | |||||||||||
Coach, Inc. | 446 | 21,114 | |||||||||
Hanesbrands, Inc. | 1,241 | 28,741 | |||||||||
Hasbro, Inc. | 212 | 23,640 | |||||||||
Mattel, Inc. | 1,172 | 25,233 | |||||||||
Mohawk Industries, Inc.1 | 169 | 40,846 | |||||||||
Newell Brands, Inc. | 1,270 | 68,097 | |||||||||
NIKE, Inc., Class B | 2,916 | 172,044 | |||||||||
PVH Corp. | 354 | 40,533 | |||||||||
Whirlpool Corp. | 485 | 92,936 | |||||||||
Total Consumer Durables & Apparel | 513,184 | ||||||||||
Consumer Services—1.8% | |||||||||||
Hilton Worldwide Holdings, Inc. | 755 | 46,697 | |||||||||
Marriott International, Inc., Class A | 820 | 82,254 | |||||||||
McDonald’s Corp. | 730 | 111,807 | |||||||||
Royal Caribbean Cruises Ltd. | 349 | 38,121 | |||||||||
| | Shares | | Value | ||||||||
Starbucks Corp. | 1,666 | $ | 97,144 | ||||||||
Wyndham Worldwide Corp. | 255 | 25,605 | |||||||||
Total Consumer Services | 401,628 | ||||||||||
Diversified Financials—2.9% | |||||||||||
Bank of New York Mellon Corp. (The) | 1,450 | 73,979 | |||||||||
BlackRock, Inc. | 123 | 51,956 | |||||||||
Goldman Sachs Group, Inc. (The) | 826 | 183,289 | |||||||||
Invesco Ltd. | 630 | 22,170 | |||||||||
Moody’s Corp. | 141 | 17,157 | |||||||||
Morgan Stanley | 4,100 | 182,696 | |||||||||
Northern Trust Corp. | 256 | 24,886 | |||||||||
S&P Global, Inc. | 177 | 25,840 | |||||||||
State Street Corp. | 552 | 49,531 | |||||||||
T. Rowe Price Group, Inc. | 270 | 20,037 | |||||||||
Total Diversified Financials | 651,541 | ||||||||||
Energy—4.6% | |||||||||||
Apache Corp. | 533 | 25,547 | |||||||||
Baker Hughes, Inc. | 764 | 41,646 | |||||||||
ConocoPhillips | 2,619 | 115,131 | |||||||||
Devon Energy Corp. | 1,696 | 54,221 | |||||||||
EQT Corp. | 150 | 8,788 | |||||||||
Halliburton Co. | 1,648 | 70,386 | |||||||||
Hess Corp. | 530 | 23,251 | |||||||||
Marathon Oil Corp. | 1,561 | 18,498 | |||||||||
Marathon Petroleum Corp. | 5,106 | 267,197 | |||||||||
Newfield Exploration Co.1 | 248 | 7,058 | |||||||||
Noble Energy, Inc. | 563 | 15,933 | |||||||||
Occidental Petroleum Corp. | 823 | 49,273 | |||||||||
ONEOK, Inc.2 | 918 | 47,883 | |||||||||
Range Resources Corp. | 302 | 6,997 | |||||||||
Schlumberger Ltd. | 1,893 | 124,635 | |||||||||
TechnipFMC PLC1 | 1,749 | 47,573 | |||||||||
Tesoro Corp. | 1,270 | 118,872 | |||||||||
Total Energy | 1,042,889 | ||||||||||
Food & Staples Retailing—7.0% | |||||||||||
CVS Health Corp. | 10,331 | 831,233 | |||||||||
Kroger Co. (The) | 22,613 | 527,335 | |||||||||
Sysco Corp. | 4,452 | 224,069 | |||||||||
Total Food & Staples Retailing | 1,582,637 | ||||||||||
Food, Beverage & Tobacco—5.2% | |||||||||||
Altria Group, Inc. | 1,157 | 86,162 | |||||||||
Brown-Forman Corp., Class B | 277 | 13,462 | |||||||||
Campbell Soup Co. | 632 | 32,959 | |||||||||
Coca-Cola Co. (The) | 4,096 | 183,706 | |||||||||
Conagra Brands, Inc. | 1,014 | 36,261 | |||||||||
Dr Pepper Snapple Group, Inc. | 314 | 28,608 | |||||||||
General Mills, Inc. | 1,235 | 68,419 | |||||||||
Hershey Co. (The) | 296 | 31,781 | |||||||||
Hormel Foods Corp. | 1,264 | 43,115 | |||||||||
J.M. Smucker Co. (The) | 263 | 31,121 | |||||||||
Kellogg Co. | 803 | 55,776 | |||||||||
McCormick & Co., Inc. | 190 | 18,527 | |||||||||
Molson Coors Brewing Co., Class B | 350 | 30,219 | |||||||||
Mondelez International, Inc., Class A | 2,583 | 111,560 | |||||||||
PepsiCo, Inc. | 2,446 | 282,489 | |||||||||
Philip Morris International, Inc. | 1,010 | 118,624 | |||||||||
Total Food, Beverage & Tobacco | 1,172,789 | ||||||||||
| | Shares | | Value | ||||||||
Health Care Equipment & Services—8.0% | |||||||||||
Abbott Laboratories | 2,110 | $ | 102,567 | ||||||||
Baxter International, Inc. | 808 | 48,917 | |||||||||
Becton Dickinson and Co. | 293 | 57,167 | |||||||||
Boston Scientific Corp.1 | 1,410 | 39,085 | |||||||||
C.R. Bard, Inc. | 55 | 17,386 | |||||||||
Cigna Corp. | 1,097 | 183,627 | |||||||||
Edwards Lifesciences Corp.1 | 125 | 14,780 | |||||||||
Henry Schein, Inc.1 | 292 | 53,442 | |||||||||
Humana, Inc. | 1,079 | 259,629 | |||||||||
Medtronic PLC | 1,527 | 135,521 | |||||||||
UnitedHealth Group, Inc. | 4,780 | 886,308 | |||||||||
Varian Medical Systems, Inc.1 | 133 | 13,724 | |||||||||
Total Health Care Equipment & Services | 1,812,153 | ||||||||||
Household & Personal Products—2.3% | |||||||||||
Church & Dwight Co., Inc. | 299 | 15,512 | |||||||||
Clorox Co. (The) | 193 | 25,715 | |||||||||
Colgate-Palmolive Co. | 906 | 67,162 | |||||||||
Estee Lauder Cos., Inc., (The), Class A | 541 | 51,925 | |||||||||
Kimberly-Clark Corp. | 634 | 81,856 | |||||||||
Procter & Gamble Co. (The) | 3,318 | 289,164 | |||||||||
Total Household & Personal Products | 531,334 | ||||||||||
Insurance—3.6% | |||||||||||
Allstate Corp. (The) | 1,861 | 164,587 | |||||||||
Marsh & McLennan Cos., Inc. | 761 | 59,327 | |||||||||
MetLife, Inc. | 5,219 | 286,732 | |||||||||
Principal Financial Group, Inc. | 867 | 55,549 | |||||||||
Prudential Financial, Inc. | 2,446 | 264,510 | |||||||||
Total Insurance | 830,705 | ||||||||||
Materials—4.1% | |||||||||||
Air Products & Chemicals, Inc. | 275 | 39,342 | |||||||||
Albemarle Corp. | 114 | 12,032 | |||||||||
Avery Dennison Corp. | 330 | 29,162 | |||||||||
Ball Corp. | 1,083 | 45,713 | |||||||||
E.I. du Pont de Nemours & Co. | 1,391 | 112,268 | |||||||||
Eastman Chemical Co. | 503 | 42,247 | |||||||||
Ecolab, Inc. | 451 | 59,870 | |||||||||
FMC Corp. | 186 | 13,587 | |||||||||
International Flavors & Fragrances, Inc. | 107 | 14,445 | |||||||||
International Paper Co. | 1,757 | 99,464 | |||||||||
LyondellBasell Industries NV, Class A | 1,753 | 147,936 | |||||||||
Mosaic Co. (The) | 1,440 | 32,875 | |||||||||
Newmont Mining Corp. | 952 | 30,835 | |||||||||
PPG Industries, Inc. | 605 | 66,526 | |||||||||
Praxair, Inc. | 364 | 48,248 | |||||||||
Sealed Air Corp. | 632 | 28,288 | |||||||||
Sherwin-Williams Co. (The) | 156 | 54,750 | |||||||||
WestRock Co. | 1,136 | 64,366 | |||||||||
Total Materials | 941,954 | ||||||||||
Media—3.3% | |||||||||||
Comcast Corp., Class A | 9,007 | 350,552 | |||||||||
Time Warner, Inc. | 1,368 | 137,361 | |||||||||
Walt Disney Co. (The) | 2,387 | 253,619 | |||||||||
Total Media | 741,532 | ||||||||||
| | Shares | | Value | ||||||||
Pharmaceuticals, Biotechnology & Life Sciences—3.0% | |||||||||||
AbbVie, Inc. | 1,693 | $ | 122,760 | ||||||||
Agilent Technologies, Inc. | 327 | 19,394 | |||||||||
Biogen, Inc.1 | 206 | 55,900 | |||||||||
Bristol-Myers Squibb Co. | 1,675 | 93,331 | |||||||||
Celgene Corp.1 | 450 | 58,442 | |||||||||
Eli Lilly & Co. | 1,198 | 98,595 | |||||||||
Pfizer, Inc. | 7,305 | 245,375 | |||||||||
Total Pharmaceuticals, Biotechnology & Life Sciences | 693,797 | ||||||||||
Real Estate—1.1% | |||||||||||
AvalonBay Communities, Inc. | 45 | 8,648 | |||||||||
Boston Properties, Inc. | 100 | 12,302 | |||||||||
CBRE Group, Inc., Class A1 | 1,715 | 62,426 | |||||||||
Equinix, Inc. | 39 | 16,737 | |||||||||
GGP, Inc. | 493 | 11,615 | |||||||||
HCP, Inc. | 333 | 10,643 | |||||||||
Host Hotels & Resorts, Inc. | 1,340 | 24,482 | |||||||||
Iron Mountain, Inc. | 482 | 16,561 | |||||||||
Kimco Realty Corp. | 298 | 5,468 | |||||||||
Macerich Co. (The) | 82 | 4,761 | |||||||||
Prologis, Inc. | 215 | 12,608 | |||||||||
Regency Centers Corp. | 51 | 3,195 | |||||||||
Vornado Realty Trust | 128 | 12,019 | |||||||||
Welltower, Inc. | 261 | 19,536 | |||||||||
Weyerhaeuser Co. | 902 | 30,217 | |||||||||
Total Real Estate | 251,218 | ||||||||||
Retailing—5.5% | |||||||||||
Bed Bath & Beyond, Inc. | 1,569 | 47,697 | |||||||||
Best Buy Co., Inc. | 3,162 | 181,277 | |||||||||
Gap, Inc. (The) | 1,197 | 26,322 | |||||||||
Home Depot, Inc. (The) | 2,747 | 421,390 | |||||||||
Kohl’s Corp. | 2,291 | 88,593 | |||||||||
L Brands, Inc. | 1,109 | 59,764 | |||||||||
Macy’s, Inc. | 5,178 | 120,337 | |||||||||
Nordstrom, Inc.2 | 1,431 | 68,445 | |||||||||
Staples, Inc. | 9,211 | 92,755 | |||||||||
TJX Cos., Inc. (The) | 2,083 | 150,330 | |||||||||
Total Retailing | 1,256,910 | ||||||||||
Semiconductors & Semiconductor Equipment—2.6% | |||||||||||
Advanced Micro Devices, Inc.1,2 | 1,753 | 21,877 | |||||||||
Analog Devices, Inc. | 214 | 16,649 | |||||||||
Applied Materials, Inc. | 1,251 | 51,679 | |||||||||
Intel Corp. | 7,800 | 263,172 | |||||||||
KLA-Tencor Corp. | 163 | 14,916 | |||||||||
Lam Research Corp. | 221 | 31,256 | |||||||||
Microchip Technology, Inc. | 191 | 14,741 | |||||||||
Micron Technology, Inc.1 | 2,192 | 65,453 | |||||||||
NVIDIA Corp. | 208 | 30,069 | |||||||||
Skyworks Solutions, Inc. | 149 | 14,297 | |||||||||
Texas Instruments, Inc. | 783 | 60,236 | |||||||||
Xilinx, Inc. | 165 | 10,613 | |||||||||
Total Semiconductors & Semiconductor Equipment | 594,958 | ||||||||||
| | Shares | | Value | ||||||||
Software & Services—8.2% | |||||||||||
Accenture PLC, Class A | 1,281 | $ | 158,434 | ||||||||
Adobe Systems, Inc.1 | 205 | 28,995 | |||||||||
Alphabet, Inc., Class A1 | 225 | 209,178 | |||||||||
Alphabet, Inc., Class C1 | 229 | 208,099 | |||||||||
Autodesk, Inc.1 | 87 | 8,771 | |||||||||
CA, Inc. | 577 | 19,889 | |||||||||
Cognizant Technology Solutions Corp., Class A | 949 | 63,014 | |||||||||
DXC Technology Co. | 462 | 35,445 | |||||||||
eBay, Inc.1 | 1,210 | 42,253 | |||||||||
International Business Machines Corp. | 2,346 | 360,885 | |||||||||
Intuit, Inc. | 158 | 20,984 | |||||||||
Microsoft Corp. | 5,685 | 391,867 | |||||||||
Oracle Corp. | 3,818 | 191,435 | |||||||||
salesforce.com, Inc.1 | 443 | 38,364 | |||||||||
Symantec Corp. | 644 | 18,193 | |||||||||
Visa, Inc., Class A | 814 | 76,337 | |||||||||
Total Software & Services | 1,872,143 | ||||||||||
Technology Hardware & Equipment—3.4% | |||||||||||
Cisco Systems, Inc. | 7,004 | 219,225 | |||||||||
Corning, Inc. | 1,506 | 45,255 | |||||||||
HP, Inc. | 12,841 | 224,461 | |||||||||
Juniper Networks, Inc. | 806 | 22,471 | |||||||||
NetApp, Inc. | 649 | 25,993 | |||||||||
Seagate Technology PLC | 1,207 | 46,771 | |||||||||
TE Connectivity Ltd. | 736 | 57,909 | |||||||||
Western Digital Corp. | 927 | 82,132 | |||||||||
Xerox Corp. | 1,743 | 50,076 | |||||||||
Total Technology Hardware & Equipment | 774,293 | ||||||||||
Telecommunication Services—5.4% | |||||||||||
AT&T, Inc. | 18,549 | 699,854 | |||||||||
Verizon Communications, Inc. | 12,094 | 540,118 | |||||||||
Total Telecommunication Services | 1,239,972 | ||||||||||
Transportation—3.7% | |||||||||||
Delta Air Lines, Inc. | 3,497 | 187,929 | |||||||||
FedEx Corp. | 1,246 | 270,793 | |||||||||
Union Pacific Corp. | 833 | 90,722 | |||||||||
United Parcel Service, Inc., Class B | 2,551 | 282,115 | |||||||||
Total Transportation | 831,559 | ||||||||||
Utilities—4.6% | |||||||||||
AES Corp. | 5,276 | 58,616 | |||||||||
Ameren Corp. | 497 | 27,171 | |||||||||
American Electric Power Co., Inc. | 1,028 | 71,415 | |||||||||
American Water Works Co., Inc. | 185 | 14,421 | |||||||||
CMS Energy Corp. | 609 | 28,166 | |||||||||
Consolidated Edison, Inc. | 657 | 53,099 | |||||||||
Dominion Energy, Inc. | 694 | 53,181 | |||||||||
DTE Energy Co. | 467 | 49,404 | |||||||||
Edison International | 662 | 51,762 | |||||||||
Entergy Corp. | 617 | 47,367 | |||||||||
Eversource Energy | 560 | 33,998 | |||||||||
Exelon Corp. | 4,029 | 145,326 | |||||||||
NextEra Energy, Inc. | 524 | 73,428 | |||||||||
NiSource, Inc. | 813 | 20,618 | |||||||||
NRG Energy, Inc. | 3,261 | 56,154 | |||||||||
| | Shares | | Value | ||||||||
Pinnacle West Capital Corp. | 181 | $ | 15,414 | ||||||||
PPL Corp. | 862 | 33,325 | |||||||||
Public Service Enterprise Group, Inc. | 950 | 40,859 | |||||||||
Southern Co. (The) | 1,909 | 91,403 | |||||||||
WEC Energy Group, Inc. | 541 | 33,207 | |||||||||
Xcel Energy, Inc. | 1,080 | 49,550 | |||||||||
Total Utilities | 1,047,884 | ||||||||||
Total Common Stocks (Cost $20,554,860) | 22,654,928 | ||||||||||
INVESTMENT OF CASH COLLATERAL FOR SECURITIES LOANED—0.3% | |||||||||||
Dreyfus Government Cash Management Money Market Fund—Institutional Shares, 0.91%3 (Cost $63,689) | 63,689 | 63,689 | |||||||||
Total Investments—99.9% (Cost $20,618,549) | 22,718,617 | ||||||||||
Other Assets in Excess of Liabilities—0.1% | 17,396 | ||||||||||
Net Assets—100.0% | $ | 22,736,013 | |||||||||
| 1 | Non-income producing security. |
| 2 | All or a portion of the security was on loan. The aggregate value of the securities on loan was $100,768; total value of the collateral held by the fund was $102,565. The total value of the collateral includes non-cash U.S. Treasury securities collateral having a value of $38,876 (Note 4). |
| 3 | Rate shown represents annualized 7-day yield as of June 30, 2017. |
| 4 | Is or was an affiliate, as defined in the Investment Company Act of 1940, as amended, at or during the reporting period, by virtue of the Fund owning at least 5% of the voting securities of the issuer or as a result of the Fund and the issuer having the same investment adviser. Transactions during the reporting period in which the issuer was an affiliate are as follows: |
| Shares October 31, 2016a | Gross Additions | Gross Reductions | Shares June 30, 2017 | |||||
| Oppenheimer Large Cap Revenue ETF | — | 26,769 | 26,769 | — |
| Value | Income | Realized Gain | ||||||
| Oppenheimer Large Cap Revenue ETF | $ — | $ — | $8,576 |
| a | Commencement of Operations. |
The accompanying notes are an integral part of these financial statements.
| | Shares | | Value | ||||||||
COMMON STOCKS—98.2% | |||||||||||
Automobiles & Components—2.4% | |||||||||||
Aisin Seiki Co. Ltd. | 1,423 | $ | 72,822 | ||||||||
Astra International Tbk PT | 46,383 | 31,061 | |||||||||
Cie Generale des Etablissements Michelin | 395 | 52,440 | |||||||||
Geely Automobile Holdings Ltd. | 11,574 | 24,967 | |||||||||
GKN PLC | 5,531 | 23,422 | |||||||||
Guangzhou Automobile Group Co. Ltd., Class H | 3,327 | 5,839 | |||||||||
Hankook Tire Co. Ltd. | 244 | 13,563 | |||||||||
Hero MotoCorp Ltd. | 187 | 10,708 | |||||||||
Nokian Renkaat OYJ | 73 | 3,017 | |||||||||
Peugeot SA | 6,198 | 123,462 | |||||||||
Stanley Electric Co. Ltd. | 272 | 8,207 | |||||||||
Sumitomo Rubber Industries Ltd.1 | 879 | 14,833 | |||||||||
Tesla, Inc.1,2 | 56 | 20,250 | |||||||||
Valeo SA | 562 | 37,812 | |||||||||
Yamaha Motor Co. Ltd.1 | 1,219 | 31,441 | |||||||||
Total Automobiles & Components | 473,844 | ||||||||||
Banks—11.5% | |||||||||||
ABN AMRO Group NV3 | 1,468 | 38,861 | |||||||||
Australia & New Zealand Banking Group Ltd. | 3,042 | 67,014 | |||||||||
Banco Bradesco SA | 10,393 | 86,576 | |||||||||
Banco de Credito e Inversiones | 117 | 6,530 | |||||||||
Banco do Brasil SA | 15,304 | 123,790 | |||||||||
Banco Santander Brasil SA | 8,341 | 62,937 | |||||||||
Banco Santander Chile | 146,158 | 9,288 | |||||||||
Banco Santander SA | 26,993 | 178,318 | |||||||||
Bank Central Asia Tbk PT | 7,960 | 10,840 | |||||||||
Bank Danamon Indonesia Tbk PT | 12,153 | 4,673 | |||||||||
Bank Hapoalim B.M. | 1,554 | 10,483 | |||||||||
Bank Leumi Le-Israel B.M. | 1,870 | 9,094 | |||||||||
Bank Mandiri Persero Tbk PT | 17,981 | 17,202 | |||||||||
Bank Millennium SA2 | 1,052 | 2,114 | |||||||||
Bank Negara Indonesia Persero Tbk PT | 18,725 | 9,273 | |||||||||
Bank of Montreal | 621 | 45,531 | |||||||||
Bank Rakyat Indonesia Persero Tbk PT | 17,072 | 19,535 | |||||||||
Bank Zachodni WBK SA | 58 | 5,354 | |||||||||
Bankinter SA | 643 | 5,915 | |||||||||
Bendigo & Adelaide Bank Ltd. | 590 | 5,014 | |||||||||
BNP Paribas SA | 3,101 | 223,034 | |||||||||
BOC Hong Kong Holdings Ltd. | 5,474 | 26,190 | |||||||||
CaixaBank SA | 5,802 | 27,661 | |||||||||
Chugoku Bank Ltd. (The) | 191 | 2,856 | |||||||||
Comerica, Inc. | 96 | 7,031 | |||||||||
Commonwealth Bank of Australia | 1,173 | 74,508 | |||||||||
Credit Agricole SA | 11,081 | 178,012 | |||||||||
DBS Group Holdings Ltd. | 1,528 | 23,017 | |||||||||
DGB Financial Group, Inc. | 550 | 5,672 | |||||||||
DNB ASA | 1,083 | 18,359 | |||||||||
Dubai Islamic Bank PJSC | 3,173 | 4,924 | |||||||||
E.Sun Financial Holding Co. Ltd. | 6,935 | 4,263 | |||||||||
Erste Group Bank AG2 | 609 | 23,286 | |||||||||
First Abu Dhabi Bank PJSC | 6,312 | 18,044 | |||||||||
Hana Financial Group, Inc. | 680 | 26,893 | |||||||||
Hang Seng Bank Ltd. | 681 | 14,246 | |||||||||
| | Shares | | Value | ||||||||
Housing Development Finance Corp. Ltd. | 860 | $ | 21,487 | ||||||||
IDFC Bank Ltd. | 3,646 | 3,086 | |||||||||
Indiabulls Housing Finance Ltd. | 222 | 3,696 | |||||||||
ING Groep NV | 6,920 | 119,178 | |||||||||
KB Financial Group, Inc. | 656 | 33,082 | |||||||||
KBC Groep NV | 411 | 31,131 | |||||||||
KeyCorp | 777 | 14,561 | |||||||||
Krung Thai Bank PCL | 19,763 | 10,937 | |||||||||
mBank SA2 | 19 | 2,368 | |||||||||
Mega Financial Holding Co. Ltd. | 6,958 | 5,787 | |||||||||
Mizrahi Tefahot Bank Ltd. | 238 | 4,331 | |||||||||
Mizuho Financial Group, Inc. | 35,990 | 65,792 | |||||||||
National Australia Bank Ltd. | 2,772 | 62,916 | |||||||||
Natixis SA | 3,147 | 21,094 | |||||||||
Nedbank Group Ltd. | 984 | 15,680 | |||||||||
Nordea Bank AB | 2,499 | 31,761 | |||||||||
People’s United Financial, Inc. | 221 | 3,903 | |||||||||
Raiffeisen Bank International AG2 | 589 | 14,846 | |||||||||
Resona Holdings, Inc. | 2,882 | 15,864 | |||||||||
Royal Bank of Canada | 1,085 | 78,666 | |||||||||
Shinhan Financial Group Co. Ltd. | 846 | 36,453 | |||||||||
Siam Commercial Bank PCL (The) | 2,477 | 11,339 | |||||||||
Skandinaviska Enskilda Banken AB, Class A | 1,371 | 16,563 | |||||||||
Societe Generale SA | 2,784 | 149,588 | |||||||||
SVB Financial Group2 | 21 | 3,692 | |||||||||
Swedbank AB, Class A | 567 | 13,801 | |||||||||
Taishin Financial Holding Co. Ltd. | 8,224 | 3,744 | |||||||||
Taiwan Business Bank | 8,275 | 2,312 | |||||||||
Westpac Banking Corp. | 2,792 | 65,340 | |||||||||
Yamaguchi Financial Group, Inc. | 305 | 3,684 | |||||||||
Total Banks | �� | 2,263,020 | |||||||||
Capital Goods—16.1% | |||||||||||
3M Co. | 338 | 70,368 | |||||||||
ABB Ltd. | 3,122 | 77,198 | |||||||||
Aboitiz Equity Ventures, Inc. | 3,395 | 5,123 | |||||||||
AGCO Corp. | 250 | 16,847 | |||||||||
Airbus SE | 1,937 | 159,066 | |||||||||
Alfa Laval AB | 444 | 9,075 | |||||||||
Allegion PLC | 63 | 5,111 | |||||||||
Alstom SA2 | 491 | 17,142 | |||||||||
Amada Holdings Co. Ltd. | 499 | 5,764 | |||||||||
Arconic, Inc. | 1,009 | 22,854 | |||||||||
Ashtead Group PLC | 364 | 7,513 | |||||||||
Atlas Copco AB, Class A | 478 | 18,305 | |||||||||
Atlas Copco AB, Class B | 249 | 8,594 | |||||||||
BAE Systems PLC | 5,969 | 49,118 | |||||||||
Bidvest Group Ltd. (The) | 888 | 10,680 | |||||||||
Boeing Co. (The) | 1,119 | 221,282 | |||||||||
Bouygues SA | 1,803 | 75,923 | |||||||||
CAE, Inc. | 264 | 4,545 | |||||||||
Caterpillar, Inc. | 807 | 86,720 | |||||||||
Cie de Saint-Gobain | 1,682 | 89,743 | |||||||||
CNH Industrial NV | 4,948 | 55,955 | |||||||||
Cummins, Inc. | 245 | 39,744 | |||||||||
Daikin Industries Ltd. | 411 | 41,956 | |||||||||
Deere & Co. | 483 | 59,694 | |||||||||
Eaton Corp. PLC | 555 | 43,196 | |||||||||
Elbit Systems Ltd. | 61 | 7,522 | |||||||||
| | Shares | | Value | ||||||||
Capital Goods (continued) | |||||||||||
Far Eastern New Century Corp. | 20,159 | $ | 16,402 | ||||||||
Finning International, Inc. | 476 | 9,317 | |||||||||
Fortune Brands Home & Security, Inc. | 173 | 11,286 | |||||||||
Fuji Electric Co. Ltd. | 3,256 | 17,155 | |||||||||
Geberit AG | 14 | 6,538 | |||||||||
HAP Seng Consolidated Bhd | 1,165 | 2,505 | |||||||||
Hino Motors Ltd. | 2,714 | 30,121 | |||||||||
Hitachi Construction Machinery Co. Ltd. | 630 | 15,739 | |||||||||
Hiwin Technologies Corp. | 184 | 1,243 | |||||||||
HOCHTIEF AG | 265 | 48,480 | |||||||||
Honeywell International, Inc. | 654 | 87,172 | |||||||||
Huntington Ingalls Industries, Inc. | 79 | 14,707 | |||||||||
IHI Corp.2 | 8,270 | 28,116 | |||||||||
IMI PLC | 293 | 4,548 | |||||||||
Ingersoll-Rand PLC | 333 | 30,433 | |||||||||
Jacobs Engineering Group, Inc. | 452 | 24,584 | |||||||||
Johnson Controls International PLC | 1,406 | 60,964 | |||||||||
Kajima Corp. | 4,671 | 39,410 | |||||||||
Keppel Corp. Ltd. | 2,323 | 10,612 | |||||||||
Komatsu Ltd. | 1,482 | 37,650 | |||||||||
Koninklijke Philips NV | 1,748 | 61,993 | |||||||||
L3 Technologies, Inc. | 147 | 24,561 | |||||||||
Legrand SA | 178 | 12,435 | |||||||||
Lennox International, Inc. | 50 | 9,182 | |||||||||
Lockheed Martin Corp. | 375 | 104,104 | |||||||||
Masco Corp. | 445 | 17,003 | |||||||||
Metso OYJ | 177 | 6,129 | |||||||||
Middleby Corp. (The)2 | 40 | 4,860 | |||||||||
Mitsubishi Electric Corp. | 6,069 | 87,259 | |||||||||
Nabtesco Corp. | 166 | 4,824 | |||||||||
Northrop Grumman Corp. | 214 | 54,936 | |||||||||
NSK Ltd. | 1,619 | 20,216 | |||||||||
OSRAM Licht AG | 122 | 9,705 | |||||||||
Parker-Hannifin Corp. | 154 | 24,612 | |||||||||
Raytheon Co. | 330 | 53,288 | |||||||||
Rexel SA | 1,822 | 29,769 | |||||||||
Rockwell Automation, Inc. | 84 | 13,605 | |||||||||
Rockwell Collins, Inc. | 136 | 14,291 | |||||||||
Roper Technologies, Inc. | 42 | 9,724 | |||||||||
Safran SA | 450 | 41,183 | |||||||||
Sandvik AB | 1,291 | 20,281 | |||||||||
Schneider Electric SE2 | 826 | 63,375 | |||||||||
Siemens AG | 1,350 | 185,308 | |||||||||
Singapore Technologies Engineering Ltd. | 3,998 | 10,686 | |||||||||
Skanska AB, Class B | 1,497 | 35,479 | |||||||||
SKF AB, Class B | 823 | 16,656 | |||||||||
Smiths Group PLC | 444 | 9,210 | |||||||||
SNC-Lavalin Group, Inc. | 357 | 15,413 | |||||||||
Taisei Corp. | 3,395 | 31,001 | |||||||||
Thales SA | 325 | 34,933 | |||||||||
THK Co. Ltd. | 208 | 5,887 | |||||||||
TOTO Ltd. | 307 | 11,721 | |||||||||
Toyota Tsusho Corp. | 5,023 | 150,431 | |||||||||
United Rentals, Inc.2 | 108 | 12,173 | |||||||||
United Technologies Corp. | 1,054 | 128,704 | |||||||||
Volvo AB, Class B | 3,675 | 62,568 | |||||||||
| | Shares | | Value | ||||||||
Wartsila OYJ Abp | 192 | $ | 11,332 | ||||||||
WEG SA | 1,084 | 5,791 | |||||||||
Weir Group PLC (The) | 217 | 4,879 | |||||||||
Wolseley PLC | 716 | 43,833 | |||||||||
Xylem, Inc. | 162 | 8,980 | |||||||||
Total Capital Goods | 3,178,340 | ||||||||||
Commercial & Professional Services—1.5% | |||||||||||
Adecco Group AG | 744 | 56,636 | |||||||||
Dai Nippon Printing Co. Ltd. | 2,725 | 30,267 | |||||||||
Edenred | 100 | 2,604 | |||||||||
Experian PLC | 489 | 10,004 | |||||||||
ISS A/S | 637 | 24,986 | |||||||||
Manpowergroup, Inc. | 421 | 47,005 | |||||||||
Recruit Holdings Co. Ltd. | 1,998 | 34,337 | |||||||||
RELX NV | 507 | 10,409 | |||||||||
RELX PLC | 490 | 10,566 | |||||||||
Robert Half International, Inc. | 255 | 12,222 | |||||||||
SGS SA | 6 | 14,548 | |||||||||
Toppan Printing Co. Ltd. | 2,846 | 31,206 | |||||||||
Wolters Kluwer NV | 248 | 10,484 | |||||||||
Total Commercial & Professional Services | 295,274 | ||||||||||
Consumer Durables & Apparel—4.1% | |||||||||||
adidas AG | 254 | 48,597 | |||||||||
Burberry Group PLC | 327 | 7,055 | |||||||||
Christian Dior SE2 | 369 | 105,363 | |||||||||
Cie Financiere Richemont SA | 275 | 22,686 | |||||||||
Hasbro, Inc. | 102 | 11,374 | |||||||||
Hermes International | 25 | 12,336 | |||||||||
HUGO BOSS AG1 | 81 | 5,663 | |||||||||
Husqvarna AB, Class B | 709 | 7,036 | |||||||||
Kering | 92 | 31,290 | |||||||||
LVMH Moet Hennessy Louis Vuitton SE | 360 | 89,633 | |||||||||
Mohawk Industries, Inc.2 | 89 | 21,510 | |||||||||
Newell Brands, Inc. | 629 | 33,727 | |||||||||
Panasonic Corp. | 12,141 | 164,675 | |||||||||
SEB SA | 73 | 13,093 | |||||||||
Sega Sammy Holdings, Inc. | 669 | 9,003 | |||||||||
Sekisui Chemical Co. Ltd. | 1,286 | 23,017 | |||||||||
Sony Corp. | 4,137 | 157,807 | |||||||||
Titan Co. Ltd.2 | 588 | 4,771 | |||||||||
Whirlpool Corp. | 253 | 48,480 | |||||||||
Total Consumer Durables & Apparel | 817,116 | ||||||||||
Consumer Services—1.3% | |||||||||||
Aramark | 868 | 35,571 | |||||||||
Aristocrat Leisure Ltd. | 221 | 3,824 | |||||||||
Compass Group PLC | 2,553 | 53,723 | |||||||||
Domino’s Pizza, Inc. | 28 | 5,923 | |||||||||
Hilton Worldwide Holdings, Inc. | 277 | 17,132 | |||||||||
InterContinental Hotels Group PLC | 55 | 3,048 | |||||||||
Marriott International, Inc., Class A | 481 | 48,249 | |||||||||
Melco Resorts & Entertainment Ltd.4 | 526 | 11,809 | |||||||||
MGM China Holdings Ltd. | 1,995 | 4,436 | |||||||||
OPAP SA | 964 | 10,885 | |||||||||
Royal Caribbean Cruises Ltd. | 171 | 18,678 | |||||||||
Sands China Ltd. | 3,295 | 15,090 | |||||||||
Shangri-La Asia Ltd. | 3,129 | 5,307 | |||||||||
Tabcorp Holdings Ltd. | 1,080 | 3,620 | |||||||||
| | Shares | | Value | ||||||||
Consumer Services (continued) | |||||||||||
Tatts Group Ltd. | 1,452 | $ | 4,656 | ||||||||
Vail Resorts, Inc. | 24 | 4,868 | |||||||||
Total Consumer Services | 246,819 | ||||||||||
Diversified Financials—3.3% | |||||||||||
3i Group PLC | 354 | 4,150 | |||||||||
Ally Financial, Inc. | 1,143 | 23,889 | |||||||||
American Express Co. | 954 | 80,365 | |||||||||
ASX Ltd. | 31 | 1,275 | |||||||||
B3 SA—Brasil Bolsa Balcao | 307 | 1,830 | |||||||||
Bajaj Finance Ltd. | 144 | 3,059 | |||||||||
Bank of New York Mellon Corp. (The) | 733 | 37,398 | |||||||||
BlackRock, Inc. | 65 | 27,457 | |||||||||
Brookfield Asset Management, Inc., Class A | 1,474 | 57,759 | |||||||||
Chailease Holding Co. Ltd. | 1,116 | 3,111 | |||||||||
CME Group, Inc. | 68 | 8,516 | |||||||||
Deutsche Boerse AG | 58 | 6,114 | |||||||||
Franklin Resources, Inc. | 344 | 15,408 | |||||||||
Fubon Financial Holding Co. Ltd.2 | 5,170 | 8,234 | |||||||||
Goldman Sachs Group, Inc. (The) | 362 | 80,328 | |||||||||
Groupe Bruxelles Lambert SA | 143 | 13,747 | |||||||||
Industrivarden AB, Class C | 3 | 72 | |||||||||
L E Lundbergforetagen AB, Class B | 29 | 2,286 | |||||||||
Macquarie Group Ltd. | 143 | 9,707 | |||||||||
Moody’s Corp. | 67 | 8,152 | |||||||||
Morgan Stanley | 2,003 | 89,254 | |||||||||
Northern Trust Corp. | 129 | 12,540 | |||||||||
Onex Corp. | 692 | 55,314 | |||||||||
PSG Group Ltd. | 183 | 3,352 | |||||||||
S&P Global, Inc. | 88 | 12,847 | |||||||||
State Street Corp. | 283 | 25,394 | |||||||||
TD Ameritrade Holding Corp. | 201 | 8,641 | |||||||||
Voya Financial, Inc. | 709 | 26,155 | |||||||||
Wendel SA | 132 | 19,512 | |||||||||
Total Diversified Financials | 645,866 | ||||||||||
Energy—7.3% | |||||||||||
Baker Hughes, Inc. | 383 | 20,877 | |||||||||
Banpu PCL | 9,556 | 4,670 | |||||||||
Cosan SA Industria e Comercio | 452 | 4,717 | |||||||||
Empresas COPEC SA | 3,267 | 35,627 | |||||||||
Encana Corp. | 711 | 6,247 | |||||||||
Exxaro Resources Ltd. | 449 | 3,187 | |||||||||
Galp Energia SGPS SA | 1,913 | 28,921 | |||||||||
Idemitsu Kosan Co. Ltd. | 2,084 | 59,167 | |||||||||
Indian Oil Corp. Ltd. | 19,733 | 117,597 | |||||||||
IRPC PCL | 79,218 | 12,476 | |||||||||
Marathon Petroleum Corp. | 2,682 | 140,349 | |||||||||
MOL Hungarian Oil & Gas PLC | 344 | 26,941 | |||||||||
Neste OYJ | 706 | 27,772 | |||||||||
Novatek PJSC | 180 | 20,052 | |||||||||
OMV AG | 911 | 47,209 | |||||||||
Origin Energy Ltd.2 | 3,546 | 18,659 | |||||||||
Pembina Pipeline Corp. | 220 | 7,276 | |||||||||
Polski Koncern Naftowy ORLEN SA | 1,594 | 48,100 | |||||||||
PTT Exploration & Production PCL | 3,599 | 9,138 | |||||||||
PTT PCL | 9,562 | 104,149 | |||||||||
Repsol SA | 5,139 | 78,541 | |||||||||
| | Shares | | Value | ||||||||
Royal Dutch Shell PLC, Class A | 10,543 | $ | 278,690 | ||||||||
Royal Dutch Shell PLC, Class B | 8,812 | 236,081 | |||||||||
Suncor Energy, Inc. | 1,374 | 40,087 | |||||||||
Thai Oil PCL | 7,806 | 18,153 | |||||||||
TransCanada Corp. | 493 | 23,467 | |||||||||
United Tractors Tbk PT | 3,765 | 7,755 | |||||||||
Woodside Petroleum Ltd. | 383 | 8,775 | |||||||||
Total Energy | 1,434,680 | ||||||||||
Food & Staples Retailing—5.8% | |||||||||||
Jeronimo Martins SGPS SA | 1,795 | 34,988 | |||||||||
President Chain Store Corp. | 1,750 | 15,734 | |||||||||
Wal-Mart Stores, Inc. | 12,500 | 946,000 | |||||||||
Whole Foods Market, Inc. | 1,009 | 42,489 | |||||||||
Woolworths Ltd. | 4,784 | 93,721 | |||||||||
Total Food & Staples Retailing | 1,132,932 | ||||||||||
Food, Beverage & Tobacco—3.1% | |||||||||||
Archer-Daniels-Midland Co. | 2,046 | 84,663 | |||||||||
Barry Callebaut AG2 | 11 | 15,139 | |||||||||
British American Tobacco PLC | 605 | 41,132 | |||||||||
Bunge Ltd. | 1,168 | 87,133 | |||||||||
Cia Cervecerias Unidas SA | 403 | 5,278 | |||||||||
Coca-Cola Amatil Ltd. | 1,275 | 9,027 | |||||||||
Coca-Cola HBC AG2 | 524 | 15,369 | |||||||||
Conagra Brands, Inc. | 511 | 18,273 | |||||||||
Ingredion, Inc. | 110 | 13,113 | |||||||||
ITC Ltd. | 4,066 | 20,359 | |||||||||
Kirin Holdings Co. Ltd. | 1,969 | 40,112 | |||||||||
Kraft Heinz Co. (The) | 639 | 54,724 | |||||||||
M Dias Branco SA | 227 | 3,378 | |||||||||
Marine Harvest ASA2 | 473 | 8,069 | |||||||||
McCormick & Co., Inc. | 82 | 7,996 | |||||||||
Nestle India Ltd. | 31 | 3,231 | |||||||||
Orkla ASA | 964 | 9,765 | |||||||||
PepsiCo, Inc. | 1,183 | 136,625 | |||||||||
Pernod Ricard SA | 155 | 20,728 | |||||||||
PT Indofood CBP Sukses Makmur Tbk | 8,464 | 5,589 | |||||||||
Standard Foods Corp. | 781 | 2,098 | |||||||||
Tate & Lyle PLC | 766 | 6,587 | |||||||||
Tiger Brands Ltd. | 175 | 4,914 | |||||||||
Treasury Wine Estates Ltd. | 435 | 4,391 | |||||||||
Total Food, Beverage & Tobacco | 617,693 | ||||||||||
Health Care Equipment & Services—1.3% | |||||||||||
Align Technology, Inc.2 | 11 | 1,651 | |||||||||
Becton Dickinson and Co. | 149 | 29,071 | |||||||||
Cochlear Ltd. | 18 | 2,146 | |||||||||
Coloplast A/S, Class B | 46 | 3,839 | |||||||||
Cooper Cos., Inc. (The) | 21 | 5,028 | |||||||||
Hoya Corp. | 189 | 9,812 | |||||||||
Humana, Inc. | 513 | 123,438 | |||||||||
IDEXX Laboratories, Inc.2 | 25 | 4,035 | |||||||||
Quest Diagnostics, Inc. | 151 | 16,785 | |||||||||
Ramsay Health Care Ltd. | 286 | 16,146 | |||||||||
ResMed, Inc.1 | 55 | 4,283 | |||||||||
Shanghai Pharmaceuticals Holding Co. Ltd., Class H | 3,940 | 11,734 | |||||||||
Sonic Healthcare Ltd. | 496 | 9,215 | |||||||||
Sonova Holding AG1 | 30 | 4,878 | |||||||||
| | Shares | | Value | ||||||||
Health Care Equipment & Services (continued) | |||||||||||
Straumann Holding AG | 4 | $ | 2,278 | ||||||||
Varian Medical Systems, Inc.2 | 72 | 7,430 | |||||||||
VCA, Inc.2 | 60 | 5,539 | |||||||||
Total Health Care Equipment & Services | 257,308 | ||||||||||
Household & Personal Products—1.6% | |||||||||||
Dabur India Ltd. | 657 | 2,969 | |||||||||
Henkel AG & Co KGaA | 218 | 26,331 | |||||||||
Lion Corp. | 391 | 8,094 | |||||||||
Natura Cosmeticos SA | 512 | 3,972 | |||||||||
Procter & Gamble Co. (The) | 1,600 | 139,440 | |||||||||
Unilever NV | 1,377 | 75,888 | |||||||||
Unilever PLC | 1,048 | 56,562 | |||||||||
Total Household & Personal Products | 313,256 | ||||||||||
Insurance—4.8% | |||||||||||
Allianz SE | 902 | 177,361 | |||||||||
CNP Assurances | 3,470 | 77,789 | |||||||||
Insurance Australia Group Ltd. | 2,687 | 13,974 | |||||||||
Manulife Financial Corp. | 2,574 | 48,182 | |||||||||
Mapfre SA1 | 13,335 | 46,510 | |||||||||
Marsh & McLennan Cos., Inc. | 375 | 29,235 | |||||||||
MS&AD Insurance Group Holdings, Inc. | 3,311 | 111,211 | |||||||||
Progressive Corp. (The) | 1,186 | 52,291 | |||||||||
RSA Insurance Group PLC | 2,267 | 18,125 | |||||||||
Sanlam Ltd. | 2,917 | 14,426 | |||||||||
Sompo Holdings, Inc. | 1,817 | 70,167 | |||||||||
Sun Life Financial, Inc. | 743 | 26,523 | |||||||||
Suncorp Group Ltd. | 2,228 | 25,327 | |||||||||
T&D Holdings, Inc. | 2,262 | 34,415 | |||||||||
Tokio Marine Holdings, Inc. | 2,372 | 98,186 | |||||||||
Zurich Insurance Group AG | 327 | 95,302 | |||||||||
Total Insurance | 939,024 | ||||||||||
Materials—6.9% | |||||||||||
Akzo Nobel NV | 407 | 35,321 | |||||||||
Anglo American PLC2 | 3,761 | 50,026 | |||||||||
Antofagasta PLC | 778 | 8,080 | |||||||||
Arkema SA | 165 | 17,583 | |||||||||
Asahi Kasei Corp. | 3,862 | 41,504 | |||||||||
Asian Paints Ltd. | 327 | 5,580 | |||||||||
Avery Dennison Corp. | 155 | 13,697 | |||||||||
Axalta Coating Systems Ltd2 | 291 | 9,324 | |||||||||
Ball Corp. | 543 | 22,920 | |||||||||
BASF SE | 1,470 | 135,956 | |||||||||
BHP Billiton PLC | 1,928 | 29,451 | |||||||||
BlueScope Steel Ltd. | 1,990 | 20,164 | |||||||||
Boliden AB | 361 | 9,840 | |||||||||
Cemex SAB de CV2 | 34,436 | 32,439 | |||||||||
CRH PLC | 1,803 | 63,697 | |||||||||
Duratex SA | 1,009 | 2,488 | |||||||||
E.I. du Pont de Nemours & Co. | 693 | 55,932 | |||||||||
Ecolab, Inc. | 221 | 29,338 | |||||||||
Fresnillo PLC | 204 | 3,938 | |||||||||
Hitachi Chemical Co. Ltd. | 388 | 11,568 | |||||||||
Hitachi Metals Ltd. | 1,389 | 19,309 | |||||||||
Hyosung Corp. | 171 | 25,034 | |||||||||
Imerys SA | 112 | 9,727 | |||||||||
| | Shares | | Value | ||||||||
International Flavors & Fragrances, Inc. | 50 | $ | 6,750 | ||||||||
JSR Corp. | 454 | 7,827 | |||||||||
Kansai Paint Co. Ltd. | 318 | 7,316 | |||||||||
Koninklijke DSM NV | 267 | 19,380 | |||||||||
Kuraray Co. Ltd. | 545 | 9,885 | |||||||||
LafargeHolcim Ltd.1,2 | 1,063 | 60,939 | |||||||||
Linde AG | 220 | 41,603 | |||||||||
Mitsubishi Chemical Holdings Corp. | 9,306 | 77,034 | |||||||||
Mitsui Chemicals, Inc. | 4,874 | 25,810 | |||||||||
Mondi Ltd. | 147 | 3,805 | |||||||||
Mondi PLC | 467 | 12,217 | |||||||||
Nitto Denko Corp. | 193 | 15,871 | |||||||||
Norsk Hydro ASA | 3,804 | 21,017 | |||||||||
Orica Ltd. | 592 | 9,391 | |||||||||
Praxair, Inc. | 174 | 23,064 | |||||||||
PTT Global Chemical PCL | 10,762 | 21,701 | |||||||||
Sherwin-Williams Co. (The) | 83 | 29,130 | |||||||||
Shin-Etsu Chemical Co. Ltd. | 278 | 25,200 | |||||||||
Siam Cement PCL (The) | 1,769 | 26,246 | |||||||||
Siam Cement PCL (The) | 1,769 | 26,246 | |||||||||
Sika AG | 6 | 38,594 | |||||||||
Solvay SA | 211 | 28,277 | |||||||||
South32 Ltd. | 6,840 | 14,061 | |||||||||
Stora Enso OYJ, Class R | 1,430 | 18,446 | |||||||||
Sumitomo Chemical Co. Ltd. | 7,354 | 42,281 | |||||||||
Teck Resources Ltd., Class B | 790 | 13,675 | |||||||||
Titan Cement Co. SA | 112 | 3,164 | |||||||||
Umicore SA | 380 | 26,395 | |||||||||
UPM-Kymmene OYJ | 835 | 23,771 | |||||||||
voestalpine AG | 578 | 26,897 | |||||||||
West Fraser Timber Co. Ltd. | 154 | 7,278 | |||||||||
Total Materials | 1,366,187 | ||||||||||
Media—1.2% | |||||||||||
Lagardere SCA | 593 | 18,701 | |||||||||
Naspers Ltd., Class N | 64 | 12,431 | |||||||||
Scripps Networks Interactive, Inc., Class A | 82 | 5,601 | |||||||||
Telenet Group Holding NV2 | 84 | 5,284 | |||||||||
Time Warner, Inc. | 648 | 65,066 | |||||||||
Walt Disney Co. (The) | 1,126 | 119,637 | |||||||||
Total Media | 226,720 | ||||||||||
Pharmaceuticals, Biotechnology & Life Sciences—1.6% | |||||||||||
Agilent Technologies, Inc. | 156 | 9,252 | |||||||||
CSL Ltd. | 144 | 15,246 | |||||||||
Genmab A/S2 | 5 | 1,065 | |||||||||
Grifols SA | 217 | 6,035 | |||||||||
H Lundbeck A/S | 93 | 5,213 | |||||||||
Ipsen SA | 24 | 3,281 | |||||||||
Lonza Group AG2 | 50 | 10,823 | |||||||||
Merck & Co., Inc. | 1,357 | 86,970 | |||||||||
Merck KGaA | 84 | 10,132 | |||||||||
Mettler-Toledo International, Inc.2 | 10 | 5,885 | |||||||||
Mitsubishi Tanabe Pharma Corp. | 366 | 8,456 | |||||||||
Orion OYJ, Class B | 20 | 1,275 | |||||||||
Piramal Enterprises Ltd.2 | 65 | 2,812 | |||||||||
PT Kalbe Farma Tbk | 27,971 | 3,410 | |||||||||
QIAGEN NV2 | 50 | 1,661 | |||||||||
Quintiles IMS Holdings, Inc.2 | 295 | 26,403 | |||||||||
| | Shares | | Value | ||||||||
Pharmaceuticals, Biotechnology & Life Sciences (continued) | |||||||||||
Sanofi | 863 | $ | 82,445 | ||||||||
Shanghai Fosun Pharmaceutical Group Co. Ltd., Class H2 | 201 | 779 | |||||||||
Sumitomo Dainippon Pharma Co. Ltd. | 531 | 7,245 | |||||||||
TESARO Inc.1,2 | 10 | 1,399 | |||||||||
Vertex Pharmaceuticals, Inc.2 | 31 | 3,995 | |||||||||
Waters Corp.2 | 28 | 5,148 | |||||||||
Zoetis, Inc. | 169 | 10,542 | |||||||||
Total Pharmaceuticals, Biotechnology & Life Sciences | 309,472 | ||||||||||
Real Estate—0.9% | |||||||||||
Alexandria Real Estate Equities, Inc. | 13 | 1,566 | |||||||||
American Tower Corp. | 92 | 12,173 | |||||||||
Ascendas Real Estate Investment Trust | 706 | 1,338 | |||||||||
Azrieli Group Ltd. | 18 | 1,001 | |||||||||
CapitaLand Commercial Trust | 388 | 468 | |||||||||
CapitaLand Ltd. | 3,289 | 8,361 | |||||||||
CBRE Group, Inc., Class A2 | 855 | 31,122 | |||||||||
Central Pattana PCL | 916 | 1,867 | |||||||||
City Developments Ltd. | 811 | 6,320 | |||||||||
Deutsche Wohnen AG | 67 | 2,559 | |||||||||
Dexus Property Group | 152 | 1,105 | |||||||||
Duke Realty Corp. | 71 | 1,985 | |||||||||
Equinix, Inc. | 21 | 9,012 | |||||||||
Global Logistic Properties Ltd. | 912 | 1,894 | |||||||||
Goodman Group | 429 | 2,590 | |||||||||
Growthpoint Properties Ltd. | 924 | 1,726 | |||||||||
Hang Lung Group Ltd. | 935 | 3,869 | |||||||||
Hang Lung Properties Ltd. | 1,473 | 3,680 | |||||||||
Host Hotels & Resorts, Inc. | 670 | 12,241 | |||||||||
Hyprop Investments Ltd. | 49 | 437 | |||||||||
Hysan Development Co. Ltd. | 218 | 1,040 | |||||||||
LendLease Group | 2,246 | 28,685 | |||||||||
Liberty Property Trust | 40 | 1,628 | |||||||||
Link REIT | 343 | 2,610 | |||||||||
Mirvac Group | 2,557 | 4,178 | |||||||||
Multiplan Empreendimentos Imobiliarios SA | 35 | 690 | |||||||||
Prologis, Inc. | 96 | 5,629 | |||||||||
SBA Communications Corp., Class A2 | 26 | 3,507 | |||||||||
SM Prime Holdings, Inc. | 6,114 | 3,998 | |||||||||
Stockland | 1,180 | 3,964 | |||||||||
Swire Properties Ltd. | 1,423 | 4,694 | |||||||||
UOL Group Ltd. | 460 | 2,553 | |||||||||
Weyerhaeuser Co. | 443 | 14,841 | |||||||||
Total Real Estate | 183,331 | ||||||||||
Retailing—2.6% | |||||||||||
Best Buy Co., Inc. | 1,476 | 84,619 | |||||||||
Canadian Tire Corp. Ltd., Class A | 165 | 18,747 | |||||||||
Foot Locker, Inc. | 293 | 14,439 | |||||||||
Foschini Group Ltd. (The) | 418 | 4,380 | |||||||||
Home Depot, Inc. (The) | 1,344 | 206,170 | |||||||||
Home Product Center PCL | 13,114 | 3,706 | |||||||||
Hotai Motor Co. Ltd. | 1,022 | 12,800 | |||||||||
Imperial Holdings Ltd. | 1,505 | 18,493 | |||||||||
| | Shares | | Value | ||||||||
Industria de Diseno Textil SA | 1,406 | $ | 53,897 | ||||||||
Jardine Cycle & Carriage Ltd. | 1,080 | 34,788 | |||||||||
Lojas Renner SA | 513 | 4,239 | |||||||||
Nitori Holdings Co. Ltd. | 65 | 8,701 | |||||||||
Priceline Group, Inc. (The)2 | 15 | 28,058 | |||||||||
Tiffany & Co. | 103 | 9,669 | |||||||||
Zalando SE2,3 | 184 | 8,397 | |||||||||
Total Retailing | 511,103 | ||||||||||
Semiconductors & Semiconductor Equipment—1.9% | |||||||||||
Advanced Semiconductor Engineering, Inc. | 16,588 | 21,294 | |||||||||
Analog Devices, Inc. | 128 | 9,958 | |||||||||
Applied Materials, Inc. | 585 | 24,166 | |||||||||
ASM Pacific Technology Ltd. | 285 | 3,852 | |||||||||
ASML Holding NV | 119 | 15,486 | |||||||||
Infineon Technologies AG | 705 | 14,864 | |||||||||
Intel Corp. | 3,674 | 123,961 | |||||||||
Lam Research Corp. | 86 | 12,163 | |||||||||
NVIDIA Corp. | 104 | 15,034 | |||||||||
Siliconware Precision Industries Co. Ltd.2 | 3,789 | 6,122 | |||||||||
Skyworks Solutions, Inc. | 62 | 5,949 | |||||||||
STMicroelectronics NV | 944 | 13,534 | |||||||||
Taiwan Semiconductor Manufacturing Co. Ltd. | 10,262 | 70,336 | |||||||||
Texas Instruments, Inc. | 359 | 27,618 | |||||||||
Tokyo Electron Ltd. | 92 | 12,413 | |||||||||
Vanguard International Semiconductor Corp.2 | 979 | 1,931 | |||||||||
Total Semiconductors & Semiconductor Equipment | 378,681 | ||||||||||
Software & Services—5.4% | |||||||||||
Accenture PLC, Class A | 639 | 79,032 | |||||||||
Adobe Systems, Inc.2 | 94 | 13,295 | |||||||||
Alphabet, Inc., Class A2 | 90 | 83,671 | |||||||||
Alphabet, Inc., Class C2 | 107 | 97,234 | |||||||||
Amadeus IT Group SA, Class A | 190 | 11,344 | |||||||||
ANSYS, Inc.2 | 17 | 2,069 | |||||||||
Atos SE | 200 | 28,035 | |||||||||
Autodesk, Inc.2 | 33 | 3,327 | |||||||||
Automatic Data Processing, Inc. | 264 | 27,049 | |||||||||
CA, Inc. | 287 | 9,893 | |||||||||
Cadence Design Systems, Inc.2 | 116 | 3,885 | |||||||||
Citrix Systems, Inc.2 | 67 | 5,332 | |||||||||
Computershare Ltd. | 425 | 4,610 | |||||||||
Dassault Systemes SE | 73 | 6,535 | |||||||||
Fujitsu Ltd. | 12,317 | 90,744 | |||||||||
International Business Machines Corp. | 1,164 | 179,058 | |||||||||
Intuit, Inc. | 73 | 9,695 | |||||||||
Jack Henry & Associates, Inc. | 29 | 3,012 | |||||||||
Konami Holdings Corp. | 96 | 5,331 | |||||||||
Microsoft Corp. | 2,722 | 187,627 | |||||||||
Nintendo Co. Ltd. | 34 | 11,402 | |||||||||
Oracle Corp. | 1,833 | 91,907 | |||||||||
Oracle Corp. Japan | 49 | 3,179 | |||||||||
PayPal Holdings, Inc.2 | 471 | 25,279 | |||||||||
Red Hat, Inc.2 | 58 | 5,554 | |||||||||
salesforce.com, Inc.2 | 202 | 17,493 | |||||||||
| | Shares | | Value | ||||||||
Software & Services (continued) | |||||||||||
SAP SE | 514 | $ | 53,612 | ||||||||
Shopify, Inc.2 | 10 | 867 | |||||||||
Symantec Corp. | 285 | 8,051 | |||||||||
VMware Inc, Class A1,2 | 35 | 3,060 | |||||||||
Workday, Inc., Class A2 | 14 | 1,358 | |||||||||
Total Software & Services | 1,072,540 | ||||||||||
Technology Hardware & Equipment—8.4% | |||||||||||
AAC Technologies Holdings, Inc. | 386 | 4,826 | |||||||||
Acer, Inc.2 | 31,605 | 16,571 | |||||||||
Apple, Inc. | 3,177 | 457,552 | |||||||||
Arista Networks, Inc.2 | 17 | 2,546 | |||||||||
AU Optronics Corp. | 61,369 | 28,042 | |||||||||
BlackBerry Ltd.2 | 274 | 2,734 | |||||||||
Cisco Systems, Inc. | 3,430 | 107,359 | |||||||||
CommScope Holding Co., Inc.2 | 302 | 11,485 | |||||||||
Corning, Inc. | 666 | 20,013 | |||||||||
Delta Electronics, Inc. | 2,857 | 15,637 | |||||||||
F5 Networks, Inc.2 | 35 | 4,447 | |||||||||
Flex Ltd.2 | 3,090 | 50,398 | |||||||||
Hewlett Packard Enterprise Co. | 3,835 | 63,623 | |||||||||
Hitachi High-Technologies Corp. | 318 | 12,340 | |||||||||
HP, Inc. | 5,739 | 100,318 | |||||||||
Keyence Corp. | 19 | 8,343 | |||||||||
Kyocera Corp. | 498 | 28,836 | |||||||||
LG Display Co. Ltd. | 1,809 | 58,658 | |||||||||
LG Innotek Co. Ltd. | 91 | 13,123 | |||||||||
Lite-On Technology Corp. | 10,389 | 17,076 | |||||||||
Micro-Star International Co. Ltd. | 3,171 | 7,370 | |||||||||
Motorola Solutions, Inc. | 161 | 13,965 | |||||||||
Omron Corp. | 382 | 16,574 | |||||||||
Samsung Electro-Mechanics Co. Ltd. | 166 | 14,799 | |||||||||
Samsung Electronics Co. Ltd. | 210 | 436,280 | |||||||||
Samsung SDI Co. Ltd. | 60 | 8,994 | |||||||||
Seiko Epson Corp. | 1,095 | 24,354 | |||||||||
TE Connectivity Ltd. | 352 | 27,695 | |||||||||
Trimble, Inc.2 | 143 | 5,101 | |||||||||
Wistron Corp. | 55,359 | 56,324 | |||||||||
Yaskawa Electric Corp. | 400 | 8,476 | |||||||||
Yokogawa Electric Corp. | 452 | 7,245 | |||||||||
Total Technology Hardware & Equipment | 1,651,104 | ||||||||||
Telecommunication Services—0.8% | |||||||||||
Advanced Info Service PCL | 1,864 | 9,740 | |||||||||
Far EasTone Telecommunications Co. Ltd. | 2,747 | 6,998 | |||||||||
Ooredoo Q.S.C. | 682 | 17,123 | |||||||||
Rogers Communications, Inc., Class B | 370 | 17,450 | |||||||||
SK Telecom Co. Ltd. | 175 | 40,685 | |||||||||
Taiwan Mobile Co. Ltd.2 | 2,891 | 10,882 | |||||||||
TDC A/S | 1,229 | 7,138 | |||||||||
Tele2 AB, Class B | 675 | 7,058 | |||||||||
Telekomunikasi Indonesia Persero Tbk PT | 59,771 | 20,271 | |||||||||
TELUS Corp. | 604 | 20,822 | |||||||||
Total Telecommunication Services | 158,167 | ||||||||||
| | Shares | | Value | ||||||||
Transportation—1.9% | |||||||||||
Abertis Infraestructuras SA | 693 | $ | 12,820 | ||||||||
Aena SA3 | 47 | 9,159 | |||||||||
Auckland International Airport Ltd. | 184 | 961 | |||||||||
Aurizon Holdings Ltd. | 1,419 | 5,834 | |||||||||
Canadian National Railway Co. | 248 | 20,093 | |||||||||
Deutsche Post AG | 3,901 | 146,026 | |||||||||
DSV A/S | 382 | 23,440 | |||||||||
Expeditors International of Washington, Inc. | 254 | 14,346 | |||||||||
Fraport AG Frankfurt Airport Services Worldwide | 71 | 6,260 | |||||||||
Localiza Rent a Car SA | 216 | 2,943 | |||||||||
Macquarie Infrastructure Corp. | 47 | 3,685 | |||||||||
MTR Corp. Ltd. | 2,201 | 12,391 | |||||||||
Norfolk Southern Corp. | 175 | 21,297 | |||||||||
SATS Ltd. | 718 | 2,665 | |||||||||
Southwest Airlines Co. | 756 | 46,978 | |||||||||
Union Pacific Corp. | 396 | 43,128 | |||||||||
Total Transportation | 372,026 | ||||||||||
Utilities—2.5% | |||||||||||
Ameren Corp. | 240 | 13,121 | |||||||||
American Water Works Co., Inc. | 94 | 7,327 | |||||||||
Atco Ltd./Canada, Class I | 152 | 5,935 | |||||||||
AusNet Services | 2,475 | 3,294 | |||||||||
China Longyuan Power Group Corp. Ltd., Class H | 3,885 | 2,827 | |||||||||
CLP Holdings Ltd. | 2,102 | 22,241 | |||||||||
CMS Energy Corp. | 302 | 13,968 | |||||||||
Consolidated Edison, Inc. | 331 | 26,751 | |||||||||
CPFL Energia SA | 1,632 | 13,058 | |||||||||
Dominion Energy, Inc. | 330 | 25,288 | |||||||||
DTE Energy Co. | 217 | 22,956 | |||||||||
Edison International | 328 | 25,646 | |||||||||
EDP—Energias do Brasil SA | 1,541 | 6,600 | |||||||||
Endesa SA | 1,874 | 43,111 | |||||||||
Enel Americas SA | 88,479 | 16,759 | |||||||||
Fortis, Inc./Canada | 437 | 15,337 | |||||||||
Huaneng Renewables Corp. Ltd., Class H | 3,825 | 1,181 | |||||||||
Inter RAO UES PJSC | 618,151 | 39,977 | |||||||||
Interconexion Electrica SA ESP | 1,078 | 4,707 | |||||||||
Korea Gas Corp.2 | 949 | 44,126 | |||||||||
Mercury NZ Ltd. | 1,043 | 2,535 | |||||||||
Meridian Energy Ltd. | 1,560 | 3,324 | |||||||||
NextEra Energy, Inc. | 258 | 36,154 | |||||||||
PG&E Corp. | 586 | 38,893 | |||||||||
Pinnacle West Capital Corp. | 88 | 7,494 | |||||||||
RusHydro PJSC | 1,015,498 | 13,642 | |||||||||
Sempra Energy | 196 | 22,099 | |||||||||
Xcel Energy, Inc. | 520 | 23,858 | |||||||||
Total Utilities | 502,209 | ||||||||||
Total Common Stocks (Cost $18,446,476) | 19,346,712 | ||||||||||
| | Shares | | Value | ||||||||
PREFERRED STOCKS—1.5% | |||||||||||
Banks—0.8% | |||||||||||
Itausa—Investimentos Itau SA | 704 | $ | 1,916 | ||||||||
Banco Bradesco SA | 10,145 | 86,194 | |||||||||
Itau Unibanco Holding SA | 6,519 | 72,308 | |||||||||
Total Banks | 160,418 | ||||||||||
Food & Staples Retailing—0.1% | |||||||||||
Cia Brasileira de Distribuicao2 | 818 | 16,085 | |||||||||
Food, Beverage & Tobacco—0.0%5 | |||||||||||
Embotelladora Andina SA | 729 | 3,081 | |||||||||
Household & Personal Products—0.1% | |||||||||||
Henkel AG & Co KGaA | 128 | 17,592 | |||||||||
Technology Hardware & Equipment—0.3% | |||||||||||
Samsung Electronics Co. Ltd. | 38 | 61,841 | |||||||||
Telecommunication Services—0.1% | |||||||||||
Telefonica Brasil SA | 1,351 | 18,308 | |||||||||
Utilities—0.1% | |||||||||||
Cia Energetica de Minas Gerais | 3,527 | 8,601 | |||||||||
Total Preferred Stocks (Cost $265,036) | 285,926 | ||||||||||
INVESTMENT OF CASH COLLATERAL FOR SECURITIES LOANED—0.9% | |||||||||||
Dreyfus Government Cash Management Money Market Fund—Institutional Shares, 0.91%6 (Cost $185,488) | 185,488 | 185,488 | |||||||||
Total Investments—100.6% (Cost $18,897,000) | 19,818,126 | ||||||||||
Liabilities in Excess of Other Assets—(0.6)% | (120,714 | ) | |||||||||
Net Assets—100.0% | $ | 19,697,412 | |||||||||
| 1 | All or a portion of the security was on loan. The aggregate value of the securities on loan was $180,260; total value of the collateral held by the fund was $189,655. The total value of the collateral includes non-cash U.S. Treasury securities collateral having a value of $4,167 (Note 4). |
| 2 | Non-income producing security. |
| 3 | Represents securities sold under Rule 144A, which are exempt from registration under the Securities Act of 1933, as amended. These securities have been determined to be liquid under guidelines established by the Board of Trustees. These securities amount to $56,417 or 0.29% of the Fund’s net assets at period end. |
| 4 | American Depositary Receipt. |
| 5 | Less than 0.05% |
| 6 | Rate shown represents annualized 7-day yield as of June 30, 2017. |
| Country | | Value | | % of Net Assets | ||||||
Australia | $ | 641,829 | 3.3 | % | ||||||
Austria | 112,238 | 0.6 | ||||||||
Belgium | 104,834 | 0.5 | ||||||||
Brazil | 526,421 | 2.7 | ||||||||
Canada | 541,267 | 2.8 | ||||||||
Chile | 84,643 | 0.4 | ||||||||
China | 78,343 | 0.4 | ||||||||
Colombia | 4,707 | 0.0 | 1 | |||||||
Denmark | 65,681 | 0.3 | ||||||||
Finland | 91,744 | 0.5 | ||||||||
France | 1,847,664 | 9.4 | ||||||||
Germany | 944,558 | 4.8 | ||||||||
Greece | 14,049 | 0.1 | ||||||||
Hong Kong | 100,827 | 0.5 | ||||||||
Hungary | 26,942 | 0.1 | ||||||||
India | 199,354 | 1.0 | ||||||||
Indonesia | 129,609 | 0.7 | ||||||||
Ireland | 63,697 | 0.3 | ||||||||
Israel | 32,429 | 0.2 | ||||||||
Japan | 2,161,467 | 11.0 | ||||||||
Macau | 4,437 | 0.0 | 1 | |||||||
Malaysia | 2,505 | 0.0 | 1 | |||||||
Mexico | 36,376 | 0.2 | ||||||||
Netherlands | 815,475 | 4.1 | ||||||||
New Zealand | 6,820 | 0.0 | 1 | |||||||
Norway | 57,209 | 0.3 | ||||||||
Philippines | 9,122 | 0.0 | 1 | |||||||
Poland | 57,935 | 0.3 | ||||||||
Portugal | 63,909 | 0.3 | ||||||||
Qatar | 17,123 | 0.1 | ||||||||
Russia | 73,671 | 0.4 | ||||||||
Singapore | 102,702 | 0.5 | ||||||||
South Africa | 105,727 | 0.5 | ||||||||
South Korea | 819,205 | 4.2 | ||||||||
Spain | 473,312 | 2.4 | ||||||||
Sweden | 259,375 | 1.3 | ||||||||
Switzerland | 478,296 | 2.4 | ||||||||
Taiwan | 334,311 | 1.7 | ||||||||
Thailand | 260,369 | 1.3 | ||||||||
United Arab Emirates | 22,969 | 0.1 | ||||||||
United Kingdom | 501,920 | 2.6 | ||||||||
United States | 7,543,055 | 38.3 | ||||||||
Total Investments | 19,818,126 | 100.6 | ||||||||
Liabilities in Excess of Other Assets | (120,714 | ) | (0.6 | ) | ||||||
Net Assets | $ | 19,697,412 | 100.0 | % | ||||||
| 1 | Less than 0.05% |
The accompanying notes are an integral part of these financial statements.
| | Oppenheimer Large Cap Revenue ETF | | Oppenheimer Mid Cap Revenue ETF | | Oppenheimer Small Cap Revenue ETF | | Oppenheimer Financials Sector Revenue ETF | |||||||||||
ASSETS: | ||||||||||||||||||
Investments at value (including securities on loan) (Note 3)1 | $ | 696,046,180 | $ | 378,799,082 | $ | 620,795,845 | $ | 33,659,058 | ||||||||||
Cash | 1,687,717 | 3,001,353 | — | 82,336 | ||||||||||||||
Cash held as collateral | — | — | 952,971 | — | ||||||||||||||
Receivables and other assets: | ||||||||||||||||||
Dividends | 645,598 | 244,050 | 365,283 | 17,879 | ||||||||||||||
Investment securities sold | — | — | 1,528,776 | — | ||||||||||||||
Securities lending income, net (Note 4) | 3,215 | 26,279 | 51,472 | — | ||||||||||||||
Reclaims | — | 145 | — | — | ||||||||||||||
Prepaid expenses | 5,601 | 3,959 | 5,062 | 2,056 | ||||||||||||||
Total Assets | 698,388,311 | 382,074,868 | 623,699,409 | 33,761,329 | ||||||||||||||
LIABILITIES: | ||||||||||||||||||
Payables and other liabilities: | ||||||||||||||||||
Due to custodian | — | — | 22,278 | — | ||||||||||||||
Payable to securities lending agent | — | — | 952,971 | — | ||||||||||||||
Investment of cash collateral for securities on loan (Note 4) | 8,514,926 | 49,958,289 | 67,073,312 | — | ||||||||||||||
Investment securities purchased | — | 2,440,409 | 575,186 | — | ||||||||||||||
Management fees (Note 9) | 163,729 | 82,817 | 131,747 | 22,798 | ||||||||||||||
BNY Fund Services fees | 78,171 | 4,541 | 80,903 | 5,447 | ||||||||||||||
Professional fees | 79,366 | 50,493 | 69,711 | 23,292 | ||||||||||||||
Trustee fees | 3,832 | 2,696 | 3,409 | 1,730 | ||||||||||||||
Other accrued expenses | 44,167 | 34,083 | 38,561 | 9,305 | ||||||||||||||
Total Liabilities | 8,884,191 | 52,573,328 | 68,948,078 | 62,572 | ||||||||||||||
NET ASSETS | $ | 689,504,120 | $ | 329,501,540 | $ | 554,751,331 | $ | 33,698,757 | ||||||||||
Composition of Net Assets: | ||||||||||||||||||
Paid-in capital | $ | 602,547,729 | $ | 300,099,298 | $ | 524,650,947 | $ | 27,096,326 | ||||||||||
Undistributed net investment income (loss) | 3,083,115 | — | 1,057,352 | 91,319 | ||||||||||||||
Accumulated undistributed net realized gain (loss) on investments and foreign currency transactions | (7,325,870 | ) | (10,001,333 | ) | (25,796,399 | ) | (147,873 | ) | ||||||||||
Net unrealized appreciation on investments and foreign currency translations | 91,199,146 | 39,403,575 | 54,839,431 | 6,658,985 | ||||||||||||||
NET ASSETS | $ | 689,504,120 | $ | 329,501,540 | $ | 554,751,331 | $ | 33,698,757 | ||||||||||
Shares outstanding (unlimited number of shares of beneficial interest authorized, without par value) | 14,851,400 | 5,851,400 | 8,401,400 | 550,000 | ||||||||||||||
Net asset value, offering and redemption price per share | $ | 46.43 | $ | 56.31 | $ | 66.03 | $ | 61.27 | ||||||||||
Investments at cost | $ | 604,847,034 | $ | 339,395,507 | $ | 565,956,414 | $ | 27,000,073 | ||||||||||
1 Includes value of securities on loan: | $ | 33,457,428 | $ | 99,887,453 | $ | 131,465,633 | $ | 97,512 | ||||||||||
The accompanying notes are an integral part of these financial statements.
| | Oppenheimer Ultra Dividend Revenue ETF | | Oppenheimer ESG Revenue ETF | | Oppenheimer Global ESG Revenue ETF | |||||||||
ASSETS: | ||||||||||||||
Investments at value (including securities on loan) (Note 3)1 | $ | 587,394,780 | $ | 22,718,617 | $ | 19,818,126 | ||||||||
Cash | 832,492 | 26,874 | — | |||||||||||
Foreign currency at value | — | — | 36,657 | |||||||||||
Receivables and other assets: | ||||||||||||||
Expense reimbursement due from Adviser | — | 771 | 199 | |||||||||||
Dividends | 1,622,159 | 25,559 | 21,558 | |||||||||||
Interest | — | — | 340 | |||||||||||
Investment securities sold | — | 60,676 | 47,308 | |||||||||||
Securities lending income, net (Note 4) | 40,871 | 125 | 26 | |||||||||||
Reclaims | — | — | 2,228 | |||||||||||
Prepaid expenses | 5,061 | 506 | 436 | |||||||||||
Total Assets | 589,895,363 | 22,833,128 | 19,926,878 | |||||||||||
LIABILITIES: | ||||||||||||||
Payables and other liabilities: | ||||||||||||||
Investment of cash collateral for securities on loan (Note 4) | 79,017,484 | 63,689 | 185,488 | |||||||||||
Due to custodian | — | — | 1,303 | |||||||||||
Management fees (Note 9) | 129,846 | — | — | |||||||||||
BNY Fund Services fees | 46,943 | 4,338 | 11,908 | |||||||||||
Professional fees | 44,439 | 19,875 | 21,112 | |||||||||||
Trustee fees | 1,990 | 1,787 | 1,760 | |||||||||||
Other accrued expenses | 24,333 | 7,426 | 7,895 | |||||||||||
Total Liabilities | 79,265,035 | 97,115 | 229,466 | |||||||||||
NET ASSETS | $ | 510,630,328 | $ | 22,736,013 | $ | 19,697,412 | ||||||||
Composition of Net Assets: | ||||||||||||||
Paid-in capital | $ | 538,828,227 | $ | 20,549,132 | $ | 18,682,859 | ||||||||
Undistributed net investment income | 5,302,588 | 114,271 | 119,836 | |||||||||||
Accumulated undistributed net realized gain on investments and foreign currency transactions | (14,270,165 | ) | (27,458 | ) | (26,159 | ) | ||||||||
Net unrealized appreciation (depreciation) on investments and foreign currency translations | (19,230,322 | ) | 2,100,068 | 920,876 | ||||||||||
NET ASSETS | $ | 510,630,328 | $ | 22,736,013 | $ | 19,697,412 | ||||||||
Shares outstanding (unlimited number of shares of beneficial interest authorized, without par value) | 15,100,000 | 800,000 | 700,000 | |||||||||||
Net asset value, offering and redemption price per share | $ | 33.82 | $ | 28.42 | $ | 28.14 | ||||||||
Investments at cost | $ | 606,625,102 | $ | 20,618,549 | $ | 18,897,000 | ||||||||
Foreign currency at cost | — | — | 37,020 | |||||||||||
1 Includes value of securities on loan: | $ | 131,529,845 | $ | 100,768 | $ | 180,260 | ||||||||
The accompanying notes are an integral part of these financial statements.
| | Oppenheimer Large Cap Revenue ETF | | Oppenheimer Mid Cap Revenue ETF | | Oppenheimer Small Cap Revenue ETF | | Oppenheimer Financials Sector Revenue ETF | |||||||||||
INVESTMENT INCOME: | ||||||||||||||||||
Dividend income | $ | 11,476,244 | $ | 3,576,974 | $ | 5,185,175 | $ | 468,410 | ||||||||||
Foreign withholding tax | — | (217 | ) | (501 | ) | — | ||||||||||||
Securities lending income, net (Note 4) | 24,814 | 140,260 | 315,114 | 131 | ||||||||||||||
Total Income | 11,501,058 | 3,717,017 | 5,499,788 | 468,541 | ||||||||||||||
EXPENSES: | ||||||||||||||||||
Management fees (Note 9) | 2,023,690 | 1,047,616 | 1,781,319 | 119,209 | ||||||||||||||
BNY Fund Services fees | 373,833 | 225,693 | 340,785 | 42,385 | ||||||||||||||
Professional fees | 160,741 | 93,249 | 139,375 | 30,884 | ||||||||||||||
Trustees fees | 14,215 | 9,569 | 13,265 | 5,819 | ||||||||||||||
NYSE Listing fees | 4,976 | 4,975 | 4,976 | 4,975 | ||||||||||||||
NYSE Calculating Agent expense | 2,979 | 2,979 | 2,979 | 2,979 | ||||||||||||||
Printing expense | 22,714 | 15,915 | 20,834 | 4,129 | ||||||||||||||
Other expenses | 17,051 | 9,621 | 14,825 | 4,429 | ||||||||||||||
Total Expenses | 2,620,199 | 1,409,617 | 2,318,358 | 214,809 | ||||||||||||||
Less expense waivers and reimbursements (Note 9) | (546,288 | ) | (336,480 | ) | (495,491 | ) | (85,003 | ) | ||||||||||
Net Expenses | 2,073,911 | 1,073,137 | 1,822,867 | 129,806 | ||||||||||||||
Net Investment Income | 9,427,147 | 2,643,880 | 3,676,921 | 338,735 | ||||||||||||||
NET REALIZED AND UNREALIZED GAIN (LOSS) ON INVESTMENTS: | ||||||||||||||||||
Net realized gain (loss) on investments | (758,387 | ) | (2,642,181 | ) | (5,758,162 | ) | 387,910 | |||||||||||
Net realized gain on in-kind redemptions | 16,848,979 | 3,595,757 | 18,063,578 | 858,866 | ||||||||||||||
Total net realized gain | 16,090,592 | 953,576 | 12,305,416 | 1,246,776 | ||||||||||||||
Net change in unrealized appreciation on investments | 46,205,932 | 36,243,241 | 46,935,829 | 5,411,247 | ||||||||||||||
Net realized and unrealized gain on investments | 62,296,524 | 37,196,817 | 59,241,245 | 6,658,023 | ||||||||||||||
Net Increase in Net Assets Resulting From Operations | $ | 71,723,671 | $ | 39,840,697 | $ | 62,918,166 | $ | 6,996,758 | ||||||||||
The accompanying notes are an integral part of these financial statements.
| | Oppenheimer Ultra Dividend Revenue ETF | | Oppenheimer ESG Revenue ETF1 | | Oppenheimer Global ESG Revenue ETF1 | |||||||||
INVESTMENT INCOME: | ||||||||||||||
Dividend income | $ | 16,215,747 | $ | 382,751 | $ | 349,742 | ||||||||
Foreign withholding tax | — | — | (31,224 | ) | ||||||||||
Securities lending income, net (Note 4) | 105,056 | 323 | 354 | |||||||||||
Total Income | 16,320,803 | 383,074 | 318,872 | |||||||||||
EXPENSES: | ||||||||||||||
Management fees (Note 9) | 1,332,271 | 58,139 | 55,253 | |||||||||||
BNY Fund Services fees | 252,681 | 14,066 | 45,540 | |||||||||||
Professional fees | 87,721 | 23,200 | 24,201 | |||||||||||
Trustees fees | 11,692 | 6,106 | 6,025 | |||||||||||
NYSE Listing fees | 4,976 | 3,678 | 3,678 | |||||||||||
NYSE Calculating Agent expense | 2,979 | 2,043 | 2,043 | |||||||||||
Printing expense | 6,173 | 4,793 | 4,793 | |||||||||||
Other expenses | 23,940 | 2,525 | 3,765 | |||||||||||
Total Expenses | 1,722,433 | 114,550 | 145,298 | |||||||||||
Less expense waivers and reimbursements (Note 9) | (369,998 | ) | (56,411 | ) | (90,045 | ) | ||||||||
Net Expenses | 1,352,435 | 58,139 | 55,253 | |||||||||||
Net Investment Income | 14,968,368 | 324,935 | 263,619 | |||||||||||
NET REALIZED AND UNREALIZED GAIN (LOSS) ON INVESTMENTS: | ||||||||||||||
Net realized gain (loss) on investments | (16,091,151 | ) | 25,325 | 34,499 | 2 | |||||||||
Net realized (loss) on investments in affiliates | — | (1,397 | ) | — | ||||||||||
Net realized gain on in-kind redemptions | 43,382,782 | 476,369 | 1,128,396 | |||||||||||
Net realized gain on in-kind redemptions in affiliates | — | 9,973 | — | |||||||||||
Net realized gain on foreign currency transactions | — | — | 964 | |||||||||||
Total net realized gain | 27,291,631 | 510,270 | 1,163,859 | |||||||||||
Net change in unrealized appreciation (depreciation) on investments | (25,153,831 | ) | 2,100,068 | 921,126 | ||||||||||
Net change in unrealized (depreciation) on foreign currency translations | — | — | (250 | ) | ||||||||||
Net change in unrealized appreciation (depreciation) | (25,153,831 | ) | 2,100,068 | 920,876 | ||||||||||
Net realized and unrealized gain on investments | 2,137,800 | 2,610,338 | 2,084,735 | |||||||||||
Net Increase in Net Assets Resulting From Operations | $ | 17,106,168 | $ | 2,935,273 | $ | 2,348,354 | ||||||||
The accompanying notes are an integral part of these financial statements.
| | Oppenheimer Large Cap Revenue ETF | | Oppenheimer Mid Cap Revenue ETF | |||||||||||||||
| | Year Ended June 30, 2017 | | Year Ended June 30, 2016 | | Year Ended June 30, 2017 | | Year Ended June 30, 2016 | |||||||||||
OPERATIONS: | ||||||||||||||||||
Net investment income | $ | 9,427,147 | $ | 6,372,289 | $ | 2,643,880 | $ | 1,974,899 | ||||||||||
Net realized gain on investments and in-kind redemptions | 16,090,592 | 18,970,873 | 953,576 | 16,355,307 | ||||||||||||||
Net change in unrealized appreciation (depreciation) on investments | 46,205,932 | (21,568,369 | ) | 36,243,241 | (29,452,236 | ) | ||||||||||||
Net increase (decrease) in net assets resulting from operations | 71,723,671 | 3,774,793 | 39,840,697 | (11,122,030 | ) | |||||||||||||
DISTRIBUTIONS TO SHAREHOLDERS FROM: | ||||||||||||||||||
Net investment income | (7,952,583 | ) | (6,322,234 | ) | (2,968,690 | ) | (2,125,196 | ) | ||||||||||
Realized gains | — | (234,442 | ) | — | — | |||||||||||||
Total distributions to shareholders | (7,952,583 | ) | (6,556,676 | ) | (2,968,690 | ) | (2,125,196 | ) | ||||||||||
SHAREHOLDER TRANSACTIONS: | ||||||||||||||||||
Proceeds from shares sold | 300,285,997 | 95,604,911 | 119,978,743 | 73,461,233 | ||||||||||||||
Cost of shares redeemed | (41,231,932 | ) | (69,825,570 | ) | (13,601,246 | ) | (116,054,019 | ) | ||||||||||
Net increase (decrease) in net assets resulting from shareholder transactions | 259,054,065 | 25,779,341 | 106,377,497 | (42,592,786 | ) | |||||||||||||
Increase (Decrease) in net assets | 322,825,153 | 22,997,458 | 143,249,504 | (55,840,012 | ) | |||||||||||||
NET ASSETS: | ||||||||||||||||||
Beginning of period/year | 366,678,967 | 343,681,509 | 186,252,036 | 242,092,048 | ||||||||||||||
End of period/year | $ | 689,504,120 | $ | 366,678,967 | $ | 329,501,540 | $ | 186,252,036 | ||||||||||
Undistributed net investment income (loss) included in net assets at end of period/year | $ | 3,083,115 | $ | 1,618,581 | $ | — | $ | 320,982 | ||||||||||
CHANGES IN SHARES OUTSTANDING: | ||||||||||||||||||
Shares outstanding, beginning of period/year | 9,001,400 | 8,401,400 | 3,901,400 | 4,901,400 | ||||||||||||||
Shares sold | 6,800,000 | 2,400,000 | 2,200,000 | 1,550,000 | ||||||||||||||
Shares redeemed | (950,000 | ) | (1,800,000 | ) | (250,000 | ) | (2,550,000 | ) | ||||||||||
Shares outstanding, end of period/year | 14,851,400 | 9,001,400 | 5,851,400 | 3,901,400 | ||||||||||||||
The accompanying notes are an integral part of these financial statements.
| | Oppenheimer Small Cap Revenue ETF | | Oppenheimer Financials Sector Revenue ETF | |||||||||||||||
| | Year Ended June 30, 2017 | | Year Ended June 30, 2016 | | Year Ended June 30, 2017 | | Year Ended June 30, 2016 | |||||||||||
OPERATIONS: | ||||||||||||||||||
Net investment income | $ | 3,676,921 | $ | 2,151,661 | $ | 338,735 | $ | 351,216 | ||||||||||
Net realized gain (loss) on investments and in-kind redemptions | 12,305,416 | 7,656,054 | 1,246,776 | 1,465,095 | ||||||||||||||
Net change in unrealized appreciation (depreciation) on investments | 46,935,829 | (35,767,955 | ) | 5,411,247 | (4,166,644 | ) | ||||||||||||
Net increase (decrease) in net assets resulting from operations | 62,918,166 | (25,960,240 | ) | 6,996,758 | (2,350,333 | ) | ||||||||||||
DISTRIBUTIONS TO SHAREHOLDERS FROM: | ||||||||||||||||||
Net investment income | (2,898,715 | ) | (2,283,532 | ) | (316,657 | ) | (372,325 | ) | ||||||||||
Realized gains | — | — | — | — | ||||||||||||||
Total distributions to shareholders | (2,898,715 | ) | (2,283,532 | ) | (316,657 | ) | (372,325 | ) | ||||||||||
SHAREHOLDER TRANSACTIONS: | ||||||||||||||||||
Proceeds from shares sold | 259,063,313 | 68,728,756 | 11,915,035 | — | ||||||||||||||
Cost of shares redeemed | (61,752,661 | ) | (117,579,966 | ) | (5,420,264 | ) | (9,266,481 | ) | ||||||||||
Net increase (decrease) in net assets resulting from shareholder transactions | 197,310,652 | (48,851,210 | ) | 6,494,771 | (9,266,481 | ) | ||||||||||||
Increase (Decrease) in net assets | 257,330,103 | (77,094,982 | ) | 13,174,872 | (11,989,139 | ) | ||||||||||||
NET ASSETS: | ||||||||||||||||||
Beginning of period/year | 297,421,228 | 374,516,210 | 20,523,885 | 32,513,024 | ||||||||||||||
End of period/year | $ | 554,751,331 | $ | 297,421,228 | $ | 33,698,757 | $ | 20,523,885 | ||||||||||
Undistributed net investment income (loss) included in net assets at end of period/year | $ | 1,057,352 | $ | 283,462 | $ | 91,319 | $ | 69,241 | ||||||||||
CHANGES IN SHARES OUTSTANDING: | ||||||||||||||||||
Shares outstanding, beginning of period/year | 5,401,400 | 6,451,400 | 450,000 | 650,000 | ||||||||||||||
Shares sold | 3,950,000 | 1,300,000 | 200,000 | — | ||||||||||||||
Shares redeemed | (950,000 | ) | (2,350,000 | ) | (100,000 | ) | (200,000 | ) | ||||||||||
Shares outstanding, end of period/year | 8,401,400 | 5,401,400 | 550,000 | 450,000 | ||||||||||||||
The accompanying notes are an integral part of these financial statements.
| | Oppenheimer Ultra Dividend Revenue ETF | | Oppenheimer ESG Revenue ETF | | Oppenheimer Global ESG Revenue ETF | |||||||||||||
| | Year Ended June 30, 2017 | | Year Ended June 30, 2016 | | For the Period October 31, 20161 to June 30, 2017 | | For the Period October 31, 20161 to June 30, 2017 | |||||||||||
OPERATIONS: | ||||||||||||||||||
Net investment income | $ | 14,968,368 | $ | 2,813,311 | $ | 324,935 | $ | 263,619 | ||||||||||
Net realized gain (loss) on investments, in-kind redemptions and foreign currency transactions | 27,291,631 | (2,382,122 | ) | 510,270 | 1,163,859 | |||||||||||||
Net change in unrealized appreciation (depreciation) on investments and foreign currency translations | (25,153,831 | ) | 8,519,386 | 2,100,068 | 920,876 | |||||||||||||
Net increase in net assets resulting from operations | 17,106,168 | 8,950,575 | 2,935,273 | 2,348,354 | ||||||||||||||
DISTRIBUTIONS TO SHAREHOLDERS FROM: | ||||||||||||||||||
Net investment income | (10,429,096 | ) | (2,568,683 | ) | (210,664 | ) | (148,617 | ) | ||||||||||
Realized gains | (191,360 | ) | — | — | — | |||||||||||||
Total distributions to shareholders | (10,620,456 | ) | (2,568,683 | ) | (210,664 | ) | (148,617 | ) | ||||||||||
SHAREHOLDER TRANSACTIONS: | ||||||||||||||||||
Proceeds from shares sold | 834,239,866 | 101,389,903 | 27,111,168 | 28,495,808 | ||||||||||||||
Cost of shares redeemed | (440,424,864 | ) | (63,696,211 | ) | (7,099,764 | ) | (10,998,133 | ) | ||||||||||
Net increase in net assets resulting from shareholder transactions | 393,815,002 | 37,693,692 | 20,011,404 | 17,497,675 | ||||||||||||||
Increase in net assets | 400,300,714 | 44,075,584 | 22,736,013 | 19,697,412 | ||||||||||||||
NET ASSETS: | ||||||||||||||||||
Beginning of period/year | 110,329,614 | 66,254,030 | — | — | ||||||||||||||
End of period/year | $ | 510,630,328 | $ | 110,329,614 | $ | 22,736,013 | $ | 19,697,412 | ||||||||||
Undistributed net investment income (loss) included in net assets at end of period/year | $ | 5,302,588 | $ | 763,360 | $ | 114,271 | $ | 119,836 | ||||||||||
CHANGES IN SHARES OUTSTANDING: | ||||||||||||||||||
Shares outstanding, beginning of period/year | 3,500,000 | 2,300,000 | — | — | ||||||||||||||
Shares sold | 24,400,000 | 3,350,000 | 1,050,000 | 1,100,000 | ||||||||||||||
Shares redeemed | (12,800,000 | ) | (2,150,000 | ) | (250,000 | ) | (400,000 | ) | ||||||||||
Shares outstanding, end of period/year | 15,100,000 | 3,500,000 | 800,000 | 700,000 | ||||||||||||||
The accompanying notes are an integral part of these financial statements.
Financial Highlights
| Year Ended June 30, | ||||||||||||||||||||||
| | 2017 | | 2016 | | 2015 | | 2014 | | 2013 | |||||||||||||
Per Share Operating Performance: | ||||||||||||||||||||||
Net asset value, beginning of year | $ | 40.74 | $ | 40.91 | $ | 38.56 | $ | 31.38 | $ | 25.20 | ||||||||||||
Net investment income1 | 0.83 | 0.76 | 0.68 | 0.59 | 0.54 | 2 | ||||||||||||||||
Net realized and unrealized gain (loss) on investments | 5.60 | (0.14 | ) | 2.35 | 7.13 | 6.17 | ||||||||||||||||
Total gain from investment operations | 6.43 | 0.62 | 3.03 | 7.72 | 6.71 | |||||||||||||||||
Less Distributions from: | ||||||||||||||||||||||
Net investment income | (0.74 | ) | (0.76 | ) | (0.64 | ) | (0.54 | ) | (0.53 | ) | ||||||||||||
Realized gains | — | (0.03 | ) | (0.04 | ) | — | — | |||||||||||||||
Total distributions | (0.74 | ) | (0.79 | ) | (0.68 | ) | (0.54 | ) | (0.53 | ) | ||||||||||||
Net asset value, end of year | $ | 46.43 | $ | 40.74 | $ | 40.91 | $ | 38.56 | $ | 31.38 | ||||||||||||
Total Return at Net Asset Value3 | 15.96 | % | 1.55 | % | 7.91 | % | 24.84 | % | 26.98 | % | ||||||||||||
Total Return at Market Value3 | 15.98 | % | 1.61 | % | 7.85 | % | 25.10 | % | 28.86 | % | ||||||||||||
Ratios/Supplemental Data: | ||||||||||||||||||||||
Net assets, end of year (000’s omitted) | $ | 689,504 | $ | 366,679 | $ | 343,682 | $ | 242,970 | $ | 182,025 | ||||||||||||
Average Net Assets (000’s omitted) | 499,579 | 331,701 | 296,609 | 201,920 | 163,192 | |||||||||||||||||
Ratio to average net assets of: | ||||||||||||||||||||||
Expenses, net of expense waivers and reimbursements | 0.42 | % | 0.49 | % | 0.49 | % | 0.49 | % | 0.49 | % | ||||||||||||
Expenses, prior to expense waivers and reimbursements | 0.52 | % | 0.62 | % | 0.61 | % | 0.68 | % | 0.71 | % | ||||||||||||
Net investment income, net of waivers and reimbursements | 1.89 | % | 1.92 | % | 1.70 | % | 1.66 | % | 1.93 | %2 | ||||||||||||
Portfolio turnover rate4 | 15.22 | % | 14.13 | % | 18.79 | % | 11.98 | % | 23.47 | % | ||||||||||||
| 1 | Based on average daily shares outstanding. |
| 2 | For the year ended June 30, 2013, net investment income per share reflects a special dividend which amounted to $0.02 per share. Excluding the special dividend, the ratio of net investment income to average net assets would have been 1.85%. |
| 3 | Net asset value total return is calculated assuming an initial investment made at the net asset value at the beginning of the year, reinvestment of all dividends and distributions at net asset value during the year and redemption on the last day of the year at net asset value. Market value total return is calculated assuming an initial investment made at the market value at the beginning of the year, reinvestment of all dividends and distributions at market value during the year, and sale at the market value on the last day of the year. Market value is determined by trading that occurs on the NYSE Arca, and may be greater or less than net asset value, depending on the 4 p.m. mean of the bid and offer prices for a share of the Fund. Total return calculated for a period of less than one year is not annualized. The total return would have been lower if certain expenses had not been reimbursed/waived by the Adviser. |
| 4 | Portfolio turnover rate is not annualized and excludes the value of portfolio securities received or delivered as a result of in-kind creations or redemptions of the Fund’s capital shares. |
The accompanying notes are an integral part of these financial statements.
Financial Highlights — continued
| Year Ended June 30, | ||||||||||||||||||||||
| | 2017 | | 2016 | | 2015 | | 2014 | | 2013 | |||||||||||||
Per Share Operating Performance: | ||||||||||||||||||||||
Net asset value, beginning of year | $ | 47.74 | $ | 49.39 | $ | 47.75 | $ | 38.00 | $ | 29.88 | ||||||||||||
Net investment income1 | 0.56 | 0.44 | 0.41 | 0.34 | 0.39 | 2 | ||||||||||||||||
Net realized and unrealized gain (loss) on investments | 8.68 | (1.63 | ) | 1.79 | 9.97 | 8.18 | ||||||||||||||||
Total gain (loss) from investment operations | 9.24 | (1.19 | ) | 2.20 | 10.31 | 8.57 | ||||||||||||||||
Less Distributions from: | ||||||||||||||||||||||
Net investment income | (0.67 | ) | (0.46 | ) | (0.39 | ) | (0.34 | ) | (0.31 | ) | ||||||||||||
Realized gains | — | — | (0.17 | ) | (0.22 | ) | (0.14 | ) | ||||||||||||||
Total distributions | (0.67 | ) | (0.46 | ) | (0.56 | ) | (0.56 | ) | (0.45 | ) | ||||||||||||
Net asset value, end of year | $ | 56.31 | $ | 47.74 | $ | 49.39 | $ | 47.75 | $ | 38.00 | ||||||||||||
Total Return at Net Asset Value3 | 19.46 | % | (2.39 | )% | 4.63 | % | 27.28 | % | 28.95 | % | ||||||||||||
Total Return at Market Value3 | 19.45 | % | (2.38 | )% | 5.05 | % | 27.14 | % | 29.25 | % | ||||||||||||
Ratios/Supplemental Data: | ||||||||||||||||||||||
Net assets, end of year (000’s omitted) | $ | 329,502 | $ | 186,252 | $ | 242,092 | $ | 205,404 | $ | 123,565 | ||||||||||||
Average Net Assets (000’s omitted) | 250,624 | 210,021 | 223,753 | 167,424 | 115,203 | |||||||||||||||||
Ratio to average net assets of: | ||||||||||||||||||||||
Expenses, net of expense waivers and reimbursements | 0.43 | % | 0.54 | % | 0.54 | % | 0.54 | % | 0.54 | % | ||||||||||||
Expenses, prior to expense waivers and reimbursements | 0.56 | % | 0.72 | % | 0.68 | % | 0.73 | % | 0.80 | % | ||||||||||||
Net investment income, net of waivers and reimbursements | 1.05 | % | 0.94 | % | 0.84 | % | 0.78 | % | 1.17 | %2 | ||||||||||||
Portfolio turnover rate4 | 46.40 | % | 22.23 | % | 13.93 | % | 24.19 | % | 44.42 | % | ||||||||||||
| 1 | Based on average daily shares outstanding. |
| 2 | For the year ended June 30, 2013, net investment income per share reflects a special dividend which amounted to $0.05 per share. Excluding the special dividend, the ratio of net investment income to average net assets would have been 1.03%. |
| 3 | Net asset value total return is calculated assuming an initial investment made at the net asset value at the beginning of the year, reinvestment of all dividends and distributions at net asset value during the year and redemption on the last day of the year at net asset value. Market value total return is calculated assuming an initial investment made at the market value at the beginning of the year, reinvestment of all dividends and distributions at market value during the year, and sale at the market value on the last day of the year. Market value is determined by trading that occurs on the NYSE Arca, and may be greater or less than net asset value, depending on the 4 p.m. mean of the bid and offer prices for a share of the Fund. Total return calculated for a period of less than one year is not annualized. The total return would have been lower if certain expenses had not been reimbursed/waived by the Adviser. |
| 4 | Portfolio turnover rate is not annualized and excludes the value of portfolio securities received or delivered as a result of in-kind creations or redemptions of the Fund’s capital shares. |
The accompanying notes are an integral part of these financial statements.
Financial Highlights — continued
| Year Ended June 30, | ||||||||||||||||||||||
| | 2017 | | 2016 | | 2015 | | 2014 | | 2013 | |||||||||||||
Per Share Operating Performance: | ||||||||||||||||||||||
Net asset value, beginning of year | $ | 55.06 | $ | 58.05 | $ | 56.25 | $ | 43.82 | $ | 33.71 | ||||||||||||
Net investment income1 | 0.55 | 0.36 | 0.39 | 0.26 | 0.38 | 2 | ||||||||||||||||
Net realized and unrealized gain (loss) on investments | 10.85 | (2.97 | ) | 1.89 | 12.81 | 10.22 | ||||||||||||||||
Total gain (loss) from investment operations | 11.40 | (2.61 | ) | 2.28 | 13.07 | 10.60 | ||||||||||||||||
Less Distributions from: | ||||||||||||||||||||||
Net investment income | (0.43 | ) | (0.38 | ) | (0.38 | ) | (0.52 | ) | (0.35 | ) | ||||||||||||
Realized gains | — | — | (0.10 | ) | (0.12 | ) | (0.14 | ) | ||||||||||||||
Total distributions | (0.43 | ) | (0.38 | ) | (0.48 | ) | (0.64 | ) | (0.49 | ) | ||||||||||||
Net asset value, end of year | $ | 66.03 | $ | 55.06 | $ | 58.05 | $ | 56.25 | $ | 43.82 | ||||||||||||
Total Return at Net Asset Value3 | 20.75 | % | (4.46 | )% | 4.06 | % | 30.03 | % | 31.74 | % | ||||||||||||
Total Return at Market Value3 | 20.76 | % | (4.51 | )% | 4.24 | % | 30.38 | % | 31.53 | % | ||||||||||||
Ratios/Supplemental Data: | ||||||||||||||||||||||
Net assets, end of year (000’s omitted) | $ | 554,751 | $ | 297,421 | $ | 374,516 | $ | 292,584 | $ | 153,441 | ||||||||||||
Average Net Assets (000’s omitted) | 427,452 | 317,271 | 322,714 | 232,088 | 129,239 | |||||||||||||||||
Ratio to average net assets of: | ||||||||||||||||||||||
Expenses, net of expense waivers and reimbursements | 0.43 | % | 0.54 | % | 0.54 | % | 0.54 | % | 0.54 | % | ||||||||||||
Expenses, prior to expense waivers and reimbursements | 0.54 | % | 0.68 | % | 0.67 | % | 0.72 | % | 0.79 | % | ||||||||||||
Net investment income, net of waivers and reimbursements | 0.86 | % | 0.68 | % | 0.69 | % | 0.51 | % | 0.99 | %2 | ||||||||||||
Portfolio turnover rate4 | 46.33 | % | 44.07 | % | 21.21 | % | 10.69 | % | 39.39 | % | ||||||||||||
| 1 | Based on average daily shares outstanding. |
| 2 | For the year ended June 30, 2013, net investment income per share reflects a special dividend which amounted to $0.12 per share. Excluding the special dividend, the ratio of net investment income to average net assets would have been 0.69%. |
| 3 | Net asset value total return is calculated assuming an initial investment made at the net asset value at the beginning of the year, reinvestment of all dividends and distributions at net asset value during the year and redemption on the last day of the year at net asset value. Market value total return is calculated assuming an initial investment made at the market value at the beginning of the year, reinvestment of all dividends and distributions at market value during the year, and sale at the market value on the last day of the year. Market value is determined by trading that occurs on the NYSE Arca, and may be greater or less than net asset value, depending on the 4 p.m. mean of the bid and offer prices for a share of the Fund. Total return calculated for a period of less than one year is not annualized. The total return would have been lower if certain expenses had not been reimbursed/waived by the Adviser. |
| 4 | Portfolio turnover rate is not annualized and excludes the value of portfolio securities received or delivered as a result of in-kind creations or redemptions of the Fund’s capital shares. |
The accompanying notes are an integral part of these financial statements.
Financial Highlights — continued
| Year Ended June 30, | | ||||||||||||||||||||||
| | 2017 | | 2016 | | 2015 | | 2014 | | 2013 | ||||||||||||||
Per Share Operating Performance: | |||||||||||||||||||||||
Net asset value, beginning of year | $ | 45.61 | $ | 50.02 | $ | 46.54 | $ | 39.35 | $ | 27.62 | |||||||||||||
Net investment income1 | 0.70 | 0.66 | 0.54 | 0.45 | 0.38 | 2 | |||||||||||||||||
Net realized and unrealized gain (loss) on investments | 15.65 | (4.38 | ) | 3.44 | 7.17 | 11.71 | |||||||||||||||||
Total gain (loss) from investment operations | 16.35 | (3.72 | ) | 3.98 | 7.62 | 12.09 | |||||||||||||||||
Less Distributions from: | |||||||||||||||||||||||
Net investment income | (0.69 | ) | (0.69 | ) | (0.50 | ) | (0.43 | ) | (0.36 | ) | |||||||||||||
Net asset value, end of year | $ | 61.27 | $ | 45.61 | $ | 50.02 | $ | 46.54 | $ | 39.35 | |||||||||||||
Total Return at Net Asset Value3 | 36.14 | % | (7.49 | )% | 8.57 | % | 19.44 | % | 44.09 | % | |||||||||||||
Total Return at Market Value3 | 36.20 | % | (7.58 | )% | 8.66 | % | 19.32 | % | 44.24 | % | |||||||||||||
Ratios/Supplemental Data: | |||||||||||||||||||||||
Net assets, end of year (000’s omitted) | $ | 33,699 | $ | 20,524 | $ | 32,513 | $ | 32,577 | $ | 29,509 | |||||||||||||
Average Net Assets (000’s omitted) | 26,491 | 25,009 | 33,925 | 31,390 | 12,464 | ||||||||||||||||||
Ratio to average net assets of: | |||||||||||||||||||||||
Expenses, net of expense waivers and reimbursements | 0.49 | % | 0.49 | % | 0.49 | % | 0.49 | % | 0.49 | % | |||||||||||||
Expenses, prior to expense waivers and reimbursements | 0.81 | % | 0.91 | % | 0.77 | % | 0.80 | % | 1.03 | % | |||||||||||||
Net investment income, net of waivers and reimbursements | 1.28 | % | 1.40 | % | 1.11 | % | 1.03 | % | 1.12 | %2 | |||||||||||||
Portfolio turnover rate4 | 17.70 | % | 20.42 | % | 12.79 | % | 13.27 | % | 20.20 | % | |||||||||||||
| 1 | Based on average daily shares outstanding. |
| 2 | For the year ended June 30, 2013, net investment income per share reflects a special dividend which amounted to $0.004 per share. Excluding the special dividend, the ratio of net investment income to average net assets would have been 1.11%. |
| 3 | Net asset value total return is calculated assuming an initial investment made at the net asset value at the beginning of the year, reinvestment of all dividends and distributions at net asset value during the year and redemption on the last day of the year at net asset value. Market value total return is calculated assuming an initial investment made at the market value at the beginning of the year, reinvestment of all dividends and distributions at market value during the year, and sale at the market value on the last day of the year. Market value is determined by trading that occurs on the NYSE Arca, and may be greater or less than net asset value, depending on the 4 p.m. mean of the bid and offer prices for a share of the Fund. Total return calculated for a period of less than one year is not annualized. The total return would have been lower if certain expenses had not been reimbursed/waived by the Adviser. |
| 4 | Portfolio turnover rate is not annualized and excludes the value of portfolio securities received or delivered as a result of in-kind creations or redemptions of the Fund’s capital shares. |
The accompanying notes are an integral part of these financial statements.
Financial Highlights — continued
| Year Ended June 30, | For the Period October 1, 20131 Through June 30, 2014 | |||||||||||||||||
| | 2017 | | 2016 | | 2015 | |||||||||||||
Per Share Operating Performance: | ||||||||||||||||||
Net asset value, beginning of period/year | $ | 31.52 | $ | 28.81 | $ | 28.72 | $ | 24.87 | ||||||||||
Net investment income2 | 1.50 | 1.21 | 1.20 | 0.91 | ||||||||||||||
Net realized and unrealized gain on investments | 1.96 | 2.66 | 0.03 | 3 | 3.39 | |||||||||||||
Total gain from investment operations | 3.46 | 3.87 | 1.23 | 4.30 | ||||||||||||||
Less Distributions from: | ||||||||||||||||||
Net investment income | (1.14 | ) | (1.16 | ) | (1.11 | ) | (0.45 | ) | ||||||||||
Realized gains | (0.02 | ) | — | (0.03 | ) | — | ||||||||||||
Total distributions | (1.16 | ) | (1.16 | ) | (1.14 | ) | (0.45 | ) | ||||||||||
Net asset value, end of period/year | $ | 33.82 | $ | 31.52 | $ | 28.81 | $ | 28.72 | ||||||||||
Total Return at Net Asset Value4 | 11.10 | % | 13.91 | % | 4.30 | % | 17.46 | % | ||||||||||
Total Return at Market Value4 | 11.18 | % | 13.90 | % | 4.19 | % | 17.58 | % | ||||||||||
Ratios/Supplemental Data: | ||||||||||||||||||
Net assets, end of period/year (000’s omitted) | $ | 510,630 | $ | 110,330 | $ | 66,254 | $ | 22,976 | ||||||||||
Average Net Assets (000’s omitted) | 333,853 | 67,190 | 47,799 | 10,504 | ||||||||||||||
Ratio to average net assets of: | ||||||||||||||||||
Expenses, net of expense waivers and reimbursements | 0.41 | % | 0.49 | % | 0.49 | % | 0.49 | % 5 | ||||||||||
Expenses, prior to expense waivers and reimbursements | 0.52 | % | 0.75 | % | 0.72 | % | 1.18 | %5 | ||||||||||
Net investment income, net of waivers and reimbursements | 4.48 | % | 4.19 | % | 4.06 | % | 4.57 | %5 | ||||||||||
Portfolio turnover rate6 | 80.57 | % | 208.25 | % | 51.83 | % | 37.43 | % | ||||||||||
| 1 | Commencement of operations. |
| 2 | Based on average daily shares outstanding. |
| 3 | The amount shown for a share outstanding throughout the period may not correlate with the Statements of Operations for the period due to timing of sales and repurchase of creation unit Fund shares in relation to income earned and/or fluctuating value of the investments of the Fund. |
| 4 | Net asset value total return is calculated assuming an initial investment made at the net asset value at the beginning of the year, reinvestment of all dividends and distributions at net asset value during the year and redemption on the last day of the year at net asset value. Market value total return is calculated assuming an initial investment made at the market value at the beginning of the year, reinvestment of all dividends and distributions at market value during the year, and sale at the market value on the last day of the year. Market value is determined by trading that occurs on the NYSE Arca, and may be greater or less than net asset value, depending on the 4 p.m. mean of the bid and offer prices for a share of the Fund. Total return calculated for a period of less than one year is not annualized. The total return would have been lower if certain expenses had not been reimbursed/waived by the Adviser. |
| 5 | Annualized for periods less than one full year. |
| 6 | Portfolio turnover rate is not annualized and excludes the value of portfolio securities received or delivered as a result of in-kind creations or redemptions of the Fund’s capital shares. |
The accompanying notes are an integral part of these financial statements.
Financial Highlights — continued
| | For the Period October 31, 20161 Through June 30, 2017 | |||||
Per Share Operating Performance: | ||||||
Net asset value, beginning of period | $ | 25.00 | ||||
Net investment income2 | 0.40 | |||||
Net realized and unrealized gain on investments | 3.28 | |||||
Total gain from investment operations | 3.68 | |||||
Less Distributions from: | ||||||
Net investment income | (0.26 | ) | ||||
Net asset value, end of period | $ | 28.42 | ||||
Total Return at Net Asset Value3 | 14.78 | % | ||||
Total Return at Market Value3 | 14.82 | % | ||||
Ratios/Supplemental Data: | ||||||
Net assets, end of period (000’s omitted) | $ | 22,736 | ||||
Average Net Assets (000’s omitted) | 21,828 | |||||
Ratio to average net assets of: | ||||||
Expenses, net of expense waivers and reimbursements | 0.40 | %4 | ||||
Expenses, prior to expense waivers and reimbursements | 0.78 | %4 | ||||
Net investment income, net of waivers and reimbursements | 2.22 | %4 | ||||
Portfolio turnover rate5 | 42.11 | % | ||||
| 1 | Commencement of operations. |
| 2 | Based on average daily shares outstanding. |
| 3 | Net asset value total return is calculated assuming an initial investment made at the net asset value at the beginning of the period, reinvestment of all dividends and distributions at net asset value during the period and redemption on the last day of the period at net asset value. Market value total return is calculated assuming an initial investment made at the market value at the beginning of the period, reinvestment of all dividends and distributions at market value during the period, and sale at the market value on the last day of the period. Market value is determined by trading that occurs on the NYSE Arca, and may be greater or less than net asset value, depending on the 4 p.m. mean of the bid and offer prices for a share of the Fund. Total return calculated for a period of less than one year is not annualized. The total return would have been lower if certain expenses had not been reimbursed/waived by the Adviser. |
| 4 | Annualized for periods less than one full year. |
| 5 | Portfolio turnover rate is not annualized and excludes the value of portfolio securities received or delivered as a result of in-kind creations or redemptions of the Fund’s capital shares. |
The accompanying notes are an integral part of these financial statements.
Financial Highlights — continued
| | For the Period October 31, 20161 Through June 30, 2017 | |||||
Per Share Operating Performance: | ||||||
Net asset value, beginning of period | $ | 25.00 | ||||
Net investment income2 | 0.38 | |||||
Net realized and unrealized gain on investments | 2.97 | |||||
Total gain from investment operations | 3.35 | |||||
Less Distributions from: | ||||||
Net investment income | (0.21 | ) | ||||
Net asset value, end of period | $ | 28.14 | ||||
Total Return at Net Asset Value3 | 13.49 | % | ||||
Total Return at Market Value3 | 14.97 | % | ||||
Ratios/Supplemental Data: | ||||||
Net assets, end of period (000’s omitted) | $ | 19,697 | ||||
Average Net Assets (000’s omitted) | 18,443 | |||||
Ratio to average net assets of: | ||||||
Expenses, net of expense waivers and reimbursements | 0.45 | %4 | ||||
Expenses, prior to expense waivers and reimbursements | 1.18 | %4 | ||||
Net investment income, net of waivers and reimbursements | 2.15 | %4 | ||||
Portfolio turnover rate5 | 78.36 | % | ||||
| 1 | Commencement of operations. |
| 2 | Based on average daily shares outstanding. |
| 3 | Net asset value total return is calculated assuming an initial investment made at the net asset value at the beginning of the year, reinvestment of all dividends and distributions at net asset value during the year and redemption on the last day of the year at net asset value. Market value total return is calculated assuming an initial investment made at the market value at the beginning of the year, reinvestment of all dividends and distributions at market value during the year, and sale at the market value on the last day of the year. Market value is determined by trading that occurs on the NYSE Arca, and may be greater or less than net asset value, depending on the 4 p.m. mean of the bid and offer prices for a share of the Fund. Total return calculated for a period of less than one year is not annualized. The total return would have been lower if certain expenses had not been reimbursed/waived by the Adviser. |
| 4 | Annualized for periods less than one full year. |
| 5 | Portfolio turnover rate is not annualized and excludes the value of portfolio securities received or delivered as a result of in-kind creations or redemptions of the Fund’s capital shares. |
The accompanying notes are an integral part of these financial statements.
| 1. | Organization |
| 2. | Significant Accounting Policies |
| Fund | | Undistributed Net Investment Income | | Undistributed Long-Term Gain | | Capital Loss Carryforwards | | Post-October Capital Losses3 | | Net Unrealized Appreciation (Depreciation) Based on cost of Securities and Other Investments for Federal Income Tax Purposes | ||||||||||||
Oppenheimer Large Cap Revenue ETF | $ | 3,072,117 | $ | — | $ | (1,351,069 | )1 | $ | — | $ | 85,235,343 | |||||||||||
Oppenheimer Mid Cap Revenue ETF | — | — | (6,993,346 | )1 | — | 36,395,588 | ||||||||||||||||
Oppenheimer Small Cap Revenue ETF | 1,051,924 | — | (13,376,930 | )1 | — | 42,425,390 | ||||||||||||||||
Oppenheimer Financials Sector Revenue ETF | 91,319 | — | (37,292 | )2 | — | 6,548,404 | ||||||||||||||||
Oppenheimer Ultra Dividend Revenue ETF | 5,302,588 | — | (518,242 | )1 | — | (32,982,245 | ) | |||||||||||||||
Oppenheimer ESG Revenue ETF | 114,271 | — | — | — | 2,072,610 | |||||||||||||||||
Oppenheimer Global ESG Revenue ETF | 129,714 | — | — | — | 884,839 | |||||||||||||||||
| 1 | During the reporting period, the Funds did not utilize any capital loss carryforward. |
| 2 | During the reporting period, the Fund utilized $404,192 of capital loss carryforward to offset capital gains realized in that fiscal year. |
| 3 | At period end, the Fund elected to treat all, or a portion of, post-October losses as arising on the first day of the following taxable year. |
| Fund | | Capital Loss Available Through 2019 | | Short Term Post-Effective No Expiration | | Long Term Post-Effective No Expiration | | Total | ||||||||||
Oppenheimer Large Cap Revenue ETF | $ | — | $ | — | $ | 1,351,069 | $ | 1,351,069 | ||||||||||
Oppenheimer Mid Cap Revenue ETF | — | 3,643,472 | 3,349,874 | $ | 6,993,346 | |||||||||||||
Oppenheimer Small Cap Revenue ETF | — | 211,174 | 13,165,756 | $ | 13,376,930 | |||||||||||||
Oppenheimer Financials Sector Revenue ETF | 37,292 | — | — | $ | 37,292 | |||||||||||||
Oppenheimer Ultra Dividend Revenue ETF | — | 518,242 | — | $ | 518,242 | |||||||||||||
Oppenheimer ESG Revenue ETF | — | — | — | $ | — | |||||||||||||
Oppenheimer Global ESG Revenue ETF | — | — | — | $ | — | |||||||||||||
| Fund | | Increase (Decrease) to Paid-in-Capital | | Increase (Decrease) to Accumulated Net Investment Income | | Increase (Decrease) to Accumulated Net Realized Gain/Loss on Investments | ||||||||
Oppenheimer Large Cap Revenue ETF | $ | 16,157,824 | $ | (10,030 | ) | $ | (16,147,794 | ) | ||||||
Oppenheimer Mid Cap Revenue ETF | 3,457,204 | 3,828 | (3,461,032 | ) | ||||||||||
Oppenheimer Small Cap Revenue ETF | 17,755,599 | (4,316 | ) | (17,751,283 | ) | |||||||||
Oppenheimer Financials Sector Revenue ETF | 845,368 | — | (845,368 | ) | ||||||||||
Oppenheimer Ultra Dividend Revenue ETF | 38,988,802 | (44 | ) | (38,988,758 | ) | |||||||||
Oppenheimer ESG Revenue ETF | 537,728 | — | (537,728 | ) | ||||||||||
Oppenheimer Global ESG Revenue ETF | 1,185,184 | 4,834 | (1,190,018 | ) | ||||||||||
| Period/Year Ended June 30, 2017 | Year Ended June 30, 2016 | ||||||||||||||||||||||||||
| Fund | | Distributions Paid from Ordinary Income | | Distributions Paid from Long-Term Capital Gains | | Total | | Distributions Paid from Ordinary Income | | Distributions Paid from Long-Term Capital Gains | | Total | |||||||||||||||
Oppenheimer Large Cap Revenue ETF | $ | 7,952,583 | $ | — | $ | 7,952,583 | $ | 6,322,311 | $ | 234,365 | $ | 6,556,676 | |||||||||||||||
Oppenheimer Mid Cap Revenue ETF | 2,968,690 | — | 2,968,690 | 2,125,196 | — | 2,125,196 | |||||||||||||||||||||
Oppenheimer Small Cap Revenue ETF | 2,898,715 | — | 2,898,715 | 2,283,532 | — | 2,283,532 | |||||||||||||||||||||
Oppenheimer Financials Sector Revenue ETF | 316,657 | — | 316,657 | 372,325 | — | 372,325 | |||||||||||||||||||||
Oppenheimer Ultra Dividend Revenue ETF | 10,429,140 | 191,316 | 10,620,456 | 2,568,683 | — | 2,568,683 | |||||||||||||||||||||
Oppenheimer ESG Revenue ETF | 210,664 | — | 210,664 | — | — | — | |||||||||||||||||||||
Oppenheimer Global ESG Revenue ETF | 148,617 | — | 148,617 | — | — | — | |||||||||||||||||||||
| Fund | | Federal Tax Cost of Securities | | Gross Unrealized Appreciation | | Gross Unrealized (Depreciation) | | Net Unrealized Appreciation (Depreciation) | ||||||||||
Oppenheimer Large Cap Revenue ETF | $ | 610,810,837 | $ | 103,459,793 | $ | (18,224,450 | ) | $ | 85,235,343 | |||||||||
Oppenheimer Mid Cap Revenue ETF | 342,403,494 | 50,312,907 | (13,917,319 | ) | 36,395,588 | |||||||||||||
Oppenheimer Small Cap Revenue ETF | 578,370,455 | 87,961,140 | (45,535,750 | ) | 42,425,390 | |||||||||||||
Oppenheimer Financials Sector Revenue ETF | 27,110,654 | 6,710,292 | (161,888 | ) | 6,548,404 | |||||||||||||
Oppenheimer Ultra Dividend Revenue ETF | 620,377,025 | 9,423,892 | (42,406,137 | ) | (32,982,245 | ) | ||||||||||||
Oppenheimer ESG Revenue ETF | 20,646,007 | 2,399,575 | (326,965 | ) | 2,072,610 | |||||||||||||
Oppenheimer Global ESG Revenue ETF | 18,970,057 | 1,122,374 | (237,535 | ) | 884,839 | |||||||||||||
| 3. | Securities Valuation |
| (Level 1) | (Level 2) | (Level 3) | ||||||||||||||||||||||||||
| Fund | | Common Stock | | Preferred Stock | | Money Market Funds | | Common Stock | | Preferred Stock | | Common Stock | | Total | ||||||||||||||
Oppenheimer Large Cap Revenue ETF | $ | 687,531,254 | $ | — | $ | 8,514,926 | $ | — | $ | — | $ | — | $ | 696,046,180 | ||||||||||||||
Oppenheimer Mid Cap Revenue ETF | 328,840,793 | — | 49,958,289 | — | — | — | 378,799,082 | |||||||||||||||||||||
Oppenheimer Small Cap Revenue ETF | 553,722,533 | — | 67,073,312 | — | — | — | 620,795,845 | |||||||||||||||||||||
Oppenheimer Financials Sector Revenue ETF | 33,659,058 | — | — | — | — | — | 33,659,058 | |||||||||||||||||||||
Oppenheimer Ultra Dividend Revenue ETF | 508,377,296 | — | 79,017,484 | — | — | — | 587,394,780 | |||||||||||||||||||||
Oppenheimer ESG Revenue ETF | 22,654,928 | — | 63,689 | — | — | — | 22,718,617 | |||||||||||||||||||||
Oppenheimer Global ESG Revenue ETF | 19,346,712 | 285,926 | 185,488 | — | — | — | 19,818,126 | |||||||||||||||||||||
| 4. | Securities Lending |
| Overnight and Continuous | <30 Days | Between 30 & 90 days | >90 days | Total | ||||||||||||||||
Oppenheimer Large Cap Revenue ETF | ||||||||||||||||||||
Money Market Mutual Fund | 8,514,926 | — | — | — | 8,514,926 | |||||||||||||||
U.S. Government Securities | — | 313,687 | 618,645 | 24,772,797 | 25,705,129 | |||||||||||||||
Total | 8,514,926 | 313,687 | 618,645 | 24,772,797 | 34,220,055 | |||||||||||||||
Oppenheimer Mid Cap Revenue ETF | ||||||||||||||||||||
Money Market Mutual Fund | 49,958,289 | — | — | — | 49,958,289 | |||||||||||||||
U.S. Government Securities | — | 646,544 | 1,521,892 | 50,462,450 | 52,630,886 | |||||||||||||||
Total | 49,958,289 | 646,544 | 1,521,892 | 50,462,450 | 102,589,175 | |||||||||||||||
Oppenheimer Small Cap Revenue ETF | ||||||||||||||||||||
Money Market Mutual Fund | 67,073,312 | — | — | — | 67,073,312 | |||||||||||||||
U.S. Government Securities | — | 900,574 | 2,193,817 | 64,748,689 | 67,843,080 | |||||||||||||||
Total | 67,073,312 | 900,574 | 2,193,817 | 64,748,689 | 134,916,392 | |||||||||||||||
Oppenheimer Financials Sector Revenue ETF | ||||||||||||||||||||
Money Market Mutual Fund | — | — | — | — | — | |||||||||||||||
U.S. Government Securities | — | — | 3,857 | 95,683 | 99,540 | |||||||||||||||
Total | — | — | 3,857 | 95,683 | 99,540 | |||||||||||||||
Oppenheimer Ultra Dividend Revenue ETF | ||||||||||||||||||||
Money Market Mutual Fund | 79,017,484 | — | — | — | 79,017,484 | |||||||||||||||
U.S. Government Securities | — | 432,106 | 537,077 | 54,744,473 | 55,713,656 | |||||||||||||||
Total | 79,017,484 | 432,106 | 537,077 | 54,744,473 | 134,731,140 | |||||||||||||||
Oppenheimer ESG Revenue ETF | ||||||||||||||||||||
Money Market Mutual Fund | 63,689 | — | — | — | 63,689 | |||||||||||||||
U.S. Government Securities | — | 396 | 335 | 38,145 | 38,876 | |||||||||||||||
Total | 63,689 | 396 | 335 | 38,145 | 102,565 | |||||||||||||||
Oppenheimer Global ESG Revenue ETF | ||||||||||||||||||||
Money Market Mutual Fund | 185,488 | — | — | — | 185,488 | |||||||||||||||
U.S. Government Securities | — | 42 | 36 | 4,089 | 4,167 | |||||||||||||||
Total | 185,488 | 42 | 36 | 4,089 | 189,655 | |||||||||||||||
| Assets | Liabilities | |||||||||||||||||||||||||||
| Fund | Gross Amounts Presented in Statements of Assets and Liabilities | | Gross Amounts Not Offset in the Statements of Assets and Liabilities Cash Collateral Received* | | Gross Amounts Not Offset in the Statements of Assets and Liabilities Non-cash Collateral Received* | | Net Amount | | Gross Amounts Presented in Statements of Assets and Liabilities | | Gross Amounts Not Offset in the Statements of Assets and Liabilities Collateral Received | | Net Amount | |||||||||||||||
Oppenheimer Large Cap Revenue ETF | $ | 33,457,428 | $ | (7,752,299 | ) | $ | (25,705,129 | ) | $ | — | $ | — | $ | — | $ | — | ||||||||||||
Oppenheimer Mid Cap Revenue ETF | 99,887,453 | (47,256,567 | ) | (52,630,886 | ) | — | — | — | — | |||||||||||||||||||
Oppenheimer Small Cap Revenue ETF | 131,465,633 | (63,622,553 | ) | (67,843,080 | ) | — | — | — | — | |||||||||||||||||||
Oppenheimer Financials Sector Revenue ETF | 97,512 | — | (97,512 | ) | — | — | — | — | ||||||||||||||||||||
Oppenheimer Ultra Dividend Revenue ETF | 131,529,845 | (75,816,189 | ) | (55,713,656 | ) | — | — | — | — | |||||||||||||||||||
Oppenheimer ESG Revenue ETF | 100,768 | (61,892 | ) | (38,876 | ) | — | — | — | — | |||||||||||||||||||
Oppenheimer Global ESG Revenue ETF | 180,260 | (176,093 | ) | (4,167 | ) | — | — | — | — | |||||||||||||||||||
* | The amount of collateral presented is limited such that the net amount cannot be less than zero. |
| 5. | Investments and Risks |
| 6. | Market Risk Factors |
| 7. | Shares of Beneficial Interest |
| 8. | Purchases & Sales of Securities |
| Fund | | Purchases | | Sales | ||||||
Oppenheimer Large Cap Revenue ETF | $ | 100,529,381 | $ | 76,356,942 | ||||||
Oppenheimer Mid Cap Revenue ETF | 126,621,790 | 116,289,154 | ||||||||
Oppenheimer Small Cap Revenue ETF | 208,580,237 | 198,456,597 | ||||||||
Oppenheimer Financials Sector Revenue ETF | 4,674,106 | 6,157,280 | ||||||||
Oppenheimer Ultra Dividend Revenue ETF | 431,674,790 | 269,223,296 | ||||||||
Oppenheimer ESG Revenue ETF | 9,191,900 | 10,392,145 | ||||||||
Oppenheimer Global ESG Revenue ETF | 21,013,078 | 14,375,519 | ||||||||
| Fund | | Purchases | | Sales | ||||||
Oppenheimer Large Cap Revenue ETF | $ | 275,121,991 | $ | 39,725,128 | ||||||
Oppenheimer Mid Cap Revenue ETF | 106,098,292 | 9,411,246 | ||||||||
Oppenheimer Small Cap Revenue ETF | 238,185,862 | 50,178,807 | ||||||||
Oppenheimer Financials Sector Revenue ETF | 11,891,571 | 3,829,317 | ||||||||
Oppenheimer Ultra Dividend Revenue ETF | 663,840,782 | 428,993,327 | ||||||||
Oppenheimer ESG Revenue ETF | 27,056,367 | 5,808,777 | ||||||||
Oppenheimer Global ESG Revenue ETF | 21,273,261 | 10,359,993 | ||||||||
| 9. | Fees and Other Transactions with Affiliates |
| Fund | | Management Fees | | Expense Limit | ||||||
Oppenheimer Large Cap Revenue ETF | 0.45 | % | 0.49 | % | ||||||
Oppenheimer Mid Cap Revenue ETF | 0.50 | % | 0.54 | % | ||||||
Oppenheimer Small Cap Revenue ETF | 0.50 | % | 0.54 | % | ||||||
Oppenheimer Financials Sector Revenue ETF | 0.45 | % | 0.49 | % | ||||||
Oppenheimer Ultra Dividend Revenue ETF | 0.45 | % | 0.49 | % | ||||||
| Fund | | Management Fees | | Expense Limit | ||||||
Oppenheimer Large Cap Revenue ETF | 0.39 | % | 0.39 | % | ||||||
Oppenheimer Mid Cap Revenue ETF | 0.39 | % | 0.39 | % | ||||||
Oppenheimer Small Cap Revenue ETF | 0.39 | % | 0.39 | % | ||||||
Oppenheimer Financials Sector Revenue ETF | 0.45 | % | 0.49 | % | ||||||
Oppenheimer Ultra Dividend Revenue ETF | 0.39 | % | 0.39 | % | ||||||
Oppenheimer ESG Revenue ETF | 0.40 | % | 0.40 | % | ||||||
Oppenheimer Global ESG Revenue ETF | 0.45 | % | 0.45 | % | ||||||
| Fund: | | Expenses Reimbursed: | | Recoupment Balance: | | Recoupment Expiration: | ||||||
Oppenheimer Large Cap Revenue ETF | $ | 344,337 | $ | 344,337 | 6/30/2019 | |||||||
| 546,288 | 546,288 | 6/30/2020 | ||||||||||
Total | 890,625 | 890,625 | ||||||||||
Oppenheimer Mid Cap Revenue ETF | 281,135 | 281,135 | 6/30/2019 | |||||||||
| 336,480 | 336,480 | 6/30/2020 | ||||||||||
Total | 617,615 | 617,615 | ||||||||||
Oppenheimer Small Cap Revenue ETF | 350,636 | 350,636 | 6/30/2019 | |||||||||
| 495,491 | 495,491 | 6/30/2020 | ||||||||||
Total | 846,127 | 846,127 | ||||||||||
Oppenheimer Financials Sector Revenue ETF | 78,895 | 78,895 | 6/30/2019 | |||||||||
| 85,003 | 85,003 | 6/30/2020 | ||||||||||
Total | 163,898 | 163,898 | ||||||||||
Oppenheimer Ultra Dividend Revenue ETF | 132,110 | 132,110 | 6/30/2019 | |||||||||
| 369,998 | 369,998 | 6/30/2020 | ||||||||||
Total | 502,108 | 502,108 | ||||||||||
Oppenheimer ESG Revenue ETF | 56,411 | 56,411 | 6/30/2020 | |||||||||
Total | 56,411 | 56,411 | ||||||||||
Oppenheimer Global ESG Revenue ETF | 90,045 | 90,045 | 6/30/2020 | |||||||||
Total | 90,045 | 90,045 | ||||||||||
| 10. | Subsequent Event |

Cleveland, Ohio
August 25, 2017
| Independent Trustees | |
| Name, Position(s) Held with the Funds, Length of Service, Year of Birth | Principal Occupation(s) During the Past 5 Years; Other Trusteeships/Directorships Held; Number of Portfolios in the Funds Complex Currently Overseen |
INDEPENDENT TRUSTEES | The address of each Trustee in the chart below is 6803 S. Tucson Way, Centennial, Colorado 80112-3924. Each Trustee serves for an indefinite term, or until his or her resignation, retirement, death or removal. |
Robert J. Malone, Chairman of the Board of Trustees (since 2016) and Trustee (since 2015) Year of Birth: 1944 | Chairman—Colorado Market of MidFirst Bank (since January 2015); Chairman of the Board (2012 – 2016) and Director (August 2005 – January 2016) of Jones International University (educational organization); Trustee of the Gallagher Family Foundation (non-profit organization) (2000 – 2016); Chairman, Chief Executive Officer and Director of Steele Street Bank Trust (commercial banking) (August 2003 – January 2015); Director of Opera Colorado Foundation (non-profit organization) (2008 – 2012); Director of Colorado UpLIFT (charitable organization) (1986 – 2010); Director of Jones Knowledge, Inc. (2006 – 2010); Former Chairman of U.S. Bank-Colorado (subsidiary of U.S. Bancorp and formerly Colorado National Bank) (July 1996 – April 1999); Director of Commercial Assets, Inc. (real estate investment trust) (1993 – 2000); Director of U.S. Exploration, Inc. (oil and gas exploration) (1997 – February 2004); Chairman of the Board (1991 – 1994) and Trustee (1985 – 1994) of Regis University; and Chairman of the Board (1990 – 1991) and Member (1984 – 1999) of Young Presidents Organization. Oversees 42 portfolios in the OppenheimerFunds complex. Mr. Malone has served on the Boards of certain Oppenheimer funds since 2002, during which time he has become familiar with the Fund’s (and other Oppenheimer funds’) financial, accounting, regulatory and investment matters and has contributed to the Board’s deliberations. |
Andrew J. Donohue, Trustee (since 2017) Year of Birth: 1950 | Chief of Staff of the U.S. Securities and Exchange Commission (regulator) (June 2015 – February 2017); Managing Director and Investment Company General Counsel of Goldman Sachs (investment bank) (November 2012 – May 2015); Partner at Morgan Lewis & Bockius, LLP (law firm) (March 2011 – October 2012); Director of the Division of Investment Management of U.S. Securities and Exchange Commission (regulator) (May 2006 – November 2010); Global General Counsel of Merrill Lynch Investment Managers (investment firm) (May 2003 – May 2006); General Counsel (October 1991 – November 2001) and Executive Vice President (January 1993 – November 2001) of OppenheimerFunds, Inc. (investment firm) (June 1991 – November 2001). Oversees 42 portfolios in the OppenheimerFunds complex. Mr. Donohue has served on the Boards of certain Oppenheimer funds since 2017, during which time he has become familiar with the Fund’s (and other Oppenheimer funds’) financial, accounting, regulatory and investment matters and has contributed to the Board’s deliberations. |
| Independent Trustees — continued | |
| Name, Position(s) Held with the Funds, Length of Service, Year of Birth | Principal Occupation(s) During the Past 5 Years; Other Trusteeships/Directorships Held; Number of Portfolios in the Funds Complex Currently Overseen |
Jon S. Fossel, Trustee (since 2015) Year of Birth: 1942 | Chairman of the Board of Jack Creek Preserve Foundation (non-profit organization) (2005 – 2015); Director of Jack Creek Preserve Foundation (non-profit organization) (since March 2005); Chairman of the Board (2006 – December 2011) and Director (June 2002 – December 2011) of UNUMProvident (insurance company); Director of Northwestern Energy Corp. (public utility corporation) (November 2004 – December 2009); Director of P.R. Pharmaceuticals (October 1999 – October 2003); Director of Rocky Mountain Elk Foundation (non-profit organization) (February 1998 – February 2003 and February 2005 – February 2007); Chairman and Director (until October 1996) and President and Chief Executive Officer (until October 1995) of the OppenheimerFunds, Inc.; President, Chief Executive Officer and Director of the following: Oppenheimer Acquisition Corp. (“OAC”) (parent holding company of OppenheimerFunds, Inc.), Shareholders Services, Inc. and Shareholder Financial Services, Inc. (until October 1995). Oversees 42 portfolios in the OppenheimerFunds complex. Mr. Fossel has served on the Boards of certain Oppenheimer funds since 1990, during which time he has become familiar with the Fund’s (and other Oppenheimer funds’) financial, accounting, regulatory and investment matters and has contributed to the Boards’ deliberations. |
Richard F. Grabish, Trustee (since 2015) Year of Birth: 1948 | Formerly Senior Vice President and Assistant Director of Sales and Marketing (March 1997 – December 2007), Director (March 1987 – December 2007) and Manager of Private Client Services (June 1985 – June 2005) of A.G. Edwards & Sons, Inc. (broker/dealer and investment firm); Chairman and Chief Executive Officer of A.G. Edwards Trust Company, FSB (March 2001 – December 2007); President and Vice Chairman of A.G. Edwards Trust Company, FSB (investment adviser) (April 1987 – March 2001); President of A.G. Edwards Trust Company, FSB (investment adviser) (June 2005 – December 2007). Oversees 42 portfolios in the OppenheimerFunds complex. Mr. Grabish has served on the Boards of certain Oppenheimer funds since 2001, during which time he has become familiar with the Fund’s (and other Oppenheimer funds’) financial, accounting, regulatory and investment matters and has contributed to the Boards’ deliberations. |
Beverly L. Hamilton, Trustee (since 2015) Year of Birth: 1946 | Trustee of Monterey Institute for International Studies (educational organization) (2000 – 2014); Board Member of Middlebury College (educational organization) (December 2005 – June 2011); Director (1991 – 2016), Vice Chairman of the Board (2006 – 2009) and Chairman of the Board (2010 – 2013) of American Funds’ Emerging Markets Growth Fund, Inc. (mutual fund); Director of The California Endowment (philanthropic organization) (April 2002 – April 2008); Director (February 2002 – 2005) and Chairman of Trustees (2006 – 2007) of the Community Hospital of Monterey Peninsula; President of ARCO Investment Management Company (February 1991 – April 2000); Member of the investment committees of The Rockefeller Foundation (2001 – 2006) and The University of Michigan (since 2000); Advisor at Credit Suisse First Boston’s Sprout venture capital unit (venture capital fund) (1994 – January 2005); Trustee of MassMutual Institutional Funds (investment company) (1996 – June 2004); Trustee of MML Series Investment Fund (investment company) (April 1989 – June 2004); Member of the investment committee of Hartford Hospital (2000 – 2003); and Advisor to Unilever (Holland) pension fund (2000 – 2003). Oversees 42 portfolios in the OppenheimerFunds complex. Ms. Hamilton has served on the Boards of certain Oppenheimer funds since 2002, during which time she has become familiar with the Fund’s (and other Oppenheimer funds’) financial, accounting, regulatory and investment matters and has contributed to the Boards’ deliberations. |
| Independent Trustees — continued | |
| Name, Position(s) Held with the Funds, Length of Service, Year of Birth | Principal Occupation(s) During the Past 5 Years; Other Trusteeships/Directorships Held; Number of Portfolios in the Funds Complex Currently Overseen |
Victoria J. Herget, Trustee (since 2015) Year of Birth: 1951 | Board Chair (2008 – 2015) and Director (2004 – Present), United Educators (insurance company); Trustee (since 2000) and Chair (since 2010), Newberry Library (independent research library); Trustee, Mather LifeWays (senior living organization) (since 2001); Independent Director of the First American Funds (mutual fund family) (2003 – 2011); former Managing Director (1993 – 2001), Principal (1985 – 1993), Vice President (1978 – 1985) and Assistant Vice President (1973 – 1978) of Zurich Scudder Investments (investment adviser) (and its predecessor firms); Trustee (1992 – 2007), Chair of the Board of Trustees (1999 – 2007), Investment Committee Chair (1994 – 1999) and Investment Committee member (2007 – 2010) of Wellesley College; Trustee, BoardSource (non-profit organization) (2006 – 2009) and Chicago City Day School (K-8 School) (1994 – 2005). Oversees 42 portfolios in the OppenheimerFunds complex. Ms. Herget has served on the Boards of certain Oppenheimer funds since 2012, during which time she has become familiar with the Fund’s (and other Oppenheimer funds’) financial, accounting, regulatory and investment matters and has contributed to the Boards’ deliberations. |
F. William Marshall, Jr., Trustee (since 2015) Year of Birth: 1942 | Trustee Emeritus of Worcester Polytech Institute (WPI) (private university) (since 2009); Trustee of MassMutual Select Funds (formerly MassMutual Institutional Funds) (investment company) (1996 – 2015), MML Series Investment Fund (investment company) (1996 – 2015) and Mass Mutual Premier Funds (investment company) (January 2012 – December 2015); President and Treasurer of the SIS Charitable Fund (private charitable fund) (January 1999 – March 2011); Former Trustee of WPI (1985 – 2008); Former Chairman of the Board (2004 – 2006) and Former Chairman of the Investment Committee of WPI (1994 – 2008); Chairman of SIS Family Bank, F.S.B. (formerly SIS Bank) (commercial bank) (January 1999 – July 1999); Executive Vice President of Peoples Heritage Financial Group, Inc. (commercial bank) (January 1999 – July 1999); and Former President and Chief Executive Officer of SIS Bancorp. (1993 – 1999). Oversees 42 portfolios in the OppenheimerFunds complex. Mr. Marshall has served on the Boards of certain Oppenheimer funds since 2000, during which time he has become familiar with the Fund’s (and other Oppenheimer funds’) financial, accounting, regulatory and investment matters and has contributed to the Boards’ deliberations. |
Karen L. Stuckey, Trustee (since 2015) Year of Birth: 1953 | Member (since May 2015) of Desert Mountain Community Foundation Advisory Board (non-profit organization); Partner (1990 – 2012) of PricewaterhouseCoopers LLP (professional services firm) (held various positions 1975 – 1990); Trustee (1992 – 2006); member of Executive, Nominating and Audit Committees and Chair of Finance Committee (1992 – 2006), and Emeritus Trustee (since 2006) of Lehigh University; and member, Women’s Investment Management Forum (professional organization) since inception. Oversees 42 portfolios in the OppenheimerFunds complex. Ms. Stuckey has served on the Boards of certain Oppenheimer funds since 2012, during which time she has become familiar with the Fund’s (and other Oppenheimer funds’) financial, accounting, regulatory and investment matters and has contributed to the Boards’ deliberations. |
| Independent Trustees — continued | |
| Name, Position(s) Held with the Funds, Length of Service, Year of Birth | Principal Occupation(s) During the Past 5 Years; Other Trusteeships/Directorships Held; Number of Portfolios in the Funds Complex Currently Overseen |
James D. Vaughn, Trustee (since 2015) Year of Birth: 1945 | Retired; former managing partner (1994 – 2001) of Denver office of Deloitte & Touche LLP, (held various positions 1969 – 1993); Trustee and Chairman of the Audit Committee of Schroder Funds (2003 – 2012); Board member and Chairman of Audit Committee of AMG National Trust Bank (since 2005); Trustee and Investment Committee member, University of South Dakota Foundation (since 1996); Board member, Audit Committee Member and past Board Chair, Junior Achievement (since 1993); former Board member, Mile High United Way, Boys and Girls Clubs, Boy Scouts, Colorado Business Committee for the Arts, Economic Club of Colorado and Metro Denver Network. Oversees 42 portfolios in the OppenheimerFunds complex. Mr. Vaughn has served on the Boards of certain Oppenheimer funds since 2012, during which time he has become familiar with the Fund’s (and other Oppenheimer funds’) financial, accounting, regulatory and investment matters and has contributed to the Boards’ deliberations. |
INTERESTED TRUSTEE AND OFFICER | Mr. Steinmetz is an “Interested Trustee” because he is affiliated with VTL by virtue of his positions as Chairman and director of OFI and officer and director of OFI Global Asset Management, Inc. Both as a Trustee and as an officer, Mr. Steinmetz serves for an indefinite term, or until his resignation, retirement, death or removal. Mr. Steinmetz’s address is 225 Liberty Street, New York, New York 10281 – 1008. |
Arthur P. Steinmetz, Trustee, President and Principal Executive Officer (since 2015) Year of Birth: 1958 | Chairman of the OppenheimerFunds, Inc. (since January 2015); CEO and Chairman of OFI Global Asset Management, Inc. (since July 2014), President of OFI Global Asset Management, Inc. (since May 2013), a Director of OFI Global Asset Management, Inc. (since January 2013), Director of OppenheimerFunds, Inc. (since July 2014), President, Management Director and CEO of Oppenheimer Acquisition Corp. (OppenheimerFunds, Inc.’s parent holding company) (since July 2014), and President and Director of OFI SteelPath, Inc. (since January 2013). Chief Investment Officer of the OppenheimerFunds advisory entities from (January 2013 – December 2013); Executive Vice President of OFI Global Asset Management, Inc. (January 2013 – May 2013); Chief Investment Officer of OppenheimerFunds, Inc. (October 2010 – December 2012); Chief Investment Officer, Fixed-Income, of OppenheimerFunds, Inc. (April 2009 – October 2010); Executive Vice President of OppenheimerFunds, Inc. (October 2009 – December 2012); Director of Fixed Income of OppenheimerFunds, Inc. (January 2009 – April 2009); and a Senior Vice President of OppenheimerFunds, Inc. (March 1993 – September 2009). An officer of 99 portfolios in the OppenheimerFunds complex. |
OTHER OFFICERS OF THE FUNDS | The addresses of the Officers in the chart below are as follows: for Mss. Lo Bessette, Foxson and Picciotto, 225 Liberty Street, New York, New York 10281-1008, for Mr. Petersen, 6803 S. Tucson Way, Centennial, Colorado 80112-3924; and for Messrs. Vincent Lowry, Justin Lowry and Reichert, One Commerce Square, 2005 Market Street, Suite 2020, Philadelphia, Pennsylvania 19103. Each Officer serves for an indefinite term or until his or her resignation, retirement, death or removal. |
Vincent T. Lowry,1 Vice President (since 2015) Year of Birth: 1957 | Senior Vice President, VTL (since December 2015); Chief Executive Officer and Chief Investment Officer, VTL (2004 – 2015); Managing Director, Smith Barney, Inc. (1984 — 2004). A portfolio manager and officer in the OppenheimerFunds complex. |
Justin V. Lowry,1 Vice President (since 2015) Year of Birth: 1987 | Vice President, VTL (since December 2015); Portfolio Manager, IMS (2009 – 2015). A portfolio manager and officer in the OppenheimerFunds complex. |
| 1 | Effective August 16, 2017, Vincent T. Lowry and Justin V. Lowry are no longer officers of the Funds. |
| Other Officers of the Fund — continued | |
| Name, Position(s) Held with the Funds, Length of Service, Year of Birth | Principal Occupation(s) During the Past 5 Years; Other Trusteeships/Directorships Held; Number of Portfolios in the Funds Complex Currently Overseen |
Sean P. Reichert, Vice President (since 2015) Year of Birth: 1987 | Assistant Vice President and Portfolio Manager of the Sub-Adviser (since January 2017); Portfolio Manager, VTL (since December 2015); Portfolio Manager, IMS (2009 – 2015). A portfolio manager and officer in the OppenheimerFunds complex. |
Mary Ann Picciotto, Chief Compliance Officer and Chief Anti-Money Laundering Officer (since 2015) Year of Birth: 1973 | Senior Vice President and Chief Compliance Officer of OFI Global Asset Management, Inc. (since March 2014); Chief Compliance Officer of Sub-Adviser, OFI SteelPath, Inc., OFI Global Trust Company, OFI Global Institutional, Inc., Oppenheimer Real Asset Management, Inc., OFI Private Investments, Inc., Harborview Asset Management Corporation, Trinity Investment Management Corporation, and Shareholder Services, Inc. (since March 2014); Chief Compliance Officer of VTL (since December 2015); Managing Director of Morgan Stanley Investment Management Inc. and certain of its various affiliated entities; Chief Compliance Officer of various Morgan Stanley Funds (May 2010 – January 2014); Chief Compliance Officer of Morgan Stanley Investment Management Inc. (April 2007 – January 2014). An officer of 99 portfolios in the OppenheimerFunds complex. |
Cynthia Lo Bessette, Secretary and Chief Legal Officer (since 2016) Year of Birth: 1969 | Executive Vice President, General Counsel and Secretary of OFI Global Asset Management, Inc. (since February 2016); Chief Legal Officer of OppenheimerFunds, Inc. and the Distributor (since February 2016); Vice President, General Counsel and Secretary of Oppenheimer Acquisition Corp. (since February 2016); General Counsel of OFI SteelPath, Inc., VTL Associates, LLC and Index Management Solutions, LLC (since February 2016); Chief Legal Officer of OFI Global Institutional, Inc., HarbourView Asset Management Corporation, OFI Global Trust Company, Oppenheimer Real Asset Management, Inc., OFI Private Investments Inc., Shareholder Services, Inc. and Trinity Investment Management Corporation (since February 2016); Senior Vice President and Deputy General Counsel (March 2015 – February 2016) and Executive Vice President, Vice President, Corporate Counsel (February 2012 – March 2015) and Deputy Chief Legal Officer (April 2013 – March 2015) of Jennison Associates LLC; Assistant General Counsel (April 2008 – September 2009) and Deputy General Counsel (October 2009 – February 2012) of Lord Abbett & Co. LLC. An officer of 99 portfolios in the OppenheimerFunds complex. |
Jennifer Foxson, Vice President and Chief Business Officer (since 2015) Year of Birth: 1969 | Senior Vice President of OppenheimerFunds Distributor, Inc. (since June 2014); Vice President of OppenheimerFunds Distributor, Inc. (April 2006 – June 2014); Vice President of OppenheimerFunds, Inc. (January 1998 – March 2006); Assistant Vice President of OppenheimerFunds, Inc. (October 1991 – December 1998). An officer of 99 portfolios in the OppenheimerFunds complex. |
Brian S. Petersen, Treasurer and Principal Financial and Accounting Officer (since 2016) Year of Birth: 1970 | Senior Vice President of OFI Global Asset Management, Inc. (since January 2017); Vice President of OFI Global Asset Management, Inc. (January 2013 – January 2017); Vice President of Sub-Adviser (February 2007 – December 2012); Assistant Vice President of Sub-Adviser (August 2002 – 2007). An officer of 99 portfolios in the OppenheimerFunds complex. |
| | QDI | | DRD | |||||||
Oppenheimer Large Cap Revenue ETF | 100 | % | 100 | % | ||||||
Oppenheimer Mid Cap Revenue ETF | 100 | % | 100 | % | ||||||
Oppenheimer Small Cap Revenue ETF | 100 | % | 100 | % | ||||||
Oppenheimer Financials Sector Revenue ETF | 100 | % | 100 | % | ||||||
Oppenheimer Ultra Dividend Revenue ETF | 93 | % | 91 | % | ||||||
Oppenheimer ESG Revenue ETF | 94 | % | 89 | % | ||||||
Oppenheimer Global ESG Revenue ETF | 84 | % | 24 | % | ||||||
| | Gross Foreign Income | | Foreign Taxes Paid | |||||||
Oppenheimer Global ESG Revenue ETF | $ | 247,083 | $ | 30,272 | ||||||
Investment Adviser | Independent Registered Public Accounting Firm | |||||
VTL Associates, LLC | Cohen & Company, Ltd. | |||||
Distributor | Legal Counsel | |||||
OppenheimerFunds Distributor, Inc. | Ropes & Gray LLP | |||||
Administrator, Custodian and Transfer Agent | ||||||
The Bank of New York Mellon (BNY Mellon) | ||||||
©2017 OppenheimerFunds, Inc. All rights reserved.
shareholders of each Fund.
unless preceded or accompanied by an effective
prospectus, which includes information regarding the
Funds’ risks, objectives, fees and expenses, experience of
their management, and other information.
Visit Us oppenheimerfunds.com Call Us 800 225 5677 | Oppenheimer Revenue Weighted ETF Trust is distributed by OppenheimerFunds Distributor, Inc. 225 Liberty Street, New York, NY 10281-1008 © 2017 OppenheimerFunds Distributor, Inc. All rights reserved. RA0000.011.0617 June 30, 2017 |
Item 2. Code of Ethics.
| (a) | The registrant, as of the end of the period covered by this report, has adopted a code of ethics that applies to the registrant’s principal executive officer, principal financial officer, principal accounting officer or controller, or persons performing similar functions, regardless of whether these individuals are employed by the registrant or a third party. |
| (d) | The registrant has not granted any waivers, including an implicit waiver, from a provision of the code of ethics that applies to the registrant’s principal executive officer, principal financial officer, principal accounting officer or controller, or persons performing similar functions, regardless of whether these individuals are employed by the registrant or a third party, that relates to one or more of the items set forth in paragraph (b) of this item’s instructions. |
Item 3. Audit Committee Financial Expert.
The Registrant’s Board of Trustees has one audit committee financial expert serving on its audit committee, an “independent” Trustee, Karen L. Stuckey. Under applicable securities laws, a person who is determined to be an audit committee financial expert will not be deemed an “expert” for any purpose, including without limitation for the purposes of Section 11 of the Securities Act of 1933, as a result of being designated or identified as an audit committee financial expert. The designation or identification of a person as an audit committee financial expert does not impose on such person any duties, obligations, or liabilities that are greater than the duties, obligations, and liabilities imposed on such person as a member of the audit committee and Board of Trustees in the absence of such designation or identification.
Item 4. Principal Accountant Fees and Services.
Audit Fees
| (a) | The aggregate fees billed for each of the last two fiscal years for professional services rendered by the principal accountant for the audit of the registrant's annual financial statements or services that are normally provided by the accountant in connection with statutory and regulatory filings or engagements for those fiscal years are $101,500 for 2017 and $116,000 for 2016. |
Audit-Related Fees
| (b) | The aggregate fees billed in each of the last two fiscal years for assurance and related services by the principal accountant that are reasonably related to the performance of the audit of the registrant's financial statements and are not reported under paragraph (a) of this Item are $0 for 2017 and $0 for 2016. |
Tax Fees
| (c) | The aggregate fees billed in each of the last two fiscal years for professional services rendered by the principal accountant for tax compliance, tax advice, and tax planning are $29,400 for 2017 and $33,600 for 2016. |
The principal accountant for the audit of the registrant’s annual financial statements billed $0 in fiscal 2017 and $0 in fiscal 2016 to the registrant’s investment adviser or any entity controlling, controlled by, or under common control with the adviser that provides ongoing services to the registrant.
Such services include: tax compliance, tax planning and tax advice. Tax compliance generally involves preparation of original and amended tax returns, claims for a refund and tax payment-planning services. Tax planning and tax advice includes assistance with tax audits and appeals, tax advice related to mergers and acquisitions and requests for rulings or technical advice from taxing authorities.
All Other Fees
| (d) | The aggregate fees billed in each of the last two fiscal years for products and services provided by the principal accountant, other than the services reported in paragraphs (a) through (c) of this Item are $0 for 2017 and $0 for 2016. |
| (e)(1) | Disclose the audit committee's pre-approval policies and procedures described in paragraph (c)(7) of Rule 2-01 of Regulation S-X. |
Per Rule 2-01(c)(7)(A), the registrant’s audit committee will pre-approve all audit, audit-related, tax and other services to be provided by the principal accountants of the registrant.
The audit committee has delegated pre-approval authority to its Chairman for any subsequent new engagements that arise between regularly scheduled meeting dates provided that any fees such pre-approved are presented to the audit committee at its next regularly scheduled meeting.
Under applicable laws, pre-approval of non-audit services may be waived provided that: 1) the aggregate amount of all such services provided constitutes no more than five percent of the total amount of fees paid by the registrant to its principal accountant during the fiscal year in which services are provided 2) such services were not recognized by the registrant at the time of engagement as non-audit services and 3) such services are promptly brought to the attention of the audit committee of the registrant and approved prior to the completion of the audit.
| (e)(2) | The percentage of services described in each of paragraphs (b) through (d) of this Item that were approved by the audit committee pursuant to paragraph (c)(7)(i)(C) of Rule 2-01 of Regulation S-X are as follows: 0% |
| (f) | No response required. |
| (g) | The aggregate non-audit fees billed by the registrant's accountant for services rendered to the registrant, and rendered to the registrant's investment adviser (not including any sub-adviser whose role is primarily portfolio management and is subcontracted with or overseen by another investment adviser), and any entity controlling, controlled by, or under common control with the adviser that provides ongoing services to the registrant for each of the last two fiscal years of the registrant was $29,400 for 2017 and $33,600 for 2016. |
| (h) | The registrant's audit committee of the board of trustees has considered whether the provision of non-audit services that were rendered to the registrant's investment adviser (not including any sub-adviser whose role is primarily portfolio management and is subcontracted with or overseen by another investment adviser), and any entity controlling, controlled by, or under common control with the investment adviser that provides ongoing services to the registrant that were not pre-approved pursuant to paragraph (c)(7)(ii) of Rule 2-01 of Regulation S-X is compatible with maintaining the principal accountant's independence. No such services were rendered. |
Item 5. Audit Committee of Listed registrants.
Not applicable.
Item 6. Investments.
(a) Not applicable. The complete schedule of investments is included in Item 1 of this Form N-CSR.
(b) Not applicable.
Item 7. Disclosure of Proxy Voting Policies and Procedures for Closed-End Management Investment Companies.
Not applicable.
Item 8. Portfolio Managers of Closed-End Management Investment Companies.
Not applicable.
Item 9. Purchases of Equity Securities by Closed-End Management Investment Company and Affiliated Purchasers.
Not applicable.
Item 10. Submission of Matters to a Vote of Security Holders.
There have been no material changes to the procedures by which the shareholders may recommend nominees to the registrant’s board of directors, where those changes were implemented after the registrant last provided disclosure in response to the requirements of Item 407(c)(2)(iv) of Regulation S-K (17 CFR 229.407) (as required by Item 22(b)(15) of Schedule 14A (17 CFR 240.14a-101)), or this Item.
Item 11. Controls and Procedures.
| (a) | The registrant’s principal executive and principal financial officers, or persons performing similar functions, have concluded that the registrant’s disclosure controls and procedures (as defined in Rule 30a-3(c) under the Investment Company Act of 1940, as amended (the “1940 Act”) (17 CFR 270.30a-3(c))) are effective, as of a date within 90 days of the filing date of the report that includes the disclosure required by this paragraph, based on their evaluation of these controls and procedures required by Rule 30a-3(b) under the 1940 Act (17 CFR 270.30a-3(b)) and Rules 13a-15(b) or 15d-15(b) under the Securities Exchange Act of 1934, as amended (17 CFR 240.13a-15(b) or 240.15d-15(b)). |
| (b) | There were no changes in the registrant’s internal control over financial reporting (as defined in Rule 30a-3(d) under the 1940 Act (17 CFR 270.30a-3(d))) that occurred during the registrant’s second fiscal quarter of the period covered by this report that has materially affected, or is reasonably likely to materially affect, the registrant’s internal control over financial reporting. |
Item 12. Exhibits.
| (a)(1) | Code of ethics, or any amendment thereto, that is the subject of disclosure required by Item 2 is attached hereto. |
| (a)(2) | Certifications pursuant to Rule 30a-2(a) under the 1940 Act and Section 302 of the Sarbanes-Oxley Act of 2002 are attached hereto. |
(a)(3) Not applicable.
SIGNATURES
Pursuant to the requirements of the Securities Exchange Act of 1934 and the Investment Company Act of 1940, the registrant has duly caused this report to be signed on its behalf by the undersigned, thereunto duly authorized.
| (Registrant) | Oppenheimer Revenue Weighted ETF Trust |
| By (Signature and Title)* | /s/ Arthur P. Steinmetz |
Arthur P. Steinmetz Principal Executive Officer |
| Date | 8/15/2017 |
Pursuant to the requirements of the Securities Exchange Act of 1934 and the Investment Company Act of 1940, this report has been signed below by the following persons on behalf of the registrant and in the capacities and on the dates indicated.
| By (Signature and Title)* | /s/ Arthur P. Steinmetz |
Arthur P. Steinmetz Principal Executive Officer |
| Date | 8/15/2017 |
| By (Signature and Title)* | /s/ Brian S. Petersen |
Brian S. Petersen Principal Financial Officer |
| Date | 8/15/2017 |
* Print the name and title of each signing officer under his or her signature.