UNITED STATES
SECURITIES AND EXCHANGE COMMISSION
Washington, D.C. 20549
FORM N-CSR
CERTIFIED SHAREHOLDER REPORT OF REGISTERED
MANAGEMENT INVESTMENT COMPANIES
Investment Company Act file number | 811-21993 | |||||||
| ||||||||
RevenueShares ETF Trust | ||||||||
(Exact name of registrant as specified in charter) | ||||||||
| ||||||||
One Commerce Square, 2005 Market Street Suite 2020 Philadelphia, Pennsylvania |
| 19103 | ||||||
(Address of principal executive offices) |
| (Zip code) | ||||||
| ||||||||
Vincent T. Lowry One Commerce Square, 2005 Market Street Suite 2020 Philadelphia, Pennsylvania 19103 | ||||||||
(Name and address of agent for service) | ||||||||
| ||||||||
Registrant’s telephone number, including area code: | 1-877-638-8870 |
| ||||||
| ||||||||
Date of fiscal year end: | June 30, 2008 |
| ||||||
| ||||||||
Date of reporting period: | June 30, 2008 |
| ||||||
Form N-CSR is to be used by management investment companies to file reports with the Commission not later than 10 days after the transmission to stockholders of any report that is required to be transmitted to stockholders under Rule 30e-1 under the Investment Company Act of 1940 (17 CFR 270.30e-1). The Commission may use the information provided on Form N-CSR in its regulatory, disclosure review, inspection, and policymaking roles.
A registrant is required to disclose the information specified by Form N-CSR, and the Commission will make this information public. A registrant is not required to respond to the collection of information contained in Form N-CSR unless the Form displays a currently valid Office of Management and Budget (“OMB”) control number. Please direct comments concerning the accuracy of the information collection burden estimate and any suggestions for reducing the burden to Secretary, Securities and Exchange Commission, 450 Fifth Street, NW, Washington, DC 20549-0609. The OMB has reviewed this collection of information under the clearance requirements of 44 U.S.C. § 3507.
Item 1. Reports to Stockholders.
RevenueSharesTM ETF Trust
Annual Report to Shareholders
June 30, 2008
RevenueSharesTM
REVENUE WEIGHTED INDEXES
The top line is the bottom lineTM
www.RevenueSharesETFs.com | 877 738 8870
Table of Contents
| Letter to Shareholders | 2 | ||||||
| Management's Discussion and Analysis | 4 | ||||||
| Shareholder Expense Examples | 10 | ||||||
| Schedule of Investment Summary Table | 11 | ||||||
| Schedules of Investments | |||||||
| RevenueShares Large Cap Fund | 12 | ||||||
| RevenueShares Mid Cap Fund | 18 | ||||||
| RevenueShares Small Cap Fund | 23 | ||||||
| Statements of Assets and Liabilities | 29 | ||||||
| Statements of Operations | 30 | ||||||
| Statements of Changes in Net Assets | 31 | ||||||
| Financial Highlights | 32 | ||||||
| Notes to Financial Statements | 33 | ||||||
| Report of Independent Registered Public Accounting Firm | 38 | ||||||
| Board Review of Investment Advisory and Sub-Advisory Agreements | 39 | ||||||
| Board of Trustees and Officers | 41 | ||||||
| Supplemental Information | 43 | ||||||
1
Letter To Shareholders
August 1, 2008
Dear Shareholders,
The first few months of RevenueSharesTM ETF Trust inaugural year have been memorable. On February 22, 2008 after much anticipation, we launched our first three ETFs on the New York Stock Exchange: the RevenueShares Large Cap FundTM (RWL), the RevenueShares Mid Cap FundTM (RWK), and the RevenueShares Small Cap FundTM (RWJ). These ETFs are comprised of the same stocks as the S&P 500® Index ("S&P 500"), the S&P MidCap 400TM Index ("S&P MidCap 400"), and the S&P SmallCap 600TM Index ("S&P SmallCap 600"), respectively but they are weighted by revenue rather than market capitalization (i.e., stock price multiplied by the number of outstanding shares). As of June 30, the ETFs had 902,100 shares outstanding (700,700 Large Cap, 100,700 Mid Cap, and 100,700 Small Cap).
Although the launch was a success, the market has not been as cooperative as we might have hoped. The global equity and bond markets have performed poorly and the capital markets have been greatly hindered by the fear of a recession. During the RevenueShares reporting period, most equity sectors of the S&P 500®, S&P MidCap 400TM, and S&P SmallCap 600TM experienced negative returns except information technology and energy. The consumer discretionary and financials experienced double digit negative returns. The revenue weighted strategy overweighted consumer discretionary sectors and market-weighted the financial sector during this period. The RevenueShares Funds' exposure to consumer discretionary and financial sectors resulted in the Funds underperformance for the reporting period versus their benchmark indexes. However, in the month of July, financials and consumer discretionary stocks had ve ry strong rallies which resulted in positive returns for the Funds during July. Despite the adversity, we believe a revenue weighted strategy is a sound long term investment methodology because revenue is a difficult fundamental to manipulate and ensures broad exposure and applicability to the market. Based on back tested data performed by Standard & Poor's, this strategy has enabled our Indexes to display favorable returns during the periods that have followed challenging equity markets back to 1978. In our view, back testing provides a very useful picture of long term performance; although it's a hypothetical calculation of how an index would have performed in the past had it existed. Back testing does have inherent limitations and isn't predictive of results, but we find it to be an incredibly useful research tool. In the next few months, we have plans to introduce several new ETF revenue weighted strategies that we believe will compliment and expand RevenueShares' ability to serve the investment comm unity for many years.
Thank you for your continued confidence and support.
Sincerely,

Vincent T. Lowry
C.E.O. and Chief Investment Officer
VTL Associates, LLC
An investment in the Funds is subject to investment risk, including the possible loss of principal amount invested. Fund returns may not match the return of their respective Index, known as non-correlation risk, due to operating expenses incurred by the Fund. The alternate weighting approach employed by the Funds (i.e., using revenues as a weighting measure), while designed to enhance potential returns, may not produce the desired results. The Small- and Mid-Cap Funds will invest in small and medium sized companies which involves greater risk than is customarily associated with investing in larger and more established companies.
The S&P 500 Index is a broad-based, unmanaged measurement of changes in stock market conditions based on the average of 500 widely held common stocks. The S&P MidCap 400 Index consists of 400 domestic mid cap stocks selected for market size, liquidity and industry group representation. The S&P SmallCap 600 Index consists of 600 domestic small cap stocks selected for market size, liquidity and industry group representation. One cannot invest
2
Letter To Shareholders — concluded
directly in an index. RevenueShares Funds are not sponsored, endorsed, sold or promoted by Standard & Poor's. Standard & Poor's makes no representation regarding the advisability of investing in RevenueShares Funds.
The views in this letter were those of the Fund manager as of August 1, 2008 and may not necessarily reflect his views on the date this letter is first published or anytime thereafter. These views are intended to assist shareholders in understanding the Funds' present investment methodology and do not constitute investment advice.
3
Management's Discussion and Analysis
June 30, 2008
RevenueShares Large Cap FundTM (Ticker: RWL)
The RevenueShares Large Cap FundTM (the Fund) seeks to achieve its investment objective of outperforming the total return performance of the S&P 500 IndexTM ("S&P 500") by investing in the constituent securities of the S&P 500 in the same proportions as the RevenueShares Large Cap Index. RevenueShares Large Cap FundTM (RWL) returned (8.31)% at net asset value while the S&P 500 returned (4.72)% for the period ended June 30, 2008 (since inception February 22, 2008).
The Fund launched on February 22, 2008 just as the second round of negative news emerged from the banking and brokerage sector. The Funds' exposure to financials resulted in negative returns through the quarter. The consumer discretionary sector pulled back particularly in the auto sector. This resulted in further poor results for the Fund. The equity markets remained under pressure as a result of rising oil and commodity prices, which threaten the earning power of equities. The weak dollar has contributed to the rise in commodity prices however multinationals in the S&P 500 experienced increased sales internationally as their products became more price competitive.
The RevenueShares Large Cap FundTM is comprised of the same constituent securities as the S&P 500®. But rather than being weighted by market capitalization, the RevenueShares Large Cap FundTM employs a patent-pending investment methodology to weight stocks by annual revenue. The Fund is rebalanced annually. RevenueShares Large Cap Index is constructed using a rules-driven methodology, which re-weights the constituent securities of the S&P 500 according to the revenue earned by the companies in the S&P 500. The resulting RevenueShares Large Cap IndexTM contains the same securities as the S&P 500, but in different proportions.
| Sector Allocations As of June 30, 2008 | |||||||
| Sector | Percentage of Net Assets | ||||||
| Energy | 16.29 | ||||||
| Consumer Staples | 15.12 | ||||||
| Financials | 14.36 | ||||||
| Consumer Discretionary | 13.76 | ||||||
| Industrials | 11.41 | ||||||
| Health Care | 9.28 | ||||||
| Information Technology | 8.80 | ||||||
| Materials | 4.05 | ||||||
| Utilities | 3.73 | ||||||
| Telecommunication Services | 2.77 | ||||||
| Total Investments | 99.57 | ||||||
| Other Assets in Excess of Liabilities | 0.43 | ||||||
| Net Assets | 100.00 | ||||||
| Top Ten Fund Holdings As of June 30, 2008 | |||||||
| Security | Percentage of Net Assets | ||||||
| Wal-Mart Stores | 5.06 | ||||||
| Exxon Mobil Corp. | 4.30 | ||||||
| Chevron Corp. | 2.78 | ||||||
| ConocoPhillips | 2.56 | ||||||
| General Electric | 1.57 | ||||||
| Ford Motor | 1.49 | ||||||
| International Business Machines | 1.37 | ||||||
| AT&T Inc. | 1.19 | ||||||
| Citigroup Inc. | 1.14 | ||||||
| JPMorgan Chase & Co. | 1.13 | ||||||
| Total | 22.59 | ||||||
4
Management's Discussion and Analysis — continued
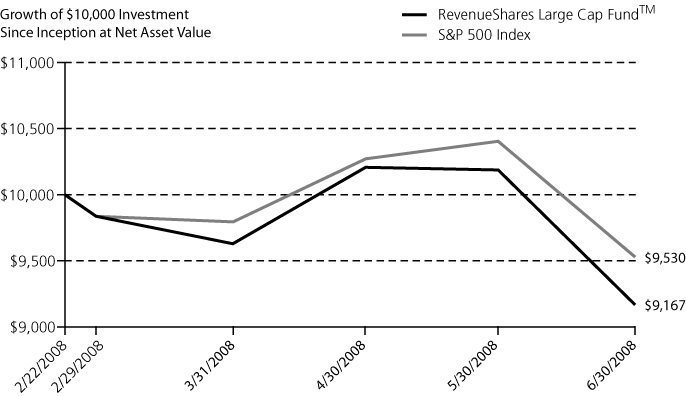
| Fund Performance History (%) | Cumulative Total Return As of June 30, 2008 | ||||||
| Since Inception (February 22, 2008) | |||||||
| Index | |||||||
| RevenueShares Large Cap IndexTM | (8.60 | )% | |||||
| S&P 500 Index | (4.72 | )% | |||||
| Fund | |||||||
| NAV Return | (8.31 | )% | |||||
| Market Price | (7.83 | )% | |||||
Performance data quoted represents past performance and is no guarantee of future results. Current performance may be lower or higher than the performance data quoted. Investment return and principal value will fluctuate so that an investor's shares, when redeemed, may be worth more or less than original cost. Returns less than one year are cumulative. As stated in the current prospectus, the Large Cap Fund's annual operating expense ratio (gross) is .56% and the net expense is .49%. (Actual expenses can be referenced in the Financial Highlights section later in the report.) The Fund's advisor has contractually agreed to waive a portion of its fees and/or reimburse expenses to the extent necessary to keep the Fund's expenses from exceeding the net expense ratio. This agreement is in effect until February 19, 2009. The performance table and graph do not reflect the deduction of taxes that a shareholder would pay on Fund distributions or th e redemption of Fund shares. For the Fund's most recent month end performance please visit www.revenuesharesetfs.com.
Performance reflects reinvestment of all dividend and capital gains distributions. During this period, some of the Fund's fees were waived and/or expenses reimbursed; otherwise, the Fund's performance would have been lower.
Index returns reflect the reinvestment of dividends but do not reflect any management fees, transaction costs or other expenses that would be incurred by a portfolio or fund, or brokerage commissions on transactions in Fund shares. Such fees, expenses and commissions reduce Fund returns. RevenueShares Large Cap Index returns became publicly available on March 1st, 2006. Index returns do not represent Fund returns. One cannot invest directly in an index.
The S&P 500 Index is a broad-based, unmanaged measurement of changes in stock market conditions based on the average of 500 widely held common stocks.
5
Management's Discussion and Analysis — continued
June 30, 2008
RevenueShares Mid Cap FundTM (Ticker: RWK)
The RevenueShares Mid Cap FundTM (the Fund) seeks to achieve its investment objective of outperforming the total return performance of the S&P MidCap 400 Index ("S&P 400") by investing in the constituent securities of the S&P 400 in the same proportions as the RevenueShares Mid Cap IndexTM. RevenueShares Mid Cap FundTM (RWK) returned (3.02)% at net asset value while the S&P 400 returned 2.74% for the period ended June 30, 2008 (since inception February 22, 2008).
The Fund launched on February 22, 2008 and experienced the volatility of the continued slump in financials and the relentless rise in oil and other commodity prices. During the quarter, the Fund's exposure to consumer discretionary and financial sector resulted in negative returns for the Fund. Rising commodity prices and falling housing prices threaten the Funds' exposure to consumer discretionary and financials.
The RevenueShares Mid Cap FundTM is comprised of the same constituent securities as the S&P MidCap 400TM Index. But rather than being weighted by market capitalization, the RevenueShares Mid Cap FundTM employs a patent-pending investment methodology to weight stocks by annual revenue. The Fund is rebalanced annually. RevenueShares Mid Cap IndexTM is constructed using a rules-driven methodology which re-weights the constituent securities of the S&P 400 according to the revenue earned by the companies in the S&P 400. The resulting RevenueShares Mid Cap IndexTM contains the same securities as the S&P 400, but in different proportions.
| Sector Allocations As of June 30, 2008 | |||||||
| Sector | Percentage of Net Assets | ||||||
| Industrials | 18.99 | ||||||
| Consumer Discretionary | 17.62 | ||||||
| Information Technology | 15.30 | ||||||
| Financials | 11.65 | ||||||
| Materials | 9.53 | ||||||
| Health Care | 8.38 | ||||||
| Utilities | 7.97 | ||||||
| Consumer Staples | 4.73 | ||||||
| Energy | 4.68 | ||||||
| Telecommunication Services | 0.47 | ||||||
| Total Investments | 99.32 | ||||||
| Other Assets in Excess of Liabilities | 0.68 | ||||||
| Net Assets | 100.00 | ||||||
| Top Ten Fund Holdings As of June 30, 2008 | |||||||
| Security | Percentage of Net Assets | ||||||
| Ingram Micro Inc. | 3.28 | ||||||
| Federal Realty Investment Trust | 2.44 | ||||||
| Tech Data Corp. | 1.97 | ||||||
| Manpower Inc. | 1.97 | ||||||
| ONEOK Inc. | 1.36 | ||||||
| Arrow Electronics | 1.29 | ||||||
| Avnet, Inc | 1.26 | ||||||
| Reliance Steel & Aluminum | 1.14 | ||||||
| Commercial Metals | 1.12 | ||||||
| Arvinmeritor Inc | 1.01 | ||||||
| Total | 16.84 | ||||||
6
Management's Discussion and Analysis — continued
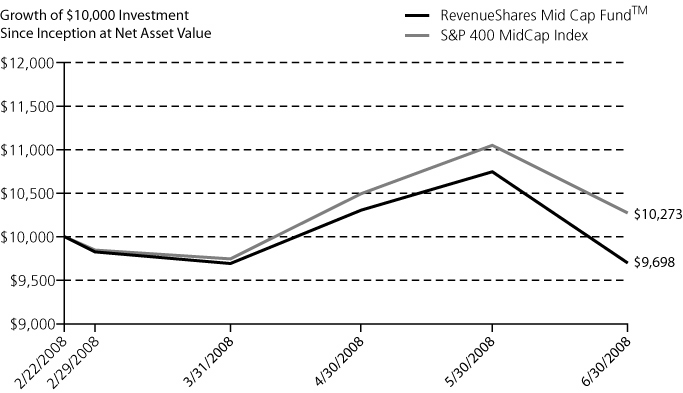
| Fund Performance History (%) | Cumulative Total Return As of June 30, 2008 | ||||||
| Since Inception (February 22, 2008) | |||||||
| Index | |||||||
| RevenueShares Mid Cap IndexTM | (3.55 | )% | |||||
| S&P 400 Index | 2.74 | % | |||||
| Fund | |||||||
| NAV Return | (3.02 | )% | |||||
| Market Price | (2.16 | )% | |||||
Performance data quoted represents past performance and is no guarantee of future results. Current performance may be lower or higher than the performance data quoted. Investment return and principal value will fluctuate so that an investor's shares, when redeemed, may be worth more or less than original cost. Returns less than one year are cumulative. As stated in the current prospectus, the Mid Cap Fund's annual operating expense ratios (gross) is .61% and the net expense ratio is .54%. (Actual expenses can be referenced in the Financial Highlights section later in the report.) The Funds' advisor has contractually agreed to waive a portion of its fees and/or reimburse expenses to the extent necessary to keep the Funds' expenses from exceeding the net expense ratio. This agreement is in effect until February 19, 2009. The performance table and graph do not reflect the deduction of taxes that a shareholder would pay on Fund distributions or the redemption of Fund Shares. For the Fund's most recent month end performance please visit www.revenuesharesetfs.com.
Performance reflects reinvestment of all dividend and capital gains distributions. During this period, some of the Fund's fees were waived and/or expenses reimbursed; otherwise, the Fund's performance would have been lower.
Index returns reflect the reinvestment of dividends but do not reflect any management fees, transaction costs or other expenses that would be incurred by a portfolio or fund, or brokerage commissions on transactions in Fund shares. Such fees, expenses and commissions reduce returns. RevenueShares Mid Cap IndexTM returns became publicly available on March 1st, 2006. Index returns do not represent Fund returns. One cannot invest directly in an index.
The S&P MidCap 400 Index consists of 400 domestic mid cap stocks selected for market size, liquidity and industry group representation.
7
Management's Discussion and Analysis — continued
June 30, 2008
RevenueShares Small CapTM Fund (Ticker: RWJ)
The RevenueShares Small Cap FundTM (the Fund) seeks to achieve its investment objective of outperforming the total return performance of the S&P SmallCap 600 Index ("S&P 600") by investing in the constituent securities of the S&P 600 in the same proportions as the RevenueShares Small Cap IndexTM. RevenueShares Small Cap FundTM (RWJ) returned (6.36)% at net asset value while the S&P Small Cap 600 returned (.59)% at net asset value for the period ended June 30, 2008 (since inception February 22, 2008).
The Fund debuted on February 22, 2008 amidst a period of rapid upward movement in energy stocks particularly smaller infrastructure energy stocks. The smaller energy explorer and equipment producers saw their shares rise and price to earnings (P/E) ratios expand which resulted in positive performance for the Fund. However the RevenueShares Small Cap FundTM experienced return drag from the Funds exposure to financials, materials and consumer discretionary sectors.
The RevenueShares Small Cap FundTM is comprised of the same constituent securities as the S&P SmallCap 600TM. But rather than being weighted by market capitalization, the RevenueShares Small Cap FundTM employs a patent-pending investment methodology to weight stocks by annual revenue. The Fund is rebalanced annually. RevenueShares Small Cap IndexTM is constructed using a rules-driven methodology which re-weights the constituent securities of the S&P 600 according to the revenue earned by the companies in the S&P 600. The resulting RevenueShares Small Cap Index contains the same securities as the S&P 600, but in different proportions.
| Sector Allocations As of June 30, 2008 | |||||||
| Sector | Percentage of Net Assets | ||||||
| Industrials | 22.23 | ||||||
| Consumer Discretionary | 21.27 | ||||||
| Information Technology | 12.51 | ||||||
| Health Care | 8.79 | ||||||
| Consumer Staples | 8.37 | ||||||
| Financials | 8.01 | ||||||
| Energy | 6.63 | ||||||
| Utilities | 6.19 | ||||||
| Materials | 5.07 | ||||||
| Telecommunication Services | 0.12 | ||||||
| Total Investments | 99.19 | ||||||
| Other Assets in Excess of Liabilities | 0.81 | ||||||
| Net Assets | 100.00 | ||||||
| Top Ten Fund Holdings As of June 30, 2008 | |||||||
| Security | Percentage of Net Assets | ||||||
| World Fuel Services | 1.65 | ||||||
| SYNNEX Corp. | 1.63 | ||||||
| Owens & Minor | 1.53 | ||||||
| Darling International Inc. | 1.50 | ||||||
| EMCOR Group | 1.19 | ||||||
| Atmos Energy Corp | 1.16 | ||||||
| UGI Corp. | 1.09 | ||||||
| Anixter International | 1.05 | ||||||
| OfficeMax Inc. | 1.03 | ||||||
| Great Atlantic & Pacific Tea Co., Inc. | 0.94 | ||||||
| Total | 12.77 | ||||||
8
Management's Discussion and Analysis — concluded
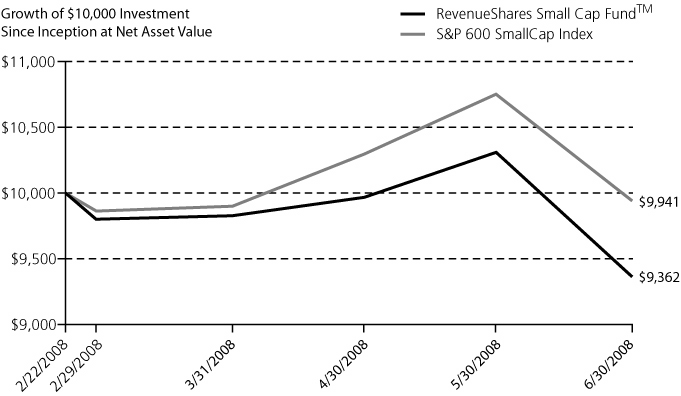
| Fund Performance History (%) | Cumulative Total Return As of June 30, 2008 | ||||||
| Since Inception (February 22, 2008) | |||||||
| Index | |||||||
| RevenueShares Small Cap IndexTM | (5.85 | )% | |||||
| S&P 600 Index | (0.59 | )% | |||||
| Fund | |||||||
| NAV Return | (6.36 | )% | |||||
| Market Price | (5.84 | )% | |||||
Performance data quoted represents past performance and is no guarantee of future results. Current performance may be lower or higher than the performance data quoted. Investment return and principal value will fluctuate so that an investor's shares, when redeemed, may be worth more or less than original cost. Returns less than one year are cumulative. The Small Cap Fund's annual operating expense ratio (gross) is .61% and the net expense ratio is .54%. (Actual expenses can be referenced in the Financial Highlights section later in the report.) The Fund's advisor has contractually agreed to waive a portion of its fees and/or reimburse expenses to the extent necessary to keep the Fund's expenses from exceeding the net expense ratio. This agreement is in effect until February 19, 2009. The performance table and graph do no reflect the deduction of taxes that a shareholder would pay on Fund distributions or the redemption of Fund shares. For the Fund's most recent month end performance please visit www.revenuesharesetfs.com.
Performance reflects reinvestment of all dividend and capital gains distributions. During this period, some of the Fund's fees were waived and/or expenses reimbursed; otherwise, the Fund's performance would have been lower.
Index returns reflect the reinvestment of dividends but do not reflect any management fees, transaction costs or other expenses that would be incurred by a portfolio or fund, or brokerage commissions on transactions in Fund shares. Such fees, expenses and commissions reduce returns. RevenueShares Small Cap Index returns became publicly available on March 1st, 2006. Index returns do not represent Fund returns. One cannot invest directly in an index.
The S&P SmallCap 600 Index consists of 600 domestic small cap stocks selected for market size, liquidity and industry group representation. Price to earnings ratio is the value of a company's stock price relative to company earnings.
9
Shareholder Expense Examples
As a shareholder of a RevenueShares ETF Trust, you incur advisory fees and other Fund expenses. The following example is intended to help you understand your ongoing costs (in dollars and cents) of investing in a Fund and to compare these costs with the ongoing costs of investing in other funds.
The example is based on an investment of $1,000 invested at the beginning of the period and held for the entire period from February 22, 2008* to June 30, 2008.
Actual expenses
The first line under each Fund in the table below provides information about actual account values and actual expenses. You may use the information in this line, together with the amount you invested, to estimate the expenses that you paid over the period. Simply divide your account value by $1,000 (for example, an $8,600 account value divided by $1,000 = 8.6), then multiply the result by the number in the first line for your Fund under the heading entitled "Expenses Paid During the Period 02/22/08* to 06/30/08" to estimate the expenses you paid on your account during this period.
Hypothetical example for comparison purposes
The second line under each Fund in the table provides information about hypothetical account values and hypothetical expenses based on each Fund's actual expense ratio and an assumed rate of return of 5% per year before expenses, which is not the Fund's actual return. The hypothetical account values and expenses may not be used to estimate the actual ending account balance or expenses you paid for the period. You may use this information to compare the ongoing costs of investing in your Fund and other funds. To do so, compare this 5% hypothetical example with the 5% hypothetical examples that appear in the shareholder reports of the other funds.
Please note that the expenses shown in the table are meant to highlight your ongoing costs only and do not reflect any transactional costs, such as brokerage commissions paid on purchases and sales of Fund shares. Therefore, the second line under each Fund in the table is useful in comparing ongoing Fund costs only and will not help you determine the relative total costs of owning different funds. In addition, if these transactional costs were included, your costs would have been higher.
| Beginning Account Value 02/22/08* | Ending Account Value 06/30/08 | Annualized Expense Ratios Based on the Period 02/22/08* to 06/30/08 | Expenses Paid During the Period 02/22/08* to 06/30/08 | ||||||||||||||||
| RevenueShares Large Cap Fund | |||||||||||||||||||
| Actual | $ | 1,000.00 | $ | 916.87 | 0.49 | % | $ | 1.67 | † | ||||||||||
| Hypothetical (5% return before expenses) | $ | 1,000.00 | $ | 1,022.43 | 0.49 | % | $ | 2.46 | ** | ||||||||||
| RevenueShares Mid Cap Fund | |||||||||||||||||||
| Actual | $ | 1,000.00 | $ | 969.79 | 0.54 | % | $ | 1.89 | † | ||||||||||
| Hypothetical (5% return before expenses) | $ | 1,000.00 | $ | 1,022.18 | 0.54 | % | $ | 2.72 | ** | ||||||||||
| RevenueShares Small Cap Fund | |||||||||||||||||||
| Actual | $ | 1,000.00 | $ | 936.42 | 0.54 | % | $ | 1.86 | † | ||||||||||
| Hypothetical (5% return before expenses) | $ | 1,000.00 | $ | 1,022.18 | 0.54 | % | $ | 2.72 | ** | ||||||||||
* Commencement of operations.
† Expenses are calculated using each Fund's annualized expense ratio, multiplied by the ending account value for the period, multiplied by 130/366 (to reflect the period since commencement of operations).
** Expenses are calculated using each Fund's annualized expense ratio, multiplied by the ending account value for the period, multiplied by 182/366 (to reflect the six-month period).
10
Schedule of Investments Summary Table
RevenueShares Large Cap Fund
| Industry | % of Net Assets | ||||||
| Automobiles & Components | 3.0 | % | |||||
| Banks | 2.4 | ||||||
| Capital Goods | 8.6 | ||||||
| Commercial Services & Supplies | 0.7 | ||||||
| Consumer Durables & Apparel | 1.8 | ||||||
| Consumer Services | 1.0 | ||||||
| Diversified Financials | 7.0 | ||||||
| Energy | 16.3 | ||||||
| Food & Staples Retailing | 9.4 | ||||||
| Food Beverage & Tobacco | 4.3 | ||||||
| Health Care Equipment & Services | 6.2 | ||||||
| Household & Personal Products | 1.4 | ||||||
| Insurance | 4.5 | ||||||
| Materials | 4.1 | ||||||
| Media | 2.6 | ||||||
| Pharmaceuticals, Biotechnology | 3.1 | ||||||
| Real Estate | 0.5 | ||||||
| Retailing | 5.3 | ||||||
| Semiconductors & Semiconductor Equipment | 1.1 | ||||||
| Software & Services | 2.4 | ||||||
| Technology Hardware & Equipment | 5.3 | ||||||
| Telecommunication Services | 2.8 | ||||||
| Transportation | 2.1 | ||||||
| Utilities | 3.7 | ||||||
| Total Investments | 99.6 | ||||||
| Other Assets in Excess of Liabilities | 0.4 | ||||||
| Net Assets | 100.0 | % | |||||
RevenueShares Mid Cap Fund
| Industry | % of Net Assets | ||||||
| Automobiles & Components | 2.8 | % | |||||
| Banks | 1.6 | ||||||
| Capital Goods | 10.7 | ||||||
| Commercial Services & Supplies | 5.1 | ||||||
| Consumer Durables & Apparel | 4.8 | ||||||
| Consumer Services | 2.1 | ||||||
| Diversified Financials | 1.2 | ||||||
| Energy | 4.7 | ||||||
| Food & Staples Retailing | 1.3 | ||||||
| Food Beverage & Tobacco | 2.6 | ||||||
| Health Care Equipment & Services | 6.9 | ||||||
| Household & Personal Products | 0.8 | ||||||
| Insurance | 4.6 | ||||||
| Materials | 9.5 | ||||||
| Media | 1.3 | ||||||
| Pharmaceuticals, Biotechnology | 1.5 | ||||||
| Real Estate | 4.2 | ||||||
| Retailing | 6.6 | ||||||
| Semiconductors & Semiconductor Equipment | 1.0 | ||||||
| Software & Services | 2.4 | ||||||
| Technology Hardware & Equipment | 11.9 | ||||||
| Telecommunication Services | 0.5 | ||||||
| Transportation | 3.2 | ||||||
| Utilities | 8.0 | ||||||
| Total Investments | 99.3 | ||||||
| Other Assets in Excess of Liabilities | 0.7 | ||||||
| Net Assets | 100.0 | % | |||||
RevenueShares Small Cap Fund
| Industry | % of Net Assets | ||||||
| Automobiles & Components | 1.0 | % | |||||
| Banks | 2.5 | ||||||
| Capital Goods | 14.3 | ||||||
| Commercial Services & Supplies | 5.1 | ||||||
| Consumer Durables & Apparel | 6.0 | ||||||
| Consumer Services | 3.3 | ||||||
| Diversified Financials | 0.9 | ||||||
| Energy | 6.6 | ||||||
| Food & Staples Retailing | 3.9 | ||||||
| Food Beverage & Tobacco | 3.8 | ||||||
| Health Care Equipment & Services | 7.9 | ||||||
| Household & Personal Products | 0.7 | ||||||
| Insurance | 2.8 | ||||||
| Materials | 5.1 | ||||||
| Media | 0.8 | ||||||
| Pharmaceuticals, Biotechnology | 0.9 | ||||||
| Real Estate | 1.8 | ||||||
| Retailing | 10.2 | ||||||
| Semiconductors & Semiconductor Equipment | 1.8 | ||||||
| Software & Services | 3.1 | ||||||
| Technology Hardware & Equipment | 7.6 | ||||||
| Telecommunication Services | 0.1 | ||||||
| Transportation | 2.8 | ||||||
| Utilities | 6.2 | ||||||
| Total Investments | 99.2 | ||||||
| Other Assets in Excess of Liabilities | 0.8 | ||||||
| Net Assets | 100.0 | % | |||||
11
Schedule of Investments
REVENUESHARES LARGE CAP FUND
JUNE 30, 2008
| Investments | Shares | Value | |||||||||
| COMMON STOCKS—99.6% | |||||||||||
| Automobiles & Components—3.0% | |||||||||||
| Ford Motor Co.* | 99,510 | $ | 478,643 | ||||||||
| General Motors Corp. | 27,598 | 317,377 | |||||||||
| Goodyear Tire & Rubber Co.* | 2,884 | 51,422 | |||||||||
| Harley-Davidson, Inc. | 532 | 19,290 | |||||||||
| Johnson Controls, Inc. | 3,766 | 108,009 | |||||||||
| Total Automobiles & Components | 974,741 | ||||||||||
| Banks—2.4% | |||||||||||
| BB&T Corp. | 1,218 | 27,734 | |||||||||
| Comerica, Inc. | 420 | 10,765 | |||||||||
| Fannie Mae | 5,494 | 107,187 | |||||||||
| Fifth Third Bancorp | 1,190 | 12,114 | |||||||||
| First Horizon National Corp. | 644 | 4,785 | |||||||||
| Freddie Mac | 5,340 | 87,576 | |||||||||
| Hudson City Bancorp, Inc. | 546 | 9,107 | |||||||||
| Huntington Bancshares, Inc. | 854 | 4,928 | |||||||||
| KeyCorp. | 1,274 | 13,989 | |||||||||
| M&T Bank Corp. | 210 | 14,813 | |||||||||
| Marshall & Ilsley Corp. | 756 | 11,589 | |||||||||
| MGIC Investment Corp. | 294 | 1,796 | |||||||||
| National City Corp. | 2,730 | 13,022 | |||||||||
| PNC Financial Services Group, Inc. | 546 | 31,177 | |||||||||
| Regions Financial Corp. | 1,736 | 18,940 | |||||||||
| Sovereign Bancorp, Inc. | 1,960 | 14,426 | |||||||||
| SunTrust Banks, Inc. | 812 | 29,411 | |||||||||
| U.S. Bancorp | 2,534 | 70,673 | |||||||||
| Wachovia Corp. | 5,550 | 86,192 | |||||||||
| Washington Mutual, Inc. | 5,802 | 28,604 | |||||||||
| Wells Fargo & Co. | 6,758 | 160,502 | |||||||||
| Zions Bancorporation | 294 | 9,258 | |||||||||
| Total Banks | 768,588 | ||||||||||
| Capital Goods—8.6% | |||||||||||
| 3M Co. | 1,204 | 83,786 | |||||||||
| Boeing Co. | 3,038 | 199,658 | |||||||||
| Caterpillar, Inc. | 2,506 | 184,993 | |||||||||
| Cooper Industries Ltd., Class A | 462 | 18,249 | |||||||||
| Cummins, Inc. | 882 | 57,789 | |||||||||
| Danaher Corp. | 504 | 38,959 | |||||||||
| Deere & Co. | 1,064 | 76,746 | |||||||||
| Dover Corp. | 658 | 31,827 | |||||||||
| Eaton Corp. | 588 | 49,962 | |||||||||
| Emerson Electric Co. | 1,554 | 76,845 | |||||||||
| Fluor Corp. | 448 | 83,364 | |||||||||
| General Dynamics Corp. | 1,204 | 101,377 | |||||||||
| General Electric Co. | 18,888 | 504,122 | |||||||||
| Goodrich Corp. | 364 | 17,275 | |||||||||
| Honeywell International, Inc. | 2,436 | 122,482 | |||||||||
| Illinois Tool Works, Inc. | 1,176 | 55,872 | |||||||||
| Ingersoll-Rand Co. Ltd., Class A | 1,038 | 38,852 | |||||||||
| ITT Corp. | 560 | 35,465 | |||||||||
| Jacobs Engineering Group, Inc.* | 392 | 31,634 | |||||||||
| L-3 Communications Holdings, Inc. | 490 | 44,526 | |||||||||
| Lockheed Martin Corp. | 1,582 | 156,080 | |||||||||
| Manitowoc Co., Inc. | 350 | 11,386 | |||||||||
| Masco Corp. | 2,296 | 36,116 | |||||||||
| Northrop Grumman Corp. | 1,582 | 105,836 | |||||||||
| Investments | Shares | Value | |||||||||
| PACCAR, Inc. | 1,274 | $ | 53,291 | ||||||||
| Pall Corp. | 238 | 9,444 | |||||||||
| Parker Hannifin Corp. | 546 | 38,941 | |||||||||
| Precision Castparts Corp. | 126 | 12,143 | |||||||||
| Raytheon Co. | 1,288 | 72,489 | |||||||||
| Rockwell Automation, Inc. | 294 | 12,857 | |||||||||
| Rockwell Collins, Inc. | 238 | 11,414 | |||||||||
| Terex Corp.* | 574 | 29,486 | |||||||||
| Textron, Inc. | 742 | 35,564 | |||||||||
| Tyco International Ltd. | 3,178 | 127,247 | |||||||||
| United Technologies Corp. | 2,912 | 179,670 | |||||||||
| W.W. Grainger, Inc. | 294 | 24,049 | |||||||||
| Total Capital Goods | 2,769,796 | ||||||||||
| Commercial Services & Supplies—0.7% | |||||||||||
| Allied Waste Industries, Inc.* | 2,184 | 27,562 | |||||||||
| Avery Dennison Corp. | 490 | 21,526 | |||||||||
| Cintas Corp. | 476 | 12,619 | |||||||||
| Equifax, Inc. | 196 | 6,590 | |||||||||
| Monster Worldwide, Inc.* | 168 | 3,462 | |||||||||
| Pitney Bowes, Inc. | 658 | 22,438 | |||||||||
| R.R. Donnelley & Sons Co. | 1,218 | 36,162 | |||||||||
| Robert Half International, Inc. | 742 | 17,786 | |||||||||
| Waste Management, Inc. | 1,596 | 60,185 | |||||||||
| Total Commercial Services & Supplies | 208,330 | ||||||||||
| Consumer Durables & Apparel—1.8% | |||||||||||
| Black & Decker Corp. | 336 | 19,323 | |||||||||
| Centex Corp. | 2,240 | 29,949 | |||||||||
| Coach, Inc.* | 294 | 8,491 | |||||||||
| D.R. Horton, Inc. | 4,452 | 48,304 | |||||||||
| Eastman Kodak Co. | 2,002 | 28,889 | |||||||||
| Fortune Brands, Inc. | 462 | 28,833 | |||||||||
| Harman International Industries, Inc. | 210 | 8,692 | |||||||||
| Hasbro, Inc. | 546 | 19,503 | |||||||||
| Jones Apparel Group, Inc. | 994 | 13,668 | |||||||||
| KB Home | 1,666 | 28,205 | |||||||||
| Leggett & Platt, Inc. | 1,106 | 18,548 | |||||||||
| Lennar Corp. Class A | 3,192 | 39,389 | |||||||||
| Liz Claiborne, Inc. | 826 | 11,688 | |||||||||
| Mattel, Inc. | 1,218 | 20,852 | |||||||||
| Newell Rubbermaid, Inc. | 994 | 16,689 | |||||||||
| Nike, Inc. Class B | 994 | 59,252 | |||||||||
| Polo Ralph Lauren Corp. | 266 | 16,699 | |||||||||
| Pulte Homes, Inc. | 4,494 | 43,277 | |||||||||
| Snap-On, Inc. | 238 | 12,378 | |||||||||
| Stanley Works | 350 | 15,691 | |||||||||
| VF Corp. | 392 | 27,903 | |||||||||
| Whirlpool Corp. | 966 | 59,632 | |||||||||
| Total Consumer Durables & Apparel | 575,855 | ||||||||||
| Consumer Services—1.0% | |||||||||||
| Apollo Group, Inc. Class A* | 140 | 6,196 | |||||||||
| Carnival Corp. | 1,176 | 38,761 | |||||||||
| Darden Restaurants, Inc. | 602 | 19,228 | |||||||||
| H&R Block, Inc. | 854 | 18,276 | |||||||||
| International Game Technology | 252 | 6,295 | |||||||||
| Marriott International, Inc. Class A | 1,470 | 38,573 | |||||||||
| McDonald's Corp. | 1,582 | 88,940 | |||||||||
The accompanying notes are an integral part of these financial statements.
12
Schedule of Investments — continued
REVENUESHARES LARGE CAP FUND
JUNE 30, 2008
| Investments | Shares | Value | |||||||||
| Consumer Services—1.0% (continued) | |||||||||||
| Starbucks Corp.* | 1,652 | $ | 26,002 | ||||||||
| Starwood Hotels & Resorts Worldwide, Inc. | 476 | 19,073 | |||||||||
| Wendy's International, Inc. | 364 | 9,908 | |||||||||
| Wyndham Worldwide Corp. | 602 | 10,782 | |||||||||
| Yum! Brands, Inc. | 1,134 | 39,792 | |||||||||
| Total Consumer Services | 321,826 | ||||||||||
| Diversified Financials—7.0% | |||||||||||
| American Capital Strategies Ltd. | 210 | 4,992 | |||||||||
| American Express Co. | 2,226 | 83,853 | |||||||||
| Ameriprise Financial, Inc. | 630 | 25,622 | |||||||||
| Bank of America Corp. | 11,286 | 269,397 | |||||||||
| Bank of New York Mellon Corp. | 1,064 | 40,251 | |||||||||
| Capital One Financial Corp. | 1,512 | 57,471 | |||||||||
| Charles Schwab Corp. | 938 | 19,267 | |||||||||
| CIT Group, Inc. | 1,316 | 8,962 | |||||||||
| Citigroup, Inc. | 21,740 | 364,361 | |||||||||
| CME Group, Inc. | 14 | 5,365 | |||||||||
| Discover Financial Services | 1,568 | 20,651 | |||||||||
| E*Trade Financial Corp.* | 4,634 | 14,551 | |||||||||
| Federated Investors, Inc. Class B | 112 | 3,855 | |||||||||
| Franklin Resources, Inc. | 224 | 20,530 | |||||||||
| Goldman Sachs Group, Inc. | 1,610 | 281,589 | |||||||||
| IntercontinentalExchange, Inc.* | 14 | 1,596 | |||||||||
| Janus Capital Group, Inc. | 140 | 3,706 | |||||||||
| JPMorgan Chase & Co. | 10,586 | 363,205 | |||||||||
| Legg Mason, Inc. | 238 | 10,370 | |||||||||
| Lehman Brothers Holdings, Inc. | 3,948 | 78,210 | |||||||||
| Leucadia National Corp. | 70 | 3,286 | |||||||||
| Merrill Lynch & Co., Inc. | 5,620 | 178,210 | |||||||||
| Moody's Corp. | 266 | 9,161 | |||||||||
| Morgan Stanley | 7,654 | 276,080 | |||||||||
| Northern Trust Corp. | 266 | 18,240 | |||||||||
| NYSE Euronext | 182 | 9,220 | |||||||||
| SLM Corp.* | 1,106 | 21,401 | |||||||||
| State Street Corp. | 588 | 37,626 | |||||||||
| T. Rowe Price Group, Inc. | 154 | 8,696 | |||||||||
| Total Diversified Financials | 2,239,724 | ||||||||||
| Energy—16.3% | |||||||||||
| Anadarko Petroleum Corp. | 826 | 61,818 | |||||||||
| Apache Corp. | 378 | 52,542 | |||||||||
| Baker Hughes, Inc. | 518 | 45,242 | |||||||||
| BJ Services Co. | 812 | 25,935 | |||||||||
| Cabot Oil & Gas Corp. | 205 | 13,885 | |||||||||
| Cameron International Corp.* | 1,008 | 55,793 | |||||||||
| Chesapeake Energy Corp. | 840 | 55,406 | |||||||||
| Chevron Corp. | 8,984 | 890,584 | |||||||||
| ConocoPhillips | 8,704 | 821,571 | |||||||||
| Consol Energy, Inc. | 252 | 28,317 | |||||||||
| Devon Energy Corp. | 532 | 63,925 | |||||||||
| El Paso Corp. | 1,106 | 24,044 | |||||||||
| ENSCO International, Inc. | 168 | 13,564 | |||||||||
| EOG Resources, Inc. | 182 | 23,878 | |||||||||
| Exxon Mobil Corp. | 15,654 | 1,379,587 | |||||||||
| Halliburton Co. | 1,932 | 102,531 | |||||||||
| Hess Corp. | 1,666 | 210,233 | |||||||||
| Investments | Shares | Value | |||||||||
| Marathon Oil Corp. | 4,060 | $ | 210,592 | ||||||||
| Massey Energy Co. | 250 | 23,438 | |||||||||
| Murphy Oil Corp. | 924 | 90,598 | |||||||||
| Nabors Industries Ltd.* | 770 | 37,907 | |||||||||
| National Oilwell Varco, Inc.* | 532 | 47,199 | |||||||||
| Noble Corp. | 210 | 13,642 | |||||||||
| Noble Energy, Inc. | 168 | 16,894 | |||||||||
| Occidental Petroleum Corp. | 1,022 | 91,837 | |||||||||
| Peabody Energy Corp. | 406 | 35,748 | |||||||||
| Range Resources Corp. | 504 | 33,032 | |||||||||
| Rowan Cos., Inc. | 224 | 10,472 | |||||||||
| Schlumberger Ltd. | 980 | 105,281 | |||||||||
| Smith International, Inc. | 546 | 45,394 | |||||||||
| Southwestern Energy Co.* | 1,050 | 49,991 | |||||||||
| Spectra Energy Corp. | 770 | 22,130 | |||||||||
| Sunoco, Inc. | 2,408 | 97,982 | |||||||||
| Tesoro Corp. | 1,666 | 32,937 | |||||||||
| Transocean, Inc.* | 168 | 25,602 | |||||||||
| Valero Energy Corp. | 5,578 | 229,702 | |||||||||
| Weatherford International Ltd.* | 952 | 47,210 | |||||||||
| Williams Cos., Inc. | 1,330 | 53,612 | |||||||||
| XTO Energy, Inc. | 434 | 29,733 | |||||||||
| Total Energy | 5,219,788 | ||||||||||
| Food & Staples Retailing—9.4% | |||||||||||
| Costco Wholesale Corp. | 3,794 | 266,111 | |||||||||
| CVS Caremark Corp. | 6,996 | 276,832 | |||||||||
| Kroger Co. | 9,292 | 268,260 | |||||||||
| Safeway, Inc. | 4,948 | 141,265 | |||||||||
| SUPERVALU, Inc. | 3,248 | 100,331 | |||||||||
| SYSCO Corp. | 4,284 | 117,853 | |||||||||
| Walgreen Co. | 6,026 | 195,905 | |||||||||
| Wal-Mart Stores, Inc. | 28,844 | 1,621,033 | |||||||||
| Whole Foods Market, Inc. | 616 | 14,593 | |||||||||
| Total Food & Staples Retailing | 3,002,183 | ||||||||||
| Food Beverage & Tobacco—4.3% | |||||||||||
| Altria Group, Inc. | 8,242 | 169,457 | |||||||||
| Anheuser-Busch Cos., Inc. | 1,302 | 80,880 | |||||||||
| Archer-Daniels-Midland Co. | 4,592 | 154,980 | |||||||||
| Brown-Forman Corp. Class B | 140 | 10,580 | |||||||||
| Campbell Soup Co. | 868 | 29,043 | |||||||||
| Coca-Cola Co. | 1,806 | 93,876 | |||||||||
| Coca-Cola Enterprises, Inc. | 3,234 | 55,948 | |||||||||
| ConAgra Foods, Inc. | 1,960 | 37,789 | |||||||||
| Constellation Brands, Inc. Class A* | 882 | 17,517 | |||||||||
| Dean Foods Co. | 1,820 | 35,708 | |||||||||
| General Mills, Inc. | 840 | 51,047 | |||||||||
| H.J. Heinz Co. | 784 | 37,514 | |||||||||
| Hershey Co. | 518 | 16,980 | |||||||||
| Kellogg Co. | 896 | 43,026 | |||||||||
| Kraft Foods, Inc. Class A | 4,326 | 123,075 | |||||||||
| Lorillard Inc.* | 3 | 207 | |||||||||
| McCormick & Co., Inc.† | 308 | 10,983 | |||||||||
| Molson Coors Brewing Co. Class B | 462 | 25,100 | |||||||||
| Pepsi Bottling Group, Inc. | 1,288 | 35,961 | |||||||||
| PepsiCo, Inc. | 2,016 | 128,197 | |||||||||
| Philip Morris International, Inc. | 589 | 29,091 | |||||||||
| Reynolds American, Inc. | 518 | 24,175 | |||||||||
The accompanying notes are an integral part of these financial statements.
13
Schedule of Investments — continued
REVENUESHARES LARGE CAP FUND
JUNE 30, 2008
| Investments | Shares | Value | |||||||||
| Food Beverage & Tobacco—4.3% (continued) | |||||||||||
| Sara Lee Corp. | 3,010 | $ | 36,873 | ||||||||
| Tyson Foods, Inc. Class A | 7,514 | 112,259 | |||||||||
| UST, Inc. | 140 | 7,645 | |||||||||
| Wm. Wrigley Jr. Co. | 336 | 26,134 | |||||||||
| Total Food Beverage & Tobacco | 1,394,045 | ||||||||||
| Health Care Equipment & Services—6.2% | |||||||||||
| Aetna, Inc. | 1,890 | 76,602 | |||||||||
| AmerisourceBergen Corp. | 6,138 | 245,458 | |||||||||
| Baxter International, Inc. | 770 | 49,234 | |||||||||
| Becton Dickinson & Co. | 322 | 26,179 | |||||||||
| Boston Scientific Corp.* | 2,688 | 33,036 | |||||||||
| C.R. Bard, Inc. | 112 | 9,850 | |||||||||
| Cardinal Health, Inc. | 5,914 | 305,043 | |||||||||
| Cigna Corp. | 1,330 | 47,069 | |||||||||
| Coventry Health Care, Inc.* | 658 | 20,016 | |||||||||
| Covidien Ltd. | 1,050 | 50,285 | |||||||||
| Express Scripts, Inc.* | 1,050 | 65,856 | |||||||||
| Hospira, Inc.* | 308 | 12,354 | |||||||||
| Humana, Inc.* | 1,274 | 50,667 | |||||||||
| IMS Health, Inc. | 392 | 9,134 | |||||||||
| Intuitive Surgical, Inc.* | 28 | 7,543 | |||||||||
| Laboratory Corp. of America Holdings* | 224 | 15,597 | |||||||||
| McKesson Corp. | 5,746 | 321,258 | |||||||||
| Medco Health Solutions, Inc.* | 3,626 | 171,147 | |||||||||
| Medtronic, Inc. | 980 | 50,715 | |||||||||
| Patterson Cos., Inc.* | 364 | 10,698 | |||||||||
| Quest Diagnostics, Inc. | 490 | 23,750 | |||||||||
| St. Jude Medical, Inc.* | 378 | 15,453 | |||||||||
| Stryker Corp. | 336 | 21,128 | |||||||||
| Tenet Healthcare Corp.* | 6,856 | 38,119 | |||||||||
| UnitedHealth Group, Inc. | 5,578 | 146,423 | |||||||||
| Varian Medical Systems, Inc.* | 140 | 7,259 | |||||||||
| WellPoint, Inc.* | 2,898 | 138,119 | |||||||||
| Zimmer Holdings, Inc.* | 238 | 16,196 | |||||||||
| Total Health Care Equipment & Service | 1,984,188 | ||||||||||
| Household & Personal Products—1.4% | |||||||||||
| Avon Products, Inc. | 994 | 35,804 | |||||||||
| Clorox Co. | 308 | 16,078 | |||||||||
| Colgate-Palmolive Co. | 700 | 48,370 | |||||||||
| Estee Lauder Cos., Inc. Class A | 644 | 29,914 | |||||||||
| Kimberly-Clark Corp. | 1,064 | 63,606 | |||||||||
| Procter & Gamble Co. | 4,214 | 256,253 | |||||||||
| Total Household & Personal Products | 450,025 | ||||||||||
| Insurance—4.5% | |||||||||||
| ACE Ltd. | 994 | 54,759 | |||||||||
| Aflac, Inc. | 1,008 | 63,302 | |||||||||
| Allstate Corp. | 2,996 | 136,588 | |||||||||
| American International Group, Inc. | 8,984 | 237,716 | |||||||||
| AON Corp. | 756 | 34,731 | |||||||||
| Assurant, Inc. | 532 | 35,091 | |||||||||
| Chubb Corp. | 1,078 | 52,833 | |||||||||
| Cincinnati Financial Corp. | 448 | 11,379 | |||||||||
| Genworth Financial, Inc. Class A | 1,764 | 31,417 | |||||||||
| Investments | Shares | Value | |||||||||
| Hartford Financial Services Group, Inc. | 1,232 | $ | 79,550 | ||||||||
| Lincoln National Corp. | 728 | 32,993 | |||||||||
| Loews Corp. | 1,624 | 76,166 | |||||||||
| Marsh & McLennan Cos., Inc. | 1,834 | 48,693 | |||||||||
| MBIA, Inc. | 336 | 1,475 | |||||||||
| MetLife, Inc. | 3,388 | 178,784 | |||||||||
| Principal Financial Group, Inc. | 714 | 29,967 | |||||||||
| Progressive Corp. | 3,304 | 61,851 | |||||||||
| Prudential Financial, Inc. | 1,512 | 90,327 | |||||||||
| Safeco Corp. | 448 | 30,088 | |||||||||
| Torchmark Corp. | 238 | 13,959 | |||||||||
| Travelers Cos., Inc. | 2,016 | 87,494 | |||||||||
| Unum Group | 1,764 | 36,074 | |||||||||
| XL Capital Ltd., Class A | 672 | 13,816 | |||||||||
| Total Insurance | 1,439,053 | ||||||||||
| Materials—4.1% | |||||||||||
| Air Products & Chemicals, Inc. | 406 | 40,137 | |||||||||
| AK Steel Holding Corp. | 510 | 35,190 | |||||||||
| Alcoa, Inc. | 3,612 | 128,659 | |||||||||
| Allegheny Technologies, Inc. | 252 | 14,939 | |||||||||
| Ashland, Inc. | 658 | 31,716 | |||||||||
| Ball Corp. | 672 | 32,081 | |||||||||
| Bemis Co. Inc. | 560 | 12,555 | |||||||||
| Dow Chemical Co. | 5,158 | 180,066 | |||||||||
| E.I. Du Pont de Nemours & Co. | 2,534 | 108,683 | |||||||||
| Eastman Chemical Co. | 476 | 32,777 | |||||||||
| Ecolab, Inc. | 448 | 19,260 | |||||||||
| Freeport-McMoRan Copper & Gold, Inc. | 630 | 73,830 | |||||||||
| Hercules, Inc. | 462 | 7,822 | |||||||||
| International Flavors & Fragrances, Inc. | 182 | 7,109 | |||||||||
| International Paper Co. | 2,688 | 62,630 | |||||||||
| MeadWestvaco Corp. | 840 | 20,026 | |||||||||
| Monsanto Co. | 336 | 42,484 | |||||||||
| Newmont Mining Corp. | 476 | 24,828 | |||||||||
| Nucor Corp. | 1,106 | 82,585 | |||||||||
| Pactiv Corp.* | 490 | 10,403 | |||||||||
| PPG Industries, Inc. | 700 | 40,159 | |||||||||
| Praxair, Inc. | 434 | 40,900 | |||||||||
| Rohm & Haas Co. | 658 | 30,558 | |||||||||
| Sealed Air Corp. | 812 | 15,436 | |||||||||
| Sigma-Aldrich Corp. | 154 | 8,294 | |||||||||
| Titanium Metals Corp. | 196 | 2,742 | |||||||||
| United States Steel Corp. | 700 | 129,346 | |||||||||
| Vulcan Materials Co. | 168 | 10,043 | |||||||||
| Weyerhaeuser Co. | 1,036 | 52,981 | |||||||||
| Total Materials | 1,298,239 | ||||||||||
| Media—2.6% | |||||||||||
| CBS Corp. Class B† | 2,184 | 42,566 | |||||||||
| Clear Channel Communications, Inc. | 812 | 28,582 | |||||||||
| Comcast Corp. Class A | 5,928 | 112,454 | |||||||||
| DIRECTV Group, Inc.* | 2,856 | 73,999 | |||||||||
| E.W. Scripps Co. Class A | 238 | 9,887 | |||||||||
| Gannett Co., Inc. | 896 | 19,416 | |||||||||
| Interpublic Group of Cos., Inc.* | 2,842 | 24,441 | |||||||||
The accompanying notes are an integral part of these financial statements.
14
Schedule of Investments — continued
REVENUESHARES LARGE CAP FUND
JUNE 30, 2008
| Investments | Shares | Value | |||||||||
| Media—2.6% (continued) | |||||||||||
| McGraw-Hill Cos., Inc. | 616 | $ | 24,714 | ||||||||
| Meredith Corp. | 126 | 3,565 | |||||||||
| New York Times Co. Class A | 798 | 12,281 | |||||||||
| News Corp. Class A | 5,648 | 84,946 | |||||||||
| Omnicom Group, Inc. | 1,064 | 47,752 | |||||||||
| Time Warner, Inc. | 11,188 | 165,583 | |||||||||
| Viacom, Inc., Class B* | 1,218 | 37,198 | |||||||||
| Walt Disney Co. | 4,466 | 139,339 | |||||||||
| Washington Post Co. Class B | 14 | 8,217 | |||||||||
| Total Media | 834,940 | ||||||||||
| Pharmaceuticals, Biotechnology—3.1% | |||||||||||
| Abbott Laboratories | 1,736 | 91,956 | |||||||||
| Allergan, Inc. | 224 | 11,659 | |||||||||
| Amgen, Inc.* | 1,120 | 52,819 | |||||||||
| Applera Corp./Applied Biosystems Group | 252 | 8,437 | |||||||||
| Barr Pharmaceuticals, Inc.* | 168 | 7,573 | |||||||||
| Biogen Idec, Inc.* | 168 | 9,390 | |||||||||
| Bristol-Myers Squibb Co. | 2,646 | 54,322 | |||||||||
| Celgene Corp.* | 84 | 5,365 | |||||||||
| Eli Lilly & Co. | 1,400 | 64,624 | |||||||||
| Forest Laboratories, Inc.* | 364 | 12,645 | |||||||||
| Genzyme Corp.* | 210 | 15,124 | |||||||||
| Gilead Sciences, Inc.* | 364 | 19,274 | |||||||||
| Johnson & Johnson | 3,556 | 228,793 | |||||||||
| King Pharmaceuticals, Inc.* | 840 | 8,795 | |||||||||
| Merck & Co., Inc. | 1,694 | 63,847 | |||||||||
| Millipore Corp.* | 84 | 5,700 | |||||||||
| Mylan, Inc.* | 532 | 6,421 | |||||||||
| PerkinElmer, Inc. | 266 | 7,408 | |||||||||
| Pfizer, Inc. | 8,438 | 147,412 | |||||||||
| Schering-Plough Corp. | 1,526 | 30,047 | |||||||||
| Thermo Fisher Scientific, Inc.* | 630 | 35,110 | |||||||||
| Waters Corp.* | 70 | 4,515 | |||||||||
| Watson Pharmaceuticals, Inc.* | 350 | 9,510 | |||||||||
| Wyeth | 1,862 | 89,302 | |||||||||
| Total Pharmaceuticals, Biotechnology | 990,048 | ||||||||||
| Real Estate—0.5% | |||||||||||
| Apartment Investment & Management Co. Class A (a) | 196 | 6,676 | |||||||||
| AvalonBay Communities, Inc. (a) | 42 | 3,745 | |||||||||
| Boston Properties, Inc. (a) | 70 | 6,315 | |||||||||
| CB Richard Ellis Group, Inc. Class A* | 1,036 | 19,891 | |||||||||
| Developers Diversified Realty Corp. (a) | 84 | 2,916 | |||||||||
| Equity Residential (a) | 238 | 9,108 | |||||||||
| General Growth Properties, Inc. (a) | 294 | 10,299 | |||||||||
| HCP Inc. (a) | 350 | 11,134 | |||||||||
| Host Hotels & Resorts, Inc. (a) | 1,204 | 16,435 | |||||||||
| Kimco Realty Corp. (a) | 84 | 2,900 | |||||||||
| Plum Creek Timber Co., Inc. (a) | 154 | 6,577 | |||||||||
| Prologis (a) | 392 | 21,305 | |||||||||
| Public Storage (a) | 98 | 7,917 | |||||||||
| Simon Property Group, Inc. (a) | 154 | 13,843 | |||||||||
| Vornado Realty Trust (a) | 168 | 14,784 | |||||||||
| Total Real Estate | 153,845 | ||||||||||
| Investments | Shares | Value | |||||||||
| Retailing—5.3% | |||||||||||
| Abercrombie & Fitch Co. Class A | 154 | $ | 9,653 | ||||||||
| Amazon.com, Inc.* | 574 | 42,091 | |||||||||
| AutoNation, Inc.* | 4,494 | 45,030 | |||||||||
| Autozone, Inc.* | 196 | 23,718 | |||||||||
| Bed Bath & Beyond, Inc.* | 826 | 23,211 | |||||||||
| Best Buy Co., Inc. | 2,716 | 107,554 | |||||||||
| Big Lots, Inc.* | 1,092 | 34,114 | |||||||||
| Dillard's, Inc. Class A | 1,540 | 17,818 | |||||||||
| Expedia, Inc.* | 308 | 5,661 | |||||||||
| Family Dollar Stores, Inc. | 1,204 | 24,008 | |||||||||
| GameStop Corp. Class A* | 140 | 5,656 | |||||||||
| Gap, Inc. | 3,136 | 52,277 | |||||||||
| Genuine Parts Co. | 924 | 36,664 | |||||||||
| Home Depot, Inc. | 11,888 | 278,416 | |||||||||
| IAC/InterActiveCorp.* | 952 | 18,355 | |||||||||
| JC Penney Co., Inc. | 1,792 | 65,032 | |||||||||
| Kohl's Corp.* | 1,204 | 48,208 | |||||||||
| Limited Brands, Inc. | 2,086 | 35,149 | |||||||||
| Lowe's Cos., Inc. | 8,018 | 166,373 | |||||||||
| Macy's, Inc. | 3,682 | 71,504 | |||||||||
| Nordstrom, Inc. | 924 | 27,997 | |||||||||
| Office Depot, Inc.* | 3,920 | 42,885 | |||||||||
| RadioShack Corp. | 966 | 11,853 | |||||||||
| Sears Holdings Corp.* | 1,988 | 146,436 | |||||||||
| Sherwin-Williams Co. | 546 | 25,078 | |||||||||
| Staples, Inc. | 2,968 | 70,490 | |||||||||
| Target Corp. | 3,934 | 182,891 | |||||||||
| Tiffany & Co. | 210 | 8,558 | |||||||||
| TJX Cos., Inc. | 2,408 | 75,780 | |||||||||
| Total Retailing | 1,702,460 | ||||||||||
| Semiconductors & Semiconductor Equipment—1.1% | |||||||||||
| Advanced Micro Devices, Inc.* | 2,674 | 15,589 | |||||||||
| Altera Corp. | 280 | 5,796 | |||||||||
| Analog Devices, Inc. | 364 | 11,564 | |||||||||
| Applied Materials, Inc. | 2,254 | 43,029 | |||||||||
| Broadcom Corp. Class A* | 574 | 15,664 | |||||||||
| Intel Corp. | 5,830 | 125,229 | |||||||||
| KLA-Tencor Corp. | 224 | 9,119 | |||||||||
| Linear Technology Corp. | 154 | 5,016 | |||||||||
| LSI Logic Corp.* | 1,848 | 11,347 | |||||||||
| MEMC Electronic Materials, Inc.* | 98 | 6,031 | |||||||||
| Microchip Technology, Inc. | 140 | 4,276 | |||||||||
| Micron Technology, Inc.* | 2,688 | 16,128 | |||||||||
| National Semiconductor Corp. | 378 | 7,764 | |||||||||
| Novellus Systems Inc.* | 266 | 5,637 | |||||||||
| NVIDIA Corp.* | 364 | 6,814 | |||||||||
| Teradyne, Inc.* | 434 | 4,804 | |||||||||
| Texas Instruments, Inc. | 1,778 | 50,068 | |||||||||
| Xilinx, Inc. | 350 | 8,838 | |||||||||
| Total Semiconductors & Semiconductor Equipment | 352,713 | ||||||||||
| Software & Services—2.4% | |||||||||||
| Adobe Systems, Inc.* | 280 | 11,029 | |||||||||
| Affiliated Computer Services, Inc. Class A* | 532 | 28,457 | |||||||||
| Akamai Technologies, Inc.* | 70 | 2,435 | |||||||||
The accompanying notes are an integral part of these financial statements.
15
Schedule of Investments — continued
REVENUESHARES LARGE CAP FUND
JUNE 30, 2008
| Investments | Shares | Value | |||||||||
| Software & Services—2.4% (continued) | |||||||||||
| Autodesk, Inc.* | 154 | $ | 5,207 | ||||||||
| Automatic Data Processing, Inc. | 742 | 31,090 | |||||||||
| BMC Software, Inc.* | 196 | 7,056 | |||||||||
| CA, Inc. | 644 | 14,870 | |||||||||
| Citrix Systems, Inc.* | 140 | 4,117 | |||||||||
| Cognizant Technology Solutions Corp., Class A* | 266 | 8,648 | |||||||||
| Computer Sciences Corp.* | 1,176 | 55,084 | |||||||||
| Compuware Corp.* | 560 | 5,342 | |||||||||
| Convergys Corp.* | 728 | 10,818 | |||||||||
| eBay, Inc.* | 896 | 24,488 | |||||||||
| Electronic Arts, Inc.* | 238 | 10,574 | |||||||||
| Electronic Data Systems Corp. | 4,550 | 112,112 | |||||||||
| Fidelity National Information Services, Inc. | 448 | 16,536 | |||||||||
| Fiserv, Inc.* | 392 | 17,785 | |||||||||
| Google, Inc. Class A* | 84 | 44,219 | |||||||||
| Intuit, Inc.* | 364 | 10,035 | |||||||||
| Microsoft Corp. | 6,208 | 170,782 | |||||||||
| Novell, Inc.* | 560 | 3,298 | |||||||||
| Oracle Corp.* | 3,500 | 73,500 | |||||||||
| Paychex, Inc. | 196 | 6,131 | |||||||||
| Symantec Corp.* | 1,176 | 22,756 | |||||||||
| Total System Services, Inc. | 616 | 13,688 | |||||||||
| Unisys Corp.* | 4,704 | 18,581 | |||||||||
| VeriSign, Inc.* | 168 | 6,350 | |||||||||
| Western Union Co. | 854 | 21,111 | |||||||||
| Yahoo! Inc.* | 1,064 | 21,982 | |||||||||
| Total Software & Services | 778,081 | ||||||||||
| Technology Hardware & Equipment—5.3% | |||||||||||
| Agilent Technologies, Inc.* | 588 | 20,898 | |||||||||
| Apple, Inc.* | 518 | 86,734 | |||||||||
| Ciena Corp* | 70 | 1,622 | |||||||||
| Cisco Systems, Inc.* | 5,102 | 118,673 | |||||||||
| Corning, Inc. | 952 | 21,944 | |||||||||
| Dell, Inc.* | 10,138 | 221,819 | |||||||||
| EMC Corp.* | 2,702 | 39,692 | |||||||||
| Hewlett-Packard Co. | 8,158 | 360,666 | |||||||||
| International Business Machines Corp. | 3,710 | 439,747 | |||||||||
| Jabil Circuit, Inc. | 3,052 | 50,083 | |||||||||
| JDS Uniphase Corp.* | 434 | 4,930 | |||||||||
| Juniper Networks, Inc.* | 350 | 7,763 | |||||||||
| Lexmark International, Inc. Class A* | 602 | 20,125 | |||||||||
| Molex, Inc. | 490 | 11,961 | |||||||||
| Motorola, Inc. | 10,180 | 74,721 | |||||||||
| NetApp Inc.* | 434 | 9,400 | |||||||||
| QLogic Corp.* | 168 | 2,451 | |||||||||
| QUALCOMM, Inc. | 896 | 39,756 | |||||||||
| SanDisk Corp.* | 420 | 7,854 | |||||||||
| Sun Microsystems Inc.* | 2,730 | 29,702 | |||||||||
| Tellabs, Inc.* | 1,162 | 5,403 | |||||||||
| Teradata Corporation* | 252 | 5,831 | |||||||||
| Tyco Electronics Ltd. | 1,498 | 53,658 | |||||||||
| Xerox Corp. | 4,116 | 55,813 | |||||||||
| Total Technology Hardware & Equipment | 1,691,246 | ||||||||||
| Investments | Shares | Value | |||||||||
| Telecommunication Services—2.8% | |||||||||||
| American Tower Corp., Class A* | 140 | $ | 5,915 | ||||||||
| AT&T, Inc. | 11,356 | 382,584 | |||||||||
| CenturyTel, Inc. | 252 | 8,969 | |||||||||
| Citizens Communications Co. | 714 | 8,097 | |||||||||
| Embarq Corp. | 546 | 25,809 | |||||||||
| Qwest Communications International, Inc. | 8,438 | 33,161 | |||||||||
| Sprint Nextel Corp.* | 10,852 | 103,094 | |||||||||
| Verizon Communications, Inc. | 8,662 | 306,635 | |||||||||
| Windstream Corp. | 1,022 | 12,611 | |||||||||
| Total Telecommunication Services | 886,875 | ||||||||||
| Transportation—2.1% | |||||||||||
| Burlington Northern Santa Fe Corp. | 770 | 76,915 | |||||||||
| C.H. Robinson Worldwide, Inc. | 546 | 29,943 | |||||||||
| CSX Corp. | 980 | 61,554 | |||||||||
| Expeditors International Washington, Inc. | 448 | 19,264 | |||||||||
| FedEx Corp. | 1,456 | 114,718 | |||||||||
| Norfolk Southern Corp. | 742 | 46,501 | |||||||||
| Ryder System, Inc. | 630 | 43,394 | |||||||||
| Southwest Airlines Co. | 2,870 | 37,425 | |||||||||
| Union Pacific Corp. | 1,036 | 78,218 | |||||||||
| United Parcel Service, Inc. Class B | 2,772 | 170,395 | |||||||||
| Total Transportation | 678,327 | ||||||||||
| Utilities—3.7% | |||||||||||
| AES Corp.* | 2,492 | 47,871 | |||||||||
| Allegheny Energy, Inc. | 224 | 11,225 | |||||||||
| Ameren Corp. | 560 | 23,649 | |||||||||
| American Electric Power Co., Inc. | 1,106 | 44,494 | |||||||||
| Centerpoint Energy, Inc. | 2,156 | 34,604 | |||||||||
| CMS Energy Corp. | 1,582 | 23,572 | |||||||||
| Consolidated Edison, Inc. | 1,078 | 42,139 | |||||||||
| Constellation Energy Group, Inc. | 840 | 68,964 | |||||||||
| Dominion Resources, Inc. | 1,372 | 65,156 | |||||||||
| DTE Energy Co. | 770 | 32,679 | |||||||||
| Duke Energy Corp. | 2,856 | 49,637 | |||||||||
| Dynegy Inc. Class A* | 1,470 | 12,569 | |||||||||
| Edison International | 952 | 48,914 | |||||||||
| Entergy Corp. | 378 | 45,541 | |||||||||
| Exelon Corp. | 882 | 79,345 | |||||||||
| FirstEnergy Corp. | 728 | 59,936 | |||||||||
| FPL Group, Inc. | 868 | 56,923 | |||||||||
| Integrys Energy Group, Inc. | 728 | 37,004 | |||||||||
| Nicor, Inc. | 294 | 12,521 | |||||||||
| NiSource, Inc. | 1,722 | 30,858 | |||||||||
| Pepco Holdings, Inc. | 1,274 | 32,678 | |||||||||
| PG&E Corp. | 1,148 | 45,564 | |||||||||
| Pinnacle West Capital Corp. | 336 | 10,339 | |||||||||
| PPL Corp. | 532 | 27,808 | |||||||||
| Progress Energy, Inc. | 840 | 35,137 | |||||||||
| Public Service Enterprise Group, Inc. | 1,064 | 48,870 | |||||||||
| Questar Corp. | 210 | 14,918 | |||||||||
| Sempra Energy | 756 | 42,676 | |||||||||
| Southern Co. | 1,638 | 57,199 | |||||||||
The accompanying notes are an integral part of these financial statements.
16
Schedule of Investments — continued
REVENUESHARES LARGE CAP FUND
JUNE 30, 2008
| Investments | Shares | Value | |||||||||
| Utilities—3.7% (continued) | |||||||||||
| TECO Energy, Inc. | 812 | $ | 17,450 | ||||||||
| Xcel Energy, Inc. | 1,750 | 35,123 | |||||||||
| Total Utilities | 1,195,363 | ||||||||||
| Total Investments—99.6% (Cost $34,667,072) | 31,910,279 | ||||||||||
| SECURITIES SOLD SHORT—(0.0)% | |||||||||||
| Media—(0.0)% | |||||||||||
| E.W. Scripps Co. Class A* (b) (Proceeds $(731)) | (238 | ) | (731 | ) | |||||||
| Other Assets in Excess of Liabilities—0.4% | 138,808 | ||||||||||
| Net Assets—100.0% | $ | 32,048,356 | |||||||||
* Non-income producing security.
† Non-voting shares
(a) Real Estate Investment Trust (REIT)
(b) "When issued" (W/I)
The accompanying notes are an integral part of these financial statements.
17
Schedule of Investments
REVENUESHARES MID CAP FUND
JUNE 30, 2008
| Investments | Shares | Value | |||||||||
| COMMON STOCKS—99.3% | |||||||||||
| Automobiles & Components—2.8% | |||||||||||
| ArvinMeritor, Inc. | 3,954 | $ | 49,346 | ||||||||
| BorgWarner, Inc. | 552 | 24,498 | |||||||||
| Gentex Corp. | 174 | 2,513 | |||||||||
| Lear Corp.* | 3,068 | 43,504 | |||||||||
| Modine Manufacturing Co. | 460 | 5,690 | |||||||||
| Thor Industries, Inc. | 434 | 9,227 | |||||||||
| Total Automobiles & Components | 134,778 | ||||||||||
| Banks—1.6% | |||||||||||
| Associated Banc-Corp. | 308 | 5,941 | |||||||||
| Astoria Financial Corp. | 250 | 5,020 | |||||||||
| Bank of Hawaii Corp. | 84 | 4,015 | |||||||||
| Cathay General Bancorp | 110 | 1,196 | |||||||||
| City National Corp. | 94 | 3,955 | |||||||||
| Colonial BancGroup, Inc. | 568 | 2,511 | |||||||||
| Commerce Bancshares, Inc. | 225 | 8,924 | |||||||||
| Cullen/Frost Bankers, Inc. | 100 | 4,985 | |||||||||
| First Niagara Financial Group, Inc. | 230 | 2,958 | |||||||||
| FirstMerit Corp. | 214 | 3,490 | |||||||||
| New York Community Bancorp, Inc. | 460 | 8,206 | |||||||||
| PacWest Bancorp | 46 | 684 | |||||||||
| PMI Group, Inc. | 464 | 905 | |||||||||
| Radian Group, Inc. | 318 | 461 | |||||||||
| SVB Financial Group* | 66 | 3,175 | |||||||||
| Synovus Financial Corp. | 374 | 3,265 | |||||||||
| TCF Financial Corp. | 402 | 4,836 | |||||||||
| Washington Federal, Inc. | 138 | 2,498 | |||||||||
| Webster Financial Corp. | 196 | 3,646 | |||||||||
| Westamerica Bancorporation | 34 | 1,788 | |||||||||
| Wilmington Trust Corp. | 162 | 4,283 | |||||||||
| Total Banks | 76,742 | ||||||||||
| Capital Goods—10.7% | |||||||||||
| AGCO Corp.* | 488 | 25,576 | |||||||||
| Alliant Techsystems, Inc.* | 152 | 15,455 | |||||||||
| Ametek, Inc. | 230 | 10,861 | |||||||||
| BE Aerospace, Inc.* | 472 | 10,993 | |||||||||
| Carlisle Cos., Inc. | 366 | 10,614 | |||||||||
| Crane Co. | 292 | 11,251 | |||||||||
| Donaldson Co., Inc. | 208 | 9,285 | |||||||||
| DRS Technologies, Inc. | 228 | 17,948 | |||||||||
| Dycom Industries, Inc.* | 202 | 2,933 | |||||||||
| Fastenal Co. | 254 | 10,963 | |||||||||
| Federal Signal Corp. | 560 | 6,720 | |||||||||
| Flowserve Corp. | 196 | 26,793 | |||||||||
| GATX Corp. | 154 | 6,827 | |||||||||
| Graco, Inc. | 116 | 4,416 | |||||||||
| Granite Construction, Inc. | 360 | 11,351 | |||||||||
| Harsco Corp. | 320 | 17,411 | |||||||||
| Hubbell, Inc. Class B | 234 | 9,330 | |||||||||
| IDEX Corp. | 192 | 7,073 | |||||||||
| Joy Global, Inc. | 222 | 16,834 | |||||||||
| KBR, Inc. | 1,182 | 41,263 | |||||||||
| Kennametal, Inc. | 310 | 10,091 | |||||||||
| Lincoln Electric Holdings, Inc. | 168 | 13,222 | |||||||||
| MSC Industrial Direct Co. Class A | 192 | 8,469 | |||||||||
| Nordson Corp. | 94 | 6,852 | |||||||||
| Investments | Shares | Value | |||||||||
| Oshkosh Corp. | 580 | $ | 12,000 | ||||||||
| Pentair, Inc. | 506 | 17,720 | |||||||||
| Quanta Services, Inc.* | 462 | 15,371 | |||||||||
| Roper Industries, Inc. | 164 | 10,804 | |||||||||
| Shaw Group, Inc.* | 35 | 2,163 | |||||||||
| SPX Corp. | 242 | 31,878 | |||||||||
| Teleflex, Inc. | 242 | 13,453 | |||||||||
| Thomas & Betts Corp.* | 198 | 7,494 | |||||||||
| Timken Co. | 826 | 27,207 | |||||||||
| Trinity Industries, Inc. | 718 | 24,907 | |||||||||
| United Rentals, Inc.* | 834 | 16,355 | |||||||||
| URS Corp.* | 444 | 18,635 | |||||||||
| Wabtec Corp. | 198 | 9,627 | |||||||||
| Total Capital Goods | 520,145 | ||||||||||
| Commercial Services & Supplies—5.1% | |||||||||||
| Brink's Co. | 260 | 17,009 | |||||||||
| ChoicePoint, Inc.* | 150 | 7,230 | |||||||||
| Copart, Inc.* | 76 | 3,254 | |||||||||
| Corporate Executive Board Co. | 38 | 1,598 | |||||||||
| Corrections Corp. of America* | 776 | 21,317 | |||||||||
| Deluxe Corp. | 276 | 4,918 | |||||||||
| Dun & Bradstreet Corp. | 92 | 8,063 | |||||||||
| Herman Miller, Inc. | 346 | 8,612 | |||||||||
| HNI Corp. | 362 | 6,393 | |||||||||
| Kelly Services, Inc. Class A | 1,536 | 29,691 | |||||||||
| Korn/Ferry International* | 208 | 3,272 | |||||||||
| Manpower, Inc. | 1,646 | 95,863 | |||||||||
| Mine Safety Appliances Co. | 104 | 4,159 | |||||||||
| MPS Group, Inc.* | 1,004 | 10,673 | |||||||||
| Navigant Consulting, Inc.* | 306 | 5,985 | |||||||||
| Republic Services, Inc. | 484 | 14,375 | |||||||||
| Rollins, Inc. | 232 | 3,438 | |||||||||
| Stericycle, Inc.* | 76 | 3,929 | |||||||||
| Total Commercial Services & Supplies | 249,779 | ||||||||||
| Consumer Durables & Apparel—4.8% | |||||||||||
| American Greetings Corp. Class A | 404 | 4,985 | |||||||||
| Blyth, Inc. | 382 | 4,595 | |||||||||
| Callaway Golf Co. | 346 | 4,093 | |||||||||
| Furniture Brands International, Inc. | 1,138 | 15,204 | |||||||||
| Hanesbrands, Inc.* | 772 | 20,952 | |||||||||
| Hovnanian Enterprises, Inc. Class A* | 3,656 | 20,035 | |||||||||
| MDC Holdings, Inc. | 514 | 20,077 | |||||||||
| Mohawk Industries, Inc.* | 512 | 32,820 | |||||||||
| NVR, Inc.* | 58 | 29,005 | |||||||||
| Phillips-Van Heusen Corp. | 272 | 9,961 | |||||||||
| Ryland Group, Inc. | 782 | 17,055 | |||||||||
| Timberland Co. Class A* | 500 | 8,175 | |||||||||
| Toll Brothers, Inc.* | 1,332 | 24,948 | |||||||||
| Tupperware Brands Corp. | 288 | 9,855 | |||||||||
| Under Armour, Inc. Class A* | 90 | 2,308 | |||||||||
| Warnaco Group Inc.* | 276 | 12,163 | |||||||||
| Total Consumer Durables & Apparel | 236,231 | ||||||||||
| Consumer Services—2.1% | |||||||||||
| Bob Evans Farms, Inc. | 278 | 7,951 | |||||||||
| Boyd Gaming Corp. | 282 | 3,542 | |||||||||
| Brinker International, Inc. | 960 | 18,144 | |||||||||
The accompanying notes are an integral part of these financial statements.
18
Schedule of Investments — continued
REVENUESHARES MID CAP FUND
JUNE 30, 2008
| Investments | Shares | Value | |||||||||
| Consumer Services—2.1% (continued) | |||||||||||
| Career Education Corp.* | 296 | $ | 4,325 | ||||||||
| CBRL Group, Inc. | 344 | 8,431 | |||||||||
| Cheesecake Factory* | 328 | 5,218 | |||||||||
| Chipotle Mexican Grill, Inc. Class A* | 38 | 3,140 | |||||||||
| Corinthian Colleges, Inc.* | 272 | 3,158 | |||||||||
| DeVry, Inc. | 86 | 4,611 | |||||||||
| International Speedway Corp. Class A | 100 | 3,903 | |||||||||
| ITT Educational Services, Inc.* | 38 | 3,140 | |||||||||
| Life Time Fitness, Inc.* | 62 | 1,832 | |||||||||
| Matthews International Corp. Class A | 88 | 3,983 | |||||||||
| Regis Corp. | 478 | 12,595 | |||||||||
| Scientific Games Corp. Class A* | 164 | 4,858 | |||||||||
| Service Corp. International | 862 | 8,499 | |||||||||
| Sotheby's | 116 | 3,059 | |||||||||
| Strayer Education, Inc. | 8 | 1,673 | |||||||||
| Total Consumer Services | 102,062 | ||||||||||
| Diversified Financials—1.2% | |||||||||||
| Affiliated Managers Group, Inc.* | 130 | 11,708 | |||||||||
| AmeriCredit Corp.* | 1,076 | 9,275 | |||||||||
| Apollo Investment Corp. | 250 | 3,583 | |||||||||
| Eaton Vance Corp. | 122 | 4,851 | |||||||||
| Jefferies Group, Inc. | 548 | 9,217 | |||||||||
| Raymond James Financial, Inc. | 468 | 12,350 | |||||||||
| SEI Investments Co. | 226 | 5,316 | |||||||||
| Waddell & Reed Financial, Inc. Class A | 120 | 4,201 | |||||||||
| Total Diversified Financials | 60,501 | ||||||||||
| Energy—4.7% | |||||||||||
| Arch Coal, Inc. | 326 | 24,460 | |||||||||
| Bill Barrett Corp.* | 50 | 2,971 | |||||||||
| Cimarex Energy Co. | 170 | 11,844 | |||||||||
| Denbury Resources, Inc.* | 156 | 5,694 | |||||||||
| Encore Acquisition Co.* | 110 | 8,271 | |||||||||
| FMC Technologies, Inc.* | 390 | 30,002 | |||||||||
| Forest Oil Corp.* | 102 | 7,599 | |||||||||
| Frontier Oil Corp. | 590 | 14,107 | |||||||||
| Helmerich & Payne, Inc. | 224 | 16,132 | |||||||||
| Newfield Exploration Co.* | 184 | 12,006 | |||||||||
| Overseas Shipholding Group, Inc. | 86 | 6,839 | |||||||||
| Patterson-UTI Energy, Inc. | 602 | 21,696 | |||||||||
| Pioneer Natural Resources Co. | 194 | 15,186 | |||||||||
| Plains Exploration & Production Co.* | 100 | 7,297 | |||||||||
| Pride International, Inc.* | 434 | 20,524 | |||||||||
| Quicksilver Resources, Inc.* | 104 | 4,019 | |||||||||
| Superior Energy Services* | 220 | 12,131 | |||||||||
| Tidewater, Inc. | 110 | 7,153 | |||||||||
| Total Energy | 227,931 | ||||||||||
| Food & Staples Retailing—1.3% | |||||||||||
| BJ's Wholesale Club, Inc.* | 1,150 | 44,505 | |||||||||
| Ruddick Corp. | 512 | 17,567 | |||||||||
| Total Food & Staples Retailing | 62,072 | ||||||||||
| Food Beverage & Tobacco—2.6% | |||||||||||
| Corn Products International, Inc. | 408 | 20,037 | |||||||||
| Hansen Natural Corp.* | 96 | 2,767 | |||||||||
| Hormel Foods Corp. | 780 | 26,996 | |||||||||
| J.M. Smucker Co. | 222 | 9,022 | |||||||||
| Investments | Shares | Value | |||||||||
| Lancaster Colony Corp. | 152 | $ | 4,603 | ||||||||
| PepsiAmericas, Inc. | 644 | 12,738 | |||||||||
| Smithfield Foods, Inc.* | 1,970 | 39,163 | |||||||||
| Tootsie Roll Industries, Inc. | 105 | 2,639 | |||||||||
| Universal Corp. | 188 | 8,501 | |||||||||
| Total Food Beverage & Tobacco | 126,466 | ||||||||||
| Health Care Equipment & Services—6.9% | |||||||||||
| Advanced Medical Optics, Inc* | 212 | 3,973 | |||||||||
| Apria Healthcare Group, Inc.* | 390 | 7,562 | |||||||||
| Beckman Coulter, Inc. | 198 | 13,371 | |||||||||
| Cerner Corp.* | 132 | 5,964 | |||||||||
| Community Health Systems, Inc.* | 934 | 30,803 | |||||||||
| DENTSPLY International, Inc. | 234 | 8,611 | |||||||||
| Edwards Lifesciences Corp.* | 114 | 7,073 | |||||||||
| Gen-Probe, Inc.* | 32 | 1,519 | |||||||||
| Health Management Associates, Inc. Class A* | 3,664 | 23,853 | |||||||||
| Health Net, Inc.* | 1,466 | 35,271 | |||||||||
| Henry Schein, Inc.* | 504 | 25,991 | |||||||||
| Hill-Rom Holdings, Inc. | 372 | 10,037 | |||||||||
| Hologic, Inc.* | 116 | 2,529 | |||||||||
| Kindred Healthcare, Inc.* | 942 | 27,092 | |||||||||
| Kinetic Concepts, Inc.* | 138 | 5,508 | |||||||||
| LifePoint Hospitals, Inc.* | 438 | 12,395 | |||||||||
| Lincare Holdings, Inc.* | 230 | 6,532 | |||||||||
| Omnicare, Inc. | 1,296 | 33,981 | |||||||||
| Psychiatric Solutions, Inc.* | 192 | 7,265 | |||||||||
| Resmed, Inc.* | 78 | 2,788 | |||||||||
| STERIS Corp. | 222 | 6,385 | |||||||||
| Universal Health Services, Inc. Class B | 470 | 29,713 | |||||||||
| VCA Antech, Inc.* | 140 | 3,889 | |||||||||
| WellCare Health Plans, Inc.* | 644 | 23,281 | |||||||||
| Total Health Care Equipment & Services | 335,386 | ||||||||||
| Household & Personal Products—0.8% | |||||||||||
| Alberto-Culver Co. | 306 | 8,039 | |||||||||
| Church & Dwight Co., Inc. | 200 | 11,270 | |||||||||
| Energizer Holdings, Inc.* | 148 | 10,817 | |||||||||
| NBTY, Inc.* | 360 | 11,542 | |||||||||
| Total Household & Personal Products | 41,668 | ||||||||||
| Insurance—4.6% | |||||||||||
| American Financial Group, Inc. | 784 | 20,972 | |||||||||
| Arthur J. Gallagher & Co. | 314 | 7,567 | |||||||||
| Brown & Brown, Inc. | 192 | 3,339 | |||||||||
| Everest Re Group Ltd. | 240 | 19,130 | |||||||||
| Fidelity National Financial, Inc. Class A | 1,976 | 24,898 | |||||||||
| First American Corp. | 1,284 | 33,898 | |||||||||
| Hanover Insurance Group, Inc. | 318 | 13,515 | |||||||||
| HCC Insurance Holdings, Inc. | 398 | 8,414 | |||||||||
| Horace Mann Educators Corp. | 238 | 3,337 | |||||||||
| Mercury General Corp. | 320 | 14,950 | |||||||||
| Old Republic International Corp. | 1,368 | 16,197 | |||||||||
| Protective Life Corp. | 386 | 14,687 | |||||||||
| StanCorp Financial Group, Inc. | 260 | 12,210 | |||||||||
| Unitrin, Inc. | 344 | 9,484 | |||||||||
| W.R. Berkley Corp. | 926 | 22,372 | |||||||||
| Total Insurance | 224,970 | ||||||||||
The accompanying notes are an integral part of these financial statements.
19
Schedule of Investments — continued
REVENUESHARES MID CAP FUND
JUNE 30, 2008
| Investments | Shares | Value | |||||||||
| Materials—9.5% | |||||||||||
| Airgas, Inc. | 320 | $ | 18,685 | ||||||||
| Albemarle Corp. | 266 | 10,616 | |||||||||
| AptarGroup, Inc. | 36 | 1,510 | |||||||||
| Cabot Corp. | 384 | 9,335 | |||||||||
| Carpenter Technology Corp. | 124 | 5,413 | |||||||||
| CF Industries Holdings, Inc. | 132 | 20,170 | |||||||||
| Chemtura Corp. | 2,614 | 15,266 | |||||||||
| Cleveland-Cliffs, Inc. | 232 | 27,651 | |||||||||
| Commercial Metals Co. | 1,450 | 54,664 | |||||||||
| Cytec Industries, Inc. | 284 | 15,495 | |||||||||
| Ferro Corp. | 538 | 10,093 | |||||||||
| FMC Corp. | 236 | 18,276 | |||||||||
| Louisiana-Pacific Corp. | 604 | 5,128 | |||||||||
| Lubrizol Corp. | 342 | 15,845 | |||||||||
| Martin Marietta Materials, Inc. | 86 | 8,909 | |||||||||
| Minerals Technologies, Inc. | 86 | 5,469 | |||||||||
| Olin Corp. | 682 | 17,855 | |||||||||
| Packaging Corp of America | 414 | 8,905 | |||||||||
| Reliance Steel & Aluminum Co. | 720 | 55,504 | |||||||||
| RPM International, Inc. | 876 | 18,046 | |||||||||
| Scotts Miracle-Gro Co. Class A | 408 | 7,169 | |||||||||
| Sensient Technologies Corp. | 210 | 5,914 | |||||||||
| Sonoco Products Co. | 680 | 21,046 | |||||||||
| Steel Dynamics, Inc. | 776 | 30,317 | |||||||||
| Temple-Inland, Inc. | 1,170 | 13,186 | |||||||||
| Terra Industries, Inc. | 296 | 14,608 | |||||||||
| Valspar Corp. | 730 | 13,804 | |||||||||
| Worthington Industries, Inc. | 728 | 14,924 | |||||||||
| Total Materials | 463,803 | ||||||||||
| Media—1.3% | |||||||||||
| Belo Corp. Class A | 606 | 4,430 | |||||||||
| DreamWorks Animation SKG, Inc. Class A* | 135 | 4,024 | |||||||||
| Entercom Communications Corp. Class A | 146 | 1,025 | |||||||||
| Getty Images, Inc.* | 150 | 5,090 | |||||||||
| Harte-Hanks, Inc. | 358 | 4,099 | |||||||||
| John Wiley & Sons, Inc. Class A | 140 | 6,304 | |||||||||
| Lamar Advertising Co. Class A* | 120 | 4,324 | |||||||||
| Lee Enterprises, Inc. | 410 | 1,636 | |||||||||
| Marvel Entertainment, Inc.* | 300 | 9,642 | |||||||||
| Media General, Inc. Class A | 230 | 2,749 | |||||||||
| Scholastic Corp.* | 314 | 8,999 | |||||||||
| Valassis Communications, Inc.* | 786 | 9,840 | |||||||||
| Total Media | 62,162 | ||||||||||
| Pharmaceuticals, Biotechnology—1.5% | |||||||||||
| Affymetrix, Inc.* | 92 | 947 | |||||||||
| Cephalon, Inc.* | 126 | 8,403 | |||||||||
| Charles River Laboratories International, Inc.* | 94 | 6,008 | |||||||||
| Covance, Inc.* | 92 | 7,914 | |||||||||
| Endo Pharmaceuticals Holdings, Inc.* | 190 | 4,596 | |||||||||
| Invitrogen Corp.* | 136 | 5,339 | |||||||||
| Medicis Pharmaceutical Corp. Class A | 80 | 1,662 | |||||||||
| Par Pharmaceutical Cos Inc* | 194 | 3,149 | |||||||||
| PDL BioPharma, Inc. | 144 | 1,529 | |||||||||
| Investments | Shares | Value | |||||||||
| Perrigo Co. | 236 | $ | 7,498 | ||||||||
| Pharmaceutical Product Development, Inc. | 172 | 7,379 | |||||||||
| Sepracor, Inc.* | 242 | 4,821 | |||||||||
| Techne Corp.* | 16 | 1,238 | |||||||||
| Valeant Pharmaceuticals International* | 418 | 7,152 | |||||||||
| Varian, Inc.* | 66 | 3,370 | |||||||||
| Vertex Pharmaceuticals, Inc* | 50 | 1,674 | |||||||||
| Total Pharmaceuticals, Biotechnology | 72,679 | ||||||||||
| Real Estate—4.2% | |||||||||||
| Alexandria Real Estate Equities, Inc. (a) | 116 | 11,291 | |||||||||
| AMB Property Corp. (a) | 62 | 3,124 | |||||||||
| BRE Properties, Inc. (a) | 40 | 1,731 | |||||||||
| Camden Property Trust (a) | 136 | 6,019 | |||||||||
| Cousins Properties, Inc. (a) | 36 | 832 | |||||||||
| Duke Realty Corp. (a) | 230 | 5,164 | |||||||||
| Equity One, Inc. (a) | 58 | 1,192 | |||||||||
| Federal Realty Investment Trust (a) | 1,724 | 118,956 | |||||||||
| Health Care REIT, Inc. (a) | 54 | 2,403 | |||||||||
| Highwoods Properties, Inc. (a) | 76 | 2,388 | |||||||||
| Hospitality Properties Trust (a) | 176 | 4,305 | |||||||||
| Jones Lang LaSalle, Inc. | 164 | 9,871 | |||||||||
| Liberty Property Trust (a) | 122 | 4,044 | |||||||||
| Macerich Co. (a) | 60 | 3,728 | |||||||||
| Mack-Cali Realty Corp. (a) | 122 | 4,169 | |||||||||
| Nationwide Health Properties, Inc. (a) | 54 | 1,700 | |||||||||
| Potlatch Corp. (a) | 186 | 8,392 | |||||||||
| Rayonier, Inc. (a) | 144 | 6,114 | |||||||||
| Realty Income Corp. (a) | 52 | 1,184 | |||||||||
| Regency Centers Corp. (a) | 34 | 2,010 | |||||||||
| UDR Inc (a) | 174 | 3,894 | |||||||||
| Weingarten Realty Investors (a) | 90 | 2,729 | |||||||||
| Total Real Estate | 205,240 | ||||||||||
| Retailing—6.6% | |||||||||||
| 99 Cents Only Stores* | 700 | 4,620 | |||||||||
| Advance Auto Parts, Inc. | 670 | 26,016 | |||||||||
| Aeropostale, Inc.* | 280 | 8,772 | |||||||||
| American Eagle Outfitters, Inc. | 590 | 8,042 | |||||||||
| AnnTaylor Stores Corp.* | 370 | 8,865 | |||||||||
| Barnes & Noble, Inc. | 694 | 17,239 | |||||||||
| Borders Group, Inc. | 1,734 | 10,404 | |||||||||
| Carmax, Inc.* | 1,608 | 22,818 | |||||||||
| Charming Shoppes, Inc.* | 2,912 | 13,366 | |||||||||
| Chico's FAS, Inc.* | 704 | 3,780 | |||||||||
| Coldwater Creek, Inc.* | 650 | 3,432 | |||||||||
| Collective Brands, Inc.* | 924 | 10,746 | |||||||||
| Dick's Sporting Goods, Inc.* | 486 | 8,622 | |||||||||
| Dollar Tree, Inc.* | 664 | 21,706 | |||||||||
| Foot Locker, Inc. | 2,170 | 27,017 | |||||||||
| Guess?, Inc. | 140 | 5,243 | |||||||||
| NetFlix, Inc.* | 254 | 6,622 | |||||||||
| O'Reilly Automotive, Inc.* | 376 | 8,404 | |||||||||
| Pacific Sunwear of California, Inc.* | 450 | 3,839 | |||||||||
| PetSmart, Inc. | 754 | 15,042 | |||||||||
| Rent-A-Center, Inc.* | 994 | 20,447 | |||||||||
| Ross Stores, Inc. | 1,038 | 36,869 | |||||||||
| Saks, Inc.* | 940 | 10,321 | |||||||||
The accompanying notes are an integral part of these financial statements.
20
Schedule of Investments — continued
REVENUESHARES MID CAP FUND
JUNE 30, 2008
| Investments | Shares | Value | |||||||||
| Retailing—6.6% (continued) | |||||||||||
| Urban Outfitters, Inc.* | 226 | $ | 7,049 | ||||||||
| Williams-Sonoma, Inc. | 668 | 13,253 | |||||||||
| Total Retailing | 322,534 | ||||||||||
| Semiconductors & Semiconductor Equipment—1.0% | |||||||||||
| Atmel Corp.* | 1,920 | 6,682 | |||||||||
| Cree, Inc.* | 86 | 1,962 | |||||||||
| Cypress Semiconductor Corp.* | 218 | 5,396 | |||||||||
| Fairchild Semiconductor International, Inc.* | 564 | 6,616 | |||||||||
| Integrated Device Technology, Inc.* | 330 | 3,280 | |||||||||
| International Rectifier Corp.* | 208 | 3,994 | |||||||||
| Intersil Corp. Class A | 146 | 3,551 | |||||||||
| Lam Research Corp.* | 272 | 9,832 | |||||||||
| RF Micro Devices, Inc.* | 920 | 2,668 | |||||||||
| Semtech Corp.* | 86 | 1,210 | |||||||||
| Silicon Laboratories, Inc.* | 48 | 1,732 | |||||||||
| TriQuint Semiconductor, Inc.* | 406 | 2,460 | |||||||||
| Total Semiconductors & Semiconductor Equipment | 49,383 | ||||||||||
| Software & Services—2.4% | |||||||||||
| ACI Worldwide, Inc.* | 84 | 1,478 | |||||||||
| Activision, Inc.* | 266 | 9,063 | |||||||||
| Acxiom Corp. | 614 | 7,055 | |||||||||
| Advent Software, Inc.* | 22 | 794 | |||||||||
| Alliance Data Systems Corp.* | 146 | 8,256 | |||||||||
| Broadridge Financial Solutions, Inc. | 484 | 10,187 | |||||||||
| Cadence Design Systems, Inc.* | 508 | 5,131 | |||||||||
| Digital River, Inc.* | 46 | 1,775 | |||||||||
| DST Systems, Inc.* | 136 | 7,487 | |||||||||
| Fair Isaac Corp. | 116 | 2,409 | |||||||||
| Gartner, Inc.* | 326 | 6,755 | |||||||||
| Global Payments, Inc. | 122 | 5,685 | |||||||||
| Jack Henry & Associates, Inc. | 128 | 2,770 | |||||||||
| Macrovision Solutions Corp.* | 56 | 838 | |||||||||
| McAfee, Inc.* | 168 | 5,717 | |||||||||
| Mentor Graphics Corp.* | 392 | 6,194 | |||||||||
| Metavante Technologies, Inc.* | 344 | 7,781 | |||||||||
| NeuStar, Inc. Class A* | 68 | 1,466 | |||||||||
| Parametric Technology Corp.* | 272 | 4,534 | |||||||||
| SRA International, Inc. Class A* | 230 | 5,166 | |||||||||
| Sybase, Inc.* | 198 | 5,825 | |||||||||
| Synopsys, Inc.* | 252 | 6,025 | |||||||||
| ValueClick, Inc.* | 140 | 2,121 | |||||||||
| Wind River Systems, Inc.* | 146 | 1,590 | |||||||||
| Total Software & Services | 116,102 | ||||||||||
| Technology Hardware & Equipment—11.9% | |||||||||||
| 3Com Corp.* | 1,424 | 3,019 | |||||||||
| ADC Telecommunications, Inc.* | 410 | 6,056 | |||||||||
| Adtran, Inc. | 114 | 2,718 | |||||||||
| Amphenol Corp. Class A | 324 | 14,541 | |||||||||
| Arrow Electronics, Inc.* | 2,046 | 62,853 | |||||||||
| Avnet, Inc.* | 2,250 | 61,380 | |||||||||
| Avocent Corp.* | 130 | 2,418 | |||||||||
| CommScope, Inc.* | 238 | 12,559 | |||||||||
| Diebold, Inc. | 446 | 15,869 | |||||||||
| Investments | Shares | Value | |||||||||
| F5 Networks, Inc.* | 94 | $ | 2,671 | ||||||||
| Flir Systems, Inc.* | 105 | 4,260 | |||||||||
| Foundry Networks, Inc.* | 630 | 7,447 | |||||||||
| Harris Corp. | 336 | 16,965 | |||||||||
| Imation Corp. | 464 | 10,635 | |||||||||
| Ingram Micro, Inc. Class A* | 9,008 | 159,891 | |||||||||
| Kemet Corp.* | 540 | 1,750 | |||||||||
| National Instruments Corp. | 106 | 3,007 | |||||||||
| NCR Corp.* | 1,272 | 32,054 | |||||||||
| Palm, Inc. | 1,262 | 6,802 | |||||||||
| Plantronics, Inc. | 156 | 3,482 | |||||||||
| Polycom, Inc.* | 190 | 4,628 | |||||||||
| Tech Data Corp.* | 2,830 | 95,908 | |||||||||
| Trimble Navigation Ltd.* | 40 | 1,428 | |||||||||
| Vishay Intertechnology, Inc.* | 1,194 | 10,591 | |||||||||
| Western Digital Corp.* | 944 | 32,596 | |||||||||
| Zebra Technologies Corp. Class A* | 114 | 3,721 | |||||||||
| Total Technology Hardware & Equipment | 579,249 | ||||||||||
| Telecommunication Services—0.5% | |||||||||||
| Cincinnati Bell, Inc.* | 1,396 | 5,556 | |||||||||
| Telephone & Data Systems, Inc. | 372 | 17,585 | |||||||||
| Total Telecommunication Services | 23,141 | ||||||||||
| Transportation—3.2% | |||||||||||
| AirTran Holdings, Inc.* | 1,396 | 2,848 | |||||||||
| Alaska Air Group, Inc.* | 730 | 11,198 | |||||||||
| Alexander & Baldwin, Inc. | 166 | 7,561 | |||||||||
| Avis Budget Group, Inc.* | 2,250 | 18,833 | |||||||||
| Con-way, Inc. | 502 | 23,725 | |||||||||
| JB Hunt Transport Services, Inc. | 672 | 22,364 | |||||||||
| JetBlue Airways Corp.* | 2,090 | 7,796 | |||||||||
| Kansas City Southern* | 128 | 5,631 | |||||||||
| Werner Enterprises, Inc. | 618 | 11,482 | |||||||||
| YRC Worldwide, Inc.* | 2,920 | 43,420 | |||||||||
| Total Transportation | 154,858 | ||||||||||
| Utilities—8.0% | |||||||||||
| AGL Resources, Inc. | 344 | 11,896 | |||||||||
| Alliant Energy Corp. | 418 | 14,321 | |||||||||
| Aqua America, Inc. | 136 | 2,172 | |||||||||
| Aquila, Inc.* | 1,872 | 7,057 | |||||||||
| Black Hills Corp. | 82 | 2,629 | |||||||||
| DPL, Inc. | 254 | 6,701 | |||||||||
| Energen Corp. | 110 | 8,583 | |||||||||
| Energy East Corp. | 956 | 23,632 | |||||||||
| Equitable Resources, Inc. | 128 | 8,840 | |||||||||
| Great Plains Energy, Inc. | 538 | 13,601 | |||||||||
| Hawaiian Electric Industries, Inc. | 538 | 13,305 | |||||||||
| IDACORP, Inc. | 126 | 3,640 | |||||||||
| MDU Resources Group, Inc. | 798 | 27,818 | |||||||||
| National Fuel Gas Co. | 214 | 12,729 | |||||||||
| Northeast Utilities | 962 | 24,560 | |||||||||
| NSTAR | 478 | 16,166 | |||||||||
| OGE Energy Corp. | 520 | 16,489 | |||||||||
| ONEOK, Inc. | 1,352 | 66,017 | |||||||||
| PNM Resources, Inc. | 568 | 6,793 | |||||||||
| Puget Energy, Inc. | 588 | 14,106 | |||||||||
The accompanying notes are an integral part of these financial statements.
21
Schedule of Investments — continued
REVENUESHARES MID CAP FUND
JUNE 30, 2008
| Investments | Shares | Value | |||||||||
| Utilities—8.0% (continued) | |||||||||||
| SCANA Corp. | 548 | $ | 20,276 | ||||||||
| Sierra Pacific Resources | 1,048 | 13,320 | |||||||||
| Vectren Corp. | 384 | 11,985 | |||||||||
| Westar Energy, Inc. | 332 | 7,141 | |||||||||
| WGL Holdings, Inc. | 408 | 14,174 | |||||||||
| Wisconsin Energy Corp. | 440 | 19,897 | |||||||||
| Total Utilities | 387,848 | ||||||||||
| Total Investments—99.3% (Cost $5,068,820) | 4,835,730 | ||||||||||
| Other Assets in Excess of Liabilities—0.7% | 33,114 | ||||||||||
| Net Assets—100.0% | $ | 4,868,844 | |||||||||
* Non-income producing security.
(a) Real Estate Investment Trust (REIT)
The accompanying notes are an integral part of these financial statements.
22
Schedule of Investments
REVENUESHARES SMALL CAP FUND
JUNE 30, 2008
| Investments | Shares | Value | |||||||||
| COMMON STOCKS—99.2% | |||||||||||
| Automobiles & Components—1.0% | |||||||||||
| ATC Technology Corp.* | 175 | $ | 4,074 | ||||||||
| Drew Industries, Inc.* | 224 | 3,573 | |||||||||
| Fleetwood Enterprises, Inc.* | 3,882 | 10,170 | |||||||||
| Monaco Coach Corp. | 1,348 | 4,098 | |||||||||
| Spartan Motors, Inc. | 546 | 4,079 | |||||||||
| Standard Motor Products, Inc. | 952 | 7,768 | |||||||||
| Superior Industries International, Inc. | 452 | 7,630 | |||||||||
| Winnebago Industries, Inc. | 368 | 3,750 | |||||||||
| Total Automobiles & Components | 45,142 | ||||||||||
| Banks—2.5% | |||||||||||
| Anchor Bancorp Wisconsin, Inc. | 120 | 841 | |||||||||
| Bank Mutual Corp. | 182 | 1,827 | |||||||||
| BankAtlantic Bancorp, Inc. Class A | 1,198 | 2,108 | |||||||||
| Boston Private Financial Holdings, Inc. | 186 | 1,055 | |||||||||
| Brookline Bancorp, Inc. | 130 | 1,242 | |||||||||
| Cascade Bancorp | 104 | 801 | |||||||||
| Central Pacific Financial Corp. | 180 | 1,919 | |||||||||
| Columbia Banking System, Inc. | 60 | 1,160 | |||||||||
| Community Bank System, Inc. | 138 | 2,846 | |||||||||
| Corus Bankshares, Inc. | 690 | 2,870 | |||||||||
| Dime Community Bancshares, Inc. | 126 | 2,080 | |||||||||
| Downey Financial Corp. | 268 | 742 | |||||||||
| East West Bancorp, Inc. | 270 | 1,906 | |||||||||
| First BanCorp. | 1,758 | 11,146 | |||||||||
| First Commonwealth Financial Corp. | 294 | 2,743 | |||||||||
| First Financial Bancorp | 214 | 1,969 | |||||||||
| First Financial Bankshares, Inc. | 30 | 1,374 | |||||||||
| First Midwest Bancorp, Inc. | 168 | 3,133 | |||||||||
| FirstFed Financial Corp.* | 178 | 1,431 | |||||||||
| Flagstar Bancorp, Inc. | 1,522 | 4,581 | |||||||||
| Frontier Financial Corp. | 144 | 1,227 | |||||||||
| Glacier Bancorp, Inc. | 170 | 2,718 | |||||||||
| Guaranty Financial Group* | 94 | 505 | |||||||||
| Hancock Holding Co. | 108 | 4,243 | |||||||||
| Hanmi Financial Corp. | 306 | 1,594 | |||||||||
| Independent Bank Corp. | 268 | 1,072 | |||||||||
| Irwin Financial Corp. | 616 | 1,657 | |||||||||
| Nara Bancorp, Inc. | 134 | 1,438 | |||||||||
| National Penn Bancshares, Inc. | 70 | 930 | |||||||||
| Old National Bancorp. | 170 | 2,424 | |||||||||
| PrivateBancorp, Inc. | 94 | 2,856 | |||||||||
| Prosperity Bancshares, Inc. | 104 | 2,780 | |||||||||
| Provident Bankshares Corp. | 192 | 1,225 | |||||||||
| Signature Bank* | 80 | 2,061 | |||||||||
| South Financial Group, Inc. | 522 | 2,046 | |||||||||
| Sterling Bancorp | 106 | 1,267 | |||||||||
| Sterling Bancshares, Inc. | 244 | 2,218 | |||||||||
| Sterling Financial Corp. | 404 | 1,673 | |||||||||
| Susquehanna Bancshares, Inc. | 296 | 4,052 | |||||||||
| TrustCo Bank Corp. | 180 | 1,336 | |||||||||
| UCBH Holdings, Inc. | 402 | 905 | |||||||||
| UMB Financial Corp. | 236 | 12,099 | |||||||||
| Umpqua Holdings Corp. | 324 | 3,930 | |||||||||
| United Bankshares, Inc. | 138 | 3,167 | |||||||||
| United Community Banks Inc. | 288 | 2,457 | |||||||||
| Whitney Holding Corp. | 258 | 4,721 | |||||||||
| Investments | Shares | Value | |||||||||
| Wilshire Bancorp, Inc. | 182 | $ | 1,560 | ||||||||
| Wintrust Financial Corp. | 178 | 4,245 | |||||||||
| Total Banks | 120,180 | ||||||||||
| Capital Goods—14.3% | |||||||||||
| A.O. Smith Corp. | 590 | 19,370 | |||||||||
| AAR Corp.* | 268 | 3,626 | |||||||||
| Acuity Brands, Inc. | 568 | 27,309 | |||||||||
| Albany International Corp. Class A | 252 | 7,308 | |||||||||
| Apogee Enterprises, Inc. | 316 | 5,107 | |||||||||
| Applied Industrial Technologies, Inc. | 604 | 14,599 | |||||||||
| Applied Signal Technology, Inc. | 118 | 1,612 | |||||||||
| Astec Industries, Inc.* | 204 | 6,557 | |||||||||
| Baldor Electric Co. | 424 | 14,832 | |||||||||
| Barnes Group, Inc. | 418 | 9,652 | |||||||||
| Belden, Inc. | 366 | 12,400 | |||||||||
| Brady Corp. Class A | 300 | 10,359 | |||||||||
| Briggs & Stratton Corp. | 852 | 10,803 | |||||||||
| Building Materials Holding Corp. | 4,378 | 7,749 | |||||||||
| C&D Technologies, Inc.* | 850 | 7,191 | |||||||||
| Cascade Corp. | 68 | 2,878 | |||||||||
| Ceradyne, Inc.* | 140 | 4,802 | |||||||||
| CLARCOR, Inc. | 230 | 8,073 | |||||||||
| Cubic Corp. | 198 | 4,411 | |||||||||
| Curtiss-Wright Corp. | 250 | 11,185 | |||||||||
| EMCOR Group, Inc.* | 1,957 | 55,832 | |||||||||
| EnPro Industries, Inc.* | 294 | 10,978 | |||||||||
| Esterline Technologies Corp.* | 200 | 9,852 | |||||||||
| Gardner Denver, Inc.* | 488 | 27,718 | |||||||||
| GenCorp, Inc.* | 538 | 3,852 | |||||||||
| Gibraltar Industries, Inc. | 874 | 13,958 | |||||||||
| Griffon Corp.* | 1,186 | 10,389 | |||||||||
| II-VI, Inc.* | 1,150 | 40,158 | |||||||||
| Insituform Technologies, Inc. Class A* | 420 | 6,397 | |||||||||
| Kaman Corp. | �� | 342 | 7,784 | ||||||||
| Kaydon Corp. | 80 | 4,113 | |||||||||
| Lawson Products, Inc. | 144 | 3,568 | |||||||||
| Lennox International, Inc. | 984 | 28,497 | |||||||||
| Lindsay Corp. | 42 | 3,569 | |||||||||
| Lydall, Inc.* | 314 | 3,941 | |||||||||
| Magnetek, Inc.* | 193 | 816 | |||||||||
| Moog, Inc. Class A* | 294 | 10,949 | |||||||||
| Mueller Industries, Inc. | 796 | 25,631 | |||||||||
| NCI Buildings Systems, Inc.* | 436 | 16,014 | |||||||||
| Orbital Sciences Corp.* | 590 | 13,900 | |||||||||
| Quanex Building Products Corp. | 1,276 | 18,961 | |||||||||
| Regal-Beloit Corp. | 338 | 14,281 | |||||||||
| Robbins & Myers, Inc. | 176 | 8,777 | |||||||||
| Simpson Manufacturing Co., Inc. | 284 | 6,742 | |||||||||
| Standex International Corp. | 298 | 6,181 | |||||||||
| Teledyne Technologies, Inc.* | 264 | 12,881 | |||||||||
| Toro Co. | 308 | 10,247 | |||||||||
| Tredegar Corp. | 684 | 10,055 | |||||||||
| Triumph Group, Inc. | 100 | 4,710 | |||||||||
| Universal Forest Products, Inc. | 788 | 23,608 | |||||||||
| Valmont Industries, Inc. | 160 | 16,686 | |||||||||
| Vicor Corp. | 122 | 1,218 | |||||||||
| Wabash National Corp. | 1,540 | 11,642 | |||||||||
| Watsco, Inc. | 440 | 18,392 | |||||||||
The accompanying notes are an integral part of these financial statements.
23
Schedule of Investments — continued
REVENUESHARES SMALL CAP FUND
JUNE 30, 2008
| Investments | Shares | Value | |||||||||
| Capital Goods—14.3% (continued) | |||||||||||
| Watts Water Technologies, Inc. Class A | 426 | $ | 10,607 | ||||||||
| Woodward Governor Co. | 260 | 9,272 | |||||||||
| Total Capital Goods | 671,999 | ||||||||||
| Commercial Services & Supplies—5.1% | |||||||||||
| ABM Industries, Inc. | 1,246 | 27,723 | |||||||||
| Administaff, Inc. | 446 | 12,439 | |||||||||
| Angelica Corp. | 234 | 4,977 | |||||||||
| Bowne & Co., Inc. | 426 | 5,432 | |||||||||
| CDI Corp. | 458 | 11,652 | |||||||||
| Consolidated Graphics, Inc.* | 168 | 8,277 | |||||||||
| G&K Services, Inc. Class A | 212 | 6,458 | |||||||||
| Healthcare Services Group, Inc. | 236 | 3,590 | |||||||||
| Heidrick & Struggles International, Inc. | 168 | 4,644 | |||||||||
| Interface, Inc. Class A | 602 | 7,543 | |||||||||
| Mobile Mini, Inc.* | 148 | 2,960 | |||||||||
| On Assignment, Inc.* | 720 | 5,774 | |||||||||
| School Specialty, Inc.* | 268 | 7,968 | |||||||||
| Spherion Corp.* | 2,342 | 10,820 | |||||||||
| Standard Register Co. | 666 | 6,280 | |||||||||
| SYKES Enterprises, Inc.* | 338 | 6,375 | |||||||||
| Tetra Tech, Inc.* | 666 | 15,065 | |||||||||
| TrueBlue, Inc.* | 824 | 10,885 | |||||||||
| United Stationers, Inc.* | 848 | 31,333 | |||||||||
| Viad Corp. | 298 | 7,685 | |||||||||
| Volt Information Sciences, Inc.* | 1,724 | 20,532 | |||||||||
| Waste Connections, Inc.* | 264 | 8,430 | |||||||||
| Watson Wyatt Worldwide, Inc. Class A | 288 | 15,232 | |||||||||
| Total Commercial Services & Supplies | 242,074 | ||||||||||
| Consumer Durables & Apparel—6.0% | |||||||||||
| Arctic Cat, Inc. | 636 | 4,993 | |||||||||
| Bassett Furniture Industries, Inc. | 304 | 3,587 | |||||||||
| Brunswick Corp. | 1,090 | 11,554 | |||||||||
| Champion Enterprises, Inc.* | 1,362 | 7,968 | |||||||||
| CROCS, Inc.* | 160 | 1,282 | |||||||||
| Deckers Outdoor Corp.* | 22 | 3,062 | |||||||||
| Ethan Allen Interiors, Inc. | 318 | 7,823 | |||||||||
| Fossil, Inc.* | 276 | 8,023 | |||||||||
| Iconix Brand Group, Inc.* | 58 | 701 | |||||||||
| JAKKS Pacific, Inc.* | 292 | 6,380 | |||||||||
| K-Swiss, Inc. Class A | 218 | 3,205 | |||||||||
| La-Z-Boy, Inc. | 2,592 | 19,829 | |||||||||
| Libbey Inc. | 456 | 3,393 | |||||||||
| M/I Homes, Inc. | 1,176 | 18,498 | |||||||||
| Maidenform Brands, Inc.* | 290 | 3,915 | |||||||||
| Meritage Homes Corp.* | 1,554 | 23,574 | |||||||||
| Movado Group, Inc. | 178 | 3,524 | |||||||||
| National Presto Industries, Inc. | 50 | 3,209 | |||||||||
| Nautilus, Inc. | 976 | 4,958 | |||||||||
| Oxford Industries, Inc. | 432 | 8,273 | |||||||||
| Perry Ellis International, Inc.* | 425 | 9,019 | |||||||||
| Polaris Industries, Inc. | 332 | 13,406 | |||||||||
| Pool Corp. | 844 | 14,989 | |||||||||
| Quiksilver, Inc.* | 2,214 | 21,741 | |||||||||
| RC2 Corp.* | 162 | 3,007 | |||||||||
| Russ Berrie & Co., Inc.* | 176 | 1,403 | |||||||||
| Skechers U.S.A., Inc. Class A* | 554 | 10,947 | |||||||||
| Investments | Shares | Value | |||||||||
| Skyline Corp. | 116 | $ | 2,726 | ||||||||
| Standard-Pacific Corp. | 9,884 | 33,407 | |||||||||
| Sturm Ruger & Co., Inc.* | 178 | 1,257 | |||||||||
| UniFirst Corp./MA | 214 | 9,557 | |||||||||
| Universal Electronics, Inc.* | 66 | 1,379 | |||||||||
| Volcom, Inc.* | 88 | 2,106 | |||||||||
| Wolverine World Wide, Inc. | 428 | 11,415 | |||||||||
| Total Consumer Durables & Apparel | 284,110 | ||||||||||
| Consumer Services—3.3% | |||||||||||
| Buffalo Wild Wings, Inc.* | 102 | 2,533 | |||||||||
| California Pizza Kitchen, Inc.* | 356 | 3,984 | |||||||||
| CEC Entertainment, Inc.* | 252 | 7,059 | |||||||||
| CKE Restaurants, Inc. | 980 | 12,220 | |||||||||
| Coinstar, Inc.* | 198 | 6,477 | |||||||||
| CPI Corp. | 100 | 1,873 | |||||||||
| DineEquity, Inc. | 68 | 2,540 | |||||||||
| Hillenbrand Inc. | 100 | 2,140 | |||||||||
| Jack in the Box, Inc.* | 896 | 20,078 | |||||||||
| Landry's Restaurants, Inc. | 446 | 8,015 | |||||||||
| Marcus Corp. | 158 | 2,362 | |||||||||
| Monarch Casino & Resort, Inc.* | 56 | 661 | |||||||||
| Multimedia Games, Inc.* | 140 | 619 | |||||||||
| O'Charleys, Inc. | 624 | 6,277 | |||||||||
| Panera Bread Co. Class A* | 230 | 10,640 | |||||||||
| Papa John's International, Inc.* | 422 | 11,221 | |||||||||
| Peet's Coffee & Tea, Inc.* | 80 | 1,586 | |||||||||
| P.F. Chang's China Bistro, Inc.* | 362 | 8,087 | |||||||||
| Pinnacle Entertainment, Inc.* | 322 | 3,378 | |||||||||
| Pre-Paid Legal Services, Inc.* | 80 | 3,250 | |||||||||
| Red Robin Gourmet Burgers, Inc.* | 168 | 4,660 | |||||||||
| Ruby Tuesday, Inc. | 1,060 | 5,724 | |||||||||
| Ruth's Hospitality Group Inc.* | 252 | 1,305 | |||||||||
| Shuffle Master, Inc.* | 136 | 672 | |||||||||
| Sonic Corp.* | 278 | 4,114 | |||||||||
| Steak N Shake Co.* | 502 | 3,178 | |||||||||
| Texas Roadhouse, Inc. Class A* | 524 | 4,700 | |||||||||
| Triarc Cos., Inc. Class B | 1,470 | 9,305 | |||||||||
| Universal Technical Institute, Inc.* | 182 | 2,268 | |||||||||
| WMS Industries, Inc.* | 144 | 4,287 | |||||||||
| Total Consumer Services | 155,213 | ||||||||||
| Diversified Financials—0.9% | |||||||||||
| Cash America International, Inc. | 232 | 7,191 | |||||||||
| Financial Federal Corp. | 76 | 1,669 | |||||||||
| First Cash Financial Services, Inc.* | 206 | 3,088 | |||||||||
| Investment Technology Group, Inc.* | 136 | 4,551 | |||||||||
| LaBranche & Co., Inc.* | 938 | 6,641 | |||||||||
| optionsXpress Holdings, Inc. | 70 | 1,564 | |||||||||
| Piper Jaffray Cos.,* | 102 | 2,992 | |||||||||
| Portfolio Recovery Associates, Inc.* | 48 | 1,800 | |||||||||
| Rewards Network, Inc.* | 398 | 1,636 | |||||||||
| SWS Group, Inc. | 318 | 5,282 | |||||||||
| TradeStation Group, Inc.* | 108 | 1,096 | |||||||||
| World Acceptance Corp.* | 82 | 2,761 | |||||||||
| Total Diversified Financials | 40,271 | ||||||||||
The accompanying notes are an integral part of these financial statements.
24
Schedule of Investments — continued
REVENUESHARES SMALL CAP FUND
JUNE 30, 2008
| Investments | Shares | Value | |||||||||
| Energy—6.6% | |||||||||||
| Atwood Oceanics, Inc.* | 38 | $ | 4,725 | ||||||||
| Basic Energy Services, Inc.* | 384 | 12,096 | |||||||||
| Bristow Group, Inc.* | 146 | 7,226 | |||||||||
| CARBO Ceramics, Inc. | 76 | 4,435 | |||||||||
| Dril-Quip, Inc.* | 76 | 4,788 | |||||||||
| Gulf Island Fabrication, Inc. | 130 | 6,361 | |||||||||
| Helix Energy Solutions Group, Inc.* | 374 | 15,573 | |||||||||
| Hornbeck Offshore Services, Inc.* | 64 | 3,617 | |||||||||
| ION Geophysical Corp.* | 394 | 6,875 | |||||||||
| Lufkin Industries, Inc. | 102 | 8,495 | |||||||||
| Matrix Service Co.* | 202 | 4,658 | |||||||||
| NATCO Group, Inc. Class A* | 92 | 5,017 | |||||||||
| Oceaneering International, Inc.* | 210 | 16,181 | |||||||||
| Patriot Coal Corp* | 74 | 11,343 | |||||||||
| Penn Virginia Corp. | 172 | 12,972 | |||||||||
| Petroleum Development Corp.* | 50 | 3,325 | |||||||||
| Petroquest Energy, Inc.* | 55 | 1,480 | |||||||||
| Pioneer Drilling Co.* | 308 | 5,793 | |||||||||
| SEACOR Holdings, Inc.* | 132 | 11,815 | |||||||||
| St. Mary Land & Exploration Co. | 194 | 12,540 | |||||||||
| Stone Energy Corp.* | 169 | 11,139 | |||||||||
| Superior Well Services, Inc.* | 152 | 4,820 | |||||||||
| Swift Energy Co.* | 140 | 9,248 | |||||||||
| Tetra Technologies, Inc.* | 534 | 12,661 | |||||||||
| Unit Corp.* | 228 | 18,917 | |||||||||
| W-H Energy Services, Inc.* | 186 | 17,808 | |||||||||
| World Fuel Services Corp. | 3,545 | 77,776 | |||||||||
| Total Energy | 311,684 | ||||||||||
| Food & Staples Retailing—3.9% | |||||||||||
| Andersons, Inc. | 56 | 2,280 | |||||||||
| Casey's General Stores, Inc. | 1,252 | 29,009 | |||||||||
| Great Atlantic & Pacific Tea Co., Inc.* | 1,943 | 44,338 | |||||||||
| Longs Drug Stores Corp. | 824 | 34,699 | |||||||||
| Nash Finch Co. | 1,092 | 37,423 | |||||||||
| Spartan Stores, Inc. | 880 | 20,240 | |||||||||
| United Natural Foods, Inc.* | 850 | 16,558 | |||||||||
| Total Food & Staples Retailing | 184,547 | ||||||||||
| Food Beverage & Tobacco—3.8% | |||||||||||
| Alliance One International, Inc.* | 4,652 | 23,772 | |||||||||
| Boston Beer Co., Inc. Class A* | 86 | 3,498 | |||||||||
| Darling International, Inc.* | 4,275 | 70,624 | |||||||||
| Flowers Foods, Inc. | 786 | 22,275 | |||||||||
| Green Mountain Coffee Roasters, Inc.* | 90 | 3,381 | |||||||||
| Hain Celestial Group Inc* | 240 | 5,635 | |||||||||
| J&J Snack Foods Corp. | 162 | 4,440 | |||||||||
| Lance, Inc. | 326 | 6,119 | |||||||||
| Ralcorp Holdings, Inc.* | 308 | 15,228 | |||||||||
| Sanderson Farms, Inc. | 360 | 12,427 | |||||||||
| TreeHouse Foods, Inc.* | 404 | 9,801 | |||||||||
| Total Food Beverage & Tobacco | 177,200 | ||||||||||
| Health Care Equipment & Services—7.9% | |||||||||||
| Abaxis, Inc.* | 190 | 4,585 | |||||||||
| Air Methods Corp.* | 15 | 375 | |||||||||
| Allscripts Healthcare Solutions, Inc.* | 134 | 1,663 | |||||||||
| Amedisys, Inc.* | 132 | 6,655 | |||||||||
| Investments | Shares | Value | |||||||||
| American Medical Systems Holding* | 296 | $ | 4,425 | ||||||||
| AMERIGROUP Corp.* | 960 | 19,968 | |||||||||
| AMN Healthcare Services, Inc.* | 612 | 10,355 | |||||||||
| AmSurg Corp.* | 178 | 4,334 | |||||||||
| Analogic Corp. | 54 | 3,406 | |||||||||
| ArthroCare Corp.* | 50 | 2,041 | |||||||||
| Biolase Technology Inc* | 218 | 746 | |||||||||
| Centene Corp.* | 1,004 | 16,857 | |||||||||
| Chemed Corp. | 180 | 6,590 | |||||||||
| CONMED Corp.* | 244 | 6,478 | |||||||||
| Cooper Cos., Inc. | 188 | 6,984 | |||||||||
| Cross Country Healthcare, Inc.* | 454 | 6,542 | |||||||||
| CryoLife Inc | 116 | 1,327 | |||||||||
| Cyberonics* | 92 | 1,996 | |||||||||
| Datascope Corp. | 96 | 4,512 | |||||||||
| Gentiva Health Services, Inc.* | 610 | 11,621 | |||||||||
| Greatbatch, Inc.* | 136 | 2,353 | |||||||||
| Haemonetics Corp.* | 68 | 3,771 | |||||||||
| HealthExtras, Inc.* | 588 | 17,722 | |||||||||
| Healthspring, Inc.* | 50 | 844 | |||||||||
| Healthways Inc.* | 86 | 2,546 | |||||||||
| HMS Holdings Corp.* | 112 | 2,405 | |||||||||
| ICU Medical, Inc.* | 48 | 1,098 | |||||||||
| IDEXX Laboratories, Inc.* | 128 | 6,239 | |||||||||
| Immucor, Inc.* | 58 | 1,501 | |||||||||
| Integra LifeSciences Holdings* | 108 | 4,804 | |||||||||
| Invacare Corp. | 556 | 11,365 | |||||||||
| inVentiv Health, Inc.* | 276 | 7,670 | |||||||||
| Kensy Nash Corp.* | 22 | 705 | |||||||||
| LCA-Vision, Inc. | 158 | 754 | |||||||||
| LHC Group, Inc.* | 100 | 2,325 | |||||||||
| Magellan Health Services, Inc.* | 225 | 8,332 | |||||||||
| MedCath Corp.* | 244 | 4,387 | |||||||||
| Mentor Corp. | 70 | 1,947 | |||||||||
| Meridian Bioscience, Inc. | 34 | 915 | |||||||||
| Merit Medical Systems, Inc.* | 124 | 1,823 | |||||||||
| Molina Healthcare, Inc.* | 544 | 13,241 | |||||||||
| Odyssey HealthCare, Inc.* | 388 | 3,779 | |||||||||
| Omnicell, Inc.* | 68 | 896 | |||||||||
| Osteotech, Inc.* | 118 | 671 | |||||||||
| Owens & Minor, Inc. | 1,570 | 71,732 | |||||||||
| Palomar Medical Technologies, Inc.* | 70 | 699 | |||||||||
| Pediatrix Medical Group, Inc.* | 120 | 5,908 | |||||||||
| PharMerica Corp.* | 236 | 5,331 | |||||||||
| Phase Forward Inc* | 46 | 827 | |||||||||
| PSS World Medical, Inc.* | 810 | 13,203 | |||||||||
| RehabCare Group, Inc.* | 296 | 4,745 | |||||||||
| Res-Care, Inc.* | 528 | 9,388 | |||||||||
| Sunrise Senior Living, Inc.* | 534 | 12,004 | |||||||||
| SurModics, Inc.* | 12 | 538 | |||||||||
| Symmetry Medical, Inc.* | 140 | 2,271 | |||||||||
| Theragenics Corp.* | 144 | 523 | |||||||||
| Vital Signs, Inc. | 34 | 1,931 | |||||||||
| West Pharmaceutical Services, Inc. | 380 | 16,446 | |||||||||
| Zoll Medical Corp.* | 28 | 943 | |||||||||
| Total Health Care Equipment & Services | 370,042 | ||||||||||
The accompanying notes are an integral part of these financial statements.
25
Schedule of Investments — continued
REVENUESHARES SMALL CAP FUND
JUNE 30, 2008
| Investments | Shares | Value | |||||||||
| Household & Personal Products—0.7% | |||||||||||
| Central Garden & Pet Co., Class A* | 2,890 | $ | 11,848 | ||||||||
| Chattem, Inc.* | 50 | 3,253 | |||||||||
| Mannatech, Inc. | 602 | 3,275 | |||||||||
| Spectrum Brands, Inc.* | 3,638 | 9,277 | |||||||||
| USANA Health Sciences, Inc.* | 90 | 2,418 | |||||||||
| WD-40 Co. | 66 | 1,931 | |||||||||
| Total Household & Personal Products | 32,002 | ||||||||||
| Insurance—2.8% | |||||||||||
| Delphi Financial Group, Inc. Class A | 366 | 8,469 | |||||||||
| Hilb Rogal & Hobbs Co. | 158 | 6,867 | |||||||||
| Infinity Property & Casualty Corp. | 256 | 10,629 | |||||||||
| LandAmerica Financial Group, Inc. | 1,310 | 29,068 | |||||||||
| National Financial Partners Corp. | 75 | 1,487 | |||||||||
| Navigators Group, Inc.* | 66 | 3,567 | |||||||||
| Philadelphia Consolidated Holding Co.* | 308 | 10,463 | |||||||||
| Presidential Life Corp. | 198 | 3,053 | |||||||||
| ProAssurance Corp.* | 120 | 5,773 | |||||||||
| RLI Corp. | 102 | 5,046 | |||||||||
| Safety Insurance Group, Inc. | 166 | 5,918 | |||||||||
| Selective Insurance Group, Inc. | 692 | 12,982 | |||||||||
| Stewart Information Services Corp. | 740 | 14,312 | |||||||||
| Tower Group, Inc. | 104 | 2,204 | |||||||||
| United Fire & Casualty Co. | 184 | 4,955 | |||||||||
| Zenith National Insurance Corp. | 206 | 7,243 | |||||||||
| Total Insurance | 132,036 | ||||||||||
| Materials—5.1% | |||||||||||
| A.M. Castle & Co. | 502 | 14,362 | |||||||||
| AMCOL International Corp. | 164 | 4,667 | |||||||||
| Arch Chemicals, Inc. | 338 | 11,205 | |||||||||
| Brush Engineered Materials, Inc.* | 192 | 4,689 | |||||||||
| Buckeye Technologies, Inc.* | 500 | 4,230 | |||||||||
| Century Aluminum Co* | 286 | 19,016 | |||||||||
| Chesapeake Corp.* | 1,698 | 3,990 | |||||||||
| Deltic Timber Corp. | 24 | 1,284 | |||||||||
| Georgia Gulf Corp. | 3,990 | 11,571 | |||||||||
| H.B. Fuller Co. | 568 | 12,746 | |||||||||
| Headwaters, Inc.* | 918 | 10,805 | |||||||||
| Material Sciences Corp.* | 308 | 2,495 | |||||||||
| Myers Industries, Inc. | 382 | 3,113 | |||||||||
| Neenah Paper, Inc. | 294 | 4,913 | |||||||||
| NewMarket Corp. | 250 | 16,558 | |||||||||
| Olympic Steel, Inc. | 4 | 304 | |||||||||
| OM Group, Inc.* | 142 | 4,656 | |||||||||
| OMNOVA Solutions, Inc.* | 1,216 | 3,380 | |||||||||
| Penford Corp. | 110 | 1,637 | |||||||||
| PolyOne Corp.* | 3,844 | 26,793 | |||||||||
| Quaker Chemical Corp. | 220 | 5,865 | |||||||||
| Rock-Tenn Co. Class A | 796 | 23,872 | |||||||||
| RTI International Metals, Inc.* | 74 | 2,636 | |||||||||
| Schulman A., Inc. | 740 | 17,042 | |||||||||
| Schweitzer-Mauduit International, Inc. | 242 | 4,078 | |||||||||
| Texas Industries, Inc. | 132 | 7,409 | |||||||||
| Tronox, Inc., Class B | 1,702 | 5,140 | |||||||||
| Wausau Paper Corp. | 1,266 | 9,761 | |||||||||
| Total Materials | 238,217 | ||||||||||
| Investments | Shares | Value | |||||||||
| Media—0.8% | |||||||||||
| 4Kids Entertainment, Inc.* | 42 | $ | 311 | ||||||||
| AH Belo Corp. Class A | 38 | 217 | |||||||||
| Arbitron, Inc. | 78 | 3,705 | |||||||||
| E.W. Scripps Co. Class A* (b) | 300 | 921 | |||||||||
| Live Nation, Inc.* | 2,918 | 30,873 | |||||||||
| Radio One, Inc. Class D* | 1,670 | 2,154 | |||||||||
| Total Media | 38,181 | ||||||||||
| Pharmaceuticals, Biotechnology—0.9% | |||||||||||
| Alpharma, Inc. Class A* | 300 | 6,760 | |||||||||
| ArQule, Inc.* | 12 | 39 | |||||||||
| Cambrex Corp.* | 366 | 2,148 | |||||||||
| Cubist Pharmaceuticals, Inc.* | 245 | 4,376 | |||||||||
| Dionex Corp.* | 32 | 2,124 | |||||||||
| Enzo Biochem Inc* | 38 | 426 | |||||||||
| Kendle International, Inc.* | 110 | 3,996 | |||||||||
| Martek Biosciences Corp.* | 104 | 3,506 | |||||||||
| Noven Pharmaceuticals, Inc.* | 44 | 470 | |||||||||
| Parexel International Corp.* | 356 | 9,367 | |||||||||
| PharmaNet Development Group, Inc.* | 100 | 1,577 | |||||||||
| Regeneron Pharmaceuticals, Inc.* | 28 | 404 | |||||||||
| Salix Pharmaceuticals Ltd.* | 360 | 2,531 | |||||||||
| Savient Pharmaceuticals, Inc.* | 14 | 354 | |||||||||
| Sciele Pharma, Inc.* | 144 | 2,786 | |||||||||
| ViroPharma, Inc.* | 208 | 2,300 | |||||||||
| Total Pharmaceuticals, Biotechnology | 43,164 | ||||||||||
| Real Estate—1.8% | |||||||||||
| Acadia Realty Trust (a) | 38 | 880 | |||||||||
| BioMed Realty Trust, Inc. (a) | 680 | 16,680 | |||||||||
| Colonial Properties Trust (a) | 186 | 3,724 | |||||||||
| DiamondRock Hospitality Co. (a) | 360 | 3,920 | |||||||||
| EastGroup Properties, Inc. (a) | 28 | 1,201 | |||||||||
| Entertainment Properties Trust (a) | 38 | 1,879 | |||||||||
| Essex Property Trust, Inc. (a) | 34 | 3,621 | |||||||||
| Extra Space Storage, Inc. (a) | 102 | 1,567 | |||||||||
| Forestar Real Estate Group, Inc.* | 42 | 800 | |||||||||
| Home Properties, Inc. (a) | 530 | 25,472 | |||||||||
| Inland Real Estate Corp. (a) | 116 | 1,673 | |||||||||
| Kilroy Realty Corp. (a) | 42 | 1,975 | |||||||||
| Kite Realty Group Trust (a) | 82 | 1,025 | |||||||||
| Lexington Realty Trust (a) | 206 | 2,808 | |||||||||
| LTC Properties, Inc. (a) | 30 | 767 | |||||||||
| Medical Properties Trust, Inc. (a) | 68 | 688 | |||||||||
| Mid-America Apartment Communities, Inc. (a) | 68 | 3,471 | |||||||||
| National Retail Properties, Inc. (a) | 68 | 1,421 | |||||||||
| Parkway Properties, Inc. (a) | 58 | 1,956 | |||||||||
| Pennsylvania Real Estate Investment Trust (a) | 50 | 1,157 | |||||||||
| PS Business Parks, Inc. (a) | 46 | 2,374 | |||||||||
| Senior Housing Properties Trust (a) | 78 | 1,523 | |||||||||
| Sovran Self Storage, Inc. (a) | 40 | 1,662 | |||||||||
| Tanger Factory Outlet Centers, Inc. (a) | 50 | 1,797 | |||||||||
| Total Real Estate | 84,041 | ||||||||||
The accompanying notes are an integral part of these financial statements.
26
Schedule of Investments — continued
REVENUESHARES SMALL CAP FUND
JUNE 30, 2008
| Investments | Shares | Value | |||||||||
| Retailing—10.2% | |||||||||||
| Aaron Rents, Inc. | 666 | $ | 14,872 | ||||||||
| Audiovox Corp. Class A* | 332 | 3,260 | |||||||||
| Big 5 Sporting Goods Corp. | 510 | 3,861 | |||||||||
| Blue Nile, Inc.* | 36 | 1,531 | |||||||||
| Brown Shoe Co, Inc. | 1,312 | 17,778 | |||||||||
| Cabela's, Inc.* | 1,274 | 14,027 | |||||||||
| Cato Corp. Class A | 568 | 8,088 | |||||||||
| Charlotte Russe Holding, Inc.* | 420 | 7,459 | |||||||||
| Childrens Place Retail Stores, Inc.* | 594 | 21,443 | |||||||||
| Christopher & Banks Corp. | 300 | 2,040 | |||||||||
| Dress Barn, Inc.* | 912 | 12,203 | |||||||||
| Finish Line Class A* | 2,995 | 26,056 | |||||||||
| Fred's, Inc. Class A | 1,504 | 16,905 | |||||||||
| Genesco, Inc.* | 413 | 12,749 | |||||||||
| Group 1 Automotive, Inc. | 2,209 | 43,892 | |||||||||
| Gymboree Corp.* | 200 | 8,014 | |||||||||
| Haverty Furniture Cos., Inc. | 858 | 8,614 | |||||||||
| Hibbett Sports, Inc.* | 208 | 4,389 | |||||||||
| Hot Topic, Inc.* | 1,076 | 5,821 | |||||||||
| Jo-Ann Stores, Inc.* | 1,096 | 25,240 | |||||||||
| Jos A. Bank Clothiers, Inc.* | 170 | 4,548 | |||||||||
| Lithia Motors, Inc. Class A | 1,930 | 9,496 | |||||||||
| LKQ Corp.* | 410 | 7,409 | |||||||||
| MarineMax, Inc.* | 768 | 5,507 | |||||||||
| Men's Wearhouse, Inc. | 520 | 8,471 | |||||||||
| Midas Inc.* | 96 | 1,296 | |||||||||
| NutriSystem, Inc. | 75 | 1,061 | |||||||||
| OfficeMax, Inc. | 3,480 | 48,371 | |||||||||
| PEP Boys-Manny, Moe & Jack | 1,768 | 15,417 | |||||||||
| PetMed Express, Inc.* | 110 | 1,348 | |||||||||
| Select Comfort Corp.* | 708 | 1,161 | |||||||||
| Sonic Automotive, Inc. Class A | 3,277 | 42,240 | |||||||||
| Stage Stores, Inc. | 802 | 9,359 | |||||||||
| Stamps.com, Inc.* | 62 | 774 | |||||||||
| Stein Mart, Inc. | 2,662 | 12,006 | |||||||||
| Tractor Supply Co.* | 576 | 16,727 | |||||||||
| Tuesday Morning Corp.* | 1,144 | 4,702 | |||||||||
| Tween Brands, Inc.* | 304 | 5,004 | |||||||||
| Zale Corp.* | 1,230 | 23,235 | |||||||||
| Zumiez, Inc.* | 80 | 1,326 | |||||||||
| Total Retailing | 477,700 | ||||||||||
| Semiconductors & Semiconductor Equipment—1.8% | |||||||||||
| Actel Corp.* | 144 | 2,426 | |||||||||
| Advanced Energy Industries, Inc.* | 268 | 3,672 | |||||||||
| ATMI, Inc.* | 106 | 2,960 | |||||||||
| Axcelis Technologies, Inc.* | 896 | 4,372 | |||||||||
| Brooks Automation, Inc.* | 560 | 4,631 | |||||||||
| Cabot Microelectronics Corp.* | 80 | 2,652 | |||||||||
| Cohu, Inc. | 150 | 2,202 | |||||||||
| Cymer, Inc.* | 112 | 3,011 | |||||||||
| Diodes, Inc.* | 116 | 3,206 | |||||||||
| DSP Group, Inc.* | 138 | 966 | |||||||||
| Exar Corp.* | 70 | 528 | |||||||||
| FEI Co.* | 212 | 4,829 | |||||||||
| Kopin Corp.* | 222 | 637 | |||||||||
| Kulicke & Soffa Industries, Inc.* | 802 | 5,847 | |||||||||
| Micrel, Inc. | 268 | 2,452 | |||||||||
| Investments | Shares | Value | |||||||||
| Microsemi Corp.* | 172 | $ | 4,331 | ||||||||
| MKS Instruments, Inc.* | 404 | 8,847 | |||||||||
| Pericom Semiconductor Corp.* | 66 | 979 | |||||||||
| Photronics Inc.* | 388 | 2,732 | |||||||||
| Rudolph Technologies, Inc.* | 142 | 1,093 | |||||||||
| Skyworks Solutions, Inc.* | 766 | 7,560 | |||||||||
| Standard Microsystems Corp.* | 90 | 2,444 | |||||||||
| Supertex, Inc.* | 26 | 607 | |||||||||
| Ultratech, Inc.* | 82 | 1,273 | |||||||||
| Varian Semiconductor Equipment Associates, Inc.* | 206 | 7,173 | |||||||||
| Veeco Instruments, Inc.* | 236 | 3,795 | |||||||||
| Total Semiconductors & Semiconductor Equipment | 85,225 | ||||||||||
| Software & Services—3.1% | |||||||||||
| Ansoft Corp.* | 26 | 946 | |||||||||
| ANSYS, Inc.* | 82 | 3,864 | |||||||||
| Bankrate, Inc.* | 22 | 860 | |||||||||
| Blackbaud, Inc. | 76 | 1,626 | |||||||||
| CACI International, Inc., Class A* | 366 | 16,752 | |||||||||
| Captaris, Inc.* | 206 | 834 | |||||||||
| Catapult Communications Corp.* | 62 | 441 | |||||||||
| CIBER, Inc.* | 1,390 | 8,632 | |||||||||
| Concur Technologies, Inc.* | 28 | 930 | |||||||||
| CSG Systems International, Inc.* | 840 | 9,257 | |||||||||
| CyberSource Corp.* | 54 | 903 | |||||||||
| Dealertrack Holdings Inc* | 50 | 706 | |||||||||
| Epicor Software Corp.* | 350 | 2,419 | |||||||||
| EPIQ Systems, Inc.* | 90 | 1,278 | |||||||||
| FactSet Research Systems, Inc. | 60 | 3,382 | |||||||||
| Gevity HR, Inc. | 1,120 | 6,026 | |||||||||
| Informatica Corp.* | 194 | 2,918 | |||||||||
| InfoSpace, Inc. | 142 | 1,183 | |||||||||
| j2 Global Communications, Inc.* | 80 | 1,840 | |||||||||
| JDA Software Group, Inc.* | 154 | 2,787 | |||||||||
| Knot, Inc.* | 66 | 645 | |||||||||
| Manhattan Associates, Inc.* | 110 | 2,610 | |||||||||
| Mantech International Corp. Class A* | 302 | 14,532 | |||||||||
| MAXIMUS, Inc. | 164 | 5,710 | |||||||||
| MICROS Systems, Inc.* | 192 | 5,854 | |||||||||
| Perficient, Inc.* | 116 | 1,121 | |||||||||
| Phoenix Technologies Ltd.* | 26 | 286 | |||||||||
| Progress Software Corp.* | 132 | 3,375 | |||||||||
| Quality Systems, Inc. | 44 | 1,288 | |||||||||
| Radiant Systems, Inc.* | 140 | 1,502 | |||||||||
| Secure Computing Corp.* | 230 | 952 | |||||||||
| SI International, Inc.* | 176 | 3,685 | |||||||||
| Smith Micro Software, Inc.* | 84 | 479 | |||||||||
| Sonic Solutions* | 134 | 799 | |||||||||
| SPSS, Inc.* | 70 | 2,546 | |||||||||
| Startek, Inc.* | 222 | 2,087 | |||||||||
| Take-Two Interactive Software, Inc.* | 512 | 13,092 | |||||||||
| THQ, Inc.* | 358 | 7,253 | |||||||||
| Tyler Technologies, Inc.* | 122 | 1,656 | |||||||||
| United Online, Inc. | 386 | 3,872 | |||||||||
| Websense, Inc.* | 108 | 1,819 | |||||||||
| Wright Express Corp.* | 76 | 1,885 | |||||||||
| Total Software & Services | 144,632 | ||||||||||
The accompanying notes are an integral part of these financial statements.
27
Schedule of Investments — concluded
REVENUESHARES SMALL CAP FUND
JUNE 30, 2008
| Investments | Shares | Value | |||||||||
| Technology Hardware & Equipment—7.6% | |||||||||||
| Adaptec, Inc.* | 766 | $ | 2,451 | ||||||||
| Agilysys, Inc. | 636 | 7,212 | |||||||||
| Anixter International, Inc.* | 828 | 49,259 | |||||||||
| Arris Group, Inc.* | 856 | 7,233 | |||||||||
| Avid Technology, Inc.* | 310 | 5,267 | |||||||||
| Bel Fuse, Inc. Class B | 78 | 1,927 | |||||||||
| Benchmark Electronics, Inc.* | 1,524 | 24,903 | |||||||||
| Black Box Corp. | 234 | 6,362 | |||||||||
| Blue Coat Systems Inc* | 42 | 593 | |||||||||
| Brightpoint, Inc.* | 1,818 | 13,271 | |||||||||
| Checkpoint Systems, Inc.* | 322 | 6,723 | |||||||||
| Cognex Corp. | 98 | 2,259 | |||||||||
| Comtech Telecommunications Corp.* | 76 | 3,724 | |||||||||
| CTS Corp. | 594 | 5,970 | |||||||||
| Daktronics, Inc. | 164 | 3,308 | |||||||||
| Digi International, Inc.* | 98 | 769 | |||||||||
| Ditech Networks, Inc.* | 209 | 449 | |||||||||
| Electro Scientific Industries, Inc.* | 108 | 1,530 | |||||||||
| FARO Technologies, Inc.* | 62 | 1,561 | |||||||||
| Gerber Scientific, Inc.* | 532 | 6,054 | |||||||||
| Harmonic Inc.* | 258 | 2,454 | |||||||||
| Hutchinson Technology, Inc.* | 240 | 3,226 | |||||||||
| Insight Enterprises, Inc.* | 2,356 | 27,637 | |||||||||
| Intevac, Inc.* | 178 | 2,008 | |||||||||
| Itron, Inc.* | 155 | 15,245 | |||||||||
| Keithley Instruments, Inc. | 146 | 1,387 | |||||||||
| Littelfuse, Inc.* | 144 | 4,543 | |||||||||
| LoJack Corp.* | 116 | 923 | |||||||||
| Mercury Computer Systems, Inc.* | 146 | 1,099 | |||||||||
| Methode Electronics, Inc. | 352 | 3,678 | |||||||||
| MTS Systems Corp. | 92 | 3,301 | |||||||||
| Netgear, Inc.* | 190 | 2,633 | |||||||||
| Network Equipment Technologies Inc.* | 56 | 199 | |||||||||
| Newport Corp.* | 310 | 3,531 | |||||||||
| Novatel Wireless, Inc.* | 224 | 2,493 | |||||||||
| Park Electrochemical Corp. | 78 | 1,896 | |||||||||
| PC-Tel, Inc.* | 94 | 901 | |||||||||
| Photon Dynamics, Inc.* | 80 | 1,206 | |||||||||
| Planar Systems, Inc.* | 388 | 1,009 | |||||||||
| Plexus Corp.* | 474 | 13,120 | |||||||||
| RadiSys Corp.* | 170 | 1,540 | |||||||||
| Rogers Corp.* | 92 | 3,458 | |||||||||
| Scansource, Inc.* | 504 | 13,487 | |||||||||
| Stratasys, Inc.* | 42 | 775 | |||||||||
| Symmetricom, Inc.* | 454 | 1,743 | |||||||||
| Synaptics, Inc.* | 40 | 1,509 | |||||||||
| SYNNEX Corp.* | 3,055 | 76,651 | |||||||||
| Technitrol, Inc. | 348 | 5,913 | |||||||||
| Tollgrade Communications, Inc.* | 76 | 341 | |||||||||
| TTM Technologies, Inc.* | 514 | 6,790 | |||||||||
| Viasat, Inc.* | 138 | 2,789 | |||||||||
| Total Technology Hardware & Equipment | 358,310 | ||||||||||
| Telecommunication Services—0.1% | |||||||||||
| Fairpoint Communications, Inc. | 275 | 1,983 | |||||||||
| General Communication, Inc. Class A* | 532 | 3,655 | |||||||||
| Total Telecommunication Services | 5,638 | ||||||||||
| Investments | Shares | Value | |||||||||
| Transportation—2.8% | |||||||||||
| Arkansas Best Corp. | 720 | $ | 26,381 | ||||||||
| Forward Air Corp. | 98 | 3,391 | |||||||||
| Heartland Express, Inc. | 366 | 5,457 | |||||||||
| HUB Group, Inc., Class A* | 572 | 19,522 | |||||||||
| Kirby Corp.* | 206 | 9,888 | |||||||||
| Knight Transportation, Inc. | 422 | 7,723 | |||||||||
| Landstar System, Inc. | 510 | 28,162 | |||||||||
| Old Dominion Freight Line, Inc.* | 552 | 16,571 | |||||||||
| Skywest, Inc. | 1,120 | 14,168 | |||||||||
| Total Transportation | 131,263 | ||||||||||
| Utilities—6.2% | |||||||||||
| ALLETE, Inc. | 182 | 7,644 | |||||||||
| American States Water Co. | 64 | 2,236 | |||||||||
| Atmos Energy Corp. | 1,976 | 54,479 | |||||||||
| Avista Corp. | 608 | 13,048 | |||||||||
| Central Vermont Public Service Corp. | 108 | 2,092 | |||||||||
| CH Energy Group, Inc. | 232 | 8,252 | |||||||||
| Cleco Corp. | 330 | 7,699 | |||||||||
| El Paso Electric Co.* | 270 | 5,346 | |||||||||
| Laclede Group, Inc. | 522 | 21,073 | |||||||||
| New Jersey Resources Corp. | 795 | 25,957 | |||||||||
| Northwest Natural Gas Co. | 194 | 8,974 | |||||||||
| Piedmont Natural Gas Co., Inc. | 584 | 15,277 | |||||||||
| South Jersey Industries, Inc. | 230 | 8,593 | |||||||||
| Southern Union Co. | 766 | 20,697 | |||||||||
| Southwest Gas Corp. | 648 | 19,265 | |||||||||
| UGI Corp. | 1,790 | 51,391 | |||||||||
| UIL Holdings Corp. | 238 | 7,000 | |||||||||
| UniSource Energy Corp. | 390 | 12,094 | |||||||||
| Total Utilities | 291,117 | ||||||||||
| Total Investments—99.2% (Cost $5,013,222) | 4,663,988 | ||||||||||
| Other Assets in Excess of Liabilities—0.8% | 38,133 | ||||||||||
| Net Assets—100.0% | $ | 4,702,121 | |||||||||
* Non-Income producing security.
(a) Real Estate Investment Trust (REIT)
(b) "When issued" (W/I)
The accompanying notes are an integral part of these financial statements.
28
Statements of Assets and Liabilities
JUNE 30, 2008
| RevenueShares Large Cap Fund | RevenueShares Mid Cap Fund | RevenueShares Small Cap Fund | |||||||||||||
| ASSETS: | |||||||||||||||
| Investments at value | $ | 31,910,279 | $ | 4,835,730 | $ | 4,663,988 | |||||||||
| Cash | 206,680 | 58,218 | 61,335 | ||||||||||||
| Receivables: | |||||||||||||||
| Expense waivers due from Adviser | 54,511 | 55,513 | 55,532 | ||||||||||||
| Dividends receivables | 25,587 | 3,959 | 4,869 | ||||||||||||
| Receivable for securities sold | 50,205 | — | 2,295 | ||||||||||||
| Other assets | 185 | 189 | 182 | ||||||||||||
| Total Assets | 32,247,447 | 4,953,609 | 4,788,201 | ||||||||||||
| LIABILITIES: | |||||||||||||||
| Securities sold short, at value (proceeds received of $731) | 731 | — | — | ||||||||||||
| Payables: | |||||||||||||||
| Investment securities purchased | 48,735 | — | 2,295 | ||||||||||||
| Dividends payable | 72,607 | 14,055 | 13,184 | ||||||||||||
| Advisory fees (Note 4) | 17,101 | 6,486 | 6,285 | ||||||||||||
| Principal Financial Officer fees | 3,044 | 4,475 | 4,503 | ||||||||||||
| Trustee fees | 3,041 | 3,040 | 3,040 | ||||||||||||
| Other accrued expenses | 53,832 | 56,709 | 56,773 | ||||||||||||
| Total Liabilities | 199,091 | 84,765 | 86,080 | ||||||||||||
| NET ASSETS | $ | 32,048,356 | $ | 4,868,844 | $ | 4,702,121 | |||||||||
| NET ASSETS CONSIST OF: | |||||||||||||||
| Paid-in capital | $ | 34,824,142 | $ | 5,104,798 | $ | 5,044,278 | |||||||||
| Undistributed net investment income | 7,646 | 1,189 | 981 | ||||||||||||
| Net realized gain (loss) on investments | (26,639 | ) | (4,053 | ) | 6,096 | ||||||||||
| Net unrealized depreciation on investments | (2,756,793 | ) | (233,090 | ) | (349,234 | ) | |||||||||
| NET ASSETS | $ | 32,048,356 | $ | 4,868,844 | $ | 4,702,121 | |||||||||
| Shares outstanding (unlimited number of shares of beneficial interest authorized, without par value) | 700,700 | 100,700 | 100,700 | ||||||||||||
| Net asset value, per share | $ | 45.74 | $ | 48.35 | $ | 46.69 | |||||||||
| Investments at cost | $ | 34,667,072 | $ | 5,068,820 | $ | 5,013,222 | |||||||||
The accompanying notes are an integral part of these financial statements.
29
Statements of Operations
FOR THE PERIOD FEBRUARY 22, 2008* TO JUNE 30, 2008
| RevenueShares Large Cap Fund | RevenueShares Mid Cap Fund | RevenueShares Small Cap Fund | |||||||||||||
| INVESTMENT INCOME: | |||||||||||||||
| Dividend income | $ | 101,810 | $ | 26,074 | $ | 24,707 | |||||||||
| Foreign withholding tax | — | — | (12 | ) | |||||||||||
| Total Income | 101,810 | 26,074 | 24,695 | ||||||||||||
| EXPENSES: | |||||||||||||||
| Professional fees | 22,472 | 22,472 | 22,472 | ||||||||||||
| Advisory (Note 4) | 19,452 | 9,101 | 8,908 | ||||||||||||
| BNY Fund Services fees | 17,951 | 17,951 | 17,951 | ||||||||||||
| Compliance | 11,456 | 10,956 | 10,942 | ||||||||||||
| Principal Financial Officer fees | 9,723 | 9,625 | 9,621 | ||||||||||||
| Distributor | 7,170 | 7,768 | 7,787 | ||||||||||||
| Trustees | 3,457 | 3,457 | 3,457 | ||||||||||||
| Other expense | 8,441 | 8,443 | 8,446 | ||||||||||||
| Total Expenses | 100,122 | 89,773 | 89,584 | ||||||||||||
| Less expense waivers (Note 4) | (78,942 | ) | (79,944 | ) | (79,963 | ) | |||||||||
| Net Expenses | 21,180 | 9,829 | 9,621 | ||||||||||||
| Net Investment Income | 80,630 | 16,245 | 15,074 | ||||||||||||
| NET REALIZED AND UNREALIZED GAIN (LOSS) ON INVESTMENTS: | |||||||||||||||
| Net realized gain (loss) on investments | (27,016 | ) | (5,054 | ) | 5,187 | ||||||||||
| Net unrealized depreciation on investments | (2,756,793 | ) | (233,090 | ) | (349,234 | ) | |||||||||
| Net realized and unrealized loss on investments | (2,783,809 | ) | (238,144 | ) | (344,047 | ) | |||||||||
| Net decrease in net assets resulting from operations | $ | (2,703,179 | ) | $ | (221,899 | ) | $ | (328,973 | ) | ||||||
* Commencement of operations.
The accompanying notes are an integral part of these financial statements.
30
Statements of Changes in Net Assets
FOR THE PERIOD FEBRUARY 22, 2008* TO JUNE 30, 2008
| RevenueShares Large Cap Fund | RevenueShares Mid Cap Fund | RevenueShares Small Cap Fund | |||||||||||||
| OPERATIONS: | |||||||||||||||
| Net investment income | $ | 80,630 | $ | 16,245 | $ | 15,074 | |||||||||
| Net realized gain (loss) on investments | (27,016 | ) | (5,054 | ) | 5,187 | ||||||||||
| Net change unrealized depreciation on investments | (2,756,793 | ) | (233,090 | ) | (349,234 | ) | |||||||||
| Net decrease in net assets resulting from operations | (2,703,179 | ) | (221,899 | ) | (328,973 | ) | |||||||||
| DISTRIBUTION TO SHAREHOLDERS FROM: | |||||||||||||||
| Net investment income | (72,607 | ) | (14,055 | ) | (13,184 | ) | |||||||||
| SHAREHOLDER TRANSACTIONS: | |||||||||||||||
| Proceeds from shares sold | 34,789,142 | 5,069,798 | 5,009,278 | ||||||||||||
| Increase in net assets | 32,013,356 | 4,833,844 | 4,667,121 | ||||||||||||
| NET ASSETS: | |||||||||||||||
| Beginning of period | 35,000 | 35,000 | 35,000 | ||||||||||||
| End of period | $ | 32,048,356 | $ | 4,868,844 | $ | 4,702,121 | |||||||||
| Undistributed net investment income included in net assets at end of period | $ | 7,646 | $ | 1,189 | $ | 981 | |||||||||
| CHANGES IN SHARES OUTSTANDING: | |||||||||||||||
| Shares outstanding, beginning of period | 700 | 700 | 700 | ||||||||||||
| Shares sold | 700,000 | 100,000 | 100,000 | ||||||||||||
| Shares outstanding, end of period | 700,700 | 100,700 | 100,700 | ||||||||||||
* Commencement of operations.
The accompanying notes are an integral part of these financial statements.
31
Financial Highlights
FOR THE PERIOD FEBRUARY 22, 20081 THROUGH JUNE 30, 2008
| RevenueShares Large Cap Fund | RevenueShares Mid Cap Fund | RevenueShares Small Cap Fund | |||||||||||||
| Per Share Operating Performance: | |||||||||||||||
| Net asset value, beginning of period | $ | 50.00 | $ | 50.00 | $ | 50.00 | |||||||||
| Net investment income2 | 0.29 | 0.16 | 0.15 | ||||||||||||
| Net realized and unrealized loss on investments | (4.45 | ) | (1.67 | ) | (3.33 | ) | |||||||||
| Total loss from investment operations | (4.16 | ) | (1.51 | ) | (3.18 | ) | |||||||||
| Less: Distributions from net investment income | (0.10 | ) | (0.14 | ) | (0.13 | ) | |||||||||
| Net asset value, end of period | $ | 45.74 | $ | 48.35 | $ | 46.69 | |||||||||
| Total Return3 | (8.31 | )% | (3.02 | )% | (6.36 | )% | |||||||||
| Ratios/Supplemental Data: | |||||||||||||||
| Net assets, end of period (000's omitted) | $ | 32,048 | $ | 4,869 | $ | 4,702 | |||||||||
| Ratio to average net assets of: | |||||||||||||||
| Expenses, net of expense waivers4 | 0.49 | % | 0.54 | % | 0.54 | % | |||||||||
| Expenses, prior to expense waivers4 | 2.32 | % | 4.93 | % | 5.03 | % | |||||||||
| Net investment income, net of waivers4 | 1.87 | % | 0.89 | % | 0.85 | % | |||||||||
| Portfolio turnover rate5 | 0.88 | % | 1.07 | % | 6.44 | % | |||||||||
1 Commencement of operations.
2 Based on average shares outstanding.
3 Total return is calculated assuming an initial investment made at the net asset value at the beginning of the period, reinvestment of all dividends and distributions at net asset value during the period and redemption on the last day of the period. Total return calculated for a period of less than one year is not annualized. The total return would have been lower if certain expenses had not been reimbursed/waived by the investment adviser.
4 Annualized.
5 Portfolio turnover rate is not annualized and excludes the value of portfolio securities received or delivered as a result of in-kind creations or redemptions of the Funds' capital shares.
The accompanying notes are an integral part of these financial statements.
32
Notes to Financial Statements
1. ORGANIZATION
The RevenueShares ETF Trust (the "Trust") was organized as a Delaware statutory trust on December 15, 2006 and has authorized capital of unlimited shares, without par value. The Trust is an open-end management investment company, registered under the Investment Company Act of 1940, as amended (the "Act"), which is currently comprised of three active funds (collectively, the "Funds" and each individually a "Fund"). Each Fund is a diversified fund under the Act. The Funds commenced operations on February 22, 2008.
The objective of the Funds (RevenueShares Large Cap Fund, RevenueShares Mid Cap Fund, and RevenueShares Small Cap Fund) is to outperform the total return performance of the Fund's corresponding benchmark Standard & Poor's index (S&P 500 Index, S&P MidCap 400 Index, and the S&P SmallCap 600 Index, respectively).
2. SIGNIFICANT ACCOUNTING POLICIES
These financial statements are prepared in accordance with accounting principles generally accepted in the United States of America, which require management to make estimates and assumptions that affect the reported amount of assets and liabilities, the disclosure of contingent liabilities at the date of the financial statements, and the reported amount of increase and decrease in net assets from operations during the fiscal period. Actual amounts could differ from these estimates. The following summarizes the significant accounting policies of the Funds:
Investment Valuation — The Net Asset Value ("NAV") per share of each Fund is computed by dividing the value of the net assets of each Fund by the total number of outstanding shares of that Fund, rounded to the nearest cent. The NAV per share is calculated by fund accounting and determined as of the close of the regular trading session on the NYSE ordinarily 4:00 p.m., Eastern Time on each day that such exchange is open. Security holdings traded on a national securities exchange are valued based on their last sale price. Price information on listed securities is taken from the exchange where the security is primarily traded. Securities regularly traded in an over the counter market are valued at the latest quoted sale price in such market or in the case of the NASDAQ, at the NASDAQ official closing price. Other portfolio securities and assets for which market quotati ons are not readily available are valued based on fair value as determined in good faith and in accordance with procedures adopted by the Trust's Board of Trustees (the "Board").
Investment Transactions — Investment transactions are accounted for on the trade date. Realized gains and losses on sales of investment securities are calculated using the identified cost method.
Distribution to Shareholders — Each Fund's shareholders are entitled to their share of a Fund's income and net realized gains on investments. Each Fund pays out substantially all of its net earnings to its shareholders as "distributions." Income distributions, if any are generally distributed to shareholders quarterly. Net capital gains are distributed at least annually.
Investment Income — Dividend income is recognized on the ex-dividend date. Interest income is accrued daily. The value of additional securities received as dividend payments is recorded as income and as an increase to the cost basis of such securities.
Expenses — Expenses of the Trust, which are directly identifiable to a specific Fund, are applied to that Fund. Expenses which are not readily identifiable to a specific Fund are allocated in such a manner as deemed equitable, taking into consideration the nature and type of expense and the relative net assets of each Fund.
Short Sales — The Funds may engage in short sales that are "uncovered". Uncovered short sales are transactions under which a Fund sells a security it does not own. To complete such a transaction, the Fund must borrow the security to make delivery to the buyer. The Fund then is obligated to replace the security borrowed by purchasing the security at the market price at the time of replacement. The price at such time may be more or less than the price at which the security was sold by the Fund. Until the security is replaced, the Fund is required to pay the lender amounts equal to dividend or interest that accrue during the period of the loan which is recorded as an expense on the Statement of Operations. To borrow the security, the Fund also may be required to pay a premium, which would decrease proceeds of the security sold. The proceeds of the short sale will be re tained by the broker, to the extent necessary to meet margin requirements, until the short position is closed out. A gain, limited to the price at which the Fund sells the security short, or a loss, potentially unlimited in size, will be recognized upon the closing of a short sale.
33
Notes to Financial Statements — continued
3. OFFERING AND ORGANIZATIONAL COSTS
VTL Associates, LLC. (the "Adviser") has agreed to assume all organization and offering costs and expenses in order to limit each Fund's operating expenses. The Adviser has paid $730,000 in offering and organizational costs.
4. ADVISORY FEES, SERVICING FEES AND OTHER TRANSACTIONS
The Adviser has overall responsibility for the general management and administration of the Funds, subject to the supervision of the Funds' Board. For the services it provides to the Funds, the Adviser receives an advisory fee based on a percentage of daily net assets of each Fund. Out of the advisory fee, the Adviser pays all fees and expenses of the Sub-Adviser. Each Fund is responsible for the payment of all other expenses associated with the operations, including but not limited to brokerage expenses, taxes, interest, fees and expenses of counsel to the Funds, fees and expenses of the Trustees, fees and expenses associated with the Funds' compliance program, litigation expenses, fees and expenses of the Funds' independent auditors, registration fees, expenses associated with compliance by the Funds with regulatory requirements, including those relating to the development and distribution of their prospectus and shareholder reports, and e xtraordinary expenses.
For services provided, the RevenueShares Large Cap, Mid Cap, and Small Cap Funds pays the Adviser a fee of 0.45%, 0.50% and 0.50%, respectively, of each Fund's average daily net assets.
The Trust and the Adviser have entered into a written fee waiver and expense reimbursement agreement pursuant to which the Adviser has agreed to waive a portion of its fees and/or reimburse expenses to the extent necessary to keep each Fund's expenses from exceeding the net annual fund operating expenses for the RevenueShares Large Cap, Mid Cap, and Small Cap Funds to 0.49%, 0.54% and 0.54%, respectively. This agreement will remain in effect and will be contractually binding for at least one year from the date of the Prospectus.
For the period ended June 30, 2008, the Adviser waived the following fees:
| Fund | Fees Waived | ||||||
| RevenueShares Large Cap Fund | $ | 78,942 | |||||
| RevenueShares Mid Cap Fund | 79,944 | ||||||
| RevenueShares Small Cap Fund | 79,963 | ||||||
BNY Investment Advisors (the "Sub-Adviser"), a separate identifiable division of The Bank of New York Mellon Corporation, acts as investment sub-adviser to the Funds. Pursuant to a Sub-Advisory Agreement between the Adviser and the Sub-Adviser, the Sub-Adviser will be responsible for the day-to-day management of the Funds, subject to the supervision of the Adviser and the Funds' Board. In this regard, the Sub-Adviser will be responsible for implementing the investment strategy for each Fund with regard to its underlying index and for general administration, compliance and management services as may be agreed between the Adviser and Sub-Adviser from time to time. The Sub-Advisory fee, calculated as a percentage of the Funds' average daily net assets, is paid by the Adviser. As of August 8, 2008 BNY Investment Advisors was replaced by Mellon Capital Management Corp.
The Bank of New York Mellon Corp. serves as the administrator, custodian and fund accounting and transfer agent for each Fund.
Distribution Agreement — Foreside Fund Services, LLC serves as the Funds' distributor (the "Distributor"). The Trust has adopted a distribution and services plan ("12b-1") pursuant to rule 12b-1 under the 1940 Act. Each Fund is authorized to pay an amount of up to a maximum annual rate of 0.25% of the average daily net assets for distribution related activities. No 12b-1 fees are currently paid by the Funds, and there are currently no plans to impose these fees.
Foreside Compliance Services, LLC ("FCS"), an affiliate of the Distributor, provides an Anti-Money Laundering Officer and Chief Compliance Officer as well as certain additional compliance support functions to the Funds. Foreside Management Services, LLC ("FMS"), an affiliate of the Distributor, provides a Principal Financial Officer to the Funds. Neither FCS nor FMS has any role in determining the investment policies or which securities are to be purchased or sold by the Trust or its Funds. Certain officers or employees of FCS and FMS are also officers of the Trust.
Licensing Fee Agreements — The Adviser has entered into a licensing agreement for each Fund with RevenueShares Investor Services. The trademarks are owned by the Licensor. These trademarks have been licensed to the Adviser for the use with the Funds.
34
Notes to Financial Statements — continued
5. CAPITAL SHARE TRANSACTIONS
As of June 30, 2008, there were an unlimited number of shares of beneficial interest without par value authorized by the Trust. Each Fund issues and redeems shares at NAV, only in large blocks typically consisting of 50,000 shares or more ("Creation Units"). Except when aggregated in Creation Units, shares of each Fund are not redeemable. Transactions in shares for each Fund are disclosed in detail in the Statements of Changes in Net Assets. The consideration for the purchase of Creation Units of a Fund generally consists of the in-kind contribution of a designated portfolio of equity securities constituting a portfolio sampling representation of the securities included in the relevant Fund's underlying index and an amount of cash. Investors purchasing and redeeming Creation Units may be charged a purchase transaction fee and a redemption transaction fee to offset transfer and other transaction costs associated with the issuance and redempti on of Creation Units.
6. FAIR VALUE MEASUREMENT
In September 2006, the FASB issued Statement of Financial Accounting Standards No. 157, "Fair Value Measurement" ("FAS 157"). FAS 157 establishes an authoritative framework for the measurement of fair value, and enhances disclosures about fair value measurements. The Statement is effective for fair value measures already required or permitted by other standards for fiscal years beginning after November 15, 2007. As a result of the adoption of FAS 157, there was no impact on the financial statements or the manner for which fair valued is determined. The Fund utilizes various inputs in determining the value of its investments. These inputs are summarized in the three broad levels as follows: Level 1 — quoted prices in active markets for identical securities Level 2 — other significant observa ble inputs (including quoted prices for similar securities, interest rates, prepayment speeds, credit risk, etc.) Level 3 — significant unobservable inputs (including the Fund's own assumptions in determining the fair value of investments). The inputs or methodology used for valuing securities are not necessarily an indication of the risk associated with investing in those securities. A summary of the inputs used as of June 30, 2008 in valuing the Funds' assets carried at fair value:
| Valuation inputs | RevenueShares Large Cap Fund | RevenueShares Mid Cap Fund | RevenueShares Small Cap Fund | ||||||||||||||||||||||||
| Investments in Securities | Other Financial Investments | Investments in Securities | Other Financial Investments | Investments in Securities | Other Financial Investments | ||||||||||||||||||||||
| Level 1 — Quoted Prices | $ | 31,910,279 | — | $ | 4,835,730 | — | $ | 4,663,988 | — | ||||||||||||||||||
| Level 2 — Other Significant Observable Inputs | — | — | — | — | — | — | |||||||||||||||||||||
| Level 3 — Significant Unobservable Inputs | — | — | — | — | — | — | |||||||||||||||||||||
| Total | $ | 31,910,279 | — | $ | 4,835,730 | — | $ | 4,663,988 | — | ||||||||||||||||||
7. INVESTMENT TRANSACTIONS
The cost of purchases and the proceeds from sales of investment securities (excluding in-kind purchases and redemptions and short-term investments) for the period ended June 30, 2008 were as follows:
| Fund | Purchases | Sales | |||||||||
| RevenueShares Large Cap Fund | $ | 122,954 | $ | 118,327 | |||||||
| RevenueShares Mid Cap Fund | 57,172 | 53,585 | |||||||||
| RevenueShares Small Cap Fund | 316,491 | 317,799 | |||||||||
35
Notes to Financial Statements — continued
For the period ended June 30, 2008, the cost of in-kind purchases and the proceeds from in-kind redemptions were as follows:
| Fund | Purchases | Sales | |||||||||
| RevenueShares Large Cap Fund | $ | 34,689,461 | — | ||||||||
| RevenueShares Mid Cap Fund | 5,070,287 | — | |||||||||
| RevenueShares Small Cap Fund | 5,009,343 | — | |||||||||
Gains and losses on in-kind redemptions are not recognized at the Fund level for tax purposes.
8. FEDERAL INCOME TAX
The Funds intend to qualify as a "regulated investment company" under Subchapter M of the Code. If so qualified, the Fund will not be subject to federal income tax to the extent it distributes substantially all of its net investment income and capital gains to shareholders.
At June 30, 2008, the aggregate gross unrealized appreciation and depreciation of investments for Federal income tax purposes were as follows:
| Fund | Tax Cost | Gross Unrealized Appreciation | Gross Unrealized Depreciation | Net Unrealized Depreciation | |||||||||||||||
| RevenueShares Large Cap Fund | $ | 34,667,045 | $ | 444,901 | $ | (3,201,667 | ) | $ | (2,756,766 | ) | |||||||||
| RevenueShares Mid Cap Fund | 5,068,708 | 331,481 | (564,459 | ) | (232,978 | ) | |||||||||||||
| RevenueShares Small Cap Fund | 5,012,892 | 326,943 | (675,847 | ) | (348,904 | ) | |||||||||||||
At June 30, 2008, the components of accumulated earnings/loss on a tax-basis were as follows:
| Fund | Undistributed Ordinary Income | Undistributed Capital and Other Gains/(Losses) | Net Unrealized Depreciation | Total Accumulated Earnings/(Losses) | |||||||||||||||
| RevenueShares Large Cap Fund | $ | 7,646 | $ | (26,666 | ) | $ | (2,756,766 | ) | $ | (2,775,786 | ) | ||||||||
| RevenueShares Mid Cap Fund | 1,189 | (4,165 | ) | (232,978 | ) | (235,954 | ) | ||||||||||||
| RevenueShares Small Cap Fund | 6,168 | 579 | (348,904 | ) | (342,157 | ) | |||||||||||||
The tax character of distributions paid during the fiscal year ended June 30, 2008 were as follows:
| Fund | Distributions paid from ordinary income | ||||||
| RevenueShares Large Cap Fund | $ | 72,607 | |||||
| RevenueShares Mid Cap Fund | 14,055 | ||||||
| RevenueShares Small Cap Fund | 13,184 | ||||||
At June 30, 2008, for Federal income tax purposes, the Funds have capital loss carryforwards available to offset future capital gains through the year indicated. To the extent that these loss carryforwards are utilized, capital gains so offset will not be distributed to shareholders.
| Fund | Capital Loss Available Through 2016 | ||||||
| RevenueShares Large Cap Fund | $ | 26,666 | |||||
| RevenueShares Mid Cap Fund | 4,165 | ||||||
| RevenueShares Small Cap Fund | — | ||||||
36
Notes to Financial Statements — concluded
At June 30, 2008, the effect of permanent book/tax reclassifications resulted in increases (decreases) to the components of net assets as follows:
| Fund | Undistributed Net Investment Income | Accumulated Net Realized Gain on investments | |||||||||
| RevenueShares Large Cap Fund | $ | (377 | ) | $ | 377 | ||||||
| RevenueShares Mid Cap Fund | (1,001 | ) | 1,001 | ||||||||
| RevenueShares Small Cap Fund | (909 | ) | 909 | ||||||||
FASB Interpretation No. 48, "Accounting for Uncertainty in Income Taxes" ("FIN 48") provides guidance for how uncertain tax positions should be recognized, measured, presented and disclosed in the financial statements. FIN 48 requires the evaluation of tax positions taken or expected to be taken in the course of preparing the Fund's tax returns to determine whether the tax positions are "more-likely-than-not" of being sustained by the applicable tax authority. Tax positions not deemed to meet the more-likely-than-not threshold are recorded as a tax benefit or expense in the current year. The adoption of FIN 48 did not result in the recording of any tax benefit or expense in the current period. Management's determination regarding FIN 48 may be subject to review and adjustment at a later date based on factors including, but not limited to, an on-going analysis of tax laws, regulations and interpretations thereof.
9. NEW ACCOUNTING PRONOUNCEMENTS
On March 19, 2008, Financial Accounting Standards Board released Statement of Financial Accounting Standards No. 161, "Disclosures about Derivative Instruments and Hedging Activities" ("FAS 161"). FAS 161 requires qualitative disclosures about objectives and strategies for using derivatives, quantitative disclosures about fair value amounts of and gains and losses on derivative instruments, and disclosures about credit-risk-related contingent features in derivative agreements. The application of FAS 161 is required for fiscal years beginning after November 15, 2008 and interim periods within those fiscal years. At this time, management is evaluating the implications of FAS 161 and its impact on the financial statements has not yet been determined.
37
Report of Independent Registered Public Accounting Firm
To the Shareholders and Board of Trustees of RevenueShares ETF Trust
We have audited the accompanying statements of assets and liabilities of the RevenueShares ETF Trust (comprising, respectively, the RevenueShares Large Cap Fund, RevenueShares Mid Cap Fund, and RevenueShares Small Cap Fund (the "Funds")) as of June 30, 2008, and the related statements of operations and changes in net assets and the financial highlights for the period of February 22, 2008 (commencement of operations) through June 30, 2008. These financial statements and financial highlights are the responsibility of the Funds' management. Our responsibility is to express an opinion on these financial statements and financial highlights based on our audits.
We conducted our audits in accordance with the standards of the Public Company Accounting Oversight Board (United States). Those standards require that we plan and perform the audit to obtain reasonable assurance about whether the financial statements and financial highlights are free of material misstatement. We were not engaged to perform an audit of the Funds' internal control over financial reporting. Our audits included consideration of internal control over financial reporting as a basis for designing audit procedures that are appropriate in the circumstances, but not for the purpose of expressing an opinion on the effectiveness of the Funds' internal control over financial reporting. Accordingly, we express no such opinion. An audit also includes examining, on a test basis, evidence supporting the amounts and disclosures in the financial statements and financial highlights, assessing the accounting principles used and significant esti mates made by management, and evaluating the overall financial statement presentation. Our procedures included confirmation of securities owned as of June 30, 2008, by correspondence with the custodian and brokers or by other appropriate auditing procedures where replies from brokers were not received. We believe that our audits provide a reasonable basis for our opinion.
In our opinion, the financial statements and financial highlights referred to above present fairly, in all material respects, the financial position of the Funds at June 30, 2008, the results of their operations, the changes in their net assets and the financial highlights for the period of February 22, 2008 (commencement of operations) through June 30, 2008 in conformity with U.S. generally accepted accounting principles.

Philadelphia, Pennsylvania
August 26, 2008
38
Board Review of Investment Advisory and Sub-Advisory Agreements
The Board of Trustees (the "Board"), including a majority of the Independent Trustees, approved each Fund's investment advisory agreement with VTL Associates, LLC (the "Adviser") and sub-advisory agreement with Mellon Capital Management (formerly, BNY Investment Advisers; the "Sub-Adviser"), as well as each Fund's administrative services agreement with an affiliate of the Fund's Sub-Adviser. In connection with considering approval of such agreements, the Board held three meetings primarily dedicated to the approval process (those Trustees unable to attend in person were present by telephonic conference means). Throughout the process, the Independent Trustees received assistance and advice from and met separately with independent counsel. The Independent Trustees met with and interviewed officers of the Adviser and Sub-Adviser (including portfolio managers), the transfer agent and the distributor. In approving the investment advisory agreemen t, the sub-advisory agreement and the administrative services agreement for each Fund, the Board, including a majority of Independent Trustees, determined that the investment advisory fee structure was fair and reasonable and that approval of the agreements was in the best interests of each Fund and its shareholders.
In reaching their decision on the investment advisory agreement and the sub-advisory agreement (as well as the administrative services agreement), the Board took into account information specifically requested and furnished in connection with the approval process. During the process, the Independent Trustees considered the Adviser's and Sub-Adviser's activities on behalf of other clients.
The information obtained by the Board during the approval process also included a special report prepared by Lipper, Inc. ("Lipper"), an independent third-party analyst, comparing the Fund's proposed expenses with those of other funds deemed comparable to the Fund as selected by Lipper ("Lipper Section 15(c) Report"). The Board reviewed the Lipper Section 15(c) Report and its usefulness in the approval process with respect to matters such as comparative fees, expenses and expense ratios. They concluded that the report was helpful in the performance of their duties.
In addition to the above and other matters considered by the Board throughout the course of the year, the following discussion relates to certain primary factors relevant to the Board's decision. No single factor was determinative to the decision of the Board.
NATURE, EXTENT AND QUALITY OF SERVICES.
The Board reviewed the nature, extent and quality of the services to be provided by the Adviser and the Sub-Adviser. In this regard, they reviewed each Fund's revenue-weighted investment approach and the Adviser's and Sub-Adviser's ability, respectively, to implement such approach. The Board reviewed each Fund's portfolio management team, including its performance in advising similar accounts, staffing, skills and compensation program. With respect to portfolio manager compensation, management of the Adviser and the Sub-Adviser assured the Board that each Fund's ability to replicate its corresponding performance of the revenue-weighted index is a significant component of incentive-based compensation. The Board noted that the portfolio manager compensation program aligned the interests of the portfolio managers with that of Fund shareholders. The Board discussed with management of the Adviser and the Sub-Adviser various other products, portfo lios and entities that are advised by each of them and the relative fees of such accounts and reasons for differences with respect thereto and any potential conflicts. During the aforementioned meetings, the Board received and discussed the Adviser's and Sub-Adviser's compliance policies, proxy voting procedures and code of ethics. The Board noted that the Adviser and the Sub-Adviser do not have any soft-dollar arrangements.
The Independent Trustees also discussed the Adviser's ability to oversee: each Fund's security weighting allocations as compared to the Fund's underlying revenue-weighted index; each Fund's cash management and investing of securities lending collateral; and corporate developments in constituent securities to ensure that reconstitutions of a Fund are done according to the predetermined methodology. The Board also considered the services to be provided by the Adviser in its oversight of the Funds' administrator, custodian and transfer agent and the Sub-Adviser. They noted the significant amount of time and effort that had been devoted to structuring each Fund, obtaining the necessary exemptive relief from the U.S. Securities and Exchange Commission and arranging prospective service providers for the Fund.
The Independent Trustees discussed the replication method to be employed by the Sub-Adviser in adjusting each Fund's portfolio in response to changes in the underlying index. The Independent Trustees also discussed the Adviser's review and selection process with respect to the Sub-Adviser, and the Adviser's favorable assessment as to the nature and quality of the sub-advisory services expected to be provided by the Sub-Adviser.
Based on their review, the Board was satisfied with the nature and quality of the overall services to be provided by the Adviser and the Sub-Adviser, respectively, to each Fund and its shareholders and were confident in the abilities of the Adviser and Sub-Adviser, respectively, to implement the revenue-weighted investment approach of each Fund and to provide quality services to each Fund and its shareholders.
39
Board Review of Investment Advisory and Sub-Advisory Agreements — concluded
INVESTMENT PERFORMANCE.
The Board noted that, as the Funds had not yet commenced investment operations, there was no investment performance for the Funds. The Board did consider the investment performance of the Adviser with respect to other accounts managed by the Adviser that have similar revenue-weighted investment objectives. The Board also considered the investment performance of the Sub-Adviser with respect to other accounts managed by the Sub-Adviser that seek to track the performance of an index. Both the Adviser and the Sub-Adviser had had minimal tracking deviations compared to the respective underlying indexes.
COMPARATIVE EXPENSES AND ADVISER AND SUB-ADVISER PROFITABILITY.
The Board considered the cost of the services to be provided and the profits to be realized by the Adviser and the Sub-Adviser (and its affiliates) from their respective relationships with the Funds. The Board noted that the Adviser and Sub-Adviser could not report any financial results from their relationships with the Funds because the Funds had not yet commenced investment operations, and thus, the Board could not evaluate the Adviser's or Sub-Adviser's profitability with respect to the Funds. The Board, however, discussed the methods and processes for determining the profitability of the Adviser and the Sub-Adviser (and its affiliates) from providing investment advisory and sub-advisory services to the Funds once financial results become available. The Board also considered the extent to which the Adviser and Sub-Adviser may derive ancillary benefits from Fund operations.
In considering the appropriateness of the advisory fee charged to the Funds, the Board also reviewed and considered the advisory fees in light of the nature, extent and quality of the advisory services expected to be provided by the Adviser, including, but not limited to, the quality and experience of the portfolio managers. The Board also reviewed and considered the sub-advisory fee that would be payable by the Adviser to the Sub-Adviser in light of the nature, extent and quality of the advisory services expected to be provided by the sub-adviser. The Board noted that the Adviser, and not the Funds, will pay the sub-advisory fee to the Sub-Adviser.
The Independent Trustees compared both the services to be rendered and the proposed fees to be paid pursuant to other investment advisory contracts of the Adviser and the Sub-Adviser. The Independent Trustees considered the fees charged to other accounts managed by the Adviser and Sub-Adviser, respectively, with similar strategies to the Fund. The Board also noted that the sub-advisory fee rates to be charged by the Sub-Adviser were within the range of fees charged by the sub-advisory to other comparable accounts managed by it. The Board considered the proposed fee waiver and expense limitation arrangements that would be in effect for the first year of operations.
Consideration was also given to a comparative analysis in the Lipper Section 15(c) Report of the investment advisory fee and total expense ratios of the Fund in comparison with those of a group of other funds selected by Lipper as its appropriate expense group. The Board noted that the actual investment advisory fee of each Fund was within the range of fees charged by other funds in the Fund's Lipper expense group. The Board also noted that the total expenses (both including and excluding the proposed fee waiver and expense limitation arrangements) of each Fund were within the range of total expenses of other funds in the Fund's Lipper expense group.
Based upon their consideration of all these factors, the Board determined that the level of profits (if any) to be realized by the Adviser and Sub-Adviser in providing services to the Funds was not expected to be excessive in view of the nature, quality and extent of services to be provided.
ECONOMIES OF SCALE.
The Board considered economies of scale realized by the Adviser and its affiliates as the Funds grow larger and the extent to which they are shared with Fund shareholders, as for example, in the level of the investment advisory fee charged, in the quality and efficiency of services rendered and in increased capital commitments benefiting the Fund directly or indirectly. Since the Funds had not yet commenced operations, the Board concluded that economies of scale were difficult to consider at that time.
40
Board of Trustees and Officers
The Trustees elect the officers of the Trust, who are responsible for administering the day-to-day operations of the Funds. The Trustees and officers of the Trust, along with their principal occupations over the past five years and their affiliations, if any, with the Adviser, are listed below. The address of each Trustee and officer of the Trust is One Commerce Square, 2005 Market Street, Suite 2020, Philadelphia, Pennsylvania 19103.
Independent Trustees
| Name and Age | Position(s) Held with Trust | Term of Office(1) and Length of Time Served | Principal Occupation(s) During Past 5 Years | Number of Portfolios in Fund Complex(2) Overseen by Trustee | Other Directorships Held by Trustee | ||||||||||||||||||
| Vincent DiStefano (69) | Trustee | Since 2006 | Orthopaedic Surgeon since 1970. | 3 | None | ||||||||||||||||||
| Lawrence A. Goldberg (67) | Trustee | Since 2006 | Attorney since 1972. | 3 | None | ||||||||||||||||||
| James C. McAuliffe (56) | Trustee | Since 2006 | Retired. Police Officer from 1971 to 2004. | 3 | None | ||||||||||||||||||
| Christian W. Myers, III (56) | Trustee | Since 2006 | Firefighter from 1976 to present. | 3 | None | ||||||||||||||||||
| John J. Kolodziej (51) | Trustee | Since 2007 | Director of Finance, St. Francis Medical Center, from 2002 to present. | 3 | None | ||||||||||||||||||
Interested Trustee
| Name and Age | Position(s) Held with Trust | Term of Office(1) and Length of Time Served | Principal Occupation(s) During Past 5 Years | Number of Portfolios in Fund Complex(2) Overseen by Trustee | Other Directorships Held by Trustee | ||||||||||||||||||
| Vincent T. Lowry(3) (56) | Chairman and Trustee; President | Since 2006 | Chief Executive Officer, VTL, from 2004 to present; Managing Director, Smith Barney, Inc. from 1984 to 2004. | 3 | None | ||||||||||||||||||
(1) Each Trustee holds office for an indefinite term.
(2) The "Fund Complex" consists of the Trust, which consists of three Funds.
(3) Mr. Lowry is considered to be an "interested person" of the Trust as defined in the 1940 Act, due to his relationship with VTL, the Funds' investment adviser.
41
Board of Trustees and Officers — concluded
Officers
The officers of the Trust not named above are:
| Name and Age | Position(s) Held with the Trust | Term of Office(1) and Length of Time Served | Principal Occupation(s) During Past 5 Years | ||||||||||||
| Christopher C. Lanza(2) (47) | Treasurer | Since 2007 | Director, ETF Services, Foreside Fund Services, LLC, 2007 to present; Vice President, Citigroup, from 2004 to 2007; Director, CMB Global Solutions, from 2000 to 2004. | ||||||||||||
| David M. Whitaker(2) (36) | Chief Compliance Officer | Since 2007 | Counsel, Foreside Financial Group, LLC, from 2007 to present; Managing Member, Beacon Fund Services (consulting), from 2007 to present; Vice President, Citigroup Fund Services, from 2004 to 2007; Assistant Counsel, PFPC, Inc., from 2000 to 2004. | ||||||||||||
| Jennifer Folgia (34) | Secretary | Since 2006 | Operations Manager, VTL, from 2004 to present; Sales Assistant, Smith Barney, Inc., from 1994to 2004. | ||||||||||||
(1) Officers of the Trust are elected by the Trustees and serve at the pleasure of the Board.
(2) Mr. Lanza and Mr. Whitaker are affiliated persons of Foreside Fund Services, LLC, the principal underwriter to the Funds.
42
Proxy Voting Policies, Procedures and Record
A description of the Funds' proxy voting policies and procedures that the Funds use to determine how to vote proxies relating to portfolio securities is available, without charge upon request, by calling (800)772-3831. This information is also available on the Securities and Exchange Commission's website at www.sec.gov.
Shareholder Reports and Quarterly Portfolio Disclosure
The Funds are required to file their complete schedule of portfolio holdings with the SEC for their first and third quarters on Form N-Q. Copies of the filings are available without charge, upon request on the SEC's website at www.sec.gov. You can also obtain copies of Form N-Q by (i) visiting the SEC's Public Reference Room in Washington, DC (information on the operation of the Public Reference Room may be obtained by calling 1-800-SEC-0330); (ii) sending your request and a duplicating fee to the SEC's Public Reference Room, Washington, DC 20549-0102; or (iii) sending your request electronically to publicinfosec.gov.
The Fund's Statement of Additional Information ("SAI") has additional information about the Funds' Trustees and Officers and is available without charge upon request, call 1-800-772-3831 or visit the Funds' website at www.revenuesharesetfs.com. Contact your financial representative for a free prospectus or SAI.
43
This page is intentionally left blank.
Investment Adviser
VTL Associates, LLC
One Commerce Square
2005 Market Street, Suite 2020
Philadelphia, Pennsylvania 19103
Distributor
Foreside Fund Services, LLC
Three Canal Plaza Suite 100
Portland, Maine 04101
www.foresides.com
Custodian
The Bank of New York Mellon
101 Barclay Street
New York, New York 10286
Legal Counsel
Stradley Ronon Stevens & Young, LLP
2600 One Commerce Square
Philadelphia, Pennsylvania 19103
*Sub-Adviser
Mellon Capital Management Corp.
1633 Broadway
13th Floor
New York, New York 10019
Transfer Agent
The Bank of New York Mellon
101 Barclay Street
New York, New York 10286
Independent Registered Public Accounting Firm
Ernst & Young, LLP
Two Commerce Square
2001 Market Street, Suite 4000
Philadelphia, Pennsylvania 19103
This report is submitted for the general information of the Funds' shareholders. It is not authorized for distribution to prospective investors unless preceded or accompanied by an effective prospectus, which includes information regarding the Funds' objectives and policies, experienced of its management, marketability of shares, and other information.
* As of August 8, 2008 BNY Investment Advisors was replaced by Mellon Capital Management Corp. as the Sub-Advisor.
RevenueShares ETF Trust
One Commerce Square, 2005 Market St. Suite 2020
Philadelphia, PA 19103
This report is submitted for the general information of the shareholders of each Fund. It is not authorized for distribution to prospective investors unless preceded or accompanied by an effective prospectus, which includes information regarding the Funds’ risks, objectives, fees and expenses, experience of their management, and other information.
DISTRIBUTOR
Foreside Fund Services, LLC
Three Canal Plaza Suite 100 Portland, ME 04101
www.foresides.com
www.RevenueSharesETFs.com | 877 738 8870
Item 2. Code of Ethics.
a). The registrant has adopted a code of ethics that applies to the registrant’s principal executive officer, principal financial officer, principal accounting officer or controller, or persons performing similar functions.
b). Not Applicable
c). Not Applicable
d). During the period, registrant granted no waivers from the provisions of its code of ethics that applies to the registrant’s principal executive officer, principal financial officer, principal accounting officer or controller, or persons performing similar functions.
e). Not Applicable
f). Not Applicable
Item 3. Audit Committee Financial Expert.
a). The registrant’s Board of Trustees has one audit committee financial expert serving on its audit committee, which of whom is an “independent” Trustee: John J. Kolodziej. Under applicable securities laws, a person who is determined to be an audit committee financial expert will not be deemed an “expert” for any purpose, including without limitation for the purposes of Section 11 of the Securities Act of 1933, as a result of being designated or identified as an audit committee financial expert. The designation or identification of a person as an audit committee financial expert does not impose on such person any duties, obligations, or liabilities that are greater than the duties, obligations, and liabilities imposed on such person as a member of the audit committee and Board of Trustees in the absence of such designation or identification
Item 4. Principal Accountant Fees and Services.
a). Audit Fees: the aggregate fees billed in each of the last two fiscal years for professional services rendered by the principal accountant for the audit are as follows:
2008: $56,000
2007: N/A
b). Audit-Related Fees: the aggregate fees billed in each of the last two fiscal years for assurance and related services by the principal accountant that are principally related to the registrant’s tax return reviews and are not reported under paragraph (a) of this item are as follows:
1
2008: $33,000
2007: N/A
c). Tax Fees, the aggregate fees billed in each of the last two fiscal years for professional services rendered by the principal accountant for tax compliance, tax advice, and tax planning are as follows:
2008: N/A
2007: N/A
d). All Other Fees, the aggregate fees billed in each of the last two fiscal years for products and services provided by the principal accountant, other than the services reported in paragraphs (a) and (c) of this Item are as follows:
2008: $0
2007: $0
(e). Audit Committee Pre-Approval Policies and Procedures.
(i) Per Rule 2-01(c)(7)(A), the Audit Committee pre-approves all of the Audit, Audit-Related, Tax and Other Fees of the Registrant.
(ii) 100% of services described in each of Items 4(b) through (d) were approved by the audit committee pursuant to paragraph (c)(7)(A) of Rule 2-01 of Regulation S-X.
(f). No response required.
(g). The aggregate non-audit fees billed by the Registrant’s accountant for services rendered to the Funds, the Advisor or any entity controlling, controlled by, or under common control with the Advisor that provides ongoing services to the registrant (except for any sub-advisor whose role is primarily portfolio management and is subcontracted with or overseen by another investment advisor) that directly impacted the Funds for the period from February 23, 2008 to June 30, 2008 were $0.
(h). Not Applicable
Item 5. Audit Committee of Listed Registrants.
Not Applicable
Item 6. Schedule of Investments.
(a). Schedule is included as part of the report to shareholders filed under Item 1 of this Form.
(b). Not Applicable
2
Item 7. Disclosure of Proxy Voting Policies and Procedures for Closed-End Management Investment Companies.
Not Applicable
Item 8. Portfolio Managers of Closed-End Management Investment Companies.
Not Applicable
Item 9. Purchases of Equity Securities by Closed-End Management Investment Company & Affiliated Purchasers.
Not Applicable
Item 10. Submission of Matters to a Vote of Security Holders.
Not Applicable
Item 11. Controls and Procedures.
(a) The Chief Executive Officer and Chief Financial Officer have evaluated the registrant’s disclosure controls and procedures within 90 days of the filing date of this report and have concluded that these controls and procedures are effective.
(b) There were no significant changes in the registrant’s internal controls over financial reporting or in other factors that could significantly affect these controls subsequent to the date of their evaluation.
Item 12. Exhibits.
(a) Code of Ethics.
(b) Certifications for each Chief Executive Officer and Chief Financial Officer of the Registrant as required by Rule 30a-2(a) under the 1940 Act (17CFR 270.30a-(a)).
3
SIGNATURES
Pursuant to the requirements of the Securities Exchange Act of 1934 and the Investment Company Act of 1940, the registrant has duly caused this report to be signed on its behalf by the undersigned, thereunto duly authorized.
Registrant: | RevenueShares ETF Trust |
| ||
| ||||
By: | /s/ Vincent T. Lowry |
| ||
| ||||
Vincent T. Lowry, Chief Executive Officer | ||||
| ||||
Date: | August 28, 2008 |
| ||
Pursuant to the requirements of the Securities Exchange Act of 1934 and the Investment Company Act of 1940, this report has been signed below by the following persons on behalf of the registrant and in the capacities and on the dates indicated.
Registrant: | RevenueShares ETF Trust |
| ||
|
|
| ||
By: | /s/ Vincent T. Lowry |
| ||
| ||||
Vincent T. Lowry, Chief Executive Officer | ||||
| ||||
Date: | August 28, 2008 |
| ||
By: | /s/ Christopher Lanza |
| |
| |||
Christopher Lanza, Chief Financial Officer | |||
| |||
Date: | August 28, 2008 |
| |
4