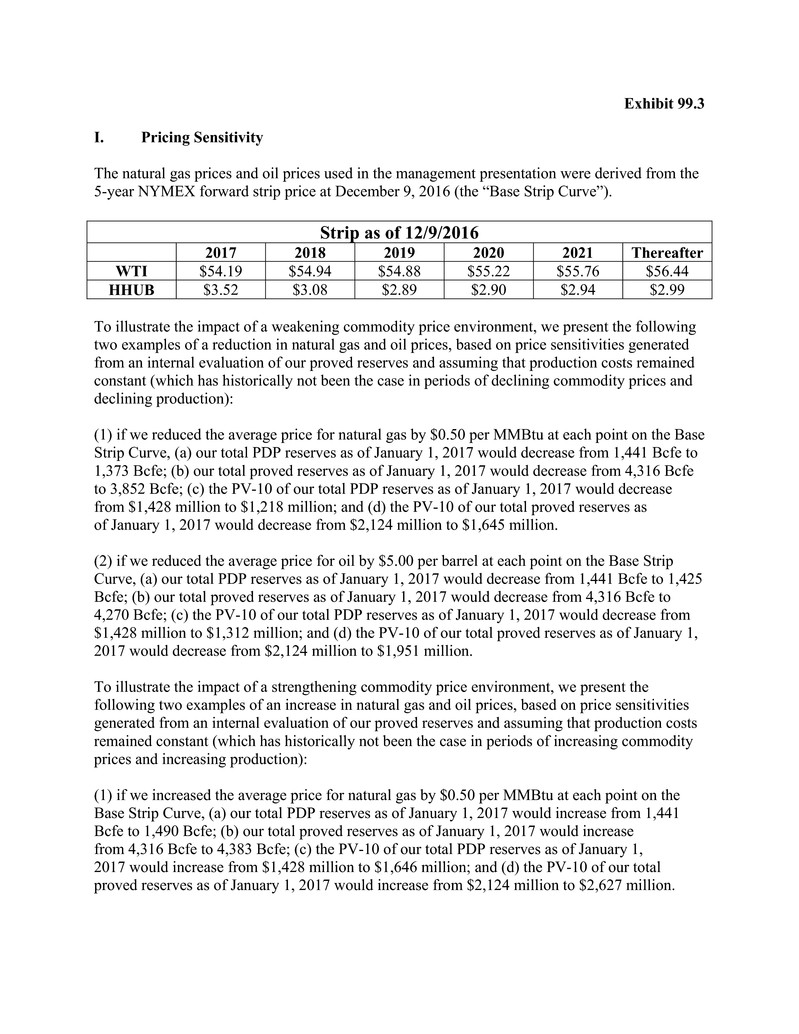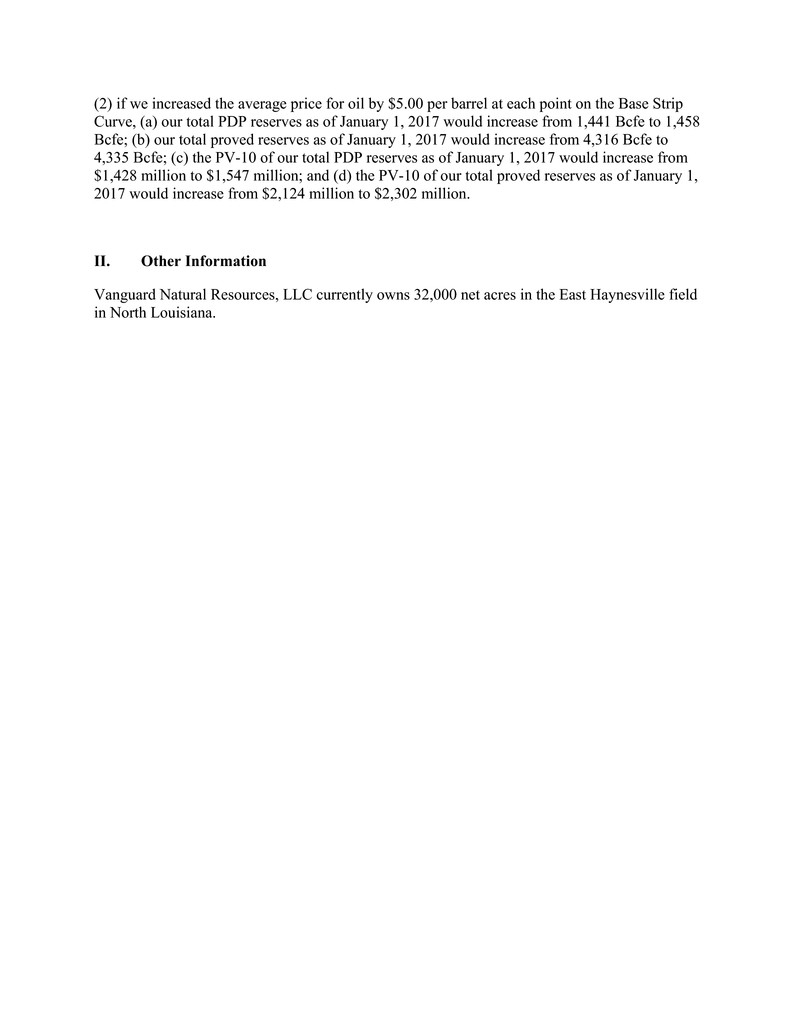
Exhibit 99.3 I. Pricing Sensitivity The natural gas prices and oil prices used in the management presentation were derived from the 5-year NYMEX forward strip price at December 9, 2016 (the “Base Strip Curve”). Strip as of 12/9/2016 2017 2018 2019 2020 2021 Thereafter WTI $54.19 $54.94 $54.88 $55.22 $55.76 $56.44 HHUB $3.52 $3.08 $2.89 $2.90 $2.94 $2.99 To illustrate the impact of a weakening commodity price environment, we present the following two examples of a reduction in natural gas and oil prices, based on price sensitivities generated from an internal evaluation of our proved reserves and assuming that production costs remained constant (which has historically not been the case in periods of declining commodity prices and declining production): (1) if we reduced the average price for natural gas by $0.50 per MMBtu at each point on the Base Strip Curve, (a) our total PDP reserves as of January 1, 2017 would decrease from 1,441 Bcfe to 1,373 Bcfe; (b) our total proved reserves as of January 1, 2017 would decrease from 4,316 Bcfe to 3,852 Bcfe; (c) the PV-10 of our total PDP reserves as of January 1, 2017 would decrease from $1,428 million to $1,218 million; and (d) the PV-10 of our total proved reserves as of January 1, 2017 would decrease from $2,124 million to $1,645 million. (2) if we reduced the average price for oil by $5.00 per barrel at each point on the Base Strip Curve, (a) our total PDP reserves as of January 1, 2017 would decrease from 1,441 Bcfe to 1,425 Bcfe; (b) our total proved reserves as of January 1, 2017 would decrease from 4,316 Bcfe to 4,270 Bcfe; (c) the PV-10 of our total PDP reserves as of January 1, 2017 would decrease from $1,428 million to $1,312 million; and (d) the PV-10 of our total proved reserves as of January 1, 2017 would decrease from $2,124 million to $1,951 million. To illustrate the impact of a strengthening commodity price environment, we present the following two examples of an increase in natural gas and oil prices, based on price sensitivities generated from an internal evaluation of our proved reserves and assuming that production costs remained constant (which has historically not been the case in periods of increasing commodity prices and increasing production): (1) if we increased the average price for natural gas by $0.50 per MMBtu at each point on the Base Strip Curve, (a) our total PDP reserves as of January 1, 2017 would increase from 1,441 Bcfe to 1,490 Bcfe; (b) our total proved reserves as of January 1, 2017 would increase from 4,316 Bcfe to 4,383 Bcfe; (c) the PV-10 of our total PDP reserves as of January 1, 2017 would increase from $1,428 million to $1,646 million; and (d) the PV-10 of our total proved reserves as of January 1, 2017 would increase from $2,124 million to $2,627 million.

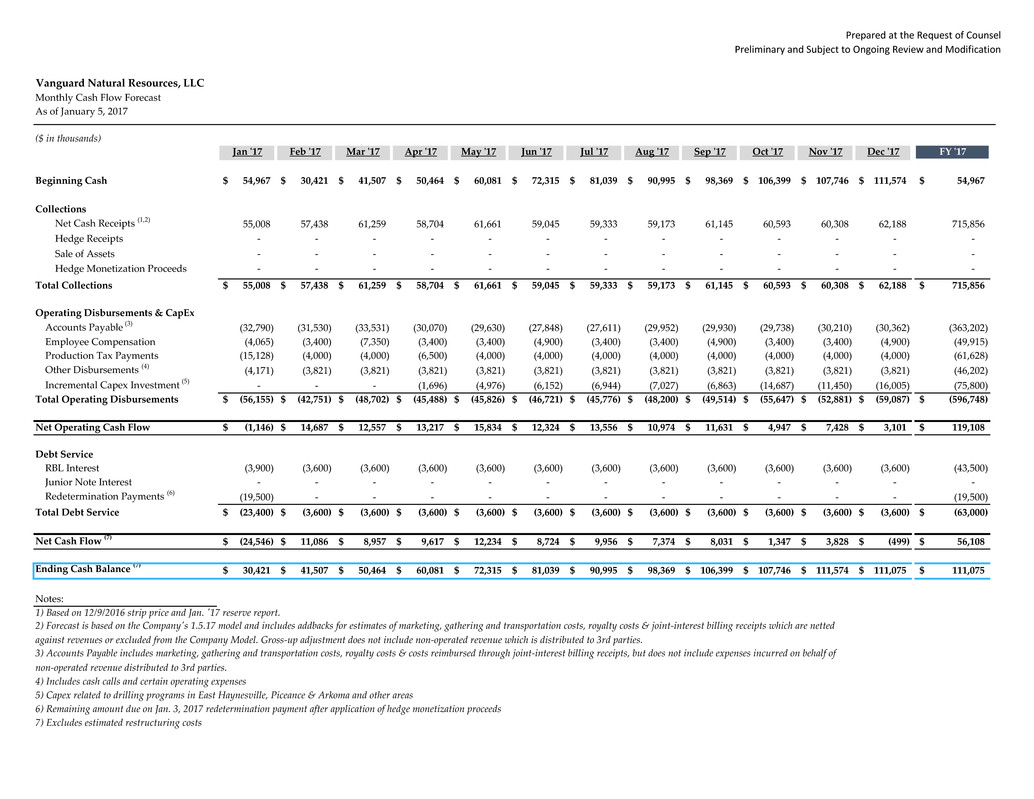
Prepared at the Request of Counsel Preliminary and Subject to Ongoing Review and Modification Vanguard Natural Resources, LLC Monthly Cash Flow Forecast As of January 5, 2017 ($ in thousands) Jan '17 Feb '17 Mar '17 Apr '17 May '17 Jun '17 Jul '17 Aug '17 Sep '17 Oct '17 Nov '17 Dec '17 FY '17 Beginning Cash 54,967$ 30,421$ 41,507$ 50,464$ 60,081$ 72,315$ 81,039$ 90,995$ 98,369$ 106,399$ 107,746$ 111,574$ 54,967$ Collections Net Cash Receipts (1,2) 55,008 57,438 61,259 58,704 61,661 59,045 59,333 59,173 61,145 60,593 60,308 62,188 715,856 Hedge Receipts - - - - - - - - - - - - - Sale of Assets - - - - - - - - - - - - - Hedge Monetization Proceeds - - - - - - - - - - - - - Total Collections 55,008$ 57,438$ 61,259$ 58,704$ 61,661$ 59,045$ 59,333$ 59,173$ 61,145$ 60,593$ 60,308$ 62,188$ 715,856$ Operating Disbursements & CapEx Accounts Payable (3) (32,790) (31,530) (33,531) (30,070) (29,630) (27,848) (27,611) (29,952) (29,930) (29,738) (30,210) (30,362) (363,202) Employee Compensation (4,065) (3,400) (7,350) (3,400) (3,400) (4,900) (3,400) (3,400) (4,900) (3,400) (3,400) (4,900) (49,915) Production Tax Payments (15,128) (4,000) (4,000) (6,500) (4,000) (4,000) (4,000) (4,000) (4,000) (4,000) (4,000) (4,000) (61,628) Other Disbursements (4) (4,171) (3,821) (3,821) (3,821) (3,821) (3,821) (3,821) (3,821) (3,821) (3,821) (3,821) (3,821) (46,202) Incremental Capex Investment (5) - - - (1,696) (4,976) (6,152) (6,944) (7,027) (6,863) (14,687) (11,450) (16,005) (75,800) Total Operating Disbursements (56,155)$ (42,751)$ (48,702)$ (45,488)$ (45,826)$ (46,721)$ (45,776)$ (48,200)$ (49,514)$ (55,647)$ (52,881)$ (59,087)$ (596,748)$ Net Operating Cash Flow (1,146)$ 14,687$ 12,557$ 13,217$ 15,834$ 12,324$ 13,556$ 10,974$ 11,631$ 4,947$ 7,428$ 3,101$ 119,108$ Debt Service RBL Interest (3,900) (3,600) (3,600) (3,600) (3,600) (3,600) (3,600) (3,600) (3,600) (3,600) (3,600) (3,600) (43,500) Junior Note Interest - - - - - - - - - - - - - Redetermination Payments (6) (19,500) - - - - - - - - - - - (19,500) Total Debt Service (23,400)$ (3,600)$ (3,600)$ (3,600)$ (3,600)$ (3,600)$ (3,600)$ (3,600)$ (3,600)$ (3,600)$ (3,600)$ (3,600)$ (63,000)$ Net Cash Flow (7) (24,546)$ 11,086$ 8,957$ 9,617$ 12,234$ 8,724$ 9,956$ 7,374$ 8,031$ 1,347$ 3,828$ (499)$ 56,108$ Ending Cash Balance (7) 30,421$ 41,507$ 50,464$ 60,081$ 72,315$ 81,039$ 90,995$ 98,369$ 106,399$ 107,746$ 111,574$ 111,075$ 111,075$ Notes: 1) Based on 12/9/2016 strip price and Jan. '17 reserve report. 4) Includes cash calls and certain operating expenses 5) Capex related to drilling programs in East Haynesville, Piceance & Arkoma and other areas 6) Remaining amount due on Jan. 3, 2017 redetermination payment after application of hedge monetization proceeds 7) Excludes estimated restructuring costs 2) Forecast is based on the Company's 1.5.17 model and includes addbacks for estimates of marketing, gathering and transportation costs, royalty costs & joint-interest billing receipts which are netted against revenues or excluded from the Company Model. Gross-up adjustment does not include non-operated revenue which is distributed to 3rd parties. 3) Accounts Payable includes marketing, gathering and transportation costs, royalty costs & costs reimbursed through joint-interest billing receipts, but does not include expenses incurred on behalf of non-operated revenue distributed to 3rd parties.


