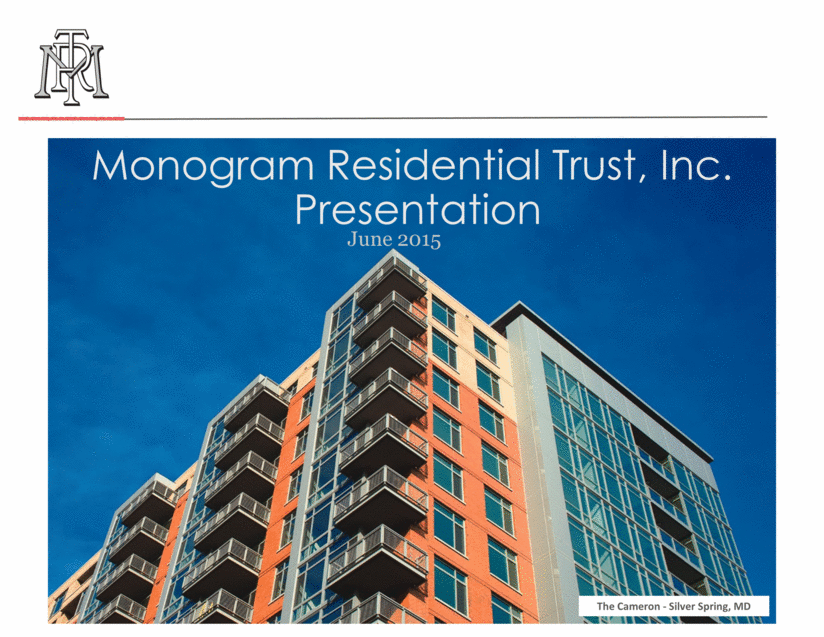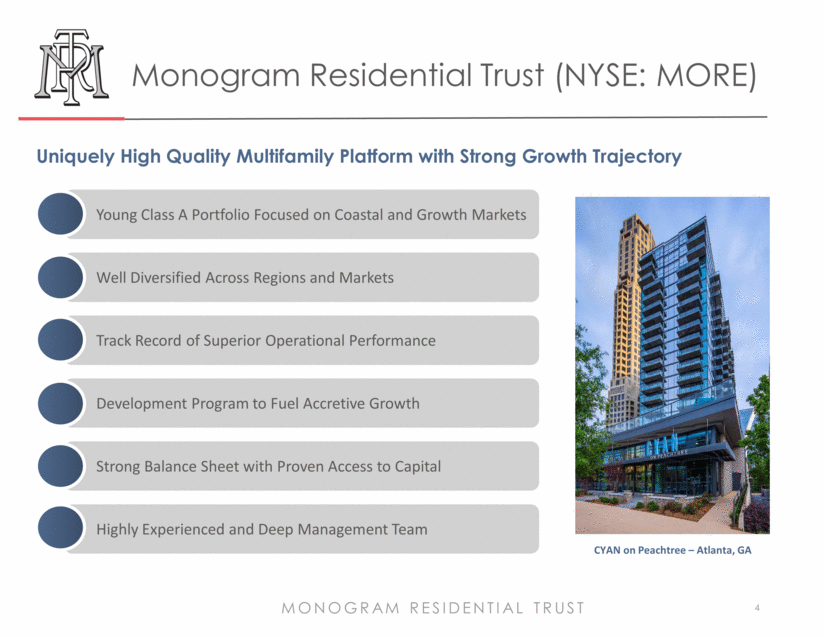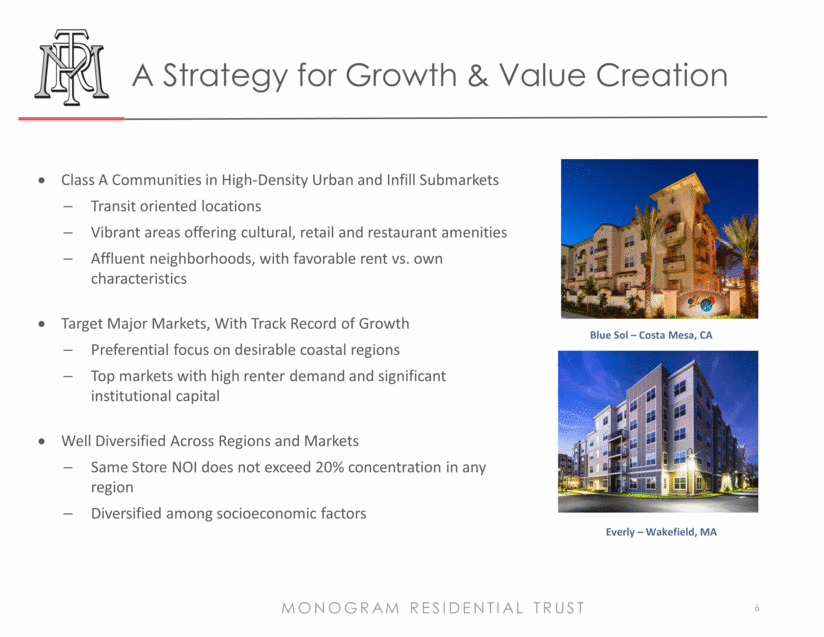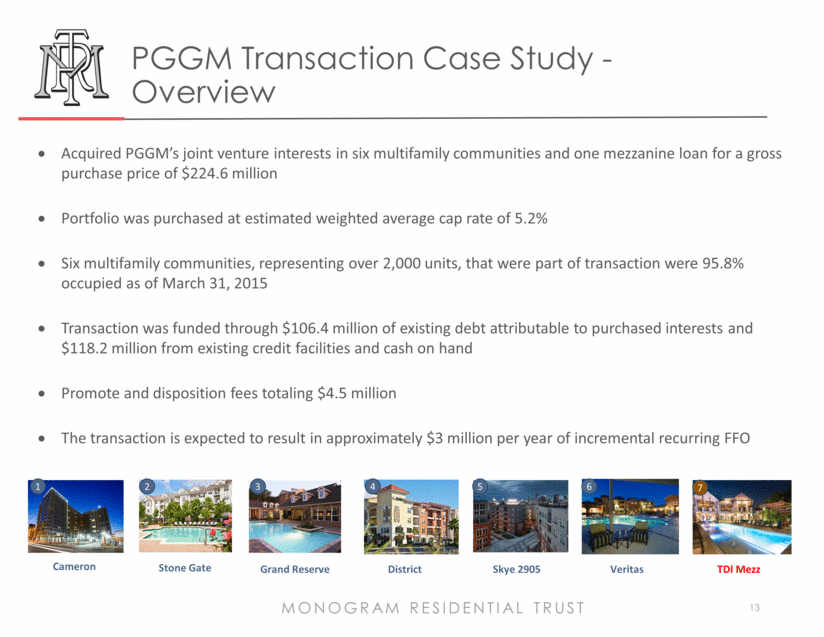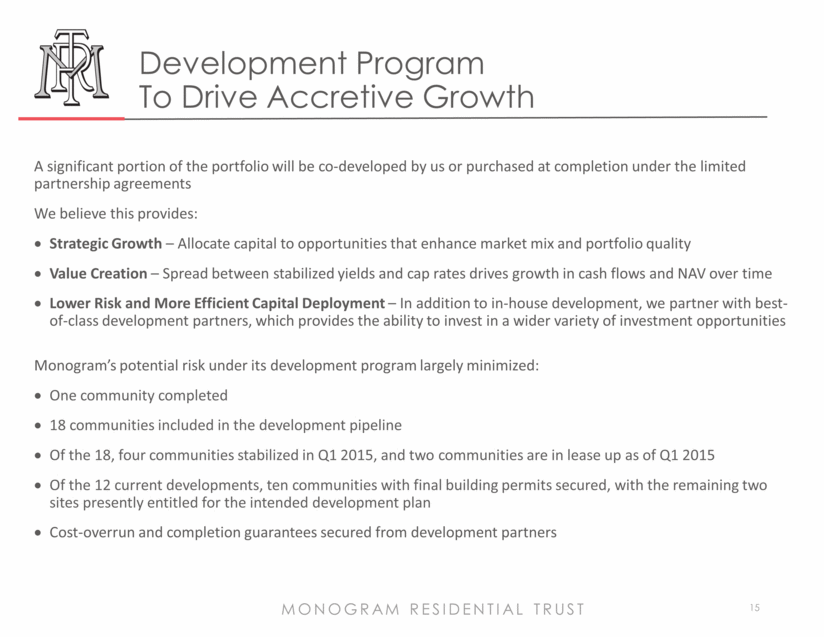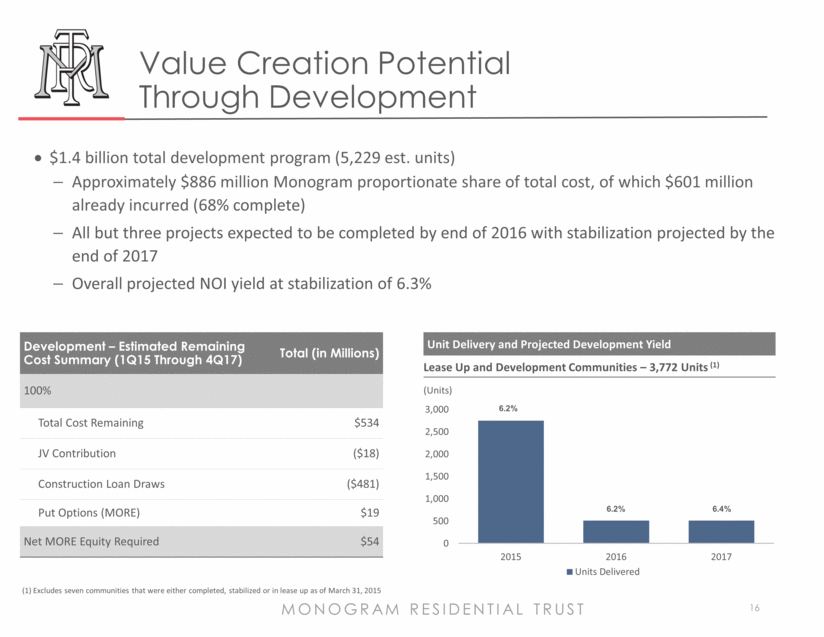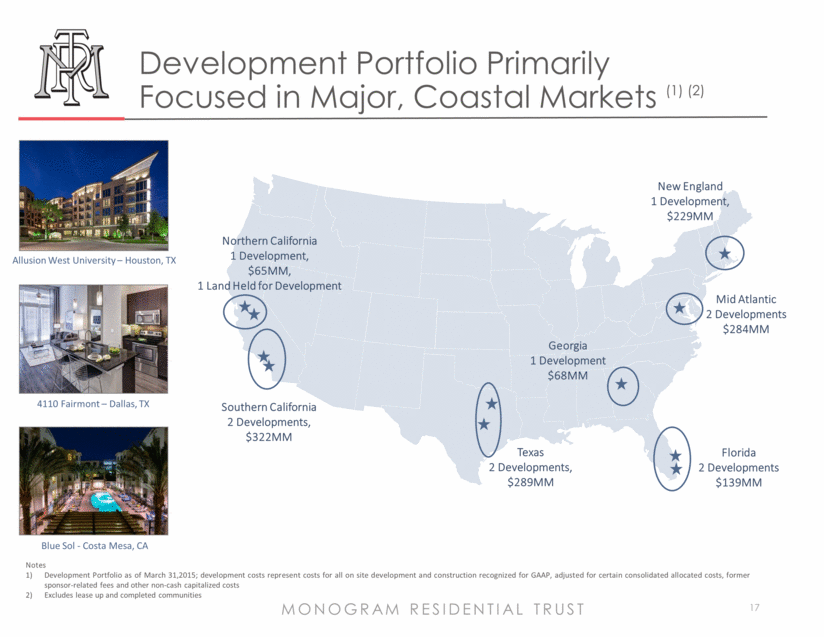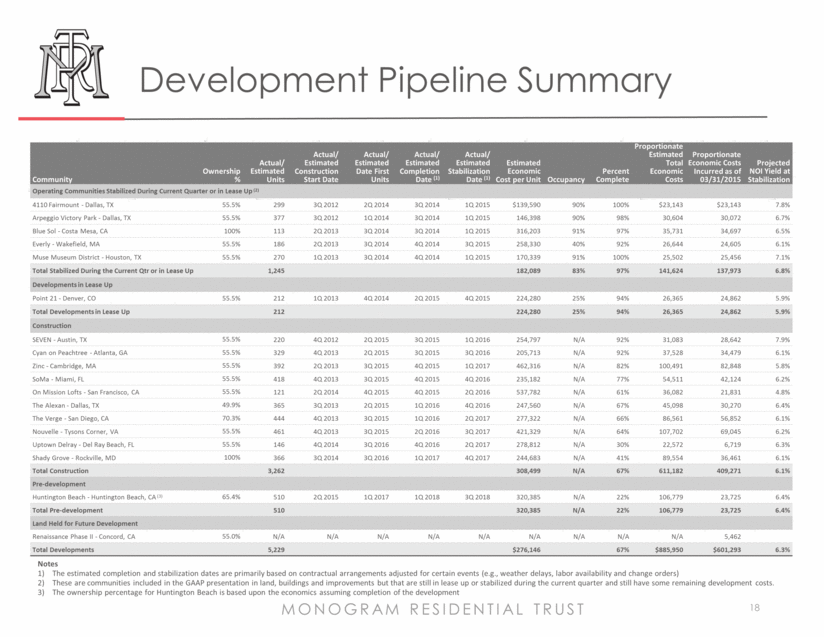
| 18 MONOGRAM RESIDENTIAL TRUST Community Ownership % Actual/ Estimated Units Actual/ Estimated Construction Start Date Actual/ Estimated Date First Units Actual/ Estimated Completion Date (1) Actual/ Estimated Stabilization Date (1) Estimated Economic Cost per Unit Occupancy Percent Complete Proportionate Estimated Total Economic Costs Proportionate Economic Costs Incurred as of 03/31/2015 Projected NOI Yield at Stabilization Operating Communities Stabilized During Current Quarter or in Lease Up (2) 4110 Fairmount - Dallas, TX 55.5% 299 3Q 2012 2Q 2014 3Q 2014 1Q 2015 $139,590 90% 100% $23,143 $23,143 7.8% Arpeggio Victory Park - Dallas, TX 55.5% 377 3Q 2012 1Q 2014 3Q 2014 1Q 2015 146,398 90% 98% 30,604 30,072 6.7% Blue Sol - Costa Mesa, CA 100% 113 2Q 2013 3Q 2014 3Q 2014 1Q 2015 316,203 91% 97% 35,731 34,697 6.5% Everly - Wakefield, MA 55.5% 186 2Q 2013 3Q 2014 4Q 2014 3Q 2015 258,330 40% 92% 26,644 24,605 6.1% Muse Museum District - Houston, TX 55.5% 270 1Q 2013 3Q 2014 4Q 2014 1Q 2015 170,339 91% 100% 25,502 25,456 7.1% Total Stabilized During the Current Qtr or in Lease Up 1,245 182,089 83% 97% 141,624 137,973 6.8% Developments in Lease Up Point 21 - Denver, CO 55.5% 212 1Q 2013 4Q 2014 2Q 2015 4Q 2015 224,280 25% 94% 26,365 24,862 5.9% Total Developments in Lease Up 212 224,280 25% 94% 26,365 24,862 5.9% Construction SEVEN - Austin, TX 55.5% 220 4Q 2012 2Q 2015 3Q 2015 1Q 2016 254,797 N/A 92% 31,083 28,642 7.9% Cyan on Peachtree - Atlanta, GA 55.5% 329 4Q 2013 2Q 2015 3Q 2015 3Q 2016 205,713 N/A 92% 37,528 34,479 6.1% Zinc - Cambridge, MA 55.5% 392 2Q 2013 3Q 2015 4Q 2015 1Q 2017 462,316 N/A 82% 100,491 82,848 5.8% SoMa - Miami, FL 55.5% 418 4Q 2013 3Q 2015 4Q 2015 4Q 2016 235,182 N/A 77% 54,511 42,124 6.2% On Mission Lofts - San Francisco, CA 55.5% 121 2Q 2014 4Q 2015 4Q 2015 2Q 2016 537,782 N/A 61% 36,082 21,831 4.8% The Alexan - Dallas, TX 49.9% 365 3Q 2013 2Q 2015 1Q 2016 4Q 2016 247,560 N/A 67% 45,098 30,270 6.4% The Verge - San Diego, CA 70.3% 444 4Q 2013 3Q 2015 1Q 2016 2Q 2017 277,322 N/A 66% 86,561 56,852 6.1% Nouvelle - Tysons Corner, VA 55.5% 461 4Q 2013 3Q 2015 2Q 2016 3Q 2017 421,329 N/A 64% 107,702 69,045 6.2% Uptown Delray - Del Ray Beach, FL 55.5% 146 4Q 2014 3Q 2016 4Q 2016 2Q 2017 278,812 N/A 30% 22,572 6,719 6.3% Shady Grove - Rockville, MD 100% 366 3Q 2014 3Q 2016 1Q 2017 4Q 2017 244,683 N/A 41% 89,554 36,461 6.1% Total Construction 3,262 308,499 N/A 67% 611,182 409,271 6.1% Pre-development Huntington Beach - Huntington Beach, CA (3) 65.4% 510 2Q 2015 1Q 2017 1Q 2018 3Q 2018 320,385 N/A 22% 106,779 23,725 6.4% Total Pre-development 510 320,385 N/A 22% 106,779 23,725 6.4% Land Held for Future Development Renaissance Phase II - Concord, CA 55.0% N/A N/A N/A N/A N/A N/A N/A N/A N/A 5,462 Total Developments 5,229 $276,146 67% $885,950 $601,293 6.3% Notes The estimated completion and stabilization dates are primarily based on contractual arrangements adjusted for certain events (e.g., weather delays, labor availability and change orders) These are communities included in the GAAP presentation in land, buildings and improvements but that are still in lease up or stabilized during the current quarter and still have some remaining development costs. The ownership percentage for Huntington Beach is based upon the economics assuming completion of the development Development Pipeline Summary |
