Exhibit 99.1
Monogram Residential Trust
Forward-Looking Statements 2 Certain statements made in this presentation and other written or oral statements made by or on behalf of Monogram Residential Trust, Inc. (“Monogram”), may constitute “forward-looking statements” within the meaning of Section 27A of the Securities Act of 1933, as amended, and Section 21E of the Securities Exchange Act of 1934, as amended. Statements regarding future events and developments and Monogram’s future performance, as well as management’s expectations, beliefs, plans, estimates or projections relating to the future, are forward-looking statements within the meaning of these laws. Examples of such statements in this presentation and in Monogram’s outlook include, expectations regarding apartment market conditions and expectations regarding future operating conditions, including Monogram’s current outlook as to expected funds from operations, core funds from operations, adjusted funds from operations, revenue, operating expenses, net operating income, capital expenditures, depreciation, gains on sales and net income and anticipated development activities (including projected construction expenditures and timing). We intend these forward-looking statements to be covered by the safe harbor provisions for forward-looking statements contained in the Private Securities Litigation Reform Act of 1995 and are including this statement for purposes of complying with those safe harbor provisions. A number of important factors could cause actual results to differ materially from the forward-looking statements contained in this presentation. Such factors include the risk that we may not meet our expected funds from operations, net operating income or other performance metrics, and other factors described in the Risk Factors section of Monogram’s Annual Report on Form 10-K for the year ended December 31, 2015 and in subsequent filings with the Securities and Exchange Commission. Management believes that these forward-looking statements are reasonable; however, you should not place undue reliance on such statements. These statements are based on current expectations and speak only as of the date of such statements. Monogram undertakes no obligation to publicly update or revise any forward-looking statement, whether as a result of future events, new information or otherwise.
Monogram Overview Owner, operator, and developer of luxury apartment communities Young, highly amenitized class A portfolio drives premium average monthly rent of $1,918 per unit(1) Well diversified across regions with significant coastal markets presence Proven track record of Value Creation(2) and strong operational performance Significantly completed development program which continues to fuel meaningful embedded NOI(2) growth Argenta – San Francisco, CA Notes 1)Data based on total stabilized portfolio as of 9/30/16 2)See Appendix for Definitions and Reconciliations of Non-GAAP Measurements 3
StrategicFocus Executing on strategy to drive same-store NOI growth and realize meaningful embedded growth and value from development program Same-store NOI growth through strong property operations Capture embedded NOI growth in developments by achieving stabilized occupancy Stabilize four development communities currently in lease up Deliver on two remaining development communities under construction Extend debt maturities while seeking to reduce leverage, pro forma for stabilized development, over the longer-term Engage in select property dispositions to supplement funding of existing development program, reduce debt and/or fund new strategic/accretive investments Continue to increase number of wholly-owned communities over time when accretive to value 4
2016 SelectPortfolio Highlights Stabilized three development communities at average (1) NOI Yields at Stabilization of approximately 6.7% SoMa in Miami, Verge in San Diego, Cyan in Atlanta (2) Total estimated Value Creation of $63 million (3) Total portfolio NOI growth of 11.4% YTD Continue to capture significant embedded NOI in development communities SoMa – Miami, FL (3) Same-store NOI growth of 3.9% YTD 2016 full-year outlook: 3.0% - 3.5% (3) No remaining 2016 debt maturities Sold Renaissance in Concord, CA for total gross sales (4) price of $65.4 million GAAP gain on sale of $17.5 million Use of proceeds to pay down debt outstanding on line of credit Verge – San Diego, CA Notes: 1) See Appendix for Definitions and Reconciliations of Non-GAAP Measurements 2) Shown at Monogram Proportionate Share. See Appendix for Definitions and Reconciliations of Non-GAAP Measurements 3) Data as of 9/30/16 4) Includes sale of Renaissance and an adjacent land parcel; Monogram share of proceeds of approximately $36 million 5
AttractiveGrowth Profile AFFO Quarterly Growth - Actual and 4Q16 Estimated (1) $0.12 $0.10 + Incremental Pro Forma AFFO $0.06 - $0.07 $0.08 $0.06 1Q16 2Q16 3Q16 4Q16E (Midpoint) Significant embedded growth potential based on fourth quarter AFFO annualized run rate of $0.44 per share and approximately $10 - $11 million of projected (2) (3) incremental NOI Incremental NOI expected to be realized from four lease up and development (3) properties expected to stabilize during 2017 Notes 1) Pro Forma AFFO for the fourth quarter of 2016 is based on the midpoint of guidance range of $0.10 - $0.12 per share. See Appendix for Definitions and Reconciliations of Non-GAAP Measurements 2) Annualized 4Q16E based on current guidance (midpoint) of $0.11 per share 3) Incremental Pro Forma AFFO per share based on $10 - $11 million of incremental projected annual stabilized NOI for the four lease up and development properties (Zinc, Nouvelle, The Alexan, Caspian Delray Beach) projected to stabilize by the second half of 2017 4) Represents incremental pro forma growth potential, resulting from the expected incremental NOI contribution from these lease up and development properties, applicable to AFFO per share on an annualized basis for the period of the second half of 2017. Excludes the potential impact from: same-store and stabilized non-comparable growth, contributions from acquisitions that may not be stabilized in 4Q16, changes in interest expense, interest income and other operations 6 Per Share $0.11 AFFO per share (2) Annualized 4Q16E (midpoint) of $0.11$0.44 (3) (4) =Pro Forma AFFO Annualized$0.50 - $0.51
High-Quality, Class A Portfolio With Significant Coastal Market Presence 50 Properties Totaling Approximately 14,000 Units Notes: 1) Based on total stabilized portfolio as of 9/30/16; occupancy represents weighted-average occupancy; cap-ex represents average annual recurring and non-recurring cap-ex per unit for 2013-2015 2) NOI percent on map reflects MORE’s proportionate share of 3Q16 NOI for total stabilized portfolio (both same-store and stabilized non-comparable) as of 9/30/16; shaded regions on map represent MORE’s major markets 7 Key Portfolio Stats(1): (2) 43 Stabilized Operating Communities, 5 Lease Ups, 2 Developments Average Property Age:Average Monthly Rental Revenue:Occupancy:Cap-Ex Total Per Unit: 4 Years$1,918 (per unit)94.7%$589 (annual)
Focused PortfolioStrategy for Growthand Value Creation Class A Communities in High-Density Urban and Infill Submarkets Transit oriented locations Vibrant areas offering cultural, retail, and restaurant amenities Affluent neighborhoods, with favorable rent vs. own characteristics - - - The Mark – Boca Raton, FL Target Major Markets, With Track Record of Growth Preferential focus on desirable coastal regions Top markets with high renter demand and significant institutional capital - - Zinc – Cambridge, MA 8
Development Program toDrive AccretiveGrowth Strategic Growth Allocation of capital to accretive investments in core markets that enhance portfolio quality - Value Creation Spread between projected stabilized yields and market cap rates drives growth in cash flows and NAV over time - Efficiency In addition to in-house development expertise, partner with best-in-class development partners, which provides access to a wider variety of investment opportunities - Risk Mitigation Cost-overrun and completion guarantees secured from development partners - 9 The Alexan - Dallas, TX
Proven Track Record of Value Creation Stabilized 11 communities since listing average realized NOI Yields at Stabilization(1) of approximately 7% at Results largely above pro forma Attractive returns on cost: spreads over market cap rates in excess of 150 – 200 basis points Total Value Creation of approximately $155 million(2) on 11 stabilized properties Seven – Austin, TX Notes 1) See Appendix for Definitions and Reconciliations of Non-GAAP Measurements 2) Shown at Monogram Proportionate Share. See Appendix for Definitions and Reconciliations of Non-GAAP Measurements 10
Substantial Progress Made on Development Program Projected NOI at Stabilization $40.0 10 2 Construction Notes: 1) See Appendix for Definitions and Reconciliations of Non-GAAP Measurements 2) NYSE listing on November 21, 2014 3) Excludes one development community sold in 2015 4) 2016 estimated stabilizations include SoMa and Verge (stabilized in 3Q16), OLUME; 2017 estimated stabilizations include Zinc, Caspian Delray Beach, The Alexan, Nouvelle; 2019 estimated stabilizations include Lucé 11 (in millions) (1) $35.0 $30.0 $25.0 $20.0 $15.0 $10.0 $5.0 $-Through 2016Through 2017Through 2018Through 2019 Previously StabilizedCurrent Period Estimated Additions (4) Development SummaryAt Listing (2) 9/30/16 Stabilized Communities011 Lease Up Communities64 Communities Under Pre-Development20 Total Communities1817 (3) Development Program Update and Expected NOI Summary Two development communities, SoMa in Miami and Verge in San Diego, stabilized during 3Q16 Four development communities currently in lease up Two remaining developments under construction (represents approximately 5% of total gross assets) All but one community expected to be completed and stabilized by the end of 2017 Total projected NOI of approximately $34 million (1)
Lease Up and Development Communities Primarily Focused in Major Coastal Markets Operating Communities in Lease Up (1) Zinc – Cambridge, MA Nouvelle – Tysons Corner, VA OLUME – San Francisco, CA Estimated Stabilization Date: 3Q17 Occupancy: 59% Projected NOI Yield at Stabilization: 5.6% Estimated Stabilization Date: 4Q16 Occupancy: 76% Projected NOI Yield at Stabilization: 5.3% Estimated Stabilization Date: 2Q17 Occupancy: 64% Projected NOI Yield at Stabilization: 5.9% Developments In Lease Up (1) The Alexan – Dallas, TX Communities Under Construction (1) Caspian Delray Beach – Delray Beach, FL Estimated Completion Date: 1Q17 Estimated Stabilized Date: 3Q17 Projected NOI Yield at Stabilization: 6.3% Lucé – Huntington Beach, CA Estimated Completion Date: 3Q18 Estimated Stabilized Date: 2Q19 Projected NOI Yield at Stabilization: 6.7% Estimated Stabilization Date: 3Q17 Occupancy: 23% Projected NOI Yield at Stabilization: 6.1% Note: 1) Data as of 9/30/16 12
Sheet(1) Strong Balance Balances by Maturity Year(3) Gross Operating Real Estate $3,272 $2,255 Construction in Progress, incl. Land $212 $137 Total Real Estate, Gross $3,484 $2,392 Mortgage and Construction Debt(4) $1,528 $998 Credit Facility(4) $10 $10 Total Debt $1,538 $1,008 Cash $65 $53 Debt / Gross Real Estate Assets 44% 42% Net Debt / Gross Real Estate Assets 42% 40% Notes 1) Data as of 9/30/16 2) Proportionate is a non-GAAP measurement. See Appendix for reconciliation to GAAP and our methodology and definitions. 3) Amounts reflect maturities as adjusted for extension options 4) Contractual Amounts as of 9/30/16 13 (in millions) $376 2016201720182019Thereafter Proportionate Share $175 $322 $117 Capitalization Summary as of September 30, 2016 (2) (in Millions)ConsolidatedProportionate Debt Maturity Schedule (2) Capital / Leverage Profile Approximately $360 million of available liquidity as of September 30, 2016 (Proportionate Share) (2) -$53 million of cash and $306 million of undrawn capacity on credit facilities Monogram’s share of estimated remaining development costs to complete is approximately $95 million. Funding is primarily expected to come from construction loans Opportunity to recycle proceeds from potential sales to supplement funding of remaining development costs and / or to pay down debt including borrowings on our credit facilities Strategic focus to extend debt maturities while seeking to reduce leverage, pro forma for stabilized development, over the longer-term
Joint Ventures Overview Note: 1) Based on 3Q16 actual amounts annualized 14 Two Primary Institutional Joint Venture Relationships PGGM joint venture – Interests in both stabilized and development investments – 21 properties, containing 6,222 units in 10 markets NPS joint venture –Interests in stabilized investments –14 properties, containing 3,748 units in 9 markets Enhances return on capital via fee income and promotes – Generates approximately $4.7 million(1) of fee income for Monogram annually which is projected to grow once developments are stabilized Buy / sell provisions which may allow for future wholly owned growth – JV property interests represent potential attractive acquisition opportunities with minimal transaction costs if Monogram determines they would be accretive acquisitions
Appendix Definitions and Reconciliations of Non-GAAP Measurements (continued on following pages) Economic Costs represents costs for all on-site development and construction costs for GAAP, but including certain items expensed for GAAP (primarily specific financing and operating expenses incurred during lease up) and excluding certain GAAP costs related to consolidated allocated costs, former sponsor-related fees and other non-cash capitalized cost items. Capital Expenditures are amounts capitalized in accordance with GAAP related to recurring and non-recurring improvements to the community (such as appliances, HVAC equipment, etc.), but excluding revenue producing improvements, major renovations and rehabilitations of units and common areas. NOI Yield at Stabilization is calculated as 12 months of NOI subsequent to stabilization divided by total Economic Costs. For communities stabilized less than one year, projected NOI was used. Value Creation represents estimates of value less estimated total Economic Cost, before any selling expenses. 15
Appendix Non-GAAP Measurements and Reconciliations We use the following non-GAAP measurements to present different components of our performance. We believe this information is also useful to our investors in comparing our results to other real estate companies and trusts because they provide characteristics of our performance that reflect the reality that real estate generally appreciates over time, which is not reflected in most depreciation methods, and focus on operating results widely used by real estate investors. We also use FFO as adjusted for straight-line rents, stock compensation expense, and recurring capital expenditures as a basis for certain of our debt covenant calculations. These non-GAAP measurements should not be considered as alternatives to net income (loss) presented in accordance with GAAP but as a supplemental performance measurement. Because these measurements may exclude certain cash flows, gains, revenues or expenses, we caution that these measurements may not be representative of our current or future liquidity as presented in accordance with GAAP. There can be no assurance that our methods for computing these non-GAAP measurements are comparable with those of other real estate companies and trusts in all respects. A reconciliation for each non-GAAP measurement to the most applicable GAAP measurement is provided below. Unless otherwise noted, our presentation is based on our Proportionate Share. Funds from Operations (“FFO”) is a non-GAAP performance financial measure that is widely recognized as a measure of REIT operating performance. We use FFO as currently defined by the National Association of Real Estate Investment Trusts (“NAREIT”) to be net income (loss), computed in accordance with GAAP, excluding gains (or losses) from sales of property (including deemed sales (if any) and settlements of pre-existing relationships), plus depreciation and amortization on real estate assets, impairment write-downs of depreciable real estate or of investments in unconsolidated real estate partnerships, joint ventures and subsidiaries (if any) that are driven by measurable decreases in the fair value of depreciable real estate assets, and after related adjustments for unconsolidated partnerships, joint ventures and subsidiaries and noncontrolling interests. Core FFO is calculated starting from FFO adjusted for loss on early extinguishment of debt, acquisition expenses, contingent purchase price adjustments, gain or loss on derivative fair value adjustments and non-recurring expenses. Adjusted Core FFO (“AFFO”) is calculated starting from Core FFO adjusted for recurring capital expenditures, straight-line rents and stock compensation expense. 16
Appendix A reconciliation for each non-GAAP measurement to the most applicable GAAP measurement is as follows: For the three months and nine months ended September 30, 2016 and 2015 historical FFO, Core FFO and AFFO (i n mi l l i on s , e xce p t p e r s h a re a mou n ts ) (u n a u d i te d ) For the Three Months Ended September 30, For the Nine Months Ended September 30, 2016 2015 2016 2015 FFO: Ne t i n come (l os s ) a ttri b u ta b l e to common s tockh ol d e rs Ad d (d e d u ct) NAREI T d e fi n e d a d ju s tme n ts : Re a l e s ta te d e p re ci a ti on a n d a morti za ti on Ga i n s on s a l e s of re a l e s ta te I mp a i rme n t e xp e n s e Le s s : Non con trol l i n g i n te re s ts a d ju s tme n ts FFO - NAREI T d e fi n e d $ 4.5 $ 31.4 $ (13.1) $ 79.7 31.0 (17.5) - (1.9) 24.8 (34.4) - (7.5) 91.9 (17.5) - (20.9) 74.3 (83.0) 3.1 (23.4) 16.1 14.3 40.4 50.7 Ad d (d e d u ct) a d ju s tme n ts to a rri ve a t Core FFO: Fa i r va l u e a d ju s tme n ts (d e ri va ti ve s a n d b u s i n e s s comb i n a ti on s ) Acq u i s i ti on e xp e n s e s (i n cl u d i n g s ta rt u p e xp e n s e s ) Workforce re d u cti on Le s s : Non con trol l i n g i n te re s ts a d ju s tme n ts Core FFO - 0.1 - - - 0.5 - - 0.1 0.6 2.0 (0.1) - 0.7 - - 16.2 14.8 43.0 51.4 Ad d (d e d u ct) a d ju s tme n ts to a rri ve a t AFFO: Re cu rri n g ca p i ta l e xp e n d i ture s Stra i gh t-l i n e re n ts Stock comp e n s a ti on e xp e n s e Le s s : Non con trol l i n g i n te re s ts a d ju s tme n ts AFFO (0.7) 0.2 0.8 0.1 (0.6) 0.2 0.7 0.1 (1.9) 0.7 2.2 0.2 (2.0) 0.7 1.8 0.3 $ 16.6 $ 15.2 $ 44.2 $ 52.2 We i gh te d a ve ra ge n u mb e r of common s h a re s ou ts ta n d i n g - b a s i c We i gh te d a ve ra ge n u mb e r of common s h a re s ou ts ta n d i n g - d i l u te d 166.9 167.6 166.6 167.3 166.8 167.5 166.5 167.2 Pe r common s h a re a mou n ts - b a s i c a n d d i l u te d : Ne t i n come (l os s ) a ttri b u ta b l e to common s tockh ol d e rs FFO a ttri b u ta b l e to common s tockh ol d e rs - NAREI T De fi n e d Core FFO a ttri b u ta b l e to common s tockh ol d e rs AFFO a ttri b u ta b l e to common s tockh ol d e rs $ $ $ $ 0.03 0.10 0.10 0.10 $ $ $ $ 0.19 0.09 0.09 0.09 $ $ $ $ (0.08) 0.24 0.26 0.26 $ $ $ $ 0.48 0.30 0.31 0.31 17
Appendix Reconciliation of full-y ear 2016 guidance: Guidance Range - Per S hare Proforma annualized net income (loss) attributable to common stockholders Add (deduct) NAREIT defined adjustments: Real estate dep reciation and amortization Gains on sales of real estate Less: Noncontrolling interests adjustments Proforma FFO annualized - NAREIT defined $ (0.12) $ (0.11) 0.73 (0.10) (0.19) 0.74 (0.10) (0.19) 0.32 0.34 Add (deduct) adjustments to arrive at Proforma Core FFO annualized: Other (p rimarily workforce reduction) Less: Noncontrolling interests adjustments Proforma Core FFO annualized 0.04 (0.01) 0.04 (0.01) 0.35 0.37 Add (deduct) adjustments to arrive at Proforma AFFO annualized: Other (p rimarily stock comp ensation exp ense and recurring cap ital exp enditures) Less: Noncontrolling interests adjustments Proforma AFFO annualized 0.01 - 0.01 - $ 0.36 $ 0.38 Proforma weighted average number of common shares outstanding - diluted (in millions) 167.6 167.6 18
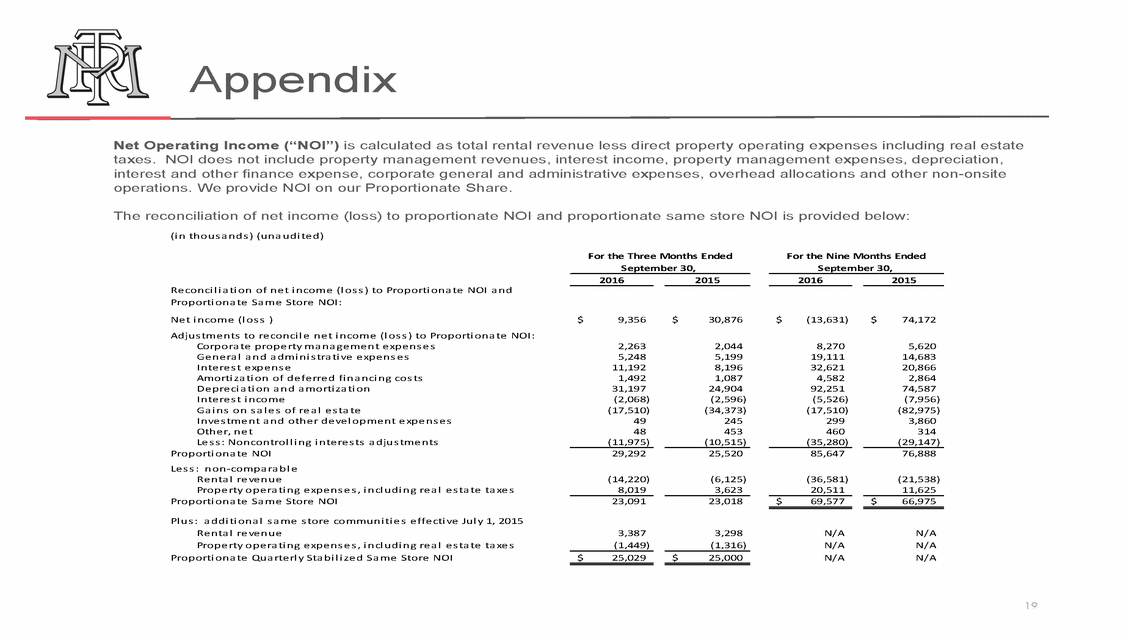
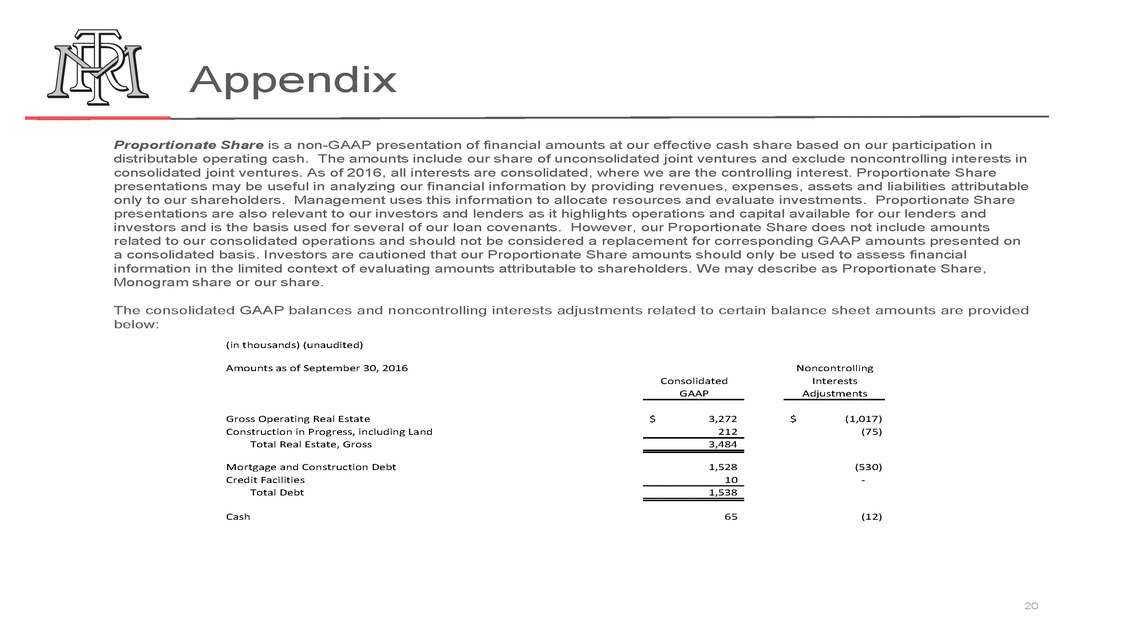
Appendix Net Operating Income (“NOI”) is calculated as total rental revenue less direct property operating expenses including real estate taxes. NOI does not include property management revenues, interest income, property management expenses, depreciation, interest and other finance expense, corporate general and administrative expenses, overhead allocations and other non-onsite operations. We provide NOI on our Proportionate Share. The reconciliation of net income (loss) to proportionate NOI and proportionate same store NOI is provided below: (i n thou s a n d s ) (u n a u d i te d ) For the Three Months Ended September 30, For the Nine Months Ended September 30, 2016 2015 2016 2015 Re con ci l i a ti on of n e t i n come (l os s ) to Prop orti on a te NOI a n d Prop orti on a te Sa me Store NOI : Ne t i n come (l os s ) Ad ju s tme n ts to re con ci l e n e t i n come (l os s ) to Prop orti on a te NOI : Corp ora te p rop e rty ma n a ge me n t e xp e n s e s Ge n e ra l a n d a d mi n i s tra ti ve e xp e n s e s I n te re s t e xp e n s e Amorti za ti on of d e fe rre d fi n a n ci n g cos ts De p re ci a ti on a n d a morti za ti on I n te re s t i n come Ga i n s on s a l e s of re a l e s ta te I n ve s tme n t a n d othe r d e ve l op me n t e xp e n s e s Oth e r, n e t Le s s : Non con trol l i n g i n te re s ts a d ju s tme n ts Prop orti on a te NOI Le s s : n on -comp a ra b l e Re n ta l re ve n u e Prop e rty op e ra ti n g e xp e n s e s , i n cl u d i n g re a l e s ta te ta xe s Prop orti on a te Sa me Store NOI $ 9,356 $ 30,876 $ (13,631) $ 74,172 2,263 5,248 11,192 1,492 31,197 (2,068) (17,510) 49 48 (11,975) 2,044 5,199 8,196 1,087 24,904 (2,596) (34,373) 245 453 (10,515) 8,270 19,111 32,621 4,582 92,251 (5,526) (17,510) 299 460 (35,280) 5,620 14,683 20,866 2,864 74,587 (7,956) (82,975) 3,860 314 (29,147) 29,292 25,520 85,647 76,888 (14,220) 8,019 (6,125) 3,623 (36,581) 20,511 (21,538) 11,625 23,091 23,018 $ 69,577 $ 66,975 Pl u s : a d d i ti on a l s a me s tore commu n i ti e s e ffe cti ve Ju l y 1, 2015 Re n ta l re ve n u e Prop e rty op e ra ti n g e xp e n s e s , i n cl u d i n g re a l e s ta te ta xe s Prop orti on a te Qu a rte rl y Sta b i l i ze d Sa me Store NOI 3,387 (1,449) 3,298 (1,316) N/A N/A N/A N/A N/A N/A $ 25,029 $ 25,000 19
Appendix Proportionate Share is a non-GAAP presentation of financial amounts at our effective cash share based on our participation in distributable operating cash. The amounts include our share of unconsolidated joint ventures and exclude noncontrolling interests in consolidated joint ventures. As of 2016, all interests are consolidated, where we are the controlling interest. Proportionate Share presentations may be useful in analyzing our financial information by providing revenues, expenses, assets and liabilities attributable only to our shareholders. Management uses this information to allocate resources and evaluate investments. Proportionate Share presentations are also relevant to our investors and lenders as it highlights operations and capital available for our lenders and investors and is the basis used for several of our loan covenants. However, our Proportionate Share does not include amounts related to our consolidated operations and should not be considered a replacement for corresponding GAAP amounts presented on a consolidated basis. Investors are cautioned that our Proportionate Share amounts should only be used to assess financial information in the limited context of evaluating amounts attributable to shareholders. We may describe as Proportionate Share, Monogram share or our share. The consolidated GAAP balances and noncontrolling interests adjustments related to certain balance sheet amounts are provided below: (in thousands) (unaudited) Amounts as of September 30, 2016 Noncontrolling Interests Adjustments Consolidated GAAP Gross Operating Real Estate Construction in Progress, including Land Total Real Estate, Gross $ 3,272 212 $ (1,017) (75) 3,484 Mortgage and Construction Debt Credit Facilities Total Debt 1,528 10 (530) - 1,538 Cash 65 (12) 20