Exhibit 99.2
| Tyco Electronics Q3 2009 Earnings Call July 29, 2009 |
| July 29, 2009 page 2 / Forward-Looking Statements / Non-GAAP Measures This presentation contains certain “forward-looking statements” within the meaning of the United States Private Securities Litigation Reform Act of 1995. These statements are based on management’s current expectations and are subject to risks, uncertainty and changes in circumstances, which may cause actual results, performance, financial condition or achievements to differ materially from anticipated results, performance, financial condition or achievements. All statements contained herein that are not clearly historical in nature are forward-looking and the words “anticipate,” “believe,” “expect,” “estimate,” “plan,” and similar expressions are generally intended to identify forward-looking statements. Tyco Electronics has no intention and is under no obligation to update or alter (and expressly disclaims any such intention or obligation to do so) its forward-looking statements whether as a result of new information, future events or otherwise, except to the extent required by law. The forward-looking statements in this presentation include statements addressing our future financial condition and operating results. Examples of factors that could cause actual results to differ materially from those described in the forward-looking statements include, among others, business, economic, competitive and regulatory risks, such as developments in the credit markets; conditions affecting demand for products, particularly the automotive industry and the telecommunications, computer and consumer electronics industries; future goodwill impairment; competition and pricing pressure; fluctuations in foreign currency exchange rates and commodity prices; political, economic and military instability in countries outside the U.S.; compliance with current and future environmental and other laws and regulations; and the possible effects on us of changes in tax laws, tax treaties and other legislation. More detailed information about these and other factors is set forth in Tyco Electronics’ Annual Report on Form 10-K/A for the fiscal year ended September 26, 2008 and Quarterly Reports on Form 10-Q for the quarterly periods ended December 26, 2008 and March 27, 2009, as well as in Tyco Electronics’ Current Reports on Form 8-K and other reports filed by Tyco Electronics with the Securities and Exchange Commission. Where we have used non-GAAP financial measures, reconciliations to the most comparable GAAP measure is provided, along with a disclosure on the usefulness of the non-GAAP measure, in this presentation. |
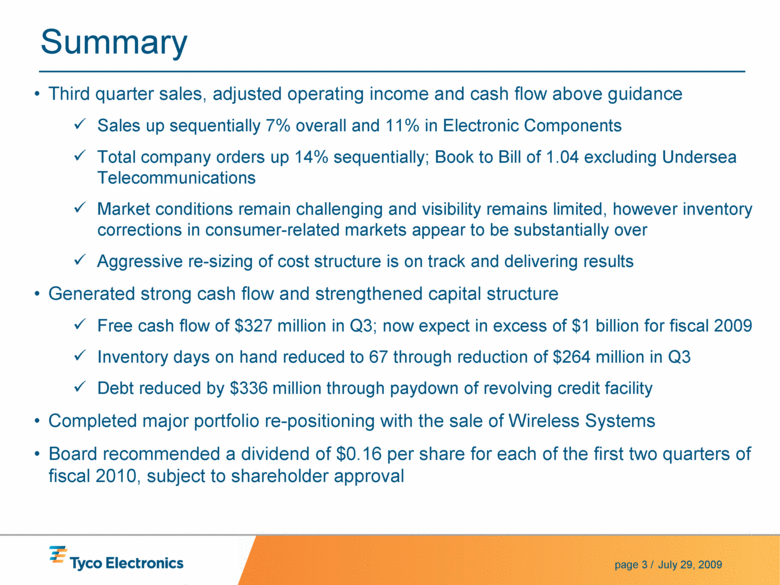
| July 29, 2009 page 3 / Summary • Third quarter sales, adjusted operating income and cash flow above guidance Sales up sequentially 7% overall and 11% in Electronic Components Total company orders up 14% sequentially; Book to Bill of 1.04 excluding Undersea Telecommunications Market conditions remain challenging and visibility remains limited, however inventory corrections in consumer-related markets appear to be substantially over Aggressive re-sizing of cost structure is on track and delivering results • Generated strong cash flow and strengthened capital structure Free cash flow of $327 million in Q3; now expect in excess of $1 billion for fiscal 2009 Inventory days on hand reduced to 67 through reduction of $264 million in Q3 Debt reduced by $336 million through paydown of revolving credit facility • Completed major portfolio re-positioning with the sale of Wireless Systems • Board recommended a dividend of $0.16 per share for each of the first two quarters of fiscal 2010, subject to shareholder approval |
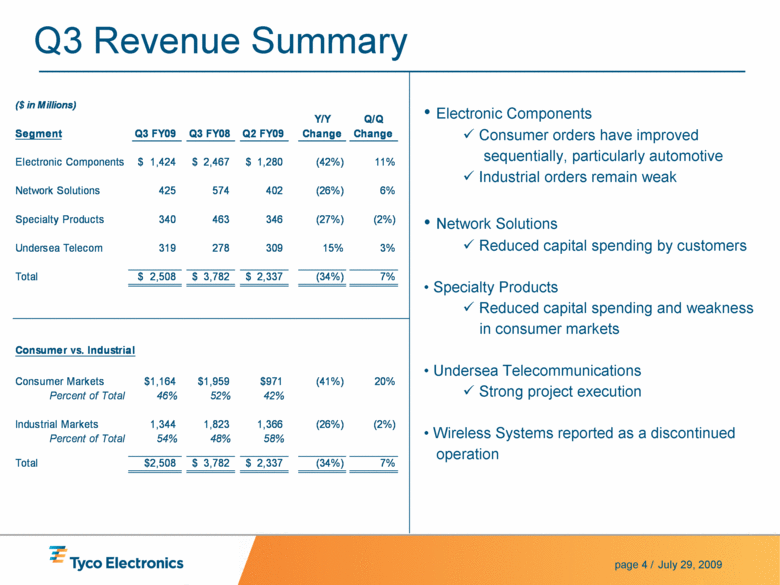
| July 29, 2009 page 4 / Q3 Revenue Summary ($ in Millions) Segment Q3 FY09 Q3 FY08 Q2 FY09 Y/Y Change Q/Q Change Electronic Components 1,424 $ 2,467 $ 1,280 $ (42%) 11% Network Solutions 425 574 402 (26%) 6% Specialty Products 340 463 346 (27%) (2%) Undersea Telecom 319 278 309 15% 3% Total 2,508 $ 3,782 $ 2,337 $ (34%) 7% Consumer vs. Industrial Consumer Markets $1,164 $1,959 $971 (41%) 20% Percent of Total 46% 52% 42% Industrial Markets 1,344 1,823 1,366 (26%) (2%) Percent of Total 54% 48% 58% Total $2,508 3,782 $ 2,337 $ (34%) 7% • Electronic Components Consumer orders have improved sequentially, particularly automotive Industrial orders remain weak • Network Solutions Reduced capital spending by customers • Specialty Products Reduced capital spending and weakness in consumer markets • Undersea Telecommunications Strong project execution • Wireless Systems reported as a discontinued operation |
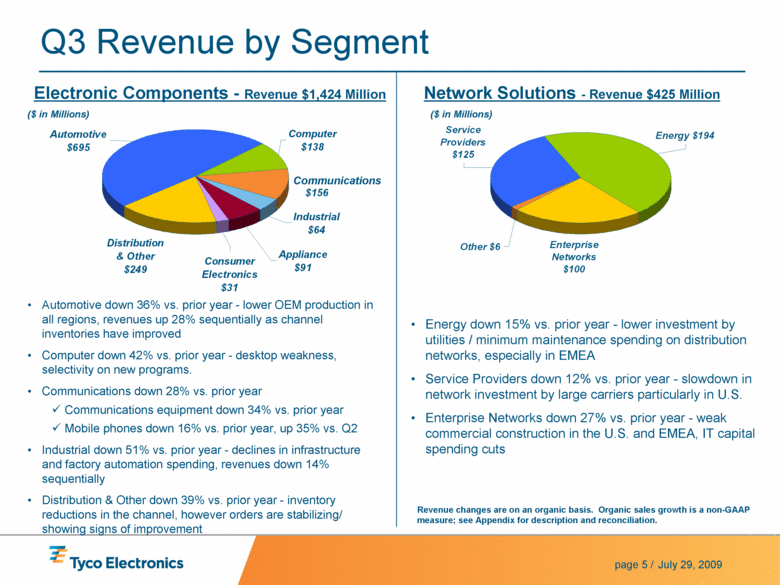
| July 29, 2009 page 5 / Q3 Revenue by Segment Electronic Components - Revenue $1,424 Million Network Solutions - Revenue $425 Million Other $6 Service Providers $125 Enterprise Networks $100 Energy $194 • Automotive down 36% vs. prior year - lower OEM production in all regions, revenues up 28% sequentially as channel inventories have improved • Computer down 42% vs. prior year - desktop weakness, selectivity on new programs. • Communications down 28% vs. prior year Communications equipment down 34% vs. prior year Mobile phones down 16% vs. prior year, up 35% vs. Q2 • Industrial down 51% vs. prior year - declines in infrastructure and factory automation spending, revenues down 14% sequentially • Distribution & Other down 39% vs. prior year - inventory reductions in the channel, how ever orders are stabilizing/ showing signs of improvement • Energy down 15% vs. prior year - lower investment by utilities / minimum maintenance spending on distribution networks, especially in EMEA • Service Providers down 12% vs. prior year - slowdown in network investment by large carriers particularly in U.S. • Enterprise Networks down 27% vs. prior year - weak commercial construction in the U.S. and EMEA, IT capital spending cuts ($ in Millions) ($ in Millions) Revenue changes are on an organic basis. Organic sales growth is a non-GAAP measure; see Appendix for description and reconciliation. Distribution & Other $249 Computer $138 $156 Automotive $695 Industrial $64 Appliance $91 Consumer Electronics $31 Communications |
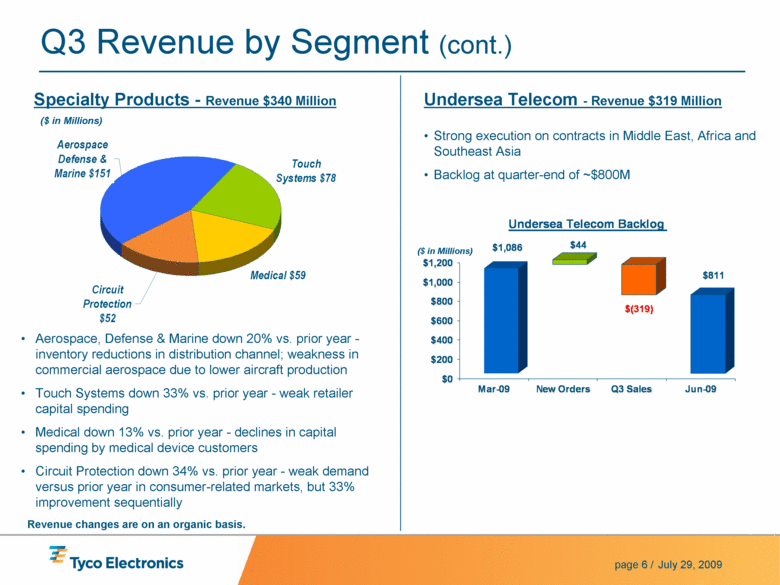
| July 29, 2009 page 6 / Specialty Products - Revenue $340 Million Undersea Telecom - Revenue $319 Million • Strong execution on contracts in Middle East, Africa and Southeast Asia • Backlog at quarter-end of ~$800M Circuit Protection $52 Aerospace Defense & Marine $151 Medical $59 Touch Systems $78 Q3 Revenue by Segment (cont.) • Aerospace, Defense & Marine down 20% vs. prior year - inventory reductions in distribution channel; weakness in commercial aerospace due to lower aircraft production • Touch Systems down 33% vs. prior year - weak retailer capital spending • Medical down 13% vs. prior year - declines in capital spending by medical device customers • Circuit Protection down 34% vs. prior year - weak demand versus prior year in consumer-related markets, but 33% improvement sequentially ($ in Millions) Revenue changes are on an organic basis. $1,086 $44 $811 $(319) $0 $200 $400 $600 $800 $1,000 $1,200 Mar-09 New Orders Q3 Sales Jun-09 Undersea Telecom Backlog |
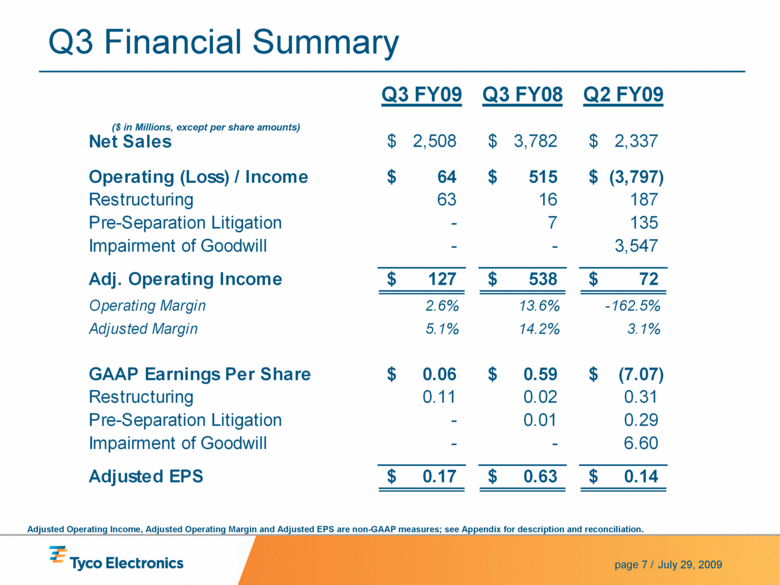
| July 29, 2009 page 7 / Q3 Financial Summary Q3 FY09 Q3 FY08 Q2 FY09 Net Sales 2,508 $ 3,782 $ 2,337 $ Operating (Loss) / Income 64 $ 515 $ (3,797) $ Restructuring 63 16 187 Pre-Separation Litigation - 7 135 Impairment of Goodwill - - 3,547 Adj. Operating Income 127 $ 538 $ 72 $ Operating Margin 2.6% 13.6% -162.5% Adjusted Margin 5.1% 14.2% 3.1% GAAP Earnings Per Share 0.06 $ 0.59 $ (7.07) $ Restructuring 0.11 0.02 0.31 Pre-Separation Litigation - 0.01 0.29 Impairment of Goodwill - - 6.60 Adjusted EPS 0.17 $ 0.63 $ 0.14 $ ($ in Millions, except per share amounts) Adjusted Operating Income, Adjusted Operating Margin and Adjusted EPS are non-GAAP measures; see Appendix for description and reconciliation. |
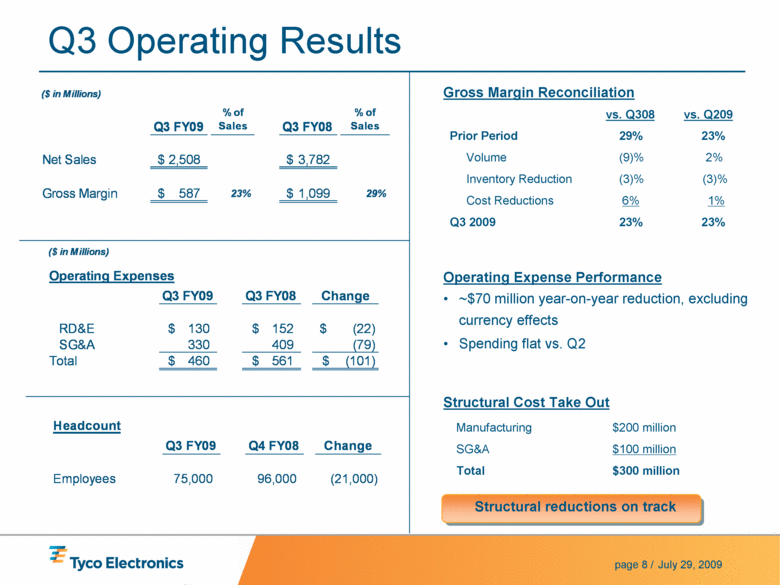
| July 29, 2009 page 8 / Q3 Operating Results ($ in Millions) Operating Expenses Q3 FY09 Q3 FY08 Change RD&E 130 $ 152 $ (22) $ SG&A 330 409 (79) Total 460 $ 561 $ (101) $ Gross Margin Reconciliation Operating Expense Performance • ~$70 million year-on-year reduction, excluding currency effects • Spending flat vs. Q2 Structural Cost Take Out vs. Q308 vs. Q209 Prior Period 29% 23% Volume (9)% 2% Inventory Reduction (3)% (3)% Cost Reductions 6% 1% Q3 2009 23% 23% ($ in Millions) Q3 FY09 % of Sales Q3 FY08 % of Sales Net Sales 2,508 $ 3,782 $ Gross Margin 587 $ 23% 1,099 $ 29% Manufacturing $200 million SG&A $100 million Total $300 million Headcount Q3 FY09 Q4 FY08 Change Employees 75,000 96,000 (21,000) Structural reductions on track |
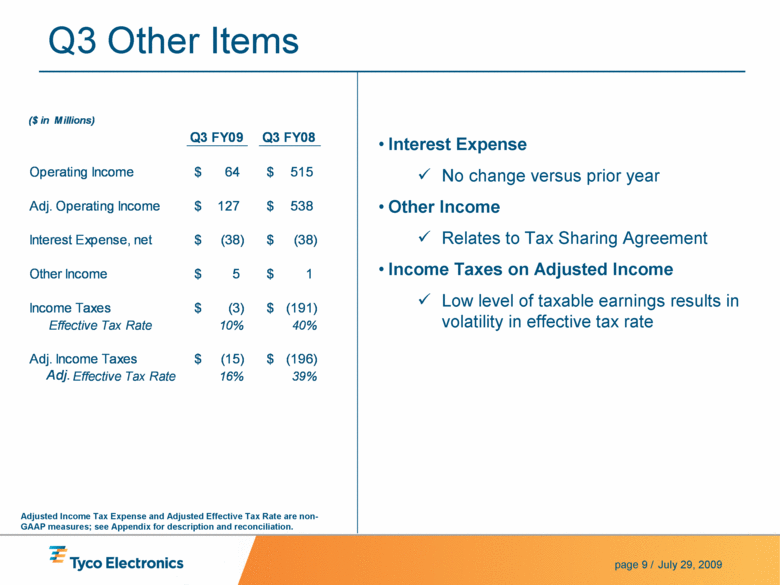
| July 29, 2009 page 9 / Q3 Other Items ($ in Millions) Q3 FY09 Q3 FY08 Operating Income 64 $ 515 $ Adj. Operating Income 127 $ 538 $ Interest Expense, net (38) $ (38) $ Other Income 5 $ 1 $ Income Taxes (3) $ (191) $ Effective Tax Rate 10% 40% Adj. Income Taxes (15) $ (196) $ Adj. Effective Tax Rate 16% 39% • Interest Expense No change versus prior year • Other Income Relates to Tax Sharing Agreement • Income Taxes on Adjusted Income Low level of taxable earnings results in volatility in effective tax rate Adjusted Income Tax Expense and Adjusted Effective Tax Rate are non-GAAP measures; see Appendix for description and recon ciliation. |
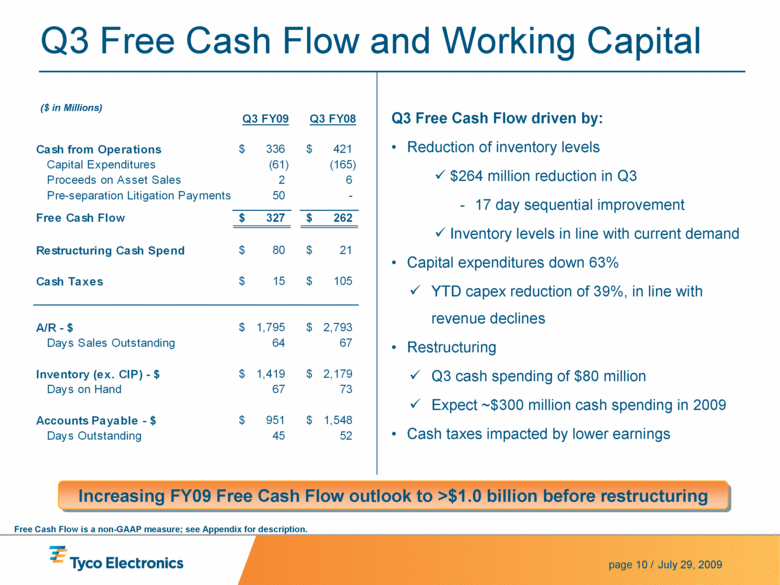
| July 29, 2009 page 10 / Q3 Free Cash Flow and Working Capital Q3 Free Cash Flow driven by: • Reduction of inventory levels $264 million reduction in Q3 - 17 day sequential improvement Inventory levels in line with current demand • Capital expenditures down 63% YTD capex reduction of 39%, in line with revenue declines • Restructuring Q3 cash spending of $80 million Expect ~$300 million cash spending in 2009 • Cash taxes impacted by lower earnings Increasing FY09 Free Cash Flow outlook to >$1.0 billion before restructuring Q3 FY09 Q3 FY08 Cash from Operations 336 $ 421 $ Capital Expenditures (61) (165) Proceeds on Asset Sales 2 6 Pre-separation Litigation Payments 50 - Free Cash Flow 327 $ 262 $ Restructuring Cash Spend 80 $ 21 $ Cash Taxes 15 $ 105 $ A/R - $ 1,795 $ 2,793 $ Days Sales Outstanding 64 67 Inventory (ex. CIP) - $ 1,419 $ 2,179 $ Days on Hand 67 73 Accounts Payable - $ 951 $ 1,548 $ Days Outstanding 45 52 ($ in Millions) Free Cash Flow is a non-GAAP measure; see Appendix for description. |
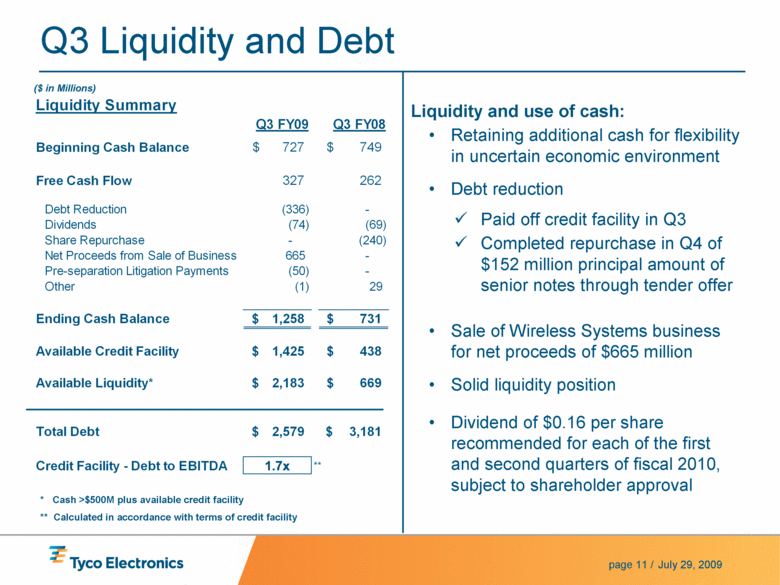
| July 29, 2009 page 11 / Q3 Liquidity and Debt Liquidity and use of cash: • Retaining additional cash for flexibility in uncertain economic environment • Debt reduction Paid off credit facility in Q3 Completed repurchase in Q4 of $152 million principal amount of senior notes through tender offer • Sale of Wireless Systems business for net proceeds of $665 million • Solid liquidity position • Dividend of $0.16 per share recommended for each of the first and second quarters of fiscal 2010, subject to shareholder approval * Cash >$500M plus available credit facility Liquidity Summary Q3 FY09 Q3 FY08 Beginning Cash Balance 727 $ 749 $ Free Cash Flow 327 262 Debt Reduction (336) - Dividends (74) (69) Share Repurchase - (240) Net Proceeds from Sale of Business 665 - Pre-separation Litigation Payments (50) - Other (1) 29 Ending Cash Balance 1,258 $ 731 $ Available Credit Facility 1,425 $ 438 $ Available Liquidity* 2,183 $ 669 $ Total Debt 2,579 $ 3,181 $ Credit Facility - Debt to EBITDA 1.7x ** ** Calculated in accordance with terms of credit facility ($ in Millions) |
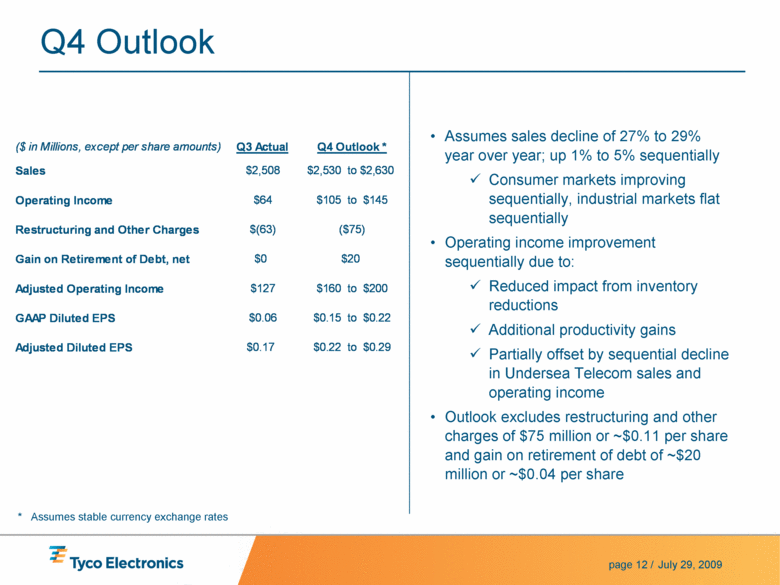
| July 29, 2009 page 12 / Q4 Outlook * Assumes stable currency exchange rates • Assumes sales decline of 27% to 29% year over year; up 1% to 5% sequentially Consumer markets improving sequentially, industrial markets flat sequentially • Operating income improvement sequentially due to: Reduced impact from inventory reductions Additional productivity gains Partially offset by sequential decline in Undersea Telecom sales and operating income • Outlook excludes restructuring and other charges of $75 million or ~$0.11 per share and gain on retirement of debt of ~$20 million or ~$0.04 per share ($ in Millions, except per share amounts) Q3 Actual Q4 Outlook * Sales $2,508 $2,530 to $2,630 Operating Income $64 $105 to $145 Restructuring and Other Charges $(63) ($75) Gain on Retirement of Debt, net $0 $20 Adjusted Operating Income $127 $160 to $200 GAAP Diluted EPS $0.06 $0.15 to $0.22 Adjusted Diluted EPS $0.17 $0.22 to $0.29 |
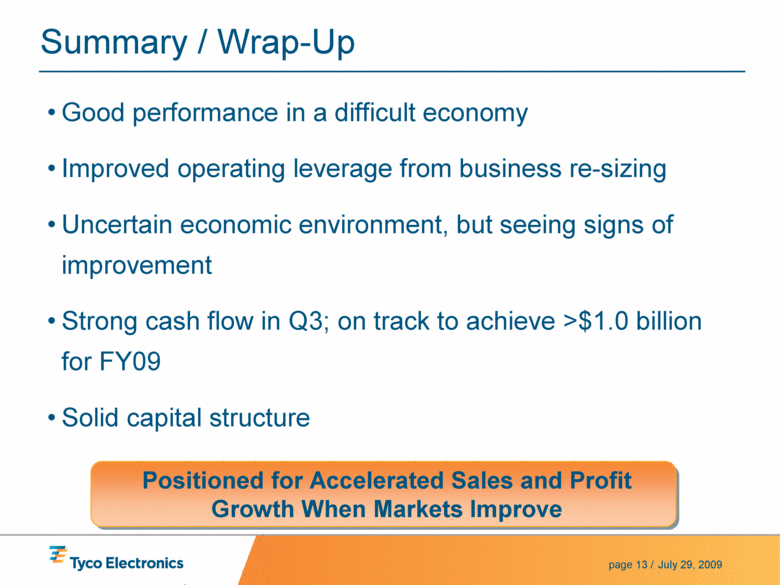
| July 29, 2009 page 13 / Summary / Wrap-Up • Good performance in a difficult economy • Improved operating leverage from business re-sizing • Uncertain economic environment, but seeing signs of improvement • Strong cash flow in Q3; on track to achieve >$1.0 billion for FY09 • Solid capital structure Positioned for Accelerated Sales and Profit Growth When Markets Improve |
| July 29, 2009 page 14 / Q & A |
| July 29, 2009 page 15 / Appendix |
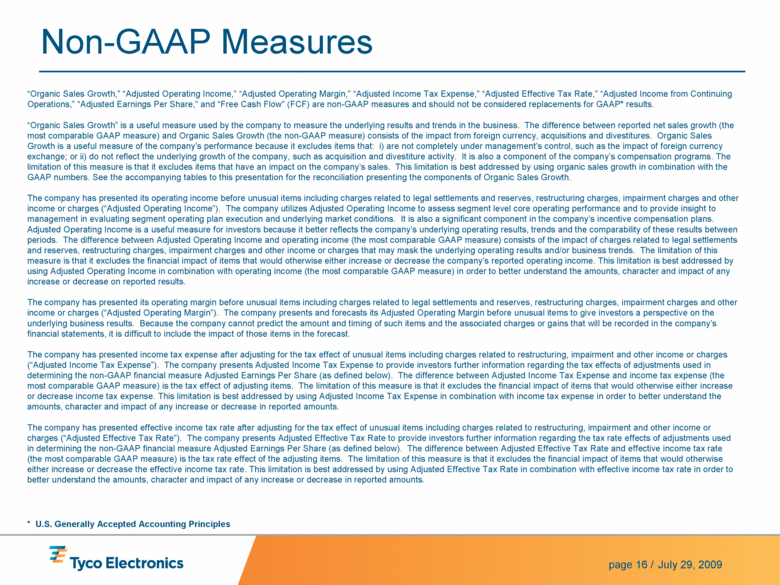
| July 29, 2009 page 16 / Non-GAAP Measures “Organic Sales Growth,” “Adjusted Operating Income,” “Adjusted Operating Margin,” “Adjusted Income Tax Expense,” “Adjusted Effective Tax Rate,” “Adjusted Income from Continuing Operations,” “Adjusted Earnings Per Share,” and “Free Cash Flow” (FCF) are non-GAAP measures and should not be considered replacements for GAAP* results. “Organic Sales Growth” is a useful measure used by the company to measure the underlying results and trends in the business. The difference between reported net sales growth (the most comparable GAAP measure) and Organic Sales Growth (the non-GAAP measure) consists of the impact from foreign currency, acquisitions and divestitures. Organic Sales Growth is a useful measure of the company’s performance because it excludes items that: i) are not completely under management’s control, such as the impact of foreign currency exchange; or ii) do not reflect the underlying growth of the company, such as acquisition and divestiture activity. It is also a component of the company’s compensation programs. The limitation of this measure is that it excludes items that have an impact on the company’s sales. This limitation is best addressed by using organic sales growth in combination with the GAAP numbers. See the accompanying tables to this presentation for the reconciliation presenting the components of Organic Sales Growth. The company has presented its operating income before unusual items including charges related to legal settlements and reserves, restructuring charges, impairment charges and other income or charges (“Adjusted Operating Income”). The company utilizes Adjusted Operating Income to assess segment level core operating performance and to provide insight to management in evaluating segment operating plan execution and underlying market conditions. It is also a significant component in the company’s incentive compensation plans. Adjusted Operating Income is a useful measure for investors because it better reflects the company’s underlying operating results, trends and the comparability of these results between periods. The difference between Adjusted Operating Income and operating income (the most comparable GAAP measure) consists of the impact of charges related to legal settlements and reserves, restructuring charges, impairment charges and other income or charges that may mask the underlying operating results and/or business trends. The limitation of this measure is that it excludes the financial impact of items that would otherwise either increase or decrease the company’s reported operating income. This limitation is best addressed by using Adjusted Operating Income in combination with operating income (the most comparable GAAP measure) in order to better understand the amounts, character and impact of any increase or decrease on reported results. The company has presented its operating margin before unusual items including charges related to legal settlements and reserves, restructuring charges, impairment charges and other income or charges (“Adjusted Operating Margin”). The company presents and forecasts its Adjusted Operating Margin before unusual items to give investors a perspective on the underlying business results. Because the company cannot predict the amount and timing of such items and the associated charges or gains that will be recorded in the company’s financial statements, it is difficult to include the impact of those items in the forecast. The company has presented income tax expense after adjusting for the tax effect of unusual items including charges related to restructuring, impairment and other income or charges (“Adjusted Income Tax Expense”). The company presents Adjusted Income Tax Expense to provide investors further information regarding the tax effects of adjustments used in determining the non-GAAP financial measure Adjusted Earnings Per Share (as defined below). The difference between Adjusted Income Tax Expense and income tax expense (the most comparable GAAP measure) is the tax effect of adjusting items. The limitation of this measure is that it excludes the financial impact of items that would otherwise either increase or decrease income tax expense. This limitation is best addressed by using Adjusted Income Tax Expense in combination with income tax expense in order to better understand the amounts, character and impact of any increase or decrease in reported amounts. The company has presented effective income tax rate after adjusting for the tax effect of unusual items including charges related to restructuring, impairment and other income or charges (“Adjusted Effective Tax Rate”). The company presents Adjusted Effective Tax Rate to provide investors further information regarding the tax rate effects of adjustments used in determining the non-GAAP financial measure Adjusted Earnings Per Share (as defined below). The difference between Adjusted Effective Tax Rate and effective income tax rate (the most comparable GAAP measure) is the tax rate effect of the adjusting items. The limitation of this measure is that it excludes the financial impact of items that would otherwise either increase or decrease the effective income tax rate. This limitation is best addressed by using Adjusted Effective Tax Rate in combination with effective income tax rate in order to better understand the amounts, character and impact of any increase or decrease in reported amounts. * U.S. Generally Accepted Accounting Principles |
| July 29, 2009 page 17 / Non-GAAP Measures (cont.) The company has presented income from continuing operations before unusual items including charges related to legal settlements and reserves, restructuring charges, impairment charges, tax sharing income related to the adoption of FIN 48, other income or charges and, if applicable, related tax effects (“Adjusted Income from Continuing Operations”). The company presents Adjusted Income from Continuing Operations as it believes that it is appropriate for investors to consider results excluding these items in addition to its results in accordance with GAAP. Adjusted Income from Continuing Operations provides additional information regarding the company’s underlying operating results, trends and the comparability of these results between periods. The difference between Adjusted Income from Continuing Operations and income from continuing operations (the most comparable GAAP measure) consists of the impact of charges related to legal settlements and reserves, restructuring charges, impairment charges, tax sharing income related to the adoption of FIN 48, other income or charges and, if applicable, related tax effects. The limitation of this measure is that it excludes the financial impact of items that would otherwise either increase or decrease the company’s reported results. This limitation is best addressed by using Adjusted Income from Continuing Operations in combination with income from continuing operations (the most comparable GAAP measure) in order to better understand the amounts, character and impact of any increase or decrease in reported amounts. The company has presented adjusted diluted earnings per share, which is diluted earnings per share from continuing operations before unusual items, including charges related to legal settlements and reserves, restructuring charges, impairment charges, tax sharing income related to the adoption of FIN 48 and other income or charges (“Adjusted Earnings Per Share”). The company presents Adjusted Earnings Per Share because it believes that it is appropriate for investors to consider results excluding these items in addition to its results in accordance with GAAP. The company believes such a measure provides a picture of its results that is more comparable among periods since it excludes the impact of unusual items, which may recur occasionally, but tend to be irregular as to timing, thereby making comparisons between periods more difficult. This limitation is best addressed by using Adjusted Earnings Per Share in combination with diluted earnings per share from continuing operations (the most comparable GAAP measure) in order to better understand the amounts, character and impact of any increase or decrease on reported results. “Free Cash Flow” (FCF) is a useful measure of the company’s cash generation which is free from any significant existing obligation. The difference between cash flows from operating activities (the most comparable GAAP measure) and FCF (the non-GAAP measure) consists mainly of significant cash outflows that the company believes are useful to identify. FCF permits management and investors to gain insight into the number that management employs to measure cash that is free from any significant existing obligation. The difference reflects the impact from: net capital expenditures, voluntary pension contributions, and cash impact of unusual items. Net capital expenditures are subtracted because they represent long-term commitments. Voluntary pension contributions are subtracted from the GAAP measure because this activity is driven by economic financing decisions rather than operating activity. The company forecasts its cash flow results excluding any voluntary pension contributions because it has not yet made a determination about the amount and timing of any future such contributions. In addition, the company’s forecast excludes the cash impact of unusual items because the company cannot predict the amount and timing of such items. The limitation associated with using FCF is that it subtracts cash items that are ultimately within management’s and the Board of Directors’ discretion to direct and that therefore may imply that there is less or more cash that is available for the company's programs than the most comparable GAAP measure. This limitation is best addressed by using FCF in combination with the GAAP cash flow numbers. FCF as presented herein may not be comparable to similarly-titled measures reported by other companies. The measure should be used in conjunction with other GAAP financial measures. Investors are urged to read the company’s financial statements as filed with the Securities and Exchange Commission, as well as the accompanying tables to this presentation that show all the elements of the GAAP measures of Cash Flows from Operating Activities, Cash Flows from Investing Activities, Cash Flows from Financing Activities and a reconciliation of the company's total cash and cash equivalents for the period. See the accompanying tables to this presentation for a cash flow statement presented in accordance with GAAP and a reconciliation presenting the components of FCF. Because the company does not predict the amount and timing of unusual items that might occur in the future, and its forecasts are developed at a level of detail different than that used to prepare GAAP-based financial measures, the company does not provide reconciliations to GAAP of its forward-looking financial measures. |
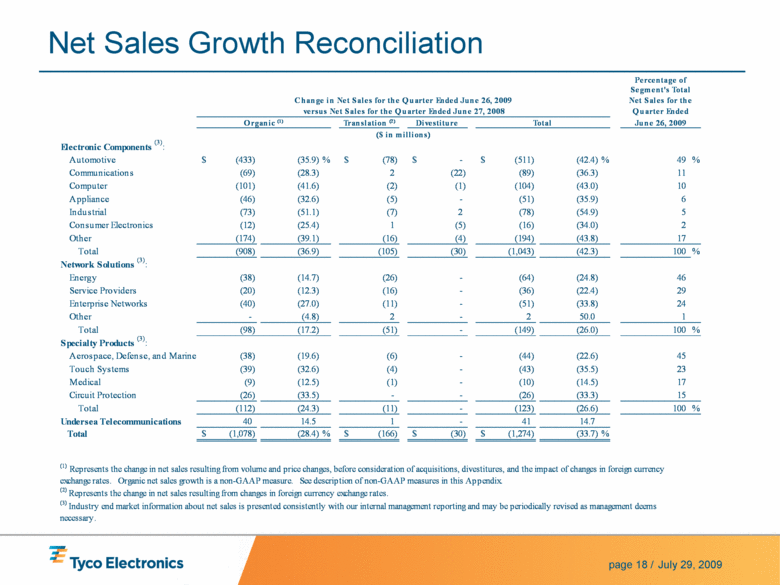
| July 29, 2009 page 18 / Net Sales Growth Reconciliation Translation (2) Divestiture Electronic Components (3) : Automotive (433) $ (35.9) % (78) $ - $ (511) $ (42.4) % 49 % Communications (69) (28.3) 2 (22) (89) (36.3) 11 Computer (101) (41.6) (2) (1) (104) (43.0) 10 Appliance (46) (32.6) (5) - (51) (35.9) 6 Industrial (73) (51.1) (7) 2 (78) (54.9) 5 Consumer Electronics (12) (25.4) 1 (5) (16) (34.0) 2 Other (174) (39.1) (16) (4) (194) (43.8) 17 Total (908) (36.9) (105) (30) (1,043) (42.3) 100 % Network Solutions (3) : Energy (38) (14.7) (26) - (64) (24.8) 46 Service Providers (20) (12.3) (16) - (36) (22.4) 29 Enterprise Networks (40) (27.0) (11) - (51) (33.8) 24 Other - (4.8) 2 - 2 50.0 1 Total (98) (17.2) (51) - (149) (26.0) 100 % Specialty Products (3) : Aerospace, Defense, and Marine (38) (19.6) (6) - (44) (22.6) 45 Touch Systems (39) (32.6) (4) - (43) (35.5) 23 Medical (9) (12.5) (1) - (10) (14.5) 17 Circuit Protection (26) (33.5) - - (26) (33.3) 15 Total (112) (24.3) (11) - (123) (26.6) 100 % Undersea Telecommunications 40 14.5 1 - 41 14.7 Total (1,078) $ (28.4) % (166) $ (30) $ (1,274) $ (33.7) % versus Net Sales for the Quarter Ended June 27, 2008 Percentage of Segment's Total (3) Industry end market information about net sales is p resented consistently with our internal management reporting and may be periodically revised as management deems necessary . Change in Net Sales for the Quarter Ended June 26, 2009 (1) Represents the change in net sales resulting from volume and price changes, before consideration of acquisitions, divestitures, and the impact of changes in foreign currency exchange rates. Organic net sales growth is a non-GAAP measure. See description of non-GAAP measures in this Appendix. (2) Rep resents the change in net sales resulting from changes in foreign currency exchange rates. Quarter Ended Net Sales for the Total ($ in millions) Organic (1) June 26, 2009 |
| July 29, 2009 page 19 / Reconciliation of Non-GAAP Financial Measures to GAAP Financial Measures for the Quarter Ended June 26, 2009 Adjustments Restructuring and Other Adjusted U.S. GAAP Charges, Net (1) (Non-GAAP) (2) Operating Income: Electronic Components (82) $ 46 $ (36) $ Network Solutions 31 15 46 Specialty Products 42 1 43 Undersea Telecommunications 73 1 74 Total 64 $ 63 $ 127 $ Operating Margin 2.6% 5.1% Income Tax Expense (3) $ (12) $ (15) $ Effective Tax Rate 10% 16% Income from Continuing Operations 26 $ 51 $ 77 $ Diluted Earnings per Share from Continuing Operations 0.06 $ 0.11 $ 0.17 $ (2) See description of non-GAAP measures contained in this Appendix. ($ in millions, except per share data) (1) Includes $63 million recorded in restructuring and other charges , net. |
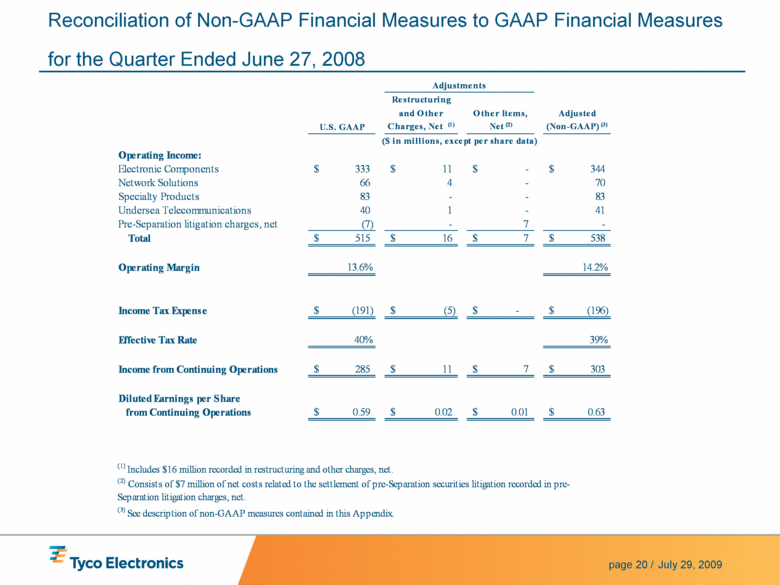
| July 29, 2009 page 20 / Reconciliation of Non-GAAP Financial Measures to GAAP Financial Measures for the Quarter Ended June 27, 2008 Restructuring and Other Other Items, Adjusted U.S. GAAP Charges, Net (1) Net (2) (Non -GAAP) (3) Operating Income: Electronic Components 333 $ 11 $ - $ 344 $ Network Solutions 66 4 - 70 Specialty Products 83 - - 83 Undersea Telecommunications 40 1 - 41 Pre-Separation litigation charges, net (7) - 7 - Total 515 $ 16 $ 7 $ 538 $ Operating Margin 13.6% 14.2% Income Tax Expense (191) $ (5) $ - $ (196) $ Effective Tax Rate 40% 39% Income from Continuing Operations 285 $ 11 $ 7 $ 303 $ Diluted Earnings per Share from Continuing Operations 0.59 $ 0.02 $ 0.01 $ 0.63 $ (3) See description of non-GAAP measures contained in this Appendix. ($ in millions, except per share data) Adjustments (1) Includes $16 million recorded in restructuring and other charges, net. (2) Consists of $7 million of net costs related to the settlement of pre-Separation securities litigation recorded in pre-Separation litigation charges, net. |
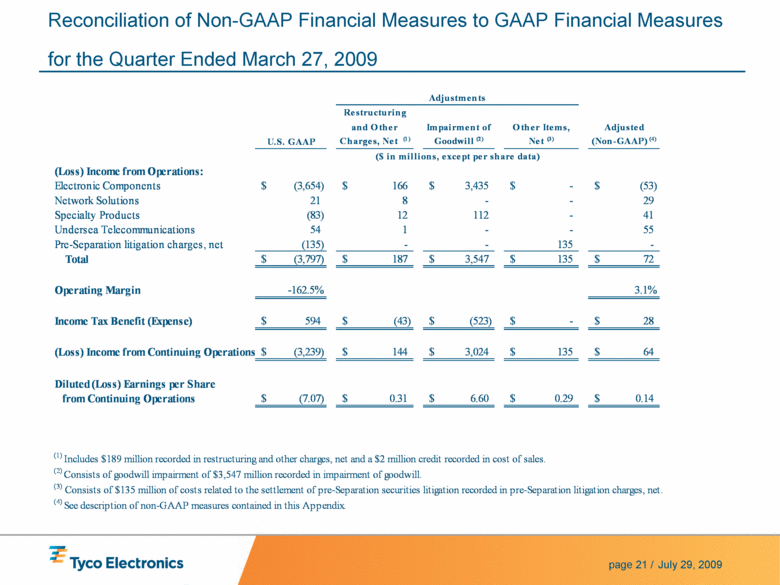
| July 29, 2009 page 21 / Reconciliation of Non-GAAP Financial Measures to GAAP Financial Measures for the Quarter Ended March 27, 2009 Restructuring and Other Impairment of Other Items, Adjusted U.S. GAAP Charges, Net (1) Goodwill (2) Net (3) (Non-GAAP) (4) (Loss) Income from Operations: Electronic Components (3,654) $ 166 $ 3,435 $ - $ (53) $ Network Solutions 21 8 - - 29 Specialty Products (83) 12 112 - 41 Undersea Telecommunications 54 1 - - 55 Pre-Separation litigation charges, net (135) - - 135 - Total (3,797) $ 187 $ 3,547 $ 135 $ 72 $ Operating Margin -162.5% 3.1% Income Tax Benefit (Expense) 594 $ (43) $ (523) $ - $ 28 $ (Loss) Income from Continuing Operations (3,239) $ 144 $ 3,024 $ 135 $ 64 $ Diluted (Loss) Earnings per Share from Continuing Operations (7.07) $ 0.31 $ 6.60 $ 0.29 $ 0.14 $ (4) See description of non-GAAP measures contained in this Appendix. Adjustments ($ in millions, except per share data) (1) Includes $189 million recorded in restructuring and other charges, net and a $2 million credit recorded in cost of sales. (2) Consists of goodwill impairment of $3,547 million recorded in impairment of goodwill. (3) Consists of $135 million of costs related to the settlement of pre-Separation securities litigation recorded in pre-Separation litigation charges, net. |
