UNITED STATES
SECURITIES AND EXCHANGE COMMISSION
Washington, D.C. 20549
FORM N-CSR
CERTIFIED SHAREHOLDER REPORT OF REGISTERED
MANAGEMENT INVESTMENT COMPANIES
Investment Company Act file number | 811-22001 |
|
TDAX Funds, Inc. |
(Exact name of registrant as specified in charter) |
|
420 Lexington Avenue, Suite 2550 New York, New York | | 10170 |
(Address of principal executive offices) | | (Zip code) |
|
David M. Kelley TDAX Funds, Inc. 420 Lexington Avenue Suite 2550 New York, New York 10170 |
(Name and address of agent for service) |
|
Registrant’s telephone number, including area code: | (212) 867-7400 | |
|
Date of fiscal year end: | May 31, 2008 | |
|
Date of reporting period: | November 30, 2007 | |
| | | | | | | | |
Item 1. Report to Stockholders.
The Registrant’s semi-annual report transmitted to shareholders pursuant to Rule 30e-1 under the Investment Company Act of 1940 is as follows:
SEMI-ANNUAL REPORT
November 30, 2007
(Unaudited)
TDAX Funds, Inc.
TDAX Independence 2010 Exchange-Traded Fund
TDAX Independence 2020 Exchange-Traded Fund
TDAX Independence 2030 Exchange-Traded Fund
TDAX Independence 2040 Exchange-Traded Fund
TDAX Independence In-Target Exchange-Traded Fund

TDAX Funds, Inc.
TABLE OF CONTENTS
| | | Page | |
| Shareholder Letter | | | 1 | | |
|
| Fund Performance Overview | |
|
| TDAX Independence 2010 Exchange-Traded Fund | | | 2 | | |
|
| TDAX Independence 2020 Exchange-Traded Fund | | | 3 | | |
|
| TDAX Independence 2030 Exchange-Traded Fund | | | 4 | | |
|
| TDAX Independence 2040 Exchange-Traded Fund | | | 5 | | |
|
| TDAX Independence In-Target Exchange-Traded Fund | | | 6 | | |
|
| Fees and Expenses | | | 7 | | |
|
| Schedule of Investments | |
|
| TDAX Independence 2010 Exchange-Traded Fund | | | 8 | | |
|
| TDAX Independence 2020 Exchange-Traded Fund | | | 13 | | |
|
| TDAX Independence 2030 Exchange-Traded Fund | | | 18 | | |
|
| TDAX Independence 2040 Exchange-Traded Fund | | | 23 | | |
|
| TDAX Independence In-Target Exchange-Traded Fund | | | 28 | | |
|
| Statements of Assets and Liabilities | | | 32 | | |
|
| Statements of Operations | | | 34 | | |
|
| Statements of Changes in Net Assets | | | 36 | | |
|
| Financial Highlights | | | 38 | | |
|
| Notes to Financial Statements | | | 40 | | |
|
| Information About Advisory Agreement | | | 45 | | |
|
| Additional Information | | | 47 | | |
|
TO OUR SHAREHOLDERS:
We are pleased to present the first shareholder report on the TDAX Independence family of target-date exchange-traded funds (ETFs). This report covers the period from the launch of the five funds on NYSE Arca, Inc. on October 1, 2007 through the end of the funds' semi-annual period on November 30, 2007.
Even though the TDAX Independence ETFs have been trading for a short period, they have achieved some significant milestones and accumulated a number of firsts. The TDAX Independence ETFs are:
• The first lifecycle ETFs to enter the market. Other target-date products are either funds of mutual funds or funds of ETFs. Historically, first-to-market ETFs have garnered attention and assets. At the end of November, the TDAX Independence ETFs collectively held $111 million in assets.
• The first ETFs to hold a blended portfolio of both fixed income and equity securities. And, like all ETFs, TDAX Independence ETFs are easy-to-access, transparent, and lower-cost products. Where open-end target-date mutual funds have expense ratios averaging 1.27%*, TDAX Independence ETFs are estimated to have an expense ratio of 0.73%, which will be reduced to 0.65% as a result of a contractual waiver**.
• ETFs that are intended to fulfill the requirements to be deemed Qualified Default Investment Alternatives (QDIA), a new retirement investment category resulting from the Pension Protection Act of 2006. QDIAs may be adopted by plan sponsors to serve as 401(k) default options. The TDAX Independence ETFs provide investors with a retirement option that reallocates and rebalances automatically.
We are also pleased to report the initial dividend distributions for the TDAX Independence ETFs. The following dividends per share were paid to shareholders of record as of December 21, 2007, on December 31, 2007:
TDAX Independence 2010 $0.20929
TDAX Independence 2020 $0.11064
TDAX Independence 2030 $0.08937
TDAX Independence 2040 $0.06457
TDAX Independence In-Target $0.14932
Lifecycle funds continue to be one of the fastest growing products for investors saving for retirement. In 2006, lifecycle funds increased assets by 50% to $303 billion, after rising 57% in 2005. According to the Investment Company Institute, this trend is expected to continue and assets may grow to $465 billion by 2010.
In addition, ETFs are one of the fastest growing investment products ever. ETF assets are collectively expected to grow to $2 trillion by 2010 from their mid-November 2007 $580 billion total, according to Morgan Stanley research. The study also noted that over 37% of the 601 ETFs trading in the U.S. today have been issued this year. Needless to say, we believe, the TDAX Independence ETFs are well positioned to capture these two surging trends of investor interest.
We look forward to concluding TDAX Funds, Inc.'s first full year of operations in 2008 and thank you for your support.
Very truly yours,
 | |  | |
|
| Anthony F. Dudzinski | | David M. Kelley | |
|
| Chairman & | | President & | |
|
| Chief Operating Officer | | Chief Executive Officer | |
|
* Source: Morningstar Database October 2007.
** The total expense ratio in the most recent prospectus is estimated at 0.73%. Amerivest Investment Management, LLC ("Amerivest") has contractually agreed to pay Fund operating expenses (excluding, among other things, acquired fund fees and expenses, interest, taxes, brokerage commissions and extraordinary expenses) in order to limit Net Annual Operating Expenses for shares of each Fund to 0.65% of the Fund's average net assets (the "Expense Cap"). The Expense Cap will remain in effect until at least September 30, 2008. Amerivest is permitted to be reimbursed for fee reductions and/or expense payments made in the prior three fiscal years. This reimbursement may be requested by Amerivest if the aggregate amount actually paid by the Fund toward operating expenses for such fiscal year (taking into account the reimbursement) does not exceed the Expense Cap. Normal brokerage commissions apply.
1
TDAX Funds, Inc.
PERFORMANCE SUMMARY
TDAX Independence 2010 Exchange-Traded Fund (TDD)
The TDAX Independence 2010 Exchange-Traded Fund commenced investment operations and began trading on NYSE Arca, Inc. ("NYSE Arca") on October 1, 2007, and seeks to track the performance, before fees and expenses, of the Zacks 2010 Lifecycle Index.
The Zacks 2010 Lifecycle Index is an index consisting of securities from three broad asset classes: international equities, domestic equities, and fixed income that is designed to represent a diversified portfolio of securities. The Underlying Index automatically rebalances annually, or quarterly when necessary, along a "glidepath" designed to prudently maximize capital appreciation at its target date. "Glidepath" refers to the Underlying Index's asset allocation strategy over time. Gradually, the Underlying Index's allocation among the different classes of securities will adjust from a more aggressive allocation (emphasizing greater equity exposure) to a more conservative allocation (emphasizing greater fixed income exposure) as the target date approaches. After the target date, allocations shift from conservative to more moderately conservative allocations, allowing for a larger exposure to equities than at the target date.
Performance as of 11/30/07
| Cumulative Total Return | |
| | | Net Asset Value | | Market Price | | Zacks 2010
Lifecycle
Index | | Dow Jones
Target 2010
Index | |
| Since Inception1 | | | 0.16 | % | | | 0.06 | % | | | 1.45 | % | | | 1.82 | % | |
1 Total returns are calculated based on the commencement of trading, 10/1/07. The Zacks 2010 Lifecycle Index return is a price return and does not include dividend or interest payments. The Fund is new and has only a very short performance history. The returns shown may not be illustrative of longer-term performance.
The preceding performance chart is provided for comparative purposes and represents the period noted. The Fund's net asset value per share ("NAV") is calculated by dividing the value of the Fund's total assets less total liabilities by the number of shares outstanding. The market price return is based on the change in the market price on NYSE Arca of a share of the Fund from inception through November 30, 2007. The price used to calculate market price returns is the mid-point of the bid/ask spread for Fund shares at 4 p.m. Eastern Time on NYSE Arca. NAV and market returns assume that dividends and capital gain distributions have been reinvested in the Fund at NAV and market price, respectively. The Dow Jones Target Date Indexes are indexes whose allocations are automatically adjusted to reduce potential risk over time. Each index in the series allocates among U.S. stock, bond and cash subindexes on a monthly basis to measure predefined relative risk levels.
An index is a statistical measure of a specified financial market or sector. An index does not actually hold a portfolio of securities, incur expenses or pay any transaction costs. Therefore index returns do not reflect deductions for fees or expenses and are not available for direct investment. In comparison, the Fund's performance is negatively impacted by these deductions. Fund returns do not reflect brokerage commissions or taxes on transactions in Fund shares or that a shareholder would pay on Fund distributions. Total returns for a period less than one year have not been annualized.
Performance quoted represents past performance and does not guarantee future results. Current performance may be higher or lower than the performance quoted. Performance data current to the most recent month end may be obtained by visiting www.tdaxshares.com. Investment in the Fund poses investment risk including possible loss of principal. The investment return and principal value of an investment will fluctuate, so that shares, when sold or redeemed, may be worth more or less than their original cost. The total expense ratio in the most recent prospectus is estimated at 0.73%. Amerivest has agreed to cap the expense ratio at 0.65% until at least 9/30/08.
Top Ten Holdings2 as of 11/30/07
| Top Ten Equity Holdings | |
| Description | | Shares | | Market Value | | % of Net Assets | |
| Sun Microsystems, Inc. | | | 5,748 | | | $ | 119,442 | | | | 0.8 | % | |
| Exxon Mobil Corp. | | | 1,047 | | | | 93,350 | | | | 0.6 | % | |
| Procter & Gamble Co. (The) | | | 1,193 | | | | 88,281 | | | | 0.6 | % | |
| American Express Co. | | | 1,340 | | | | 79,032 | | | | 0.5 | % | |
| Pfizer, Inc. | | | 3,186 | | | | 75,700 | | | | 0.5 | % | |
| United Technologies Corp. | | | 947 | | | | 70,806 | | | | 0.5 | % | |
| Johnson & Johnson | | | 1,044 | | | | 70,721 | | | | 0.5 | % | |
| Motorola, Inc. | | | 4,426 | | | | 70,682 | | | | 0.5 | % | |
| Microsoft Corp. | | | 1,993 | | | | 66,964 | | | | 0.4 | % | |
| Altria Group, Inc. | | | 800 | | | | 62,048 | | | | 0.4 | % | |
| Top Ten Fixed Income Holdings | |
| Description | | Principal Amount | | Market Value | | % of Net Assets | |
| U.S. Treasury Note, 6.00, 8/15/09 | | | 1,374,000 | | | $ | 1,440,017 | | | | 9.4 | % | |
| Fed. Home Loan Mort. Corp., 4.50, 1/15/13 | | | 756,000 | | | | 771,887 | | | | 5.1 | % | |
| Fed. Natl. Mort. Assoc., 5.00, 9/15/08 | | | 541,000 | | | | 545,379 | | | | 3.6 | % | |
| U.S. Treasury Note, 4.75, 11/15/08 | | | 425,000 | | | | 430,910 | | | | 2.8 | % | |
| U.S. Treasury Note, 3.50, 2/15/10 | | | 405,000 | | | | 408,892 | | | | 2.7 | % | |
| Citigroup, Inc., 6.00, 2/21/12 | | | 362,000 | | | | 374,843 | | | | 2.5 | % | |
| Fed. Natl. Mort. Assoc., 5.00, 4/15/15 | | | 350,000 | | | | 364,982 | | | | 2.4 | % | |
| Merrill Lynch & Co., Inc., 5.00, 1/15/15 | | | 242,000 | | | | 228,253 | | | | 1.5 | % | |
| Goldman Sachs Grp. L.P., 5.00, 10/01/14 | | | 212,000 | | | | 207,190 | | | | 1.4 | % | |
| Wachovia Corp., 5.25, 8/01/14 | | | 212,000 | | | | 206,697 | | | | 1.4 | % | |
2 Holdings are subject to change without notice and there is no guarantee that the Fund will remain invested in any particular security. For a complete list of holdings go to www.tdaxshares.com.
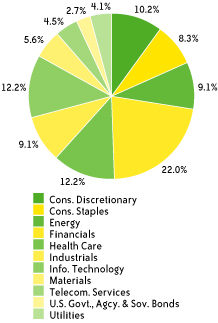
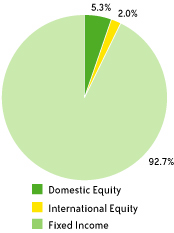
Asset Class Breakdown
as of 11/30/07*
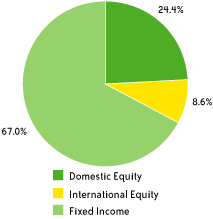
Sector Breakdown as of 11/30/07*
*Weightings are expressed as a percentage of total investments and may change over time. The sector classifications used above are based on company classifications under Global Industry Classification Standards (GICS).
2
TDAX Funds, Inc.
PERFORMANCE SUMMARY
TDAX Independence 2020 Exchange-Traded Fund (TDH)
The TDAX Independence 2020 Exchange-Traded Fund commenced investment operations and began trading on NYSE Arca, Inc. ("NYSE Arca") on October 1, 2007, and seeks to track the performance, before fees and expenses, of the Zacks 2020 Lifecycle Index.
The Zacks 2020 Lifecycle Index is an index consisting of securities from three broad asset classes: international equities, domestic equities, and fixed income that is designed to represent a diversified portfolio of securities. The Underlying Index automatically rebalances annually, or quarterly when necessary, along a "glidepath" designed to prudently maximize capital appreciation at its target date. "Glidepath" refers to the Underlying Index's asset allocation strategy over time. Gradually, the Underlying Index's allocation among the different classes of securities will adjust from a more aggressive allocation (emphasizing greater equity exposure) to a more conservative allocation (emphasizing greater fixed income exposure) as the target date approaches. After the target date, allocations shift from conservative to more moderately conservative allocations, allowing for a larger exposure to equities than at the target date.
Performance as of 11/30/07
| Cumulative Total Return | |
| | | Net Asset Value | | Market Price | | Zacks 2020
Lifecycle
Index | | Dow Jones
Target 2020
Index | |
| Since Inception1 | | | -1.14 | % | | | -0.96 | % | | | 1.64 | % | | | -0.03 | % | |
1 Total returns are calculated based on the commencement of trading, 10/1/07. The Zacks 2020 Lifecycle Index return is a price return and does not include dividend or interest payments. The Fund is new and has only a very short performance history. The returns shown may not be illustrative of longer-term performance.
The preceding performance chart is provided for comparative purposes and represents the period noted. The Fund's net asset value per share ("NAV") is calculated by dividing the value of the Fund's total assets less total liabilities by the number of shares outstanding. The market price return is based on the change in the market price on NYSE Arca of a share of the Fund from inception through November 30, 2007. The price used to calculate market price returns is the mid-point of the bid/ask spread for Fund shares at 4 p.m. Eastern Time on NYSE Arca. NAV and market returns assume that dividends and capital gain distributions have been reinvested in the Fund at NAV and market price, respectively. The Dow Jones Target Date Indexes are indexes whose allocations are automatically adjusted to reduce potential risk over time. Each index in the series allocates among U.S. stock, bond and cash subindexes on a monthly basis to measure predefined relative risk levels.
An index is a statistical measure of a specified financial market or sector. An index does not actually hold a portfolio of securities, incur expenses or pay any transaction costs. Therefore index returns do not reflect deductions for fees or expenses and are not available for direct investment. In comparison, the Fund's performance is negatively impacted by these deductions. Fund returns do not reflect brokerage commissions or taxes on transactions in Fund shares or that a shareholder would pay on Fund distributions. Total returns for a period less than one year have not been annualized.
Performance quoted represents past performance and does not guarantee future results. Current performance may be higher or lower than the performance quoted. Performance data current to the most recent month end may be obtained by visiting www.tdaxshares.com. Investment in the Fund poses investment risk including possible loss of principal. The investment return and principal value of an investment will fluctuate, so that shares, when sold or redeemed, may be worth more or less than their original cost. The total expense ratio in the most recent prospectus is estimated at 0.73%. Amerivest has agreed to cap the expense ratio at 0.65% until at least 9/30/08.
Top Ten Holdings2 as of 11/30/07
| Top Ten Equity Holdings | |
| Description | | Shares | | Market Value | | % of Net Assets | |
| Sun Microsystems, Inc. | | | 22,122 | | | $ | 459,694 | | | | 1.5 | % | |
| Exxon Mobil Corp. | | | 4,053 | | | | 361,364 | | | | 1.2 | % | |
| Procter & Gamble Co. | | | 4,628 | | | | 342,471 | | | | 1.1 | % | |
| American Express Co. | | | 5,472 | | | | 322,738 | | | | 1.1 | % | |
| Pfizer, Inc. | | | 12,562 | | | | 298,472 | | | | 1.0 | % | |
| Motorola, Inc. | | | 17,775 | | | | 283,866 | | | | 0.9 | % | |
| United Technologies Corp. | | | 3,749 | | | | 280,312 | | | | 0.9 | % | |
| Johnson & Johnson | | | 3,987 | | | | 270,079 | | | | 0.9 | % | |
| Microsoft Corp. | | | 7,745 | | | | 260,232 | | | | 0.9 | % | |
| Exelon Corp. | | | 3,003 | | | | 243,453 | | | | 0.8 | % | |
| Top Ten Fixed Income Holdings | |
| Description | | Principal Amount | | Market Value | | % of Net Assets | |
| Fed. Home Loan Mort. Corp., 4.50, 1/15/13 | | | 483,000 | | | $ | 493,150 | | | | 1.6 | % | |
| U.S. Treasury Bond, 7.625, 2/15/25 | | | 351,000 | | | | 485,285 | | | | 1.6 | % | |
| U.S. Treasury Bond, 8.125, 8/15/19 | | | 357,000 | | | | 484,851 | | | | 1.6 | % | |
| Citigroup, Inc., 6.00, 2/21/12 | | | 402,000 | | | | 416,262 | | | | 1.4 | % | |
| Fed. Home Loan Mort. Corp., 6.25, 7/15/32 | | | 342,000 | | | | 404,024 | | | | 1.3 | % | |
| U.S. Treasury Bond, 6.25, 5/15/30 | | | 235,000 | | | | 295,843 | | | | 1.0 | % | |
| HSBC Finance Corp., 6.375, 11/27/12 | | | 271,000 | | | | 283,191 | | | | 0.9 | % | |
| Morgan Stanley, 5.30, 3/01/13 | | | 277,000 | | | | 274,752 | | | | 0.9 | % | |
| US Treasury Note, 4.75, 5/15/14 | | | 255,000 | | | | 271,336 | | | | 0.9 | % | |
| Goldman Sachs Grp. L.P., 5.00, 10/01/14 | | | 271,000 | | | | 264,852 | | | | 0.9 | % | |
2 Holdings are subject to change without notice and there is no guarantee that the Fund will remain invested in any particular security. For a complete list of holdings go to www.tdaxshares.com.
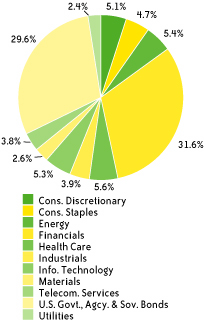
Asset Class Breakdown
as of 11/30/07*
Sector Breakdown as of 11/30/07*

*Weightings are expressed as a percentage of total investments and may change over time. The sector classifications used above are based on company classifications under Global Industry Classification Standards (GICS).
3
TDAX Funds, Inc.
PERFORMANCE SUMMARY
TDAX Independence 2030 Exchange-Traded Fund (TDN)
The TDAX Independence 2030 Exchange-Traded Fund commenced investment operations and began trading on NYSE Arca, Inc. ("NYSE Arca") on October 1, 2007, and seeks to track the performance, before fees and expenses, of the Zacks 2030 Lifecycle Index.
The Zacks 2030 Lifecycle Index is an index consisting of securities from three broad asset classes: international equities, domestic equities, and fixed income that is designed to represent a diversified portfolio of securities. The Underlying Index automatically rebalances annually, or quarterly when necessary, along a "glidepath" designed to prudently maximize capital appreciation at its target date. "Glidepath" refers to the Underlying Index's asset allocation strategy over time. Gradually, the Underlying Index's allocation among the different classes of securities will adjust from a more aggressive allocation (emphasizing greater equity exposure) to a more conservative allocation (emphasizing greater fixed income exposure) as the target date approaches. After the target date, allocations shift from conservative to more moderately conservative allocations, allowing for a larger exposure to equities than at the target date.
Performance as of 11/30/07
| Cumulative Total Return | |
| | | Net Asset Value | | Market Price | | Zacks 2030
Lifecycle
Index | | Dow Jones
Target 2030
Index | |
| Since Inception1 | | | -2.27 | % | | | -2.18 | % | | | -0.09 | % | | | -1.45 | % | |
1 Total returns are calculated based on the commencement of trading, 10/1/07. The Zacks 2030 Lifecycle Index return is a price return and does not include dividend or interest payments. The Fund is new and has only a very short performance history. The returns shown may not be illustrative of longer-term performance.
The preceding performance chart is provided for comparative purposes and represents the period noted. The Fund's net asset value per share ("NAV") is calculated by dividing the value of the Fund's total assets less total liabilities by the number of shares outstanding. The market price return is based on the change in the market price on NYSE Arca of a share of the Fund from inception through November 30, 2007. The price used to calculate market price returns is the mid-point of the bid/ask spread for Fund shares at 4 p.m. Eastern Time on NYSE Arca. NAV and market returns assume that dividends and capital gain distributions have been reinvested in the Fund at NAV and market price, respectively. The Dow Jones Target Date Indexes are indexes whose allocations are automatically adjusted to reduce potential risk over time. Each index in the series allocates among U.S. stock, bond and cash subindexes on a monthly basis to measure predefined relative risk levels.
An index is a statistical measure of a specified financial market or sector. An index does not actually hold a portfolio of securities, incur expenses or pay any transaction costs. Therefore index returns do not reflect deductions for fees or expenses and are not available for direct investment. In comparison, the Fund's performance is negatively impacted by these deductions. Fund returns do not reflect brokerage commissions or taxes on transactions in Fund shares or that a shareholder would pay on Fund distributions. Total returns for a period less than one year have not been annualized.
Performance quoted represents past performance and does not guarantee future results. Current performance may be higher or lower than the performance quoted. Performance data current to the most recent month end may be obtained by visiting www.tdaxshares.com. Investment in the Fund poses investment risk including possible loss of principal. The investment return and principal value of an investment will fluctuate, so that shares, when sold or redeemed, may be worth more or less than their original cost. The total expense ratio in the most recent prospectus is estimated at 0.73%. Amerivest has agreed to cap the expense ratio at 0.65% until at least 9/30/08.
Top Ten Holdings2 as of 11/30/07
| Top Ten Equity Holdings | |
| Description | | Shares | | Market Value | | % of Net Assets | |
| Sun Microsystems, Inc. | | | 24,606 | | | $ | 511,313 | | | | 2.0 | % | |
| Exxon Mobil Corp. | | | 4,496 | | | | 400,863 | | | | 1.6 | % | |
| Procter & Gamble Co. (The) | | | 5,148 | | | | 380,953 | | | | 1.5 | % | |
| American Express Co. | | | 6,338 | | | | 373,814 | | | | 1.5 | % | |
| Pfizer, Inc. | | | 14,098 | | | | 334,969 | | | | 1.3 | % | |
| Motorola, Inc. | | | 19,681 | | | | 314,306 | | | | 1.3 | % | |
| Johnson & Johnson | | | 4,606 | | | | 312,011 | | | | 1.2 | % | |
| United Technologies Corp. | | | 4,161 | | | | 311,117 | | | | 1.2 | % | |
| Chevron Corp. | | | 3,271 | | | | 287,096 | | | | 1.1 | % | |
| Microsoft Corp. | | | 8,172 | | | | 274,579 | | | | 1.1 | % | |
| Top Ten Fixed Income Holdings | |
| Description | | Principal Amount | | Market Value | | % of Net Assets | |
| U.S. Treasury Note, 4.75, 5/15/14 | | | 127,000 | | | $ | 135,136 | | | | 0.5 | % | |
| U.S. Treasury Bond, 6.25, 5/15/30 | | | 103,000 | | | | 129,667 | | | | 0.5 | % | |
| Fed. Home Loan Mort. Corp., 6.25, 7/15/32 | | | 109,000 | | | | 128,768 | | | | 0.5 | % | |
| Lincoln National Corp., 7.00, 5/17/66 | | | 109,000 | | | | 109,042 | | | | 0.4 | % | |
| Travelers Cos., Inc. (The), 6.25, 3/15/37 | | | 104,000 | | | | 98,776 | | | | 0.4 | % | |
| U.S. Treasury Bond, 8.125, 8/15/19 | | | 70,000 | | | | 95,069 | | | | 0.4 | % | |
| U.S. Treasury Note, 3.50, 2/15/10 | | | 84,000 | | | | 84,807 | | | | 0.3 | % | |
| American Gen. Fin. Corp., 5.375, 10/01/12 | | | 84,000 | | | | 83,920 | | | | 0.3 | % | |
| Procter & Gamble Co. (The), 5.55, 3/05/37 | | | 79,000 | | | | 79,163 | | | | 0.3 | % | |
| American Express Co., 6.80, 9/01/66 | | | 68,000 | | | | 70,052 | | | | 0.3 | % | |
2 Holdings are subject to change without notice and there is no guarantee that the Fund will remain invested in any particular security. For a complete list of holdings go to www.tdaxshares.com.
Asset Class Breakdown
as of 11/30/07*

Sector Breakdown as of 11/30/07*
*Weightings are expressed as a percentage of total investments and may change over time. The sector classifications used above are based on company classifications under Global Industry Classification Standards (GICS).
4
TDAX Funds, Inc.
PERFORMANCE SUMMARY
TDAX Independence 2040 Exchange-Traded Fund (TDV)
The TDAX Independence 2040 Exchange-Traded Fund commenced investment operations and began trading on NYSE Arca, Inc. ("NYSE Arca") on October 1, 2007, and seeks to track the performance, before fees and expenses, of the Zacks 2040 Lifecycle Index.
The Zacks 2040 Lifecycle Index is an index consisting of securities from three broad asset classes: international equities, domestic equities, and fixed income that is designed to represent a diversified portfolio of securities. The Underlying Index automatically rebalances annually, or quarterly when necessary, along a "glidepath" designed to prudently maximize capital appreciation at its target date. "Glidepath" refers to the Underlying Index's asset allocation strategy over time. Gradually, the Underlying Index's allocation among the different classes of securities will adjust from a more aggressive allocation (emphasizing greater equity exposure) to a more conservative allocation (emphasizing greater fixed income exposure) as the target date approaches. After the target date, allocations shift from conservative to more moderately conservative allocations, allowing for a larger exposure to equities than at the target date.
Performance as of 11/30/07
| Cumulative Total Return | |
| | | Net Asset Value | | Market Price | | Zacks 2040
Lifecycle
Index | | Dow Jones
Target 2040
Index | |
| Since Inception1 | | | -2.61 | % | | | -2.43 | % | | | -1.85 | % | | | -2.14 | % | |
1 Total returns are calculated based on the commencement of trading, 10/1/07. The Zacks 2040 Lifecycle Index return is a price return and does not include dividend or interest payments. The Fund is new and has only a very short performance history. The returns shown may not be illustrative of longer-term performance.
The preceding performance chart is provided for comparative purposes and represents the period noted. The Fund's net asset value per share ("NAV") is calculated by dividing the value of the Fund's total assets less total liabilities by the number of shares outstanding. The market price return is based on the change in the market price on NYSE Arca of a share of the Fund from inception through November 30, 2007. The price used to calculate market price returns is the mid-point of the bid/ask spread for Fund shares at 4 p.m. Eastern Time on NYSE Arca. NAV and market returns assume that dividends and capital gain distributions have been reinvested in the Fund at NAV and market price, respectively. The Dow Jones Target Date Indexes are indexes whose allocations are automatically adjusted to reduce potential risk over time. Each index in the series allocates among U.S. stock, bond and cash subindexes on a monthly basis to measure predefined relative risk levels.
An index is a statistical measure of a specified financial market or sector. An index does not actually hold a portfolio of securities, incur expenses or pay any transaction costs. Therefore index returns do not reflect deductions for fees or expenses and are not available for direct investment. In comparison, the Fund's performance is negatively impacted by these deductions. Fund returns do not reflect brokerage commissions or taxes on transactions in Fund shares or that a shareholder would pay on Fund distributions. Total returns for a period less than one year have not been annualized.
Performance quoted represents past performance and does not guarantee future results. Current performance may be higher or lower than the performance quoted. Performance data current to the most recent month end may be obtained by visiting www.tdaxshares.com. Investment in the Fund poses investment risk including possible loss of principal. The investment return and principal value of an investment will fluctuate, so that shares, when sold or redeemed, may be worth more or less than their original cost. The total expense ratio in the most recent prospectus is estimated at 0.73%. Amerivest has agreed to cap the expense ratio at 0.65% until at least 9/30/08.
Top Ten Holdings2 as of 11/30/07
| Top Ten Equity Holdings | |
| Description | | Shares | | Market Value | | % of Net Assets | |
| Sun Microsystems, Inc. | | | 26,624 | | | $ | 553,247 | | | | 2.2 | % | |
| Exxon Mobil Corp. | | | 4,844 | | | | 431,890 | | | | 1.7 | % | |
| Procter & Gamble Co. (The) | | | 5,566 | | | | 411,883 | | | | 1.6 | % | |
| American Express Co. | | | 6,837 | | | | 403,246 | | | | 1.6 | % | |
| Pfizer, Inc. | | | 15,226 | | | | 361,771 | | | | 1.4 | % | |
| Motorola, Inc. | | | 21,516 | | | | 343,611 | | | | 1.4 | % | |
| United Technologies Corp. | | | 4,518 | | | | 337,811 | | | | 1.4 | % | |
| Johnson & Johnson | | | 4,718 | | | | 319,597 | | | | 1.3 | % | |
| General Electric Co. | | | 7,863 | | | | 301,074 | | | | 1.2 | % | |
| Exelon Corp. | | | 3,672 | | | | 297,688 | | | | 1.2 | % | |
| Top Ten Fixed Income Holdings | |
| Description | | Principal Amount | | Market Value | | % of Net Assets | |
| U.S. Treasury Bond, 7.50, 11/15/16 | | | 44,000 | | | $ | 55,478 | | | | 0.2 | % | |
| Fed. Home Loan Mort. Corp., 6.25, 7/15/32 | | | 45,000 | | | | 53,161 | | | | 0.2 | % | |
| American Express Co., 6.80, 9/01/66 | | | 40,000 | | | | 41,206 | | | | 0.2 | % | |
| Bristol-Myers Squibb Co., 5.875, 11/15/36 | | | 28,000 | | | | 27,883 | | | | 0.1 | % | |
| Procter & Gamble Co. (The), 5.55, 3/05/37 | | | 26,000 | | | | 26,053 | | | | 0.1 | % | |
| Eli Lilly & Co., 5.55, 3/15/37 | | | 26,000 | | | | 25,417 | | | | 0.1 | % | |
| U.S. Treasury Note, 3.50, 2/15/10 | | | 25,000 | | | | 25,240 | | | | 0.1 | % | |
| Lincoln National Corp., 7.00, 5/17/66 | | | 25,000 | | | | 25,009 | | | | 0.1 | % | |
| Travelers Cos., Inc. (The), 6.25, 3/15/37 | | | 26,000 | | | | 24,694 | | | | 0.1 | % | |
| Burlington Northern Santa Fe Corp., 6.15, 5/01/37 | | | 25,000 | | | | 24,680 | | | | 0.1 | % | |
2 Holdings are subject to change without notice and there is no guarantee that the Fund will remain invested in any particular security. For a complete list of holdings go to www.tdaxshares.com.
Asset Class Breakdown
as of 11/30/07*

Sector Breakdown as of 11/30/07*

*Weightings are expressed as a percentage of total investments and may change over time. The sector classifications used above are based on company classifications under Global Industry Classification Standards (GICS).
5
TDAX Funds, Inc.
PERFORMANCE SUMMARY
TDAX Independence In-Target Exchange-Traded Fund (TDX)
The TDAX Independence In-Target Exchange-Traded Fund commenced investment operations and began trading on NYSE Arca, Inc. ("NYSE Arca") on October 1, 2007, and seeks to track the performance, before fees and expenses, of the Zacks In-Target Lifecycle Index.
The Zacks In-Target Lifecycle Index is an index consisting of securities from three broad asset classes: international equities, domestic equities, and fixed income that is designed to represent a diversified portfolio of securities. The Zacks In-Target Lifecycle Index is designed for persons who are at or near their target date and therefore has a conservative allocation (emphasis on greater fixed income exposure). Allocations will now begin to shift from conservative to more moderately conservative allocations, allowing for a larger exposure to equities than at inception.
Performance as of 11/30/07
| Cumulative Total Return | |
| | | Net Asset Value | | Market Price | | Zacks In-Target
Lifecycle
Index | | Dow Jones
Target Today
Index | |
| Since Inception1 | | | 1.08 | % | | | 0.26 | % | | | -0.02 | % | | | 1.52 | % | |
1 Total returns are calculated based on the commencement of trading, 10/1/07. The Zacks In-Target Lifecycle Index return is a price return and does not include dividend or interest payments. The Fund is new and has only a very short performance history. The returns shown may not be illustrative of longer-term performance.
The preceding performance chart is provided for comparative purposes and represents the period noted. The Fund's net asset value per share ("NAV") is calculated by dividing the value of the Fund's total assets less total liabilities by the number of shares outstanding. The market price return is based on the change in the market price on NYSE Arca of a share of the Fund from inception through November 30, 2007. The price used to calculate market price returns is the mid-point of the bid/ask spread for Fund shares at 4 p.m. Eastern Time on NYSE Arca. NAV and market returns assume that dividends and capital gain distributions have been reinvested in the Fund at NAV and market price, respectively. The Dow Jones Target Date Indexes are indexes whose allocations are automatically adjusted to reduce potential risk over time. Each index in the series allocates among U.S stock, bond and cash subindexes on a monthly basis to measure predefined relative risk levels.
An index is a statistical measure of a specified financial market or sector. An index does not actually hold a portfolio of securities, incur expenses or pay any transaction costs. Therefore index returns do not reflect deductions for fees or expenses and are not available for direct investment. In comparison, the Fund's performance is negatively impacted by these deductions. Fund returns do not reflect brokerage commissions or taxes on transactions in Fund shares or that a shareholder would pay on Fund distributions. Total returns for a period less than one year have not been annualized.
Performance quoted represents past performance and does not guarantee future results. Current performance may be higher or lower than the performance quoted. Performance data current to the most recent month end may be obtained by visiting www.tdaxshares.com. Investment in the Fund poses investment risk including possible loss of principal. The investment return and principal value of an investment will fluctuate, so that shares, when sold or redeemed, may be worth more or less than their original cost. The total expense ratio in the most recent prospectus is estimated at 0.73%. Amerivest has agreed to cap the expense ratio at 0.65% until at least 9/30/08.
Top Ten Holdings2 as of 11/30/07
| Top Ten Equity Holdings | |
| Description | | Shares | | Market Value | | % of Net Assets | |
| Exxon Mobil Corp. | | | 334 | | | $ | 29,780 | | | | 0.2 | % | |
| Sun Microsystems, Inc. | | | 1,206 | | | | 25,060 | | | | 0.2 | % | |
| Procter & Gamble Co. (The) | | | 331 | | | | 24,494 | | | | 0.2 | % | |
| Johnson & Johnson | | | 334 | | | | 22,626 | | | | 0.1 | % | |
| American Express Co. | | | 361 | | | | 21,292 | | | | 0.1 | % | |
| Wal-Mart Stores, Inc. | | | 361 | | | | 17,292 | | | | 0.1 | % | |
| Pfizer, Inc. | | | 719 | | | | 17,083 | | | | 0.1 | % | |
| Motorola, Inc. | | | 1,049 | | | | 16,753 | | | | 0.1 | % | |
| Chevron Corp. | | | 184 | | | | 16,150 | | | | 0.1 | % | |
| Bank of America Corp. | | | 334 | | | | 15,407 | | | | 0.1 | % | |
| Top Ten Fixed Income Holdings | |
| Description | | Principal Amount | | Market Value | | % of Net Assets | |
| U.S. Treasury Note, 4.375, 12/31/07 | | | 1,676,000 | | | $ | 1,677,310 | | | | 11.0 | % | |
| U.S. Treasury Note, 4.875, 8/15/09 | | | 1,365,000 | | | | 1,404,671 | | | | 9.2 | % | |
| U.S. Treasury Note, 3.125, 9/15/08 | | | 1,350,000 | | | | 1,348,946 | | | | 8.9 | % | |
| U.S. Treasury Note, 4.625, 9/15/08 | | | 1,320,000 | | | | 1,324,435 | | | | 8.7 | % | |
| U.S. Treasury Note, 4.75, 11/15/08 | | | 1,138,000 | | | | 1,153,826 | | | | 7.6 | % | |
| U.S. Treasury Note, 3.75, 5/15/08 | | | 1,139,000 | | | | 1,141,670 | | | | 7.5 | % | |
| U.S. Treasury Note, 3.50, 2/15/10 | | | 870,000 | | | | 878,361 | | | | 5.8 | % | |
| U.S. Treasury Note, 2.625, 3/15/09 | | | 616,000 | | | | 612,246 | | | | 4.0 | % | |
| U.S. Treasury Note, 3.875, 7/15/10 | | | 496,000 | | | | 506,657 | | | | 3.3 | % | |
| U.S. Treasury Note, 4.50, 5/15/10 | | | 466,000 | | | | 482,383 | | | | 3.2 | % | |
2 Holdings are subject to change without notice and there is no guarantee that the Fund will remain invested in any particular security. For a complete list of holdings go to www.tdaxshares.com.
Asset Class Breakdown
as of 11/30/07*
Sector Breakdown as of 11/30/07*

*Weightings are expressed as a percentage of total investments and may change over time. The sector classifications used above are based on company classifications under Global Industry Classification Standards (GICS). Sectors representing less than 1% of total investments are included in Other.
6
TDAX Funds, Inc.
FEES AND EXPENSES (UNAUDITED)
As a shareholder of one or more of the various TDAX Independence ETFs (each, a "Fund"), you incur advisory fees and other Fund expenses. The expense examples below are intended to help you understand your ongoing costs (in dollars) of investing in the Fund and to compare these costs with the ongoing costs of investing in other funds.
The example is based on an investment of $1,000 invested at the beginning of the period (in this case, since inception) and held through the period ended November 30, 2007.
ACTUAL EXPENSES
The first line in the following tables provides information about actual account values and actual expenses. You may use the information in this line, together with the amount you invested, to estimate the expenses that you paid over the period. Simply divide your account value by $1,000 (for example, an $8,600 account value divided by $1,000 = 8.6), then multiply the result by the number in the first line under the heading "Expenses Paid During the Period" to estimate the expenses you paid on your account during this period.
HYPOTHETICAL EXAMPLE FOR COMPARISON PURPOSES
The second line in the following tables provides information about hypothetical account values and hypothetical expenses based on the Funds' actual expense ratio and an assumed rate of return of 5% per year before expenses (which is not the Funds' actual return). The hypothetical account values and expenses may not be used to estimate the actual ending account balance or expenses you paid for the period. You may use this information to compare the ongoing costs of investing in the Fund and other funds. To do so, compare this 5% hypothetical example with the 5% hypothetical examples that appear in the shareholder reports of the other funds.
Please note that the expenses shown in the tables are meant to highlight your ongoing costs only, and do not reflect any transactional costs. Therefore the second line in the table is useful in comparing ongoing costs only, and will not help you determine the relative total costs of owning different funds. In addition, if these transactional costs were included, your costs would have been higher.
| | | Beginning
Account Value
October 1, 2007
(Commencement of
Investment Operations) | | Ending
Account Value
November 30, 2007 | | Annualized
Expense Ratio(1)
based on the number of
days in the period | | Expenses Paid
During the Period(2)
October 1, 2007
(Commencement of
Investment Operations) to
November 30, 2007 | |
TDAX Independence 2010
Exchange Traded-Fund | |
| Actual | | $ | 1,000.00 | | | $ | 1,001.60 | | | | 0.66 | % | | $ | 1.10 | | |
| Hypothetical (5% return before expenses) | | $ | 1,000.00 | | | $ | 1,021.72 | | | | 0.66 | % | | $ | 3.32 | | |
TDAX Independence 2020
Exchange Traded-Fund | |
| Actual | | $ | 1,000.00 | | | $ | 988.60 | | | | 0.65 | % | | $ | 1.08 | | |
| Hypothetical (5% return before expenses) | | $ | 1,000.00 | | | $ | 1,021.73 | | | | 0.65 | % | | $ | 3.31 | | |
TDAX Independence 2030
Exchange Traded-Fund | |
| Actual | | $ | 1,000.00 | | | $ | 977.30 | | | | 0.65 | % | | $ | 1.08 | | |
| Hypothetical (5% return before expenses) | | $ | 1,000.00 | | | $ | 1,021.73 | | | | 0.65 | % | | $ | 3.31 | | |
TDAX Independence 2040
Exchange Traded-Fund | |
| Actual | | $ | 1,000.00 | | | $ | 973.90 | | | | 0.65 | % | | $ | 1.08 | | |
| Hypothetical (5% return before expenses) | | $ | 1,000.00 | | | $ | 1,021.73 | | | | 0.65 | % | | $ | 3.31 | | |
TDAX Independence In-Target
Exchange Traded-Fund | |
| Actual | | $ | 1,000.00 | | | $ | 1,010.80 | | | | 0.66 | % | | $ | 1.10 | | |
| Hypothetical (5% return before expenses) | | $ | 1,000.00 | | | $ | 1,021.71 | | | | 0.66 | % | | $ | 3.33 | | |
(1) Amerivest Investment Management, LLC ("Amerivest"), a sub-advisor to the Funds, has contractually agreed to pay Fund operating expenses (excluding, among other things, acquired fund fees and expenses, interest, taxes, brokerage commissions and extraordinary expenses) in order to limit the Net Annual Operating Expenses for shares of each Fund to 0.65% of the Fund's average net assets (the "Expense Cap"). The Expense Cap will remain in effect until at least September 30, 2008. Amerivest is permitted to be reimbursed for fee reductions and/or expense payments made in the prior three fiscal years. This reimbursement may be requested by Amerivest if the aggregate amount actually paid by the Fund toward operating expenses for such fiscal year (taking into account the reimbursement) does not exceed the Expense Cap. Ratios would have been higher if fees were not reduced by Amerivest.
(2) Expenses are calculated using the annualized expense ratio, which represents the ongoing expenses as a percentage of net assets for the period October 1, 2007 (commencement of investment operations) to November 30, 2007. Expenses are calculated by multiplying the Fund's annualized expense ratio by the average account value for the period; then multiplying the result by 61 days and then dividing the result by 366.
7
TDAX Funds, Inc.
SCHEDULE OF INVESTMENTS
TDAX INDEPENDENCE 2010 EXCHANGE-TRADED FUND
November 30, 2007 (Unaudited)
| | | Number
of Shares | | Market
Value | |
| COMMON STOCKS—32.5% | |
| CONSUMER DISCRETIONARY—3.1% | |
| Aeropostale, Inc.* | | | 149 | | | $ | 3,807 | | |
| ArvinMeritor, Inc. | | | 449 | | | | 4,539 | | |
| Brookfield Homes Corp. | | | 449 | | | | 7,570 | | |
| Cabela's, Inc., Class A* | | | 149 | | | | 2,464 | | |
| Coach, Inc.* | | | 598 | | | | 22,210 | | |
| Collective Brands, Inc.* | | | 449 | | | | 6,883 | | |
| Comcast Corp., Class A* | | | 1,395 | | | | 28,653 | | |
Compagnie Financiere Richemont SA,
Class A (China) | | | 87 | | | | 5,987 | | |
| Daimler AG (Germany) | | | 48 | | | | 4,900 | | |
| DeVry, Inc. | | | 349 | | | | 19,188 | | |
| DIRECTV Group (The), Inc.* | | | 1,495 | | | | 37,181 | | |
| Fleetwood Enterprises, Inc.* | | | 1,349 | | | | 7,379 | | |
| Gemstar-TV Guide International, Inc.* | | | 745 | | | | 4,396 | | |
| Home Depot (The), Inc. | | | 449 | | | | 12,823 | | |
| HONDA MOTOR Co. Ltd. (Japan) | | | 300 | | | | 10,169 | | |
| J. Crew Group, Inc.* | | | 129 | | | | 6,198 | | |
| Jo-Ann Stores, Inc.* | | | 260 | | | | 4,280 | | |
| Jos. A. Bank Clothiers, Inc.* | | | 149 | | | | 3,858 | | |
| Lear Corp.* | | | 176 | | | | 5,181 | | |
| Liberty Global, Inc., Class A* | | | 490 | | | | 19,904 | | |
| Live Nation, Inc.* | | | 248 | | | | 3,328 | | |
| McDonald's Corp. | | | 598 | | | | 34,965 | | |
| Men's Wearhouse (The), Inc. | | | 149 | | | | 5,143 | | |
| New York & Co., Inc.* | | | 745 | | | | 5,491 | | |
| Omnicom Group, Inc. | | | 100 | | | | 4,875 | | |
| Sony Corp. (Japan) | | | 300 | | | | 16,254 | | |
| Sotheby's | | | 149 | | | | 5,580 | | |
| Steven Madden Ltd.* | | | 149 | | | | 3,387 | | |
| Target Corp. | | | 449 | | | | 26,967 | | |
| Tempur-Pedic International, Inc. | | | 349 | | | | 10,362 | | |
| Time Warner, Inc. | | | 1,193 | | | | 20,591 | | |
| Toyota Motor Corp. (Japan) | | | 900 | | | | 50,630 | | |
| Under Armour, Inc., Class A* | | | 69 | | | | 3,428 | | |
| Universal Technical Institute, Inc.* | | | 449 | | | | 7,916 | | |
| Viacom, Inc., Class B* | | | 837 | | | | 35,171 | | |
| Yum! Brands, Inc. | | | 745 | | | | 27,677 | | |
| | | | | | | | 479,335 | | |
| CONSUMER STAPLES—2.9% | |
| Altria Group, Inc. | | | 800 | | | | 62,048 | | |
| British American Tobacco PLC (United Kingdom) | | | 82 | | | | 3,182 | | |
| Carrefour SA (France) | | | 51 | | | | 3,961 | | |
| Coca-Cola (The) Co. | | | 900 | | | | 55,890 | | |
| ConAgra Foods, Inc. | | | 1,044 | | | | 26,121 | | |
| CVS Caremark Corp. | | | 449 | | | | 18,000 | | |
| Diageo PLC (United Kingdom) | | | 383 | | | | 8,607 | | |
| Groupe DANONE (France) | | | 9 | | | | 796 | | |
| Kraft Foods, Inc., Class A | | | 800 | | | | 27,640 | | |
| Longs Drug Stores Corp. | | | 149 | | | | 7,885 | | |
| Nestle SA (China) | | | 96 | | | | 46,170 | | |
| Pilgrim's Pride Corp. | | | 149 | | | | 3,886 | | |
| Procter & Gamble (The) Co. | | | 1,193 | | | | 88,281 | | |
| Reckitt Benckiser Group PLC (United Kingdom) | | | 51 | | | | 3,031 | | |
| Seaboard Corp. | | | 3 | | | | 4,527 | | |
| Tesco PLC (United Kingdom) | | | 1,262 | | | | 12,429 | | |
| | | Number
of Shares | | Market
Value | |
| CONSUMER STAPLES (Continued) | |
| Unilever NV (Netherlands) | | | 296 | | | $ | 10,493 | | |
| Wal-Mart Stores, Inc. | | | 1,193 | | | | 57,145 | | |
| | | | | | | | 440,092 | | |
| ENERGY—3.1% | |
| Alon USA Energy, Inc. | | | 149 | | | | 4,145 | | |
| BG Group PLC (United Kingdom) | | | 547 | | | | 11,450 | | |
| BP PLC (United Kingdom) | | | 3,879 | | | | 47,057 | | |
| Chevron Corp. | | | 598 | | | | 52,485 | | |
| ConocoPhillips | | | 598 | | | | 47,864 | | |
| Dril-Quip, Inc.* | | | 149 | | | | 8,407 | | |
| ENI S.p.A (Italy) | | | 281 | | | | 10,052 | | |
| EOG Resources, Inc. | | | 598 | | | | 49,501 | | |
| Exxon Mobil Corp. | | | 1,047 | | | | 93,350 | | |
| International Coal Group, Inc.* | | | 1,793 | | | | 8,983 | | |
| Newpark Resources, Inc.* | | | 891 | | | | 4,794 | | |
| Occidental Petroleum Corp. | | | 149 | | | | 10,396 | | |
| Oil States International, Inc.* | | | 149 | | | | 4,725 | | |
| Oilsands Quest, Inc.* | | | 1,145 | | | | 5,153 | | |
| PetroHawk Energy Corp.* | | | 296 | | | | 4,825 | | |
| Petroleum Development Corp.* | | | 149 | | | | 7,550 | | |
| Repsol YPF, S.A. (Spain) | | | 93 | | | | 3,437 | | |
Royal Dutch Shell PLC, Class A
(United Kingdom) | | | 712 | | | | 28,782 | | |
Royal Dutch Shell PLC, Class B
(United Kingdom) | | | 523 | | | | 20,991 | | |
| Schlumberger Ltd. (Netherlands Antilles) | | | 233 | | | | 21,774 | | |
| Total SA (France) | | | 224 | | | | 18,160 | | |
| W-H Energy Services, Inc.* | | | 149 | | | | 7,525 | | |
| | | | | | | | 471,406 | | |
| FINANCIALS—7.0% | |
| ABN AMRO Holding NV (Netherlands) | | | 221 | | | | 11,678 | | |
| Allianz SE (Germany) | | | 66 | | | | 13,660 | | |
| American Express Co. | | | 1,340 | | | | 79,032 | | |
| American International Group, Inc. | | | 249 | | | | 14,474 | | |
| Aspen Insurance Holdings Ltd. (Bermuda) | | | 146 | | | | 4,205 | | |
| Assicurazioni Generali S.p.A (Italy) | | | 30 | | | | 1,381 | | |
| Aviva PLC (United Kingdom) | | | 466 | | | | 6,535 | | |
| AXA (France) | | | 242 | | | | 9,921 | | |
| Banco Bilbao Vizcaya Argentaria, S.A. (Spain) | | | 149 | | | | 3,720 | | |
| Banco Santander S.A. (Spain) | | | 2,350 | | | | 50,499 | | |
| Bank of America Corp. | | | 745 | | | | 34,367 | | |
| Barclays PLC (United Kingdom) | | | 1,959 | | | | 22,678 | | |
| BNP Paribas (France) | | | 126 | | | | 14,269 | | |
| Charles Schwab (The) Corp. | | | 1,691 | | | | 41,108 | | |
| Citigroup, Inc. | | | 1,044 | | | | 34,765 | | |
| Commonwealth Bank of Australia (Australia) | | | 6 | | | | 317 | | |
| Credit Suisse Group (China) | | | 422 | | | | 25,472 | | |
| Deerfield Triarc Capital Corp. REIT | | | 1,909 | | | | 14,337 | | |
| Delphi Financial Group, Inc., Class A | | | 149 | | | | 5,728 | | |
| Deutsche Bank AG (Germany) | | | 12 | | | | 1,582 | | |
| Digital Realty Trust, Inc. REIT | | | 351 | | | | 13,394 | | |
| Dollar Financial Corp.* | | | 149 | | | | 4,452 | | |
| Fortis (Belgium) | | | 44 | | | | 1,183 | | |
| Franklin Resources, Inc. | | | 351 | | | | 43,235 | | |
| GFI Group, Inc.* | | | 149 | | | | 14,510 | | |
See Notes to Financial Statements.
8
TDAX Funds, Inc.
SCHEDULE OF INVESTMENTS (CONTINUED)
TDAX INDEPENDENCE 2010 EXCHANGE-TRADED FUND
November 30, 2007 (Unaudited)
| | | Number
of Shares | | Market
Value | |
| FINANCIALS (Continued) | |
| Goldman Sachs Group (The), Inc. | | | 100 | | | $ | 22,664 | | |
| HBOS PLC (United Kingdom) | | | 831 | | | | 13,635 | | |
| Highwoods Properties, Inc. REIT | | | 349 | | | | 11,074 | | |
| HSBC Holdings PLC (United Kingdom) | | | 2,276 | | | | 38,842 | | |
| ING Groep N.V. (Netherlands) | | | 413 | | | | 16,083 | | |
| International Securities Exchange Holdings, Inc. | | | 149 | | | | 10,011 | | |
| Intesa Sanpaolo S.p.A (Italy) | | | 368 | | | | 2,944 | | |
| JPMorgan Chase & Co. | | | 598 | | | | 27,281 | | |
| Lincoln National Corp. | | | 598 | | | | 36,819 | | |
| Lloyds TSB Group PLC (United Kingdom) | | | 1,773 | | | | 18,045 | | |
| Mizuho Financial Group, Inc. (Japan) | | | 1 | | | | 5,364 | | |
| Morgan Stanley | | | 100 | | | | 5,272 | | |
Muenchener Rueckversicherungs-Gesellschaft AG
(Germany) | | | 30 | | | | 5,483 | | |
| National City Corp. | | | 1,193 | | | | 23,574 | | |
| Nomura Holdings, Inc. (Japan) | | | 900 | | | | 16,130 | | |
| Nordea Bank AB (Sweden) | | | 1,200 | | | | 20,137 | | |
| Northern Trust Corp. | | | 349 | | | | 28,266 | | |
| NYSE Euronext | | | 380 | | | | 32,908 | | |
| Odyssey Re Holdings Corp. | | | 349 | | | | 13,450 | | |
| optionsXpress Holdings, Inc. | | | 449 | | | | 13,654 | | |
| Platinum Underwriters Holdings Ltd. (Bermuda) | | | 102 | | | | 3,705 | | |
| Post Properties, Inc. REIT | | | 149 | | | | 5,410 | | |
| Prudential PLC (United Kingdom) | | | 440 | | | | 6,143 | | |
| Realty Income Corp. REIT | | | 449 | | | | 12,797 | | |
Royal Bank of Scotland Group PLC
(United Kingdom) | | | 2,411 | | | | 22,754 | | |
| Simon Property Group, Inc. REIT | | | 249 | | | | 24,514 | | |
| SLM Corp.* | | | 598 | | | | 22,772 | | |
| Societe Generale (France) | | | 36 | | | | 5,579 | | |
| Sumitomo Mitsui Financial Group, Inc. (Japan) | | | 1 | | | | 8,573 | | |
| Swiss Re (China) | | | 72 | | | | 5,354 | | |
| UBS AG (China) | | | 616 | | | | 31,208 | | |
| UniCredito Italiano S.p.A (Italy) | | | 1,944 | | | | 16,622 | | |
| Vornado Realty Trust REIT | | | 149 | | | | 13,410 | | |
| Wachovia Corp. | | | 451 | | | | 19,393 | | |
| Waddell & Reed Financial, Inc., Class A | | | 149 | | | | 5,093 | | |
| Wells Fargo & Co. | | | 598 | | | | 19,393 | | |
| Westpac Banking Corp. (Australia) | | | 145 | | | | 3,633 | | |
| Zurich Financial Services AG (China) | | | 36 | | | | 10,498 | | |
| | | | | | | | 1,064,989 | | |
| HEALTH CARE—4.2% | |
| Abbott Laboratories | | | 598 | | | | 34,391 | | |
| Alexion Pharmaceuticals, Inc.* | | | 81 | | | | 5,890 | | |
| AMERIGROUP Corp.* | | | 351 | | | | 12,064 | | |
| AstraZeneca PLC (United Kingdom) | | | 212 | | | | 10,069 | | |
| Auxilium Pharmaceuticals, Inc.* | | | 269 | | | | 7,545 | | |
| Becton, Dickinson & Co. | | | 498 | | | | 41,200 | | |
| CIGNA Corp. | | | 498 | | | | 26,698 | | |
| Dendreon Corp.* | | | 703 | | | | 3,515 | | |
| Genzyme Corp.* | | | 598 | | | | 44,808 | | |
| GlaxoSmithKline PLC (United Kingdom) | | | 910 | | | | 24,100 | | |
| Hologic, Inc.* | | | 149 | | | | 9,892 | | |
| Illumina, Inc.* | | | 149 | | | | 8,611 | | |
| Johnson & Johnson | | | 1,044 | | | | 70,721 | | |
| Magellan Health Services, Inc.* | | | 149 | | | | 6,772 | | |
| Matria Healthcare, Inc.* | | | 449 | | | | 10,201 | | |
| | | Number
of Shares | | Market
Value | |
| HEALTH CARE (Continued) | |
| McKesson Corp. | | | 498 | | | $ | 33,232 | | |
| Merck & Co., Inc. | | | 745 | | | | 44,223 | | |
| Novartis AG (China) | | | 550 | | | | 31,347 | | |
| Pfizer, Inc. | | | 3,186 | | | | 75,700 | | |
| Roche Holding AG (China) | | | 194 | | | | 37,028 | | |
| Sanofi-Aventis SA (France) | | | 54 | | | | 5,153 | | |
| STERIS Corp. | | | 149 | | | | 4,166 | | |
| Takeda Pharmaceutical Co. Ltd. (Japan) | | | 100 | | | | 6,401 | | |
| Thermo Fisher Scientific, Inc.* | | | 745 | | | | 42,942 | | |
| UnitedHealth Group, Inc. | | | 449 | | | | 24,695 | | |
| Ventana Medical Systems, Inc.* | | | 149 | | | | 13,234 | | |
| WellPoint, Inc.* | | | 149 | | | | 12,547 | | |
| | | | | | | | 647,145 | | |
| INDUSTRIALS—3.3% | |
| ABB Ltd. (China) | | | 487 | | | | 14,312 | | |
| Aecom Technology Corp.* | | | 311 | | | | 8,269 | | |
| Allegiant Travel Co.* | | | 378 | | | | 13,381 | | |
| Boeing Co. | | | 351 | | | | 32,482 | | |
| Brady Corp., Class A | | | 349 | | | | 13,970 | | |
| Caterpillar, Inc. | | | 349 | | | | 25,093 | | |
| CDI Corp. | | | 449 | | | | 11,975 | | |
| Compagnie de Saint-Gobain (France) | | | 50 | | | | 4,936 | | |
| Danaher Corp. | | | 100 | | | | 8,682 | | |
| Emerson Electric Co. | | | 449 | | | | 25,602 | | |
| FedEx Corp. | | | 100 | | | | 9,847 | | |
| Fuel Tech, Inc.* | | | 675 | | | | 16,477 | | |
| General Electric Co. | | | 1,242 | | | | 47,555 | | |
| Granite Construction, Inc. | | | 149 | | | | 6,112 | | |
| IKON Office Solutions, Inc. | | | 149 | | | | 1,882 | | |
| Illinois Tool Works, Inc. | | | 149 | | | | 8,270 | | |
| Ingersoll-Rand Co., Ltd., Class A (Bermuda) | | | 90 | | | | 4,648 | | |
| JetBlue Airways Corp.* | | | 1,379 | | | | 9,653 | | |
Koninklijke (Royal) Philips Electronics N.V.
(Netherlands) | | | 203 | | | | 8,540 | | |
| Manpower, Inc. | | | 149 | | | | 9,104 | | |
| Mitsubishi Corp. (Japan) | | | 300 | | | | 8,600 | | |
| Northrop Grumman Corp. | | | 451 | | | | 35,534 | | |
| PHH Corp.* | | | 149 | | | | 3,302 | | |
| Raven Industries, Inc. | | | 349 | | | | 12,121 | | |
| Schneider Electric SA (France) | | | 9 | | | | 1,260 | | |
| Siemens AG (Germany) | | | 84 | | | | 12,789 | | |
| Simpson Manufacturing Co., Inc. | | | 449 | | | | 11,948 | | |
| Trane, Inc. | | | 598 | | | | 21,953 | | |
| Union Pacific Corp. | | | 100 | | | | 12,614 | | |
| United Parcel Service, Inc., Class B | | | 351 | | | | 25,862 | | |
| United Technologies Corp. | | | 947 | | | | 70,806 | | |
| | | | | | | | 497,579 | | |
| INFORMATION TECHNOLOGY—4.3% | |
| Accenture Ltd., Class A (Bermuda) | | | 239 | | | | 8,260 | | |
| Agilysys, Inc. | | | 149 | | | | 2,070 | | |
| Amkor Technology, Inc.* | | | 598 | | | | 4,928 | | |
| Ansoft Corp.* | | | 351 | | | | 10,183 | | |
| Benchmark Electronics, Inc.* | | | 149 | | | | 2,675 | | |
| CANON, Inc. (Japan) | | | 300 | | | | 15,713 | | |
| Cisco Systems, Inc.* | | | 1,044 | | | | 29,253 | | |
| eBay, Inc.* | | | 800 | | | | 26,824 | | |
See Notes to Financial Statements.
9
TDAX Funds, Inc.
SCHEDULE OF INVESTMENTS (CONTINUED)
TDAX INDEPENDENCE 2010 EXCHANGE-TRADED FUND
November 30, 2007 (Unaudited)
| | | Number
of Shares | | Market
Value | |
| INFORMATION TECHNOLOGY (Continued) | |
| Entegris, Inc.* | | | 296 | | | $ | 2,563 | | |
| FLIR Systems, Inc.* | | | 149 | | | | 10,241 | | |
| Foundry Networks, Inc.* | | | 449 | | | | 7,916 | | |
| Hewlett-Packard Co. | | | 449 | | | | 22,971 | | |
| Intel Corp. | | | 1,146 | | | | 29,888 | | |
| International Business Machines Corp. | | | 149 | | | | 15,672 | | |
| Ixia* | | | 900 | | | | 9,297 | | |
| Jack Henry & Associates, Inc. | | | 149 | | | | 3,987 | | |
| Juniper Networks, Inc.* | | | 598 | | | | 17,773 | | |
| Lawson Software, Inc.* | | | 628 | | | | 6,104 | | |
| Microsoft Corp. | | | 1,993 | | | | 66,964 | | |
| Motorola, Inc. | | | 4,426 | | | | 70,682 | | |
| MPS Group, Inc.* | | | 149 | | | | 1,654 | | |
| Nintendo Co. Ltd. (Japan) | | | 4 | | | | 2,434 | | |
| Nokia Oyj (Finland) | | | 775 | | | | 31,022 | | |
| Nuance Communications, Inc.* | | | 658 | | | | 13,278 | | |
| ON Semiconductor Corp.* | | | 598 | | | | 5,496 | | |
| Orbcomm, Inc.* | | | 1,548 | | | | 12,059 | | |
| Perficient, Inc.* | | | 449 | | | | 7,530 | | |
| Perot Systems Corp., Class A* | | | 451 | | | | 5,931 | | |
| SAIC, Inc.* | | | 568 | | | | 11,326 | | |
| SAP AG (Germany) | | | 127 | | | | 6,513 | | |
| SAVVIS, Inc.* | | | 143 | | | | 4,582 | | |
| Sonus Networks, Inc.* | | | 721 | | | | 4,744 | | |
| Sun Microsystems, Inc.* | | | 5,748 | | | | 119,442 | | |
| Sybase, Inc.* | | | 149 | | | | 3,820 | | |
| Symantec Corp.* | | | 1,047 | | | | 18,637 | | |
| Telefonaktiebolaget LM Ericsson (Sweden) | | | 6,000 | | | | 14,652 | | |
| ValueClick, Inc.* | | | 449 | | | | 10,614 | | |
| Veeco Instruments, Inc.* | | | 449 | | | | 7,534 | | |
| Xerox Corp. | | | 745 | | | | 12,576 | | |
| | | | | | | | 657,808 | | |
| MATERIALS—1.9% | |
| A. Schulman, Inc. | | | 149 | | | | 3,212 | | |
| Alcoa, Inc. | | | 449 | | | | 16,330 | | |
| Anglo American PLC (United Kingdom) | | | 403 | | | | 27,229 | | |
| ArcelorMittal (Luxembourg) | | | 75 | | | | 5,550 | | |
| BASF AG (Germany) | | | 30 | | | | 4,173 | | |
| Bayer AG (Germany) | | | 48 | | | | 3,970 | | |
| BHP Billiton Ltd. (Australia) | | | 416 | | | | 15,813 | | |
| BHP Billiton PLC (United Kingdom) | | | 604 | | | | 19,958 | | |
| CF Industries Holdings, Inc. | | | 149 | | | | 13,556 | | |
| Dow Chemical (The) Co. | | | 349 | | | | 14,637 | | |
| E.I. du Pont de Nemours & Co. | | | 449 | | | | 20,721 | | |
| Headwaters, Inc.* | | | 149 | | | | 1,788 | | |
| JFE Holdings, Inc. (Japan) | | | 302 | | | | 16,471 | | |
| NIPPON STEEL Corp. (Japan) | | | 3,000 | | | | 17,985 | | |
| Quanex Corp. | | | 149 | | | | 7,456 | | |
| Rio Tinto PLC (United Kingdom) | | | 218 | | | | 25,281 | | |
| Southern Copper Corp. | | | 249 | | | | 27,551 | | |
| Terra Industries, Inc.* | | | 319 | | | | 12,052 | | |
| Weyerhaeuser Co. | | | 349 | | | | 25,540 | | |
| Xstrata PLC (United Kingdom) | | | 140 | | | | 9,842 | | |
| | | | | | | | 289,115 | | |
| | | Number
of Shares | | Market
Value | |
| TELECOMMUNICATION SERVICES—1.4% | |
| AT&T, Inc. | | | 1,495 | | | $ | 57,124 | | |
| BT Group PLC (United Kingdom) | | | 1,441 | | | | 8,496 | | |
| Golden Telecom, Inc.* | | | 149 | | | | 15,118 | | |
| Koninklijke (Royal) KPN N.V. (Netherlands) | | | 260 | | | | 4,793 | | |
| Qwest Communications International, Inc.* | | | 5,994 | | | | 39,740 | | |
| Telefonica S.A. (Spain) | | | 670 | | | | 22,531 | | |
| Time Warner Telecom, Inc., Class A* | | | 254 | | | | 5,697 | | |
| Verizon Communications, Inc. | | | 598 | | | | 25,840 | | |
| Vodafone Group PLC (United Kingdom) | | | 10,768 | | | | 40,340 | | |
| | | | | | | | 219,679 | | |
| UTILITIES—1.3% | |
| American Electric Power Co., Inc. | | | 449 | | | | 21,404 | | |
| Constellation Energy Group, Inc. | | | 351 | | | | 35,174 | | |
| E.ON AG (Germany) | | | 36 | | | | 7,362 | | |
| Endesa S.A. (Spain) | | | 337 | | | | 18,590 | | |
| Enel S.p.A (Italy) | | | 484 | | | | 5,818 | | |
| Exelon Corp. | | | 745 | | | | 60,396 | | |
| National Grid PLC (United Kingdom) | | | 547 | | | | 9,240 | | |
| PNM Resources, Inc. | | | 149 | | | | 3,305 | | |
| RWE AG (Germany) | | | 33 | | | | 4,523 | | |
| Suez SA (France) | | | 66 | | | | 4,406 | | |
| Tokyo Electric Power (The) Co., Inc. (Japan) | | | 600 | | | | 16,389 | | |
| Westar Energy, Inc. | | | 149 | | | | 3,861 | | |
| | | | | | | | 190,468 | | |
Total Common Stocks
(Cost $5,069,724) | | | | | | | 4,957,616 | | |
| | | Principal
Amount | | Market
Value | |
| CORPORATE BONDS—36.7% | |
| CONSUMER DISCRETIONARY—1.9% | |
Comcast Cable Communications Holdings, Inc.
8.375%, 3/15/13 | | $ | 112,000 | | | | 126,056 | | |
Daimler Finance North America LLC
7.30%, 1/15/12 | | | 60,000 | | | | 64,939 | | |
Home Depot (The), Inc.
5.40%, 3/01/16 | | | 105,000 | | | | 99,666 | | |
| | | | | | | | 290,661 | | |
| CONSUMER STAPLES—1.7% | |
Diageo Finance BV (Netherlands)
5.30%, 10/28/15 | | | 75,000 | | | | 74,819 | | |
Kroger (The) Co.
5.50%, 2/01/13 | | | 45,000 | | | | 46,112 | | |
Wal-Mart Stores, Inc.
4.55%, 5/01/13 | | | 137,000 | | | | 136,492 | | |
| | | | | | | | 257,423 | | |
| ENERGY—2.2% | |
Apache Corp.
5.25%, 4/15/13 | | | 62,000 | | | | 63,633 | | |
Enterprise Products Operating LP, Series B
5.60%, 10/15/14 | | | 59,000 | | | | 59,758 | | |
Hess Corp.
6.65%, 8/15/11 | | | 80,000 | | | | 85,136 | | |
See Notes to Financial Statements.
10
TDAX Funds, Inc.
SCHEDULE OF INVESTMENTS (CONTINUED)
TDAX INDEPENDENCE 2010 EXCHANGE-TRADED FUND
November 30, 2007 (Unaudited)
| | | Principal
Amount | | Market
Value | |
| ENERGY (Continued) | |
Kinder Morgan Energy Partners L.P.
6.75%, 3/15/11 | | $ | 35,000 | | | $ | 36,833 | | |
Spectra Energy Capital LLC
6.25%, 2/15/13 | | | 90,000 | | | | 94,846 | | |
| | | | | | | | 340,206 | | |
| FINANCIALS—24.0% | |
American General Finance Corp., Series H MTN
5.375%, 10/01/12 | | | 120,000 | | | | 119,885 | | |
Ameriprise Financial, Inc.
5.35%, 11/15/10 | | | 81,000 | | | | 83,221 | | |
Bank of America Corp.
4.50%, 8/01/10 | | | 180,000 | | | | 180,415 | | |
Bank of America Corp.
4.875%, 1/15/13 | | | 15,000 | | | | 15,005 | | |
Boeing Capital Corp. Ltd.
5.80%, 1/15/13 | | | 60,000 | | | | 63,729 | | |
Boston Properties LP
6.25%, 1/15/13 | | | 109,000 | | | | 113,086 | | |
Capital One Financial Corp.
6.15%, 9/01/16 | | | 90,000 | | | | 83,848 | | |
Citigroup, Inc.
6.00%, 2/21/12 | | | 362,000 | | | | 374,843 | | |
Countrywide Home Loans, Inc., Series L MTN
4.00%, 3/22/11 | | | 33,000 | | | | 25,116 | | |
European Investment Bank (Supranational)
4.625%, 5/15/14 | | | 122,000 | | | | 125,085 | | |
General Electric Capital Corp., Series A MTN
5.875%, 2/15/12 | | | 111,000 | | | | 116,526 | | |
Genworth Financial, Inc.
5.75%, 6/15/14 | | | 60,000 | | | | 61,278 | | |
Goldman Sachs Group, L.P.
5.00%, 10/01/14 | | | 212,000 | | | | 207,190 | | |
Goldman Sachs Group (The), Inc.
3.875%, 1/15/09 | | | 75,000 | | | | 74,187 | | |
HSBC Finance Corp.
6.375%, 11/27/12 | | | 152,000 | | | | 158,837 | | |
| 5.50%, 1/19/16 | | | 100,000 | | | | 99,029 | | |
International Lease Finance Corp., Series Q MTN
5.75%, 6/15/11 | | | 152,000 | | | | 154,841 | | |
iStar Financial, Inc., Series 1
5.875%, 3/15/16 | | | 55,000 | | | | 45,067 | | |
John Deere Capital Corp.
7.00%, 3/15/12 | | | 60,000 | | | | 65,693 | | |
JPMorgan Chase & Co.
5.75%, 1/02/13 | | | 75,000 | | | | 76,866 | | |
Kreditanstalt fuer Wiederaufbau (Germany)
4.25%, 6/15/10 | | | 111,000 | | | | 113,464 | | |
Lehman Brothers Holdings, Inc. MTN
5.50%, 4/04/16 | | | 90,000 | | | | 86,506 | | |
Marsh & McLennan Cos., Inc.
5.75%, 9/15/15 | | | 88,000 | | | | 88,346 | | |
Merrill Lynch & Co., Inc., Series C MTN
5.00%, 1/15/15 | | | 242,000 | | | | 228,253 | | |
MetLife, Inc.
5.00%, 6/15/15 | | | 60,000 | | | | 57,840 | | |
Morgan Stanley
5.05%, 1/21/11 | | | 100,000 | | | | 100,151 | | |
| 5.30%, 3/01/13 | | | 162,000 | | | | 160,685 | | |
| | | Principal
Amount | | Market
Value | |
| FINANCIALS (Continued) | |
National Rural Utilities Cooperative
Finance Corp., Series C MTN
7.25%, 3/01/12 | | $ | 66,000 | | | $ | 71,891 | | |
Residential Capital LLC
6.375%, 6/30/10 | | | 10,000 | | | | 6,700 | | |
Royal Bank of Scotland Group PLC
(United Kingdom)
5.00%, 10/01/14 | | | 85,000 | | | | 85,313 | | |
SLM Corp., Series A MTN
5.375%, 5/15/14 | | | 40,000 | | | | 35,355 | | |
Wachovia Corp.
5.25%, 8/01/14 | | | 212,000 | | | | 206,697 | | |
Wells Fargo & Co.
5.00%, 11/15/14 | | | 188,000 | | | | 185,567 | | |
| | | | | | | | 3,670,515 | | |
| HEALTH CARE—1.3% | |
AmerisourceBergen Corp.
5.875%, 9/15/15 | | | 60,000 | | | | 60,879 | | |
UnitedHealth Group, Inc.
4.875%, 3/15/15 | | | 87,000 | | | | 83,847 | | |
WellPoint, Inc.
5.25%, 1/15/16 | | | 56,000 | | | | 54,325 | | |
| | | | | | | | 199,051 | | |
| INDUSTRIALS—0.6% | |
United Technologies Corp.
4.375%, 5/01/10 | | | 90,000 | | | | 90,330 | | |
| INFORMATION TECHNOLOGY—0.9% | |
International Business Machines Corp.
4.25%, 9/15/09 | | | 66,000 | | | | 66,460 | | |
Oracle Corp.
5.25%, 1/15/16 | | | 66,000 | | | | 66,061 | | |
| | | | | | | | 132,521 | | |
| MATERIALS—0.6% | |
Alcoa, Inc.
6.00%, 1/15/12 | | | 95,000 | | | | 98,896 | | |
| TELECOMMUNICATION SERVICES—2.3% | |
Embarq Corp.
7.082%, 6/01/16 | | | 48,000 | | | | 50,140 | | |
New Cingular Wireless Services, Inc.
7.875%, 3/01/11 | | | 175,000 | | | | 189,907 | | |
Sprint Capital Corp.
8.375%, 3/15/12 | | | 97,000 | | | | 104,093 | | |
| | | | | | | | 344,140 | | |
| UTILITIES—1.2% | |
Constellation Energy Group, Inc.
4.55%, 6/15/15 | | | 50,000 | | | | 46,395 | | |
Dominion Resources, Inc., Series C
5.15%, 7/15/15 | | | 99,000 | | | | 96,008 | | |
Exelon Generation Co. LLC
5.35%, 1/15/14 | | | 35,000 | | | | 34,385 | | |
| | | | | | | | 176,788 | | |
Total Corporate Bonds
(Amortized Cost $5,538,541) | | | | | | | 5,600,531 | | |
See Notes to Financial Statements.
11
TDAX Funds, Inc.
SCHEDULE OF INVESTMENTS (CONTINUED)
TDAX INDEPENDENCE 2010 EXCHANGE-TRADED FUND
November 30, 2007 (Unaudited)
| | | Principal
Amount | | Market
Value | |
UNITED STATES GOVERNMENT & AGENCIES
OBLIGATIONS—27.7% | |
| FEDERAL HOME LOAN MORTGAGE CORP.—5.0% | |
| 4.50%, 1/15/13 | | $ | 756,000 | | | $ | 771,887 | | |
| FEDERAL NATIONAL MORTGAGE ASSOCIATION—6.0% | |
| 5.00%, 9/15/08 | | | 541,000 | | | | 545,379 | | |
| 5.00%, 4/15/15 | | | 350,000 | | | | 364,982 | | |
| | | | | | | | 910,361 | | |
| UNITED STATES TREASURY BONDS/NOTES—16.7% | |
| 5.125%, 6/30/08 | | | 75,000 | | | | 75,773 | | |
| 4.75%, 11/15/08 | | | 425,000 | | | | 430,910 | | |
| 6.00%, 8/15/09 | | | 1,374,000 | | | | 1,440,447 | | |
| 3.50%, 2/15/10 | | | 405,000 | | | | 408,892 | | |
| 4.75%, 5/15/14 | | | 188,000 | | | | 200,044 | | |
| | | | | | | | 2,556,066 | | |
Total United States Government &
Agencies Obligations
(Amortized Cost $4,154,648) | | | | | | | 4,238,314 | | |
| SOVEREIGN BONDS—1.3% | |
| SOVEREIGN—1.3% | |
Italy Government International Bond (Italy)
6.00%, 2/22/11 | | | 131,000 | | | | 140,338 | | |
United Mexican States, Series A MTN (Mexico)
6.375%, 1/16/13 | | | 58,000 | | | | 61,741 | | |
Total Sovereign Bonds
(Amortized Cost $197,044) | | | | | | | 202,079 | | |
Total Investments—98.2%
(Amortized Cost $14,959,957) | | | | | | $ | 14,998,540 | | |
| Other assets less liabilities—1.8% | | | | | | | 279,149 | | |
| Net Assets—100.0% | | | | | | $ | 15,277,689 | | |
MTN - Medium Term Note.
REIT - Real Estate Investment Trust.
* Non-income producing security.
See Notes to Financial Statements.
12
TDAX Funds, Inc.
SCHEDULE OF INVESTMENTS
TDAX INDEPENDENCE 2020 EXCHANGE-TRADED FUND
November 30, 2007 (Unaudited)
| | | Number
of Shares | | Market
Value | |
| COMMON STOCKS—65.8% | |
| CONSUMER DISCRETIONARY—6.7% | |
| Aeropostale, Inc.* | | | 1,491 | | | $ | 38,095 | | |
| ArvinMeritor, Inc. | | | 2,226 | | | | 22,505 | | |
| Brookfield Homes Corp. | | | 1,485 | | | | 25,037 | | |
| Cabela's, Inc., Class A* | | | 138 | | | | 2,283 | | |
| Coach, Inc.* | | | 2,226 | | | | 82,674 | | |
| Comcast Corp., Class A* | | | 5,817 | | | | 119,481 | | |
Compagnie Financiere Richemont SA,
Class A (China) | | | 282 | | | | 19,407 | | |
| Daimler AG (Germany) | | | 279 | | | | 28,483 | | |
| DeVry, Inc. | | | 746 | | | | 41,015 | | |
| DIRECTV Group (The), Inc.* | | | 5,955 | | | | 148,100 | | |
| Fleetwood Enterprises, Inc.* | | | 3,711 | | | | 20,299 | | |
| Gemstar-TV Guide International, Inc.* | | | 3,384 | | | | 19,966 | | |
| Home Depot (The), Inc. | | | 1,623 | | | | 46,353 | | |
| HONDA MOTOR Co. Ltd. (Japan) | | | 1,800 | | | | 61,014 | | |
| J. Crew Group, Inc.* | | | 528 | | | | 25,370 | | |
| Jo-Ann Stores, Inc.* | | | 1,035 | | | | 17,036 | | |
| Jos. A. Bank Clothiers, Inc.* | | | 746 | | | | 19,314 | | |
| Lear Corp.* | | | 702 | | | | 20,667 | | |
| Liberty Global, Inc., Class A* | | | 1,605 | | | | 65,195 | | |
| Live Nation, Inc.* | | | 999 | | | | 13,407 | | |
| Matsushita Electric Industrial Co. Ltd. (Japan) | | | 1,000 | | | | 20,149 | | |
| McDonald's Corp. | | | 2,850 | | | | 166,639 | | |
| Men's Wearhouse (The), Inc. | | | 746 | | | | 25,752 | | |
| New York & Co., Inc.* | | | 3,987 | | | | 29,384 | | |
| Omnicom Group, Inc. | | | 885 | | | | 43,144 | | |
| Priceline.com, Inc.* | | | 138 | | | | 15,704 | | |
| Regis Corp. | | | 138 | | | | 4,056 | | |
| Sony Corp. (Japan) | | | 1,600 | | | | 86,689 | | |
| Sotheby's | | | 746 | | | | 27,938 | | |
| Speedway Motorsports, Inc. | | | 138 | | | | 4,658 | | |
| Steven Madden Ltd.* | | | 879 | | | | 19,980 | | |
| Target Corp. | | | 2,226 | | | | 133,694 | | |
| Tempur-Pedic International, Inc. | | | 1,491 | | | | 44,268 | | |
| Time Warner, Inc. | | | 4,728 | | | | 81,605 | | |
| Toyota Motor Corp. (Japan) | | | 3,608 | | | | 202,964 | | |
| Universal Technical Institute, Inc.* | | | 1,485 | | | | 26,181 | | |
| Viacom, Inc., Class B* | | | 3,292 | | | | 138,330 | | |
| Yum! Brands, Inc. | | | 3,103 | | | | 115,276 | | |
| | | | | | | | 2,022,112 | | |
| CONSUMER STAPLES—5.8% | |
| Altria Group, Inc. | | | 3,103 | | | | 240,669 | | |
British American Tobacco PLC
(United Kingdom) | | | 558 | | | | 21,650 | | |
| Carrefour SA (France) | | | 313 | | | | 24,309 | | |
| Coca-Cola (The) Co. | | | 3,491 | | | | 216,791 | | |
| ConAgra Foods, Inc. | | | 4,455 | | | | 111,464 | | |
| CVS Caremark Corp. | | | 746 | | | | 29,907 | | |
| Diageo PLC (United Kingdom) | | | 1,095 | | | | 24,609 | | |
| Groupe DANONE (France) | | | 42 | | | | 3,715 | | |
| Kraft Foods, Inc., Class A | | | 2,970 | | | | 102,614 | | |
| Longs Drug Stores Corp. | | | 746 | | | | 39,478 | | |
| Nestle SA (China) | | | 385 | | | | 185,160 | | |
| Pilgrim's Pride Corp. | | | 746 | | | | 19,456 | | |
| Procter & Gamble (The) Co. | | | 4,628 | | | | 342,471 | | |
| Seaboard Corp. | | | 12 | | | | 18,108 | | |
| | | Number
of Shares | | Market
Value | |
| CONSUMER STAPLES (Continued) | |
| Tesco PLC (United Kingdom) | | | 8,690 | | | $ | 85,587 | | |
| Unilever NV (Netherlands) | | | 1,767 | | | | 62,638 | | |
| Unilever PLC (United Kingdom) | | | 102 | | | | 3,742 | | |
| Wal-Mart Stores, Inc. | | | 4,728 | | | | 226,471 | | |
| | | | | | | | 1,758,839 | | |
| ENERGY—6.3% | |
| Alon USA Energy, Inc. | | | 746 | | | | 20,754 | | |
| BG Group PLC (United Kingdom) | | | 1,599 | | | | 33,470 | | |
| BP PLC (United Kingdom) | | | 16,561 | | | | 200,906 | | |
| Chevron Corp. | | | 2,489 | | | | 218,460 | | |
| ConocoPhillips | | | 2,369 | | | | 189,615 | | |
| Dril-Quip, Inc.* | | | 746 | | | | 42,089 | | |
| ENI S.p.A (Italy) | | | 476 | | | | 17,027 | | |
| EOG Resources, Inc. | | | 2,126 | | | | 175,990 | | |
| Exxon Mobil Corp. | | | 4,053 | | | | 361,364 | | |
| International Coal Group, Inc.* | | | 5,406 | | | | 27,084 | | |
| Newpark Resources, Inc.* | | | 4,119 | | | | 22,160 | | |
| Occidental Petroleum Corp. | | | 879 | | | | 61,328 | | |
| Oil States International, Inc.* | | | 746 | | | | 23,656 | | |
| Oilsands Quest, Inc.* | | | 4,583 | | | | 20,624 | | |
| PetroHawk Energy Corp.* | | | 1,623 | | | | 26,455 | | |
| Petroleum Development Corp.* | | | 746 | | | | 37,800 | | |
Royal Dutch Shell PLC, Class A
(United Kingdom) | | | 3,366 | | | | 136,067 | | |
Royal Dutch Shell PLC, Class B
(United Kingdom) | | | 2,507 | | | | 100,621 | | |
| Schlumberger Ltd. (Netherlands Antilles) | | | 1,047 | | | | 97,842 | | |
| Total SA (France) | | | 857 | | | | 69,476 | | |
| W-H Energy Services, Inc.* | | | 746 | | | | 37,673 | | |
| | | | | | | | 1,920,461 | | |
| FINANCIALS—14.0% | |
| ABN AMRO Holding NV (Netherlands) | | | 902 | | | | 47,664 | | |
| Allianz SE (Germany) | | | 301 | | | | 62,297 | | |
| American Express Co. | | | 5,472 | | | | 322,738 | | |
| American International Group, Inc. | | | 1,541 | | | | 89,578 | | |
| Aspen Insurance Holdings Ltd. (Bermuda) | | | 1,023 | | | | 29,462 | | |
| Assicurazioni Generali S.p.A (Italy) | | | 180 | | | | 8,283 | | |
Australia & New Zealand Banking
Group Ltd. (Australia) | | | 139 | | | | 3,462 | | |
| Aviva PLC (United Kingdom) | | | 1,473 | | | | 20,656 | | |
| AXA (France) | | | 879 | | | | 36,036 | | |
| Banco Bilbao Vizcaya Argentaria, S.A. (Spain) | | | 480 | | | | 11,985 | | |
| Banco Santander S.A. (Spain) | | | 9,542 | | | | 205,050 | | |
| Bank of America Corp. | | | 3,103 | | | | 143,141 | | |
| Barclays PLC (United Kingdom) | | | 6,705 | | | | 77,618 | | |
| BNP Paribas (France) | | | 291 | | | | 32,954 | | |
| Calamos Asset Management, Inc., Class A | | | 1,485 | | | | 43,971 | | |
| Cascade Bancorp | | | 1,485 | | | | 25,750 | | |
| Charles Schwab (The) Corp. | | | 6,350 | | | | 154,369 | | |
| Citigroup, Inc. | | | 3,987 | | | | 132,767 | | |
| CME Group, Inc. | | | 100 | | | | 65,860 | | |
| Cohen & Steers, Inc. | | | 746 | | | | 21,164 | | |
| Commerce Group (The), Inc. | | | 746 | | | | 26,819 | | |
| Commonwealth Bank of Australia (Australia) | | | 24 | | | | 1,266 | | |
| Credit Suisse Group (China) | | | 1,539 | | | | 92,895 | | |
See Notes to Financial Statements.
13
TDAX Funds, Inc.
SCHEDULE OF INVESTMENTS (CONTINUED)
TDAX INDEPENDENCE 2020 EXCHANGE-TRADED FUND
November 30, 2007 (Unaudited)
| | | Number
of Shares | | Market
Value | |
| FINANCIALS (Continued) | |
| Deerfield Triarc Capital Corp. REIT | | | 6,274 | | | $ | 47,118 | | |
| Delphi Financial Group, Inc., Class A | | | 55 | | | | 2,114 | | |
| Digital Realty Trust, Inc. REIT | | | 746 | | | | 28,467 | | |
| Dollar Financial Corp.* | | | 879 | | | | 26,265 | | |
| Fortis (Belgium) | | | 512 | | | | 13,761 | | |
| Franklin Resources, Inc. | | | 1,264 | | | | 155,700 | | |
| GFI Group, Inc.* | | | 138 | | | | 13,438 | | |
| Goldman Sachs Group (The), Inc. | | | 220 | | | | 49,861 | | |
Greenlight Capital Re Ltd., Class A
(Cayman Islands)* | | | 1,305 | | | | 28,358 | | |
| HBOS PLC (United Kingdom) | | | 3,145 | | | | 51,603 | | |
| Highwoods Properties, Inc. REIT | | | 746 | | | | 23,671 | | |
| HSBC Holdings PLC (United Kingdom) | | | 10,002 | | | | 170,695 | | |
| ING Groep N.V. (Netherlands) | | | 1,974 | | | | 76,872 | | |
| International Securities Exchange Holdings, Inc. | | | 746 | | | | 50,124 | | |
| Intesa Sanpaolo S.p.A (Italy) | | | 1,233 | | | | 9,864 | | |
| JPMorgan Chase & Co. | | | 2,369 | | | | 108,074 | | |
| Lincoln National Corp. | | | 2,249 | | | | 138,471 | | |
| Lloyds TSB Group PLC (United Kingdom) | | | 4,902 | | | | 49,892 | | |
| Mizuho Financial Group, Inc. (Japan) | | | 11 | | | | 59,004 | | |
| Morgan Stanley | | | 879 | | | | 46,341 | | |
| National Australia Bank Ltd. (Australia) | | | 276 | | | | 9,349 | | |
| National City Corp. | | | 5,352 | | | | 105,756 | | |
| Nationwide Health Properties, Inc. REIT | | | 746 | | | | 23,335 | | |
| Nomura Holdings, Inc. (Japan) | | | 3,000 | | | | 53,766 | | |
| Nordea Bank AB (Sweden) | | | 3,600 | | | | 60,409 | | |
| Northern Trust Corp. | | | 1,485 | | | | 120,270 | | |
| NYSE Euronext | | | 1,209 | | | | 104,699 | | |
| Odyssey Re Holdings Corp. | | | 744 | | | | 28,674 | | |
| optionsXpress Holdings, Inc. | | | 879 | | | | 26,730 | | |
| Platinum Underwriters Holdings Ltd. (Bermuda) | | | 240 | | | | 8,717 | | |
| Post Properties, Inc. REIT | | | 746 | | | | 27,087 | | |
| Prudential PLC (United Kingdom) | | | 1,761 | | | | 24,586 | | |
| Ramco-Gershenson Properties Trust REIT | | | 746 | | | | 18,874 | | |
| Realty Income Corp. REIT | | | 746 | | | | 21,261 | | |
Royal Bank of Scotland Group PLC
(United Kingdom) | | | 8,561 | | | | 80,796 | | |
| Simon Property Group, Inc. REIT | | | 1,105 | | | | 108,787 | | |
| SLM Corp.* | | | 2,226 | | | | 84,766 | | |
| Societe Generale (France) | | | 174 | | | | 26,966 | | |
| Sumitomo Mitsui Financial Group, Inc. (Japan) | | | 5 | | | | 42,867 | | |
| SVB Financial Group* | | | 138 | | | | 7,104 | | |
| Swiss Re (China) | | | 21 | | | | 1,561 | | |
| UBS AG (China) | | | 2,802 | | | | 141,955 | | |
| UniCredito Italiano S.p.A (Italy) | | | 6,411 | | | | 54,815 | | |
| Vornado Realty Trust REIT | | | 885 | | | | 79,650 | | |
| Wachovia Corp. | | | 879 | | | | 37,797 | | |
| Waddell & Reed Financial, Inc., Class A | | | 138 | | | | 4,717 | | |
| Washington Real Estate Investment Trust REIT | | | 138 | | | | 4,422 | | |
| Wells Fargo & Co. | | | 1,761 | | | | 57,109 | | |
| Westpac Banking Corp. (Australia) | | | 945 | | | | 23,677 | | |
| Zurich Financial Services AG (China) | | | 186 | | | | 54,241 | | |
| | | | | | | | 4,250,221 | | |
| HEALTH CARE—8.4% | |
| Abbott Laboratories | | | 2,369 | | | | 136,241 | | |
| Alexion Pharmaceuticals, Inc.* | | | 319 | | | | 23,198 | | |
| AMERIGROUP Corp.* | | | 746 | | | | 25,640 | | |
| | | Number
of Shares | | Market
Value | |
| HEALTH CARE (Continued) | |
| AstraZeneca PLC (United Kingdom) | | | 664 | | | $ | 31,538 | | |
| Auxilium Pharmaceuticals, Inc.* | | | 1,071 | | | | 30,042 | | |
| Becton, Dickinson & Co. | | | 1,623 | | | | 134,271 | | |
| CIGNA Corp. | | | 1,485 | | | | 79,611 | | |
| Dendreon Corp.* | | | 2,820 | | | | 14,100 | | |
| Genzyme Corp.* | | | 2,226 | | | | 166,794 | | |
| GlaxoSmithKline PLC (United Kingdom) | | | 3,699 | | | | 97,961 | | |
| Hologic, Inc.* | | | 746 | | | | 49,527 | | |
| Illumina, Inc.* | | | 744 | | | | 42,996 | | |
| Johnson & Johnson | | | 3,987 | | | | 270,079 | | |
| Magellan Health Services, Inc.* | | | 746 | | | | 33,906 | | |
| Matria Healthcare, Inc.* | | | 1,491 | | | | 33,876 | | |
| McKesson Corp. | | | 1,485 | | | | 99,094 | | |
| Merck & Co, Inc. | | | 3,103 | | | | 184,194 | | |
| Novartis AG (China) | | | 2,208 | | | | 125,845 | | |
| Perrigo Co. | | | 270 | | | | 8,343 | | |
| Pfizer, Inc. | | | 12,562 | | | | 298,472 | | |
| Psychiatric Solutions, Inc.* | | | 138 | | | | 5,041 | | |
| Roche Holding AG (China) | | | 807 | | | | 154,031 | | |
| Sanofi-Aventis SA (France) | | | 126 | | | | 12,024 | | |
| Sirona Dental Systems, Inc.* | | | 746 | | | | 20,187 | | |
| STERIS Corp. | | | 138 | | | | 3,858 | | |
| Takeda Pharmaceutical Co. Ltd. (Japan) | | | 600 | | | | 38,404 | | |
| Thermo Fisher Scientific, Inc.* | | | 3,103 | | | | 178,857 | | |
| UnitedHealth Group, Inc. | | | 2,782 | | | | 153,010 | | |
| Ventana Medical Systems, Inc.* | | | 138 | | | | 12,257 | | |
| WellPoint, Inc.* | | | 885 | | | | 74,526 | | |
| | | | | | | | 2,537,923 | | |
| INDUSTRIALS—6.3% | |
| ABB Ltd. (China) | | | 1,998 | | | | 58,716 | | |
| Aecom Technology Corp.* | | | 672 | | | | 17,868 | | |
| Allegiant Travel Co.* | | | 1,119 | | | | 39,613 | | |
| Belden CDT, Inc. | | | 746 | | | | 34,353 | | |
| Boeing Co. | | | 746 | | | | 69,035 | | |
| Brady Corp., Class A | | | 746 | | | | 29,862 | | |
| Caterpillar, Inc. | | | 1,485 | | | | 106,772 | | |
| CDI Corp. | | | 879 | | | | 23,443 | | |
| Compagnie de Saint-Gobain (France) | | | 407 | | | | 40,176 | | |
| Danaher Corp. | | | 358 | | | | 31,082 | | |
| Emerson Electric Co. | | | 879 | | | | 50,121 | | |
| FedEx Corp. | | | 220 | | | | 21,663 | | |
| Fuel Tech, Inc.* | | | 1,534 | | | | 37,445 | | |
| General Electric Co. | | | 5,916 | | | | 226,524 | | |
| Granite Construction, Inc. | | | 746 | | | | 30,601 | | |
| Illinois Tool Works, Inc. | | | 1,485 | | | | 82,418 | | |
| Ingersoll-Rand Co. Ltd., Class A (Bermuda) | | | 264 | | | | 13,633 | | |
| JetBlue Airways Corp.* | | | 2,652 | | | | 18,564 | | |
Koninklijke (Royal) Philips Electronics N.V.
(Netherlands) | | | 921 | | | | 38,745 | | |
| Manpower, Inc. | | | 746 | | | | 45,581 | | |
| Mitsubishi Corp. (Japan) | | | 1,800 | | | | 51,602 | | |
| Northrop Grumman Corp. | | | 1,623 | | | | 127,876 | | |
| PHH Corp.* | | | 746 | | | | 16,531 | | |
| Raven Industries, Inc. | | | 746 | | | | 25,909 | | |
| Siemens AG (Germany) | | | 349 | | | | 53,134 | | |
| Simpson Manufacturing Co., Inc. | | | 1,485 | | | | 39,516 | | |
| Trane, Inc. | | | 2,226 | | | | 81,716 | | |
See Notes to Financial Statements.
14
TDAX Funds, Inc.
SCHEDULE OF INVESTMENTS (CONTINUED)
TDAX INDEPENDENCE 2020 EXCHANGE-TRADED FUND
November 30, 2007 (Unaudited)
| | | Number
of Shares | | Market
Value | |
| INDUSTRIALS (Continued) | |
| Union Pacific Corp. | | | 746 | | | $ | 94,100 | | |
| United Parcel Service, Inc., Class B | | | 885 | | | | 65,207 | | |
| United Stationers, Inc.* | | | 746 | | | | 37,792 | | |
| United Technologies Corp. | | | 3,749 | | | | 280,312 | | |
| Waste Connections, Inc.* | | | 138 | | | | 4,393 | | |
| Watson Wyatt Worldwide, Inc., Class A | | | 138 | | | | 6,355 | | |
| | | | | | | | 1,900,658 | | |
| INFORMATION TECHNOLOGY—9.1% | |
| Accenture Ltd., Class A (Bermuda) | | | 566 | | | | 19,561 | | |
| Agilysys, Inc. | | | 1,623 | | | | 22,543 | | |
| Amkor Technology, Inc.* | | | 1,761 | | | | 14,511 | | |
| Anixter International, Inc.* | | | 746 | | | | 48,117 | | |
| Ansoft Corp.* | | | 1,491 | | | | 43,254 | | |
| Benchmark Electronics, Inc.* | | | 138 | | | | 2,477 | | |
| CANON, Inc. (Japan) | | | 1,800 | | | | 94,280 | | |
| Cisco Systems, Inc.* | | | 4,455 | | | | 124,829 | | |
| eBay, Inc.* | | | 2,970 | | | | 99,584 | | |
| Entegris, Inc.* | | | 1,155 | | | | 10,002 | | |
| Equinix, Inc.* | | | 361 | | | | 37,584 | | |
| FLIR Systems, Inc.* | | | 746 | | | | 51,273 | | |
| Foundry Networks, Inc.* | | | 1,623 | | | | 28,613 | | |
| Google, Inc., Class A* | | | 120 | | | | 83,160 | | |
| Hewlett-Packard Co. | | | 1,623 | | | | 83,033 | | |
| Intel Corp. | | | 4,455 | | | | 116,186 | | |
| International Business Machines Corp. | | | 746 | | | | 78,464 | | |
| Ixia* | | | 3,711 | | | | 38,335 | | |
| Jack Henry & Associates, Inc. | | | 138 | | | | 3,693 | | |
| Juniper Networks, Inc.* | | | 1,623 | | | | 48,236 | | |
| Lawson Software, Inc.* | | | 2,724 | | | | 26,477 | | |
| MICROS Systems, Inc.* | | | 746 | | | | 53,816 | | |
| Microsoft Corp. | | | 7,745 | | | | 260,232 | | |
| Motorola, Inc. | | | 17,775 | | | | 283,866 | | |
| MPS Group, Inc.* | | | 409 | | | | 4,540 | | |
| Nintendo Co. Ltd. (Japan) | | | 29 | | | | 17,647 | | |
| Nokia Oyj (Finland) | | | 2,658 | | | | 106,395 | | |
| Nuance Communications, Inc.* | | | 1,233 | | | | 24,882 | | |
| ON Semiconductor Corp.* | | | 1,761 | | | | 16,184 | | |
| Orbcomm, Inc.* | | | 2,778 | | | | 21,641 | | |
| Perficient, Inc.* | | | 1,485 | | | | 24,903 | | |
| Perot Systems Corp., Class A* | | | 1,485 | | | | 19,528 | | |
| SAIC, Inc.* | | | 1,857 | | | | 37,029 | | |
| SAP AG (Germany) | | | 450 | | | | 23,079 | | |
| SAVVIS, Inc.* | | | 564 | | | | 18,071 | | |
| Sonus Networks, Inc.* | | | 3,579 | | | | 23,550 | | |
| Spansion, Inc., Class A* | | | 2,904 | | | | 15,507 | | |
| Sun Microsystems, Inc.* | | | 22,122 | | | | 459,694 | | |
| Sybase, Inc.* | | | 270 | | | | 6,923 | | |
| Symantec Corp.* | | | 4,455 | | | | 79,299 | | |
| Telefonaktiebolaget LM Ericsson (Sweden) | | | 30,000 | | | | 73,258 | | |
| THQ, Inc.* | | | 746 | | | | 18,240 | | |
| ValueClick, Inc.* | | | 879 | | | | 20,780 | | |
| Veeco Instruments, Inc.* | | | 1,485 | | | | 24,918 | | |
| Xerox Corp. | | | 2,640 | | | | 44,563 | | |
| | | | | | | | 2,752,757 | | |
| | | Number
of Shares | | Market
Value | |
| MATERIALS—3.8% | |
| A. Schulman, Inc. | | | 879 | | | $ | 18,951 | | |
| Alcoa, Inc. | | | 1,485 | | | | 54,009 | | |
| Anglo American PLC (United Kingdom) | | | 1,611 | | | | 108,846 | | |
| AptarGroup, Inc. | | | 746 | | | | 31,489 | | |
| ArcelorMittal (Luxembourg) | | | 301 | | | | 22,272 | | |
| BASF AG (Germany) | | | 71 | | | | 9,876 | | |
| Bayer AG (Germany) | | | 331 | | | | 27,373 | | |
| BHP Billiton Ltd. (Australia) | | | 1,467 | | | | 55,763 | | |
| BHP Billiton PLC (United Kingdom) | | | 2,357 | | | | 77,881 | | |
| CF Industries Holdings, Inc. | | | 746 | | | | 67,871 | | |
| Dow Chemical (The) Co. | | | 1,123 | | | | 47,099 | | |
| E.I. du Pont de Nemours & Co. | | | 2,226 | | | | 102,730 | | |
| Greif, Inc., Class A | | | 744 | | | | 43,948 | | |
| JFE Holdings, Inc. (Japan) | | | 600 | | | | 32,725 | | |
| Newmont Mining Corp. | | | 200 | | | | 9,938 | | |
| NIPPON STEEL Corp. (Japan) | | | 6,000 | | | | 35,970 | | |
| Quanex Corp. | | | 746 | | | | 37,330 | | |
| Rio Tinto PLC (United Kingdom) | | | 849 | | | | 98,456 | | |
| Rockwood Holdings, Inc.* | | | 746 | | | | 25,125 | | |
| Southern Copper Corp. | | | 746 | | | | 82,545 | | |
| Terra Industries, Inc.* | | | 819 | | | | 30,942 | | |
| Weyerhaeuser Co. | | | 1,264 | | | | 92,500 | | |
| Xstrata PLC (United Kingdom) | | | 463 | | | | 32,549 | | |
| | | | | | | | 1,146,188 | | |
| TELECOMMUNICATION SERVICES—2.9% | |
| AT&T, Inc. | | | 5,955 | | | | 227,542 | | |
| BT Group PLC (United Kingdom) | | | 4,208 | | | | 24,810 | | |
| Deutsche Telekom AG (Germany) | | | 246 | | | | 5,452 | | |
| Golden Telecom, Inc.* | | | 626 | | | | 63,514 | | |
| Qwest Communications International, Inc.* | | | 23,910 | | | | 158,523 | | |
| Telefonica S.A. (Spain) | | | 2,846 | | | | 95,706 | | |
| Time Warner Telecom, Inc., Class A* | | | 1,029 | | | | 23,080 | | |
| Verizon Communications, Inc. | | | 2,970 | | | | 128,334 | | |
| Vodafone Group PLC (United Kingdom) | | | 44,896 | | | | 168,194 | | |
| | | | | | | | 895,155 | | |
| UTILITIES—2.5% | |
| ALLETE, Inc. | | | 38 | | | | 1,556 | | |
| American Electric Power Co., Inc. | | | 2,226 | | | | 106,113 | | |
| Constellation Energy Group, Inc. | | | 1,270 | | | | 127,267 | | |
| E.ON AG (Germany) | | | 240 | | | | 49,080 | | |
| Endesa S.A. (Spain) | | | 1,155 | | | | 63,712 | | |
| Enel S.p.A (Italy) | | | 2,652 | | | | 31,882 | | |
| Exelon Corp. | | | 3,003 | | | | 243,453 | | |
| MGE Energy, Inc. | | | 138 | | | | 4,840 | | |
| National Grid PLC (United Kingdom) | | | 1,563 | | | | 26,401 | | |
| PNM Resources, Inc. | | | 270 | | | | 5,989 | | |
| RWE AG (Germany) | | | 18 | | | | 2,467 | | |
| Suez SA (France) | | | 426 | | | | 28,439 | | |
| Tokyo Electric Power (The) Co., Inc. (Japan) | | | 1,800 | | | | 49,168 | | |
| Westar Energy, Inc. | | | 270 | | | | 6,996 | | |
| | | | | | | | 747,363 | | |
Total Common Stocks
(Cost $20,208,296) | | | | | | | 19,931,677 | | |
See Notes to Financial Statements.
15
TDAX Funds, Inc.
SCHEDULE OF INVESTMENTS (CONTINUED)
TDAX INDEPENDENCE 2020 EXCHANGE-TRADED FUND
November 30, 2007 (Unaudited)
| | | Principal
Amount | | Market
Value | |
| CORPORATE BONDS—22.2% | |
| CONSUMER DISCRETIONARY—1.7% | |
CBS Corp.
7.875%, 7/30/30 | | $ | 30,000 | | | $ | 32,578 | | |
Comcast Cable Communications Holdings, Inc.
8.375%, 3/15/13 | | | 90,000 | | | | 101,295 | | |
Daimler Finance North America LLC
7.30%, 1/15/12 | | | 90,000 | | | | 97,409 | | |
Home Depot (The), Inc.
5.40%, 3/01/16 | | | 101,000 | | | | 95,869 | | |
News America, Inc.
6.20%, 12/15/34 | | | 60,000 | | | | 57,983 | | |
Time Warner, Inc.
7.70%, 5/01/32 | | | 60,000 | | | | 66,130 | | |
Viacom, Inc.
6.25%, 4/30/16 | | | 54,000 | | | | 55,080 | | |
| | | | | | | | 506,344 | | |
| CONSUMER STAPLES—0.8% | |
Coca-Cola Enterprises, Inc.
8.50%, 2/01/22 | | | 66,000 | | | | 83,668 | | |
Diageo Finance BV (Netherlands)
5.30%, 10/28/15 | | | 54,000 | | | | 53,870 | | |
Kroger (The) Co.
5.50%, 2/01/13 | | | 48,000 | | | | 49,186 | | |
Pepsi Bottling Group (The), Inc., Series B
7.00%, 3/01/29 | | | 48,000 | | | | 55,266 | | |
| | | | | | | | 241,990 | | |
| ENERGY—2.0% | |
Anadarko Petroleum Corp.
5.95%, 9/15/16 | | | 101,000 | | | | 103,099 | | |
Apache Corp.
5.25%, 4/15/13 | | | 66,000 | | | | 67,738 | | |
Canadian Natural Resources Ltd. (Canada)
5.70%, 5/15/17 | | | 36,000 | | | | 36,173 | | |
ConocoPhillips
5.90%, 10/15/32 | | | 112,000 | | | | 116,088 | | |
Enterprise Products Operating LP, Series B
5.60%, 10/15/14 | | | 72,000 | | | | 72,925 | | |
Hess Corp.
6.65%, 8/15/11 | | | 84,000 | | | | 89,393 | | |
Kinder Morgan Energy Partners L.P.
6.75%, 3/15/11 | | | 36,000 | | | | 37,886 | | |
Spectra Energy Capital LLC
6.25%, 2/15/13 | | | 90,000 | | | | 94,846 | | |
| | | | | | | | 618,148 | | |
| FINANCIALS—12.6% | |
Allstate (The) Corp.
5.55%, 5/09/35 | | | 60,000 | | | | 54,098 | | |
American General Finance Corp., Series H MTN
5.375%, 10/01/12 | | | 186,000 | | | | 185,822 | | |
Bank of America Corp.
4.875%, 1/15/13 | | | 224,000 | | | | 224,069 | | |
Boeing Capital Corp. Ltd.
5.80%, 1/15/13 | | | 96,000 | | | | 101,966 | | |
Boston Properties LP
6.25%, 1/15/13 | | | 118,000 | | | | 122,423 | | |
| | | Principal
Amount | | Market
Value | |
| FINANCIALS (Continued) | |
Capital One Financial Corp.
6.15%, 9/01/16 | | $ | 102,000 | | | $ | 95,027 | | |
Citigroup, Inc.
6.00%, 2/21/12 | | | 402,000 | | | | 416,262 | | |
Countrywide Home Loans, Inc., Series L MTN
4.00%, 3/22/11 | | | 36,000 | | | | 27,400 | | |
Credit Suisse (USA), Inc.
7.125%, 7/15/32 | | | 84,000 | | | | 94,948 | | |
European Investment Bank (Supranational)
4.625%, 5/15/14 | | | 101,000 | | | | 103,554 | | |
General Electric Capital Corp., Series A MTN
5.875%, 2/15/12 | | | 72,000 | | | | 75,584 | | |
| 6.75%, 3/15/32 | | | 36,000 | | | | 41,323 | | |
Goldman Sachs Group, L.P.
5.00%, 10/01/14 | | | 271,000 | | | | 264,852 | | |
HSBC Finance Corp.
6.375%, 11/27/12 | | | 271,000 | | | | 283,191 | | |
Inter-American Development Bank (Supranational)
4.375%, 9/20/12 | | | 150,000 | | | | 152,385 | | |
John Deere Capital Corp.
7.00%, 3/15/12 | | | 90,000 | | | | 98,540 | | |
Landwirtschaftliche Rentenbank,
Series G MTN (Germany)
5.00%, 11/08/16 | | | 150,000 | | | | 157,222 | | |
Lehman Brothers Holdings, Inc. MTN
5.50%, 4/04/16 | | | 60,000 | | | | 57,671 | | |
Marsh & McLennan Cos., Inc.
5.75%, 9/15/15 | | | 104,000 | | | | 104,409 | | |
Merrill Lynch & Co., Inc., Series C MTN
5.00%, 1/15/15 | | | 174,000 | | | | 164,115 | | |
| MetLife, Inc. 5.00%, 6/15/15 | | | 120,000 | | | | 115,680 | | |
| Morgan Stanley 5.30%, 3/01/13 | | | 277,000 | | | | 274,752 | | |
National Rural Utilities Cooperative
Finance Corp., Series C MTN
7.25%, 3/01/12 | | | 54,000 | | | | 58,820 | | |
Royal Bank of Scotland Group PLC
(United Kingdom)
5.00%, 10/01/14 | | | 72,000 | | | | 72,265 | | |
Unilever Capital Corp.
5.90%, 11/15/32 | | | 72,000 | | | | 72,627 | | |
Wachovia Corp.
5.25%, 8/01/14 | | | 241,000 | | | | 234,972 | | |
Wells Fargo & Co.
5.00%, 11/15/14 | | | 168,000 | | | | 165,825 | | |
| | | | | | | | 3,819,802 | | |
| HEALTH CARE—0.8% | |
Abbott Laboratories
5.875%, 5/15/16 | | | 36,000 | | | | 37,605 | | |
UnitedHealth Group, Inc.
4.875%, 3/15/15 | | | 102,000 | | | | 98,304 | | |
WellPoint, Inc.
5.25%, 1/15/16 | | | 72,000 | | | | 69,846 | | |
Wyeth
5.50%, 2/01/14 | | | 36,000 | | | | 36,910 | | |
| | | | | | | | 242,665 | | |
See Notes to Financial Statements.
16
TDAX Funds, Inc.
SCHEDULE OF INVESTMENTS (CONTINUED)
TDAX INDEPENDENCE 2020 EXCHANGE-TRADED FUND
November 30, 2007 (Unaudited)
| | | Principal
Amount | | Market
Value | |
| INFORMATION TECHNOLOGY—0.2% | |
Oracle Corp.
5.25%, 1/15/16 | | $ | 54,000 | | | $ | 54,050 | | |
| MATERIALS—0.9% | |
Alcoa, Inc.
6.00%, 1/15/12 | | | 99,000 | | | | 103,060 | | |
BHP Billiton Finance USA Ltd. (Australia)
4.80%, 4/15/13 | | | 42,000 | | | | 41,973 | | |
CRH America, Inc.
6.00%, 9/30/16 | | | 36,000 | | | | 35,645 | | |
E.I. du Pont de Nemours & Co.
5.25%, 12/15/16 | | | 36,000 | | | | 35,504 | | |
Weyerhaeuser Co.
7.375%, 3/15/32 | | | 60,000 | | | | 60,445 | | |
| | | | | | | | 276,627 | | |
| TELECOMMUNICATION SERVICES—2.2% | |
BellSouth Corp.
6.00%, 11/15/34 | | | 70,000 | | | | 69,232 | | |
Embarq Corp.
7.082%, 6/01/16 | | | 48,000 | | | | 50,140 | | |
New Cingular Wireless Services, Inc.
7.875%, 3/01/11 | | | 216,000 | | | | 234,400 | | |
Sprint Capital Corp.
8.375%, 3/15/12 | | | 108,000 | | | | 115,897 | | |
Verizon Global Funding Corp.
7.75%, 12/01/30 | | | 108,000 | | | | 128,619 | | |
Vodafone Group PLC (United Kingdom)
5.625%, 2/27/17 | | | 54,000 | | | | 54,118 | | |
| | | | | | | | 652,406 | | |
| UTILITIES—1.0% | |
Constellation Energy Group, Inc.
4.55%, 6/15/15 | | | 54,000 | | | | 50,106 | | |
Dominion Resources, Inc., Series C
5.15%, 7/15/15 | | | 101,000 | | | | 97,948 | | |
Exelon Generation Co. LLC
5.35%, 1/15/14 | | | 36,000 | | | | 35,368 | | |
FirstEnergy Corp., Series C
7.375%, 11/15/31 | | | 36,000 | | | | 38,817 | | |
Oncor Electric Delivery Co.
7.00%, 9/01/22 | | | 36,000 | | | | 37,501 | | |
Pacific Gas & Electric Co.
6.05%, 3/01/34 | | | 48,000 | | | | 47,664 | | |
| | | | | | | | 307,404 | | |
Total Corporate Bonds
(Amortized Cost $6,681,745) | | | | | | | 6,719,436 | | |
UNITED STATES GOVERNMENT & AGENCIES
OBLIGATIONS—9.8% | |
| FEDERAL HOME LOAN MORTGAGE CORP.—3.0% | |
| 4.50%, 1/15/13 | | | 483,000 | | | | 493,150 | | |
| 6.25%, 7/15/32 | | | 342,000 | | | | 404,024 | | |
| | | | | | | | 897,174 | | |
| FEDERAL NATIONAL MORTGAGE ASSOCIATION—0.8% | |
| 5.00%, 4/15/15 | | | 241,000 | | | | 251,316 | | |
| | | Principal
Amount | | Market
Value | |
| UNITED STATES TREASURY BONDS/NOTES—6.0% | |
| 3.50%, 2/15/10 | | $ | 101,000 | | | $ | 101,971 | | |
| 4.75%, 5/15/14 | | | 255,000 | | | | 271,336 | | |
| 7.50%, 11/15/16 | | | 155,000 | | | | 195,433 | | |
| 8.125%, 8/15/19 | | | 357,000 | | | | 484,851 | | |
| 7.625%, 2/15/25 | | | 351,000 | | | | 485,285 | | |
| 6.25%, 5/15/30 | | | 235,000 | | | | 295,843 | | |
| | | | | | | | 1,834,719 | | |
Total United States Government &
Agencies Obligations
(Amortized Cost $2,889,821) | | | | | | | 2,983,209 | | |
| SOVEREIGN BONDS—1.1% | |
| SOVEREIGN—1.1% | |
Province of Quebec Canada (Canada)
7.50%, 9/15/29 | | | 120,000 | | | | 157,541 | | |
United Mexican States, Series A MTN (Mexico)
6.375%, 1/16/13 | | | 174,000 | | | | 185,223 | | |
Total Sovereign Bonds
(Amortized Cost $335,153) | | | | | | | 342,764 | | |
Total Investments—98.9%
(Amortized Cost $30,115,015) | | | | | | $ | 29,977,086 | | |
| Other assets less liabilities—1.1% | | | | | | | 320,459 | | |
| Net Assets—100.0% | | | | | | $ | 30,297,545 | | |
MTN - Medium Term Note.
REIT - Real Estate Investment Trust.
* Non-income producing security.
See Notes to Financial Statements.
17
TDAX Funds, Inc.
SCHEDULE OF INVESTMENTS
TDAX INDEPENDENCE 2030 EXCHANGE-TRADED FUND
November 30, 2007 (Unaudited)
| | | Number
of Shares | | Market
Value | |
| COMMON STOCKS—88.5% | |
| CONSUMER DISCRETIONARY—9.0% | |
| Aeropostale, Inc.* | | | 1,639 | | | $ | 41,876 | | |
| ArvinMeritor, Inc. | | | 1,539 | | | | 15,559 | | |
| Brookfield Homes Corp. | | | 1,639 | | | | 27,634 | | |
| Coach, Inc.* | | | 2,724 | | | | 101,169 | | |
| Comcast Corp., Class A* | | | 6,538 | | | | 134,291 | | |
Compagnie Financiere Richemont SA,
Class A (China) | | | 552 | | | | 37,988 | | |
| Daimler AG (Germany) | | | 512 | | | | 52,270 | | |
| DeVry, Inc. | | | 547 | | | | 30,074 | | |
| DIRECTV Group (The), Inc.* | | | 5,991 | | | | 148,996 | | |
| Gemstar-TV Guide International, Inc.* | | | 4,906 | | | | 28,945 | | |
| Home Depot (The), Inc. | | | 974 | | | | 27,817 | | |
| HONDA MOTOR Co. Ltd. (Japan) | | | 2,500 | | | | 84,742 | | |
| J. Crew Group, Inc.* | | | 756 | | | | 36,326 | | |
| Jo-Ann Stores, Inc.* | | | 1,495 | | | | 24,608 | | |
| Jos. A. Bank Clothiers, Inc.* | | | 1,092 | | | | 28,272 | | |
| Lear Corp.* | | | 1,015 | | | | 29,882 | | |
| Liberty Global, Inc., Class A* | | | 1,557 | | | | 63,245 | | |
| Live Nation, Inc.* | | | 1,433 | | | | 19,231 | | |
| Matsushita Electric Industrial Co. Ltd. (Japan) | | | 1,000 | | | | 20,149 | | |
| McDonald's Corp. | | | 2,724 | | | | 159,272 | | |
| Men's Wearhouse (The), Inc. | | | 547 | | | | 18,882 | | |
| New York & Co., Inc.* | | | 4,906 | | | | 36,157 | | |
| Omnicom Group, Inc. | | | 492 | | | | 23,985 | | |
| Priceline.com, Inc.* | | | 547 | | | | 62,249 | | |
| Regis Corp. | | | 547 | | | | 16,076 | | |
| Rent-A-Center, Inc.* | | | 547 | | | | 7,746 | | |
| Sony Corp. (Japan) | | | 1,500 | | | | 81,271 | | |
| Sotheby's | | | 1,055 | | | | 39,510 | | |
| Speedway Motorsports, Inc. | | | 547 | | | | 18,461 | | |
| Steven Madden Ltd.* | | | 1,639 | | | | 37,254 | | |
| Target Corp. | | | 2,181 | | | | 130,991 | | |
| Tempur-Pedic International, Inc. | | | 1,094 | | | | 32,481 | | |
| Time Warner, Inc. | | | 5,991 | | | | 103,405 | | |
| Toyota Motor Corp. (Japan) | | | 4,000 | | | | 225,017 | | |
| Universal Technical Institute, Inc.* | | | 1,639 | | | | 28,896 | | |
| Viacom, Inc., Class B* | | | 3,662 | | | | 153,877 | | |
| Yum! Brands, Inc. | | | 3,514 | | | | 130,545 | | |
| | | | 2,259,149 | | |
| CONSUMER STAPLES—7.8% | |
| Altria Group, Inc. | | | 3,271 | | | | 253,699 | | |
British American Tobacco PLC
(United Kingdom) | | | 1,465 | | | | 56,841 | | |
| Carrefour SA (France) | | | 353 | | | | 27,415 | | |
| Coca-Cola (The) Co. | | | 3,271 | | | | 203,129 | | |
| ConAgra Foods, Inc. | | | 4,361 | | | | 109,112 | | |
| CVS Caremark Corp. | | | 1,094 | | | | 43,858 | | |
| Diageo PLC (United Kingdom) | | | 2,042 | | | | 45,891 | | |
| Groupe DANONE (France) | | | 124 | | | | 10,968 | | |
| Kraft Foods, Inc., Class A | | | 2,724 | | | | 94,114 | | |
| Longs Drug Stores Corp. | | | 547 | | | | 28,947 | | |
| Nestle SA (China) | | | 452 | | | | 217,383 | | |
| Pilgrim's Pride Corp. | | | 1,092 | | | | 28,479 | | |
| Procter & Gamble (The) Co. | | | 5,148 | | | | 380,953 | | |
| Seaboard Corp. | | | 15 | | | | 22,635 | | |
| Tesco PLC (United Kingdom) | | | 9,501 | | | | 93,575 | | |
| | | Number
of Shares | | Market
Value | |
| CONSUMER STAPLES (Continued) | |
| Unilever NV (Netherlands) | | | 2,067 | | | $ | 73,272 | | |
| Unilever PLC (United Kingdom) | | | 107 | | | | 3,925 | | |
| Wal-Mart Stores, Inc. | | | 5,383 | | | | 257,847 | | |
| | | | 1,952,043 | | |
| ENERGY—8.5% | |
| Alon USA Energy, Inc. | | | 1,092 | | | | 30,379 | | |
| BG Group PLC (United Kingdom) | | | 2,918 | | | | 61,078 | | |
| BP PLC (United Kingdom) | | | 17,883 | | | | 216,944 | | |
| Chevron Corp. | | | 3,271 | | | | 287,096 | | |
| ConocoPhillips | | | 2,724 | | | | 218,029 | | |
| Dril-Quip, Inc.* | | | 547 | | | | 30,862 | | |
| ENI S.p.A (Italy) | | | 915 | | | | 32,731 | | |
| EOG Resources, Inc. | | | 2,186 | | | | 180,957 | | |
| Exxon Mobil Corp. | | | 4,496 | | | | 400,863 | | |
| International Coal Group, Inc.* | | | 7,774 | | | | 38,948 | | |
| Newpark Resources, Inc.* | | | 5,991 | | | | 32,232 | | |
| Occidental Petroleum Corp. | | | 1,092 | | | | 76,189 | | |
| Oil States International, Inc.* | | | 547 | | | | 17,345 | | |
| Oilsands Quest, Inc.* | | | 6,603 | | | | 29,714 | | |
| PetroHawk Energy Corp.* | | | 2,181 | | | | 35,550 | | |
| Petroleum Development Corp.* | | | 547 | | | | 27,716 | | |
Royal Dutch Shell PLC,
Class A (United Kingdom) | | | 3,246 | | | | 131,216 | | |
Royal Dutch Shell PLC,
Class B (United Kingdom) | | | 2,415 | | | | 96,929 | | |
| Schlumberger Ltd. (Netherlands Antilles) | | | 1,025 | | | | 95,786 | | |
| Total SA (France) | | | 856 | | | | 69,395 | | |
| W-H Energy Services, Inc.* | | | 547 | | | | 27,624 | | |
| | | | 2,137,583 | | |
| FINANCIALS—18.7% | |
| ABN AMRO Holding NV (Netherlands) | | | 1,045 | | | | 55,220 | | |
| Allianz SE (Germany) | | | 214 | | | | 44,291 | | |
| American Express Co. | | | 6,338 | | | | 373,814 | | |
| American International Group, Inc. | | | 1,669 | | | | 97,019 | | |
| Aspen Insurance Holdings Ltd. (Bermuda) | | | 990 | | | | 28,512 | | |
| Assicurazioni Generali S.p.A (Italy) | | | 313 | | | | 14,403 | | |
| Aviva PLC (United Kingdom) | | | 2,689 | | | | 37,708 | | |
| AXA (France) | | | 851 | | | | 34,888 | | |
| Banco Bilbao Vizcaya Argentaria, S.A. (Spain) | | | 462 | | | | 11,535 | | |
| Banco Santander S.A. (Spain) | | | 10,769 | | | | 231,417 | | |
| Bank of America Corp. | | | 3,814 | | | | 175,940 | | |
| Barclays PLC (United Kingdom) | | | 6,478 | | | | 74,990 | | |
| BNP Paribas (France) | | | 398 | | | | 45,071 | | |
| Calamos Asset Management, Inc., Class A | | | 1,092 | | | | 32,334 | | |
| Cascade Bancorp | | | 1,639 | | | | 28,420 | | |
| Charles Schwab (The) Corp. | | | 7,120 | | | | 173,087 | | |
| Citigroup, Inc. | | | 4,361 | | | | 145,221 | | |
| CME Group, Inc. | | | 100 | | | | 65,860 | | |
| Cohen & Steers, Inc. | | | 1,092 | | | | 30,980 | | |
| Commerce Group (The), Inc. | | | 547 | | | | 19,665 | | |
| Commonwealth Bank of Australia (Australia) | | | 29 | | | | 1,530 | | |
| Credit Suisse Group (China) | | | 1,485 | | | | 89,635 | | |
| Deerfield Triarc Capital Corp. REIT | | | 5,312 | | | | 39,893 | | |
| Delphi Financial Group, Inc., Class A | | | 147 | | | | 5,651 | | |
| Digital Realty Trust, Inc. REIT | | | 1,092 | | | | 41,671 | | |
See Notes to Financial Statements.
18
TDAX Funds, Inc.
SCHEDULE OF INVESTMENTS (CONTINUED)
TDAX INDEPENDENCE 2030 EXCHANGE-TRADED FUND
November 30, 2007 (Unaudited)
| | | Number
of Shares | | Market
Value | |
| FINANCIALS (Continued) | |
| Dollar Financial Corp.* | | | 1,092 | | | $ | 32,629 | | |
| Fortis (Belgium) | | | 613 | | | | 16,475 | | |
| Franklin Resources, Inc. | | | 1,439 | | | | 177,256 | | |
| GAMCO Investors, Inc., Class A | | | 547 | | | | 29,155 | | |
| GFI Group, Inc.* | | | 547 | | | | 53,267 | | |
| Goldman Sachs Group (The), Inc. | | | 200 | | | | 45,328 | | |
Greenlight Capital Re Ltd.,
Class A (Cayman Islands)* | | | 1,261 | | | | 27,402 | | |
| HBOS PLC (United Kingdom) | | | 3,834 | | | | 62,909 | | |
| Highwoods Properties, Inc. REIT | | | 1,092 | | | | 34,649 | | |
| HSBC Holdings PLC (United Kingdom) | | | 10,088 | | | | 172,162 | | |
| ING Groep N.V. (Netherlands) | | | 1,684 | | | | 65,578 | | |
| International Securities Exchange Holdings, Inc. | | | 547 | | | | 36,753 | | |
| Intesa Sanpaolo S.p.A (Italy) | | | 1,030 | | | | 8,240 | | |
| JPMorgan Chase & Co. | | | 2,724 | | | | 124,269 | | |
| Lincoln National Corp. | | | 2,524 | | | | 155,403 | | |
| Lloyds TSB Group PLC (United Kingdom) | | | 4,724 | | | | 48,081 | | |
| Mizuho Financial Group, Inc. (Japan) | | | 10 | | | | 53,640 | | |
| Morgan Stanley | | | 392 | | | | 20,666 | | |
Muenchener Rueckversicherungs-Gesellschaft
AG (Germany) | | | 44 | | | | 8,042 | | |
| National Australia Bank Ltd. (Australia) | | | 328 | | | | 11,110 | | |
| National City Corp. | | | 6,191 | | | | 122,334 | | |
| Nationwide Health Properties, Inc. REIT | | | 547 | | | | 17,110 | | |
| Nomura Holdings, Inc. (Japan) | | | 3,000 | | | | 53,766 | | |
| Nordea Bank AB (Sweden) | | | 2,000 | | | | 33,561 | | |
| Northern Trust Corp. | | | 1,092 | | | | 88,441 | | |
| NYSE Euronext | | | 1,378 | | | | 119,335 | | |
| Odyssey Re Holdings Corp. | | | 547 | | | | 21,081 | | |
| optionsXpress Holdings, Inc. | | | 1,092 | | | | 33,208 | | |
| Platinum Underwriters Holdings Ltd. (Bermuda) | | | 711 | | | | 25,824 | | |
| Post Properties, Inc. REIT | | | 547 | | | | 19,862 | | |
| Prudential PLC (United Kingdom) | | | 2,540 | | | | 35,462 | | |
| Ramco-Gershenson Properties Trust REIT | | | 547 | | | | 13,839 | | |
| Realty Income Corp. REIT | | | 1,092 | | | | 31,122 | | |
Royal Bank of Scotland Group
PLC (United Kingdom) | | | 9,593 | | | | 90,536 | | |
| Simon Property Group, Inc. REIT | | | 1,129 | | | | 111,150 | | |
| SLM Corp.* | | | 2,181 | | | | 83,052 | | |
| Societe Generale (France) | | | 209 | | | | 32,390 | | |
| Sumitomo Mitsui Financial Group, Inc. (Japan) | | | 10 | | | | 85,734 | | |
| SVB Financial Group* | | | 547 | | | | 28,160 | | |
| Swiss Re (China) | | | 104 | | | | 7,733 | | |
| UBS AG (China) | | | 2,704 | | | | 136,990 | | |
| UniCredito Italiano S.p.A (Italy) | | | 5,582 | | | | 47,727 | | |
| Vornado Realty Trust REIT | | | 1,092 | | | | 98,280 | | |
| Wachovia Corp. | | | 1,639 | | | | 70,477 | | |
| Waddell & Reed Financial, Inc., Class A | | | 1,092 | | | | 37,325 | | |
| Washington Real Estate Investment Trust REIT | | | 547 | | | | 17,526 | | |
| Wells Fargo & Co. | | | 1,704 | | | | 55,261 | | |
| Westpac Banking Corp. (Australia) | | | 1,030 | | | | 25,807 | | |
| Zurich Financial Services AG (China) | | | 194 | | | | 56,574 | | |
| | | | 4,681,436 | | |
| HEALTH CARE—11.6% | |
| Abbott Laboratories | | | 2,759 | | | | 158,670 | | |
| Alexion Pharmaceuticals, Inc.* | | | 467 | | | | 33,960 | | |
| AMERIGROUP Corp.* | | | 1,092 | | | | 37,532 | | |
| | | Number
of Shares | | Market
Value | |
| HEALTH CARE (Continued) | |
| AstraZeneca PLC (United Kingdom) | | | 731 | | | $ | 34,720 | | |
| Auxilium Pharmaceuticals, Inc.* | | | 1,537 | | | | 43,113 | | |
| Becton, Dickinson & Co. | | | 2,081 | | | | 172,161 | | |
| CIGNA, Corp. | | | 1,639 | | | | 87,867 | | |
| Dendreon Corp.* | | | 4,065 | | | | 20,325 | | |
| Genzyme Corp.* | | | 2,181 | | | | 163,422 | | |
| GlaxoSmithKline PLC (United Kingdom) | | | 3,777 | | | | 100,027 | | |
| Hologic, Inc.* | | | 547 | | | | 36,315 | | |
| Illumina, Inc.* | | | 547 | | | | 31,611 | | |
| Johnson & Johnson | | | 4,606 | | | | 312,011 | | |
| Magellan Health Services, Inc.* | | | 547 | | | | 24,861 | | |
| Matria Healthcare, Inc.* | | | 1,092 | | | | 24,810 | | |
| McKesson Corp. | | | 1,639 | | | | 109,370 | | |
| Merck & Co., Inc. | | | 3,614 | | | | 214,528 | | |
| Novartis AG (China) | | | 2,687 | | | | 153,145 | | |
| Perrigo Co. | | | 1,092 | | | | 33,743 | | |
| Pfizer, Inc. | | | 14,098 | | | | 334,969 | | |
| Psychiatric Solutions, Inc.* | | | 547 | | | | 19,982 | | |
| Roche Holding AG (China) | | | 811 | | | | 154,794 | | |
| Sanofi-Aventis SA (France) | | | 209 | | | | 19,944 | | |
| Sirona Dental Systems, Inc.* | | | 1,092 | | | | 29,550 | | |
| STERIS Corp. | | | 1,092 | | | | 30,532 | | |
| Takeda Pharmaceutical Co. Ltd. (Japan) | | | 500 | | | | 32,004 | | |
| Thermo Fisher Scientific, Inc.* | | | 3,271 | | | | 188,540 | | |
| UnitedHealth Group, Inc. | | | 2,724 | | | | 149,820 | | |
| Ventana Medical Systems, Inc.* | | | 547 | | | | 48,585 | | |
| WellPoint, Inc.* | | | 1,092 | | | | 91,957 | | |
| | | | 2,892,868 | | |
| INDUSTRIALS—8.5% | |
| ABB Ltd. REG (China) | | | 2,470 | | | | 72,587 | | |
| ABM Industries, Inc. | | | 1,094 | | | | 22,318 | | |
| Aecom Technology Corp.* | | | 1,273 | | | | 33,849 | | |
| Allegiant Travel Co.* | | | 1,087 | | | | 38,480 | | |
| Belden CDT, Inc. | | | 547 | | | | 25,189 | | |
| Boeing Co. | | | 1,092 | | | | 101,054 | | |
| Caterpillar, Inc. | | | 1,639 | | | | 117,844 | | |
| CDI Corp. | | | 1,092 | | | | 29,124 | | |
| Compagnie de Saint-Gobain (France) | | | 229 | | | | 22,605 | | |
| Danaher Corp. | | | 547 | | | | 47,491 | | |
| Emerson Electric Co. | | | 1,092 | | | | 62,266 | | |
| FedEx Corp. | | | 547 | | | | 53,863 | | |
| Fuel Tech, Inc.* | | | 1,244 | | | | 30,366 | | |
| General Electric Co. | | | 7,085 | | | | 271,285 | | |
| Granite Construction, Inc. | | | 547 | | | | 22,438 | | |
| Illinois Tool Works, Inc. | | | 1,092 | | | | 60,606 | | |
| Ingersoll-Rand Co. Ltd., Class A (Bermuda) | | | 612 | | | | 31,604 | | |
| JetBlue Airways Corp.* | | | 3,814 | | | | 26,698 | | |
Koninklijke (Royal) Philips Electronics
N.V. (Netherlands) | | | 1,070 | | | | 45,013 | | |
| Manpower, Inc. | | | 1,092 | | | | 66,721 | | |
| Mitsubishi Corp. (Japan) | | | 1,500 | | | | 43,002 | | |
| Northrop Grumman Corp. | | | 1,674 | | | | 131,894 | | |
| PACCAR, Inc. | | | 820 | | | | 41,500 | | |
| PHH Corp.* | | | 1,092 | | | | 24,199 | | |
| Raven Industries, Inc. | | | 1,092 | | | | 37,925 | | |
| Siemens AG (Germany) | | | 408 | | | | 62,116 | | |
| Simpson Manufacturing Co., Inc. | | | 1,092 | | | | 29,058 | | |
See Notes to Financial Statements.
19
TDAX Funds, Inc.
SCHEDULE OF INVESTMENTS (CONTINUED)
TDAX INDEPENDENCE 2030 EXCHANGE-TRADED FUND
November 30, 2007 (Unaudited)
| | | Number
of Shares | | Market
Value | |
| INDUSTRIALS (Continued) | |
| Trane, Inc. | | | 1,639 | | | $ | 60,168 | | |
| Union Pacific Corp. | | | 547 | | | | 68,999 | | |
| United Parcel Service, Inc., Class B | | | 1,639 | | | | 120,762 | | |
| United Stationers, Inc.* | | | 547 | | | | 27,711 | | |
| United Technologies Corp. | | | 4,161 | | | | 311,117 | | |
| | | | 2,139,852 | | |
| INFORMATION TECHNOLOGY—12.0% | |
| Accenture Ltd., Class A (Bermuda) | | | 1,261 | | | | 43,580 | | |
| Agilysys, Inc. | | | 1,639 | | | | 22,766 | | |
| Amkor Technology, Inc.* | | | 3,271 | | | | 26,953 | | |
| Benchmark Electronics, Inc.* | | | 582 | | | | 10,447 | | |
| CANON, Inc. (Japan) | | | 2,000 | | | | 104,755 | | |
| Cisco Systems, Inc.* | | | 4,361 | | | | 122,195 | | |
| eBay, Inc.* | | | 2,724 | | | | 91,336 | | |
| FLIR Systems, Inc.* | | | 547 | | | | 37,595 | | |
| Foundry Networks, Inc.* | | | 1,639 | | | | 28,896 | | |
| Google, Inc., Class A* | | | 239 | | | | 165,627 | | |
| Hewlett-Packard Co. | | | 1,639 | | | | 83,851 | | |
| Intel Corp. | | | 3,814 | | | | 99,469 | | |
| International Business Machines Corp. | | | 1,092 | | | | 114,857 | | |
| Itron, Inc.* | | | 547 | | | | 42,420 | | |
| Ixia* | | | 3,814 | | | | 39,399 | | |
| Jack Henry & Associates, Inc. | | | 1,092 | | | | 29,222 | | |
| Juniper Networks, Inc.* | | | 2,181 | | | | 64,819 | | |
| Lawson Software, Inc.* | | | 2,619 | | | | 25,457 | | |
| MICROS Systems, Inc.* | | | 547 | | | | 39,461 | | |
| Microsoft Corp. | | | 8,172 | | | | 274,579 | | |
| MKS Instruments, Inc.* | | | 547 | | | | 9,939 | | |
| Motorola, Inc. | | | 19,681 | | | | 314,306 | | |
| Nintendo Co. Ltd. (Japan) | | | 32 | | | | 19,473 | | |
| Nokia Oyj (Finland) | | | 3,072 | | | | 122,967 | | |
| Nuance Communications, Inc.* | | | 1,793 | | | | 36,183 | | |
| ON Semiconductor Corp.* | | | 3,271 | | | | 30,060 | | |
| Orbcomm, Inc.* | | | 3,998 | | | | 31,144 | | |
| Perficient, Inc.* | | | 547 | | | | 9,173 | | |
| Perot Systems Corp., Class A* | | | 1,639 | | | | 21,553 | | |
| SAIC, Inc.* | | | 751 | | | | 14,975 | | |
| SAP AG (Germany) | | | 258 | | | | 13,232 | | |
| SAVVIS, Inc.* | | | 811 | | | | 25,984 | | |
| Sonus Networks, Inc.* | | | 5,100 | | | | 33,558 | | |
| Spansion, Inc., Class A* | | | 1,020 | | | | 5,447 | | |
| Sun Microsystems, Inc.* | | | 24,606 | | | | 511,313 | | |
| Sybase, Inc.* | | | 1,092 | | | | 27,999 | | |
| Symantec Corp.* | | | 3,814 | | | | 67,889 | | |
| Telefonaktiebolaget LM Ericsson (Sweden) | | | 35,000 | | | | 85,467 | | |
| THQ, Inc.* | | | 1,092 | | | | 26,699 | | |
| ValueClick, Inc.* | | | 1,639 | | | | 38,746 | | |
| Veeco Instruments, Inc.* | | | 1,639 | | | | 27,502 | | |
| Xerox Corp. | | | 4,361 | | | | 73,614 | | |
| | | | 3,014,907 | | |
| MATERIALS—5.1% | |
| A. Schulman, Inc. | | | 1,094 | | | | 23,587 | | |
| Alcoa, Inc. | | | 1,639 | | | | 59,610 | | |
| Anglo American PLC (United Kingdom) | | | 1,500 | | | | 101,348 | | |
| AptarGroup, Inc. | | | 547 | | | | 23,089 | | |
| ArcelorMittal (Luxembourg) | | | 169 | | | | 12,505 | | |
| | | Number
of Shares | | Market
Value | |
| MATERIALS (Continued) | |
| BASF AG (Germany) | | | 214 | | | $ | 29,766 | | |
| Bayer AG (Germany) | | | 338 | | | | 27,952 | | |
| BHP Billiton Ltd. (Australia) | | | 1,423 | | | | 54,090 | | |
| BHP Billiton PLC (United Kingdom) | | | 2,923 | | | | 96,583 | | |
| CF Industries Holdings, Inc. | | | 547 | | | | 49,766 | | |
| Dow Chemical (The) Co. | | | 1,639 | | | | 68,740 | | |
| E.I. du Pont de Nemours & Co. | | | 2,181 | | | | 100,653 | | |
| Glatfelter | | | 1,094 | | | | 16,443 | | |
| Greif, Inc., Class A | | | 547 | | | | 32,311 | | |
| Headwaters, Inc.* | | | 1,639 | | | | 19,668 | | |
| Hercules, Inc. | | | 1,092 | | | | 21,196 | | |
| JFE Holdings, Inc. (Japan) | | | 500 | | | | 27,271 | | |
| Newmont Mining Corp. | | | 200 | | | | 9,938 | | |
| NIPPON STEEL Corp. (Japan) | | | 10,000 | | | | 59,950 | | |
| Quanex Corp. | | | 547 | | | | 27,372 | | |
| Rio Tinto PLC (United Kingdom) | | | 1,000 | | | | 115,966 | | |
| Rockwood Holdings, Inc.* | | | 547 | | | | 18,423 | | |
| Southern Copper Corp. | | | 992 | | | | 109,764 | | |
| Terra Industries, Inc.* | | | 1,184 | | | | 44,732 | | |
| Weyerhaeuser Co. | | | 1,092 | | | | 79,913 | | |
| Xstrata PLC (United Kingdom) | | | 507 | | | | 35,642 | | |
| | | | 1,266,278 | | |
| TELECOMMUNICATION SERVICES—4.0% | |
| AT&T, Inc. | | | 5,991 | | | | 228,916 | | |
| BT Group PLC (United Kingdom) | | | 12,957 | | | | 76,395 | | |
| Golden Telecom, Inc.* | | | 792 | | | | 80,356 | | |
| Koninklijke (Royal) KPN N.V. (Netherlands) | | | 424 | | | | 7,817 | | |
| Qwest Communications International, Inc.* | | | 24,093 | | | | 159,737 | | |
| Telefonica S.A. (Spain) | | | 3,166 | | | | 106,468 | | |
| Time Warner Telecom, Inc., Class A* | | | 1,480 | | | | 33,196 | | |
| Verizon Communications, Inc. | | | 2,724 | | | | 117,704 | | |
| Vodafone Group PLC (United Kingdom) | | | 49,546 | | | | 185,614 | | |
| | | | 996,203 | | |
| UTILITIES—3.3% | |
| ALLETE, Inc. | | | 39 | | | | 1,597 | | |
| American Electric Power Co., Inc. | | | 1,639 | | | | 78,131 | | |
| American States Water Co. | | | 547 | | | | 22,783 | | |
| Constellation Energy Group, Inc. | | | 1,339 | | | | 134,181 | | |
| E.ON AG (Germany) | | | 268 | | | | 54,806 | | |
| Endesa S.A. (Spain) | | | 1,862 | | | | 102,711 | | |
| Enel S.p.A (Italy) | | | 2,614 | | | | 31,425 | | |
| Exelon Corp. | | | 3,306 | | | | 268,017 | | |
| MGE Energy, Inc. | | | 547 | | | | 19,183 | | |
| National Grid PLC (United Kingdom) | | | 267 | | | | 4,510 | | |
| PNM Resources, Inc. | | | 1,094 | | | | 24,265 | | |
| Suez SA (France) | | | 637 | | | | 42,525 | | |
| Tokyo Electric Power (The) Co., Inc. (Japan) | | | 500 | | | | 13,658 | | |
| Westar Energy, Inc. | | | 1,092 | | | | 28,294 | | |
| | | | 826,086 | | |
Total Common Stocks
(Cost $22,731,511) | | | | | | | 22,166,405 | | |
See Notes to Financial Statements.
20
TDAX Funds, Inc.
SCHEDULE OF INVESTMENTS (CONTINUED)
TDAX INDEPENDENCE 2030 EXCHANGE-TRADED FUND
November 30, 2007 (Unaudited)
| | | Principal
Amount | | Market
Value | |
| CORPORATE BONDS—7.8% | |
| CONSUMER DISCRETIONARY—1.1% | |
CBS Corp.
7.875%, 7/30/30 | | $ | 50,000 | | | $ | 54,297 | | |
Comcast Cable Communications Holdings, Inc.
8.375%, 3/15/13 | | | 55,000 | | | | 61,902 | | |
Home Depot, Inc.
5.40%, 3/01/16 | | | 15,000 | | | | 14,238 | | |
News America, Inc.
6.20%, 12/15/34 | | | 56,000 | | | | 54,117 | | |
Time Warner Cable, Inc.
6.55%, 5/01/37 | | | 32,000 | | | | 31,861 | | |
Time Warner, Inc.
7.70%, 5/01/32 | | | 49,000 | | | | 54,006 | | |
Viacom, Inc.
6.25%, 4/30/16 | | | 9,000 | | | | 9,180 | | |
| | | | 279,601 | | |
| CONSUMER STAPLES—0.5% | |
Coca-Cola Enterprises, Inc.
8.50%, 2/01/22 | | | 15,000 | | | | 19,016 | | |
Kroger (The) Co.
5.50%, 2/01/13 | | | 10,000 | | | | 10,247 | | |
Procter & Gamble (The) Co.
5.55%, 3/05/37 | | | 79,000 | | | | 79,163 | | |
Wal-Mart Stores, Inc.
4.55%, 5/01/13 | | | 6,000 | | | | 5,978 | | |
| | | | 114,404 | | |
| ENERGY—0.4% | |
Anadarko Petroleum Corp.
5.95%, 9/15/16 | | | 9,000 | | | | 9,187 | | |
Apache Corp.
5.25%, 4/15/13 | | | 15,000 | | | | 15,395 | | |
Canadian Natural Resources Ltd. (Canada)
5.70%, 5/15/17 | | | 6,000 | | | | 6,029 | | |
ConocoPhillips
5.90%, 10/15/32 | | | 61,000 | | | | 63,226 | | |
Enterprise Products Operating LP, Series B
5.60%, 10/15/14 | | | 6,000 | | | | 6,077 | | |
Spectra Energy Capital LLC
6.25%, 2/15/13 | | | 6,000 | | | | 6,323 | | |
| | | | 106,237 | | |
| FINANCIALS—3.1% | |
Allstate (The) Corp.
5.55%, 5/09/35 | | | 64,000 | | | | 57,705 | | |
American Express Co.
6.80%, 9/01/66 | | | 68,000 | | | | 70,052 | | |
American General Finance Corp., Series H MTN
5.375%, 10/01/12 | | | 84,000 | | | | 83,920 | | |
Bank of America Corp.
4.875%, 1/15/13 | | | 6,000 | | | | 6,002 | | |
Capital One Financial Corp.
6.15%, 9/01/16 | | | 9,000 | | | | 8,385 | | |
Capmark Financial Group, Inc. 144A
6.30%, 5/10/17 | | | 8,000 | | | | 5,522 | | |
| | | Principal
Amount | | Market
Value | |
| FINANCIALS (Continued) | |
Credit Suisse (USA), Inc.
7.125%, 7/15/32 | | $ | 59,000 | | | $ | 66,690 | | |
General Electric Capital Corp., Series A MTN
6.75%, 3/15/32 | | | 55,000 | | | | 63,133 | | |
Goldman Sachs Group, L.P.
5.00%, 10/01/14 | | | 8,000 | | | | 7,819 | | |
HSBC Finance Corp.
6.375%, 11/27/12 | | | 34,000 | | | | 35,529 | | |
Inter-American Development Bank (Supranational)
4.375%, 9/20/12 | | | 35,000 | | | | 35,557 | | |
iStar Financial, Inc., Series 1
5.875%, 3/15/16 | | | 6,000 | | | | 4,916 | | |
Landwirtschaftliche Rentenbank, Series G
MTN (Germany)
5.00%, 11/08/16 | | | 25,000 | | | | 26,204 | | |
Lincoln National Corp.
7.00%, 5/17/66 | | | 109,000 | | | | 109,042 | | |
Marsh & McLennan Cos., Inc.
5.75%, 9/15/15 | | | 10,000 | | | | 10,039 | | |
Morgan Stanley
5.30%, 3/01/13 | | | 6,000 | | | | 5,951 | | |
Royal Bank of Scotland Group PLC
(United Kingdom)
5.00%, 10/01/14 | | | 6,000 | | | | 6,022 | | |
SLM Corp., Series A MTN
5.375%, 5/15/14 | | | 6,000 | | | | 5,303 | | |
Travelers (The) Cos., Inc.
6.25%, 3/15/37 | | | 104,000 | | | | 98,776 | | |
Unilever Capital Corp.
5.90%, 11/15/32 | | | 59,000 | | | | 59,514 | | |
Wells Fargo & Co.
5.00%, 11/15/14 | | | 6,000 | | | | 5,922 | | |
| | | | 772,003 | | |
| HEALTH CARE—0.5% | |
Abbott Laboratories
5.875%, 5/15/16 | | | 8,000 | | | | 8,357 | | |
Bristol-Myers Squibb Co.
5.875%, 11/15/36 | | | 60,000 | | | | 59,749 | | |
Eli Lilly & Co.
5.55%, 3/15/37 | | | 55,000 | | | | 53,766 | | |
WellPoint, Inc.
5.25%, 1/15/16 | | | 8,000 | | | | 7,761 | | |
| | | | 129,633 | | |
| INDUSTRIALS—0.4% | |
Burlington Northern Santa Fe Corp.
6.15%, 5/01/37 | | | 54,000 | | | | 53,309 | | |
CSX Corp.
6.00%, 10/01/36 | | | 56,000 | | | | 53,595 | | |
| | | | 106,904 | | |
| MATERIALS—0.5% | |
BHP Billiton Finance USA Ltd. (Australia)
4.80%, 4/15/13 | | | 20,000 | | | | 19,987 | | |
CRH America, Inc.
6.00%, 9/30/16 | | | 6,000 | | | | 5,941 | | |
See Notes to Financial Statements.
21
TDAX Funds, Inc.
SCHEDULE OF INVESTMENTS (CONTINUED)
TDAX INDEPENDENCE 2030 EXCHANGE-TRADED FUND
November 30, 2007 (Unaudited)
| | | Principal
Amount | | Market
Value | |
| MATERIALS (Continued) | |
Vale Overseas Ltd. (Cayman Islands)
6.875%, 11/21/36 | | $ | 51,000 | | | $ | 53,270 | | |
Weyerhaeuser Co.
7.375%, 3/15/32 | | | 50,000 | | | | 50,371 | | |
| | | | 129,569 | | |
| TELECOMMUNICATION SERVICES—0.5% | |
BellSouth Corp.
6.00%, 11/15/34 | | | 63,000 | | | | 62,309 | | |
Embarq Corp.
7.082%, 6/01/16 | | | 5,000 | | | | 5,223 | | |
Verizon Global Funding Corp.
7.75%, 12/01/30 | | | 50,000 | | | | 59,546 | | |
| | | | 127,078 | | |
| UTILITIES—0.8% | |
Constellation Energy Group
4.55%, 6/15/15 | | | 6,000 | | | | 5,567 | | |
Dominion Resources, Inc., Series C
5.15%, 7/15/15 | | | 6,000 | | | | 5,819 | | |
Exelon Generation Co. LLC
5.35%, 1/15/14 | | | 15,000 | | | | 14,737 | | |
FirstEnergy Corp., Series C
7.375%, 11/15/31 | | | 46,000 | | | | 49,600 | | |
MidAmerican Energy Holdings Co.
6.125%, 4/01/36 | | | 54,000 | | | | 53,937 | | |
Pacific Gas & Electric Co.
6.05%, 3/01/34 | | | 55,000 | | | | 54,614 | | |
| | | | 184,274 | | |
Total Corporate Bonds
(Amortized Cost $1,948,364) | | | | | | | 1,949,703 | | |
UNITED STATES GOVERNMENT & AGENCIES
OBLIGATIONS—2.6% | |
| FEDERAL HOME LOAN MORTGAGE CORP.—0.5% | |
| 6.25%, 7/15/32 | | | 109,000 | | | | 128,768 | | |
| UNITED STATES TREASURY BONDS/NOTES—2.1% | |
| 3.50%, 2/15/10 | | | 84,000 | | | | 84,807 | | |
| 4.75%, 5/15/14 | | | 127,000 | | | | 135,136 | | |
| 8.125%, 8/15/19 | | | 70,000 | | | | 95,069 | | |
| 7.625%, 2/15/25 | | | 50,000 | | | | 69,129 | | |
| 6.25%, 5/15/30 | | | 103,000 | | | | 129,667 | | |
| | | | 513,808 | | |
Total United States Government &
Agencies Obligations
(Amortized Cost $622,976) | | | | | | | 642,576 | | |
| | | Principal
Amount | | Market
Value | |
| SOVEREIGN BONDS—0.1% | |
| SOVEREIGN—0.1% | |
United Mexican States, Series A MTN (Mexico)
6.375%, 1/16/13
(Amortized Cost $21,145) | | $ | 20,000 | | | $ | 21,290 | | |
Total Investments—99.0%
(Amortized Cost $25,323,996) | | | | $ | 24,779,974 | | |
| Other assets less liabilities—1.0% | | | | | 261,384 | | |
| Net Assets—100.0% | | | | $ | 25,041,358 | | |
MTN - Medium Term Note.
REIT - Real Estate Investment Trust.
* Non-income producing security.
144A - Security is exempt from registration under Rule 144A of the Securities Act of 1933. These securities are considered liquid and may be resold in transactions exempt from registration, normally to qualified institutional buyers. At November 30, 2007, the aggregate market value of these securities amounted to $35,392 or 0.1% of net assets.
See Notes to Financial Statements.
22
TDAX Funds, Inc.
SCHEDULE OF INVESTMENTS
TDAX INDEPENDENCE 2040 EXCHANGE-TRADED FUND
November 30, 2007 (Unaudited)
| | | Number
of Shares | | Market
Value | |
| COMMON STOCKS—95.9% | |
| CONSUMER DISCRETIONARY—9.7% | |
| Aeropostale, Inc.* | | | 1,573 | | | $ | 40,190 | | |
| ArvinMeritor, Inc. | | | 2,099 | | | | 21,221 | | |
| Brookfield Homes Corp. | | | 1,577 | | | | 26,588 | | |
| Cabela's, Inc., Class A* | | | 1,051 | | | | 17,384 | | |
| Coach, Inc.* | | | 2,621 | | | | 97,344 | | |
| Comcast Corp., Class A* | | | 6,817 | | | | 140,021 | | |
Compagnie Financiere Richemont SA,
Class A (China) | | | 591 | | | | 40,672 | | |
| Daimler AG (Germany) | | | 511 | | | | 52,167 | | |
| DeVry, Inc. | | | 531 | | | | 29,194 | | |
| DIRECTV Group (The), Inc.* | | | 5,766 | | | | 143,400 | | |
| Fleetwood Enterprises, Inc.* | | | 3,672 | | | | 20,086 | | |
| Gemstar-TV Guide International, Inc.* | | | 5,244 | | | | 30,940 | | |
| Home Depot (The), Inc. | | | 2,099 | | | | 59,947 | | |
| HONDA MOTOR Co. Ltd. (Japan) | | | 1,500 | | | | 50,845 | | |
| J. Crew Group, Inc.* | | | 801 | | | | 38,488 | | |
| Jo-Ann Stores, Inc.* | | | 1,587 | | | | 26,122 | | |
| Jos. A. Bank Clothiers, Inc.* | | | 1,051 | | | | 27,210 | | |
| Lear Corp.* | | | 1,073 | | | | 31,589 | | |
| Liberty Global, Inc., Class A* | | | 1,642 | | | | 66,698 | | |
| Live Nation, Inc.* | | | 1,523 | | | | 20,439 | | |
| Matsushita Electric Industrial Co. Ltd. (Japan) | | | 1,000 | | | | 20,149 | | |
| McDonald's Corp. | | | 2,621 | | | | 153,250 | | |
| Men's Wearhouse (The), Inc. | | | 531 | | | | 18,330 | | |
| New York & Co., Inc.* | | | 5,244 | | | | 38,648 | | |
| Omnicom Group, Inc. | | | 1,051 | | | | 51,236 | | |
| Priceline.com, Inc.* | | | 531 | | | | 60,428 | | |
| Regis Corp. | | | 1,051 | | | | 30,889 | | |
| Rent-A-Center, Inc.* | | | 531 | | | | 7,519 | | |
| Sony Corp. (Japan) | | | 2,000 | | | | 108,362 | | |
| Sotheby's | | | 1,051 | | | | 39,360 | | |
| Speedway Motorsports, Inc. | | | 531 | | | | 17,921 | | |
| Steven Madden Ltd.* | | | 1,573 | | | | 35,754 | | |
| Target Corp. | | | 2,099 | | | | 126,066 | | |
| Tempur-Pedic International, Inc. | | | 1,051 | | | | 31,204 | | |
| Time Warner, Inc. | | | 6,295 | | | | 108,652 | | |
| Toyota Motor Corp. (Japan) | | | 4,400 | | | | 247,520 | | |
| Universal Technical Institute, Inc.* | | | 1,573 | | | | 27,732 | | |
| Viacom, Inc., Class B* | | | 3,963 | | | | 166,525 | | |
| Vivendi (France) | | | 237 | | | | 10,920 | | |
| Yum! Brands, Inc. | | | 3,692 | | | | 137,158 | | |
| | | | 2,418,168 | | |
| CONSUMER STAPLES—8.6% | |
| Altria Group, Inc. | | | 3,672 | | | | 284,800 | | |
| British American Tobacco PLC (United Kingdom) | | | 1,433 | | | | 55,600 | | |
| Carrefour SA (France) | | | 367 | | | | 28,503 | | |
| Coca-Cola (The) Co. | | | 3,672 | | | | 228,031 | | |
| ConAgra Foods, Inc. | | | 4,718 | | | | 118,044 | | |
| CVS Caremark Corp. | | | 1,051 | | | | 42,135 | | |
| Diageo PLC (United Kingdom) | | | 2,161 | | | | 48,566 | | |
| Kraft Foods, Inc., Class A | | | 3,145 | | | | 108,660 | | |
| Longs Drug Stores Corp. | | | 531 | | | | 28,101 | | |
| Nestle SA (China) | | | 489 | | | | 235,177 | | |
| Pilgrim's Pride Corp. | | | 1,051 | | | | 27,410 | | |
| Procter & Gamble (The) Co. | | | 5,566 | | | | 411,883 | | |
| Reckitt Benckiser Group PLC (United Kingdom) | | | 491 | | | | 29,177 | | |
| | | Number
of Shares | | Market
Value | |
| CONSUMER STAPLES (Continued) | |
| Ruddick Corp. | | | 431 | | | $ | 15,425 | | |
| Seaboard Corp. | | | 20 | | | | 30,180 | | |
| Tesco PLC (United Kingdom) | | | 10,391 | | | | 102,340 | | |
| Unilever NV (Netherlands) | | | 1,787 | | | | 63,347 | | |
| Unilever PLC (United Kingdom) | | | 566 | | | | 20,762 | | |
| Wal-Mart Stores, Inc. | | | 5,791 | | | | 277,389 | | |
| | | | 2,155,530 | | |
| ENERGY—9.3% | |
| Alon USA Energy, Inc. | | | 1,051 | | | | 29,239 | | |
| BG Group PLC (United Kingdom) | | | 3,090 | | | | 64,679 | | |
| BP PLC (United Kingdom) | | | 18,943 | | | | 229,803 | | |
| Chevron Corp. | | | 3,145 | | | | 276,037 | | |
| ConocoPhillips | | | 3,045 | | | | 243,722 | | |
| Dril-Quip, Inc.* | | | 531 | | | | 29,959 | | |
| ENI S.p.A (Italy) | | | 1,207 | | | | 43,176 | | |
| EOG Resources, Inc. | | | 2,099 | | | | 173,755 | | |
| Exxon Mobil Corp. | | | 4,844 | | | | 431,890 | | |
| International Coal Group, Inc.* | | | 8,239 | | | | 41,277 | | |
| Newpark Resources, Inc.* | | | 6,295 | | | | 33,867 | | |
| Occidental Petroleum Corp. | | | 1,051 | | | | 73,328 | | |
| Oil States International, Inc.* | | | 1,051 | | | | 33,327 | | |
| Oilsands Quest, Inc.* | | | 6,996 | | | | 31,482 | | |
| PetroHawk Energy Corp.* | | | 2,099 | | | | 34,214 | | |
| Petroleum Development Corp.* | | | 1,051 | | | | 53,254 | | |
| Repsol YPF, S.A. (Spain) | | | 686 | | | | 25,355 | | |
Royal Dutch Shell PLC, Class A
(United Kingdom) | | | 3,437 | | | | 138,937 | | |
Royal Dutch Shell PLC, Class B
(United Kingdom) | | | 2,556 | | | | 102,588 | | |
| Schlumberger Ltd. (Netherlands Antilles) | | | 1,088 | | | | 101,674 | | |
| Ship Finance International Ltd. (Bermuda) | | | 1,026 | | | | 26,132 | | |
| Total SA (France) | | | 911 | | | | 73,854 | | |
| W-H Energy Services, Inc.* | | | 531 | | | | 26,816 | | |
| | | | 2,318,365 | | |
| FINANCIALS—20.5% | |
| ABN AMRO Holding NV (Netherlands) | | | 1,052 | | | | 55,590 | | |
| Allianz SE (Germany) | | | 225 | | | | 46,568 | | |
| American Express Co. | | | 6,837 | | | | 403,246 | | |
| American International Group, Inc. | | | 1,819 | | | | 105,738 | | |
| Aspen Insurance Holdings Ltd. (Bermuda) | | | 1,046 | | | | 30,125 | | |
| Assicurazioni Generali S.p.A (Italy) | | | 816 | | | | 37,550 | | |
Australia & New Zealand Banking Group Ltd.
(Australia) | | | 939 | | | | 23,386 | | |
| Aviva PLC (United Kingdom) | | | 766 | | | | 10,742 | | |
| AXA (France) | | | 906 | | | | 37,143 | | |
| Banco Bilbao Vizcaya Argentaria, S.A. (Spain) | | | 496 | | | | 12,384 | | |
| Banco Santander S.A. (Spain) | | | 10,503 | | | | 225,702 | | |
| Bank of America Corp. | | | 3,672 | | | | 169,389 | | |
| Barclays PLC (United Kingdom) | | | 6,862 | | | | 79,435 | | |
| BNP Paribas (France) | | | 422 | | | | 47,789 | | |
| Calamos Asset Management, Inc., Class A | | | 531 | | | | 15,723 | | |
| Cascade Bancorp | | | 1,573 | | | | 27,276 | | |
| Charles Schwab (The) Corp. | | | 7,683 | | | | 186,774 | | |
| Citigroup, Inc. | | | 4,718 | | | | 157,109 | | |
| CME Group, Inc. | | | 100 | | | | 65,860 | | |
See Notes to Financial Statements.
23
TDAX Funds, Inc.
SCHEDULE OF INVESTMENTS (CONTINUED)
TDAX INDEPENDENCE 2040 EXCHANGE-TRADED FUND
November 30, 2007 (Unaudited)
| | | Number
of Shares | | Market
Value | |
| FINANCIALS (Continued) | |
| Commerce Group (The), Inc. | | | 1,051 | | | $ | 37,783 | | |
| Commonwealth Bank of Australia (Australia) | | | 25 | | | | 1,319 | | |
| Credit Suisse Group (China) | | | 1,573 | | | | 94,947 | | |
| Deerfield Triarc Capital Corp. REIT | | | 4,026 | | | | 30,235 | | |
| Delphi Financial Group, Inc., Class A | | | 231 | | | | 8,880 | | |
| Deutsche Bank AG (Germany) | | | 10 | | | | 1,318 | | |
| Digital Realty Trust, Inc. REIT | | | 1,051 | | | | 40,106 | | |
| Dollar Financial Corp.* | | | 1,051 | | | | 31,404 | | |
| Fortis (Belgium) | | | 1,919 | | | | 51,576 | | |
| Franklin Resources, Inc. | | | 1,577 | | | | 194,255 | | |
| GFI Group, Inc.* | | | 531 | | | | 51,709 | | |
| Goldman Sachs Group (The), Inc. | | | 506 | | | | 114,680 | | |
Greenlight Capital Re, Ltd., Class A
(Cayman Islands)* | | | 1,333 | | | | 28,966 | | |
| HBOS PLC (United Kingdom) | | | 4,061 | | | | 66,633 | | |
| Highwoods Properties, Inc. REIT | | | 1,051 | | | | 33,348 | | |
| HSBC Holdings PLC (United Kingdom) | | | 10,688 | | | | 182,402 | | |
| ING Groep N.V. (Netherlands) | | | 1,969 | | | | 76,677 | | |
| International Securities Exchange Holdings, Inc. | | | 531 | | | | 35,678 | | |
| Intesa Sanpaolo S.p.A (Italy) | | | 32 | | | | 256 | | |
| JPMorgan Chase & Co. | | | 3,145 | | | | 143,475 | | |
| Lincoln National Corp. | | | 2,621 | | | | 161,375 | | |
| Lloyds TSB Group PLC (United Kingdom) | | | 4,997 | | | | 50,859 | | |
| Mizuho Financial Group, Inc. (Japan) | | | 10 | | | | 53,640 | | |
| Morgan Stanley | | | 951 | | | | 50,137 | | |
Muenchener Rueckversicherungs-Gesellschaft AG
(Germany) | | | 55 | | | | 10,053 | | |
| National Australia Bank Ltd. (Australia) | | | 861 | | | | 29,164 | | |
| National City Corp. | | | 6,295 | | | | 124,389 | | |
| Nationwide Health Properties, Inc. REIT | | | 1,051 | | | | 32,875 | | |
| Nomura Holdings, Inc. (Japan) | | | 3,500 | | | | 62,727 | | |
| Nordea Bank AB (Sweden) | | | 3,000 | | | | 50,341 | | |
| Northern Trust Corp. | | | 1,573 | | | | 127,397 | | |
| NYSE Euronext | | | 1,463 | | | | 126,696 | | |
| Odyssey Re Holdings Corp. | | | 531 | | | | 20,465 | | |
| OptionsXpress Holdings, Inc. | | | 1,051 | | | | 31,961 | | |
| Platinum Underwriters Holdings Ltd. (Bermuda) | | | 756 | | | | 27,458 | | |
| Post Properties, Inc. REIT | | | 531 | | | | 19,281 | | |
| Prudential PLC (United Kingdom) | | | 2,688 | | | | 37,528 | | |
| Ramco-Gershenson Properties Trust REIT | | | 1,051 | | | | 26,590 | | |
| Realty Income Corp. REIT | | | 1,051 | | | | 29,954 | | |
Royal Bank of Scotland Group PLC
(United Kingdom) | | | 10,149 | | | | 95,783 | | |
| Simon Property Group, Inc. REIT | | | 1,473 | | | | 145,017 | | |
| SLM Corp.* | | | 2,621 | | | | 99,808 | | |
| Societe Generale (France) | | | 215 | | | | 33,320 | | |
| Sumitomo Mitsui Financial Group, Inc. (Japan) | | | 10 | | | | 85,734 | | |
| SVB Financial Group* | | | 531 | | | | 27,336 | | |
| Swiss Re (China) | | | 155 | | | | 11,525 | | |
| UBS AG (China) | | | 2,860 | | | | 144,893 | | |
| UniCredito Italiano S.p.A (Italy) | | | 7,723 | | | | 66,033 | | |
| Vornado Realty Trust REIT | | | 1,051 | | | | 94,590 | | |
| Wachovia Corp. | | | 1,573 | | | | 67,639 | | |
| Waddell & Reed Financial, Inc., Class A | | | 1,051 | | | | 35,923 | | |
| Washington Real Estate Investment Trust REIT | | | 431 | | | | 13,809 | | |
| Wells Fargo & Co. | | | 2,346 | | | | 76,081 | | |
| Westpac Banking Corp. (Australia) | | | 1,088 | | | | 27,260 | | |
| Zurich Financial Services AG (China) | | | 205 | | | | 59,781 | | |
| | | | 5,120,598 | | |
| | | Number
of Shares | | Market
Value | |
| HEALTH CARE—12.3% | |
| Abbott Laboratories | | | 3,045 | | | $ | 175,118 | | |
| Alexion Pharmaceuticals, Inc.* | | | 496 | | | | 36,069 | | |
| AMERIGROUP Corp.* | | | 1,051 | | | | 36,123 | | |
| AstraZeneca PLC (United Kingdom) | | | 781 | | | | 37,095 | | |
| Auxilium Pharmaceuticals, Inc.* | | | 1,627 | | | | 45,637 | | |
| Becton, Dickinson & Co. | | | 2,119 | | | | 175,305 | | |
| CIGNA Corp. | | | 2,099 | | | | 112,527 | | |
| Dendreon Corp.* | | | 4,313 | | | | 21,565 | | |
| Genzyme Corp.* | | | 2,621 | | | | 196,392 | | |
| GlaxoSmithKline PLC (United Kingdom) | | | 3,648 | | | | 96,611 | | |
| Hologic, Inc.* | | | 531 | | | | 35,253 | | |
| Illumina, Inc.* | | | 531 | | | | 30,686 | | |
| Johnson & Johnson | | | 4,718 | | | | 319,597 | | |
| Magellan Health Services, Inc.* | | | 531 | | | | 24,134 | | |
| Matria Healthcare, Inc.* | | | 1,577 | | | | 35,829 | | |
| McKesson Corp. | | | 1,573 | | | | 104,966 | | |
| Merck & Co., Inc. | | | 3,896 | | | | 231,267 | | |
| Novartis AG (China) | | | 2,940 | | | | 167,565 | | |
| Perrigo Co. | | | 1,051 | | | | 32,476 | | |
| Pfizer, Inc. | | | 15,226 | | | | 361,771 | | |
| Psychiatric Solutions, Inc.* | | | 531 | | | | 19,397 | | |
| Roche Holding AG (China) | | | 861 | | | | 164,338 | | |
| Sanofi-Aventis SA (France) | | | 327 | | | | 31,204 | | |
| Sirona Dental Systems, Inc.* | | | 1,051 | | | | 28,440 | | |
| STERIS Corp. | | | 1,051 | | | | 29,386 | | |
| Takeda Pharmaceutical Co., Ltd. (Japan) | | | 700 | | | | 44,805 | | |
| Thermo Fisher Scientific, Inc.* | | | 3,672 | | | | 211,654 | | |
| UnitedHealth Group, Inc. | | | 2,621 | | | | 144,155 | | |
| Ventana Medical Systems, Inc.* | | | 531 | | | | 47,163 | | |
| WellPoint, Inc.* | | | 1,051 | | | | 88,505 | | |
| | | | 3,085,033 | | |
| INDUSTRIALS—9.1% | |
| ABB Ltd. (China) | | | 2,611 | | | | 76,731 | | |
| Aecom Technology Corp.* | | | 1,113 | | | | 29,595 | | |
| Allegiant Travel Co.* | | | 1,153 | | | | 40,816 | | |
| Belden CDT, Inc. | | | 1,051 | | | | 48,399 | | |
| Boeing Co. | | | 1,051 | | | | 97,260 | | |
| Brady Corp., Class A | | | 531 | | | | 21,256 | | |
| Caterpillar, Inc. | | | 1,597 | | | | 114,824 | | |
| CDI Corp. | | | 1,051 | | | | 28,030 | | |
| Compagnie de Saint-Gobain (France) | | | 247 | | | | 24,382 | | |
| Danaher Corp. | | | 531 | | | | 46,101 | | |
| Emerson Electric Co. | | | 1,573 | | | | 89,692 | | |
| FedEx Corp. | | | 531 | | | | 52,288 | | |
| Fuel Tech, Inc.* | | | 1,318 | | | | 32,172 | | |
| General Electric Co. | | | 7,863 | | | | 301,074 | | |
| Granite Construction, Inc. | | | 531 | | | | 21,782 | | |
| IKON Office Solutions, Inc. | | | 1,051 | | | | 13,274 | | |
| Illinois Tool Works, Inc. | | | 1,573 | | | | 87,302 | | |
| Ingersoll-Rand Co. Ltd., Class A (Bermuda) | | | 651 | | | | 33,618 | | |
| JetBlue Airways Corp.* | | | 4,046 | | | | 28,322 | | |
Koninklijke (Royal) Philips Electronics N.V.
(Netherlands) | | | 931 | | | | 39,166 | | |
| Manpower, Inc. | | | 1,051 | | | | 64,216 | | |
| Mitsubishi Corp. (Japan) | | | 1,500 | | | | 43,002 | | |
| Northrop Grumman Corp. | | | 1,573 | | | | 123,937 | | |
| PACCAR, Inc. | | | 595 | | | | 30,113 | | |
See Notes to Financial Statements.
24
TDAX Funds, Inc.
SCHEDULE OF INVESTMENTS (CONTINUED)
TDAX INDEPENDENCE 2040 EXCHANGE-TRADED FUND
November 30, 2007 (Unaudited)
| | | Number
of Shares | | Market
Value | |
| INDUSTRIALS (Continued) | |
| PHH Corp.* | | | 1,051 | | | $ | 23,290 | | |
| Raven Industries, Inc. | | | 1,051 | | | | 36,501 | | |
| Siemens AG (Germany) | | | 432 | | | | 65,770 | | |
| Simpson Manufacturing Co., Inc. | | | 1,051 | | | | 27,967 | | |
| Trane, Inc. | | | 1,573 | | | | 57,745 | | |
| Union Pacific Corp. | | | 531 | | | | 66,980 | | |
| United Parcel Service, Inc., Class B | | | 1,573 | | | | 115,899 | | |
| United Stationers, Inc.* | | | 531 | | | | 26,900 | | |
| United Technologies Corp. | | | 4,518 | | | | 337,811 | | |
| Waste Connections, Inc.* | | | 551 | | | | 17,538 | | |
| | | | 2,263,753 | | |
| INFORMATION TECHNOLOGY—12.9% | |
| Accenture Ltd., Class A (Bermuda) | | | 1,333 | | | | 46,068 | | |
| Agilysys, Inc. | | | 2,099 | | | | 29,155 | | |
| Amkor Technology, Inc.* | | | 3,145 | | | | 25,915 | | |
| Anixter International, Inc.* | | | 531 | | | | 34,250 | | |
| Benchmark Electronics, Inc.* | | | 1,051 | | | | 18,865 | | |
| CANON, Inc. (Japan) | | | 2,000 | | | | 104,755 | | |
| Cisco Systems, Inc.* | | | 4,196 | | | | 117,572 | | |
| eBay, Inc.* | | | 3,150 | | | | 105,620 | | |
| Entegris, Inc.* | | | 2,621 | | | | 22,698 | | |
| FLIR Systems, Inc.* | | | 531 | | | | 36,496 | | |
| Foundry Networks, Inc.* | | | 2,099 | | | | 37,005 | | |
| Google, Inc., Class A* | | | 225 | | | | 155,925 | | |
| Hewlett-Packard Co. | | | 2,099 | | | | 107,385 | | |
| Intel Corp. | | | 4,196 | | | | 109,432 | | |
| International Business Machines Corp. | | | 1,051 | | | | 110,544 | | |
| Itron, Inc.* | | | 531 | | | | 41,179 | | |
| Ixia* | | | 3,672 | | | | 37,932 | | |
| Jack Henry & Associates, Inc. | | | 1,051 | | | | 28,125 | | |
| Juniper Networks, Inc.* | | | 2,099 | | | | 62,382 | | |
| Lawson Software, Inc.* | | | 2,770 | | | | 26,924 | | |
| MICROS Systems, Inc.* | | | 531 | | | | 38,306 | | |
| Microsoft Corp. | | | 8,389 | | | | 281,870 | | |
| MKS Instruments, Inc.* | | | 531 | | | | 9,648 | | |
| Motorola, Inc. | | | 21,516 | | | | 343,611 | | |
| MPS Group, Inc.* | | | 2,099 | | | | 23,299 | | |
| Nintendo Co. Ltd. (Japan) | | | 35 | | | | 21,298 | | |
| Nokia Oyj (Finland) | | | 2,713 | | | | 108,597 | | |
| Nuance Communications, Inc.* | | | 1,909 | | | | 38,524 | | |
| ON Semiconductor Corp.* | | | 3,145 | | | | 28,903 | | |
| Orbcomm, Inc.* | | | 4,238 | | | | 33,014 | | |
| Perficient, Inc.* | | | 1,051 | | | | 17,625 | | |
| Perot Systems Corp., Class A* | | | 1,573 | | | | 20,685 | | |
| SAP AG (Germany) | | | 509 | | | | 26,105 | | |
| SAVVIS, Inc.* | | | 861 | | | | 27,586 | | |
| Sonus Networks, Inc.* | | | 5,534 | | | | 36,414 | | |
| Sun Microsystems, Inc.* | | | 26,624 | | | | 553,247 | | |
| Sybase, Inc.* | | | 1,051 | | | | 26,948 | | |
| Symantec Corp.* | | | 4,198 | | | | 74,724 | | |
| Telefonaktiebolaget LM Ericsson (Sweden) | | | 35,000 | | | | 85,467 | | |
| THQ, Inc.* | | | 1,051 | | | | 25,697 | | |
| TIBCO Software, Inc.* | | | 531 | | | | 4,158 | | |
| ValueClick, Inc.* | | | 1,573 | | | | 37,186 | | |
| Veeco Instruments, Inc.* | | | 1,573 | | | | 26,395 | | |
| Xerox Corp. | | | 4,196 | | | | 70,828 | | |
| | | | 3,218,362 | | |
| | | Number
of Shares | | Market
Value | |
| MATERIALS—5.5% | |
| A. Schulman, Inc. | | | 1,573 | | | $ | 33,914 | | |
| Alcoa, Inc. | | | 2,099 | | | | 76,341 | | |
| Anglo American PLC (United Kingdom) | | | 1,792 | | | | 121,077 | | |
| AptarGroup, Inc. | | | 1,051 | | | | 44,363 | | |
| ArcelorMittal (Luxembourg) | | | 462 | | | | 34,185 | | |
| BASF AG (Germany) | | | 175 | | | | 24,341 | | |
| Bayer AG (Germany) | | | 357 | | | | 29,523 | | |
| BHP Billiton Ltd. (Australia) | | | 1,503 | | | | 57,131 | | |
| BHP Billiton PLC (United Kingdom) | | | 2,309 | | | | 76,295 | | |
| CF Industries Holdings, Inc. | | | 531 | | | | 48,310 | | |
| Dow Chemical (The) Co. | | | 2,099 | | | | 88,032 | | |
| E.I. du Pont de Nemours & Co. | | | 2,099 | | | | 96,869 | | |
| Greif, Inc., Class A | | | 531 | | | | 31,366 | | |
| Headwaters, Inc.* | | | 2,099 | | | | 25,188 | | |
| JFE Holdings, Inc. (Japan) | | | 500 | | | | 27,271 | | |
| Newmont Mining Corp. | | | 200 | | | | 9,938 | | |
| NIPPON STEEL Corp. (Japan) | | | 10,000 | | | | 59,950 | | |
| Quanex Corp. | | | 1,051 | | | | 52,592 | | |
| Rio Tinto PLC (United Kingdom) | | | 1,056 | | | | 122,462 | | |
| Rockwood Holdings, Inc.* | | | 1,051 | | | | 35,398 | | |
| Southern Copper Corp. | | | 1,051 | | | | 116,293 | | |
| Terra Industries, Inc.* | | | 1,253 | | | | 47,338 | | |
| Weyerhaeuser Co. | | | 1,051 | | | | 76,912 | | |
| Xstrata PLC (United Kingdom) | | | 541 | | | | 38,032 | | |
| | | | 1,373,121 | | |
| TELECOMMUNICATION SERVICES—4.3% | |
| AT&T, Inc. | | | 6,295 | | | | 240,533 | | |
| BT Group PLC (United Kingdom) | | | 13,873 | | | | 81,795 | | |
| Deutsche Telekom AG (Germany) | | | 100 | | | | 2,216 | | |
| Golden Telecom, Inc.* | | | 851 | | | | 86,342 | | |
| Koninklijke (Royal) KPN N.V. (Netherlands) | | | 789 | | | | 14,546 | | |
| Qwest Communications International, Inc.* | | | 25,523 | | | | 169,218 | | |
| Telefonica S.A. (Spain) | | | 3,425 | | | | 115,177 | | |
| Time Warner Telecom, Inc., Class A* | | | 1,563 | | | | 35,058 | | |
| Verizon Communications, Inc. | | | 3,145 | | | | 135,895 | | |
| Vodafone Group PLC (United Kingdom) | | | 52,483 | | | | 196,618 | | |
| | | | 1,077,398 | | |
| UTILITIES—3.7% | |
| American Electric Power Co., Inc. | | | 2,099 | | | | 100,059 | | |
| American States Water Co. | | | 531 | | | | 22,116 | | |
| Constellation Energy Group, Inc. | | | 1,473 | | | | 147,609 | | |
| E.ON AG (Germany) | | | 277 | | | | 56,647 | | |
| Endesa S.A. (Spain) | | | 1,463 | | | | 80,702 | | |
| Enel S.p.A (Italy) | | | 2,765 | | | | 33,240 | | |
| Exelon Corp. | | | 3,672 | | | | 297,688 | | |
| MGE Energy, Inc. | | | 1,051 | | | | 36,859 | | |
| National Grid PLC (United Kingdom) | | | 1,408 | | | | 23,783 | | |
| PNM Resources, Inc. | | | 1,573 | | | | 34,889 | | |
| Suez SA (France) | | | 650 | | | | 43,393 | | |
| Tokyo Electric Power (The) Co., Inc. (Japan) | | | 1,000 | | | | 27,316 | | |
| Westar Energy, Inc. | | | 1,051 | | | | 27,231 | | |
| | | | 931,532 | | |
Total Common Stocks
(Cost $24,795,391) | | | | | | | 23,961,860 | | |
See Notes to Financial Statements.
25
TDAX Funds, Inc.
SCHEDULE OF INVESTMENTS (CONTINUED)
TDAX INDEPENDENCE 2040 EXCHANGE-TRADED FUND
November 30, 2007 (Unaudited)
| | | Principal
Amount | | Market
Value | |
| CORPORATE BONDS—2.5% | |
| CONSUMER DISCRETIONARY—0.4% | |
CBS Corp.
7.875%, 7/30/30 | | $ | 15,000 | | | $ | 16,289 | | |
Comcast Cable Communications Holdings, Inc.
8.375%, 3/15/13 | | | 15,000 | | | | 16,882 | | |
Comcast Corp.
6.45%, 3/15/37 | | | 11,000 | | | | 11,009 | | |
Home Depot (The), Inc.
5.40%, 3/01/16 | | | 5,000 | | | | 4,746 | | |
News America, Inc.
6.20%, 12/15/34 | | | 16,000 | | | | 15,462 | | |
Time Warner Cable, Inc.
6.55%, 5/01/37 | | | 15,000 | | | | 14,935 | | |
Time Warner Cable, Inc. 144A
6.55%, 5/01/37 | | | 10,000 | | | | 9,957 | | |
Time Warner, Inc.
7.70%, 5/01/32 | | | 14,000 | | | | 15,430 | | |
Viacom, Inc.
6.25%, 4/30/16 | | | 1,000 | | | | 1,020 | | |
| | | | 105,730 | | |
| CONSUMER STAPLES—0.2% | |
CVS Caremark Corp.
6.302%, 6/01/37 | | | 10,000 | | | | 9,806 | | |
Kroger (The) Co.
5.50%, 2/01/13 | | | 4,000 | | | | 4,099 | | |
Pepsi Bottling Group (The), Inc., Series B
7.00%, 3/01/29 | | | 4,000 | | | | 4,606 | | |
Procter & Gamble (The) Co.
5.55%, 3/05/37 | | | 26,000 | | | | 26,053 | | |
Wal-Mart Stores, Inc.
4.55%, 5/01/13 | | | 2,000 | | | | 1,993 | | |
| | | | 46,557 | | |
| ENERGY—0.1% | |
Anadarko Petroleum Corp.
5.95%, 9/15/16 | | | 2,000 | | | | 2,042 | | |
Canadian Natural Resources Ltd. (Canada)
5.70%, 5/15/17 | | | 2,000 | | | | 2,010 | | |
ConocoPhillips
5.90%, 10/15/32 | | | 16,000 | | | | 16,583 | | |
Enterprise Products Operating LP, Series B
5.60%, 10/15/14 | | | 2,000 | | | | 2,026 | | |
Spectra Energy Capital LLC
6.25%, 2/15/13 | | | 2,000 | | | | 2,108 | | |
| | | | 24,769 | | |
| FINANCIALS—0.8% | |
Allstate (The) Corp.
5.55%, 5/09/35 | | | 19,000 | | | | 17,131 | | |
American Express Co.
6.80%, 9/01/66 | | | 40,000 | | | | 41,206 | | |
American General Finance Corp., Series H MTN
5.375%, 10/01/12 | | | 5,000 | | | | 4,995 | | |
Bank of America Corp.
4.875%, 1/15/13 | | | 2,000 | | | | 2,001 | | |
Capital One Financial Corp.
6.15%, 9/01/16 | | | 4,000 | | | | 3,727 | | |
Capmark Financial Group, Inc. 144A
6.30%, 5/10/17 | | | 6,000 | | | | 4,142 | | |
| | | Principal
Amount | | Market
Value | |
| FINANCIALS (Continued) | |
Credit Suisse (USA), Inc.
7.125%, 7/15/32 | | $ | 16,000 | | | $ | 18,085 | | |
General Electric Capital Corp., Series A MTN
6.75%, 3/15/32 | | | 10,000 | | | | 11,479 | | |
Goldman Sachs Group, L.P.
5.00%, 10/01/14 | | | 2,000 | | | | 1,955 | | |
HSBC Finance Corp.
6.375%, 11/27/12 | | | 5,000 | | | | 5,225 | | |
Inter-American Development Bank (Supranational)
4.375%, 9/20/12 | | | 5,000 | | | | 5,080 | | |
iStar Financial, Inc. Series 1
5.875%, 3/15/16 | | | 2,000 | | | | 1,639 | | |
Landwirtschaftliche Rentenbank, Series G
MTN (Germany)
5.00%, 11/08/16 | | | 5,000 | | | | 5,241 | | |
Lincoln National Corp.
7.00%, 5/17/66 | | | 25,000 | | | | 25,009 | | |
Morgan Stanley
5.30%, 3/01/13 | | | 2,000 | | | | 1,984 | | |
Royal Bank of Scotland Group PLC
(United Kingdom)
5.00%, 10/01/14 | | | 2,000 | | | | 2,007 | | |
SLM Corp., Series A MTN
5.375%, 5/15/14 | | | 2,000 | | | | 1,768 | | |
Travelers (The) Cos., Inc.
6.25%, 3/15/37 | | | 26,000 | | | | 24,694 | | |
Unilever Capital Corp.
5.90%, 11/15/32 | | | 19,000 | | | | 19,165 | | |
Wells Fargo & Co.
5.00%, 11/15/14 | | | 2,000 | | | | 1,974 | | |
| | | | 198,507 | | |
| HEALTH CARE—0.2% | |
Abbott Laboratories
5.875%, 5/15/16 | | | 2,000 | | | | 2,089 | | |
Bristol-Myers Squibb Co.
5.875%, 11/15/36 | | | 28,000 | | | | 27,883 | | |
Eli Lilly & Co.
5.55%, 3/15/37 | | | 26,000 | | | | 25,417 | | |
WellPoint, Inc.
5.25%, 1/15/16 | | | 2,000 | | | | 1,940 | | |
| | | | 57,329 | | |
| INDUSTRIALS—0.2% | |
Burlington Northern Santa Fe Corp.
6.15%, 5/01/37 | | | 25,000 | | | | 24,680 | | |
CSX Corp.
6.00%, 10/01/36 | | | 17,000 | | | | 16,270 | | |
| | | | 40,950 | | |
| MATERIALS—0.2% | |
BHP Billiton Finance USA Ltd. (Australia)
4.80%, 4/15/13 | | | 5,000 | | | | 4,997 | | |
CRH America, Inc.
6.00%, 9/30/16 | | | 2,000 | | | | 1,980 | | |
Vale Overseas Ltd. (Cayman Islands)
6.875%, 11/21/36 | | | 21,000 | | | | 21,935 | | |
Weyerhaeuser Co.
7.375%, 3/15/32 | | | 15,000 | | | | 15,111 | | |
| | | | 44,023 | | |
See Notes to Financial Statements.
26
TDAX Funds, Inc.
SCHEDULE OF INVESTMENTS (CONTINUED)
TDAX INDEPENDENCE 2040 EXCHANGE-TRADED FUND
November 30, 2007 (Unaudited)
| | | Principal
Amount | | Market
Value | |
| TELECOMMUNICATION SERVICES—0.2% | |
BellSouth Corp.
6.00%, 11/15/34 | | $ | 20,000 | | | $ | 19,780 | | |
Embarq Corp.
7.082%, 6/01/16 | | | 2,000 | | | | 2,089 | | |
Verizon Global Funding Corp.
7.75%, 12/01/30 | | | 15,000 | | | | 17,864 | | |
| | | | 39,733 | | |
| UTILITIES—0.2% | |
Constellation Energy Group, Inc.
4.55%, 6/15/15 | | | 2,000 | | | | 1,856 | | |
Dominion Resources, Inc., Series C
5.15%, 7/15/15 | | | 2,000 | | | | 1,940 | | |
Exelon Generation Co. LLC
5.35%, 1/15/14 | | | 2,000 | | | | 1,965 | | |
FirstEnergy Corp., Series C
7.375%, 11/15/31 | | | 15,000 | | | | 16,174 | | |
Midamerican Energy Holdings Co.
6.125%, 4/01/36 | | | 17,000 | | | | 16,979 | | |
Pacific Gas & Electric Co.
6.05%, 3/01/34 | | | 16,000 | | | | 15,888 | | |
| | | | 54,802 | | |
Total Corporate Bonds
(Amortized Cost $614,972) | | | | | | | 612,400 | | |
UNITED STATES GOVERNMENT &
AGENCIES OBLIGATIONS—0.7% | |
| FEDERAL HOME LOAN MORTGAGE CORP.—0.2% | |
| 6.25%, 7/15/32 | | | 45,000 | | | | 53,161 | | |
| UNITED STATES TREASURY BONDS/NOTES—0.5% | |
| 3.50%, 2/15/10 | | | 25,000 | | | | 25,240 | | |
| 4.75%, 5/15/14 | | | 6,000 | | | | 6,384 | | |
| 7.50%, 11/15/16 | | | 44,000 | | | | 55,478 | | |
| 7.625%, 2/15/25 | | | 15,000 | | | | 20,739 | | |
| 6.25%, 5/15/30 | | | 11,000 | | | | 13,848 | | |
| | | | 121,689 | | |
Total United States Government &
Agencies Obligations
(Amortized Cost $168,386) | | | | | | | 174,850 | | |
| SOVEREIGN BONDS—0.0% | |
| SOVEREIGN—0.0% | |
United Mexican States, Series A MTN (Mexico)
6.375%, 1/16/13 (Amortized Cost $5,280) | | | 5,000 | | | | 5,323 | | |
Total Investments—99.1%
(Amortized Cost $25,584,029) | | | | | | $ | 24,754,433 | | |
| Other assets less liabilities—0.9% | | | | | | | 235,057 | | |
| Net Assets—100.0% | | | | | | $ | 24,989,490 | | |
MTN - Medium Term Note.
REIT - Real Estate Investment Trust.
* Non-income producing security.
144A - Security is exempt from registration under Rule 144A of the Securities Act of 1933. These securities are considered liquid and may be resold in transactions exempt from registration, normally to qualified institutional buyers. At November 30, 2007, the aggregate market value of these securities amounted to $29,034 or 0.1% of net assets.
See Notes to Financial Statements.
27
TDAX Funds, Inc.
SCHEDULE OF INVESTMENTS
TDAX INDEPENDENCE IN-TARGET EXCHANGE-TRADED FUND
November 30, 2007 (Unaudited)
| | | Number
of Shares | | Market
Value | |
| COMMON STOCKS—7.3% | |
| CONSUMER DISCRETIONARY—0.7% | |
| Cabela's, Inc., Class A* | | | 150 | | | $ | 2,481 | | |
| Citadel Broadcasting Corp. | | | 334 | | | | 768 | | |
| Coach, Inc.* | | | 150 | | | | 5,571 | | |
| Comcast Corp., Class A* | | | 331 | | | | 6,799 | | |
Compagnie Financiere Richemont SA,
Class A (China) | | | 65 | | | | 4,473 | | |
| DIRECTV Group (The), Inc.* | | | 334 | | | | 8,308 | | |
| Fleetwood Enterprises, Inc.* | | | 331 | | | | 1,811 | | |
| Gaylord Entertainment Co.* | | | 30 | | | | 1,262 | | |
| Gemstar-TV Guide International, Inc.* | | | 331 | | | | 1,953 | | |
| Home Depot (The), Inc. | | | 150 | | | | 4,284 | | |
| HONDA MOTOR Co. Ltd. (Japan) | | | 200 | | | | 6,779 | | |
| J. Crew Group, Inc.* | | | 45 | | | | 2,162 | | |
| Jo-Ann Stores, Inc.* | | | 101 | | | | 1,662 | | |
| Lear Corp.* | | | 39 | | | | 1,148 | | |
| Liberty Global, Inc., Class A* | | | 104 | | | | 4,224 | | |
| Live Nation, Inc.* | | | 101 | | | | 1,355 | | |
| McDonald's Corp. | | | 184 | | | | 10,759 | | |
| New York & Co., Inc.* | | | 331 | | | | 2,439 | | |
| Omnicom Group, Inc. | | | 27 | | | | 1,316 | | |
| Rent-A-Center, Inc.* | | | 151 | | | | 2,138 | | |
| Sony Corp. (Japan) | | | 100 | | | | 5,418 | | |
| Target Corp. | | | 30 | | | | 1,802 | | |
| Time Warner, Inc. | | | 27 | | | | 466 | | |
| Toyota Motor Corp. (Japan) | | | 200 | | | | 11,252 | | |
| Under Armour, Inc., Class A* | | | 24 | | | | 1,192 | | |
| Viacom, Inc., Class B* | | | 149 | | | | 6,261 | | |
| Yum! Brands, Inc. | | | 181 | | | | 6,724 | | |
| | | | 104,807 | | |
| CONSUMER STAPLES—0.7% | |
| Altria Group, Inc. | | | 181 | | | | 14,038 | | |
British American Tobacco PLC
(United Kingdom) | | | 33 | | | | 1,280 | | |
| Carrefour SA (France) | | | 21 | | | | 1,631 | | |
| Coca-Cola (The) Co. | | | 231 | | | | 14,345 | | |
| ConAgra Foods, Inc. | | | 234 | | | | 5,855 | | |
| Diageo PLC (United Kingdom) | | | 71 | | | | 1,596 | | |
| Kraft Foods, Inc., Class A | | | 231 | | | | 7,981 | | |
| L'Oreal SA (France) | | | 3 | | | | 418 | | |
| Nestle SA (China) | | | 15 | | | | 7,214 | | |
| Procter & Gamble (The) Co. | | | 331 | | | | 24,494 | | |
| Reckitt Benckiser Group PLC (United Kingdom) | | | 12 | | | | 713 | | |
| Tesco PLC (United Kingdom) | | | 131 | | | | 1,290 | | |
| Unilever NV (Netherlands) | | | 68 | | | | 2,411 | | |
| Unilever PLC (United Kingdom) | | | 24 | | | | 880 | | |
| Wal-Mart Stores, Inc. | | | 361 | | | | 17,292 | | |
| | | | 101,438 | | |
| ENERGY—0.7% | |
| BG Group PLC (United Kingdom) | | | 247 | | | | 5,170 | | |
| BP PLC (United Kingdom) | | | 1,123 | | | | 13,623 | | |
| Chevron Corp. | | | 184 | | | | 16,150 | | |
| ENI S.p.A (Italy) | | | 131 | | | | 4,686 | | |
| EOG Resources, Inc. | | | 100 | | | | 8,278 | | |
| Exxon Mobil Corp. | | | 334 | | | | 29,780 | | |
| International Coal Group, Inc.* | | | 516 | | | | 2,585 | | |
| | | Number
of Shares | | Market
Value | |
| ENERGY (Continued) | |
| Newpark Resources, Inc.* | | | 334 | | | $ | 1,797 | | |
| Oilsands Quest, Inc.* | | | 444 | | | | 1,998 | | |
| Repsol YPF S.A. (Spain) | | | 75 | | | | 2,772 | | |
Royal Dutch Shell PLC, Class A
(United Kingdom) | | | 203 | | | | 8,206 | | |
Royal Dutch Shell PLC, Class B
(United Kingdom) | | | 158 | | | | 6,341 | | |
| Schlumberger Ltd. (Netherlands Antilles) | | | 59 | | | | 5,514 | | |
| Ship Finance International Ltd. (Bermuda) | | | 62 | | | | 1,579 | | |
| Total SA (France) | | | 74 | | | | 5,999 | | |
| | | | 114,478 | | |
| FINANCIALS—1.5% | |
| ABN AMRO Holding NV (Netherlands) | | | 56 | | | | 2,959 | | |
| American Express Co. | | | 361 | | | | 21,292 | | |
| American International Group, Inc. | | | 30 | | | | 1,744 | | |
| Apollo Investment Corp. | | | 331 | | | | 5,862 | | |
| Aspen Insurance Holdings Ltd. (Bermuda) | | | 36 | | | | 1,037 | | |
| Assicurazioni Generali S.p.A (Italy) | | | 15 | | | | 690 | | |
| Aviva PLC (United Kingdom) | | | 119 | | | | 1,669 | | |
| AXA (France) | | | 27 | | | | 1,107 | | |
| Banco Bilbao Vizcaya Argentaria, S.A. (Spain) | | | 68 | | | | 1,698 | | |
| Banco Santander S.A. (Spain) | | | 427 | | | | 9,176 | | |
| Bank of America Corp. | | | 334 | | | | 15,407 | | |
| Barclays PLC (United Kingdom) | | | 289 | | | | 3,346 | | |
| BNP Paribas (France) | | | 27 | | | | 3,058 | | |
| Cascade Bancorp | | | 150 | | | | 2,601 | | |
| Charles Schwab (The) Corp. | | | 361 | | | | 8,776 | | |
| Citigroup, Inc. | | | 331 | | | | 11,022 | | |
| Commonwealth Bank of Australia (Australia) | | | 42 | | | | 2,216 | | |
| Credit Suisse Group (China) | | | 77 | | | | 4,648 | | |
| Deerfield Triarc Capital Corp. REIT | | | 343 | | | | 2,576 | | |
| Deutsche Bank AG (Germany) | | | 3 | | | | 395 | | |
| FelCor Lodging Trust, Inc. REIT | | | 150 | | | | 2,627 | | |
| First Industrial Realty Trust, Inc. REIT | | | 30 | | | | 1,096 | | |
| Fortis (Belgium) | | | 71 | | | | 1,908 | | |
Greenlight Capital Re, Ltd., Class A
(Cayman Islands)* | | | 194 | | | | 4,216 | | |
| HBOS PLC (United Kingdom) | | | 227 | | | | 3,725 | | |
| HSBC Holdings PLC (United Kingdom) | | | 380 | | | | 6,485 | | |
| ING Groep N.V. (Netherlands) | | | 45 | | | | 1,752 | | |
| Intesa Sanpaolo S.p.A (Italy) | | | 199 | | | | 1,592 | | |
| JPMorgan Chase & Co. | | | 334 | | | | 15,237 | | |
| Lincoln National Corp. | | | 181 | | | | 11,144 | | |
| Lloyds TSB Group PLC (United Kingdom) | | | 283 | | | | 2,880 | | |
| Montpelier Re Holdings Ltd. (Bermuda) | | | 51 | | | | 883 | | |
| Morgan Stanley | | | 30 | | | | 1,582 | | |
Muenchener Rueckversicherungs-Gesellschaft
AG (Germany) | | | 3 | | | | 548 | | |
| National Australia Bank Ltd. (Australia) | | | 48 | | | | 1,626 | | |
| National City Corp. | | | 361 | | | | 7,133 | | |
| Nomura Holdings, Inc. (Japan) | | | 300 | | | | 5,377 | | |
| Nordea Bank AB (Sweden) | | | 200 | | | | 3,356 | | |
| Northern Trust Corp. | | | 30 | | | | 2,430 | | |
| NYSE Euronext | | | 77 | | | | 6,668 | | |
| Platinum Underwriters Holdings Ltd. (Bermuda) | | | 41 | | | | 1,489 | | |
| Prudential PLC (United Kingdom) | | | 68 | | | | 949 | | |
See Notes to Financial Statements.
28
TDAX Funds, Inc.
SCHEDULE OF INVESTMENTS (CONTINUED)
TDAX INDEPENDENCE IN-TARGET EXCHANGE-TRADED FUND
November 30, 2007 (Unaudited)
| | | Number
of Shares | | Market
Value | |
| FINANCIALS (Continued) | |
| Ramco-Gershenson Properties Trust REIT | | | 150 | | | $ | 3,795 | | |
| Realty Income Corp. REIT | | | 150 | | | | 4,275 | | |
Royal Bank of Scotland Group PLC
(United Kingdom) | | | 529 | | | | 4,993 | | |
| SLM Corp.* | | | 150 | | | | 5,712 | | |
| Societe Generale (France) | | | 12 | | | | 1,860 | | |
| SVB Financial Group* | | | 100 | | | | 5,148 | | |
| Swiss Re (China) | | | 21 | | | | 1,561 | | |
| UBS AG (China) | | | 143 | | | | 7,245 | | |
| UniCredito Italiano S.p.A (Italy) | | | 256 | | | | 2,189 | | |
| Wachovia Corp. | | | 30 | | | | 1,290 | | |
| Wells Fargo & Co. | | | 100 | | | | 3,243 | | |
| Zurich Financial Services AG (China) | | | 12 | | | | 3,499 | | |
| | | | 230,792 | | |
| HEALTH CARE—0.9% | |
| Abbott Laboratories | | | 184 | | | | 10,582 | | |
| Alexion Pharmaceuticals, Inc.* | | | 33 | | | | 2,400 | | |
| AstraZeneca PLC (United Kingdom) | | | 48 | | | | 2,280 | | |
| Auxilium Pharmaceuticals, Inc.* | | | 104 | | | | 2,917 | | |
| Becton, Dickinson & Co. | | | 30 | | | | 2,482 | | |
| CIGNA Corp. | | | 151 | | | | 8,095 | | |
| Dendreon Corp.* | | | 271 | | | | 1,355 | | |
| GlaxoSmithKline PLC (United Kingdom) | | | 95 | | | | 2,516 | | |
| Healthspring, Inc.* | | | 77 | | | | 1,455 | | |
| Inverness Medical Innovations, Inc.* | | | 33 | | | | 1,936 | | |
| Johnson & Johnson | | | 334 | | | | 22,626 | | |
| Kindred Healthcare, Inc.* | | | 100 | | | | 2,457 | | |
| McKesson Corp. | | | 30 | | | | 2,002 | | |
| Merck & Co, Inc. | | | 181 | | | | 10,744 | | |
| MGI Pharma, Inc.* | | | 62 | | | | 2,146 | | |
| Novartis AG (China) | | | 107 | | | | 6,098 | | |
| OSI Pharmaceuticals, Inc.* | | | 45 | | | | 2,098 | | |
| Pfizer, Inc. | | | 719 | | | | 17,083 | | |
| Psychiatric Solutions, Inc.* | | | 100 | | | | 3,653 | | |
| Roche Holding AG (China) | | | 35 | | | | 6,680 | | |
| Sanofi-Aventis SA (France) | | | 18 | | | | 1,718 | | |
| STERIS Corp. | | | 100 | | | | 2,796 | | |
| Sunrise Senior Living, Inc.* | | | 100 | | | | 3,139 | | |
| Thermo Fisher Scientific, Inc.* | | | 181 | | | | 10,433 | | |
| UnitedHealth Group, Inc. | | | 184 | | | | 10,120 | | |
| | | | 139,811 | | |
| INDUSTRIALS—0.8% | |
| ABB Ltd. (China) | | | 113 | | | | 3,321 | | |
| ABM Industries, Inc. | | | 100 | | | | 2,040 | | |
| Aecom Technology Corp.* | | | 146 | | | | 3,882 | | |
| Allegiant Travel Co.* | | | 98 | | | | 3,469 | | |
| Belden CDT, Inc. | | | 100 | | | | 4,605 | | |
| Brady Corp., Class A | | | 100 | | | | 4,003 | | |
| Caterpillar, Inc. | | | 100 | | | | 7,190 | | |
| CDI Corp. | | | 100 | | | | 2,667 | | |
| Curtiss-Wright Corp. | | | 100 | | | | 5,394 | | |
| Emerson Electric Co. | | | 30 | | | | 1,711 | | |
| FreightCar America, Inc. | | | 100 | | | | 3,397 | | |
| Fuel Tech, Inc.* | | | 98 | | | | 2,392 | | |
| General Electric Co. | | | 361 | | | | 13,822 | | |
| Granite Construction, Inc. | | | 100 | | | | 4,102 | | |
| | | Number
of Shares | | Market
Value | |
| INDUSTRIALS (Continued) | |
| Illinois Tool Works, Inc. | | | 30 | | | $ | 1,665 | | |
| Ingersoll-Rand Co. Ltd., Class A (Bermuda) | | | 33 | | | | 1,704 | | |
| JetBlue Airways Corp.* | | | 244 | | | | 1,708 | | |
Koninklijke (Royal) Philips Electronics
N.V. (Netherlands) | | | 89 | | | | 3,744 | | |
| Mitsubishi Corp. (Japan) | | | 200 | | | | 5,734 | | |
| Northrop Grumman Corp. | | | 30 | | | | 2,364 | | |
| Raven Industries, Inc. | | | 100 | | | | 3,473 | | |
| Regal-Beloit Corp. | | | 100 | | | | 4,708 | | |
| RSC Holdings, Inc.* | | | 176 | | | | 2,161 | | |
| Schneider Electric SA (France) | | | 12 | | | | 1,680 | | |
| Siemens AG (Germany) | | | 30 | | | | 4,567 | | |
| Simpson Manufacturing Co, Inc. | | | 100 | | | | 2,661 | | |
| Trane, Inc. | | | 150 | | | | 5,507 | | |
| United Parcel Service, Inc., Class B | | | 30 | | | | 2,210 | | |
| United Technologies Corp. | | | 184 | | | | 13,758 | | |
| | | | 119,639 | | |
| INFORMATION TECHNOLOGY—1.0% | |
| 3Com Corp.* | | | 432 | | | | 1,862 | | |
| Accenture Ltd., Class A (Bermuda) | | | 131 | | | | 4,527 | | |
| Agilysys, Inc. | | | 100 | | | | 1,389 | | |
| Amkor Technology, Inc.* | | | 181 | | | | 1,491 | | |
| Andrew Corp.* | | | 122 | | | | 1,789 | | |
| Cisco Systems, Inc.* | | | 331 | | | | 9,275 | | |
| eBay, Inc.* | | | 184 | | | | 6,170 | | |
| Electronics for Imaging, Inc.* | | | 57 | | | | 1,308 | | |
| Equinix, Inc.* | | | 21 | | | | 2,186 | | |
| Foundry Networks, Inc.* | | | 100 | | | | 1,763 | | |
| Hewlett-Packard Co. | | | 30 | | | | 1,535 | | |
| Intel Corp. | | | 334 | | | | 8,711 | | |
| Ixia* | | | 331 | | | | 3,419 | | |
| Juniper Networks, Inc.* | | | 150 | | | | 4,458 | | |
| Lawson Software, Inc.* | | | 161 | | | | 1,565 | | |
| Microsoft Corp. | | | 331 | | | | 11,122 | | |
| Motorola, Inc. | | | 1,049 | | | | 16,753 | | |
| Nokia Oyj (Finland) | | | 181 | | | | 7,245 | | |
| Nuance Communications, Inc.* | | | 119 | | | | 2,401 | | |
| ON Semiconductor Corp.* | | | 184 | | | | 1,691 | | |
| Orbcomm, Inc.* | | | 268 | | | | 2,088 | | |
| Palm, Inc.* | | | 100 | | | | 697 | | |
| Perficient, Inc.* | | | 100 | | | | 1,677 | | |
| Quest Software, Inc.* | | | 100 | | | | 1,617 | | |
| SAIC, Inc.* | | | 92 | | | | 1,834 | | |
| SAP AG (Germany) | | | 36 | | | | 1,846 | | |
| SAVVIS, Inc.* | | | 59 | | | | 1,890 | | |
| Sonus Networks, Inc.* | | | 268 | | | | 1,763 | | |
| Spansion, Inc., Class A* | | | 185 | | | | 988 | | |
| Sun Microsystems, Inc.* | | | 1,206 | | | | 25,060 | | |
| Symantec Corp.* | | | 331 | | | | 5,892 | | |
| Telefonaktiebolaget LM Ericsson (Sweden) | | | 1,000 | | | | 2,442 | | |
| TIBCO Software, Inc.* | | | 331 | | | | 2,592 | | |
| Xerox Corp. | | | 331 | | | | 5,587 | | |
| | | | 146,633 | | |
| MATERIALS—0.4% | |
| Alcoa, Inc. | | | 184 | | | | 6,692 | | |
| Anglo American PLC (United Kingdom) | | | 77 | | | | 5,203 | | |
See Notes to Financial Statements.
29
TDAX Funds, Inc.
SCHEDULE OF INVESTMENTS (CONTINUED)
TDAX INDEPENDENCE IN-TARGET EXCHANGE-TRADED FUND
November 30, 2007 (Unaudited)
| | | Number
of Shares | | Market
Value | |
| MATERIALS (Continued) | |
| AptarGroup, Inc. | | | 27 | | | $ | 1,140 | | |
| ArcelorMittal (Luxembourg) | | | 18 | | | | 1,332 | | |
| BASF AG (Germany) | | | 15 | | | | 2,086 | | |
| Bayer AG (Germany) | | | 18 | | | | 1,489 | | |
| BHP Billiton Ltd. (Australia) | | | 129 | | | | 4,903 | | |
| BHP Billiton PLC (United Kingdom) | | | 86 | | | | 2,842 | | |
| Dow Chemical (The) Co. | | | 184 | | | | 7,717 | | |
| E.I. du Pont de Nemours & Co. | | | 184 | | | | 8,491 | | |
| Hercules, Inc. | | | 331 | | | | 6,425 | | |
| Rio Tinto PLC (United Kingdom) | | | 48 | | | | 5,566 | | |
| Terra Industries, Inc.* | | | 77 | | | | 2,909 | | |
| Xstrata PLC (United Kingdom) | | | 33 | | | | 2,320 | | |
| | | | 59,115 | | |
| TELECOMMUNICATION SERVICES—0.3% | |
| Alaska Communications Systems Group, Inc. | | | 150 | | | | 2,250 | | |
| AT&T, Inc. | | | 209 | | | | 7,986 | | |
| BT Group PLC (United Kingdom) | | | 343 | | | | 2,022 | | |
| Deutsche Telekom AG (Germany) | | | 74 | | | | 1,640 | | |
| Koninklijke (Royal) KPN N.V. (Netherlands) | | | 140 | | | | 2,581 | | |
| Qwest Communications International, Inc.* | | | 1,514 | | | | 10,038 | | |
| Telefonica S.A. (Spain) | | | 77 | | | | 2,589 | | |
| Time Warner Telecom, Inc., Class A* | | | 98 | | | | 2,198 | | |
| Verizon Communications, Inc. | | | 181 | | | | 7,821 | | |
| Vodafone Group PLC (United Kingdom) | | | 2,051 | | | | 7,684 | | |
| | | | 46,809 | | |
| UTILITIES—0.3% | |
| American Electric Power Co., Inc. | | | 30 | | | | 1,430 | | |
| E.ON AG (Germany) | | | 3 | | | | 614 | | |
| Endesa S.A. (Spain) | | | 57 | | | | 3,144 | | |
| Enel S.p.A (Italy) | | | 167 | | | | 2,008 | | |
| Exelon Corp. | | | 184 | | | | 14,916 | | |
| Iberdrola S.A. (Spain) | | | 74 | | | | 1,224 | | |
| National Grid PLC (United Kingdom) | | | 164 | | | | 2,770 | | |
| RWE AG (Germany) | | | 15 | | | | 2,056 | | |
| Tokyo Electric Power (The) Co., Inc. (Japan) | | | 300 | | | | 8,195 | | |
| Westar Energy, Inc. | | | 181 | | | | 4,690 | | |
| | | | 41,047 | | |
Total Common Stocks
(Cost $1,108,563) | | | | | | | 1,104,569 | | |
| | | Principal
Amount | | Market
Value | |
| CORPORATE BONDS—10.8% | |
| CONSUMER DISCRETIONARY — 0.2% | |
Comcast Cable Communications Holdings, Inc.
8.375%, 3/15/13 | | $ | 30,000 | | | | 33,765 | | |
| CONSUMER STAPLES—0.3% | |
Kroger (The) Co.
5.50%, 2/01/13 | | | 15,000 | | | | 15,371 | | |
Wal-Mart Stores, Inc.
4.55%, 5/01/13 | | | 30,000 | | | | 29,889 | | |
| | | | 45,260 | | |
| | | Principal
Amount | | Market
Value | |
| ENERGY—0.7% | |
Apache Corp.
5.25%, 4/15/13 | | $ | 21,000 | | | $ | 21,553 | | |
Hess Corp.
6.65%, 8/15/11 | | | 27,000 | | | | 28,733 | | |
Kinder Morgan Energy Partners L.P.
6.75%, 3/15/11 | | | 21,000 | | | | 22,100 | | |
Spectra Energy Capital LLC
6.25%, 2/15/13 | | | 30,000 | | | | 31,616 | | |
| | | | 104,002 | | |
| FINANCIALS—8.0% | |
American Express Co.
4.875%, 7/15/13 | | | 42,000 | | | | 41,112 | | |
Ameriprise Financial, Inc.
5.35%, 11/15/10 | | | 15,000 | | | | 15,411 | | |
Bank of America Corp.
4.875%, 1/15/13 | | | 48,000 | | | | 48,015 | | |
Boeing Capital Corp. Ltd.
5.80%, 1/15/13 | | | 30,000 | | | | 31,864 | | |
Boston Properties LP
6.25%, 1/15/13 | | | 30,000 | | | | 31,125 | | |
Citigroup, Inc.
6.00%, 2/21/12 | | | 77,000 | | | | 79,732 | | |
European Investment Bank (Supranational)
4.625%, 5/15/14 | | | 143,000 | | | | 146,615 | | |
General Electric Capital Corp., Series A MTN
7.375%, 1/19/10 | | | 15,000 | | | | 15,955 | | |
| 5.875%, 2/15/12 | | | 15,000 | | | | 15,747 | | |
Genworth Financial, Inc.
5.75%, 6/15/14 | | | 30,000 | | | | 30,639 | | |
Goldman Sachs Group L.P.
5.00%, 10/01/14 | | | 60,000 | | | | 58,639 | | |
Goldman Sachs Group (The), Inc.
3.875%, 1/15/09 | | | 60,000 | | | | 59,349 | | |
HSBC Finance Corp.
6.375%, 11/27/12 | | | 77,000 | | | | 80,464 | | |
International Bank for Reconstruction &
Development (Supranational)
4.125%, 8/12/09 | | | 116,000 | | | | 116,972 | | |
International Lease Finance Corp.,
Series Q MTN
5.75%, 6/15/11 | | | 77,000 | | | | 78,439 | | |
John Deere Capital Corp.
7.00%, 3/15/12 | | | 45,000 | | | | 49,270 | | |
JPMorgan Chase & Co.
5.75%, 1/02/13 | | | 15,000 | | | | 15,373 | | |
Kreditanstalt fuer Wiederaufbau (Germany)
4.25%, 6/15/10 | | | 48,000 | | | | 49,066 | | |
Morgan Stanley
5.30%, 3/01/13 | | | 45,000 | | | | 44,635 | | |
National Rural Utilities Cooperative Finance
Corp., Series C MTN
7.25%, 3/01/12 | | | 18,000 | | | | 19,607 | | |
Wachovia Corp.
5.25%, 8/01/14 | | | 45,000 | | | | 43,874 | | |
Washington Mutual, Inc.
4.00%, 1/15/09 | | | 67,000 | | | | 63,052 | | |
Wells Fargo & Co.
4.875%, 1/12/11 | | | 83,000 | | | | 84,112 | | |
| | | | 1,219,067 | | |
See Notes to Financial Statements.
30
TDAX Funds, Inc.
SCHEDULE OF INVESTMENTS (CONTINUED)
TDAX INDEPENDENCE IN-TARGET EXCHANGE-TRADED FUND
November 30, 2007 (Unaudited)
| | | Principal
Amount | | Market
Value | |
| INDUSTRIALS—0.5% | |
United Technologies Corp.
4.375%, 5/01/10 | | $ | 77,000 | | | $ | 77,282 | | |
| INFORMATION TECHNOLOGY—0.5% | |
International Business Machines Corp.
4.25%, 9/15/09 | | | 72,000 | | | | 72,502 | | |
| TELECOMMUNICATION SERVICES—0.3% | |
New Cingular Wireless Services, Inc.
7.875%, 3/01/11 | | | 15,000 | | | | 16,278 | | |
Sprint Capital Corp.
8.375%, 3/15/12 | | | 30,000 | | | | 32,193 | | |
| | | | 48,471 | | |
| UTILITIES—0.3% | |
Exelon Generation Co. LLC
5.35%, 1/15/14 | | | 15,000 | | | | 14,737 | | |
Progress Energy, Inc.
7.10%, 3/01/11 | | | 33,000 | | | | 35,258 | | |
| | | | 49,995 | | |
Total Corporate Bonds
(Amortized Cost $1,633,340) | | | | | | | 1,650,344 | | |
UNITED STATES GOVERNMENT & AGENCIES
OBLIGATIONS—80.5% | |
| FEDERAL HOME LOAN MORTGAGE CORP.—2.6% | |
| 4.75%, 3/05/09 | | | 301,000 | | | | 304,136 | | |
| 4.50%, 1/15/13 | | | 89,000 | | | | 90,870 | | |
| | | | 395,006 | | |
| FEDERAL NATIONAL MORTGAGE ASSOCIATION—1.1% | |
| 7.25%, 1/15/10 | | | 150,000 | | | | 160,832 | | |
| UNITED STATES TREASURY BONDS/NOTES—76.8% | |
| 4.375%, 12/31/07 | | | 1,676,000 | | | | 1,677,310 | | |
| 4.625%, 2/29/08 | | | 1,320,000 | | | | 1,324,435 | | |
| 3.75%, 5/15/08 | | | 1,139,000 | | | | 1,141,670 | | |
| 3.125%, 9/15/08 | | | 1,350,000 | | | | 1,348,946 | | |
| 4.625%, 9/30/08 | | | 210,000 | | | | 212,198 | | |
| 4.75%, 11/15/08 | | | 1,138,000 | | | | 1,153,826 | | |
| 4.50%, 2/15/09 | | | 304,000 | | | | 308,988 | | |
| 2.625%, 3/15/09 | | | 616,000 | | | | 612,246 | | |
| 4.875%, 8/15/09 | | | 1,365,000 | | | | 1,404,671 | | |
| 3.50%, 2/15/10 | | | 870,000 | | | | 878,361 | | |
| 4.75%, 2/15/10 | | | 451,000 | | | | 467,349 | | |
| 4.50%, 5/15/10 | | | 466,000 | | | | 482,383 | | |
| 3.875%, 7/15/10 | | | 496,000 | | | | 506,657 | | |
| 4.75%, 5/15/14 | | | 173,000 | | | | 184,083 | | |
| | | | 11,703,123 | | |
Total United States Government &
Agencies Obligations
(Amortized Cost $12,181,322) | | | | | | | 12,258,961 | | |
| | | Principal
Amount | | Market
Value | |
| SOVEREIGN BONDS—0.4% | |
| SOVEREIGN—0.4% | |
Italy Government International Bond (Italy)
6.00%, 2/22/11 | | $ | 27,000 | | | $ | 28,925 | | |
United Mexican States (Mexico)
4.625%, 10/08/08 | | | 33,000 | | | | 32,925 | | |
Total Sovereign Bonds
(Amortized Cost $61,265) | | | | | 61,850 | | |
Total Investments—99.0%
(Amortized Cost $14,984,490) | | | | $ | 15,075,724 | | |
| Other assets less liabilities—1.0% | | | | | 155,239 | | |
| Net Assets—100.0% | | | | $ | 15,230,963 | | |
MTN - Medium Term Note.
REIT - Real Estate Investment Trust.
* Non-income producing security.
See Notes to Financial Statements.
31
TDAX Funds, Inc.
STATEMENTS OF ASSETS AND LIABILITIES
November 30, 2007 (Unaudited)
| | | TDAX
INDEPENDENCE 2010
EXCHANGE-TRADED
FUND | | TDAX
INDEPENDENCE 2020
EXCHANGE-TRADED
FUND | | TDAX
INDEPENDENCE 2030
EXCHANGE-TRADED
FUND | |
| ASSETS: | |
| Investments at value | | $ | 14,998,540 | | | $ | 29,977,086 | | | $ | 24,779,974 | | |
| Foreign currency at value | | | 71,454 | | | | 69,167 | | | | 40,974 | | |
| Cash | | | 71,488 | | | | 222,086 | | | | 274,012 | | |
| Receivables: | |
| From investment advisor | | | 31,041 | | | | 31,041 | | | | 31,041 | | |
| Investment securities sold | | | 88,512 | | | | 367,575 | | | | 629,567 | | |
| Interest | | | 136,810 | | | | 136,610 | | | | 29,049 | | |
| Dividends | | | 9,668 | | | | 34,979 | | | | 40,422 | | |
| Foreign tax reclaims | | | 24 | | | | 82 | | | | 86 | | |
| Other assets | | | 9,329 | | | | 13,211 | | | | 9,418 | | |
| Total Assets | | | 15,416,866 | | | | 30,851,837 | | | | 25,834,543 | | |
| LIABILITIES: | |
| Payables: | |
| Investment securities purchased | | | 108,484 | | | | 514,540 | | | | 756,925 | | |
| Investment advisory fees | | | 2,062 | | | | 3,455 | | | | 2,918 | | |
| Investment sub-advisory fees | | | 11,339 | | | | 19,004 | | | | 16,050 | | |
| Accrued expenses and other liabilities | | | 17,292 | | | | 17,293 | | | | 17,292 | | |
| Total Liabilities | | | 139,177 | | | | 554,292 | | | | 793,185 | | |
| NET ASSETS | | $ | 15,277,689 | | | $ | 30,297,545 | | | $ | 25,041,358 | | |
| NET ASSETS CONSIST OF: | |
| Paid-in capital | | $ | 15,156,867 | | | $ | 30,322,883 | | | $ | 25,552,421 | | |
| Undistributed net investment income | | | 67,192 | | | | 83,890 | | | | 55,380 | | |
| Net realized gain/(loss) on investments and foreign currency transactions | | | 13,871 | | | | 27,725 | | | | (22,733 | ) | |
| Net unrealized appreciation/(depreciation) on investments and foreign currency transactions | | | 39,759 | | | | (136,953 | ) | | | (543,710 | ) | |
| Net Assets | | $ | 15,277,689 | | | $ | 30,297,545 | | | $ | 25,041,358 | | |
| NET ASSET VALUE, per Common Share (par value $0.0001 per Common Share) | | $ | 25.43 | | | $ | 25.23 | | | $ | 25.02 | | |
| Number of Common Shares outstanding (12.5 billion Common Shares have been authorized) | | | 600,800 | | | | 1,200,800 | | | | 1,000,800 | | |
| Investments at cost | | $ | 14,959,957 | | | $ | 30,115,015 | | | $ | 25,323,996 | | |
| Foreign currency at cost | | $ | 70,261 | | | $ | 68,129 | | | $ | 40,588 | | |
See Notes to Financial Statements.
32
| | | TDAX
INDEPENDENCE 2040
EXCHANGE-TRADED
FUND | | TDAX
INDEPENDENCE IN-TARGET
EXCHANGE-TRADED
FUND | |
| ASSETS: | |
| Investments at value | | $ | 24,754,433 | | | $ | 15,075,724 | | |
| Foreign currency at value | | | 42,039 | | | | 13,329 | | |
| Cash | | | 231,964 | | | | 58,656 | | |
| Receivables: | |
| From investment advisor | | | 31,041 | | | | 31,041 | | |
| Investment securities sold | | | 561,812 | | | | 28,721 | | |
| Interest | | | 8,987 | | | | 143,892 | | |
| Dividends | | | 46,860 | | | | 1,565 | | |
| Foreign tax reclaims | | | 115 | | | | 2 | | |
| Other assets | | | 13,288 | | | | 7,380 | | |
| Total Assets | | | 25,690,539 | | | | 15,360,310 | | |
| LIABILITIES: | |
| Payables: | |
| Investment securities purchased | | | 663,742 | | | | 101,924 | | |
| Investment advisory fees | | | 3,079 | | | | 1,559 | | |
| Investment sub-advisory fees | | | 16,936 | | | | 8,572 | | |
| Accrued expenses and other liabilities | | | 17,292 | | | | 17,292 | | |
| Total Liabilities | | | 701,049 | | | | 129,347 | | |
| NET ASSETS | | $ | 24,989,490 | | | $ | 15,230,963 | | |
| NET ASSETS CONSIST OF: | |
| Paid-in capital | | $ | 25,769,839 | | | $ | 15,089,148 | | |
| Undistributed net investment income | | | 52,818 | | | | 49,403 | | |
| Net realized gain/(loss) on investments and foreign currency transactions | | | (3,851 | ) | | | 852 | | |
| Net unrealized appreciation/(depreciation) on investments and foreign currency transactions | | | (829,316 | ) | | | 91,560 | | |
| Net Assets | | $ | 24,989,490 | | | $ | 15,230,963 | | |
| NET ASSET VALUE, per Common Share (par value $0.0001 per Common Share) | | $ | 24.97 | | | $ | 25.35 | | |
| Number of Common Shares outstanding (12.5 billion Common Shares have been authorized) | | | 1,000,800 | | | | 600,800 | | |
| Investments at cost | | $ | 25,584,029 | | | $ | 14,984,490 | | |
| Foreign currency at cost | | $ | 41,639 | | | $ | 13,001 | | |
See Notes to Financial Statements.
33
TDAX Funds, Inc.
STATEMENTS OF OPERATIONS
| | | TDAX
INDEPENDENCE 2010
EXCHANGE-TRADED
FUND | | TDAX
INDEPENDENCE 2020
EXCHANGE-TRADED
FUND | | TDAX
INDEPENDENCE 2030
EXCHANGE-TRADED
FUND | |
| | | For the Period
October 1, 2007*
through
November 30, 2007
(Unaudited) | | For the Period
October 1, 2007*
through
November 30, 2007
(Unaudited) | | For the Period
October 1, 2007*
through
November 30, 2007
(Unaudited) | |
| INVESTMENT INCOME: | |
| Interest | | $ | 71,910 | | | $ | 60,449 | | | $ | 17,844 | | |
| Dividends | | | 14,968 | | | | 51,389 | | | | 58,513 | | |
| Amortization/accretion | | | (5,768 | ) | | | (4,118 | ) | | | (697 | ) | |
| Foreign withholding taxes | | | (383 | ) | | | (1,237 | ) | | | (1,179 | ) | |
| Total investment income | | | 80,727 | | | | 106,483 | | | | 74,481 | | |
| EXPENSES: | |
| Professional fees | | | 12,833 | | | | 12,833 | | | | 12,833 | | |
| Sub-advisory fees | | | 11,339 | | | | 19,004 | | | | 16,049 | | |
| Compliance | | | 8,750 | | | | 8,750 | | | | 8,750 | | |
| Directors | | | 3,375 | | | | 3,375 | | | | 3,375 | | |
| Advisory fees | | | 2,062 | | | | 3,455 | | | | 2,918 | | |
| Listing fees | | | 1,250 | | | | 1,250 | | | | 1,250 | | |
| Printing | | | 1,000 | | | | 1,000 | | | | 1,000 | | |
| Other expenses | | | 3,967 | | | | 3,967 | | | | 3,967 | | |
| Total Expenses | | | 44,576 | | | | 53,634 | | | | 50,142 | | |
| Less fees waived: | |
| Sub-advisory | | | (11,339 | ) | | | (19,004 | ) | | | (16,049 | ) | |
| Other fees assumed by the Sub-Advisor | | | (19,702 | ) | | | (12,037 | ) | | | (14,992 | ) | |
| Net Expenses | | | 13,535 | | | | 22,593 | | | | 19,101 | | |
| NET INVESTMENT INCOME | | | 67,192 | | | | 83,890 | | | | 55,380 | | |
| REALIZED AND UNREALIZED GAIN/(LOSS) ON INVESTMENTS: | |
| Net realized gain/(loss) from: | |
| Investment transactions | | | 13,856 | | | | 27,515 | | | | (22,686 | ) | |
| In-kind redemptions | | | — | | | | 13 | | | | — | | |
| Foreign currency transactions | | | 15 | | | | 197 | | | | (47 | ) | |
| Net realized gain/(loss) | | | 13,871 | | | | 27,725 | | | | (22,733 | ) | |
| Net unrealized appreciation/(depreciation) on: | |
| Investments | | | 38,583 | | | | (137,929 | ) | | | (544,022 | ) | |
| Foreign currency transactions | | | 1,176 | | | | 976 | | | | 312 | | |
| Net unrealized appreciation/(depreciation) | | | 39,759 | | | | (136,953 | ) | | | (543,710 | ) | |
| Net realized and unrealized gain/(loss) | | | 53,630 | | | | (109,228 | ) | | | (566,443 | ) | |
| NET INCREASE/(DECREASE) IN NET ASSETS RESULTING FROM OPERATIONS | | $ | 120,822 | | | $ | (25,338 | ) | | $ | (511,063 | ) | |
* Commencement of Investment Operations.
See Notes to Financial Statements.
34
| | | TDAX
INDEPENDENCE 2040
EXCHANGE-TRADED
FUND | | TDAX
INDEPENDENCE IN-TARGET
EXCHANGE-TRADED
FUND | |
| | | For the Period
October 1, 2007*
through
November 30, 2007
(Unaudited) | | For the Period
October 1, 2007*
through
November 30, 2007
(Unaudited) | |
| INVESTMENT INCOME: | |
| Interest | | $ | 5,686 | | | $ | 57,273 | | |
| Dividends | | | 68,939 | | | | 2,380 | | |
| Amortization/accretion | | | (233 | ) | | | 77 | | |
| Foreign withholding taxes | | | (1,425 | ) | | | (63 | ) | |
| Total investment income | | | 72,967 | | | | 59,667 | | |
| EXPENSES: | |
| Professional fees | | | 12,833 | | | | 12,833 | | |
| Sub-advisory fees | | | 16,936 | | | | 8,572 | | |
| Compliance | | | 8,750 | | | | 8,750 | | |
| Directors | | | 3,375 | | | | 3,375 | | |
| Advisory fees | | | 3,079 | | | | 1,558 | | |
| Listing fees | | | 1,250 | | | | 1,250 | | |
| Printing | | | 1,000 | | | | 1,000 | | |
| Other expenses | | | 3,967 | | | | 3,967 | | |
| Total Expenses | | | 51,190 | | | | 41,305 | | |
| Less fees waived: | |
| Sub-advisory | | | (16,936 | ) | | | (8,572 | ) | |
| Other fees assumed by the Sub-Advisor | | | (14,105 | ) | | | (22,469 | ) | |
| Net Expenses | | | 20,149 | | | | 10,264 | | |
| NET INVESTMENT INCOME | | | 52,818 | | | | 49,403 | | |
| REALIZED AND UNREALIZED GAIN/(LOSS) ON INVESTMENTS: | |
| Net realized gain/(loss) from: | |
| Investment transactions | | | (3,843 | ) | | | 878 | | |
| In-kind redemptions | | | — | | | | — | | |
| Foreign currency transactions | | | (8 | ) | | | (26 | ) | |
| Net realized gain/(loss) | | | (3,851 | ) | | | 852 | | |
| Net unrealized appreciation/(depreciation) on: | |
| Investments | | | (829,596 | ) | | | 91,234 | | |
| Foreign currency transactions | | | 280 | | | | 326 | | |
| Net unrealized appreciation/(depreciation) | | | (829,316 | ) | | | 91,560 | | |
| Net realized and unrealized gain/(loss) | | | (833,167 | ) | | | 92,412 | | |
| NET INCREASE/(DECREASE) IN NET ASSETS RESULTING FROM OPERATIONS | | $ | (780,349 | ) | | $ | 141,815 | | |
See Notes to Financial Statements.
35
TDAX Funds, Inc.
STATEMENTS OF CHANGES IN NET ASSETS
| | | TDAX
INDEPENDENCE 2010
EXCHANGE-TRADED
FUND | | TDAX
INDEPENDENCE 2020
EXCHANGE-TRADED
FUND | | TDAX
INDEPENDENCE 2030
EXCHANGE-TRADED
FUND | |
| | | For the Period
October 1, 2007*
through
November 30, 2007
(Unaudited) | | For the Period
October 1, 2007*
through
November 30, 2007
(Unaudited) | | For the Period
October 1, 2007*
through
November 30, 2007
(Unaudited) | |
| OPERATIONS: | |
| Net investment income | | $ | 67,192 | | | $ | 83,890 | | | $ | 55,380 | | |
| Net realized gain/(loss) on investments and foreign currency transactions | | | 13,871 | | | | 27,725 | | | | (22,733 | ) | |
| Unrealized appreciation/(depreciation) on investments and foreign currency transactions | | | 39,759 | | | | (136,953 | ) | | | (543,710 | ) | |
| Net increase/(decrease) in net assets resulting from operations | | | 120,822 | | | | (25,338 | ) | | | (511,063 | ) | |
| SHAREHOLDER TRANSACTIONS: | |
| Proceeds from shares sold | | | 15,156,867 | | | | 30,322,883 | | | | 25,552,421 | | |
| Value of shares repurchased | | | — | | | | — | | | | — | | |
| Net increase in net assets resulting from shareholder transactions | | | 15,156,867 | | | | 30,322,883 | | | | 25,552,421 | | |
| Net increase in net assets | | | 15,277,689 | | | | 30,297,545 | | | | 25,041,358 | | |
| NET ASSETS: | |
| Beginning of Period | | | — | | | | — | | | | — | | |
| End of Period | | $ | 15,277,689 | | | $ | 30,297,545 | | | $ | 25,041,358 | | |
| Undistributed net investment income at end of period | | $ | 67,192 | | | $ | 83,890 | | | $ | 55,380 | | |
| CHANGES IN SHARES OUTSTANDING: | |
| Shares outstanding, beginning of period | | | — | | | | — | | | | — | | |
| Shares sold | | | 600,800 | | | | 1,200,800 | | | | 1,000,800 | | |
| Shares repurchased | | | — | | | | — | | | | — | | |
| Shares outstanding, end of period | | | 600,800 | | | | 1,200,800 | | | | 1,000,800 | | |
* Commencement of Investment Operations.
See Notes to Financial Statements.
36
| | | TDAX
INDEPENDENCE 2040
EXCHANGE-TRADED
FUND | | TDAX
INDEPENDENCE IN-TARGET
EXCHANGE-TRADED
FUND | |
| | | For the Period
October 1, 2007*
through
November 30, 2007
(Unaudited) | | For the Period
October 1, 2007*
through
November 30, 2007
(Unaudited) | |
| OPERATIONS: | |
| Net investment income | | $ | 52,818 | | | $ | 49,403 | | |
| Net realized gain/(loss) on investments and foreign currency transactions | | | (3,851 | ) | | | 852 | | |
| Unrealized appreciation/(depreciation) on investments and foreign currency transactions | | | (829,316 | ) | | | 91,560 | | |
| Net increase/(decrease) in net assets resulting from operations | | | (780,349 | ) | | | 141,815 | | |
| SHAREHOLDER TRANSACTIONS: | |
| Proceeds from shares sold | | | 25,769,839 | | | | 15,089,148 | | |
| Value of shares repurchased | | | — | | | | — | | |
| Net increase in net assets resulting from shareholder transactions | | | 25,769,839 | | | | 15,089,148 | | |
| Net increase in net assets | | | 24,989,490 | | | | 15,230,963 | | |
| NET ASSETS: | |
| Beginning of Period | | | — | | | | — | | |
| End of Period | | $ | 24,989,490 | | | $ | 15,230,963 | | |
| Undistributed net investment income at end of period | | $ | 52,818 | | | $ | 49,403 | | |
| CHANGES IN SHARES OUTSTANDING: | |
| Shares outstanding, beginning of period | | | — | | | | — | | |
| Shares sold | | | 1,000,800 | | | | 600,800 | | |
| Shares repurchased | | | — | | | | — | | |
| Shares outstanding, end of period | | | 1,000,800 | | | | 600,800 | | |
See Notes to Financial Statements.
37
TDAX Funds, Inc.
FINANCIAL HIGHLIGHTS
| | | TDAX
INDEPENDENCE 2010
EXCHANGE-TRADED
FUND | | TDAX
INDEPENDENCE 2020
EXCHANGE-TRADED
FUND | | TDAX
INDEPENDENCE 2030
EXCHANGE-TRADED
FUND | |
| For a Share outstanding throughout each period | | For the Period
October 1, 2007*
through
November 30, 2007
(Unaudited) | | For the Period
October 1, 2007*
through
November 30, 2007
(Unaudited) | | For the Period
October 1, 2007*
through
November 30, 2007
(Unaudited) | |
| Net Asset Value, beginning of period | | $ | 25.39 | | | $ | 25.52 | | | $ | 25.60 | | |
| Income from Investment Operations: | |
| Net investment income** | | | 0.14 | | | | 0.11 | | | | 0.09 | | |
| Net realized and unrealized gain/(loss) on investments** | | | (0.10 | ) | | | (0.40 | ) | | | (0.67 | ) | |
| Total from investment operations | | | 0.04 | | | | (0.29 | ) | | | (0.58 | ) | |
| Net Asset Value, end of period | | $ | 25.43 | | | $ | 25.23 | | | $ | 25.02 | | |
| Total Return*** | | | 0.16 | % | | | (1.14 | )% | | | (2.27 | )% | |
| Ratios/Supplemental Data: | |
| Net Assets, end of period (in 000's) | | $ | 15,278 | | | $ | 30,298 | | | $ | 25,042 | | |
| Ratios to average net assets: | |
| Expenses, net of expense reimbursements+ | | | 0.66 | % | | | 0.65 | % | | | 0.65 | % | |
| Expenses, prior to expense reimbursements+ | | | 2.16 | % | | | 1.55 | % | | | 1.72 | % | |
| Net investment income+ | | | 3.26 | % | | | 2.43 | % | | | 1.91 | % | |
| Portfolio turnover rate++ | | | 21 | % | | | 24 | % | | | 10 | % | |
* Commencement of Investment Operations.
** Based on average shares outstanding.
*** Total Return is calculated assuming an initial investment made at the Net Asset Value at the beginning of the period, reinvestment of all dividends distributions at Net Asset Value during the period, and redemption at Net Asset Value on the last day of the period. Total Return calculated for a period of less than one year is not annualized. The Total Return would have been lower if certain fees had not been reimbursed by Amerivest, a sub-advisor.
+ Annualized.
++ Portfolio turnover is not annualized and does not include securities received or delivered from processing creations or redemptions.
See Notes to Financial Statements.
38
| | | TDAX
INDEPENDENCE 2040
EXCHANGE-TRADED
FUND | | TDAX
INDEPENDENCE IN-TARGET
EXCHANGE-TRADED
FUND | |
| For a Share outstanding throughout each period | | For the Period
October 1, 2007*
through
November 30, 2007
(Unaudited) | | For the Period
October 1, 2007*
through
November 30, 2007
(Unaudited) | |
| Net Asset Value, beginning of period | | $ | 25.64 | | | $ | 25.08 | | |
| Income from Investment Operations: | |
| Net investment income** | | | 0.07 | | | | 0.12 | | |
| Net realized and unrealized gain/(loss) on investments** | | | (0.74 | ) | | | 0.15 | | |
| Total from investment operations | | | (0.67 | ) | | | 0.27 | | |
| Net Asset Value, end of period | | $ | 24.97 | | | $ | 25.35 | | |
| Total Return*** | | | (2.61 | )% | | | 1.08 | % | |
| Ratios/Supplemental Data: | |
| Net Assets, end of period (in 000's) | | $ | 24,989 | | | $ | 15,231 | | |
| Ratios to average net assets: | |
| Expenses, net of expense reimbursements+ | | | 0.65 | % | | | 0.66 | % | |
| Expenses, prior to expense reimbursements+ | | | 1.66 | % | | | 2.65 | % | |
| Net investment income+ | | | 1.72 | % | | | 3.17 | % | |
| Portfolio turnover rate++ | | | 6 | % | | | 39 | % | |
See Notes to Financial Statements.
39
TDAX Funds, Inc.
NOTES TO FINANCIAL STATEMENTS
1. ORGANIZATION
TDAX Funds, Inc. (the "Company") was organized as a Maryland Corporation on December 22, 2006 and is registered under the Investment Company Act of 1940, as amended (the "Act").
As of November 30, 2007, the following five (5) series of exchange-traded funds ("ETF") (each a "Fund" and collectively, the "Funds" or "TDAX Independence Exchange-Traded Funds") were in operation and trading:
| TDAX Independence 2010 Exchange-Traded Fund | | "Independence 2010 ETF" | |
|
| TDAX Independence 2020 Exchange-Traded Fund | | "Independence 2020 ETF" | |
|
| TDAX Independence 2030 Exchange-Traded Fund | | "Independence 2030 ETF" | |
|
| TDAX Independence 2040 Exchange-Traded Fund | | "Independence 2040 ETF" | |
|
| TDAX Independence In-Target Exchange-Traded Fund | | "Independence In-Target ETF" | |
|
XShares Advisors LLC (the "Advisor") serves as investment advisor to the Funds and has overall responsibility for the general management and administration of the Funds, subject to the supervision of the Funds' Board of Directors.
Each Fund offers shares, known as TDAX Independence Target Date Shares that are listed and traded on NYSE Arca, Inc. ("NYSE Arca"). Unlike conventional mutual funds, each Fund issues and redeems shares on a continuous basis, at net asset value, only in large specified lots, consisting of 200,000 shares, each called a "Creation Unit." Except when aggregated in Creation Units, shares are not individually redeemable securities of the Funds. A minimum transaction fee of $500 per Creation Unit is charged to those persons creating or redeeming Creation Units.
The investment objective of each Fund is to track the performance, before fees and expenses, of a particular index (the "Underlying Index"). Zacks Investment Research ("Zacks") is the creator of each Underlying Index. Each Underlying Index is comprised of a mix of securities from three broad asset classes, international equities, domestic equities, and fixed income (including, cash, cash equivalents or short-term money market instruments). The Underlying Indexes are designed to reflect a portfolio of investments that can be used for lifecycle investing. Lifecycle investing is an investment technique that starts by targeting a particular investment horizon. That investment horizon corresponds to the date the investor expects to need his or her invested assets.
The Underlying Indexes for the TDAX Independence Exchange-Traded Funds are:
| Fund | | Index | |
|
| Independence 2010 ETF | | Zacks 2010 Lifecycle Index | |
|
| Independence 2020 ETF | | Zacks 2020 Lifecycle Index | |
|
| Independence 2030 ETF | | Zacks 2030 Lifecycle Index | |
|
| Independence 2040 ETF | | Zacks 2040 Lifecycle Index | |
|
| Independence In-Target ETF | | Zacks In-Target Lifecycle Index | |
|
2. SIGNIFICANT ACCOUNTING POLICIES
The preparation of financial statements in conformity with accounting principles generally accepted in the United States of America ("US GAAP") requires management to make estimates and assumptions that affect the reported amounts and disclosures in the financial statements. Actual results could differ from those estimates.
A. Security Valuation The net asset value, or NAV, of each Fund's shares is calculated each business day as of the close of regular trading on the New York Stock Exchange, generally 4:00 p.m., Eastern Time. NAV per share is computed by dividing the net assets by the number of shares outstanding. When calculating the NAV of the Funds' shares, stocks held by a Fund are valued at their market value when reliable market quotations are readily available. Certain short-term debt instruments used to manage a Fund's cash are valued on the basis of amortized cost. The values of any foreign securities held by a Fund are converted into U.S. dollars using an exchange rate obtained from an independent third party.
B. Fair Value When reliable market quotations are not readily available, securities are priced at their fair value. A Fund also may use fair-value pricing if the value of a security it holds has been materially affected by events occurring before the Fund's pricing time but after the close of the primary markets or exchanges on which the security is traded. Fair-value prices are determined by a committee (the "Pricing Committee") according to procedures adopted by BNY Investment Advisors (BNY). BNY was delegated by the Board of Directors to perform this function. When fair-value pricing is employed, the prices of securities used by a Fund to calculate its NAV may differ from quoted or published prices for the same securities.
40
C. Securities Transactions Securities transactions are recorded as of the date that the securities are purchased or sold (trade date). Realized gains and losses from the sale or disposition of securities are calculated on the identified cost-methods. Corporate actions (including cash dividends) are recorded on the ex-date.
D. Investment Income Dividend income is recorded on the ex-dividend date. Interest income is recorded on the accrual basis.
E. Dividends and Distributions to Shareholders It is each Fund's policy to comply with all requirements of the Internal Revenue Code of 1986, as amended ("the Code"). Each Fund intends to qualify for and to elect treatment as a separate Regulated Investment Company ("RIC") under Subchapter M of the Code. It is the policy of each Fund to pay out dividends, if any, to investors at least annually. Taxable net realized gains from investment transactions, reduced by capital loss carryforwards, if any, are declared and distributed to shareholders at least annually. The capital loss carryforward amount, if any, is available to offset future net capital gains. The Funds may occasionally be required to make supplemental distributions at some other time during the year. The Funds reserve the right to declare special distributions if, in its reasonab le discretion, such action is necessary or advisable to preserve the status of each Fund as a RIC or to avoid imposition of income or excise taxes on undistributed income. Dividends and distributions to shareholders are recorded on the ex-dividend date. The amount of dividends and distributions from net investment income and net realized capital gains are determined in accordance with Federal income tax regulations which may differ from U.S. GAAP. These "book/tax" differences are either considered temporary or permanent in nature. To the extent these differences are permanent in nature, such amounts are reclassified within the components of net assets based on their federal tax basis treatment; temporary differences do not require reclassification. Dividends and distributions, which exceed earnings and profit for tax purposes, are reported as a tax return of capital. Each Fund pays out dividends from its net investment income to investors annually. Each Fund distributes any net capital gains annually.
There were no distributions paid during the period ended November 30, 2007.
F. Expenses Expenses that are directly related to each of the Funds are charged to that respective Fund. Expenses which are not readily identifiable to a specific Fund are allocated in such a manner as deemed equitable, taking into consideration the nature and type of expense and the relative net assets of each Fund. Each Fund is entitled to use its respective Underlying Index pursuant to a licensing agreement between Zacks and Amerivest and a sub-licensing agreement between Amerivest and the Advisor. There is no charge to the Funds in connection with these licensing agreements. Expenses related to the initial organization, registration and offering of the Funds are borne by Amerivest.
G. Taxes On July 13, 2006, the Financial Accounting Standards Board ("FASB") released FASB Interpretation No. 48, "Accounting for Uncertainty in Income Taxes" ("FIN 48"). FIN 48 provides guidance for how uncertain tax positions should be recognized, measured, presented and disclosed in the financial statements. FIN 48 requires the evaluation of tax positions taken or expected to be taken in the course of preparing the Fund's tax returns to determine whether the tax positions are "more-likely-than-not" of being sustained by the applicable tax authority. Tax positions not deemed to meet the more-likely-than-not threshold would be recorded as a tax benefit or expense in the current year. Adoption of FIN 48 is required for fiscal years beginning after December 15, 2006 and is to be applied to all open tax years as of the effective date. At thi s time, management has evaluated the implications of FIN 48 and there is no impact in the financial statements for the period ended November 30, 2007.
H. Short Term Investments Each Fund may invest in short-term instruments, which include obligations of the U.S. government and its agencies or instrumentalities; commercial paper, variable amount master demand notes and other debt securities, including high quality U.S. dollar-denominated short-term bonds and notes issued by domestic and foreign corporations; variable and floating rate securities; bank obligations; repurchase agreements collateralized by these securities; and shares of other investment companies that primarily invest in any of the above-referenced securities.
I. Security Lending Each Fund may lend portfolio securities to certain qualified institutional investors (typically brokers, dealers, banks, or other financial institutions). The loans are collateralized at all time by cash and/or high grade debt obligations in an amount at least equal to 105% of the current market value of the loaned securities and that collateral is marked to market daily. By lending its investment securities, a Fund attempts to increase its net investment income through the receipt of interest on the collateral received. The Funds will pay reasonable administration and custodial fees in connection with the loan of securities. If the borrower defaults on its obligation to return the securities lent because of insolvency or other reasons, a Fund could experience delays and costs in recovering the securities lent or in gai ning access to the collateral. These delays and costs could be greater for foreign securities. If a Fund is not able to recover the securities
41
TDAX Funds, Inc.
NOTES TO FINANCIAL STATEMENTS (CONTINUED)
lent, a Fund may sell the collateral and purchase a replacement investment in the market. The value of the collateral could decrease below the value of the replacement investment by the time the replacement investment is purchased. Cash received as collateral through loan transactions may be invested in other eligible securities. Investing this cash subjects that investment to market appreciation or depreciation.
The securities lending income earned by the Funds, if any, is disclosed on the Statements of Operations.
3. INVESTMENT ADVISORY AND OTHER AGREEMENTS
The Advisor has overall responsibility for the general management and administration of the Funds, subject to the supervision of the Funds' Board of Directors. Under the Investment Advisory Agreement, the Advisor is responsible for arranging sub-advisory, transfer agency, custody, fund administration, and all other non-distribution related services for the Funds to operate. The Advisor will also be responsible for employing any sampling strategy for the Funds. The Investment Advisory Agreement has an initial term of two years and can be terminated with sixty days written notice when authorized either by a majority vote of each Fund's outstanding voting shares or by a vote of a majority of the Company's Board of Directors.
For the services it provides to the Funds, the Advisor receives a unified advisory fee based on a percentage of the daily net assets of each Fund. The advisory fee is calculated daily and paid monthly in arrears. Out of the advisory fee, the Advisor pays, or arranges for the payment of, all fees and expenses of the Sub-Advisors, Transfer Agent, the Administrator and Accounting Agent and the Custodian. Each Fund is responsible for the payment of all other expenses associated with its operation, including but not limited to, brokerage expenses, taxes, interest, fees and expenses of counsel to the Funds, fees and expenses of the Disinterested Directors (including legal counsel fees), certain out-of-pocket expenses of the Advisor or Sub-Advisors, including, but not limited to cost of obtaining prices for security valuations (including manual broker quotes), Federal Reserve charges related to securities transactions, postage and insu rance on physical transfer items, telecommunication charges, and proxy voting execution, advice and reporting etc., fees and expenses of the Chief Compliance Officer and expenses associated with the Funds' compliance program, litigation expenses, fees and expenses of the Funds' independent auditors, registration fees, expenses associated with compliance by the Fund with regulatory requirements, including those relating to the development and distribution of its prospectus and shareholder reports, and extraordinary expenses. Pursuant to the Investment Advisory Agreement, the Advisor is authorized to engage one or more sub-advisors to perform any of the services contemplated to be performed by the Advisor under the Investment Advisory Agreement.
Amerivest Investment Management, LLC ("Amerivest") and BNY Investment Advisors ("BNY") act as investment sub-advisors to the Funds (each a "Sub-Advisor" and, together, the "Sub-Advisors"). Amerivest is a wholly owned subsidiary of TD AMERITRADE Holding Corporation. BNY is a separate identifiable division of The Bank of New York Mellon. Pursuant to separate Sub-Advisory Agreements between the Advisor and each Sub-Advisor, the Sub-Advisors will be responsible for the day-to-day management of the Funds, subject to the supervision of the Advisor and the Funds' Board of Directors. In this regard, the Sub-Advisors will be responsible for implementing the replication strategy for each Fund with regard to its underlying index and for general administration, compliance and management services as may be agreed between the Advisor and Sub-Advisors from time to time.
For its services provided to the Funds under the Investment Advisory Agreement, each Fund pays the Advisor a fee equal to 0.65% (per annum) of each Fund's average daily net assets. The fee is accrued daily and paid monthly in arrears.
In accordance with the terms of the Sub-Advisory Agreement with Amerivest, the Advisor will pay Amerivest, out of its own resources, a fee at the annual rate of 0.55% of each Fund's average daily net assets for the first $5 billion in assets and 0.60% of each Fund's average daily net assets in excess of $5 billion.
Out of the Sub-Advisory fee, Amerivest pays all fees and expenses of BNY, the Transfer Agent, Administrator and Accounting Agent and Custodian. Amerivest has contractually agreed to reduce its fees and/or pay Fund operating expenses (excluding, among other things, acquired fund fees and expenses, interest, taxes and extraordinary expenses) in order to limit each Fund's net annual operating expenses for shares of the Fund to 0.65% of the Fund's average net assets (the "Expense Cap"). For the period ended November 30, 2007, the "Outside the Cap" expenses on taxes for Independence 2010 ETF and Independence In-Target ETF amounted to 0.01% of the Fund's average daily net assets. The Expense Cap will remain in effect until at least September 30, 2008. Amerivest is permitted to be reimbursed for fee reductions and/or expense payments made in the prior three fiscal years. This reimbursement may be requested by Amerivest if the aggregate amount actually paid by the Fund toward operating expenses for such fiscal year (taking into account the reimbursement) does not exceed the Expense Cap.
42
Amerivest pays BNY, out of its own resources, a fee based on a percentage of the average daily net assets of each Fund as set forth below:
• 10 basis points (0.10%) of the first $100 million in combined daily net assets of all Funds; and
• 5 basis points (0.05%) of the combined daily net assets of all Funds in excess of $100 million.
There is a minimum annual fee of $35,000 per Fund.
Expenses related to the initial organization, registration and offering of the Funds will be borne by Amerivest.
The amounts subject to reimbursement to Amerivest at November 30, 2007 were as follows:
| | | Reimbursements available through: | |
| | | 11/30/2007 | | 11/30/2008 | | 11/30/2009 | |
| Independence 2010 ETF | | $ | 31,041 | | | $ | 31,041 | | | $ | 31,041 | | |
| Independence 2020 ETF | | | 31,041 | | | | 31,041 | | | | 31,041 | | |
| Independence 2030 ETF | | | 31,041 | | | | 31,041 | | | | 31,041 | | |
| Independence 2040 ETF | | | 31,041 | | | | 31,041 | | | | 31,041 | | |
| Independence In-Target ETF | | | 31,041 | | | | 31,041 | | | | 31,041 | | |
For the period ended November 30, 2007, the fee waiver and expenses assumed by Amerivest were as follows:
| | | Amerivest
Fee Waiver | | Expense Assumed
by Amerivest | |
| Independence 2010 ETF | | $ | 11,339 | | | $ | 19,702 | | |
| Independence 2020 ETF | | | 19,004 | | | | 12,037 | | |
| Independence 2030 ETF | | | 16,049 | | | | 14,992 | | |
| Independence 2040 ETF | | | 16,936 | | | | 14,105 | | |
| Independence In-Target ETF | | | 8,572 | | | | 22,469 | | |
The Bank of New York serves as Administrator, Custodian, Accounting Agent and Transfer Agent for each Fund. Effective July 2, 2007, The Bank of New York became a wholly-owned subsidiary of The Bank of New York Mellon Corporation.
ALPS Distributors, Inc. serves as the distributor of Creation Units for each Fund on an agency basis. The Distributor does not maintain a secondary market in shares of the Funds.
The Board is currently comprised of four Directors, of whom three Directors are not "interested" persons of the Company or the Advisor, as defined under the 1940 Act ("Disinterested Directors"). The Company pays each Disinterested Director an annual fee of $30,000, plus a fee for the attendance of each meeting. Each Disinterested Director will also receive $2,000 per Audit Committee meeting attended, except for the Audit Committee Chairman, who will receive $3,000 per Audit Committee meeting attended. The Company reimburses each Director for their costs and expenses associated with their performance of their duties hereunder, including the cost and expenses associated with attendance of meetings of the Board. Directors' fees and expenses are allocated among the Funds based on each Fund's relative average net assets.
4. FEDERAL INCOME TAXES
As of November 30, 2007, the cost of investments for federal income tax purposes were substantially the same as for book purposes and the aggregated gross unrealized appreciation/depreciation on investments and foreign currency were as follows:
| Cost | | Net Unrealized
Appreciation
(Depreciation) | | Gross
Unrealized
Appreciation | | Gross
Unrealized
Depreciation | | Net Unrealized
Appreciation on
Currency | |
| Independence 2010 ETF $14,959,957 | | $ | 38,583 | | | $ | 326,195 | | | $ | (287,612 | ) | | $ | 1,176 | | |
| Independence 2020 ETF 30,115,015 | | | (137,929 | ) | | | 746,399 | | | | (884,328 | ) | | | 976 | | |
| Independence 2030 ETF 25,323,996 | | | (544,022 | ) | | | 581,365 | | | | (1,125,387 | ) | | | 312 | | |
| Independence 2040 ETF 25,584,029 | | | (829,596 | ) | | | 596,273 | | | | (1,425,869 | ) | | | 280 | | |
| Independence In-Target ETF 14,984,490 | | | 91,234 | | | | 125,992 | | | | (34,758 | ) | | | 326 | | |
43
TDAX Funds, Inc.
NOTES TO FINANCIAL STATEMENTS (CONTINUED)
5. INVESTMENT PORTFOLIO TRANSACTIONS
For the period ended November 30, 2007, the cost of investments purchased and proceeds from sale of investments (excluding in-kind transactions and short-term investments) were as follows:
| | | Purchases | | Sales | |
| Independence 2010 ETF | | $ | 2,384,882 | | | $ | 3,072,461 | | |
| Independence 2020 ETF | | | 4,833,933 | | | | 4,925,069 | | |
| Independence 2030 ETF | | | 1,501,155 | | | | 1,711,152 | | |
| Independence 2040 ETF | | | 1,173,853 | | | | 1,331,527 | | |
| Independence In-Target ETF | | | 3,239,654 | | | | 2,162,559 | | |
For the period ended November 30, 2007, the cost of in-kind purchases and the proceeds from in-kind sales were as follows:
| | | Purchases | | Sales | |
| Independence 2010 ETF | | $ | 15,019,416 | | | | — | | |
| Independence 2020 ETF | | | 30,182,741 | | | | — | | |
| Independence 2030 ETF | | | 25,455,797 | | | | — | | |
| Independence 2040 ETF | | | 25,720,170 | | | | — | | |
| Independence In-Target ETF | | | 7,808,755 | | | | — | | |
6. CAPITAL SHARE TRANSACTIONS
As of November 30, 2007, there were 12.5 billion shares of $0.0001 par value capital shares authorized by the Company. Capital shares are issued and redeemed by each Fund only in Creation Units or multiples thereof. Except when aggregated in Creation Units, shares of each Fund are not redeemable. Transactions in capital shares for each Fund are disclosed in detail in the Statements of Changes in Net Assets. The consideration for the purchase of Creation Units of a Fund generally consists of the in-kind contribution of a designated portfolio of equity securities constituting a portfolio sampling representation of the securities included in the relevant Fund's underlying index and an amount of cash. Investors purchasing and redeeming Creation Units pay a purchase transaction fee and a redemption transaction fee to offset transfer and other transaction costs associated with the issuance and redemption of Creation Units.
7. INDEMNIFICATIONS
In the normal course of business the Company enters into contracts that contain a variety of representations which provide general indemnifications. The Company's maximum exposure under these arrangements cannot be known; however, the Company expects any risk of loss to be remote.
8. NEW ACCOUNTING PRONOUNCEMENTS
On September 15, 2006, the FASB released Statement of Financial Accounting Standards No. 157, "Fair Value Measurements" ("FAS 157") which provides enhanced guidance for measuring fair value. The standard requires companies to provide expanded information about the assets and liabilities measured at fair value and the potential effect of these fair valuations on an entity's financial performance. The standard does not expand the use of fair value in any new circumstances, but provides clarification on acceptable fair valuation methods and applications. Adoption of FAS 157 is required for fiscal years beginning after November 15, 2007. At this time, management is evaluating the implications of FAS 157 and its impact in the financial statements has not yet been determined.
44
TDAX Funds, Inc.
BOARD CONSIDERATIONS REGARDING APPROVAL OF ADVISORY AGREEMENT
At a meeting held on July 24, 2007, the Board of Directors (the "Board") of TDAX Funds, Inc. (the "Company"), including the Directors who are not "interested persons" (as defined in the Investment Company Act of 1940) approved the Company's investment advisory agreement (the "Advisory Agreement") with XShares Advisors LLC (the "Advisor"), with respect to the Company and its portfolios (the "Funds"), and separate subadvisory agreements (each, a "Sub-Advisory Agreement" and, together, with the Advisory Agreement, the "Agreements") between the Advisor and BNY Investment Advisors ("BNY"), and between the Advisor and Amerivest Investment Management, LLC ("Amerivest" and, together with BNY, the "Sub-Advisors"). Prior to the meeting, the Board received and reviewed substantial information regarding the Company and the Funds, the Advisor, and the Sub-Advisors, and the services to be provided by the Advisor and the Sub-Advisors to the Co mpany and its Funds under the Agreements. This information formed the primary (but not exclusive) basis for the Board's determinations. Below is a summary of the factors considered by the Board and the conclusions that formed the basis for the Board's approval of the Agreements.
1. The nature, extent and quality of the services to be provided by the Advisor and the Sub-Advisors.
The Board reviewed in detail the nature and extent of the services to be provided by the Advisor and the Sub-Advisors under the Agreements. The Board noted that these services will include, among other things, furnishing a continuous investment program for the Funds, including arranging for, or implementing, the purchase and sale of portfolio securities, the provision of general corporate services such as portfolio management compliance services and the preparation and filing of certain reports on behalf of the Company. The Board appreciated the relatively unique nature of the Funds, as exchange-traded funds, and the background and experience of the Advisor's and Sub-Advisors' senior management, including those individuals responsible for portfolio management. The Board considered that the Advisor will provide, at its own expense, office facilities and equipment for use by the Funds and supervisory persons responsible for superv ising and monitoring the Company's service providers. The Board noted that, in addition to managing the investment program for the Funds, the Advisor will provide certain non-advisory services.
The Board also considered that the Advisor will pay for the compensation of officers or employees of the Company who are also officers or employees of the Advisor, except as may otherwise be determined by the Board. The Board evaluated these factors in consultation with counsel, Paul, Hastings, Janofsky & Walker LLP. Based on this review, the Board concluded that the nature, extent, and quality of services to be provided by the Advisor to the Funds under the Advisory Agreement were reasonable and appropriate in relation to the advisory fee, taking special consideration of the fact that the advisory fee is a unitary fee and, as a result, a portion of this unitary advisory fee will be used to compensate the Funds' service providers.
The Board also considered BNY's operational capabilities and resources, and BNY's experience in serving as an advisor to exchange-traded funds, noting that BNY currently provides investment advisory and management services to other exchange-traded funds. The Board also noted that The Bank of New York, an affiliate of BNY, was proposed to serve as the Funds' administrator, accountant, custodian and transfer agent and will receive compensation for acting in these capacities and will be responsible for, among other things, coordinating the Funds' audits, financial statements and tax returns, managing expenses and budgeting for the Funds, processing trades on behalf of each Fund and acting as Custodian for Fund assets. In this regard, the Board concluded that the benefits accruing to BNY and its affiliates by virtue of their relationship with the Funds are reasonable and fair in comparison with the anticipated costs of providing the relevant services. The Board noted that the Advisor, not the Funds, pays the fees to BNY under the Sub-Advisory Agreement with BNY.
The Board also considered Amerivest's role in providing oversight over BNY, such oversight to include review of the portfolio of securities of each Fund in accordance with the terms of the Funds' prospectuses and statements of additional information, assistance in the resolution of any pricing issues and assistance in the development of trading strategies. In addition, Amerivest will (i) coordinate with BNY to keep the Board and the Advisor fully informed on an ongoing basis of all material facts concerning the investment and reinvestment of the assets of each Fund and the operations of Amerivest and BNY, (ii) in conjunction with BNY, promptly notify the Advisor or the Board of fair valuation situations or of significant events that may require fair value pricing of all or a portion of a Fund's portfolio and provide assistance in determining the fair value of securities, and (iii) provide reasonable assistance to the Advisor, BN Y, the administrator, the custodian and foreign custodians, the transfer agent and pricing agents. In this regard, the Board concluded that the benefits accruing to Amerivest by virtue of its relationship with the Funds are reasonable and fair in comparison with the anticipated costs of providing the relevant services. The Board also noted that the Advisor, not the Funds, pays the fees to Amerivest under the Sub-Advisory Agreement with Amerivest.
45
TDAX Funds, Inc.
BOARD CONSIDERATIONS REGARDING APPROVAL OF ADVISORY AGREEMENT (CONTINUED)
2. The performance of the Funds, the Advisor and the Sub-Advisors.
Since the Funds have not yet commenced operations, it was not possible for the Board to consider the performance of the Funds, the Advisor and the Sub-Advisors. In connection with its assessment of the ability of the Advisor and the Sub-Advisors to perform their duties under the Agreements, the Board considered the Advisor's and Sub-Advisors' financial condition and whether they had the resources necessary to carry out their functions under the Agreements. The Board concluded that the Advisor and the Sub-Advisors had the financial resources necessary to perform their obligations under the Agreements.
3. The cost of the advisory services and the profits to the Advisor, Sub-Advisors, and their affiliates from their relationship with the Funds.
The Board considered the proposed level of the advisory fee for each Fund against a sample of advisory fees charged by other exchange-traded funds provided with the materials that had been distributed to each of the Directors in advance of the meeting (the "Board Materials"). The Board also considered comparative non-management fee expenses and comparative total fund expenses of the Funds against a sample universe of other exchange-traded funds provided with the Board Materials. The Board considered that this type of information would be useful in assessing whether the Advisor and the Sub-Advisors would be providing services at a cost that was competitive with other exchange-traded funds. The Board concluded that the contract rate advisory fee and total fund expenses for each of the Funds were reasonable, but noted that the advisory fees charged by the Funds were at the higher end of the range as compared to the advisory fees ch arged by the other exchange-traded funds listed in the Board Materials. In concluding that the advisory fees and fund expenses were reasonable, the Board considered the Company's innovative and unique investment process. In assessing this information, the Directors considered both the gross fees as well as the level of fees after waivers and/or reimbursements.
4. The extent to which economies of scale will be realized as the Funds grow and whether fee levels reflect those economies of scale.
With respect to the Board's consideration of economies of scale, the Board discussed whether economies of scale would be realized by the Funds at higher asset levels. The Board also assessed whether certain of the Advisor's costs would increase if asset levels rise. The Board concluded that under foreseeable conditions, they were unable to assess at this time whether economies of scale would be realized if the Funds were to experience significant growth. In the event there were to be significant asset growth in the Funds, the Board determined to reassess whether the advisory fee appropriately took into account any economies of scale that had been realized as a result of that growth.
5. Other factors.
The Board also considered whether the Sub-Advisors would benefit in other ways from their relationship with the Funds, noting that the Sub-Advisors do not presently participate in any soft-dollar arrangements in connection with the Funds' brokerage transactions and that affiliates of the Sub-Advisors provide other services to the Funds.
Based on a consideration of all these factors in their totality, the Board, including the "non-interested" Directors, determined that each Fund's advisory fee, as well as the sub-advisory fees payable to each Sub-Advisor, were fair and reasonable with respect to the quality of services provided and in light of the other factors described above that the Board deemed relevant. Accordingly, the Board determined to approve the Agreements. The Board based its decision on evaluations of all these factors as a whole and did not consider any one factor as all-important or controlling.
46
TDAX Funds, Inc.
ADDITIONAL INFORMATION
PROXY VOTING POLICIES AND PROCEDURES
A description of the policies and procedures that the Company uses to determine how to vote proxies related to each Fund's portfolio securities, (and information on how the Funds will have voted proxies during the period ending June 30, 2008) is available without charge, upon request, (i) by calling 800-925-2870; (ii) on the Company's website at www.tdaxshares.com; and (iii) on the Securities and Exchange Commission's ("SEC") website at www.sec.gov.
SHAREHOLDER REPORTS AND QUARTERLY PORTFOLIO DISCLOSURE
The Funds are required to file their complete schedule of portfolio holdings with the SEC for their first and third fiscal quarters on Form N-Q. Copies of the filings are available without charge, upon request on the SEC's website at www.sec.gov and are available by calling the Company at 800-925-2870. You can also obtain copies of Form N-Q by (i) visiting the SEC's Public Reference Room in Washington, DC (information on the operation of the Public Reference Room may be obtained by calling 800-SEC-0330); (ii) sending your request and a duplicating fee to the SEC's Public Reference Room, Washington, DC 20549-0102; or (iii) sending your request electronically to publicinfo@sec.gov.
Information about each Fund's portfolio holdings is available daily at www.tdaxshares.com.
47
This Page is Intentionally Left Blank
48
This material must be accompanied or preceded by a prospectus.
An Investor should consider the fund's investment objective, risks, charges and expenses carefully before investing.
There are risks involved with investing in exchange-traded funds ("ETFs") including possible loss of money. TDAX Independence ETFs are not actively managed and are subject to risks similar to stocks, including those related to short selling and margin maintenance. Losses from short sales may be unlimited, and losses from purchases on margin may exceed original investment.
Investments in small and medium capitalization companies may be subject to higher volatility than larger, more established companies.
Investments in foreign securities will be subject to certain risks not associated with domestic securities, such as currency fluctuations, and changes in political and economic conditions.
Investments in fixed income securities will be subject to certain risks as well. The prices of fixed income securities respond to economic developments, particularly interest rate changes, as well as to perceptions about the credit risk of individual issuers. Generally, fixed income securities will decrease in value if interest rates rise, and the volatility of lower rated securities is even greater than that of higher rated securities.
There is no assurance that the investment process will consistently lead to successful investing. Diversification does not eliminate the risk of experiencing investment losses.
The prospectus is not an offer to buy or sell the portfolio shares, nor is the fund soliciting an offer to buy its shares in any jurisdiction where the offer or sale is not permitted.
For this and more complete information about the fund call 800.925.2870 or visit the website www.tdaxshares.com for a prospectus. Please read the prospectus carefully before investing.
TDAX Independence ETFs are distributed by ALPS Distributors, Inc., member of FINRA, which is not affiliated with TDAX Funds, Inc. or any other affiliate.
TDAX Funds, Inc.
INVESTMENT ADVISOR
XShares Advisors LLC
420 Lexington Avenue
Suite 2550
New York, NY 10170
INVESTMENT SUB-ADVISORS
Amerivest Investment Management, LLC
1005 North Ameritrade Place
Bellevue, NE 68005
BNY Investment Advisors
200 Park Avenue
8th Floor
New York, NY 10166
ADMINISTRATOR, CUSTODIAN,
FUND ACCOUNTANT & TRANSFER AGENT
The Bank of New York
101 Barclay Street
New York, NY 10286
DISTRIBUTOR
ALPS Distributors, Inc.
P.O. Box 328
Denver, CO 80201
INDEPENDENT REGISTERED
PUBLIC ACCOUNTING FIRM
Eisner LLP
750 Third Avenue
New York, NY 10017
LEGAL COUNSEL
Paul, Hastings, Janofsky, Walker LLP
75 East 55th Street
New York, NY 10022
TDAX Independence Exchange-Traded Funds

Item 2. Code of Ethics.
Not required for a semi-annual period.
Item 3. Audit Committee Financial Expert.
Not required for a semi-annual period.
Item 4. Principal Accountant Fees and Services.
Not required for a semi-annual period.
Items 5. Audit Committee of Listed Registrants.
Not required for a semi-annual period.
Item 6. Schedule of Investments.
The Schedules of Investments are included as part of the report to shareholders filed under Item 1 of this Form.
Item 7. Disclosure of Proxy Voting Policies and Procedures for Closed-End Management Investment Companies.
Not applicable.
Item 8. Portfolio Managers of Closed-End Management Investment Companies.
Not applicable.
Item 9. Purchases of Equity Securities by Closed-End Management Investment Company and Affiliated Purchasers.
Not applicable.
Item 10. Submission of Matters to a Vote of Security Holders.
There have been no material changes to the procedures by which the shareholders may recommend nominees to the Registrant’s Board of Directors that would require disclosure herein.
Item 11. Controls and Procedures.
a) Based on their evaluation of the Registrant’s disclosure controls and procedures (as defined in Rule 30a-3-(c) under the Investment Company Act of 1940) as of a date within 90 days of the filing date of this report, the Registrant’s Chief Executive Officer (principal executive officer) and Chief Financial Officer (principal financial officer) have concluded that such disclosure controls and procedures are reasonably designed and are operating effectively to ensure that material information relating to the Registrant, including its consolidated subsidiaries, is made known to them by others within those entities, particularly during the period in which this report is being prepared, and that the information required in filings on Form N-CSR is recorded, processed, summarized and reported on a timely basis.
b) There were no significant changes in the Registrant’s internal controls over financial reporting (as defined in Rule 30a-3(d) under the Investment Company Act of 1940) that occurred during the Registrant’s first fiscal half-year that have materially affected, or are reasonably likely to materially affect, the Registrant’s internal control over financial reporting.
Item 12. Exhibits.
(a) Certifications of the Registrant’s Chief Executive Officer and Chief Financial Officer pursuant to Section 302 of the Sarbanes-Oxley Act of 2002 are attached as Exhibit 99.CERT.
(b) Certifications of the Registrant’s Chief Executive Officer and Chief Financial Officer pursuant to Section 906 of the Sarbanes-Oxley Act of 2002 is attached as Exhibit 99.906CERT.
SIGNATURES
Pursuant to the requirements of the Securities Exchange Act of 1934 and the Investment Company Act of 1940, the Registrant has duly caused this report to be signed on its behalf by the undersigned, thereunto duly authorized.
(Registrant) | TDAX Funds, Inc. | | . |
| | | |
By: | /s/ David M. Kelley | | . |
| | | |
Name: | David M. Kelley | |
| | |
Title: | President and Chief Executive Officer | |
| | |
Date: | February 5, 2008 | |
| | | | | | |
Pursuant to the requirements of the Securities Exchange Act of 1934 and the Investment Company Act of 1940, this report has been signed by the following persons on behalf of the Registrant and in the capacities and on the dates indicated.
By: | /s/ David M. Kelley | | . |
| | | |
Name: | David M. Kelley | |
| | |
Title: | President and Chief Executive Officer | |
| | |
Date: | February 5, 2008 | |
| | | | |
By: | /s/ David W. Jaffin | | . |
| | | |
Name: | David W. Jaffin | |
| | |
Title: | Chief Financial Officer, Secretary and Treasurer | |
| | |
Date: | February 5, 2008 | |
| | | | |