UNITED STATES SECURITIES AND EXCHANGE COMMISSION
Washington, DC 20549
FORM 10-K
| þ | ANNUAL REPORT PURSUANT TO SECTION 13 OR 15(d) OF THE SECURITIES EXCHANGE ACT OF 1934 |
for the fiscal year ended December 31, 2011
OR
| ¨ | TRANSITION REPORT PURSUANT TO SECTION 13 OR 15(d) OF THE SECURITIES EXCHANGE ACT OF 1934 |
for the transition period from to
COMMISSION FILE NUMBER: 001-33658
Horsehead Holding Corp.
(Exact name of registrant as specified in its charter)
| | |
| DELAWARE | | 20-0447377 |
(State or other jurisdiction of
incorporation or organization) | | (I.R.S. Employer
Identification No.) |
| |
4955 Steubenville Pike, Suite 405 Pittsburgh, Pennsylvania 15205 (Address of Principal Executive Offices,
including Zip Code) | | (724) 774-1020 (Registrant’s Telephone Number,
Including Area Code) |
Securities registered pursuant to Section 12(b) of the Act:
| | |
Title of each class | | Name of exchange on which registered |
| Common Stock, par value $0.01 per share | | The NASDAQ Stock Market LLC |
Securities registered pursuant to Section 12(g) of the Act:
None.
Indicate by check mark if the registrant is a well-known seasoned issuer, as defined in Rule 405 of the Securities Act. Yes ¨ No þ
Indicate by check mark if the registrant is not required to file reports pursuant to Section 13 or Section 15(d) of the Act. Yes ¨ No þ
Indicate by check mark whether the registrant (1) has filed all reports required to be filed by Section 13 or 15(d) of the Securities Exchange Act of 1934 during the preceding 12 months (or for such shorter period that it was required to file such reports), and (2) has been subject to such filing requirements for the past 90 days. Yes þ No ¨
Indicate by check mark whether the registrant has submitted electronically and posted on its corporate Web site, if any, every Interactive Data File required to be submitted and posted pursuant to Rule 405 of Regulation S-T (§ 232.405 of this chapter) during the preceding 12 months (or for such shorter period that the registrant was required to submit and post such files). Yes þ No ¨
Indicate by check mark if disclosure of delinquent filers pursuant to Item 405 of Regulation S-K is not contained herein, and will not be contained, to the best of the registrant’s knowledge, in definitive proxy or information statements incorporated by reference in Part III of this Form 10-K or any amendment to this Form 10-K. þ
Indicate by check mark whether the registrant is a large accelerated filer, an accelerated filer, a non-accelerated filer or a smaller reporting company. See definitions of “large accelerated filer,” “accelerated filer” and “smaller reporting company” in Rule 12b-2 of the Exchange Act.
| | | | | | |
| Large accelerated filer ¨ | | Accelerated filer þ | | Non-accelerated filer ¨ | | Smaller reporting company ¨ |
| | (Do not check if a smaller reporting company) |
Indicate by check mark whether the registrant is a shell company (as defined in Rule 12b-2 of the Exchange Act). Yes ¨ No þ
As of June 30, 2011, the aggregate market value of the registrant’s common stock held by non-affiliates of the registrant was approximately $509 million (based upon the closing sale price of the common stock on that date on The NASDAQ Global Select Market). For this purpose, all shares held by directors, executive officers and stockholders beneficially owning ten percent or more of the registrant’s common stock have been treated as held by affiliates.
The number of shares of the registrant’s common stock outstanding as of March 7, 2012 was 43,720,289
DOCUMENTS INCORPORATED BY REFERENCE:
Portions of the registrant’s definitive proxy statement for its 2012 annual meeting of stockholders, which is expected to be filed with the Securities and Exchange Commission not later than April 10, 2012 are incorporated by reference into Part III of this report on Form 10-K. In the event such proxy statement is not filed by April 10, 2012, the required information will be filed as an amendment to this report on Form 10-K no later than that date.
TABLE OF CONTENTS
i
CAUTIONARY STATEMENT FOR PURPOSES OF THE SAFE HARBOR PROVISIONS OF THE PRIVATE SECURITIES LITIGATION REFORM ACT OF 1995
This report contains forward-looking statements within the meaning of the federal securities laws. These statements relate to analyses and other information, which are based on forecasts of future results and estimates of amounts not yet determinable. These statements also relate to our future prospects, developments and business strategies.
These forward looking statements are identified by the use of terms and phrases such as “anticipate”, “believe”, “could”, “estimate”, “expect”, “intend”, “may”, “plan”, “predict”, “project”, and similar terms and phrases, including references to assumptions. However, these words are not the exclusive means of identifying such statements. These statements are contained in many sections of this report, including “Part II, Item 7. Management’s Discussion and Analysis of Financial Condition and Results of Operations.” Although we believe that our plans, intentions and expectations reflected in or suggested by such forward-looking statements are reasonable, we cannot assure you that we will achieve those plans, intentions or expectations. We believe that the following factors, among others (including those described in “Part I, Item 1A. Risk Factors”), could affect our future performance and the liquidity and value of our securities and cause our actual results to differ materially from those expressed or implied by forward-looking statements made by us or on our behalf: the cyclical nature of the metals industry; decreases in the prices of zinc and nickel-based products; long-term declines in demand for zinc and nickel products due to competing technologies or materials; competition from global zinc and nickel manufacturers; our ability to implement our business strategy successfully; our ability to obtain sufficient funds to construct the new zinc facility, including accessing capital markets; our ability to service our debt; our ability to construct and operate the new zinc facility; our ability to realize the projected benefits from the new zinc facility if constructed; work stoppages and labor disputes; material disruptions at any of our manufacturing facilities, including for equipment, power failures or industrial accidents; fluctuations in the costs or availability of our energy supplies; decreases in order volume from major customers; the costs of compliance with environmental, health and safety laws and responding to potential liabilities and changes under these laws; failure of our hedging strategies, including those relating to the prices of energy, raw materials and zinc products; our ability to attract and retain key personnel; our ability to protect our intellectual property and know-how; our dependence on third parties for transportation services; and risks associated with our recent acquisition of Zochem, Inc. on November 1, 2011 and with future acquisitions, joint ventures or asset dispositions.
There may be other factors that may cause our actual results to differ materially from the forward-looking statements. Our actual results, performance or achievements could differ materially from those expressed in, or implied by, the forward-looking statements. We can give no assurances that any of the events anticipated by the forward-looking statements will occur or, if any of them does, what impact they will have on our results of operations and financial condition. You should carefully read the factors described in the “Risk Factors” section of this report for a description of certain risks that could, among other things, cause our actual results to differ from these forward-looking statements.
All forward-looking statements are qualified in their entirety by this cautionary statement, and we undertake no obligation to revise or update this Annual Report on Form 10-K to reflect events or circumstances after the date hereof.
ii
PART I
Horsehead Holding Corp. is the parent company of Horsehead Corporation, a leading U.S. producer of specialty zinc and zinc-based products and a leading recycler of electric arc furnace dust (“Horsehead”); The International Metals Reclamation Company, Inc., a leading recycler of nickel-bearing wastes and nickel-cadmium (“Ni-Cd”) batteries in North America (“INMETCO”) that we acquired on December 31, 2009; and Zochem Inc. (“Zochem”), a producer of zinc oxide in North America that we acquired on November 1, 2011. We have production and/or recycling operations at six facilities located in four states in the United States. Zochem operates from one facility located in Canada. We also own and until September 2011 operated, a 110 megawatt coal-fired power plant that provided us with a captive source of electricity and allowed us to sell approximately one-fifth of its capacity. In September 2011, we entered into a new power purchase agreement to supply our electrical power needs at our Monaca, Pennsylvania facility and have temporarily idled our power plant. Our products are used in a wide variety of applications, including in the galvanizing of fabricated steel products, as components in rubber tires, alkaline batteries, paint, chemicals and pharmaceuticals and as a remelt alloy in the production of stainless steel. We believe that we are the largest refiner of zinc oxide and Prime Western grade (“PW”) zinc metal, a grade of zinc containing a minimum of 98.5% zinc, in North America. We believe we are also the largest North American recycler of electric arc furnace (“EAF”) dust, a hazardous waste produced by the carbon steel mini-mill manufacturing process. Through our INMETCO operations, we believe we are also a leading recycler of EAF dust and other nickel-bearing waste generated by specialty steel producers and a leading recycler of Ni-Cd batteries in North America. We, together with our predecessors, have been operating in the zinc industry for more than 150 years and in the nickel-bearing waste industry for more than 30 years. We operate as two business segments.
While we vary our raw material inputs, or feedstocks, based on cost and availability, we generally produce our zinc products at our Monaca, Pennsylvania facility using 100% recycled zinc, including zinc recovered from our four EAF dust recycling operations located in four states. We believe that our ability to convert recycled zinc into finished products results in lower feed costs than for smelters that rely primarily on zinc concentrates, and several of our customers have long-term contracts with us to provide us with EAF dust. Our four EAF dust recycling facilities also generate service fee revenue from steel mini-mills by providing a convenient and safe means for recycling their EAF dust. In 2010, we commenced operations at our fourth EAF dust processing facility located in South Carolina. INMETCO provides recycling services, some of which are on a tolling basis, from a single production facility in Ellwood City, Pennsylvania. Our current plans to construct a new zinc facility in Rutherford County, North Carolina could potentially enable us to recover other marketable materials from EAF dust.
During 2011 we sold approximately 304.0 million pounds of zinc products and 20.0 million pounds of nickel-based products, generally priced at amounts based on zinc and nickel prices on the London Metals Exchange (“LME”). For the year ended December 31, 2011, we generated sales and net income of $451.2 million and $21.5 million, respectively.
Competitive Strengths
Leading Market Positions and Strategically Located Recycling Facilities
We believe that we are the largest refiner of zinc oxide and PW zinc metal in North America, based on capacity, and that we are a leading recycler of nickel-bearing waste material generated by the stainless and specialty steel industry and a leading recycler of nickel-bearing batteries. We also believe that we are the largest North American recycler of EAF dust and that we currently recycle more than half of all EAF dust generated in the United States. In addition, our four company-owned EAF dust recycling facilities are strategically located near major EAF operators, reducing transportation costs and enhancing our ability to compete effectively with other means of EAF dust disposal. We believe that the location of our facilities, together with our long-term EAF dust contracts with several of our customers, competitive cost position, extensive zinc distribution network and proprietary market knowledge, will enable us to maintain our leading market positions and continue to capture market share in zinc products, zinc recycling and nickel-bearing waste recycling.
Strong, Long-Standing Relationships with Diverse Customer Base
We believe that our product quality, reputation for on-time delivery and competitive pricing enable us to maintain strong relationships with a broad base of customers in each of our end markets. For example, we believe we are the leading supplier of zinc metal to the after-fabrication hot-dip segment of the North American galvanizing industry. We also sell zinc oxide to over 200 producers of tire and rubber products, chemicals, paints, plastics and pharmaceuticals. We have supplied zinc oxide to nine of our current ten largest zinc oxide customers for over ten years, and our recent acquisition of Zochem on November 1, 2011, a producer of zinc oxide in North America, expands our customer base throughout North America. We believe that we are the sole or primary supplier of PW zinc to most of our customers. We believe that we are the largest recycler of EAF dust in the United States, and we now recycle EAF dust for nine of North America’s ten largest carbon steel EAF operators and North America’s three largest stainless steel producers, based on 2011 production volume. In addition, INMETCO provides environmental services to over 200 customers that generate nickel-containing waste products such as filter cake, spent pickle liquor, grinding swarf and mill scale. INMETCO also collects and recycles batteries from The Rechargeable Battery Recycling Corporation, founded in 1994 by five major rechargeable battery makers, as well as through its own collection programs.
Low-Cost Feedstock and Contracted EAF Dust Sources
We believe that we are the only zinc smelter in North America with the proven ability to refine zinc metal and zinc oxide using 100% recycled zinc feedstocks. Our use of large amounts of recycled feedstock reduces our exposure to increases in LME zinc prices and increases our operating margins during periods of high LME zinc prices.In addition, our EAF dust recycling operations provide us with a reliable, cost-effective source of recycled zinc without relying on third-party sellers. Further, several of our EAF dust customers have long-term contracts to provide us with their EAF dust.
Proven, Proprietary Technology with Flexible Processes
Since our recycling processes convert EAF dust and other wastes into saleable products, our customers generally face less exposure to environmental liabilities from EAF dust, which the U.S. Environmental Protection Agency (“EPA”) classifies as a listed hazardous waste, than if they disposed of their EAF dust in landfills. The EPA has designated our recycling processes as the “Best Demonstrated Available Technology” for the high-temperature metals recovery from EAF dust from both carbon steel mini-mill and stainless steel producers. In addition, we believe our zinc smelter and refinery in Monaca, Pennsylvania is able to produce zinc from a wide range of zinc-bearing raw materials. This flexibility allows us to modify our feedstock mix based on cost and availability, as well as to use 100% recycled zinc feedstock, whether purchased from third parties at a discount to the LME zinc price or generated by our EAF dust recycling operations. We believe that INMETCO’s recycling process is a successful technology for the recycling of a broad range of nickel-bearing waste products. INMETCO has successfully licensed this technology in the past.
Strong, Experienced Management Team
Our nine-member senior management team collectively has over 200 years of experience in zinc- and metal-related industries. James M. Hensler, our Chief Executive Officer, joined us in early 2004 and has since established a culture of continuous improvement in safety and operational excellence, which has led to significant cost reductions, productivity improvements and growth.
Business Strategy
Pursue Plans to Construct New State-of-the-Art Zinc Facility
During the first quarter of 2011, we announced the completion of a preliminary feasibility study to construct a new zinc facility (the “new zinc facility”) based on the ZINCEXTM solvent extraction technology combined with state-of-the-art electro-winning and casting capabilities. We anticipate that the new zinc facility will significantly reduce our manufacturing costs due to higher zinc recovery, lower energy usage, higher labor productivity and lower maintenance requirements associated with the new technology. In addition, we expect to realize lower operating and logistics costs in our EAF dust recycling plants resulting from the elimination of the
2
need to calcine a portion of our Waelz oxide, also known as crude zinc oxide (“CZO”), before it is fed to the smelter. We expect that the new zinc facility will be capable of producing in excess of 150,000 tons of zinc metal per year and will enable us to convert Waelz oxide derived from EAF dust and other recycled materials into special high grade (“SHG”) zinc of 99.995% purity and continuous galvanizing grade (“CGG”) in addition to the PW grade that we currently produce. This will allow us to expand into new markets, including selling to continuous galvanizers, which include some of our EAF dust customers, die casters and LME warehouses, while continuing to serve customers in our existing markets. We believe the new technology will also allow us to recover value from metals such as silver, lead and copper contained in EAF dust. The new zinc facility will replace our older smelter technology and will allow us to significantly reduce emissions of greenhouse gases and particulates into the atmosphere. Total capital expenditures for the construction of the new zinc facility are currently estimated to range from $350.0 million to $375.0 million. During the third quarter of 2011, we announced that the new zinc facility will be constructed in Rutherford County, North Carolina. As of December 31, 2011, site clearing and grading has been completed, detailed engineering is underway and long-lead time equipment is being ordered. We anticipate that construction of the plant will be completed and start-up will begin in the third quarter of 2013. We have spent approximately $42 million on this project through the end of 2011.
Continue to Focus on Production Efficiencies and Operating Cost Reductions
We have reduced our manufacturing costs by increasing our usage of low-cost feedstock, streamlining our organizational structure and implementing “Six Sigma” (a business process improvement methodology) initiatives, and we intend to continue to focus on these and similar initiatives in the future. As part of our “Six Sigma” initiatives, we made a series of operating improvements at certain facilities. For example, at our Calumet, Illinois plant we have reduced the amount of non-zinc materials fed to our smelter, thereby reducing operating costs by approximately $1.4 million on an annual basis without significant capital expenditures. Two projects, one directed at identifying better materials of construction for sinter machine pallets at our smelter in Monaca, Pennsylvania, and the other, aimed at improving calcining process control at our Palmerton, Pennsylvania facility, have reduced our sinter machine pallet repair costs at our Monaca, Pennsylvania facility by approximately $2.0 million annually. We also automated key operational parameters for the zinc smelting furnaces at our Monaca, Pennsylvania facility leading to a more consistent operation and steadily improving our yields, which resulted in a cost savings of approximately $3.5 million in 2010. Finally, in response to the significant decrease in demand for zinc metals resulting from the economic downturn that began in the third quarter of 2008, we took aggressive steps to reduce our operating costs, including the shutdown of our smallest and highest cost recycling facility in Beaumont, Texas, reductions in the price paid for purchased feedstock as a percentage of the LME price, a reduction of our salaried and temporary workforce and a cost-saving revision to our construction strategy for our recently completed South Carolina facility. In 2009, we idled our Bartlesville, Oklahoma hydrometallurgical facility and began outsourcing the processing of the lead-bearing material at reduced costs.
Expand EAF Dust Recycling Capacity
We estimate that in 2007 approximately one-third of the carbon steel EAF dust generated in the United States was deposited in landfills, including by existing customers. Since then, new EAF steel plant projects have come online, further increasing EAF dust generation in the United States. Due to productivity, capital and operating cost efficiencies relative to integrated steel mills, the mini-mill share of the U.S. steel market has doubled in the last ten years and is expected to account for over 70% of U.S. steel produced by 2017, according to the Steel Manufacturers Association. Steel mini-mill operators have increasingly relied on recyclers rather than landfills to manage this increased output. In order to grow our EAF dust recycling business, we placed a new kiln with an annual EAF dust recycling capacity of 80,000 tons into production in early 2008 at our facility in Rockwood, Tennessee and placed into production two kilns with a combined annual capacity of 180,000 tons at our new facility in Barnwell, South Carolina in 2010. We entered into a long term contract with a major U.S. steel mini-mill producer to process all of the EAF dust generated at its facilities located near this new plant. In 2009, we acquired the EAF dust contracts held by Envirosafe Services of Ohio, Inc (“ESOI”), a leading landfill disposer of EAF dust. In addition to generating additional service fees, we expect that our new kilns will provide us with additional low-cost recycled zinc that we can use in our own smelting process or that we can sell as feed to other zinc smelters. We estimate that with the increased recycling capacity, less than 10% of the EAF dust generated is now deposited in landfills.
3
Diversify and Expand Environmental Services Business
Our core strengths relate to our proven ability to manage hazardous and non-hazardous wastes generated by industrial processes and our experience and capabilities to recover valuable metals from these waste streams. We expect to expand our environmental services business into a broader range of metal-bearing wastes. The acquisition of INMETCO is an example of this diversification and we believe that INMETCO will be a platform for further growth. We expect to continue to pursue capital investment and acquisition opportunities in this area and believe this will reduce our exposure to changes in zinc prices.
Continue to Reduce Exposure to Commodity Price Fluctuations
We regularly evaluate our zinc price hedging alternatives considering the costs and benefits in light of the commodity price environment. We sourced approximately 74% of our zinc feedstock in 2011 at our Monaca, Pennsylvania facility from our EAF dust recycling operations. This source of feedstock is not significantly impacted by changes in LME zinc prices. The remainder of our zinc feedstock costs is derived primarily from zinc secondaries which use LME-based pricing, and therefore are somewhat naturally hedged against changes in the LME price.
At December 31, 2011, we have zinc put options with an $0.85 per pound strike price outstanding, which cover approximately 160,000 tons of zinc production, representing approximately 75% of the expected shipments for the period from January 2012 through June 2013. These put options are in place to provide protection to operating cash flow in the event that zinc prices decline below that level during the construction of the new zinc facility. In June 2011, we entered into hedge arrangements in which we bought put options with a strike price of $0.85 per pound, sold call options with a strike price of $1.20 per pound and bought call options with a strike price of $1.81 per pound. The value of these bought and sold positions resulted in a zero cash outlay. The hedges reduced our exposure to future declines in zinc prices below $0.85 per pound. We would not, however, have been able to participate in increased zinc prices beyond $1.20 per pound until the zinc price reached $1.81 per pound. The $1.81 per pound call options were bought in order to cap the potential collateral requirements surrounding these hedge arrangements. During the fourth quarter of 2011, with forward zinc prices lower than when the program was implemented, we bought back the $1.20 per pound sold call option positions at a cost of $15.7 million and realized a gain of $13.4 million. The repurchase of these $1.20 per pound call options effectively eliminated both the risk of a potential cash collateral requirement and the limitation to our profitability, in the event that zinc prices increase above the $1.20 per pound during that period. The zinc call options with a $1.81 per pound strike price continue to be held at December 31, 2011 but their value was negligible.
In 2010, we purchased put options for approximately 99,000 tons of zinc for 2011 having a strike price of $0.65 per pound at a cost of $3.0 million. The purchases represented approximately 70% of our expected zinc production in 2011.
In September 2011, we entered into a new power purchase agreement for our electrical power needs at our Monaca, Pennsylvania facility at rates lower than the cost at which we are currently able to produce power on-site, which led to our decision to temporarily idle our Monaca, Pennsylvania power plant in September 2011. We had entered into forward contracts for the purchase of coal for a fixed price through the end of 2011 and any excess coal requirements under this contract were sold to third parties during the third and fourth quarters of 2011.
Pursue New Markets, Applications and Acquisition Opportunities
We intend to continue to leverage our technical expertise, culture of innovation and close customer relationships in order to identify and pursue new markets and applications for our products. For example, we are currently testing new, higher-margin applications for iron-rich material, a co-product of EAF dust recycling, such as its potential uses as a low-cost feed for iron and steel production, its use as a passive water-treatment medium at coal mining sites that have acidic mine drainage and as a daily cover or base material for municipal landfills to reduce ground water contamination. We are also evaluating new markets for our zinc powder, and we expect that our expanded EAF dust recycling capacity will allow us to enter new markets for the sale of CZO to other zinc smelters in the U.S. and internationally. On November 1, 2011, we acquired 100% of Zochem, located in
4
Brampton, Ontario Canada, a producer of zinc oxide in North America. This acquisition broadens our geographic reach, diversifies our customers and markets for zinc oxide and provides added operational flexibility. In addition, we believe INMETCO provides new potential platforms for growth, including increasing capacity of the existing facility, growing our share of the battery recycling market, recycling other industrial wastes to recover metals in addition to nickel and enabling us to expand internationally. We also intend to continue to identify and explore strategic acquisition opportunities, including expanding markets for our current products, as well as developing new products that allow us to leverage our expertise in industrial waste handling and metals recovery processes.
Our History
We, together with the previous owners of our assets, have been operating in the zinc industry for more than 150 years. Horsehead Industries, Inc. (“HII”) was formed as a result of several purchases of assets and entities that substantially form our existing company. In 2002, record-low zinc prices, production inefficiencies, high operational costs and legacy environmental costs associated with prior owners/operators of our facilities caused HII to file for Chapter 11 bankruptcy protection. An affiliate of Sun Capital Partners, Inc. (together with its affiliates, “Sun Capital”) purchased substantially all of the operating assets and assumed certain liabilities of HII in December 2003 pursuant to a sale order under Section 363 of the U.S. Bankruptcy Code. Sun Capital assisted us in hiring our current chief executive officer and chief financial officer in 2004, and since that time we have implemented significant operational improvements as well as experienced significantly improved industry conditions. As a result of certain transactions in 2007, Sun Capital and its affiliates no longer own any of our outstanding common stock.
On November 30, 2006, we completed the private placement of 15,812,500 shares of our common stock at a price of $13.00 per share, and on April 12, 2007, we completed the private placement of 13,973,862 shares of our common stock at a price of $13.50 per share all of which we subsequently registered for resale with the Securities and Exchange Commission (“SEC”). We used the net proceeds of the offerings primarily to repurchase shares and redeem warrants held by our pre-November 2006 stockholders (including Sun Capital). On August 15, 2007, we completed the public offering of 5,597,050 shares of our common stock at a price of $18.00 per share (less discounts and commissions of $1.26) as part of an underwritten public offering. We used a portion of the net proceeds to retire substantially all debt and used the remaining net proceeds of the public offering to fund capital expansion and improvements and for general corporate purposes.
In June 2009, we acquired the EAF dust collection business of ESOI, the largest land-filler in our market. As part of this acquisition, we purchased their EAF dust contracts, one of which was for 10 years with a major Midwestern producer. We did not acquire their landfill or landfill operations.
In September 2009, we completed an underwritten public offering of 8,050,000 shares of common stock at $10.50 per share.
On December 31, 2009, we acquired INMETCO.
On July 27, 2011, we issued $100.0 million in principal amount of 3.80% Convertible Senior Notes due 2017 (the “Convertible Notes”) in a private placement.
On November 1, 2011, we acquired Zochem.
Operations
Our zinc recycling facilities recycle EAF dust into CZO and zinc calcine, which we then use as raw material feedstocks in the production of zinc metal and value-added zinc products. Our nickel facility recycles a broad
5
range of nickel-bearing wastes into a remelt alloy product used in the production of stainless steel. Our recycling and production operations form a complete recycling loop, as illustrated below, from recycled metals to finished zinc or nickel-bearing products. We believe we are the only primary zinc producer in the U.S. that uses recycled materials for substantially all of its zinc feedstocks.
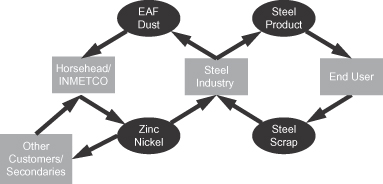
Zochem, which we acquired on November 1, 2011, uses zinc metal to produce zinc oxide.
Zinc Products and Services
Operations
Horsehead operates four hazardous waste recycling facilities for the recovery of zinc from EAF dust. Our recycling process has been designated by the EPA as a “Best Demonstrated Available Technology” for the processing of EAF dust. Our recycling facilities are strategically located near sources of EAF dust production. These facilities recover zinc from EAF dust generated primarily by carbon steel mini-mill manufacturers during the melting of steel scrap, as well as from other waste material. We extract zinc from EAF dust, and recycle the other components of EAF dust into non-hazardous materials, using our proprietary “Waelz Kiln” process at our Palmerton, Pennsylvania, Barnwell, South Carolina, Rockwood, Tennessee, and Calumet, Illinois facilities.
Our Waelz Kiln recycling process blends, conditions, adds carbon to and pelletizes EAF dust, and then feeds it into the kiln itself, a refractory-lined tube that is approximately 160 feet in length and 12 feet in diameter. During the passage through the kiln, the material is heated under reducing conditions at temperatures exceeding 1,100 degrees Celsius, thereby volatilizing the nonferrous metals, including zinc. The resulting volatized gas stream is oxidized and collected as CZO, which has a zinc content of between 55% and 65%. In addition, we produce iron-rich material that we sell for use as an aggregate in asphalt and as an iron source in cement.
The majority of the CZO generated is shipped to our Palmerton, Pennsylvania facility, where it is further refined in a process, called “calcining,” whereby we heat the material to drive off impurities. Through this rotary kiln process, which is fired with natural gas, the zinc content is further increased to approximately 65% to 70%, and the product is collected as zinc calcine in granular form for shipment to our Monaca, Pennsylvania facility or for sale to other zinc refineries around the world. The metal concentrate product from the calcining process is shipped to a third-party processor for final metals recovery. We have added a washing facility to remove chlorine at our smelting facility to allow us to ship an increasing amount of CZO directly as a feed to our Monaca, Pennsylvania facility.
In order to expand our EAF dust recycling capacity, we brought an 80,000 tons per year kiln online at our Rockwood, Tennessee facility in January 2008 at a cost of approximately $33 million. This kiln provides approximately 14,500 tons of zinc that we either use directly in our own smelting process or sell as feed to other zinc smelters. In 2010, we brought a new 180,000 tons per year kiln facility online in Barnwell, South Carolina for a total investment of approximately $65 million.
Production
Our approximately 150,000 ton-per-year capacity electrothermic zinc smelter and refinery in Monaca, Pennsylvania produces zinc metal and value-added zinc products (e.g., zinc oxide) using a wide range of feedstocks, including zinc generated by our recycling operations, zinc secondary material from galvanizers and
6
other users of zinc. This uniquely flexible electrothermic smelter and refinery in Monaca, Pennsylvania provides a substantial competitive advantage both in raw material costs (where we are able to use a wide range of zinc-bearing feedstocks) and in finished products (where, together with our refining operations, we can produce a wide range of zinc metal and value-added zinc products). As a result of reduced demand for our zinc products resulting from the economic downturn that began in the third quarter of 2008 and extended through 2009, we operated our smelting and refinery facility at less than capacity in 2009, producing 106,000 tons of zinc. Our smelting facility, due to the refinery incident that occurred in July 2010, operated at less than full capacity during the latter part of 2010 but returned to full capacity by the end of the year. We produced 124,000 tons of zinc in 2010. We operated at full capacity, with the exception of intermittent production difficulties, during 2011 and produced 137,000 tons of zinc in 2011.
Our Monaca, Pennsylvania smelter is the only smelter in North America that is able to use this wide range of feedstocks, including 100% recycled feedstocks, to produce our zinc products. Our unique ability to vary our feedstock blend lowers our overall raw materials costs without corresponding reductions in product quality, as compared to other zinc smelters and refiners, which generally can accept only a narrow slate of specific mined zinc concentrates and only small amounts of recycled materials. We also own, and until September 2011 operated, a 110 megawatt coal-fired power plant that provided us with a captive source of electricity. In September 2011, as a result of a power purchase agreement that we entered into, we temporarily idled this power plant. We entered into this agreement because we were able to secure a rate for power which was lower than our anticipated generating costs over the same period of time. Furthermore, the agreement allows us to defer or potentially avoid needed capital investment in the power plant until such time that the future of the Monaca, Pennsylvania site and the full impact of recently promulgated and proposed environmental compliance regulations on coal-fired power plants are more clearly defined.
The Monaca, Pennsylvania facility operates on a 24-hours-per-day, 365-days-per-year basis to maximize efficiency and output. EAF-sourced calcine and other purchased secondary zinc materials are processed through a sintering operation. The sintering process converts this combined zinc feedstock into a uniform, hard, porous material suitable for the electrothermic furnaces. Monaca’s seven electrothermic furnaces are the key to Monaca’s production flexibility. Sintered feedstock and metallic zinc secondary materials are mixed with metallurgical coke and fed directly into the top of the furnaces. Metallic zinc vapor is drawn from the furnaces into a vacuum condenser, which is then tapped to produce molten zinc metal. This metal is then either cast as slab zinc metal, or conveyed directly to the zinc refinery in liquid form. This integrated facility reduces costs by eliminating the need to cast and then remelt the zinc to refinery feed.
At the Monaca, Pennsylvania refinery, the molten zinc is fed directly through distillation columns to produce an ultra-high-purity zinc vapor that is condensed into “thermally refined” special special high grade (“SSHG”) zinc metal or processed through a combustion chamber into zinc oxide. The condensed metal is either sold or sent for further conversion into zinc powder. Damage caused by an incident at the refinery in late July 2010 halted production. Production was resumed at a reduced rate in November 2010, and we were able to meet market demand by the end of that year.
We believe that our thermally produced SSHG zinc metal is among the purest and highest quality SSHG zinc metal sold in North America. Our zinc oxide is processed and separately refined through our highly automated, zinc oxide screening, coating and packing facility which is the largest in North America, to create one of our 50 grades of zinc oxide with ISO:9002 certification.
Our Product Development Lab, located at our Monaca, Pennsylvania site, is designed for production of specially engineered zinc oxide products for unique “high tech” applications. One such product is an extremely fine particle size (micronized) zinc oxide that may be used in cosmetic and pharmaceutical applications.
7
The chart below describes the flow of our operations, beginning with the input of raw materials, continuing through the production processes and identifying finished products and end uses for each such raw material.

Our Zochem facility, which we acquired on November 1, 2011, is located in Brampton, Ontario, Canada and produces zinc oxide. The facility has production capabilities of approximately 49,000 tons of zinc oxide per year from six muffle type furnaces. The production process uses SHG zinc metal jumbo blocks as raw materials which are added to the melting section of the furnaces. The melted zinc is then boiled and the zinc vapor is combusted as it enters an oxidation chamber. The zinc oxide is then collected and packaged for shipment.
Products and Services
We offer a wide variety of zinc products and services. In 2011, we sold approximately 152,000 tons of zinc products. The following are our primary zinc products.
Zinc Metal
Our primary zinc metal product is PW zinc metal, which we sell to the hot-dip galvanizing and brass industries. We also produce SSHG zinc metal, which is used as feed for the manufacture of high-purity zinc powder and zinc alloys. SSHG zinc metal is an ultra pure grade of zinc exceeding the American Society for Testing and Materials standard for special high-grade zinc. Our zinc metal is recognized within the galvanizing industry for its consistent quality and appearance. We believe we are the leading supplier of zinc metal to the after-fabrication hot-dip segment of the North American galvanizing industry, which uses our zinc metal to provide a protective coating to a myriad of fabricated products, from pipe and guard rails to heat exchangers and telecommunications towers. We also sell PW zinc metal for use in the production of brass, a zinc/copper alloy. We believe that our operational standards and proximity to customers allow us to deliver higher quality metal than many of our competitors. To accommodate various customer handling needs, our zinc metal is sold in numerous forms, from 55-pound slabs to 2,500-pound ingots. The new zinc facility will produce SHG zinc. It will also allow for SHG zinc to be alloyed with other metals. This will allow us to expand into new markets, including selling to continuous galvanizers operated by the steel mills, which include some of our EAF dust customers, die casters and LME warehouses, while continuing to serve customers in our existing markets.
Zinc Oxide
We sell over 50 different grades of zinc oxide with differing particle sizes, shapes, coatings and purity levels. Zinc oxide is an important ingredient in the production of tire and rubber products, chemicals, ceramics, plastics, paints, lubricating oils and pharmaceuticals. Various end uses for zinc oxide include the following.
| | Ÿ | | Tire and rubber applications. Zinc oxide aids in the vulcanization process, acts as a strengthening and reinforcing agent, provides UV protection, and enhances thermal and electrical properties. There is approximately a half pound of zinc oxide in a typical automobile tire. |
8
| | Ÿ | | Chemical applications. In motor oil, zinc oxide is used to reduce oxidation, inhibit corrosion and extend the wear of automotive engines. In plastics, zinc oxide is an effective UV stabilizer for polypropylene and polyethylene. |
| | Ÿ | | Ceramics. Ceramics containing zinc oxide are used in electronic components. For example, in ceramic varistors (surge protectors), zinc oxide allows for high temperature stability, resistance to electrical load, current shock and humidity. |
| | Ÿ | | Other applications. In paints, zinc oxide provides mold and mildew protection, functions as a white pigment and provides UV protection and chalking resistance. In pharmaceutical applications, zinc oxide operates as a sunscreen, a vitamin supplement and a medicinal ointment. |
As a result of the acquisition of Zochem on November 1, 2011, we will be able to broaden our geographic reach, diversify our customer base and markets for zinc oxide and provide added operational flexibility.
EAF Dust Recycling
We created the market for EAF dust recycling for carbon steel mini-mill producers with the development of our recycling technology in the early 1980s, which has since been designated by the EPA as the “Best Demonstrated Available Technology” for processing of EAF dust, a hazardous waste generated by steel mini-mills. To date, we have recycled over 9.0 million tons of EAF dust (equivalent to 1.8 million tons of zinc), representing the dust generated in the production of over 530 million tons of steel. We believe the recycling and conversion of EAF dust reduces the steel mini-mill’s exposure to environmental liabilities which may arise when the EAF dust is sent to a landfill.
In 2011, we recycled 555,000 tons of EAF dust compared to 549,000 tons in 2010. The installation of a new Waelz Kiln in Rockwood in early January 2008 increased our recycling capacity by 80,000 net tons, or 15%. We commenced operations at our new kiln facility in South Carolina in 2010, adding an additional 180,000 tons, or 31%, of EAF dust processing capacity.
In June 2009, we acquired the EAF dust collection business of ESOI, the largest land-filler in our market. As part of this acquisition we purchased ESOI’s EAF dust contracts, one of which was a ten year contract with a major Midwestern producer.
We expect that the new zinc facility will enable us to convert Waelz oxide derived from EAF dust and other recycled materials into SHG zinc and other grades that sell at a premium to the PW grade that we currently offer. We believe the new zinc facility will allow us also to recover value from metals such as silver and lead, as well as copper contained in EAF dust.
CZO (Waelz Oxide) and Calcine Sales
In response to the strong demand for zinc-bearing feed materials and attractive pricing, we began selling CZO generated in our Waelz Kilns to other zinc smelters in 2007. We plan to continue selling CZO from time to time based on market conditions.
Zinc Powder and Copper-Based Powders
Our zinc powder is sold for use in a variety of chemical, metallurgical and battery applications as well as for use in corrosion-resistant coating applications. Zinc powder is manufactured by the atomization of molten zinc.
We manufacture the following three basic lines of powders at our Palmerton facility.
| | Ÿ | | Special Zinc Powders. These are used in general chemical and metallurgical applications, and in friction applications, such as brake linings for automobiles. |
| | Ÿ | | Battery Grade Zinc Powders. These are used in most types of alkaline batteries, as well as mercuric oxide, silver oxide and zinc-air batteries. |
| | Ÿ | | Copper-Based Powders. These include brass, bronze and nickel-silver powders. These products are used in a variety of applications, including brazing and infiltrating and for powdered metallurgical hardware, such as lock bodies, valves and gears. |
9
Sales and Marketing
Zinc Products and Services sales and marketing staff consists of :
| | Ÿ | | a sales and marketing group comprised of sales professionals whose goal is to develop and maintain excellent customer relationships and provide key market analysis; |
| | Ÿ | | a customer service department responsible for processing zinc orders, scheduling product shipments and answering customer inquiries; and |
| | Ÿ | | a technical service staff highly trained to assist zinc customers with specification development, new applications, process improvements and on-site troubleshooting assistance when needed. |
Our process engineering group provides additional technical help to our EAF clients with monthly EAF analytical information and assistance with any problems encountered on EAF dust chemistry, transportation and environmental matters. Our quality assurance department provides extensive laboratory services critical to maintaining in-plant process control and providing customer support by certifying compliance to hundreds of unique product specifications. We are ISO 9002 certified. Our laboratory also offers sales and technical services support by assisting in new product developments and troubleshooting various application and processing issues both in-plant and with specific customers. We also rely on a network of distributors with warehouses throughout North America that assist us with supporting smaller customers.
Customers
Most of the zinc metal we produce is purchased by galvanizers and brass producers. We believe we are the leading supplier of zinc metal to the after-fabrication hot-dip segment of the North American galvanizing industry. We sell zinc metal to a broad group of approximately 100 hot-dip galvanizers. In many cases, these customers are also suppliers of secondary materials, including zinc remnants of steel galvanizing processes, to us.
We sell zinc oxide to over 200 different customers under contract as well as on a spot basis, principally to manufacturers of tire and rubber products, lubricating oils, chemicals, paints, ceramics, plastics and pharmaceuticals.
Our SSHG zinc metal product is used in the manufacturing of zinc powder for the alkaline battery industry.
We typically enter into multi-year service contracts with steel mini-mills to recycle their EAF dust. We provide our EAF dust recycling services to over 45 steel producing facilities.
Raw Material
In 2011, approximately 74% of the raw material used in our Monaca, Pennsylvania facility was sourced through our EAF dust recycling operations. The remaining 26% of the raw material was comprised of zinc secondaries, which are principally zinc-containing remnants of steel galvanizing processes, including top drosses, bottom drosses and skimmings that we purchase primarily from several of our metal customers. The prices of zinc secondaries vary according to the amount of recoverable zinc contained, and provide us with a diverse portfolio of low cost inputs from which to choose. In addition to the dross and skims from the galvanizing industry, we purchase other types of zinc-bearing residues from the zinc, brass and alloying industries. Many of these materials are acquired from our own customers. We also buy CZO from one of the other U.S. based EAF dust recyclers. In addition, we also have long standing relationships with zinc brokers in North America, Europe and South America. These brokers in some cases act as an agent for us and are favorably located to supply us with reliable and cost effective zinc feedstock.
Raw materials used in our Zochem facility consist entirely of SHG zinc metal purchased from one supplier. The price of these metal blocks is based on the LME zinc price.
Power Plant and Fuels
During 2010 and 2009, we relied on a combination of purchased and internally-generated electricity for our operations. We generated substantially all of our electricity requirements for our Monaca, Pennsylvania facility at our on-site power plant, using Powder River Basin (“PRB”) coal as our principal input. Sales of excess power
10
capacity from this power plant historically provided a reliable source of revenue. As a result of a power purchase agreement that we entered into, we temporarily idled the Monaca, Pennsylvania power plant in September 2011. In addition to the electricity used by our Monaca, Pennsylvania facility, we use a combination of coke and natural gas in our smelting and refining processes. Our recycling facilities use a combination of coke, electricity and natural gas. In 2011, we purchased the majority of our energy under supply contracts, although we also engage in spot purchases. We purchased all of our coal requirements pursuant to a supply agreement that carried fixed prices through 2011. Due to the temporary idling of the power plant in September 2011, we sold the remaining coal requirements under this contract to third parties during the third and fourth quarters of 2011
Intellectual Property
We possess proprietary technical expertise and know-how related to EAF dust recycling and zinc production, particularly zinc production using recycled feedstocks. Our proprietary know-how includes production methods for zinc oxide and micro-fine zinc oxides and widely varying customer specifications. As a major supplier of zinc metal and other zinc-based products to industrial and commercial markets, we emphasize developing intellectual property and protecting our rights in our processes. However, the scope of protection afforded by intellectual property rights, including ours, is often uncertain and involves complex legal and factual issues. Also, there can be no assurance that intellectual property rights will not be infringed or designed around by others. In addition, we may not elect to pursue an infringer due to the high costs and uncertainties associated with litigation. Further, there can be no assurance that courts will ultimately hold issued intellectual property rights to be valid and enforceable.
Competition
We believe that we are a unique business, having no direct competitor that recycles similar secondary materials into zinc products in North America. Our primary competitor in the zinc oxide segment is U.S. Zinc Corporation (“US Zinc”), a wholly-owned subsidiary of Votorantim Metals, Ltda. On November 1, 2011, we acquired Zochem, a wholly owned subsidiary of Hudson Bay Mining and Smelting Co. Limited which was previously one of our competitors in the zinc oxide business. US Zinc, located in the middle-southern states of the United States, is also a zinc recycler and our primary competitor but lacks our integrated processing and smelting capabilities.
Approximately 74% of the zinc metal consumed in the United States is imported. Therefore, we enjoy a domestic freight and reliability advantage over foreign competitors with respect to U.S. customers. Xstrata Plc, which acquired Falconbridge in 2006, Teck Cominco Limited and Penoles are the primary zinc metal producers in the North American market. The vast majority of the metal produced by these companies is used by continuous galvanizers in the coating of steel sheet products. In addition, these producers have mining and smelting operations while we engage only in smelting. In contrast, we currently produce PW zinc metal primarily for use by hot-dip galvanizers.
We compete for EAF dust management contracts primarily with the two other domestic recyclers of EAF dust and to a lesser extent with landfill operators. The domestic recyclers are Steel Dust Recycling and an EAF dust processing facility built by The Heritage Group. Steel Dust Recycling commenced operations during the second quarter of 2008 and was subsequently acquired in October 2009 by Zinc Nacional, a Mexico-based recycler. The Heritage Group built an EAF dust processing facility in Arkansas and began operations in 2009. We expect to see new entrants once again explore opportunities in this area when zinc prices are at or near historical high levels. Our proven reliability, expanded processing capacity and customer service have helped us maintain long-standing customer relationships. Many of our EAF dust customers have been under contract with us since our predecessor began recycling EAF dust in the 1980s. In June of 2009, we acquired the EAF dust collection contracts of ESOI.
ZincOx Resources plc acquired Big River Zinc Corporation with the stated intention of producing zinc metal from recycled EAF dust sourced from the United States (Envirosafe) and Turkey, with initial estimated smelting output from EAF dust of 90,000 tons. They announced the groundbreaking for their recycling plant in Ohio in June 2008; however, construction activity was placed on hold pending the development of other projects.
11
Nickel Products and Services
Recycling Operations for Nickel-Bearing Waste
Our INMETCO facility located in Ellwood City, Pennsylvania, operates a high temperature metals recovery facility, which utilizes a combination rotary hearth furnace and electric arc smelting furnace to recover nickel, chromium and iron, along with smaller amounts of other metals, from a variety of metal-bearing waste materials, generated primarily by the specialty steel industry. INMETCO’s main product is a nickel-chromium-iron (“Ni-Cr-Fe”) remelt alloy ingot that is used as a feedstock to produce stainless and specialty steels. INMETCO also recycles nickel-cadmium (“Ni-Cd”) batteries, producing a cadmium metal product that is reused in the production of Ni-Cd batteries.
The INMETCO process for treating Ni-Cr-Fe metals waste is comprised of feed preparation, blending and pelletizing, thermal reduction and smelting and casting.
The first portion of the INMETCO process consists of material preparation, storage, blending, feeding and pelletizing. INMETCO receives the various wastes and pretreats them when necessary to ensure a uniform size of the raw material. These materials, as well as flue dust and carbon, are pelletized. Pellets are transferred to the Rotary Hearth Furnace (“RHF”) for the reduction of some oxidized metal to its metallic form. Reduced pellets are fed to the EAF for production of Ni-Cr-Fe remelt alloy. Slag discharged from the EAF is processed and sold primarily as road aggregate.
Cadmium Recovery
The cadmium recovery process was added to the INMETCO facility in 1995, with production commencing in 1996. This process is operated under a licensing agreement with Saft AB. This process involves the separation of the metal components of Ni-Cd batteries. The cadmium recovery process involves a basic thermal operation where cadmium or cadmium oxide is processed into high purity cadmium metal. The cadmium metal is sold primarily back into the Ni-Cd battery industry.
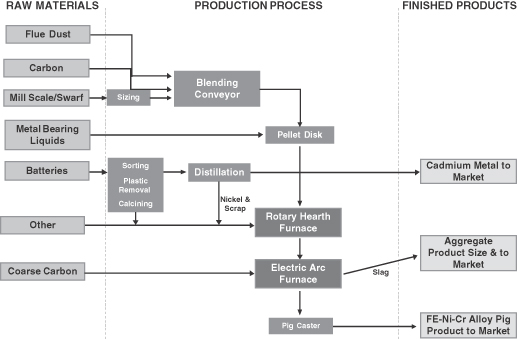
The chart below describes the INMETCO flow of operations, beginning with the input of raw materials, continuing through the production processes and indentifying finished products.
12
Products and Services
INMETCO provides recycling services to its customers under two types of fee arrangements: toll processing arrangements and environmental services arrangements.
Tolling Services
Under the tolling arrangement, INMETCO charges a processing fee per ton of waste received and returns a remelt alloy product based on the waste’s metal content and INMETCO’s historical metal recovery factors for similar waste products. INMETCO serves almost all of the major austenitic stainless steel manufacturers in the United States in its tolling segment. We believe INMETCO is the only recycler of stainless steel wastes in North America and that INMETCO’s customers rely on its services to promote sustainable business practices, to avoid potential environmental liabilities associated with disposing of hazardous wastes at landfills and to take advantage of the return of valuable metals from their metal-bearing waste products. Most of INMETCO’s tolling customers have signed long-term, exclusive contracts, under which INMETCO processes their metal-bearing wastes. INMETCO receives four main nickel-containing waste materials from the specialty steel industry, which support the “tolling” segment of the business. These materials are flue dust, mill scale, grinding swarf and pickling filter cakes from spent pickling solution and are received either in a dry form or a wet form containing oil and/or water. Furnace baghouse dust or flue dust is generated during the melting and refining steps in the manufacture of stainless steel.
Environmental Services
Under the environmental service fee arrangement, INMETCO acquires waste materials and processes those materials with no obligation to return any product to the customer. Depending on the state of the metals markets, INMETCO either charges a fee or pays to acquire environmental services materials. These materials include batteries and specialty steel industry wastes. Batteries include Ni-Cd, nickel-metal hydride, sodium-nickel-chloride and various other nickel-based batteries. INMETCO also processes limited quantities of household alkaline, zinc-carbon and lithium batteries. Additionally, lithium-ion and lead-acid batteries are sent to third-party recyclers for processing. Specialty steel industry wastes include flue dust, mill scale, grinding swarf and pickling filter cake along with a wide variety of other nickel-bearing wastes. Revenues are derived from these materials through the sale of remelt alloy product and cadmium product, as well as scrap sales and brokerage activities.
Remelt Alloy
INMETCO sells its remelt alloy product, produced from waste accepted as an environmental service, back to the stainless steel industry. Because the sale of remelt alloy product is based on metals market prices, INMETCO’s revenues and profits fluctuate with prevailing metal prices.
In addition to the production of the remelt alloy in 30-pound ingot size, INMETCO also produces a larger 1000-pound ingot on request.
Cadmium
INMETCO produces its cadmium metal in the form of shot or ingots to a specification of at least 99.95% purity. INMETCO also produces a portion of its product to a 99.99% grade. These products are sold on a global basis under the “CADMET” trademark.
Sales and Marketing
INMETCO’s marketing team consists of a sales manager and two inside sales assistants. The marketing team provides in-house INMETCO seminars in which current applicable regulations regarding storage and treatment of wastes, manifesting and transporting wastes and the recycling process are discussed. These seminars conclude with a tour of the INMETCO facility. INMETCO has also been active in exhibiting or presenting papers at outside seminars and trade shows to promote the capabilities of the business segment. The marketing team supplements these activities with advertisements in applicable industry publications, as well as on the Internet.
13
Customers
While INMETCO has over 200 customers in total, approximately 86% of its sales are made to its top three customers. INMETCO has had a long-term relationship with each of its major customers. Two of INMETCO’s top three customers have been customers since INMETCO commenced operations in the late 1970’s and one has been a customer since that customer’s startup in the early 2000’s.
Intellectual Property
The INMETCO process enables the business to treat and reclaim Ni-Cr-Fe bearing hazardous and non-hazardous materials in a low cost, environmentally safe manner. The INMETCO process is recognized by the EPA as the “Best Demonstrated Available Technology” for the treatment of steelmaking dust (i.e., low zinc KO61, KO62 and F006 designated hazardous waste). The INMETCO process has also been recognized by the EPA as the Best Demonstrated Available Technology for the treatment of cadmium-containing batteries.
Competition
We believe that our recycling facilities provide an environmentally favorable alternative for disposing of hazardous waste. Since 1978, INMETCO has provided a recycling alternative for a wide variety of hazardous waste products produced by the specialty steel industry, including steelmaking dust, mill scale and grinding swarf. Stainless steel producers are faced with the same dust disposal problems as carbon steel producers. However, the process requirements and economics of stainless steelmaking dust processing are different, since the cost of treating the dust may be substantially offset by the recovery of valuable metals such as nickel, chromium and iron, which are recycled and returned to the specialty steel industry under toll arrangements.
In the metal processing industry, the most commonly used techniques for managing and disposing of hazardous waste are land disposal facilities and recycling facilities such as INMETCO’s. We believe the INMETCO process offers three key advantages over landfill: (1) it is a preferred solution from an environmental and product stewardship perspective, (2) it offers potential cost advantages through the return of valuable metals and (3) it avoids exposure to long-term contingent liabilities associated with sending waste to landfill facilities. Accordingly, we expect the INMETCO process to continue to remain the alternative of choice for the specialty steel industry. We believe INMETCO is the largest recycler of nickel-bearing hazardous waste in North America.
Governmental Regulation and Environmental Issues
Our facilities and operations are subject to various federal, state and local governmental laws and regulations with respect to the protection of the environment, including regulations relating to air and water quality and solid and hazardous waste management and disposal. These laws include the Comprehensive Environmental Response, Compensation and Liability Act (“CERCLA” or “Superfund”), the Resource Conservation and Recovery Act (“RCRA”), the Clean Air Act (“CAA”), the Clean Water Act, and their state equivalents. We are also subject to various other laws and regulations, including those administered by the Department of Labor, the Federal Energy Regulatory Commission (“FERC”), the Surface Transportation Board, the Occupational Health and Safety Administration, the Department of Transportation and the Federal Railroad Administration, as well as certain of their state equivalents. We believe that we are in material compliance with applicable laws and regulations, including environmental laws and regulations governing our ongoing operations, and that we have obtained or applied in a timely manner for all material permits and approvals necessary for the operation of our business.
Our process modifications have resulted in operations fully utilizing recycled feedstocks. The use of recycled zinc feedstocks preserves natural resources, precluding the need for mining and land reclamation and thereby operating in a manner consistent with the principles of sustainable development. Our recycling services avoid the potential environmental impacts that are associated with landfilling hazardous wastes. EAF dust itself is a listed hazardous waste created from the melting of steel scrap in electric arc furnaces by the steel mini-mill industry. Our recycling process has been designated by the EPA as “Best Demonstrated Available Technology” for the recycling of EAF dust.
14
We maintain irrevocable letters of credit and a surety bond to address financial assurance requirements for potential future remediation costs and RCRA permit termination for several facilities. Financial assurance is required under RCRA permit requirements for the Ellwood City, Pennsylvania and Palmerton, Pennsylvania facilities. Financial assurance, through an irrevocable letter of credit, is also required for eventual closure of our residual landfill at the Monaca, Pennsylvania facility.
In Bartlesville, Oklahoma, we and our predecessor formerly operated a primary zinc processing facility which was closed in the 1990’s and subsequently dismantled. Environmental remediation work at this facility was completed in 2003 in connection with closing these former facilities under a consent agreement with the Oklahoma Department of Environmental Quality. We currently manage this facility including groundwater monitoring and other maintenance activities under a RCRA post-closure permit. We, along with two other responsible parties, provide financial assurance for future post closure care activities at the Bartlesville facility. A reserve on our balance sheet in the amount of $0.7 million has been established for our share of future costs associated with this matter.
Our Palmerton, Pennsylvania property is part of a CERCLA, or “Superfund,” site that was added to the National Priorities List in 1983. When the Palmerton, Pennsylvania facility’s assets were purchased out of bankruptcy in December 2003, we acquired only those assets, including real property, needed to support the ongoing recycling and metal powders businesses at that location. We currently hold 107 acres within an area of the approximately 1,600 acres owned by HII. With limited exceptions, the successor in interest to previous owners has contractually assumed responsibility for historic site contamination and associated remediation and has indemnified us against any liabilities related to the property, including Natural Resource Damages. Exceptions to this indemnity include our obligations under the 1995 consent decree described below and non-Superfund RCRA obligations and environmental liabilities resulting from our ongoing operations.
We assumed certain of HII’s environmental liabilities related to our Palmerton, Pennsylvania operations pursuant to a 1995 Consent Decree between HII, the EPA and the Pennsylvania Department of Environmental Protection (“PADEP”). Our obligations pursuant to this consent decree include construction of a storage building for calcine kiln feed materials and the removal of historic accumulations of lead concentrate from three buildings. Removal of historic accumulations of lead concentrate was completed in 2008. We believed our obligations under the consent decree were currently being managed in accordance with the requirements of the regulatory agencies and were reserved for on our balance sheet in the amount of $1.5 million. During 2011, the PADEP concurred with our assessment that construction of the storage building for calcine feed was not necessary in light of the material management practices employed at the Palmerton, Pennsylvania facility which comply with applicable environmental regulations and the hazardous waste permit for the facility. The reserve for $1.5 million formerly established on our balance sheet was removed during 2011.
During 2009, our Ellwood City facility completed installation of a new baghouse complex to control air emissions from its RHF, which were previously controlled by a wet scrubber system. The RHF baghouse complex was installed in accordance with a Consent Order & Agreement (“CO&A”) entered into with PADEP prior to our acquisition of INMETCO. Compliance certification testing of the RHF baghouse installation was conducted and submitted to the State in the later part of 2009. The CO&A was extinguished in 2011 upon final approval of compliance certification testing by the PADEP.
15
Employees
As of December 31, 2011, we employed 1,064 persons at the following locations.
| | | | | | | | | | | | |
Location | | Salaried
Personnel | | | Hourly
Personnel | | | Union
Contract
Expiration | |
Monaca, Pennsylvania | | | 118 | | | | 470 | | | | 4/30/14 | * |
Pittsburgh, Pennsylvania | | | 19 | | | | 0 | | | | N/A | |
Bartlesville, Oklahoma | | | 1 | | | | 0 | | | | N/A | |
Beaumont, Texas | | | 2 | | | | 0 | | | | N/A | |
Calumet, Illinois | | | 13 | | | | 48 | | | | 08/03/14 | |
Palmerton, Pennsylvania | | | 25 | | | | 110 | | | | 04/27/15 | |
Palmerton (Chestnut Ridge Railroad), Pennsylvania | | | 0 | | | | 3 | | | | 12/15/11 | ** |
Rockwood, Tennessee | | | 10 | | | | 48 | | | | 07/01/15 | |
Barnwell, South Carolina | | | 9 | | | | 43 | | | | N/A | |
Ellwood City, Pennsylvania | | | 32 | | | | 72 | | | | 10/31/13 | |
Brampton, Ontario Canada | | | 19 | | | | 22 | | | | 6/30/12 | |
| | | | | | | | | | | | |
Total | | | 248 | | | | 816 | | | | | |
| | | | | | | | | | | | |
| * | The Monaca Power Plant, which is temporarily idled , has 2 active bargaining unit employees working under a labor agreement that expires on 9-14-14. |
| ** | The Chestnut Ridge Railroad labor contract negotiations were postponed until 2012 by mutual consent of the bargaining unit and the Company. |
The vast majority of our hourly personnel are unionized. Hourly workers receive medical, dental and prescription drug benefits. We do not have defined benefit plans for hourly or salaried employees, except at our Brampton, Ontario Canada site, which was acquired on November 1, 2011. These defined benefit plans include 36 active employees. We have a 401(k) plan for both our hourly and salaried employees at all sites, excluding the Brampton, Ontario Canada facility. We have no company-paid medical plan for retirees. Our labor contracts provide for a company contribution and in most cases a company match, which varies from contract to contract. We believe we have satisfactory relations with our employees.
Executive Officers and Key Employees of the Registrant
Set forth below is information concerning our executive officers and key employees.
| | | | |
Name | | Age | | Position |
James M. Hensler | | 56 | | Chairman of the Board of Directors, Class I Director, President and Chief Executive Officer |
Robert D. Scherich | | 51 | | Vice President and Chief Financial Officer |
Gary Whitaker | | 56 | | Vice President — General Counsel and Secretary |
Lee Burkett | | 55 | | Vice President — Manufacturing |
James A. Totera | | 55 | | Vice President — Sales and Marketing |
Timothy R. Basilone | | 52 | | Vice President — Environmental Affairs |
Ali Alavi | | 50 | | Senior Vice President — Corporate Affairs |
Bruce Morgan | | 40 | | Vice President — Human Resources |
Mark Tomaszewski | | 55 | | President - INMETCO |
Joshua Belczyk | | 34 | | General Manager — Zochem |
James M. Hensler, Chairman of the Board of Directors, President and Chief Executive Officer, joined us in April 2004. He has over 30 years of experience working in the metals industry. From 2003 to April 2004, Mr. Hensler was a consultant to various companies in the metals industry. From 1999 to 2003, Mr. Hensler was
16
Vice President of Global Operations and Vice President and General Manager of the Huntington Alloys Business Unit for Special Metals Corp., a leading international manufacturer of high performance nickel and cobalt alloys. Prior to that, Mr. Hensler was the Executive Vice President for Austeel Lemont Co., General Manager of Washington Steel Co. and Director of Business Planning for Allegheny Teledyne Inc. He received a BS in Chemical Engineering from the University of Notre Dame in 1977, an MSE in Chemical Engineering from Princeton University in 1978 and an MBA from the Katz Graduate School of Business at the University of Pittsburgh in 1987.
Robert D. Scherich, Vice President and Chief Financial Officer, joined us in July 2004. From 1996 to 2004, Mr. Scherich was the Chief Financial Officer of Valley National Gases, Inc. Prior to that, he was the Controller and General Manager at Wheeling-Pittsburgh Steel Corp. and an accountant at Ernst & Whinney. Mr. Scherich received a BS in Business Administration from The Pennsylvania State University in 1982.
Gary Whitaker, Vice President — General Counsel and Secretary, joined us in December 2011. Mr. Whitaker previously was in private practice in Atlanta, Georgia from 2009 to 2011. He served as Vice President, General Counsel and Secretary for GrafTech International Ltd., a manufacturer of graphite products, including graphite electrodes used in electric arc furnaces, from 2006 to 2008, and as Vice President, General Counsel and Secretary for the US operations of the SK Group, one of South Korea’s largest conglomerates, from 1998 to 2006. Mr. Whitaker also worked as a corporate attorney for Eastman Chemical Company and for the DuPont Company, and was a senior associate for Powell, Goldstein, Frazer and Murphy, in Atlanta, Georgia. Mr. Whitaker received a B.A. in History from U.C.L.A. in 1976 and a JD from the University of Houston Law School in 1980.
Lee Burkett, Vice President — Manufacturing, joined us in November 2006 with over 27 years of industry experience. During the three years prior to joining us, Mr. Burkett was General Manager of the Bridgeville Facility of Universal Stainless. Previous positions included General Manager — Finishing Operations of J&L Specialty Steel, Plant Manager of Timet’s Toronto, Ohio facility, Vice President Operations for Caparo Steel and 14 years with Washington Steel with responsibilities in all aspects of the operation including Plant Manager of Finishing. Mr. Burkett received a BS in Mechanical Engineering from The Pennsylvania State University in 1979.
James A. Totera,Vice President — Sales and Marketing, joined us in 1997. Prior to that, he was the Vice President of Sales for Steel Mill Products, where he worked in, among other things EAF dust recycling and also spent over 15 years working in sales positions, including as General Manager of Sales at Insul Company. Mr. Totera received a BA in Economics, Administrative Management Science and Psychology from Carnegie Mellon University in 1979.
Timothy R. Basilone, Vice President — Environmental Affairs, joined us in January 2010. Mr. Basilone has over 20 years of experience working in all aspects of environmental affairs in a variety of industries. Prior to joining us, he spent ten years with Koppers Inc., including seven years as a Senior Manager in the Corporate Environmental Affairs Department and three years as Operations Superintendent at the Koppers coal tar distillation facility in Clairton, Pennsylvania. Prior to that Mr. Basilone spent nine years at Westinghouse Electric Corporation as the Environmental Remediation Program Manager in the Corporate Legal and Environmental Affairs Department. He began his professional career as an Exploration / Production Geologist with Marathon Oil Company before moving on to Westinghouse. Mr. Basilone earned an MS degree in Earth and Planetary Science from the University of Pittsburgh in 1984 and a BA degree in Geology from the College of Wooster in 1981.
Ali Alavi,Senior Vice President — Corporate Affairs joined us in 1996. Mr. Alavi previously served as our Vice President — Corporate Administration, General Counsel and Secretary, Director & Counsel of Environment, Health & Safety and Director of Environmental Performance. Prior to joining us, Mr. Alavi worked as Assistant General Counsel of Clean Sites, Inc., Senior Regulatory Analyst of the American Petroleum Institute and Project Manager/Engineer for the U.S. Army Toxic & Hazardous Materials Agency. Mr. Alavi received a BA in Geography/Environmental Studies from the University of Pittsburgh in 1983, an MS in Petroleum Engineering from the University of Pittsburgh School of Engineering in 1985 and a JD from the University of Maryland Law School in 1993.
Bruce Morgan,Vice President — Human Resources joined us in May 2010. Prior to joining us, from November 2006 to May 2010, Mr. Morgan served as Director of Human Resources — North America for the
17
Steel Mill Services division of Harsco Corporation. Prior to that, Mr. Morgan served as Director of Human Resources for both the Steel and Foundry Divisions of Vesuvius USA, a global refractory manufacturer, where he was employed from March 1997 to November 2006. Among other previous employment, Mr. Morgan served as an HR Associate for the construction and start-up of Gallatin Steel Company, where he was employed from June 1994 to August 1995. Mr. Morgan received a BS degree in Industrial and Labor Relations from Cornell University in 1994.
Mark Tomaszewski, President — INMETCO, joined us on December 31, 2009 when we acquired INMETCO, where he had served for over 30 years in positions ranging from General Manager — Finance and Administration to his current position of President of INMETCO, which position he has held since August 2008. Mr. Tomaszewski received a BS in Business Administration from West Virginia Wesleyan College in 1978 and an MS in Business Administration from Robert Morris University in 1992.
Joshua Belczyk, General Manager — Zochem, Inc., joined us in September 2010 as Director — Business Development. Prior to joining us, he worked with FTI Consulting, Inc in Corporate Financing and Restructuring. Prior to that, Mr. Belczyk worked for eight years for Bailey — PVS Oxides, LLC., an environmental service and recycling provider to the steel industry, where he last served as multi-site General Manager. Mr. Belczyk received a BS degree in Environmental Science and Public Policy from Harvard University in 2000 and a MBA from the University of Michigan in 2009.
Available Information
We file annual, quarterly and current reports and other information with the SEC. These filings are available to the public at the SEC’s web site at http://www.sec.gov. You may also read and copy any document we file at the SEC’s public reference room located in Washington, DC 20549. Please call the SEC at 1-800-SEC-0330 for further information on the public reference room.
Our internet website address is www.horsehead.net. Our annual reports on Form 10-K, quarterly reports on Form 10-Q, and amendments to those reports filed or furnished pursuant to Section 13 or 15(d) of the Exchange Act are available free of charge through our website as soon as reasonably practicable after they are electronically filed with, or furnished to, the SEC. Additionally, our Code of Ethics may be accessed within the Investor Relations section of our web site. Our website and the information contained or incorporated therein are not intended to be incorporated into this report.
In addition to the other information in thisAnnual Report on Form 10-K, the following risk factors should be read carefully in connection with evaluating our business and the forward-looking information contained in this Annual Report on Form 10-K. Any of the following risks could materially adversely affect our business, operating results, financial condition and the actual outcome of matters as to which we have made forward-looking statements in this Annual Report on Form 10-K. There may be additional risks and uncertainties that are not presently known or that we do not currently consider to be significant that may adversely affect our business, performance or financial condition in the future.
Risks related to our business
The metals industry is highly cyclical. Fluctuations in the availability of zinc and nickel and in levels of customer demand have historically been severe, and future changes and/or fluctuations could cause us to experience lower sales volumes, which would negatively impact our profit margins.
The metals industry is highly cyclical. The length and magnitude of industry cycles have varied over time and by product but generally reflect changes in macroeconomic conditions, levels of industry capacity and availability of usable raw materials. The overall levels of demand for our products containing zinc or nickel reflect fluctuations in levels of end-user demand, which depend in large part on general macroeconomic conditions in North America and regional economic conditions in our markets. For example, many of the principal consumers of zinc metal and zinc-related products operate in industries such as transportation,
18
construction or general manufacturing, that themselves are heavily dependent on general economic conditions, including the availability of affordable energy sources, employment levels, interest rates, consumer confidence and housing demand. These cyclical shifts in our customers’ industries tend to result in significant fluctuations in demand and pricing for our products and services. As a result, in periods of recession or low economic growth, such as the one we are currently experiencing, metals companies, including ours, have generally tended to under-perform compared to other industries. We generally have high fixed costs, so changes in industry demand that impact our production volume also can significantly impact our profit margins and our overall financial condition. Economic downturns in the national and international economies and a prolonged recession in our principal industry segments have had a negative impact on our operations and on those of our predecessor both recently and in the past, and a continuation or further deterioration of current economic conditions could have a negative impact on our future financial condition or results of operations.
Current or future credit and financial market conditions could materially and adversely affect our business and results of operations in several ways.
Financial markets in the United States, Europe and Asia have experienced extreme disruption, including, among other things, extreme volatility in securities prices, severely diminished liquidity and credit availability, rating downgrades of certain investments and declining valuations of others. Despite some improvement in credit and financial markets, there can be no assurance that there will not be further deterioration in these markets and confidence in economic conditions. These economic developments affect businesses such as ours in a number of ways. Tightening of credit in financial markets may delay or prevent our customers from securing funding adequate to honor their existing contracts with us or to enter into new contracts to purchase our products and could result in a decrease in or cancellation of orders for our products. Our customers may also seek to delay deliveries of our products under existing contracts, which may postpone our ability to recognize revenue on contracts in our order backlog.
Our business is also adversely affected by decreases in the general level of economic activity, including the levels of purchasing and investment in general. Strengthening of the rate of exchange for the U.S. dollar against certain major currencies may adversely affect our results or may adversely affect our domestic customers’ ability to export their product. We may also face increased risk that the counterparty or clearing agent to a hedging transaction that we enter or have entered into may default on its obligation to pay or deliver under the forward contract. We are unable to predict the likely duration and severity of disruptions in financial markets and sluggish economic conditions in the United States and other countries, and any resulting effects or changes, including those described above, may have a material and adverse effect on our business, results of operations and financial condition.
Changes in the prices of zinc and nickel will have a significant impact on our operating results and financial condition.
We derive most of our revenue from the sale of zinc and nickel-based products. Changes in the market price of zinc and nickel impact the selling prices of our products, and therefore our profitability is significantly affected by decreased zinc and nickel prices. Market prices of these metals are dependent upon supply and demand and a variety of factors over which we have little or no control, including:
| | Ÿ | | U.S. and world economic conditions; |
| | Ÿ | | availability and relative pricing of metal substitutes; |
| | Ÿ | | environmental laws and regulations; |
| | Ÿ | | import and export restrictions. |
Declines in the price of zinc have had a negative impact on our operations in the past, and future declines could have a negative impact on our future financial condition or results of operations. In 2002, record low zinc prices, together with high operational and legacy environmental costs and inefficiencies, caused our predecessor,
19
HII, to file for Chapter 11 bankruptcy protection. Market conditions beyond our control determine the prices for our products, and the price for any one or more of our products may fall below our production costs, requiring us to either incur short-term losses and/or idle or permanently shut down production capacity. Market prices for zinc and nickel may decrease, and therefore our operating results may be significantly harmed.
Some of our products and services are vulnerable to long-term declines in demand due to competing technologies, materials or imports, which would significantly reduce our sales.
Our zinc and nickel-based products compete with other materials in many of their applications. For example, our zinc is used by steel fabricators in the hot dip galvanizing process, in which steel is coated with zinc in order to protect it from corrosion. Steel fabricators also can use paint, which we do not sell, for corrosion protection. Demand for our zinc as a galvanizing material may shift depending on how customers view the respective merits of hot dip galvanizing and paint. In addition, some of our customers may reduce or eliminate their usage of PW grade zinc metal because it contains a small amount of lead and may switch to other grades of zinc metal that we do not produce.
Our nickel-based products are used in the stainless steel industry. Demand for our products and services may decline if demand for stainless steel lessens. Nickel-bearing stainless steel faces competition from stainless steels containing a lower level of nickel or no nickel. Domestic production of stainless steel may be negatively impacted by imports.
In addition, in periods of high zinc and nickel prices, consumers of these metals may have additional incentives to invest in the development of technologically viable substitutes for zinc and nickel-based products. Similarly, customers may develop ways to manufacture their products by using less zinc and nickel-based material than they do currently. If one or more of our customers successfully identify alternative products that can be substituted for our zinc or nickel-based products, or find ways to reduce their zinc or nickel consumption, our sales to those and other customers would likely decline.
Demand for our EAF dust or nickel-bearing waste recycling operations may decline to the extent that steel mini-mill producers identify less expensive or more convenient alternatives for the disposal of their EAF dust or nickel-bearing waste or if the EPA were to no longer classify EAF dust as a listed hazardous waste. We may in the future face increased competition from other EAF dust or nickel-bearing waste recyclers, including new entrants into those recycling markets, or from landfills implementing more effective disposal techniques. Furthermore, our current recycling customers may seek to capitalize on the value of the EAF dust or nickel-bearing waste produced by their operations, or may seek to recycle their material themselves, or reduce the price they pay to us for the material they deliver to us. Any of these developments would have an adverse effect on our financial results.
We may be unable to compete effectively against manufacturers of zinc and nickel products in one or more of our markets, which would limit our market share or reduce our sales and our operating profit margins.
We face intense competition from regional, national and global companies in each of the markets we serve, where we face also the potential for future entrants and competitors. We compete on the basis of product quality, on-time delivery performance and price, with price representing a more important factor for our larger customers and for sales of standard zinc products than for smaller customers and customers to whom we sell value-added zinc-based products. Our competitors include other independent zinc producers as well as vertically integrated zinc companies that mine and produce zinc. Some of our competitors have substantially greater financial and other resources than we do. In addition, we estimate that our products comprised only approximately 14% of total zinc consumption in the United States in 2011, and several of our competitors have greater market share than we do. Our competitors may also foresee the course of market development more accurately than we do, sell products at a lower price than we can and/or adapt more quickly to new technologies or industry and customer requirements. We operate in a global marketplace, and zinc metal imports now represent approximately 74% of U.S. zinc metal consumption.
In the future, foreign zinc metal producers may develop new ways of packaging and transporting zinc metal that could mitigate the freight cost and other shipping limitations that we believe currently limit their ability to more fully penetrate the U.S. zinc market. If our customers in any of the end-user markets we serve were to shift
20
their production outside the United States and Canada, then those customers would likely source zinc overseas, and, as a result, our net sales and results of operations would be adversely affected. If we cannot compete other than by reducing prices, we may lose market share and suffer reduced profit margins. If our competitors lower their prices, it could inhibit our ability to compete for customers with higher value-added sales and could lead to a reduction in our sales volumes and profit. If our product mix changed as a result of competitive pricing, it could have an adverse impact on our gross margins and profitability.
If we fail to implement our business strategy, our financial condition and results of operations could be materially and adversely affected.
Our ability to achieve our business and financial objectives is subject to a variety of factors, many of which are beyond our control. For example, factors such as increased competition, legal and regulatory developments, general economic conditions or increased operating costs could prevent us from increasing our capacity, implementing further productivity improvements, investing in technology upgrades or continuing to enhance our business and product mix.
An important part of our strategy is to grow our business by expanding our capacity to process EAF dust. One new kiln was placed into service in 2008 at our Rockwood, Tennessee facility and two new kilns were placed into service in 2010 at our new recycling facility in Barnwell, South Carolina. We may also need additional financing to implement our strategy related to the new zinc facility and we may not have access to the funding required on acceptable terms or at all. Our construction costs may also increase to levels that would make our facilities unprofitable to operate. Our planned projects may also suffer significant delays or cost overruns as a result of a variety of factors, such as shortages of workers or materials, transportation constraints, adverse weather, unforeseen difficulties or labor issues, any of which could prevent us from completing our expansion plans as currently expected. Our project plans may also result in other unanticipated adverse consequences, such as the diversion of management’s attention from our existing operations. In addition, even if we are able to implement our strategy, projected increases in EAF dust recycling may not materialize to the extent we expect, or at all, resulting in unutilized capacity. Any failure to successfully implement our business strategy, including for any of the above reasons, could materially and adversely affect our financial condition and results of operations. We may, in addition, decide to alter or discontinue certain aspects of our business strategy at any time.
We may not have sufficient funds to enable us to construct the new zinc facility.
In July 2011, we issued $100.0 million in principal amount of the Convertible Notes and on September 28, 2011, we closed on a $60 million Revolving Credit Agreement. The net proceeds from the Convertible Notes offering and the availability under the Revolving Credit Agreement, together with cash on hand, will be used to fund the initial stages of construction of the new zinc facility. Our cash flow may not be sufficient to provide the capital needed to complete construction and in that event, we will require additional financing. We may not have access to such funding on acceptable terms or at all. In addition, the budgets we have prepared for the new zinc facility are engineering estimates based on front-end engineering and design estimates, all of which are subject to change as we continue to refine and develop our plans. Increases in the costs of constructing the new zinc facility or other unforeseen circumstances could require us to obtain additional financing, which we may not be able to obtain on acceptable terms or at all. If we cannot construct the new zinc facility, it could affect our business strategies and negatively impact our liquidity, financial conditions or operations.
We may experience delays in the construction of, or be unable to construct, the new zinc facility, which would harm our profitability.
All construction and development projects are potentially subject to delays in completion (whether caused by us or by factors beyond our control), technological challenges ( particularly in the case of the construction of the new zinc facility, which relies on advanced technology), shortages of raw materials, poor workmanship, disruption of our existing operations, shortages of skilled construction labor, injuries sustained by worker or patrons on the job site, and cost or budget overruns. In addition, the new zinc facility will require numerous and potentially difficult-to-obtain permits and they may be subject to appeal or later revoked. Furthermore, we will be subject to risks related to the integration of the new zinc facility into our operations, both during the planning and implementation stages of its
21
construction. If these risks materialize, we may experience delays in the construction of, or be unable to construct, the new zinc facility, which could negatively impact our future business and results of operations.
The projected benefits from the new zinc facility may fail to materialize.
The benefits that we project to receive from the new zinc facility are based on numerous assumptions, and if these assumptions are incorrect, it could negatively impact such projected benefits. The technology that we plan to use at this new zinc facility has only been implemented in a limited number of production environments, and our assumptions with regard to this technology may be incorrect. For example, the feed materials we intend to use and some aspects of the technology in the new zinc facility have not been tested in exactly the same manner on a production scale or the equipment in the new zinc facility may not be operated in exactly the same manner as the other production environments. This could decrease the amount of SHG zinc, as well as other metals, that we are able to recover using the technology at the new zinc facility, which would increase the cost of the products that we expect to produce. We may also not be able to realize the reduced recycling costs or the logistical benefits that come from directly converting Waelz oxide to SHG zinc. If we are unable to successfully utilize the technology that we currently plan to use at the new zinc facility, we may not be able to fully realize the benefits that we expect from this new facility or we may be required to invest in additional equipment to realize these benefits. Further, we may be unable to penetrate the market for the SHG zinc that we plan to produce. Finally, the projected benefits at the new zinc facility are based on numerous other assumptions, including the recovery rate and prices of zinc and the other metals we expect to recover, energy consumption requirements, energy prices, the number of employees required to operate the new zinc facility and labor and maintenance costs at the new zinc facility. If any of our assumptions are incorrect, we may not realize the anticipated benefits from the new zinc facility, which could negatively impact our future business and results of operations.
Servicing our debt requires a significant amount of cash, and we may not have sufficient cash flow from our business to pay the notes or other debt we may occur.
Our ability to make scheduled payments of the principal or pay interest on or to refinance the Convertible Notes or other indebtedness we may incur, depends on our future performance, which is subject to economic, financial, competitive and other factors beyond our control. Our business may not continue to generate cash flow from operations in the future sufficient to service our debt and make necessary capital expenditures. If we are unable to generate such cash flow, we may be required to adopt one or more alternatives, such as selling assets, restructuring debt or obtaining additional equity capital on terms that may be onerous. Our ability to refinance our indebtedness will depend on the capital markets and our financial condition at such time. We may not be able to engage in any of these activities or engage in these activities on desirable terms, which could result in a default on the Convertible Notes or other debt obligations we may incur.
Our business could be harmed if we do not successfully manage the integration of businesses that we acquire in the future or we may not realize all or any of the anticipated benefits from acquisitions we make in the future.
As part of our business strategy, we have and may continue to acquire other businesses that complement our core capabilities, including the acquisition of Zochem on November 1, 2011. The benefits of an acquisition, including the acquisition of Zochem, may often take considerable time to develop and may not be realized. Business acquisitions entail a number of inherent risks such as:
| | Ÿ | | the potential loss of key customers and employees of the acquired business; |
| | Ÿ | | the in-ability to achieve the operating and financial synergies anticipated from an acquisition; |
| | Ÿ | | disruptions that can arise from the integration of the acquired business; and |
| | Ÿ | | potential unknown liabilities or other difficulties associated with the acquired businesses. |
As a result of the aforementioned and other risks, we may not realize the anticipated benefits from acquisitions, which could adversely affect our business.
22
Work stoppages and other labor matters could interrupt our production or increase our costs, either of which would negatively impact our operating results.
As of December 31, 2011, we had 1,064 employees, 773, or approximately 73%, of whom were covered by union contracts. Two of the eight collective bargaining agreements to which we are a party are scheduled to expire in 2012. We may be unable to resolve any of these contract negotiations without work stoppages or significant increases in costs, which could have a material adverse effect on our financial condition, cash flows and operating results. We may be unable to maintain satisfactory relationships with our employees and their unions, and we may encounter strikes, further unionization efforts or other types of conflicts with labor unions or our employees, which may interfere with our production or increase our costs, either of which would negatively impact our operating results.
Equipment or power failures, delays in deliveries or catastrophic loss at any of our facilities, such as experienced in the refinery incident at our Monaca, Pennsylvania facility that occurred on July 22, 2010, could prevent us from meeting customer demand, reduce our sales, increase our costs and/or negatively impact our results of operations.
An interruption in production or service capabilities at any of our production facilities as a result of equipment or power failure or other reasons could limit our ability to deliver products to our customers, reducing our net sales and net income, increasing our costs and potentially damaging relationships with our customers. Any significant delay in deliveries to our customers could lead to increased returns or cancellations, damage to our reputation and/or permanent loss of customers. Any such production stoppage or delay could also require us to make unplanned capital expenditures, which together with reduced sales and increased costs, could adversely affect our results or operations.
For instance, in July 2010, we experienced an incident at our refinery at our Monaca, Pennsylvania facility that resulted in two fatalities and reported injuries to two employees. We determined that we needed to rebuild each of the ten columns used to produce zinc oxide and refined zinc metal at this facility before production could be restarted but we were unable to commence reconstruction for several weeks pending completion of various regulatory and other investigations. Consequently, we lost approximately 12,000 tons of zinc production, incurred $17.9 million in increased costs related to the incident and estimate that our profit was decreased by $20.5 million excluding the amounts of any insurance recovery.
Furthermore, because many of our customers are, to varying degrees, dependent on deliveries from our facilities, customers that have to reschedule their own production due to our missed deliveries could pursue financial claims against us. Our facilities are also subject to the risk of catastrophic loss due to unanticipated events such as fires, adverse weather conditions or other refinery incidents. We have experienced, and may experience in the future, periods of reduced production as a result of repairs that are necessary to our kiln, smelting and refinery operations. If any of these events occur in the future, they could have a material adverse effect on our business, financial condition or results of operations. Our insurance policies may not cover all of our losses and we could incur uninsured losses and liabilities arising from, among other things, loss of life, physical damage, business interruptions and product liability.
Fluctuations in the cost or availability of electricity, coke, and/or natural gas would lead to higher manufacturing costs, thereby reducing our margins and limiting our cash flows from operations.
Energy is one of our most significant costs, comprising approximately $85 million of our production costs in 2011. Our processes rely on electricity, coke and natural gas in order to operate, our freight operations depend heavily on the availability of diesel fuel and our Monaca power plant, which was temporarily idled in September 2011 as a result of a power purchase agreement that was entered into in September 2011, used coal to generate electricity for our operations in that facility. Energy prices, particularly for electricity, natural gas, coal, coke and diesel fuel, have been volatile and have exceeded historical averages in recent years. These fluctuations impact our manufacturing costs and contribute to earnings volatility. We estimate that a hypothetical 10% increase in electricity, natural gas and coke costs would have reduced our income from operations by approximately $8.5 million for 2011. In addition, the new power purchase agreement at the Monaca, Pennsylvania facility will be
23
subject to the same risks related to an increase in electricity costs. In addition, at most of our facilities we do not maintain sources of secondary power, and therefore any prolonged interruptions in the supply of energy to our facilities could result in lengthy production shutdowns, increased costs associated with restarting production and waste of production in progress. We have experienced rolling power outages in the past, and any future outages would reduce our production capacity, reducing our net sales and potentially impacting our ability to deliver products to our customers.
If we were to lose order volumes from any of our major customers, our sales could decline significantly and our cash flows may be reduced.
In 2011, our ten largest customers were responsible for 39% of our consolidated sales. In 2011, three of INMETCO’s customers provided 86% of its sales. A loss of order volumes from, or a loss of industry share by, any major customer could negatively affect our financial condition and results of operations by lowering sales volumes, increasing costs and lowering profitability. In addition, several of our customers have become involved in bankruptcy or insolvency proceedings and have defaulted on their obligations to us in recent years. We may be required to record significant additional reserves for accounts receivable from customers which may have a material impact on our financial condition, results of operations and cash flows.
In addition, approximately 36% by volume of our zinc product shipments in 2011 were to customers who do not have long-term contractual arrangements with us. These customers purchase products and services from us on a spot basis and may choose not to continue to purchase our products and services. The loss of these customers or a significant reduction in their purchase orders could have a negative impact on our sales volume and business.
Our operations are subject to numerous federal and state statutes that regulate the protection of the health and safety of our employees, and changes in health and safety regulation could result in significant costs, which would reduce our margins and adversely affect our cash flow from operations.
We are subject to the requirements of the U.S. Occupational Safety and Health Administration (“OSHA”), and comparable state statutes that regulate the protection of the health and safety of workers. In addition, the OSHA hazard communication standard requires that information be maintained about hazardous materials used or produced in operations and that this information be provided to employees, state and local government authorities and citizens. We are also subject to federal and state laws regarding operational safety. Costs and liabilities related to worker safety may be incurred and any violation of health and safety laws or regulations could impose substantial costs on us. Possible future developments, including stricter safety laws for workers or others, regulations and enforcement policies and claims for personal injury or property damages resulting from our operations could result in substantial costs and liabilities that could reduce the amount of cash that we would otherwise have to distribute or use to service our indebtedness or further enhance our business.
Litigation related to worker safety may result in significant liabilities and limit our profitability.
We may be involved in claims and litigation filed on behalf of persons alleging injuries suffered predominantly because of occupational exposure to substances at our facilities. It is not possible to predict the ultimate outcome of these claims and lawsuits due to the unpredictable nature of personal injury litigation. If these claims and lawsuits, individually or in the aggregate, were finally resolved against us, our results of operations and cash flows could be adversely affected.
We are subject to stringent environmental regulation, which may cause us to incur significant costs and liabilities that could materially harm our operating results.
Our business is subject to a variety of environmental regulations and our operations expose us to various potential environmental liabilities. For example, we recycle EAF dust, which is listed and regulated as a hazardous waste under the EPA’s solid waste Resource Conservation and Recovery Act (“RCRA”). Failure to properly process and manage EAF dust could result in significant liability for us, including, among other things, costs for health-related claims or for remediation of hazardous substances in the environment. In addition, as part of the purchase of assets out of bankruptcy, we inherited responsibility for several environmental issues from our
24
predecessor at our Palmerton, Pennsylvania and Bartlesville, Oklahoma facilities. The issues related to our Palmerton, Pennsylvania facility are cited in a 1995 Environmental Protection Agency (“EPA”) and Pennsylvania Department of Environmental protection (“PADEP”) consent decree, and the matters relating to our Bartlesville, Oklahoma facility are covered in a RCRA post-closure care permit issued by the Oklahoma Department of Environmental Quality. A reserve in the amount of $2.2 million was established as of December 31, 2010, to cover the cost of construction of a storage building for calcine kiln feed materials at our Palmerton, Pennsylvania facility ($1.5 million) and for ongoing post-closure groundwater monitoring and maintenance activities at our Bartlesville, Oklahoma facility ($0.7 million). The reserve ($1.5 million) for the Palmerton, Pennsylvania facility was removed during 2011 since the PADEP concurred with our assessment that construction of the storage building for calcine feed was not necessary. We may also incur costs related to future compliance with or violations of applicable environmental laws and regulations, including air emission regulations under “Maximum Achievable Control Technology” (“MACT”) rules relating to industrial boilers, future MACT regulations relating to the non-ferrous secondary metals production category, revised rules related to the National Ambient Air Quality Standard (“NAAQS”) for lead emissions at our Monaca, Pennsylvania facility, “Cross State Air Pollution Rule”, which was indefinitely stayed in December 2011, that focuses on reducing emissions that affect a “downwind” state’s ability to meet NAAQS for a variety of pollutants, including nitrogen oxides and sulfur oxides, from our Monaca, Pennsylvania power plant and Pennsylvania regulations that are more stringent than the federal MACT regulations that would apply to mercury emissions from coal combustion at our Monaca, Pennsylvania power plant. We may not be able to meet the revised rules related to NAAQS for lead emissions at our Monaca facility or it may require significant capital to comply and we may not be able fund these additional capital expenditures or be able to ultimately meet the requirements. Our Monaca, Pennsylvania power plant was temporarily idled in September 2011. Our total cost of environmental compliance at any time depends on a variety of regulatory, legal, technical and factual issues, some of which cannot be anticipated. Additional environmental issues could arise, or laws and regulations could be passed and promulgated, resulting in additional costs, which our reserves may not cover and which could materially harm our operating results.
Potential federal climate change legislation or greenhouse gas regulation could result in increased operating costs and reduced demand for our products.
Over the past two years, Congress has considered legislation that would cap and reduce emissions of greenhouse gases (“GHGs”) for most industrial sectors, although to date no major climate change bill has been enacted. In June 2009, the U.S. House of Representatives passed the American Clean Energy Security Act of 2009, which was introduced by Rep. Henry Waxman (D-CA) and Rep. Edward Markey (D-MA) and commonly known as “Waxman-Markey.” This bill would have established an economy-wide cap-and-trade system for emissions of GHGs, seeking to reduce them 17% below 2005 levels by 2020 and 83% below 2005 levels by 2050. Under Waxman-Markey, sources that emit GHGs would have been required to hold an emission allowance or an offset credit for each carbon dioxide-equivalent ton of a GHG emitted or produced on site. Broadly, Waxman-Markey and similar regulatory programs would likely have resulted in increased costs associated with the production and combustion of carbon-intensive fuels such as coal, oil, refined petroleum products, and gas. As of March 1, 2012, the U.S. Senate still has not voted on the House-passed bill. It is possible that similar legislation could be proposed again in the near future.
In addition, the EPA has begun regulating GHG emissions under the Clean Air Act in response to the Supreme Court’s 2007 decision inMassachusetts v. EPA. In December 2009, the EPA published its findings that atmospheric concentrations of GHGs endanger public health and welfare pursuant to the Clean Air Act (“CAA”) and that GHG emissions from new motor vehicles and new motor vehicle engines are contributing to air pollution endangering public health and welfare pursuant to the CAA (the “endangerment finding”). Although these findings do not by themselves impose any requirements with respect to sources emitting GHGs and contain no specific emission reduction targets, they have resulted in subsequent efforts by the EPA to regulate GHGs under the CAA.
Following the endangerment finding, the EPA conducted several rulemakings that, if ultimately implemented, would regulate GHGs from certain stationary sources under the CAA. Separately, EPA has promulgated a series of rulemakings requiring the reporting of GHG emissions. The adoption and implementation of any regulations imposing reporting obligations on, or limiting emissions of GHGs from, our equipment and operations could require us to incur significant costs to reduce emissions of GHGs associated with our operations.
We believe we are in substantial compliance with existing environmental laws and regulations applicable to our current operations. However, accidental spills or releases may occur in the course of our operations, and we
25
cannot give any assurance that we will not incur substantial costs and liabilities as a result of such spills or releases, including those relating to claims for damage to property, persons, natural resources or the environment. Moreover, we cannot give any assurance that the passage of more stringent laws or regulations in the future will not have a negative effect on our business, financial condition and results of operations.
Our hedging strategies may fail to protect us from changes in the prices for natural gas, zinc and nickel, which could reduce our gross margin and cash flow.
We pursue various hedging strategies, including entering into forward purchase contracts and call and put options, in order to reduce our exposure to losses from adverse changes in the prices for natural gas, zinc and nickel. Our hedging activities may fail to protect or could harm our operating results because, among other things:
| | Ÿ | | hedging can be expensive, particularly during periods of volatile prices; |
| | Ÿ | | available hedges may not correspond directly with the risks that we are seeking to protect ourselves against; |
| | Ÿ | | the duration of the hedge may not match the duration of the risk that we are seeking to protect ourselves against; |
| | Ÿ | | the counterparty or clearing agent to a hedging transaction may default on its obligation to pay or deliver under the forward contract; and |
| | Ÿ | | we may need to post collateral with counterparties for certain hedging transactions. |
We depend on the service of key individuals, the loss of whom could materially harm our business.
Our success will depend, in part, on the efforts of our executive officers and other key employees, none of whom are covered by key person insurance policies. These individuals possess sales, marketing, engineering, manufacturing, financial and administrative skills that are critical to the operation of our business. If we lose or suffer an extended interruption in the services of one or more of our executive officers or other key employees, our business, results of operations and financial condition may be negatively impacted. Moreover, the market for qualified individuals may be highly competitive and we may not be able to attract and retain qualified personnel to succeed members of our management team or other key employees, should the need arise.
We may not be able to protect our intellectual property, particularly our proprietary technology related to the recycling of EAF dust, the smelting of recycled zinc and the processing of nickel-bearing materials. Our market share and results of operations could be harmed.
We rely upon proprietary know-how and continuing technological and operating innovation and other trade secrets to develop and maintain our competitive position. Our competitors could gain knowledge of our know-how or trade secrets, either directly or through one or more of our employees or other third parties. If one or more of our competitors can use or independently develop such know-how or trade secrets, our market share, sales volumes and profit margins could be adversely affected.
We depend on third parties for transportation services, and their failure to deliver raw material to us or finished products to our customers could increase our costs and harm our reputation and operating results.
We rely primarily on third parties for transportation of the products we manufacture, as well as the delivery of EAF dust to our recycling plants and other raw materials, including recycled zinc, to our Monaca, Pennsylvania production facility. In particular, a substantial portion of the raw materials we use is transported by railroad, which is highly regulated. If any of our third-party transportation providers were to fail to deliver our products in a timely manner, we may be unable to sell those products at full value or at all. Similarly, if any of these providers were to fail to deliver raw materials to us in a timely manner, we may be unable to meet customer demand. In addition, if any of these third parties were to cease operations or cease doing business with us, we may be unable to replace them at reasonable cost. Any failure of a third-party transportation provider to deliver raw materials or finished products in a timely manner could disrupt our operations, harm our reputation and have a material adverse effect on our financial condition and operating results.
26
Risks related to our Common Stock
The market price for shares of our common stock has been and may continue to be highly volatile and subject to wide fluctuations.
The market for common stock has been subject to significant disruptions that have caused substantial volatility in the prices of these securities, which may or may not have corresponded to the business or financial success of the particular company. The market price for shares of our common stock has been volatile and could decline if our future operating results fail to meet or exceed the expectations of market analysts and investors or current economic or market conditions persist or worsen.
Some specific factors that may have a significant effect on the future market price of our shares of common stock include:
| | Ÿ | | actual or expected fluctuations in our operating results; |
| | Ÿ | | actual or expected changes in our growth rates or our competitors’ growth rates; |
| | Ÿ | | changes in general economic conditions or conditions in our industry generally; |
| | Ÿ | | changes in conditions in the financial markets; |
| | Ÿ | | our inability to raise additional capital; |
| | Ÿ | | increases in our cost of capital; |
| | Ÿ | | changes in applicable laws or regulations, court rulings and enforcement and legal actions; |
| | Ÿ | | adverse market reaction to any increased indebtedness we incur in the future; |
| | Ÿ | | additions or departures of key management personnel; |
| | Ÿ | | actions by our stockholders; |
| | Ÿ | | changes in market prices for our products or for our raw materials; and |
| | Ÿ | | changes in stock market analyst research and recommendations regarding the shares of our common stock, other comparable companies or our industry generally. |
These and other factors may affect your ability to resell your shares of our common stock at or above the price you paid for such shares.
We do not have any current plan to pay dividends on our common stock, and as a result, your only opportunity to achieve a return on your investment in our common stock is if the price of our common stock increases.
We anticipate that we will retain all future earnings and other cash resources for the future operation and development of our business. Accordingly, we do not intend to declare or pay regular cash dividends on our common stock in the near future. Payment of any future dividends will be at the discretion of our board of directors after taking into account many factors, including our operating results, financial conditions, current and anticipated cash needs and plans for expansion. The declaration and payment of any dividends on our common stock may also be restricted by the terms of any future credit facilities. As a result, your only opportunity to achieve a return on your investment in us will be if the price of our common stock increases and if you are able to sell your shares at a profit. You may not be able to sell shares of our common stock at a price that exceeds the price that you pay.
As a result of our Revolving Credit Agreement entered into on September 28, 2011, Horsehead Corporation is restricted, under certain circumstances, from providing cash to us. This may limit our ability to pay dividends on our common stock during the Revolving Credit Agreement’s five year term.
27
Provisions of our amended certificate of incorporation and by-laws could delay or prevent a takeover of us by a third party and may prevent attempts by stockholders to replace or remove our current management.
Provisions in our amended certificate of incorporation and by-laws and of Delaware corporate law may make it difficult and expensive for a third party to pursue a tender offer, change in control or takeover attempt that is opposed by our management and board of directors. These anti-takeover provisions could substantially impede the ability of public stockholders to benefit from a change of control or change our management and board of directors.
In addition, Section 203 of the Delaware General Corporation Law may discourage, delay or prevent a change in control by prohibiting us from engaging in a business combination with an interested stockholder for a period of three years after the person becomes an interested stockholder. These provisions could limit the price that certain investors might be willing to pay in the future for shares of our common stock and limit the return, if any, you are able to achieve on your investment in us.
ITEM 1B. UNRESOLVED STAFF COMMENTS
None.
As of December 31, 2011, our zinc production operations are located in Monaca and Palmerton, Pennsylvania and Brampton, Ontario Canada and our principal zinc recycling operations are located in Palmerton, Calumet, Illinois, Rockwood, Tennessee and Barnwell, South Carolina. Our nickel recycling operations are located in Ellwood City, Pennsylvania.
The chart below provides a brief description of each of our production facilities:
| | | | | | | | | | | | |
Location | | Own/ Lease | | Process | | Product | | Annual Capacity | |
| | | | | | | | | | | (tons) | |
Monaca, PA | | Own | | Finished Product | | PW Metal | | | 88,000 | |
| | | | | | Zinc Oxide | | | 90,000 | |
| | | | | | SSHG Metal | | | 15,000 | |
| | | | | | Zinc Dust | | | 5,900 | |
Brampton, Ontario Canada | | Own | | Finished Product | | Zinc Oxide | | | 49,600 | |
Barnwell, SC | | Own | | Recycling | | CZO(1) | | | 180,000 | * |
Calumet, IL | | Own | | Recycling | | CZO | | | 169,000 | * |
Palmerton, PA | | Own | | Recycling | | Calcine | | | 130,000 | (2) |
| | | | | | CZO | | | 273,000 | * |
| | | | | | Zinc Powder | | | 5,000 to 14,000 | (3) |
| | | | Finished Product | | Zinc Copper Base | | | 3,000 | |
Rockwood, TN | | Own | | Recycling | | CZO | | | 148,000 | * |
Ellwood City, PA | | Own | | Recycling | | Nickel-chromium-iron alloy | | | 70,000 | * |
| | | | | | Cadmium | | | 5,000 | |
Total carbon steel EAF dust Recycling Capacity | | | | | | | | | 770,000 | |
Total Smelting Capacity | | | | | | | | | 150,000 | |
| * | Represents EAF dust and other metal-bearing wastes recycling and processing capacity |
| (1) | CZO, with approximately 55% - 65% zinc content, is produced by our recycling operations and is used as a |
28
| | feedstock for our zinc facility in Monaca or further processed in Palmerton into zinc calcine (up to 65% — 70% zinc content) before being used as a feedstock in Monaca. |
| (2) | Assumes that one of four kilns is operated to produce calcine and the other three kilns are operated to produce CZO. |
We believe that our existing space is adequate for our current operations. We believe that suitable replacement and additional space will be available in the future on commercially reasonable terms.
We are party to various litigation, claims and disputes, including labor regulation claims and U.S. Occupational Safety and Health Act (“OSHA”) and environmental regulation violations, some of which are for substantial amounts, arising in the ordinary course of business. While the ultimate effect of such actions cannot be predicted with certainty, we expect that the outcome of these matters will not result in a material adverse effect on our business, financial condition or results of operations.
On July 2, 2010, we renewed a Consent Order and Agreement with the Pennsylvania Department of Environmental Protection (“PADEP”) related to the resolution of fugitive emission violations at our Monaca, Pennsylvania facility. The original Consent Order and Agreement was entered into on June 28, 2006 and required planning for, implementing and reporting on actions to mitigate fugitive air emissions at our Monaca, Pennsylvania facility. The recently renewed Consent Order and Agreement requires development and submittal of a preventative maintenance plan following approval by the PADEP. In addition, we are required to implement a plan for replacing bags in baghouses on a scheduled basis. Finally, we are required to submit quarterly progress reports to the PADEP on the above activities. The Consent Order and Agreement required that we continue to pay a civil penalty of $6,500 each month until June 15, 2011, and $9,000 each month from July 2011 through termination of the Consent Order and Agreement in June 2012.
| ITEM 4. MINE | SAFETY DISCLOSURES |
None.
29
PART II
| ITEM 5. MARKET | FOR REGISTRANT’S COMMON EQUITY, RELATED STOCKHOLDER MATTERS AND ISSUER PURCHASES OF EQUITY SECURITIES |
Market Information
Our common stock has been listed on The NASDAQ Global Select Market under the symbol “ZINC” since August 10, 2007. The highest and lowest sale prices of our common stock for the most recent eight quarters were:
| | | | | | | | |
Quarter | | High | | | Low | |
2011 | | | | | | | | |
10/01/11 — 12/31/11 | | $ | 9.76 | | | $ | 6.24 | |
07/01/11 — 09/30/11 | | | 13.87 | | | | 7.11 | |
04/01/11 — 06/30/11 | | | 17.98 | | | | 10.53 | |
01/01/11 — 03/31/11 | | | 17.97 | | | | 11.70 | |
2010 | | | | | | | | |
10/01/10 — 12/31/10 | | $ | 13.81 | | | $ | 9.45 | |
07/01/10 — 09/30/10 | | | 10.09 | | | | 7.11 | |
04/01/10 — 06/30/10 | | | 12.81 | | | | 7.33 | |
01/01/10 — 03/31/10 | | | 13.92 | | | | 8.31 | |
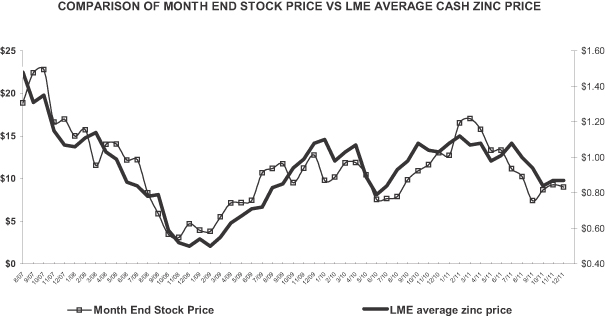
As of March 1, 2012, there were 4 holders of record of our common stock and approximately 11,600 beneficial owners of such stock. The transfer agent and registrar for our common stock is Computershare, P.O. Box 43078, Providence, Rhode Island, 02940-3078, Toll-free telephone 800-622-6757 (US, Canada, Puerto Rico), 781-575-4735 (non-US).
Unregistered Sales of Equity Securities
Issuance of Convertible Senior Notes
On July 27, 2011, we completed the private placement of $100,000,000 aggregate principal amount of 3.80% Convertible Senior Notes (“Convertible Notes”) due July 1, 2017. The Convertible Notes were offered at
30
an initial issue price of 100% which resulted in net proceeds of $97,000,000, after underwriting discounts. The representative for the initial purchasers was Stifel, Nicolaus & Company, Incorporated.
The Convertible Notes are convertible into shares of the our common stock, cash, or a combination of our common stock and cash, at our election, at an initial conversion rate of 66.6667 shares of our common stock per $1,000 principal amount of the Convertible Notes (approximately 6.666.67 underlying shares), which is equivalent to an initial conversion price of approximately $15.00 per share of common stock, subject to adjustment in certain circumstances, as defined in the indenture governing the Convertible Notes.
Holders of the Convertible Notes may convert their Convertible Notes at the applicable conversion rate at any time on or after April 1, 2017 until the close of business on the second business day immediately preceding the maturity date. The Notes may be converted prior to April 1, 2017 only under certain circumstances. We do not have the right to redeem the Convertible Notes prior to the stated maturity date of July 1, 2017.
Neither the Convertible Notes nor the shares of common stock issuable upon conversion of the Convertible Notes were registered under the Securities Act of 1933, as amended, or the securities laws of any other jurisdiction. The offering was only made to qualified institutional buyers in accordance with Rule 144A under the Securities Act.
We intend to use the proceeds from the private placement for the initial stages of construction of a new zinc facility and general corporate purposes, including working capital needs, investment in business initiatives, capital expenditures and acquisitions.
Dividends
We currently do not plan to pay dividends on our common stock. As a result of our Revolving Credit Agreement entered into on September 28, 2011, Horsehead Corporation is restricted, under certain circumstances, from providing cash to us. This may limit our ability to pay dividends on our common stock during the Revolving Credit Agreement’s five year term.
Any future determination to pay dividends will depend upon, among other factors, our results of operations, financial condition, capital requirements, debt covenants, any contractual restrictions and any other considerations our board of directors deems relevant.
Securities Authorized for Issuance under Equity Compensation Plans
Information regarding securities authorized for issuance under our equity compensation plans may be found in our Proxy Statement related to the 2012 Annual Meeting of Stockholders and is incorporated herein by reference.
31
Performance Graph
The following graph compares the fifty-eight month cumulative stockholder return on our common stock with the return on the Russell 2000 Index and a Peer Group Index, from February 1, 2007 through December 31, 2011, the end of our fiscal year. The graph assumes investments of $100 on February 1, 2007 in our common stock, the Russell 2000 Index and the Peer Group Index and assumes the reinvestment of all dividends. The Peer Group Index is composed of Harsco Corp., Lundin Mining Corp., Nyrstar, Schnitzer Steel Industries Inc., Teck Cominco Limited, Umicore SA, Sims Group Limited, Hudbay Minerals Inc. and Breakwater Resources Limited and is weighted by each of their relative market capitalizations at the beginning of each month for which returns are reported. One member of the Peer Group in 2007, Metals Management, Inc., merged in 2008 with another member of the Peer Group, Sims Group Limited, and is therefore no longer included in the Peer Group Index.
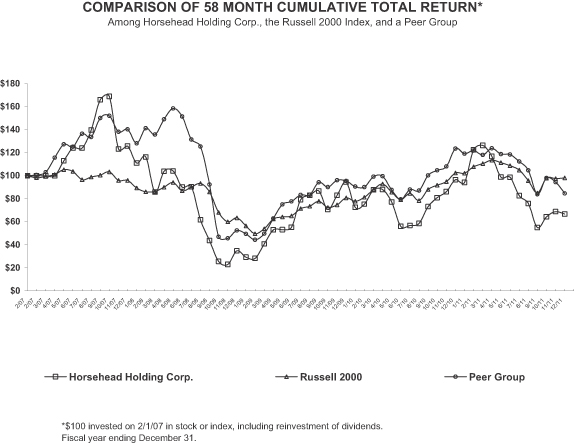
The prices for the period from February 1, 2007 through August 9, 2007, the day immediately prior to the date on which our common stock began trading on the Nasdaq Global Market, represent the closing prices on The PORTAL Market for the approximately 29.9 million shares of our common stock that we issued in private placement transactions in November 2006 and April 2007. PORTAL market data for the period prior to February 1, 2007 is not currently available. The prices for the period beginning August 10, 2007 represent the closing prices of our common stock on the Nasdaq Global Market and include the approximately 8.1 million shares of our common stock that we issued in our initial underwritten public offering.
| | | | | | | | | | | | | | | | | | | | | | | | | | | | | | | | | | | | |
| | | | | 2007 |
| | | | | | | | | | | | | | | 2/01 | | 2 | | 3 | | 4 | | 5 | | 6 | | 7 | | 8 | | 9 | | 10 | | 11 | | 12 |
| | | | | | | | | | | | | | | All amounts rounded to the nearest dollar |
Horsehead Holding Corp. | | | | | | | | | | | | | | 100 | | 100 | | 100 | | 100 | | 113 | | 124 | | 124 | | 140 | | 166 | | 169 | | 123 | | 126 |
Russell 2000 | | | | | | | | | | | | | | 100 | | 98 | | 99 | | 101 | | 105 | | 104 | | 97 | | 99 | | 101 | | 103 | | 96 | | 96 |
Peer Group | | | | | | | | | | | | | | 100 | | 101 | | 103 | | 116 | | 127 | | 125 | | 136 | | 134 | | 150 | | 152 | | 138 | | 140 |
32
| | | | | | | | | | | | | | | | | | | | | | | | | | | | | | | | | | | | |
| | | | | 2008 |
| | | | | | | | | | | | | | | 1 | | 2 | | 3 | | 4 | | 5 | | 6 | | 7 | | 8 | | 9 | | 10 | | 11 | | 12 |
| | | | | | | | | | | | | | | All amounts rounded to the nearest dollar |
Horsehead Holding Corp. | | | | | | | | | | | | | | 111 | | 116 | | 86 | | 104 | | 104 | | 90 | | 90 | | 62 | | 44 | | 26 | | 23 | | 35 |
Russell 2000 | | | | | | | | | | | | | | 89 | | 86 | | 86 | | 90 | | 94 | | 87 | | 90 | | 93 | | 86 | | 68 | | 60 | | 64 |
Peer Group | | | | | | | | | | | | | | 128 | | 141 | | 136 | | 149 | | 158 | | 151 | | 131 | | 125 | | 92 | | 47 | | 46 | | 52 |
| | | | | | | | | | | | | | | | | | | | | | | | | | | | | | | | | | | | |
| | | | | 2009 |
| | | | | | | | | | | | | | | 1 | | 2 | | 3 | | 4 | | 5 | | 6 | | 7 | | 8 | | 9 | | 10 | | 11 | | 12 |
| | | | | | | | | | | | | | | All amounts rounded to the nearest dollar |
Horsehead Holding Corp. | | | | | | | | | | | | | | 29 | | 28 | | 41 | | 53 | | 53 | | 55 | | 79 | | 83 | | 87 | | 71 | | 83 | | 94 |
Russell 2000 | | | | | | | | | | | | | | 56 | | 50 | | 54 | | 62 | | 64 | | 65 | | 71 | | 74 | | 78 | | 72 | | 75 | | 81 |
Peer Group | | | | | | | | | | | | | | 49 | | 44 | | 50 | | 63 | | 75 | | 78 | | 83 | | 83 | | 94 | | 90 | | 96 | | 96 |
| | | | | | | | | | | | | | | | | | | | | | | | | | | | | | | | | | | | |
| | | | | 2010 |
| | | | | | | | | | | | | | | 1 | | 2 | | 3 | | 4 | | 5 | | 6 | | 7 | | 8 | | 9 | | 10 | | 11 | | 12 |
| | | | | | | | | | | | | | | All amounts rounded to the nearest dollar |
Horsehead Holding Corp. | | | | | | | | | | | | | | 73 | | 75 | | 88 | | 88 | | 77 | | 56 | | 57 | | 59 | | 73 | | 81 | | 86 | | 97 |
Russell 2000 | | | | | | | | | | | | | | 78 | | 81 | | 88 | | 93 | | 86 | | 79 | | 85 | | 78 | | 88 | | 92 | | 95 | | 102 |
Peer Group | | | | | | | | | | | | | | 91 | | 90 | | 99 | | 100 | | 88 | | 79 | | 88 | | 87 | | 100 | | 105 | | 108 | | 124 |
| | | | | | | | | | | | | | | | | | | | | | | | | | | | | | | | | | | | |
| | | | | 2011 |
| | | | | | | | | | | | | | | 1 | | 2 | | 3 | | 4 | | 5 | | 6 | | 7 | | 8 | | 9 | | 10 | | 11 | | 12 |
| | | | | | | | | | | | | | | All amounts rounded to the nearest dollar |
Horsehead Holding Corp. | | | | | | | | | | | | | | 94 | | 123 | | 126 | | 117 | | 99 | | 99 | | 83 | | 76 | | 55 | | 64 | | 69 | | 67 |
Russell 2000 | | | | | | | | | | | | | | 102 | | 108 | | 111 | | 114 | | 111 | | 109 | | 105 | | 96 | | 85 | | 98 | | 98 | | 98 |
Peer Group | | | | | | | | | | | | | | 119 | | 122 | | 118 | | 124 | | 119 | | 118 | | 112 | | 105 | | 84 | | 98 | | 94 | | 85 |
Issuer Purchases of Equity Securities
We did not repurchase any of our common stock during the fourth quarter of the fiscal year ended December 31, 2011, and we do not have a formal or publicly announced stock repurchase program.
| ITEM 6. SELECTED | FINANCIAL DATA |
We have derived the selected historical consolidated financial information as of December 31, 2009, 2008 and 2007 and for the years ended December 31, 2008 and 2007 from our audited consolidated financial statements, which are not included in this Annual Report on Form 10-K. We have derived the selected historical consolidated financial information as of December 31, 2011 and 2010 and for the years ended December 31, 2011, 2010 and 2009 from our audited consolidated financial statements, which are included elsewhere in this Annual Report on Form 10-K.
33
The selected historical consolidated financial and other information presented below is condensed and may not contain all of the information that you should consider. You should read this information in conjunction with the consolidated financial statements of us and our predecessor, including, where applicable, the related notes, and the “Management’s Discussion and Analysis of Financial Condition and Results of Operations” section included in this Annual Report on Form 10-K.
| | | | | | | | | | | | | | | | | | | | |
| | | Year ended December 31, | |
| | | 2011 | | | 2010 | | | 2009 | | | 2008 | | | 2007 | |
| | | (In thousands, except for LME price and per share data) | |
Statement of income (loss) data: (2) | | | | | | | | | | | | | | | | | | | | |
Net sales | | $ | 451,180 | | | $ | 382,362 | | | $ | 216,530 | | | $ | 445,921 | | | $ | 545,579 | |
Cost of sales (excluding depreciation and amortization) | | | 377,401 | | | | 305,522 | | | | 226,171 | | | | 353,248 | | | | 373,359 | |
Depreciation and amortization | | | 22,025 | | | | 18,612 | | | | 15,982 | | | | 12,797 | | | | 10,150 | |
Selling, general and administrative expenses | | | 22,942 | | | | 18,672 | | | | 17,080 | | | | 18,184 | | | | 15,688 | |
| | | | | | | | | | | | | | | | | | | | |
Total costs and expenses | | | 422,368 | | | | 342,806 | | | | 259,233 | | | | 384,229 | | | | 399,197 | |
Income (loss) from operations | | | 28,812 | | | | 39,556 | | | | (42,703 | ) | | | 61,692 | | | | 146,382 | |
Interest expense | | | (3,324 | ) | | | (1,226 | ) | | | (2,340 | ) | | | (1,474 | ) | | | (7,589 | ) |
Gain on bargain purchase of business | | | 4,920 | | | | — | | | | — | | | | — | | | | — | |
Interest and other income | | | 1,948 | | | | 849 | | | | 883 | | | | 1,871 | | | | 3,037 | |
| | | | | | | | | | | | | | | | | | | | |
Income (loss) before income taxes | | | 32,356 | | | | 39,179 | | | | (44,160 | ) | | | 62,089 | | | | 141,830 | |
Income tax provision (benefit) | | | 10,902 | | | | 14,409 | | | | (16,689 | ) | | | 22,647 | | | | 51,147 | |
| | | | | | | | | | | | | | | | | | | | |
Net income (loss) | | $ | 21,454 | | | $ | 24,770 | | | $ | (27,471 | ) | | $ | 39,442 | | | $ | 90,683 | |
| | | | | | | | | | | | | | | | | | | | |
Net income (loss) per share: | | | | | | | | | | | | | | | | | | | | |
Basic | | $ | 0.49 | | | $ | 0.57 | | | $ | (0.73 | ) | | $ | 1.12 | | | $ | 3.13 | |
Diluted | | $ | 0.49 | | | $ | 0.57 | | | $ | (0.73 | ) | | $ | 1.12 | | | $ | 2.85 | |
Balance sheet data (at end of period): | | | | | | | | | | | | | | | | | | | | |
Cash and cash equivalents | | $ | 188,500 | | | $ | 109,557 | | | $ | 95,480 | | | $ | 122,768 | | | $ | 76,169 | |
Working capital | | | 260,930 | | | | 170,120 | | | | 143,455 | | | | 160,912 | | | | 150,018 | |
Property, plant and equipment, net | | | 260,052 | | | | 218,652 | | | | 191,307 | | | | 136,141 | | | | 98,932 | |
Total assets | | | 631,492 | | | | 496,136 | | | | 438,262 | | | | 358,478 | | | | 314,804 | |
Total long-term obligations, less current maturities | | | 79,663 | | | | 255 | | | | 255 | | | | 58 | | | | 121 | |
Stockholders’ equity | | | 412,251 | | | | 373,010 | | | | 345,417 | | | | 286,559 | | | | 242,054 | |
Cash flow statement data: | | | | | | | | | | | | | | | | | | | | |
Operating cash flow | | $ | 36,604 | | | $ | 57,306 | | | $ | (6,733 | ) | | $ | 94,007 | | | $ | 102,575 | |
Investing cash flow | | | (55,888 | ) | | | (44,134 | ) | | | (104,924 | ) | | | (50,671 | ) | | | (45,288 | ) |
Financing cash flow | | | 98,187 | | | | 905 | | | | 84,369 | | | | 3,263 | | | | 17,924 | |
Other data: | | | | | | | | | | | | | | | | | | | | |
Tons of zinc product shipped | | | 152 | | | | 137 | | | | 118 | | | | 154 | | | | 153 | |
Average LME zinc price(1) | | $ | 0.99 | | | $ | 0.98 | | | $ | 0.75 | | | $ | 0.85 | | | $ | 1.47 | |
Capital expenditures | | | 64,709 | | | | 44,704 | | | | 37,151 | | | | 50,671 | | | | 45,288 | |
Depreciation and amortization | | | 22,025 | | | | 18,612 | | | | 16,981 | | | | 13,463 | | | | 12,656 | |
| (1) | Average LME zinc price equals the average of each closing LME price for zinc on a dollars per pound basis during the measured period. |
| (2) | We acquired INMETCO on December 31, 2009 for a purchase price of $38,567 and Zochem on November 1, 2011 for a purchase price of $15,078. |
34
| ITEM 7. MANAGEMENT’S | DISCUSSION AND ANALYSIS OF FINANCIAL CONDITION AND RESULTS OF OPERATIONS |
You should read the following discussion and analysis in conjunction with the other sections of this Annual Report on Form 10-K, including “Business” and “Selected Financial Data,” as well as our consolidated financial statements, including the notes thereto. The statements in this discussion and analysis regarding industry outlook, our expectations regarding our future performance and our liquidity and capital resources and other non-historical statements in this discussion are forward-looking statements. See the “Cautionary Statement Regarding Forward-Looking Statements.” Our actual results may differ materially from those contained in or implied in any forward-looking statements due to numerous risks and uncertainties, including, but not limited to, the risks and uncertainties described in “Risk Factors.”
Overview
Our History
We are a leading U.S. producer of zinc and nickel-based products. Our products are used in a wide variety of applications, including in the galvanizing of fabricated steel products and as components in rubber tires, alkaline batteries, paint, chemicals, pharmaceuticals and as a remelt alloy in the production of stainless steel. We believe that we are the largest refiner of zinc oxide and PW zinc metal in North America. On November 1, 2011 we acquired Zochem, a producer of zinc oxide located in Brampton, Ontario Canada. We believe we are also the largest North American recycler of EAF dust, a hazardous waste produced by the carbon steel mini-mill manufacturing process. Through our INMETCO operations, we believe we are also a leading recycler of EAF dust and other nickel-bearing waste generated by specialty steel producers and a leading recycler of Ni-Cd batteries in North America. We, together with our predecessors, have been operating in the zinc industry for more than 150 years and in the nickel-bearing waste industry for more than 30 years. As a result of the acquisition of INMETCO, we now operate as two business segments.
While we vary our raw material inputs, or feedstocks, based on cost and availability, we generally produce our zinc products using nearly 100% recycled zinc, including zinc recovered from our four EAF dust recycling operations located in four states. We believe that our ability to convert recycled zinc into finished products results in lower feed costs than for smelters that rely primarily on zinc concentrates. Our four EAF dust recycling facilities also generate service fee revenue from steel mini-mills by providing a convenient and safe means for recycling their EAF dust. In 2010, we commenced operations at our fourth EAF dust processing facility located in South Carolina. We began the initial phase of construction, during the fourth quarter of 2011, on a new zinc facility to be located in Rutherford County, North Carolina. This new zinc facility which will be capable of producing SHG zinc, Continuous Galvanizing Grade (“CGG”) zinc as well as PW zinc, will also enable us to potentially recover other marketable metals from EAF dust. INMETCO provides recycling services, some of which is on a tolling basis, from a single production facility in Ellwood City, Pennsylvania.
Strategic acquisitions and investments
In early 2011, we announced plans to construct a new zinc facility, which we anticipate will be capable of production in excess of 150,000 tons of zinc metal per year, including grades of zinc that we are not currently able to produce, and will significantly reduce our manufacturing conversion costs due to the lower energy usage, higher labor productivity and lower maintenance needs associated with the new technology to be employed at the facility. The plant design will rely upon sustainable manufacturing practices to produce zinc solely from recycled materials and use significantly less fossil fuel than our current smelter. The new zinc facility will convert Waelz oxide and other recycled materials into SHG zinc and other grades that sell at a premium to the PW grade that we currently offer. This will allow us to expand into new markets, including selling to continuous galvanizers operated by steel mills, which include some of our EAF dust customers, die casters and LME warehouses, while continuing to serve customers in our existing markets. In addition, we believe the process will allow us to recover value from new metals such as silver and lead as well as the copper contained in EAF dust. Total capital expenditures for the construction of the new zinc facility in Rutherford County, North Carolina are currently estimated to range from $350 million to $375 million. To fund the initial stages of construction, we issued $100.0 million in principal amount of Convertible Notes on July 27, 2011 in a private placement. We received proceeds
35
of $100.0 million and recognized approximately $3.5 million in issuance costs in connection with the offering. On September 28, 2011, we entered into a $60.0 million Revolving Credit Agreement to support our liquidity needs during construction and to allow for the availability of previously restricted cash. We were able to release $18.7 million of restricted cash which was replaced with $17.8 million in letters of credit under the Revolving Credit Agreement. We intend to use the proceeds from the offering and availability under the credit facility, together with cash on hand, for the initial stages of construction of the new zinc facility in North Carolina and general corporate purposes including working capital needs, investment in business initiatives, capital expenditures and acquisitions.
On November 1, 2011, we acquired all of the outstanding shares of Zochem, a zinc oxide producer located in Brampton, Ontario Canada from Hudson Bay Mining and Smelting Co., Limited (“HudBay”) for a cash purchase price of $15.1 million. This acquisition will broaden the Company’s geographic reach, provide added operational flexibility and diversify our customers and markets for zinc oxide. We currently plan to continue to operate our zinc oxide production facilities in Monaca, Pennsylvania.
In June 2009, we grew our EAF dust collection operations through the purchase of ESOI’s customer contracts related to its EAF dust collection business.
On December 31, 2009, we purchased all of the issued and outstanding capital stock of INMETCO from Vale Inco Americas Inc. The acquisition of INMETCO enhanced our hazardous waste services platform and diversified our range of capabilities and products including the recycling of EAF dust and stainless steel flue dust for the recovery and reuse of a wide range of valuable metals. It expanded our industrial metals portfolio while leveraging our key strengths in hazardous waste management and high temperature metals recovery.
Economic Conditions and Outlook
We have seen much higher EAF dust receipt levels since the beginning of 2012 due in part to additional contracts entered into and due in part to stronger steel production in 2012 . We expect to operate all nine of our Waelz kilns through the first quarter of 2012. Oxide shipments since the start of 2012 have been stronger than expected at both oxide production facilities, reflecting some increase in market share and some strengthening of underlying market demand. Demand for zinc metal has also been outpacing 2011 levels thus far. In 2012, we are beginning to see evidence of strengthening of stainless steel production as tolling receipts have gradually increased. Nickel prices have also shown some recovery since the start of 2012.
During 2011, the economy continued to remain relatively weak. Our quarterly zinc product shipment levels for 2011 continued to improve over the quarterly shipment levels for 2010. Zinc oxide shipments in the second half of 2010, however, were affected by the refinery incident that occurred at our Monaca, Pennsylvania facility in July 2010. In 2011, we took several planned extended maintenance outages to refurbish kilns and some forced outages due to lower dust receipt levels at our recycling facilities during the third and fourth quarters.
Factors Affecting Our Operating Results
Market Price for Zinc and Nickel. Since we generate the substantial majority of our net sales from the sale of zinc and nickel-based products, our operating results depend heavily on the prevailing market price for zinc and nickel. Our principal raw materials are zinc extracted from recycled EAF dust, for which we receive revenue from the carbon steel mini-mill companies, and other zinc-bearing secondary materials (“purchased feedstock” or “purchased feed”) that we purchase from third parties. Costs to acquire and recycle EAF dust, which, during 2011, comprised approximately 74% of our raw materials at our Monaca, Pennsylvania facility, were not impacted significantly by fluctuations in the market price of zinc on the LME. However, the cost for the remaining portion of our raw materials is directly impacted by changes in the market price of zinc. The price of our finished products is impacted directly by changes in the market price of zinc and nickel, which can result in rapid and significant changes in our monthly revenues. Zinc prices experienced a period of general decline between 2000 and 2003, primarily due to increased exports from China and declines in global zinc consumption. During 2004, however, zinc prices began to recover, primarily due to increases in global zinc demand, including in China, and to declines in global production due to closed or permanently idled zinc mining and smelting capacity. Monthly average zinc prices rose throughout 2005 and 2006, then began a steady decline through 2008,
36
which was particularly sharp in the fourth quarter of 2008. Monthly average zinc prices began to gradually strengthen in 2009 and continued to strengthen throughout 2010 and through the first half of 2011; however, during the second half of 2011, the monthly average zinc prices began a steady decline which continued through the end of 2011.
Average monthly, daily and yearly LME zinc prices for the years 2004 through 2011 were as follows:
| | | | | | | | | | | | | | | | | | | | | | | | | | | | | | | | |
LME Zinc Prices | | 2004 | | | 2005 | | | 2006 | | | 2007 | | | 2008 | | | 2009 | | | 2010 | | | 2011 | |
Monthly Average | | | | | | | | | | | | | | | | | | | | | | | | | | | | | | | | |
High | | $ | 0.54 | | | $ | 0.83 | | | $ | 2.00 | | | $ | 1.74 | | | $ | 1.14 | | | $ | 1.08 | | | $ | 1.10 | | | $ | 1.12 | |
Low | | $ | 0.44 | | | $ | 0.54 | | | $ | 0.95 | | | $ | 1.07 | | | $ | 0.50 | | | $ | 0.50 | | | $ | 0.79 | | | $ | 0.84 | |
| | | | | | | | |
Daily High | | $ | 0.58 | | | $ | 0.86 | | | $ | 2.08 | | | $ | 1.93 | | | $ | 1.28 | | | $ | 1.17 | | | $ | 1.20 | | | $ | 1.15 | |
Daily Low | | $ | 0.43 | | | $ | 0.53 | | | $ | 0.87 | | | $ | 1.00 | | | $ | 0.47 | | | $ | 0.48 | | | $ | 0.72 | | | $ | 0.79 | |
Average per year | | $ | 0.48 | | | $ | 0.63 | | | $ | 1.48 | | | $ | 1.47 | | | $ | 0.85 | | | $ | 0.75 | | | $ | 0.98 | | | $ | 0.99 | |
In 2009, we purchased put options for 2010 for a financial hedge of approximately 100,000 tons of zinc, having a strike price of $0.65 per pound at a cost of $5.3 million. At the time of the purchase, the options represented approximately 80% of our anticipated sales volume for 2010. In 2010, we purchased put options for 2011 for a financial hedge of approximately 99,000 tons of zinc for 2011, having a strike price of $0.65 per pound, to mitigate the effects of decreases in the LME average zinc price. The purchases represented approximately 70% of our expected zinc production for 2011. We also sold put options for 2011 having a strike price of $0.55 per pound. The cost of the options purchased was $3.0 million and the proceeds from the options sold was $0.2 million.
At December 31, 2011, we have zinc put options with an $0.85 per pound strike price outstanding, which cover approximately 160,000 tons of zinc production, representing approximately 75% of the expected shipments for the period from January 2012 through June 2013. These put options are in place to provide protection to operating cash flow in the event that zinc prices decline below that level during the construction of the new zinc facility. In June 2011, we entered into hedge arrangements in which we bought put options with a strike price of $0.85 per pound, sold call options with a strike price of $1.20 per pound and bought call options with a strike price of $1.81 per pound. The value of these bought and sold positions resulted in a zero cash outlay. The hedges reduced our exposure to future declines in zinc prices below $0.85 per pound. We would not, however, have been able to participate in increased zinc prices beyond $1.20 per pound until the zinc price reached $1.81 per pound. The $1.81 per pound call options were bought in order to cap the potential collateral requirements surrounding these hedge arrangements. During the fourth quarter of 2011, with forward zinc prices lower than when the program was implemented, we bought back the $1.20 per pound sold call option positions at a cost of $15.7 million and realized a gain of $13.4 million. The repurchase of these $1.20 per pound call options effectively eliminated both the risk of a potential cash collateral requirement and the limitation to our profitability, in the event that zinc prices increase above the $1.20 per pound during that period. The zinc call options with a $1.81 per pound strike price continue to be held at December 31, 2011 but their value was negligible. For further discussion, see “Results from Operating Activities” in the “Liquidity and Capital Resources” section.
For 2010, LME average nickel prices ranged from $8.36 per pound to $11.81 per pound and averaged $9.89 per pound. For 2011, LME average nickel prices ranged from $7.68 per pound to $13.17 per pound and averaged $10.36 per pound.
Demand for Zinc and Nickel-Based Products. We generate revenue from the sale of zinc metal, zinc oxide, zinc- and copper-based powders, nickel-based products and services, as well as from the collection and recycling of EAF dust. Demand for our products and services decreased significantly in the fourth quarter of 2008 due to the severe economic slowdown and continued into the first quarter of 2009. Demand for our products began to increase in the second quarter of 2009 and has continued to increase through 2011. Our zinc equivalent production of zinc products at our Monaca, Pennsylvania facility for 2011 was 137,000 tons compared to 124,000 tons in 2010 and 106,000 tons for 2009.
Weekly steel industry capacity utilization declined to an average of approximately 60% for the fourth quarter of 2008 from a peak level of approximately 90% earlier in 2008. This decline continued through the first
37
quarter of 2009 thereby reducing the amount of EAF dust generated and the demand for our EAF dust recycling services. Steel production began to increase in the second quarter of 2009 and continued to increase through the second quarter of 2010 but leveled during the third and fourth quarters of 2010. Despite the increase, steel production continued to remain at reduced levels compared to 2008. In response to the sharp decline in 2008, we operated our recycling facilities below capacity for a majority of 2009. We restarted one of the kilns at our Rockwood, Tennessee facility in September of 2009 as steel production increased and we began processing the additional EAF dust associated with the customer contracts we purchased from ESOI in June of 2009. We restarted the second kiln at that facility in November of 2009. This brought our recycling operations to capacity, excluding our smallest and highest cost facility located in Beaumont, Texas. We do not intend to resume recycling operations at that facility and wrote down the assets to net realizable value in the third quarter of 2009. During the fourth quarter of 2011, we wrote off the remaining assets of the Beaumont, Texas facility as recycling has not resumed. We began operations at the first kiln at our Barnwell, South Carolina facility in April of 2010 and the second kiln in September of 2010. Weekly steel capacity utilization continued its general upward trend from 2010 through the first quarter of 2011 and has remained relatively constant in the mid 70% range throughout the remainder of 2011, thereby increasing the amount of EAF dust generated and the demand for our EAF dust recycling services.
The table below illustrates historical sales volumes and revenues for zinc and nickel-based products and EAF dust:
| | | | | | | | | | | | | | | | | | | | | | | | | | |
| | | Shipments/EAF Dust
Receipts | | | | | Revenue/Ton | |
| | | Year Ended
December 31, | | | | | Year Ended
December 31, | |
| | | 2011 | | | 2010 | | | 2009 | | | | | 2011 | | | 2010 | | | 2009 | |
| | | (Tons, in thousands) | | | | | (In U.S. dollars) | |
Product: | | | | | | | | | | | | | | | | | | | | | | | | | | |
Zinc Products | | | 152 | | | | 137 | | | | 118 | | | | | $ | 2,024 | | | $ | 1,976 | | | $ | 1,529 | |
EAF Dust | | | 528 | | | | 532 | | | | 409 | | | | | $ | 69 | | | $ | 74 | | | $ | 80 | |
Nickel-based products | | | 28 | | | | 27 | | | | 25 | | | | | $ | 1,930 | | | $ | 1,768 | | | $ | 1,453 | |
Cost of Sales (excluding depreciation and amortization). Our cost of producing zinc and nickel products consists principally of purchased feedstock, energy, maintenance and labor costs. In 2011, 2010 and 2009, our zinc related purchased feedstock costs comprised approximately 19% of our production costs. Purchased feed stock related costs are driven by the percentage of purchased feed used in the feed mix, the average LME zinc price and the price we pay for the purchased feed expressed as a percentage of the LME average zinc price. Purchased feedstock sells at a discount to the LME price of zinc. The remaining 81% of our zinc related production costs were conversion-related. A portion of our conversion costs do not change proportionally with changes in production volume. Consequently, as volume changes our conversion cost per ton changes inversely. Other components of cost of sales include transportation costs, as well as other manufacturing expenses. The main factors that influence our cost of sales as a percentage of net sales are fluctuations in zinc and nickel prices, production and shipment volumes, efficiencies, energy costs and our ability to implement cost control measures aimed at improving productivity.
We value our inventories using the weighted average actual cost method. Under this method, the cost of our purchased feedstock generally takes three to four months to flow through our cost of sales. In an environment of declining LME average zinc and nickel prices, our inventory cost can exceed the market value of our finished goods. A lower-of-cost-or-market (“LCM”) adjustment can result. In 2011, we recorded LCM adjustments during the third and fourth quarters totaling $0.8 million. No LCM adjustment was recorded in 2010. In the first quarter of 2009, we recorded an LCM adjustment of $2.8 million.
Selling, General and Administrative Expenses. Our selling, general and administrative expenses consist of all sales and marketing expenditures, as well as administrative overhead costs, such as salary and benefit costs for sales personnel and administrative staff, expenses related to the use and maintenance of administrative offices, costs associated with acquisitions, other administrative expenses, including expenses relating to logistics and information systems and legal and accounting expense, and other selling expenses, including travel costs.
38
Salary and benefit costs historically have comprised the largest single component of our selling, general and administrative expenses. Selling, general and administrative expenses as a percent of net sales historically have been impacted by changes in salary and benefit costs, as well as by changes in selling prices.
Refinery incident at our Monaca, Pennsylvania facility on July 22, 2010
On July 22, 2010, a refinery incident occurred at our Monaca, PA zinc oxide refining facility. The zinc refinery was shut down for repairs and an investigation and assessment of the damage. Each of the ten columns used to produce zinc oxide and refined zinc metal in the refining facility was redesigned and rebuilt. Production resumed in the fourth quarter of 2010.
The smelting facility at the Monaca plant was returned to full capacity late in the fourth quarter of 2010. Although it operated at a reduced rate during the third quarter, we were able to offset a portion of the lost revenue from zinc oxide with additional zinc metal sales beyond our traditional markets.
We pursued recovery of the cost of repairs, lost profit and other losses from our zinc oxide and refined metal, subject to customary deductibles, under our business interruption and property insurance. We submitted a claim totaling $33,831 and reached a final settlement in the amount of $29,614 in the first quarter of 2011. As of December 31, 2011, the entire insurance recoveries of $29,614 had been received in cash. See Footnote AA — Monaca, Pennsylvania Accident Insurance Recovery in our Audited Consolidated Financial Statements.
Trends Affecting Our Business
Our operating results are and will be influenced by a variety of factors, including:
| | Ÿ | | LME price of zinc and nickel; |
| | Ÿ | | changes in cost of energy and fuels; |
| | Ÿ | | gain and loss of customers; |
| | Ÿ | | pricing pressures from competitors, including new entrants into the EAF dust or nickel-bearing waste recycling markets; |
| | Ÿ | | increases and decreases in the use of zinc and nickel-based products; |
| | Ÿ | | expansions into new products and expansion of our capacity, which requires us to incur costs prior to generating revenues; |
| | Ÿ | | expenditures required to comply with environmental and other operational regulations; |
| | Ÿ | | access to credit by customers; and |
| | Ÿ | | our operational efficiency improvement programs. |
We have experienced fluctuations in our sales and operating profits in recent years due to fluctuations in zinc and energy prices. Historically, zinc prices have been extremely volatile, and we expect that volatility to continue. Changes in zinc pricing have impacted our sales revenues, since the prices of the products we sell are based primarily on LME zinc prices, and they have impacted our costs of production, since the prices of some of our feedstocks are based on LME zinc prices. Therefore, since a large portion of our sales and a portion of our costs are affected by the LME zinc price, we expect that changing zinc prices will continue to impact our operations and financial results in the future and any significant drop in zinc prices will negatively impact our results of operations. We employ various hedging instruments in an attempt to reduce the impact of decreases in the selling prices of a portion of our expected production.
Energy is one of our most significant costs. Our processes rely on electricity, coke and natural gas in order to operate. Our freight operations depend heavily on the availability of diesel fuel, and our Monaca power plant, which was temporarily idled in September 2011, used coal to generate electricity for our operations in that facility. Energy prices, particularly for coke and diesel fuel, have been volatile in recent years and currently exceed long-term historical averages. These fluctuations impact our manufacturing costs and contribute to earnings volatility. In September 2011, we entered into a new power purchase agreement to supply our electrical
39
power needs at our Monaca, Pennsylvania facility at rates lower than the cost at which we are currently able to produce power on-site, which led to our decision to idle our Monaca, Pennsylvania power plant in September 2011. The power plant was idled and will be maintained in such a manner so that if market conditions are strong after the power purchase agreement expires, we could restart and operate the power plant again.
The historically high zinc prices from 2006 into 2008 also made it attractive for new competitors to enter the EAF dust recycling market to compete for dust generated by existing EAF producers as well as new EAF capacity. The entry of new competitors could have an adverse impact on our price realization and market share from EAF dust recycling. For example, Steel Dust Recycling started up its Waelz kiln facility located in Alabama in 2008 and The Heritage Group built an EAF dust processing facility in Arkansas and began operations in 2009.
Our zinc products compete with other materials in many of their applications, and in some cases our customers may shift to new processes or products. For example, our zinc is used by steel fabricators in the hot dip galvanizing process, in which steel is coated with zinc in order to protect it from corrosion. Demand for our zinc as a galvanizing material may shift depending on how customers view the respective merits of hot dip galvanizing and paint. Our stainless steel customers face competition from producers of material containing lower levels of nickel, which could have an impact on the demand for our nickel-based products. Our ability to anticipate shifts in product usage and to produce new products to meet our current and future customers’ needs will significantly impact our operating results. We also face intense competition from regional, national and global providers of zinc based products, and the growth of any of those competitors could reduce our market share and negatively impact our operating results.
Finally, our business is subject to a wide variety of environmental and other regulations and our operations expose us to a wide variety of potential liabilities. Our total cost of environmental compliance at any time depends on a variety of regulatory, technical and factual issues, some of which cannot be anticipated. Changes in regulations and/or our failure to comply with existing regulations can result in significant capital expenditure requirements or penalties.
Summary of Critical Accounting Policies and Estimates
Our discussion and analysis of our financial condition and results of operations are based on our consolidated financial statements, which have been prepared in conformity with accounting principles generally accepted in the United States of America. Note B to the audited consolidated financial statements contained in this Annual Report on Form 10-K contains a summary of our significant accounting policies. Certain of these accounting policies are described below.
Inventories
Inventories, which consist primarily of zinc and nickel bearing materials, and supplies and spare parts, are valued at the lower of cost or market using a weighted average actual cost method. Raw materials are purchased, as well as produced from the processing of EAF dust. Supplies and spare parts inventory used in the production process are purchased. Work-in-process and finished goods inventories are valued based on the costs of raw materials plus applicable conversion costs, including depreciation and overhead costs relating to associated process facilities.
Zinc and nickel are traded as commodities on the LME and, accordingly, product inventories are subject to price fluctuations. When reviewing inventory for the lower of cost or market, we consider both the forward prices as quoted on the LME as of the reporting date and average LME price for the month ended in determining our estimate of net realizable value to determine if an adjustment is required. Our product revenues are based on the current or prior months’ LME average price. The LME average price upon which our product revenue is based has been reasonably correlated with the forward LME prices that we use to make the lower of cost or market adjustments.
Financial Instruments
The following methods are used to estimate the fair value of our financial instruments.
| | Ÿ | | Cash and cash equivalents, accounts receivable, notes payable due within one year, accounts payable and accrued expenses approximate their fair value due to the short-term nature of these instruments. |
40
| | Ÿ | | Our financial swap and financial option instruments are carried at fair value. We recognize changes in fair value within the consolidated statements of operations as they occur (see Note T – Accounting for Derivative Instruments and Hedging Activities in our audited consolidated financial statements). |
| | Ÿ | | Our Convertible Notes, issued on July 27, 2011, were initially valued at fair value and are currently carried at amortized cost (see Note N – Long Term Debt) |
We do not purchase, hold or sell derivative financial instruments unless we have an existing asset or obligation or anticipate a future activity that is likely to occur and will expose us to market risk. We use various strategies to manage our market risk, including the use of derivative instruments to limit, offset or reduce such risk. Derivative financial instruments are used to manage well-defined commodity price risks from our primary business activity.
The fair values of derivative instruments are based upon a comparison of our internal valuations to the valuations provided by third party counterparties with whom we have entered into substantially identical derivative contracts. We also compare their valuations to ensure that there is an acceptable level of consistency among them. The valuations utilize forward pricing and an implied volatility of the underlying commodity as well as interest rate forwards and are therefore subject to fluctuation based on the movements of the commodity markets.
We are exposed to credit loss in cases where counter-parties with which we have entered into derivative transactions are unable to pay us when they owe us funds as a result of agreements with them. To minimize the risk of such losses, the Company utilizes LME-registered contracts entered into with the London Clearing House for a majority of the contracts
Impairment
We review the carrying value of our intangible assets and our long-lived assets for impairment whenever events or circumstances indicate that the carrying amounts may not be recoverable.
In 2011, the Company recorded an impairment charge of $9.8 million related to the Monaca, Pennsylvania facility, to adjust the net book value of the assets as a result of the expected future start-up of the new zinc facility in North Carolina. The Company plans to close the smelting operation when the new zinc facility is commissioned but has not made any final decisions regarding other operations at the site. The net book value of the remaining assets of the Monaca, Pennsylvania facility was approximately $50 million at December 31, 2011. The Company will continue to evaluate the carrying values of these assets each quarter as the continued use of the assets is evaluated.
In 2009, we wrote-down to net realizable value certain machinery and equipment and supplies inventories by $1.1 million. The write-down related primarily to our Beaumont, Texas recycling facility. In the third quarter of 2009, we made a decision to proceed with the construction of our Barnwell, South Carolina kiln project, and we started operations there in 2010. The Waelz kiln process used at the Barnwell facility is a lower cost process than the process that was used at the Beaumont facility. Therefore, we do not intend to use the higher cost capacity at the Beaumont facility. In 2011, the remaining value of its machinery and equipment and supplies inventory was written off in the amount of $0.5 million.
We have no goodwill.
41
Results of Operations
The following table sets forth the percentages of sales that certain items of operating data constitute for the periods indicated.
| | | | | | | | | | | | |
| | | Year ended December 31, | |
| | | 2011 | | | 2010 | | | 2009 | |
Net sales | | | 100.0 | % | | | 100.0 | % | | | 100.0 | % |
Cost of sales (excluding depreciation and amortization) | | | 83.6 | | | | 79.9 | | | | 104.4 | |
Depreciation and amortization | | | 4.9 | | | | 4.8 | | | | 7.4 | |
Selling, general and administrative expenses | | | 5.1 | | | | 4.9 | | | | 7.9 | |
| | | | | | | | | | | | |
Income (loss) from operations | | | 6.4 | | | | 10.4 | | | | (19.7 | ) |
Interest expense | | | 0.7 | | | | 0.3 | | | | 1.1 | |
Gain on bargain purchase of business | | | 1.1 | | | | 0.0 | | | | 0.0 | |
Other income | | | 0.4 | | | | 0.2 | | | | 0.4 | |
| | | | | | | | | | | | |
Income (loss) before income taxes | | | 7.2 | | | | 10.3 | | | | (20.4 | ) |
Income tax provision (benefit) | | | 2.4 | | | | 3.8 | | | | (7.7 | ) |
| | | | | | | | | | | | |
Net income (loss) | | | 4.8 | % | | | 6.5 | % | | | (12.7 | )% |
| | | | | | | | | | | | |
Net income (loss) per share | | | | | | | | | | | | |
Basic | | $ | 0.49 | | | $ | 0.57 | | | $ | (0.73 | ) |
| | | | | | | | | | | | |
Diluted | | $ | 0.49 | | | $ | 0.57 | | | $ | (0.73 | ) |
| | | | | | | | | | | | |
The following table sets forth the activity and the fair values of our hedging instruments at the reporting dates.
| | | | | | | | | | | | | | | | | | | | | | | | | | | | |
| | | Put and Call Options Settlement Periods | | | | | | | |
| | | 2009 | | | 2010 | | | 2011 | | | 2012 | | | 2013 | | | Swaps | | | Total | |
Fair value December 31, 2008 | | $ | 6,846 | | | $ | — | | | $ | — | | | $ | — | | | $ | — | | | $ | 1,768 | | | $ | 8,614 | |
Settlements of closed positions | | | — | | | | — | | | | — | | | | — | | | | — | | | | 356 | | | | 356 | |
Gain (loss) on settlements of closed positions | | | (744 | ) | | | — | | | | — | | | | — | | | | — | | | | (256 | ) | | | (1,000 | ) |
Mark to market adjustment on open positions | | | (3,903 | ) | | | — | | | | — | | | | — | | | | — | | | | 284 | | | | (3,619 | ) |
| | | | | | | | | | | | | | | | | | | | | | | | | | | | |
Fair value March 31, 2009 | | | 2,199 | | | | — | | | | — | | | | — | | | | — | | | | 2,152 | | | | 4,351 | |
Settlements of closed positions | | | — | | | | — | | | | — | | | | — | | | | — | | | | (916 | ) | | | (916 | ) |
Gain (loss) on settlements of closed positions | | | (217 | ) | | | — | | | | — | | | | — | | | | — | | | | 411 | | | | 194 | |
Mark to market adjustment on open positions | | | (1,566 | ) | | | — | | | | — | | | | — | | | | — | | | | 446 | | | | (1,120 | ) |
| | | | | | | | | | | | | | | | | | | | | | | | | | | | |
Fair value June 30, 2009 | | | 416 | | | | — | | | | — | | | | — | | | | — | | | | 2,093 | | | | 2,509 | |
Purchases | | | — | | | | 2,374 | | | | — | | | | — | | | | — | | | | — | | | | 2,374 | |
Settlements of closed positions | | | — | | | | — | | | | — | | | | — | | | | — | | | | (1,260 | ) | | | (1,260 | ) |
Gain (loss) on settlements of closed positions | | | (51 | ) | | | — | | | | — | | | | — | | | | — | | | | 398 | | | | 347 | |
Mark to market adjustment on open positions | | | (364 | ) | | | (870 | ) | | | — | | | | — | | | | — | | | | 778 | | | | (456 | ) |
| | | | | | | | | | | | | | | | | | | | | | | | | | | | |
Fair value September 30, 2009 | | | 1 | | | | 1,504 | | | | — | | | | — | | | | — | | | | 2,009 | | | | 3,514 | |
Purchases | | | — | | | | 2,902 | | | | — | | | | — | | | | — | | | | — | | | | 2,902 | |
Settlements of closed positions | | | — | | | | — | | | | — | | | | — | | | | — | | | | (1,965 | ) | | | (1,965 | ) |
Gain (loss) on settlements of closed positions | | | (1 | ) | | | — | | | | — | | | | — | | | | — | | | | 616 | | | | 615 | |
Mark to market adjustment on open positions | | | — | | | | (3,669 | ) | | | — | | | | — | | | | — | | | | 497 | | | | (3,172 | ) |
| | | | | | | | | | | | | | | | | | | | | | | | | | | | |
42
| | | | | | | | | | | | | | | | | | | | | | | | | | | | |
Fair value December 31, 2009 | | | — | | | | 737 | | | | — | | | | — | | | | — | | | | 1,157 | | | | 1,894 | |
Purchases | | | — | | | | — | | | | — | | | | — | | | | — | | | | — | | | | — | |
Settlements of closed positions | | | — | | | | — | | | | — | | | | — | | | | — | | | | (228 | ) | | | (228 | ) |
Gain (loss) on settlements of closed positions | | | — | | | | — | | | | — | | | | — | | | | — | | | | (34 | ) | | | (34 | ) |
Mark to market adjustment on open positions | | | — | | | | (368 | ) | | | — | | | | — | | | | — | | | | 119 | | | | (249 | ) |
| | | | | | | | | | | | | | | | | | | | | | | | | | | | |
Fair value March 31, 2010 | | | — | | | | 369 | | | | — | | | | — | | | | — | | | | 1,014 | | | | 1,383 | |
Purchases | | | — | | | | — | | | | 882 | | | | — | | | | — | | | | — | | | | 882 | |
Settlements of closed positions | | | — | | | | — | | | | — | | | | — | | | | — | | | | (74 | ) | | | (74 | ) |
Gain (loss) on settlements of closed positions | | | — | | | | (1 | ) | | | — | | | | — | | | | — | | | | (209 | ) | | | (210 | ) |
Mark to market adjustment on open positions | | | — | | | | 813 | | | | 1,441 | | | | — | | | | — | | | | (616 | ) | | | 1,638 | |
| | | | | | | | | | | | | | | | | | | | | | | | | | | | |
Fair value June 30, 2010 | | | — | | | | 1,181 | | | | 2,323 | | | | — | | | | — | | | | 115 | | | | 3,619 | |
Purchases | | | — | | | | — | | | | 1,307 | | | | — | | | | — | | | | — | | | | 1,307 | |
Settlements of closed positions | | | — | | | | — | | | | — | | | | — | | | | — | | | | (439 | ) | | | (439 | ) |
Gain (loss) on settlements of closed positions | | | — | | | | (214 | ) | | | — | | | | — | | | | — | | | | 452 | | | | 238 | |
Mark to market adjustment on open positions | | | — | | | | (962 | ) | | | (2,668 | ) | | | — | | | | — | | | | 461 | | | | (3,169 | ) |
| | | | | | | | | | | | | | | | | | | | | | | | | | | | |
Fair value September 30, 2010 | | | — | | | | 5 | | | | 962 | | | | — | | | | — | | | | 589 | | | | 1,556 | |
Purchases | | | — | | | | — | | | | 585 | | | | — | | | | — | | | | — | | | | 585 | |
Settlements of closed positions | | | — | | | | — | | | | — | | | | — | | | | — | | | | 233 | | | | 233 | |
Gain (loss) on settlements of closed positions | | | — | | | | (5 | ) | | | — | | | | — | | | | — | | | | (532 | ) | | | (537 | ) |
Mark to market adjustment on open positions | | | — | | | | — | | | | (968 | ) | | | — | | | | — | | | | 115 | | | | (853 | ) |
| | | | | | | | | | | | | | | | | | | | | | | | | | | | |
Fair value December 31, 2010 | | | — | | | | — | | | | 579 | | | | — | | | | — | | | | 405 | | | | 984 | |
Purchases | | | — | | | | — | | | | — | | | | — | | | | — | | | | — | | | | — | |
Settlements of closed positions | | | — | | | | — | | | | — | | | | — | | | | — | | | | (225 | ) | | | (225 | ) |
Gain (loss) on settlements of closed positions | | | — | | | | — | | | | (1 | ) | | | — | | | | — | | | | (109 | ) | | | (110 | ) |
Mark to market adjustment on open positions | | | — | | | | — | | | | (427 | ) | | | — | | | | — | | | | (34 | ) | | | (461 | ) |
| | | | | | | | | | | | | | | | | | | | | | | | | | | | |
Fair value March 31, 2011 | | | — | | | | — | | | | 151 | | | | — | | | | — | | | | 37 | | | | 188 | |
Purchases | | | — | | | | — | | | | — | | | | * | | | | * | | | | — | | | | — | |
Settlements of closed positions | | | — | | | | — | | | | — | | | | — | | | | — | | | | (135 | ) | | | (135 | ) |
Gain (loss) on settlements of closed positions | | | — | | | | — | | | | — | | | | — | | | | — | | | | 69 | | | | 69 | |
Mark to market adjustment on open positions | | | — | | | | — | �� | | | (117 | ) | | | (10,288 | ) | | | (4,931 | ) | | | 963 | | | | (14,373 | ) |
| | | | | | | | | | | | | | | | | | | | | | | | | | | | |
Fair value June 30, 2011 | | | — | | | | — | | | | 34 | | | | (10,288 | ) | | | (4,931 | ) | | | 934 | | | | (14,251 | ) |
Purchases | | | — | | | | — | | | | — | | | | — | | | | — | | | | — | | | | — | |
Settlements of closed positions | | | — | | | | — | | | | — | | | | — | | | | — | | | | (360 | ) | | | (360 | ) |
Gain (loss) on settlements of closed positions | | | — | | | | — | | | | — | | | | — | | | | — | | | | (196 | ) | | | (196 | ) |
Mark to market adjustment on open positions | | | — | | | | — | | | | 38 | | | | 25,834 | | | | 13,148 | | | | (12 | ) | | | 39,008 | |
| | | | | | | | | | | | | | | | | | | | | | | | | | | | |
Fair value September 30, 2011 | | | — | | | | — | | | | 72 | | | | 15,546 | | | | 8,217 | | | | 366 | | | | 24,201 | |
Purchases | | | — | | | | — | | | | — | | | | 7,835 | | | | 7,908 | | | | 32 | | | | 15,775 | |
Settlements of closed positions | | | — | | | | — | | | | — | | | | — | | | | — | | | | (69 | ) | | | (69 | ) |
Gain (loss) on settlements of closed positions | | | — | | | | — | | | | (72 | ) | | | (3,404 | ) | | | (2,281 | ) | | | (270 | ) | | | (6,027 | ) |
Mark to market adjustment on open positions | | | — | | | | — | | | | — | | | | (2,254 | ) | | | (141 | ) | | | (1,029 | ) | | | (3,424 | ) |
| | | | | | | | | | | | | | | | | | | | | | | | | | | | |
Fair value December 31, 2011 | | $ | — | | | $ | — | | | $ | — | | | $ | 17,723 | | | $ | 13,703 | | | $ | (970 | ) | | $ | 30,456 | |
| | | | | | | | | | | | | | | | | | | | | | | | | | | | |
| * | Put and call options were purchased and call options were sold having a net zero cash outlay |
A significant portion of our zinc oxide shipments are priced based on prior months’ LME average zinc price. Consequently, changes in the LME average zinc price are not fully realized until subsequent periods. The LME average zinc prices for the most recent eight quarters and the average LME zinc prices for the year to date as of the end of each quarter are listed in the table below:
| | | | | | | | | | | | | | | | | | | | | | | | | | | | | | | | | | | | | | | | |
| | | 2010 | | 2011 |
Average LME zinc price | | Quarter ended | | Quarter ended |
| | March 31 | | June 30 | | September 30 | | December 31 | | March 31 | | June 30 | | September 30 | | December 31 |
Quarter | | | $ | 1.04 | | | | $ | 0.92 | | | | $ | 0.91 | | | | $ | 1.05 | | | | $ | 1.09 | | | | $ | 1.02 | | | | $ | 1.01 | | | | $ | 0.86 | |
Year-to-date | | | $ | 1.04 | | | | $ | 0.98 | | | | $ | 0.96 | | | | $ | 0.98 | | | | $ | 1.09 | | | | $ | 1.05 | | | | $ | 1.04 | | | | $ | 0.99 | |
43
Year Ended December 31, 2011 Compared with Year Ended December 31, 2010
Consolidated net sales. Consolidated net sales increased $68.8 million, or 18.0%, to $451.2 million for 2011 compared to $382.4 million for 2010. Net sales for 2011 includes net realized gains of $13.4 million related to the purchase of previously sold call positions and net unrealized gains of $0.3 million related to other hedging activities. Net sales for 2010 include $3.7 million of net unrealized losses relating to hedging activities. Excluding the net adjustments related to hedging activities, consolidated net sales increased $51.4 million, or 13.3%, to $437.5 million in 2011 from $386.1 million for 2010. The increase includes a $43.1 million increase in net sales for Zinc products and services (“Zinc”) and $8.3 million increase in Nickel products and services (“Nickel”). Zinc net sales include the sales of Zochem, which was acquired on November 1, 2011, for the two month period ending December 31, 2011.
Consolidated cost of sales (excluding depreciation and amortization). Consolidated cost of sales increased $71.9 million, or 23.5%, to $377.4 million for 2011 compared to $305.5 million for 2010. Zinc cost of sales for 2011 and 2010 include benefits from business interruption and property damage insurance recoveries, net of additional cost of repairs and clean-up, of $9.4 million and $12.5 million, respectively. Cost of sales for 2011 also includes an impairment charge of $9.8 million related to the Monaca, Pennsylvania facility. Excluding the additional costs and insurance recoveries associated with the refinery incident, and the impairment charge, cost of sales increased $59.0 million, or 18.6%, to $377.0 million for 2011 from $318.0 million for 2010. The increase includes a $55.0 million increase in Zinc cost of sales and a $4.0 million increase in Nickel cost of sales.
Consolidated depreciation and amortization. Consolidated depreciation and amortization increased $3.4 million, or 18.3% to $22.0 million for 2011 compared to $18.6 million for 2010. The increase primarily reflects an entire year of depreciation on the Barnwell facility, which began operations in April 2010 and increased depreciation by $2.1 million in 2011.
Consolidated selling, general and administrative expenses. Consolidated selling, general and administrative expenses increased $4.3 million, or 22.9% to $22.9 million for 2011 compared to $18.7 million for 2010. The increase primarily reflects increases of $1.5 million in labor costs of which $1.0 million relates to non cash stock based compensation expense, acquisition related costs of $1.0 million, $0.7 million in bad debt expense due to net recoveries of $292 in 2010 and related adjustments to the reserve and the inclusion of two months of selling, general and administrative costs for Zochem which was acquired on November 1, 2011.
Consolidated other income (expense). Consolidated other income (expense) increased $3.9 million, on a net basis, to $3.5 million of income in 2011 compared to $(0.4) million expense in 2010. Other income (expense) for 2011 includes a $4.9 million in gain on bargain purchase related to the acquisition of Zochem. Interest expense increased $2.1 million, net of capitalized interest of $0.6 million, primarily related to the Convertible Notes issued on July 27, 2011, which was offset by an increase in interest and other income of $1.1 million.
Consolidated income tax provision. Consolidated income tax provision was $10.9 million for 2011 compared to $14.4 million for 2010. Our effective tax rate for 2011 was 33.7% compared to 36.8% for 2010. The decrease in the effective rate is primarily due to the gain on bargain purchase of a business which is not taxable under Canadian tax law.
Consolidated net income. For the reasons stated above, our net income was $21.5 million for 2011, compared to net income of $24.8 million for 2011.
Business Segments
Zinc Products and Services (“Zinc”)
Net sales. Net sales increased $60.5 million, or 18.4%, to $388.7 million for 2011 from $328.2 million in 2010. The increase was a result of a $30.4 million increase in sales volume reflecting a net increase in shipments and the inclusion of two months of net sales from Zochem which was acquired on November 1, 2011, a $5.9 million increase in price realization, $7.7 million in net sales related to the sale of excess coal due to the temporary idling of the power plant in September 2011, offset by a decrease in co-product and miscellaneous sales of $0.9 million. Hedging activities increased net sales by $17.4 million in 2011 compared to 2010. In 2011,
44
we recorded a realized gain of $13.4 million related to the purchase of previously sold call positions and $0.3 million in unrealized gains from other hedging activities compared to an unrealized loss of $3.7 million in 2010.
Zinc product shipments were 151,997 tons for 2011, or 139,515 tons on a zinc contained basis, compared to 136,661 tons, or 126,720 tons on a zinc contained basis, for 2010. The average sales price realization for zinc products on a zinc contained basis, was $1.10 per pound compared to $1.07 per pound for 2010. The increase is primarily the result of a higher percentage of zinc oxide sales on a zinc contained basis in 2011 compared to 2010. Zinc oxide premiums on a zinc contained basis generally result in higher sales price realization per pound than zinc metal.
Net sales of zinc metal increased $10.5 million, or 6.1% to $181.7 million for 2011 from $171.2 million for 2010. The increase was primarily attributable to a $4.6 million increase in sales volume and a $5.9 million increase in price realization. The increase in price realization is due to an increase in the zinc metal premiums to the LME for 2011 compared to 2010, despite a relatively flat LME zinc price for 2011 as compared to 2010. Zinc metal premiums in 2010 were lower due to exported zinc metal during the second half of 2010, which was at a lower premium. We increased our shipments, in the second half of 2010 beyond our traditional markets, which sold at a price discount to the LME to partially offset the loss of zinc oxide shipments resulting from the refinery incident that occurred in late July 2010 at our zinc oxide refining facility in Monaca, Pennsylvania.
Net sales of zinc oxide increased $25.9 million, or 26.8%, to $122.5 million for 2011 from $96.6 million for 2010. The increase was primarily due to a $24.7 million increase in sales volume and a $1.2 million increase in price realization. The increase in volume reflects the inclusion of two months of sales from Zochem and the increase in shipments compared to 2010, which was affected by the incident that occurred at the Monaca, Pennsylvania facility in July 2010 which reduced shipment volumes in the third and fourth quarters of 2010.
Net sales of zinc and copper based powders increased $2.5 million, or 17.4%, to $16.9 million in 2011 from $14.4 million for 2010. The increase was attributable to a $1.3 million increase in shipment volume and $1.2 million increase in price realization. The increase in shipment volume was attributable to our zinc-based powders and the increase in price realization was primarily attributable to our copper-based powders.
Revenues from EAF dust recycling decreased $2.8 million, or 7.1%, to $36.6 million in 2011 from $39.4 million in 2010. The decrease was primarily attributable to a decrease in price realization of 6.4% which reduced revenues by $2.5 million. EAF dust receipts decreased 0.7% to 528,066 tons in 2011 compared to 531,714 tons in 2010.
Cost of sales (excluding depreciation and amortization). Cost of sales increased $67.9 million, or 25%, to $340.0 million in 2011 from $272.1 million in 2010.
The cost of zinc material and other zinc related products sold increased $67.8 million, 27.3%, to $315.8 million in 2011 from $248.0 million in 2010. The increase, which also included two months of operations for Zochem, was primarily due to an increase of $28.1 million in shipment volume, a $12.8 million increase in the cost of products shipped, $9.4 million related to the sale of excess coal due to the temporary idling of the Monaca power plant in September 2011 and a $9.8 million initial impairment charges related to the Monaca facility. This increase was offset by a decrease in other costs of $1.3 million which is primarily related to a reduction in costs related to the Monaca power plant which was temporarily idled in September 2011. Cost of sales for 2011 and 2010 include $10.3 million and $19.3 million, respectively, related to insurance recoveries from the refinery incident that occurred at the Monaca facility in July 2010. Conversion costs for 2011 reflect an increase in production levels of 10.9% compared to 2010. In addition to the increase in production volume, energy costs increased $15.8 million, the majority of which resulted from an increase in the cost of coke. Labor costs increased $10.5 million, which reflects the increase in production and includes a one time charge of approximately $2.3 million related to signing bonuses for several union contract renewals which occurred during 2011. Additionally, maintenance costs increased $1.8 million and services increased $2.9 million. The conversion cost increases were compounded by an increase in purchased feed costs of $5.4 million in 2011 compared to 2010. The cost of purchased feed expressed as a percentage of the LME remained relatively the same for both 2011 and 2010.
45
The cost of EAF dust services increased $0.1 million, or 0.4%, to $24.1 million in 2011 from $24.0 million in 2010. The increase primarily reflects an increase in transportation costs of $0.3 million offset by decrease of $0.2 million in volume. Cost per ton remained relatively flat for 2011 as compared to 2010.
Income before income taxes. For the reasons stated above, income before income taxes, which includes a net benefit of $9.3 million for 2011 and a net benefit of $12.3 million for 2010, related to insurance recoveries less additional costs associated with the refinery incident at our Monaca facility, decreased $7.8 million, or 31.8%, to $16.7 million in 2011 from $24.5 million in 2010. Excluding the insurance recoveries and additional costs, income before income taxes decreased $8.0 million to $4.5 million for 2011.
Nickel Products and Services (“Nickel”)
Net sales. Net sales increased $8.3 million, or 15.4%, to $62.5 million in 2011 from $54.2 million in 2010. The increase was primarily a result of a $2.7 million increase related to higher product shipment volume and a $4.5 million increase from higher price realization, including a net gain from hedging activities of $0.9 million in 2011 compared with 2010. A higher LME average nickel price for 2011 compared with 2010 was the primary reason for the higher price realization.
Cost of sales (excluding depreciation and amortization). Cost of sales increased approximately $4.0 million, or 11.9%, to $38.4 million in 2011 from $34.4 million in 2010. The increase was primarily due to an increase of $1.1 million due to higher product shipment volume and an increase of $2.5 million in the cost of product shipped. The principal reason for the increase in the cost of product shipped in 2011 compared with 2010 was higher purchased raw material costs resulting from a higher LME average nickel price.
Income before income taxes. For the reasons stated above, income before income taxes, increased $4.2 million, or 29.3%, to 18.6 million in 2011 from $14.4 million for 2010.
Year Ended December 31, 2010 Compared with Year Ended December 31, 2009
Net sales. Consolidated net sales increased $165.9 million, or 76.6%, to $382.4 million for 2010, compared to $216.5 million for 2009. The increase includes a $111.7 million increase in net sales for Zinc and $54.2 million in net sales related to Nickel.
Net sales relating to Zinc increased $111.7 million, or 51.6%, to $328.2 million for 2010, compared to $216.5 million for 2009. The increase was a result of a $61.1 million increase in price realization, due primarily to a higher average LME zinc price for 2010 versus 2009, a $40.5 million increase in sales volume reflecting a net increase in shipments and an increase in EAF dust receipts and a $1.8 million increase in our co-product and miscellaneous sales. Our net sales for 2010 further exceeded net sales for 2009 by $8.3 million relating to our hedging activity. We recorded an unfavorable non-cash adjustment of $3.7 million in 2010 relating to our hedging activity versus an unfavorable non-cash adjustment of $12.0 million in 2009. Zinc product shipments were 136,661 tons for 2010, or 126,720 tons on a zinc contained basis, compared to 118,242 tons, or 107,470 tons on a zinc contained basis, for 2009.
The average sales price realization for zinc products on a zinc contained basis, excluding the effects from the non-cash mark to market adjustments of our open hedge positions, was $1.07 per pound for 2010, compared to $0.84 per pound for 2009. The increase reflects the 30.1% increase in the average LME zinc price for 2010 compared to 2009. The increase in zinc prices reflects the general economic recovery that began in 2009 and continued into 2010, as well as continued investor activity in the metal markets.
Net sales of zinc metal increased $71.8 million, or 72.2%, to $171.2 million for 2010, compared to $99.4 million for 2009. The increase was attributable primarily to a $36.7 million increase in price realization and a $35.1 million increase in sales volume. The increase in price realization was attributable to a higher average LME zinc price for 2010 versus 2009, partially offset by the effects of a decrease in the average premium to the LME on zinc metal sold for 2010 versus 2009. The increase in shipment volume reflects the gradual improvement in demand for our products that began in the second quarter of 2009 and continued throughout 2010. It also reflects our efforts to increase shipments of zinc metal beyond our traditional markets to partially offset the loss of zinc oxide shipments in the third and fourth quarters of 2010 resulting from the refinery incident that occurred in late July 2010 at our zinc oxide refining facility in Monaca, Pennsylvania.
46
Net sales of zinc oxide increased $17.0 million, or 21.4%, to $96.6 million for 2010, compared to $79.6 million for 2009. The increase was attributable to a $23.1 million increase in price realization partially offset by a $6.1 million decrease in sales volume. The increase in price realization reflects the increase of the average LME zinc prices over the past twelve months partially offset by the lag effect of pricing a majority of our zinc oxide shipments on prior months’ average LME zinc prices. The discount to the LME on sales of zinc oxide decreased in 2010 from the discount realized in 2009. The volume decrease reflects the reduced shipment volumes in the third and fourth quarters of 2010 as a result of the refinery incident at our zinc oxide refining facility in Monaca, Pennsylvania in late July of 2010. Shipments to our largest tire customers increased in the first two quarters of 2010 reflecting the strengthening in the market that began in the second quarter of 2009 and continued into 2010. However, we were unable to fully capitalize on the improving zinc oxide market in 2010 as a result of the explosion.
Net sales of zinc and copper-based powder increased $6.1 million, or 73.5%, to $14.4 million for 2010, compared to $8.3 million for 2009. The increase was attributable primarily to increases in prices and shipment volumes of our copper-based powders.
Revenues from EAF dust recycling increased $6.8 million, or 20.9%, to $39.4 million for 2010, compared to $32.6 million for 2009. Increased volumes caused revenues to increase by $9.8 million. A 7.0% decrease in price realization on EAF dust recycling fees for 2010 compared to 2009 resulted in a decrease in net sales of $3.0 million. EAF dust receipts for 2010 increased 30.0% to 531,714 tons compared to 408,967 tons for 2009, reflecting the increase in volume associated with the purchase of the customer contracts from ESOI in June 2009, the startup of our new recycling facility at Barnwell, South Carolina in 2010 and the increase in steel production that began in the second quarter of 2009 and continued into 2010. According to data from the American Iron & Steel Institute, reported steel production for 2010 increased 27.5% from 2009.
Cost of sales (excluding depreciation and amortization). Consolidated cost of sales increased $79.3 million, or 35.1%, to $305.5 million for 2010, compared to $226.2 million for 2009. The increase includes a $45.9 million increase in cost of sales for Zinc and $33.4 million in cost of sales related to Nickel. Cost of sales for 2010 also includes a benefit from business interruption and property damage insurance recoveries totaling $19.3 million partially offset by additional costs of repairs and clean-up totaling $6.8 million relating to the explosion at our Monaca refinery. As a percentage of consolidated net sales, consolidated cost of sales was 79.9% for 2010, compared to 104.4% for 2009.
Cost of sales related to Zinc, excluding the additional costs and insurance recoveries associated with the explosion, increased $58.3 million, or 25.8%, to $284.5 million for 2010, compared to $226.2 million for 2009. As a percentage of net sales related to Zinc excluding the additional insurance and explosion related items, cost of sales was 86.7% for 2010, compared to 104.4% for 2009. The change in percentage reflects the net effect of changes in the average LME zinc prices on our net sales and cost of sales. Changes in the average LME zinc price are restricted to the purchased feed component of our cost of sales; therefore any changes in the average LME zinc price have a smaller effect on our cost of sales than on our net sales. The change in percentage also reflects the effect of increased production on our cost per ton.
The cost of zinc material and other products sold increased $49.7 million, or 23.6% to $267.3 million for 2010, compared to $210.6 million for 2009. The increase was primarily the result of a net $27.5 million increase in shipment volume, a $29.9 million increase in the cost of products shipped and a $7.7 million decrease in recycling and other costs. The increases reflect higher feed costs and higher conversion costs for 2010 compared to 2009. Purchased feed costs increased by $17.8 million, reflecting both the higher LME average zinc price as well as a slightly increased cost of purchased feeds we pay expressed as a percentage of the LME average zinc price. The increase in our purchased feed costs also reflects a 11.0% increase in the number of tons of purchased feed consumed. The cost of zinc material and other products sold for 2010 included property and workers’ compensation insurance deductibles relating to the refinery incident at our zinc oxide refining facility in late July 2010. Our costs for 2009 include a $1.0 million write-down of certain machinery and equipment and supplies inventories primarily at our Beaumont, Texas recycling facility.
Our conversion costs were $30.8 million higher in 2010 than in 2009. The increase reflects a $18.2 million increase in energy costs, the majority of which resulted from an increase in the cost of coke, a $4.8 million
47
increase in labor costs, a $5.8 million increase in maintenance and supplies costs and the startup of the new recycling facility in Barnwell, South Carolina. These increases were driven primarily by higher production levels for 2010 as compared to 2009 in response to the gradual economic recovery that began late in 2009 and continued into 2010.
The cost of EAF dust services increased $8.5 million, or 54.8%, to $24.0 million for 2010, compared to $15.5 million for 2009 primarily reflecting an increased volume of EAF dust received and an increase in transportation costs.
Depreciation and amortization. Consolidated depreciation and amortization expense increased $2.6 million, or 16.5%, to $18.6 million for 2010, compared to $16.0 million for 2009. The increase reflects increased capital expenditures during the twelve months ended December 31, 2010.
Selling, general and administrative expenses. Selling, general and administrative expenses increased $1.6 million to $18.7 million for 2010, compared to $17.1 million for 2009. Zinc related costs decreased $1.2 million reflecting primarily a decrease in bad debt expense of $1.6 million and a decrease in legal and professional services of $1.4 million partially offset by an increase in labor and benefit costs of $1.4 million. The decrease in bad debt expense reflects higher bad debt write-offs in 2009 coupled with bad debt recoveries in 2010. The decrease in legal and professional fees reflects legal and professional fees of approximately $1.0 million included in 2009 expenses relating to acquisition activity in 2009. Selling, general and administrative expenses relating to Nickel were $2.8 million.
Interest expense. Interest expense decreased $1.1 million to $1.2 million for 2010, compared to $2.3 million for 2009. The decrease largely reflects a $1.5 million reduction in expenses related to the credit facility we cancelled in December, 2009, partially offset by a $0.5 million increase in accretion expense associated with the liability we incurred to purchase the ESOI EAF dust contracts in June of 2009.
Income tax provision (benefit). Our income tax provision was $14.4 million for 2010, compared to a benefit of $(16.7) million for 2009. Our effective tax rates for 2010 and 2009 were 36.8% and 37.8% respectively.
Net income. For the reasons stated above, our net income was $24.8 million for 2010, compared to a net loss of ($27.5) million for 2009.
Liquidity and Capital Resources
We finance our operations, capital expenditures and debt service primarily with funds generated by our operations. We believe the combination of our cash balance, which includes proceeds from the issuance of the Convertible Notes, availability under the Revolving Credit Agreement, our cost reduction initiatives, our hedging positions and our cash generated from operations, will be sufficient to satisfy our liquidity and capital requirements, including capital requirements related to the construction of the new zinc facility, for the next twelve months. We are currently pursuing additional financing options for the construction of the new zinc facility. Although we believe we could obtain additional credit and reduce our capital requirements if necessary, our ability to do so may be affected by industry factors, including LME zinc prices, and by general economic, financial, competitive, legislative, regulatory and other factors discussed in this report, or in material incorporated herein by reference.
Our balance of cash and cash equivalents at December 31, 2011, excluding $2.5 million of restricted cash, was $188.5 million, a $78.9 million increase from the December 31, 2010 balance of $109.6 million. Cash and cash equivalent are held in three US banks and one Canadian bank.
Our cash is not restricted with the exception of $2.5 million related to the financial assurance with the ESOI customer contracts purchased by us in 2009, which are described in Footnote Q – Other Long Term Liabilities found in our audited financial statements included in this report.
Total capital expenditures for the construction of the new zinc facility are currently estimated to range from $350 million to $375 million. During the third quarter of 2011, we announced that the new zinc plant will be constructed in Rutherford County, North Carolina. As of December 31, 2011, site clearing and grading has been
48
completed, detailed engineering is underway and long-lead time equipment is being ordered. We anticipate that construction of the plant will be completed and start-up will begin in the third quarter of 2013. We have spent approximately $42 million on this project through the end of 2011. We continue to develop financing alternatives for the balance of the capital that may be needed to complete the project. Capital expenditures for 2012 are estimated to be approximately $207 million, which includes $192 million related to the new zinc facility.
At December 31, 2011, we have zinc put options with an $0.85 per pound strike price outstanding, which cover approximately 160,000 tons of zinc production, representing approximately 75% of the expected shipments for the period from January 2012 through June 2013. These put options are in place to provide protection to operating cash flow in the event that zinc prices decline below that level during the construction of the new zinc facility. In June 2011, we entered into hedge arrangements in which we bought put options with a strike price of $0.85 per pound, sold call options with a strike price of $1.20 per pound and bought call options with a strike price of $1.81 per pound. The value of these bought and sold positions resulted in a zero cash outlay. The hedges reduced our exposure to future declines in zinc prices below $0.85 per pound. We would not, however, have been able to participate in increased zinc prices beyond $1.20 per pound until the zinc price reached $1.81 per pound. As a result of these hedges, we were subject to potential margin calls if the forward zinc prices increased prior to settlement. In the event of a margin call, unsecured credit provided by our clearing agent would apply first. After the use of the credit that they provided, we would be required to put cash on deposit with the clearing agent as security for eventual settlement of the hedge positions. This deposit would be classified as a restricted asset. The $1.81 per pound call options were bought in order to cap the potential collateral requirements surrounding these hedge arrangements. During the fourth quarter of 2011, with forward zinc prices lower than when the program was implemented, we bought back the $1.20 per pound sold call option positions at a cost of $15.7 million and realized a gain of $13.4 million. The repurchase of these $1.20 per pound call options effectively eliminated both the risk of a potential cash collateral requirement and the limitation to our profitability in the event that zinc prices increase above the $1.20 per pound during that period. The zinc call options with a $1.81 per pound strike price continue to be held at December 31, 2011 but their value was negligible.
On July 27, 2011, we issued $100.0 million in principal amount of the Convertible Notes in a private placement. We received proceeds of $100.0 million and recognized approximately $3.5 million in issuance costs in connection with the offering.
On September 28, 2011, we entered into a $60.0 million Revolving Credit Agreement to support liquidity needs during construction of the new zinc facility and to allow for the availability of previously restricted cash. At December 31, 2011, we had $17.8 million in letters of credit outstanding under the Revolving Credit Agreement which had previously been collateralized with restricted cash. At December 31, 2011, there were no outstanding borrowings under the Revolving Credit Agreement and undrawn availability was $30.3 million at December 31, 2011. We recognized $0.4 million in issuance costs in connection with the Revolving Credit Agreement.
Cash Flows from Operating Activities
Our operations provided a net $36.6 million of cash in 2011. The cash flows generated reflect the operating performance in 2011, insurance proceeds of $10.3 million from the refinery incident at our Monaca facility in July 2010 and a $4.0 million income tax refund offset by a use of $15.7 million relating to hedging activities.
Our investment in working capital increased $90.8 million to $260.9 million at December 31, 2011 compared to $170.1 million at December 31, 2010. The increase includes net proceeds of $96.5 million from the issuance of the Convertible Notes in July 2011, $10.3 million relating to the final insurance settlement relating to the incident at our refinery in Monaca, Pennsylvania, the release of $23.9 million of restricted cash into operating cash and the addition of the Zochem working capital. These increases were offset by a use of $15.7 million relating to the purchase of $1.20 per pound hedge positions and $15.1 million related to the acquisition of Zochem. The increase in prepaid expenses and other current assets relate primarily to the current portion of the purchase of put and call options in June 2011 which were entered into to protect our cash flow during construction of the new zinc facility.
49
Cash Flows from Investing Activities
Capital expenditures were $64.7 million for 2011, of which $42.0 million related to the construction of the new zinc facility. We acquired Zochem on November 1, 2011 for a purchase price of $15.1 million.
During the first quarter of 2011, restricted cash totaling $2.5 million was released from escrow, $1.5 million was related to reduced collateral requirements under the ESOI purchase agreement and $1.0 million was the final amount to be received under the provisions of the New Market Tax Credit Program (“NMTC”) related to the financing and development of the Barnwell site. During the third quarter of 2011, restricted cash totaling $21.4 million was released from escrow, $2.7 million of which related to collateralization for a letter of credit required for a closure bond for one of our Pennsylvania facilities which was replaced with a surety bond; the remaining $18.7 million related to letters of credit collateralized by restricted cash which are now outstanding under the Revolving Credit Agreement.
Cash Flows from Financing Activities
Cash provided by financing activities was $98.2 million for 2011 and consisted primarily of proceeds of $100.0 million from the issuance of the Convertible Notes and $2.4 million from the exercise of 181,500 stock options. Cash used in financing activities of $3.9 million related to issuance costs for the Convertible Notes and Revolving Credit Agreement.
Year Ended December 31, 2010
Our balance of cash and cash equivalents at December 31, 2010, excluding $26.4 million of restricted cash, was $109.6 million, a $14.1 million increase from the December 31, 2009 balance of $95.5 million. Cash and cash equivalents are held in three U.S. banks. In 2009 we invested in certificates of deposit and other short term investments. The funds invested in certificates of deposit on December 31, 2009 matured in January 2010 and were invested in a money market demand account and subsequently transferred to our cash account. We re-invested $25.0 million in a money market demand account in October 2010. The funds we had invested in the government money market fund on December 31, 2009 matured in January 2010.
Cash Flows from Operating Activities
Our operations provided a net $57.3 million in cash in 2010, reflecting the gradual improvement in the overall economy as well as the generally higher LME average prices of zinc and nickel during the period. The improving economy and the higher LME average prices for zinc and nickel also contributed to the increase in accounts receivable and inventory during the period.
Our investment in working capital was $170.1 million at December 31, 2010 and $143.5 million at December 31, 2009. The increase includes $19.3 million in undisputed claims for business interruption and property damage insurance relating to the incident at our refinery in Monaca, PA. We received cash payments of $11.0 million in 2010 relating to the claims with the remaining $8.3 million included in our accounts receivable balance. The increase in our accounts receivable also reflects higher sales volumes resulting from the strengthening economy and the higher LME average zinc price. The increase in our inventories primarily reflects cost and volume increases associated with our raw materials, work in process and zinc products finished goods inventories. The decrease in our prepaid expenses and other current assets reflects the receipt of an $18.9 million federal tax refund and an unfavorable, non-cash fair value adjustment of $2.9 million on our zinc put options partially offset by an $11.8 million income tax refund receivable for 2010. We entered into put option contracts in 2009 and 2010 to protect our cash flows from declines in the LME price of zinc. The options settle monthly. In 2010, we were entitled to receive the amount, if any, by which the option strike price, set at $0.65 per pound, exceeded the average LME price of zinc during the preceding month. During 2010, the average LME zinc price exceeded the strike price; consequently, the options settled with no payment due to us.
The post closing adjustments associated with our purchase of INMETCO in December 2009 reduced working capital by $0.9 million during the first quarter of 2010.
50
Cash Flows from Investing Activities
Capital expenditures were $44.7 million for 2010, of which $24.0 million related to the construction of the two kilns in Barnwell, South Carolina. The first kiln commenced operation in mid-April of 2010 and the second kiln commenced operation in late September of 2010. In December, funds totaling $4.9 million were released from escrow in accordance with the provisions of the NMTC program related to the financing and development of the Barnwell site. The arrangement provided $5.9 million of NMTC funds to be used for completion of the development of the project site and construction of buildings and other real property. The funds and the accrued interest thereon are being held in escrow and are being released as the project is completed.
We funded our capital expenditures with cash on hand. Additionally, we made payments totaling $4.6 million representing the remaining purchase price of INMETCO.
Cash Flows from Financing Activities
Cash flows from financing activities include proceeds of $1.2 million from the exercise of 102,596 stock options in the fourth quarter of 2010.
Contractual Obligations and Commercial Commitments
The following table summarizes our contractual obligations and commitments as of December 31, 2011:
| | | | | | | | | | | | | | | | | | | | |
| | | Payments Due by Period | |
| | | Total | | | Less Than 1 Year | | | 1-3 Years | | | 3-5 Years | | | More Than 5 Years | |
| | | (Dollars in millions) | |
Long-term debt obligations (excluding interest) | | $ | 100.3 | | | $ | — | | | $ | — | | | $ | 0.3 | | | $ | 100.0 | |
Operating lease obligations | | | 16.7 | | | | 4.3 | | | | 6.8 | | | | 3.8 | | | | 1.8 | |
Interest on debt | | | 22.8 | | | | 3.8 | | | | 7.6 | | | | 7.6 | | | | 3.8 | |
Executive compensation | | | 2.2 | | | | 1.1 | | | | 1.1 | | | | — | | | | — | |
Other long-term liabilities(1) | | | 15.8 | | | | 1.0 | | | | 2.1 | | | | 2.1 | | | | 10.6 | |
| | | | | | | | | | | | | | | | | | | | |
Total | | $ | 157.8 | | | $ | 10.2 | | | $ | 17.6 | | | $ | 13.8 | | | $ | 116.2 | |
| | | | | | | | | | | | | | | | | | | | |
| (1) | Other long-term liabilities include obligations associated with the NMTC put option, the pension liability and payments under the ESOI deferred purchase agreement. |
Capital expenditures for 2012 are estimated to be approximately $207 million, which includes $192 million related to the new zinc facility currently under construction in Rutherford County, North Carolina. Estimated capital expenditures for 2013 related to the new zinc facility are estimated to be approximately $140 million.
Off-Balance Sheet Arrangements
Our off-balance sheet arrangements include operating leases, letters of credit and a surety bond. As of December 31, 2011, we had letters of credit outstanding under the Revolving Credit Agreement in the amount of $17.8 million to collateralize self-insured claims for workers’ compensation and other general insurance claims and closure bonds for two of our facilities in Pennsylvania. We also have a surety bond outstanding in the amount of $2.6 million to collateralize a closure bond for the Company’s third facility located in Pennsylvania.
Inflation
Inflation can affect us primarily as it relates to material purchases, energy, labor and other costs. We do not believe that inflation has had a material effect on our business, financial condition or results of operations in recent years. However, if our costs were to become subject to significant inflationary pressures, either as described above or otherwise, we may not be able to fully offset such higher costs through price increases.
51
Seasonality
Due in large part to the diverse end-markets into which we sell our products and services, our sales are generally not impacted by seasonality with the exception of a slight reduction in demand in the fourth quarter of the year as some customers reduce production during the period.
ITEM 7A. QUANTITATIVE AND QUALITATIVE DISCLOSURES ABOUT MARKET RISK
In the ordinary course of our business, we are exposed to potential losses arising from changes in interest rates and the prices of zinc, nickel, lead, natural gas and, until September 2011, coal. We have historically used derivative instruments, such as swaps, put options and forward purchase contracts to manage the effect of these changes. When we use forward contract hedging instruments to reduce our exposure to rising energy prices, we are limited in our ability to take advantage of future reductions in energy prices, because we are required to exercise the hedging instrument at the settlement date regardless of the market price at the time. We have also used put options to reduce our exposure to future declines in zinc prices. We have entered into arrangements hedging a portion of our exposure to future changes in the prices of zinc and nickel through 2013.
Our risk management policy seeks to meet our overall goal of managing our exposure to market price risk, particularly risks related to changing zinc and nickel prices. All derivative contracts are held for purposes other than trading and are used primarily to mitigate uncertainty and volatility of expected cash flow and cover underlying exposures. We are exposed to credit loss in cases where counter-parties or clearing agents with which we have entered into derivative transactions become unable to satisfy their obligations in accordance with the underlying agreements. To minimize the risk of such losses, we utilize LME-registered contracts entered into with the London Clearing House for a majority of our contracts. We also minimize credit loss by utilizing several different brokers for our derivative contracts. At December 31, 2011, we are utilizing four different brokers for our hedging program.
From January through November 1, 2011, the clearing agent for the majority of our hedges had been MF Global UK Ltd, a U.K. affiliate of MF Global. On November 1, 2011, MF Global Holdings Ltd. And MF Global Finance USA filed for U.S. bankruptcy protection under Chapter 11 of the U.S. Bankruptcy Code, and a special administration order was issued in the United Kingdom in respect of MF Global UK Limited, appointing partners of KPMG LLP as joint administrators responsible for managing its business. We successfully transferred all our LME-registered hedging contracts, which include our entire put and call options for 2012 and 2013, to an alternate clearing member of the London Clearing House. On November 11, 2011, we received notification via email from MF Global UK Ltd. (in special administration) notifying us that all outstanding Over the Counter (“OTC”) hedge positions would be closed with an effective date of November 1, 2011. The net value of these outstanding OTC positions was $0.4 million and this amount was written off during the fourth quarter of 2011.
Interest Rate Risk
We are subject to interest rate risk in connection with our $60.0 million Revolving Credit Agreement entered into on September 28, 2011 which bears interest at variable rates. Assuming that our Revolving Credit Agreement is fully drawn and holding other variables constant, each one percentage point change in interest rates would be expected to have an impact on pre-tax earnings and cash flows for the next year of approximately $0.6 million.
Commodity Price Risk
Our business consists principally of the sale of zinc and nickel-based products. As a result, our results of operations are subject to risk of fluctuations in the market prices of zinc and nickel. While our finished products are generally priced based on a spread to the price of zinc or nickel on the LME, our revenues are impacted significantly by changes in the market prices of these metals. Changes in zinc prices will also impact our ability to generate revenue from our EAF recycling operations as well as our ability to procure raw materials. In addition, we consume substantial amounts of energy in our zinc production and EAF dust recycling operations, and therefore our cost of sales is vulnerable to changes in prevailing energy prices, particularly natural gas and coke.
52
In 2009, we purchased put options for 2010 for a financial hedge of approximately 100,000 tons of zinc. The cost of the options was $5.3 million and they had a strike price of $0.65 per pound. At the time of the purchases, the options represented approximately 80% of our anticipated sales volume for 2010.
In 2010, we purchased put options for 2011 for a financial hedge of approximately 99,000 tons of zinc for 2011 having a strike price of $0.65 per pound. The purchases represented approximately 70% of our expected zinc production in 2011. We also sold put options for approximately 35,000 tons of zinc for 2011 having a strike price of $0.55 per pound. The cost of the options purchased was $3.0 million and the proceeds from the options sold was $0.2 million. The options are included in “Prepaid expenses and other current assets” in our consolidated financial statements.
At December 31, 2011 we have zinc put options with an $0.85 per pound strike price outstanding, which cover approximately 160,000 tons of zinc production, representing approximately 75% of the expected shipment for the period from January 2012 through June 2013. These put option are in place to provide protection to operating cash flow in the event that zinc prices decline below that level during the construction of the new zinc facility. In June 2011, we entered into hedge arrangements in which we bought put options with a strike price of $0.85 per pound, sold call options with a strike price of $1.20 per pound and bought call options with a strike price of $1.81 per pound. The value of these bought and sold positions resulted in a zero cash outlay. The hedges reduced our exposure to future declines in zinc prices below $0.85 per pound. We would not, however, have been able to participate in increased zinc prices beyond $1.20 per pound until the zinc price reached $1.81 per pound. The $1.81 per pound call options were bought in order to cap the potential collateral requirements surrounding these hedge arrangements. During the fourth quarter of 2011, with forward zinc prices lower than when the program was implemented, we bought back the $1.20 per pound call option positions for $15.7 million and realized a gain of $13.4 million. The repurchase of these $1.20 per pound call options effectively eliminated both the risk of a potential cash collateral requirement and the limitation to our profitability, in the event that zinc prices increase above the $1.20 per pound during that period. We anticipate that we will leave the $0.85 per pound options in place to provide protection to operating cash flow in the event that zinc prices decline below that level during the construction of the new zinc plant. The zinc call options with a $1.81 per pound strike price continue to be held at December 31, 2011 but their value was negligible. These options are included in “Prepaid expenses and other current assets” and “ Deposits and other” in our consolidated financial statements.
As of December 31, 2010, we were party to contracts for the purchase and delivery of the coal requirements for our power plant in Monaca through 2011. We were party to a similar contract in 2010. In September 2011, we entered into a new power purchase agreement to supply our electrical power needs at our Monaca, Pennsylvania facility and temporarily idled the Monaca power plant. During the third and fourth quarters of 2011, we sold all of our remaining coal obligations under this contract. Each year, we enter into contracts for the forward purchase of natural gas to cover the majority of natural gas requirements in order to reduce our exposure to the volatility of natural gas prices.
Exchange Rate Sensitivity Analysis
Our exchange rate exposures result from our acquisition of Zochem on November 1, 2011, Zochem’s functional currency is the Canadian dollar. Holding other variables constant, if there were a 10% reduction in all relevant exchange rates, the effect on our earnings, based on actual earnings of Zochem for the two months ended December 31, 2011 would have had relatively no effect on earnings.
| ITEM 8. CONSOLIDATED | FINANCIAL STATEMENTS AND SUPPLEMENTARY DATA |
Our consolidated financial statements, together with the related notes and the report of the independent registered public accounting firm, are set forth on the pages indicated in Item 15 in this Annual Report on Form 10-K.
| ITEM 9. | CHANGES IN AND DISAGREEMENTS WITH ACCOUNTANTS ON ACCOUNTING AND FINANCIAL DISCLOSURE |
There were no changes in or disagreements with accountants on accounting and financial disclosure.
53
| ITEM 9A. CONTROLS | AND PROCEDURES |
Evaluation of Disclosure Controls and Procedures
Based on our management’s evaluation (with the participation of our principal executive officer and principal financial officer), as of the end of the period covered by this report, our principal executive officer and principal financial officer have concluded that our disclosure controls and procedures (as defined in Rules 13a-15(e) and 15d-15(e) under the Securities Exchange Act of 1934, as amended, (the “Exchange Act”)) are effective to ensure that information required to be disclosed by us in reports that we file or submit under the Exchange Act is recorded, processed, summarized and reported within the time periods specified in SEC rules and forms and is accumulated and communicated to our management, including our principal executive officer and principal financial officer, as appropriate to allow timely decisions regarding required disclosure.
Management’s Annual Report on Internal Control Over Financial Reporting
Our management is responsible for establishing and maintaining adequate internal control over our financial reporting (as defined in Rules 13a-15(f) and 15d-15(f) under the Exchange Act). Because of its inherent limitations, internal control over financial reporting may not prevent or detect misstatements. Projections of any evaluation of effectiveness to future periods are subject to the risk that controls may become inadequate because of changes in conditions, or that the degree of compliance with the policies or procedures may deteriorate.
Our management assessed the effectiveness of our internal control over financial reporting as of December 31, 2011. In making this assessment, our management used the criteria set forth by the Committee of Sponsoring Organizations of the Treadway Commission (COSO) in Internal Control Integrated Framework. Due to the fact that Zochem was acquired on November 1, 2011, management’s assessment of the effectiveness of our internal control over financial reporting excludes internal control over financial reporting of Zochem. Zochem constitutes approximately 5% of our total assets as of December 31, 2011 and 2% of our total revenues for the year ended December 31, 2011. We believe that management had sufficient cause to exclude the acquisition due to the fact that Zochem was acquired on November 1, 2011. Based on our assessment, management believes that, as of December 31, 2011, our internal control over financial reporting, excluding Zochem as discussed above is effective based on those criteria. The independent registered public accounting firm which audited our financial statements included in this Annual Report on Form 10-K has issued an attestation report on our internal control over financial reporting. Please see “Report of Independent Registered Public Accounting Firm.”
Changes in Internal Control over Financial Reporting
No change in our internal control over financial reporting occurred during the quarter ended December 31, 2011 that has materially affected, or is reasonably likely to materially affect, our internal control over financial reporting. On November 1, 2011, we acquired Zochem. We will begin our assessment of the internal controls over financial reporting at Zochem early in 2012.
54
REPORT OF INDEPENDENT REGISTERED PUBLIC ACCOUNTING FIRM
Board of Directors and Shareholders
Horsehead Holding Corp.
We have audited Horsehead Holding Corp. (a Delaware Corporation) and Subsidiaries’ (collectively, the “Company”) internal control over financial reporting as of December 31, 2011, based on criteria established inInternal Control — Integrated Framework issued by the Committee of Sponsoring Organizations of the Treadway Commission (COSO). The Company’s management is responsible for maintaining effective internal control over financial reporting and for its assessment of the effectiveness of internal control over financial reporting, included in the accompanying Management’s Annual Report on Internal Control Over Financial Reporting (Management’s Report). Our responsibility is to express an opinion on the Company’s internal control over financial reporting based on our audit. Our audit of, and opinion on, the Company’s internal control over financial reporting does not include internal control over financial reporting of Zochem, Inc. (“Zochem”), a wholly-owned subsidiary, whose financial statements reflect total assets and revenues constituting 5% and 2%, respectively, of the related consolidated financial statement amounts as of and for the year ended December 31, 2011. As indicated in Management’s Report, Zochem was acquired on November 1, 2011 and therefore, management’s assessment on the effectiveness of the Company’s internal control over financial reporting excludes internal control over financial reporting of Zochem.
We conducted our audit in accordance with the standards of the Public Company Accounting Oversight Board (United States). Those standards require that we plan and perform the audit to obtain reasonable assurance about whether effective internal control over financial reporting was maintained in all material respects. Our audit included obtaining an understanding of internal control over financial reporting, assessing the risk that a material weakness exists, testing and evaluating the design and operating effectiveness of internal control based on the assessed risk, and performing such other procedures as we considered necessary in the circumstances. We believe that our audit provides a reasonable basis for our opinion.
A company’s internal control over financial reporting is a process designed to provide reasonable assurance regarding the reliability of financial reporting and the preparation of financial statements for external purposes in accordance with generally accepted accounting principles. A company’s internal control over financial reporting includes those policies and procedures that (1) pertain to the maintenance of records that, in reasonable detail, accurately and fairly reflect the transactions and dispositions of the assets of the company; (2) provide reasonable assurance that transactions are recorded as necessary to permit preparation of financial statements in accordance with generally accepted accounting principles, and that receipts and expenditures of the company are being made only in accordance with authorizations of management and directors of the company; and (3) provide reasonable assurance regarding prevention or timely detection of unauthorized acquisition, use, or disposition of the company’s assets that could have a material effect on the financial statements.
Because of its inherent limitations, internal control over financial reporting may not prevent or detect misstatements. Also, projections of any evaluation of effectiveness to future periods are subject to the risk that controls may become inadequate because of changes in conditions, or that the degree of compliance with the policies or procedures may deteriorate.
In our opinion, Horsehead Holding Corp. and Subsidiaries maintained, in all material respects, effective internal control over financial reporting as of December 31, 2011, based on criteria established inInternal Control — Integrated Framework issued by COSO.
We also have audited, in accordance with the standards of the Public Company Accounting Oversight Board (United States), the consolidated balance sheets as of December 31, 2011 and 2010 of Horsehead Holding Corp. and Subsidiaries, and the related consolidated statements of operations, stockholder’s equity and cash flows for each of the three years in the period ended December 31, 2011, and our report dated March 9, 2012 expressed an unqualified opinion.
/s/ GRANT THORNTON LLP
Cleveland, Ohio
March 9, 2012
55
| ITEM 9B. | OTHER INFORMATION |
None.
PART III
| ITEM 10. | DIRECTORS, EXECUTIVE OFFICERS AND CORPORATE GOVERNANCE |
The information required by this item may be found in our Proxy Statement related to the 2012 Annual Meeting of Stockholders and is incorporated herein by reference and in “Executive Officers of the Registrant” as set forth in “Item 1. Business” in this report.
There have been no material changes to the procedures through which stockholders may recommend nominees to our Board of Directors since April 10, 2006. We have adopted a Code of Ethics that applies to our principal executive officer, principal financial officer and principal accounting officer. The text of our Code of Ethics is posted on our website: www.horsehead.net — click on “Investor Relations”, then click on “Corp. Governance” and then click on “Code of Ethics for Senior Management.” We intend to disclose future amendments to, or waivers from, certain provisions of the Code of Ethics on the website within four business days following the date of such amendment or waiver. Stockholders may request a free copy of the Code of Ethics from: Horsehead Holding Corp., Attention: Corporate Secretary, 4955 Steubenville Pike, Suite 405, Pittsburgh, Pennsylvania 15205.
| ITEM 11. | EXECUTIVE COMPENSATION |
The information required by this item may be found in our Proxy Statement related to the 2012 Annual Meeting of Stockholders and is incorporated herein by reference.
| ITEM 12. | SECURITY OWNERSHIP OF CERTAIN BENEFICIAL OWNERS AND MANAGEMENT AND RELATED STOCKHOLDER MATTERS |
The information required by this item may be found in our Proxy Statement related to the 2012 Annual Meeting of Stockholders and is incorporated herein by reference.
| ITEM 13. | CERTAIN RELATIONSHIPS AND RELATED TRANSACTIONS, AND DIRECTOR INDEPENDENCE |
The information required by this item may be found in our Proxy Statement related to the 2012 Annual Meeting of Stockholders and is incorporated herein by reference.
| ITEM 14. | PRINCIPAL ACCOUNTANT FEES AND SERVICES |
The information required by this item may be found in our Proxy Statement related to the 2012 Annual Meeting of Stockholders and is incorporated herein by reference.
56
PART IV
ITEM 15. EXHIBITS AND FINANCIAL STATEMENT SCHEDULES
(a)(1) Financial Statements.
(a)(2) Financial Statement Schedule.
Schedule I: Condensed Financial Information of Registrant
All remaining schedules have been omitted because they are not required or applicable or the information is included in the consolidated financial statements or notes thereto.
(a)(3) Exhibits. See Exhibit Index appearing on page E-1 for a list of exhibits filed with or incorporated by reference as a part of this Annual Report on Form 10-K.
57
SIGNATURES
Pursuant to the requirements of Section 13 or 15(d) of the Securities Exchange Act of 1934, the registrant has duly caused this report to be signed on its behalf by the undersigned, thereunto duly authorized on March 9, 2012.
| | |
| HORSEHEAD HOLDING CORP. |
| |
| By: | | /s/ James M. Hensler |
| | James M. Hensler |
| | Its: Chief Executive Officer |
POWER OF ATTORNEY
KNOW ALL PERSONS BY THESE PRESENTS, that each person whose signature appears below constitutes and appoints James M. Hensler and Robert D. Scherich, jointly and severally, his attorney-in-fact, each with the full power of substitution, for such person, in any and all capacities, to sign any and all amendments to this Annual Report on Form 10-K, and to file the same, with all exhibits thereto and other documents in connection therewith, with the Securities and Exchange Commission, granting unto said attorney-in-fact and agent full power and authority to do and perform each and every act and thing requisite and necessary to be done in connection therewith, as fully to all intents and purposes as he might do or could do in person hereby ratifying and confirming all that each of said attorneys-in-fact and agents, or his substitute, may do or cause to be done by virtue hereof.
Pursuant to the requirements of the Securities Exchange Act of 1934, this report has been signed below by the following persons on behalf of the registrant and in the capacities indicated and on March 9, 2012.
| | |
SIGNATURE | | TITLE |
| |
| | Chairman of the Board of Directors, President and Chief Executive Officer (Principal Executive Officer) |
/s/ James M. Hensler | |
James M. Hensler | |
| |
/s/ Robert D. Scherich | | Vice President and Chief Financial Officer (Principal Financial and Accounting Officer) |
Robert D. Scherich | |
| |
/s/ John Van Roden | | Director |
John Van Roden | | |
| |
/s/ T. Grant John | | Director |
T. Grant John | | |
| |
/s/ Bryan D. Rosenberger | | Director |
Bryan D. Rosenberger | | |
| |
/s/ Jack Shilling | | Director |
Jack Shilling | | |
58
REPORT OF INDEPENDENT REGISTERED PUBLIC ACCOUNTING FIRM
Board of Directors and Shareholders
Horsehead Holding Corp.
We have audited the accompanying consolidated balance sheets of Horsehead Holding Corp. (a Delaware corporation) and subsidiaries (collectively the “Company”) as of December 31, 2011 and 2010, and the related consolidated statements of operations, stockholders’ equity, and cash flows for each of the three years in the period ended December 31, 2011. Our audits of the basic consolidated financial statement schedule listed in the index appearing under Item 15. These financial statements and financial statement schedule are the responsibility of the Company’s management. Our responsibility is to express an opinion on these financial statements and financial statement schedule based on our audits.
We conducted our audits in accordance with the standards of the Public Company Accounting Oversight Board (United States). Those standards require that we plan and perform the audit to obtain reasonable assurance about whether the financial statements are free of material misstatement. An audit includes examining, on a test basis, evidence supporting the amounts and disclosures in the financial statements. An audit also includes assessing the accounting principles used and significant estimates made by management, as well as evaluating the overall financial statement presentation. We believe that our audits provide a reasonable basis for our opinion.
In our opinion, the consolidated financial statements referred to above present fairly, in all material respects, the financial position of Horsehead Holding Corp. and subsidiaries as of December 31, 2011 and 2010, and the results of their operations and their cash flows for each of the three years in the period ended December 31, 2011 in conformity with accounting principles generally accepted in the United States of America. Also in our opinion, the related financial statement schedule, when considered in relation to the basic consolidated financial statements taken as a whole, present fairly, in all material respects, the information set forth therein.
We also have audited, in accordance with the standards of the Public Company Accounting Oversight Board (United States), Horsehead Holding Corp.’s internal control over financial reporting as of December 31, 2011, based on criteria established inInternal Control — Integrated Framework issued by the Committee of Sponsoring Organizations of the Treadway Commission (COSO)and our report dated March 9, 2012 expressed an unqualified opinion.
/s/ GRANT THORNTON LLP
Cleveland, Ohio
March 9, 2012
F-1
HORSEHEAD HOLDING CORP. AND SUBSIDIARIES
CONSOLIDATED BALANCE SHEETS
December 31, 2011 and 2010
(Amounts in thousands, except per share amounts)
| | | | | | | | |
| | | 2011 | | | 2010 | |
ASSETS | | | | | | | | |
Current assets | | | | | | | | |
Cash and cash equivalents | | $ | 188,500 | | | $ | 109,557 | |
Accounts receivable, net of allowance of $566 and $1,741 in 2011 and 2010, respectively | | | 60,939 | | | | 53,075 | |
Inventories, net | | | 53,430 | | | | 50,855 | |
Prepaid expenses and other current assets | | | 30,312 | | | | 16,178 | |
Deferred income taxes | | | — | | | | 6,090 | |
| | | | | | | | |
Total current assets | | | 333,181 | | | | 235,755 | |
Property, plant and equipment, net | | | 260,052 | | | | 218,652 | |
Other assets | | | | | | | | |
Intangible assets | | | 12,607 | | | | 13,026 | |
Restricted cash | | | 2,500 | | | | 26,399 | |
Deferred income taxes | | | 1,855 | | | | 1,984 | |
Deposits and other | | | 21,297 | | | | 320 | |
| | | | | | | | |
Total other assets | | | 38,259 | | | | 41,729 | |
Total assets | | $ | 631,492 | | | $ | 496,136 | |
| | | | | | | | |
| | |
LIABILITIES AND STOCKHOLDERS’ EQUITY | | | | | | | | |
Current liabilities | | | | | | | | |
Current maturities of long-term debt | | $ | — | | | $ | — | |
Accounts payable | | | 39,011 | | | | 39,374 | |
Accrued expenses | | | 31,524 | | | | 26,261 | |
Deferred income taxes | | | 1,716 | | | | — | |
| | | | | | | | |
Total current liabilities | | | 72,251 | | | | 65,635 | |
Long-term debt, less current maturities | | | 79,663 | | | | 255 | |
Other long-term liabilities | | | 21,428 | | | | 17,501 | |
Deferred income taxes | | | 45,899 | | | | 39,735 | |
Commitments and contingencies | | | | | | | | |
Stockholders’ equity | | | | | | | | |
Common stock, par value $.01 per share; 100,000 shares with voting rights authorized; 43,696 and 43,468 shares issued and outstanding in 2011 and 2010, respectively | | | 436 | | | | 434 | |
Preferred stock, par value $.01 per share; 10,000 shares authorized; no shares issued or outstanding | | | — | | | | — | |
Additional paid-in capital | | | 232,562 | | | | 214,406 | |
Retained earnings | | | 175,219 | | | | 153,765 | |
Accumulated other comprehensive loss | | | (258 | ) | | | — | |
| | | | | | | | |
Total stockholders’ equity before noncontrolling interest | | | 407,959 | | | | 368,605 | |
Noncontrolling interest | | | 4,292 | | | | 4,405 | |
| | | | | | | | |
Total stockholders’ equity | | | 412,251 | | | | 373,010 | |
Total liabilities and stockholders’ equity | | $ | 631,492 | | | $ | 496,136 | |
| | | | | | | | |
The accompanying notes to consolidated financial statements are an integral part of these statements.
F-2
HORSEHEAD HOLDING CORP. AND SUBSIDIARIES
CONSOLIDATED STATEMENTS OF OPERATIONS
For the Years Ended December 31, 2011, 2010 and 2009
(Amounts in thousands, except per share amounts)
| | | | | | | | | | | | |
| | | 2011 | | | 2010 | | | 2009 | |
Net sales of zinc material and other goods | | $ | 352,060 | | | $ | 288,796 | | | $ | 183,949 | |
Net sales of nickel-based material and other services | | | 62,477 | | | | 54,162 | | | | — | |
EAF dust service fees | | | 36,643 | | | | 39,404 | | | | 32,581 | |
| | | | | | | | | | | | |
Net sales | | | 451,180 | | | | 382,362 | | | | 216,530 | |
Cost of sales of zinc material and other goods | | | 326,167 | | | | 267,283 | | | | 210,642 | |
Cost of sales of nickel-based material and other services | | | 37,446 | | | | 33,466 | | | | — | |
Cost of EAF dust services | | | 24,135 | | | | 24,040 | | | | 15,529 | |
Insurance claim income | | | (10,347 | ) | | | (19,267 | ) | | | — | |
| | | | | | | | | | | | |
Cost of sales (excluding depreciation and amortization) | | | 377,401 | | | | 305,522 | | | | 226,171 | |
Depreciation and amortization | | | 22,025 | | | | 18,612 | | | | 15,982 | |
Selling, general and administrative expenses | | | 22,942 | | | | 18,672 | | | | 17,080 | |
| | | | | | | | | | | | |
Total costs and expenses | | | 422,368 | | | | 342,806 | | | | 259,233 | |
Income (loss) from operations | | | 28,812 | | | | 39,556 | | | | (42,703 | ) |
Other income (expense) | | | | | | | | | | | | |
Interest expense | | | (3,324 | ) | | | (1,226 | ) | | | (2,340 | ) |
Gain on bargain purchase of a business | | | 4,920 | | | | — | | | | — | |
Interest and other income | | | 1,948 | | | | 849 | | | | 883 | |
| | | | | | | | | | | | |
Total other income (expense) | | | 3,544 | | | | (377 | ) | | | (1,457 | ) |
Income (loss) before income taxes | | | 32,356 | | | | 39,179 | | | | (44,160 | ) |
Income tax provision (benefit) | | | 10,902 | | | | 14,409 | | | | (16,689 | ) |
| | | | | | | | | | | | |
NET INCOME(LOSS) | | $ | 21,454 | | | $ | 24,770 | | | $ | (27,471 | ) |
| | | | | | | | | | | | |
Earnings (loss) per common share: | | | | | | | | | | | | |
Basic | | $ | 0.49 | | | $ | 0.57 | | | $ | (0.73 | ) |
Diluted | | $ | 0.49 | | | $ | 0.57 | | | $ | (0.73 | ) |
Weighted average shares outstanding: | | | | | | | | | | | | |
Basic | | | 43,652 | | | | 43,353 | | | | 37,604 | |
Diluted | | | 44,161 | | | | 43,668 | | | | 37,604 | |
The accompanying notes to consolidated financial statements are an integral part of these statements.
F-3
HORSEHEAD HOLDING CORP. AND SUBSIDIARIES
CONSOLIDATED STATEMENTS OF STOCKHOLDERS’ EQUITY
For the Years Ended December 31, 2011, 2010 and 2009
(Amounts in thousands)
| | | | | | | | | | | | | | | | | | | | | | | | | | | | |
| | | | | | | | | | | | | | | Accumulated | | | | | | | |
| | | | | | | | | Additional | | | | | | Other | | | Non- | | | | |
| | | Common Stock | | | Paid-In | | | Retained | | | Comprehensive | | | Controlling | | | | |
| | | Shares | | | Amount | | | Capital | | | Earnings | | | Loss | | | Interest | | | Total | |
Balance at January 1, 2009 | | | 35,253 | | | $ | 352 | | | $ | 129,741 | | | $ | 156,466 | | | | — | | | | — | | | $ | 286,559 | |
Restricted stock vesting | | | 19 | | | | 1 | | | | (1 | ) | | | — | | | | — | | | | — | | | | — | |
Stock option exercise | | | 12 | | | | — | | | | 12 | | | | — | | | | — | | | | — | | | | 12 | |
Equity offering | | | 8,050 | | | | 80 | | | | 79,705 | | | | — | | | | — | | | | — | | | | 79,785 | |
Stock compensation expense | | | — | | | | — | | | | 2,153 | | | | — | | | | — | | | | — | | | | 2,153 | |
Contribution from noncontrolling interest | | | — | | | | — | | | | — | | | | — | | | | — | | | | 4,472 | | | | 4.472 | |
Reduction of tax benefit of equity award exercise | | | — | | | | — | | | | (93 | ) | | | — | | | | — | | | | — | | | | (93 | ) |
Net loss | | | — | | | | — | | | | — | | | | (27,471 | ) | | | — | | | | — | | | | (27,471 | ) |
| | | | | | | | | | | | | | | | | | | | | | | | | | | | |
Balance at December 31, 2009 | | | 43,334 | | | | 433 | | | | 211,517 | | | | 128,995 | | | | — | | | | 4,472 | | | | 345,417 | |
Restricted stock vesting | | | 31 | | | | 1 | | | | (1 | ) | | | — | | | | — | | | | — | | | | — | |
Stock option exercise | | | 103 | | | | — | | | | 1,183 | | | | — | | | | — | | | | — | | | | 1,183 | |
Stock compensation expense | | | — | | | | — | | | | 1,860 | | | | — | | | | — | | | | — | | | | 1,860 | |
Distribution to noncontrolling interest | | | — | | | | — | | | | — | | | | — | | | | — | | | | (67 | ) | | | (67 | ) |
Reduction of tax benefit of equity award exercise | | | — | | | | — | | | | (153 | ) | | | — | | | | — | | | | — | | | | (153 | ) |
Net Income | | | — | | | | — | | | | — | | | | 24,770 | | | | — | | | | — | | | | 24,770 | |
| | | | | | | | | | | | | | | | | | | | | | | | | | | | |
Balance at December 31, 2010 | | | 43,468 | | | | 434 | | | | 214,406 | | | | 153,765 | | | | — | | | | 4 ,405 | | | | 373,010 | |
Restricted stock vesting | | | 46 | | | | — | | | | — | | | | — | | | | — | | | | — | | | | — | |
Stock option exercise | | | 182 | | | | 2 | | | | 2,358 | | | | — | | | | — | | | | — | | | | 2,360 | |
Stock compensation expense | | | — | | | | — | | | | 2,984 | | | | — | | | | — | | | | — | | | | 2,984 | |
Distribution to noncontrolling interest | | | — | | | | — | | | | — | | | | — | | | | — | | | | (113 | ) | | | (113 | ) |
Reduction of tax benefit of equity award exercise | | | — | | | | — | | | | (151 | ) | | | — | | | | — | | | | — | | | | (151 | ) |
Issuance of Convertible Notes | | | — | | | | — | | | | 13,725 | | | | — | | | | — | | | | — | | | | 13,725 | |
Equity issuance costs related to issuance of Debt | | | — | | | | — | | | | (760 | ) | | | — | | | | — | | | | — | | | | (760 | ) |
Net Income | | | — | | | | — | | | | — | | | | 21,454 | | | | — | | | | — | | | | 21,454 | |
Other comprehensive income, net of tax: | | | | | | | | | | | | | | | | | | | | | | | | | | | | |
Foreign currency translation adjustments | | | — | | | | — | | | | — | | | | — | | | | (272 | ) | | | — | | | | (272 | ) |
Net pension liability adjustment | | | — | | | | — | | | | — | | | | — | | | | 14 | | | | — | | | | 14 | |
| | | | | | | | | | | | | | | | | | | | | | | | | | | | |
Comprehensive income | | | | | | | | | | | | | | | | | | | | | | | | | | | 21,196 | |
| | | | | | | | | | | | | | | | | | | | | | | | | | | | |
Balance at December 31, 2011 | | | 43,696 | | | $ | 436 | | | $ | 232,562 | | | $ | 175,219 | | | $ | (258 | ) | | $ | 4,292 | | | | 412,251 | |
| | | | | | | | | | | | | | | | | | | | | | | | | | | | |
The accompanying notes to consolidated financial statements are an integral part of these statements.
F-4
HORSEHEAD HOLDING CORP. AND SUBSIDIARIES
CONSOLIDATED STATEMENTS OF CASH FLOWS
For the Years Ended December 31, 2011, 2010 and 2009
(Amounts in thousands)
| | | | | | | | | | | | |
| | | 2011 | | | 2010 | | | 2009 | |
Cash Flows from Operating Activities: | | | | | | | | | | | | |
Net income (loss) | | $ | 21,454 | | | $ | 24,770 | | | $ | (27,471 | ) |
Adjustments to reconcile net income (loss) to net cash provided by (used in) operating activities: | | | | | | | | | | | | |
Depreciation and amortization | | | 22,025 | | | | 18,612 | | | | 16,981 | |
Gain on bargain purchase of a business | | | (4,920 | ) | | | — | | | | — | |
Deferred income tax provision | | | 5,832 | | | | 16,026 | | | | 9,486 | |
Accretion on Convertible Notes | | | 1,235 | | | | — | | | | — | |
Accretion on ESOI liabilities | | | 336 | | | | 905 | | | | 366 | |
Amortization of deferred finance costs | | | 213 | | | | — | | | | 999 | |
Losses on write down or disposal of assets | | | 10,220 | | | | 203 | | | | 1,153 | |
(Gains) losses on derivative financial instruments | | | (271 | ) | | | 3,686 | | | | 11,997 | |
Lower of cost or market adjustment to inventories | | | 838 | | | | — | | | | — | |
Non-cash compensation expense | | | 2,984 | | | | 1,860 | | | | 2,153 | |
Capitalization of interest | | | (597 | ) | | | — | | | | — | |
Changes in operating assets and liabilities: | | | | | | | | | | | | |
Decrease (increase) in accounts receivable, net | | | 1,634 | | | | (12,616 | ) | | | (1,152 | ) |
Decrease (increase) in inventories, net | | | 2,722 | | | | (11,551 | ) | | | 13,760 | |
(Increase) decrease in prepaid expenses and other current assets | | | (16,815 | ) | | | 5,322 | | | | (24,827 | ) |
(Increase) in other assets | | | (9,717 | ) | | | (87 | ) | | | (1,048 | ) |
(Decrease) increase in accounts payable | | | (477 | ) | | | 7,019 | | | | (6,308 | ) |
Increase (decrease) in accrued expenses | | | 1,848 | | | | 5,427 | | | | (2,634 | ) |
(Decrease) in other non-current liabilities | | | (1,940 | ) | | | (2,270 | ) | | | (188 | ) |
| | | | | | | | | | | | |
Net cash provided by (used in) operating activities | | | 36,604 | | | | 57,306 | | | | (6,733 | ) |
Cash Flows from Investing Activities: | | | | | | | | | | | | |
Purchase of property, plant and equipment | | | (64,709 | ) | | | (44,704 | ) | | | (37,151 | ) |
Acquisitions | | | (15,078 | ) | | | (4,567 | ) | | | (33,237 | ) |
Purchase of intangibles | | | — | | | | — | | | | (3,000 | ) |
Decrease (increase) in restricted cash | | | 23,899 | | | | 5,137 | | | | (31,536 | ) |
| | | | | | | | | | | | |
Net cash used in investing activities | | | (55,888 | ) | | | (44,134 | ) | | | (104,924 | ) |
Cash Flows from Financing Activities: | | | | | | | | | | | | |
Proceeds from equity offering, net of expenses | | | — | | | | — | | | | 79,785 | |
Proceeds from the exercise of stock options | | | 2,360 | | | | 1,183 | | | | 12 | |
(Distributions to) proceeds from noncontrolling interest equity holders | | | (113 | ) | | | (67 | ) | | | 4,472 | |
Proceeds from the issuance of Convertible Notes | | | 100,000 | | | | — | | | | — | |
Debt issuance costs | | | (3,149 | ) | | | — | | | | — | |
Equity issuance costs related to the issuance of Convertible Notes | | | (760 | ) | | | — | | | | — | |
Tax effect of share based compensation award exercise and vesting | | | (151 | ) | | | (153 | ) | | | (93 | ) |
Proceeds from issuance of notes payable | | | — | | | | — | | | | 255 | |
Payments on notes payable and long-term debt | | | — | | | | (58 | ) | | | (62 | ) |
| | | | | | | | | | | | |
Net cash provided by financing activities | | | 98,187 | | | | 905 | | | | 84,369 | |
Foreign currency impact on cash balance | | | 40 | | | | — | | | | — | |
Net increase (decrease) in cash and cash equivalents | | | 78,943 | | | | 14,077 | | | | (27,288 | ) |
Cash and cash equivalents at beginning of year | | | 109,557 | | | | 95,480 | | | | 122,768 | |
| | | | | | | | | | | | |
Cash and cash equivalents at end of year | | $ | 188,500 | | | $ | 109,557 | | | $ | 95,480 | |
| | | | | | | | | | | | |
The accompanying notes to consolidated financial statements are an integral part of these statements.
F-5
HORSEHEAD HOLDING CORP. AND SUBSIDIARIES
NOTES TO CONSOLIDATED FINANCIAL STATEMENTS
December 31, 2011 and 2010
and for the Years Ended December 31, 2011, 2010 and 2009
(Amounts in thousands, except per share data)
NOTE A — ORGANIZATION
Horsehead Holding Corp. (“HHC”, “Horsehead” or the “Company”) was incorporated in the state of Delaware in May 2003. On December 23, 2003, the Company acquired substantially all of the operating assets and assumed certain liabilities of Horsehead Industries, Inc. and its wholly-owned subsidiaries. The Company commenced operations on December 24, 2003.
The Company is a producer of zinc and nickel-based products sold primarily to customers throughout the United States of America and Canada. It is also the largest recycler of electric arc furnace dust in the United States and a leading U.S. recycler of hazardous and non-hazardous waste for the specialty steel industry. It also provides short-line railroad service for the movement of materials for both the Company and outside customers. The Company operates as two business segments.
The consolidated financial statements include the accounts of Horsehead and its wholly-owned subsidiaries, Horsehead Corporation (“HC”), Chestnut Ridge Railroad Corp., Horsehead Zinc Recycling, LLC, Horsehead Metals Development, LLC, Horsehead Materials Recycling, LLC, The International Metals Reclamation Company, Inc. (“INMETCO”), Horsehead Canada Holding Corp. and Zochem Inc. (“Zochem”). Intercompany accounts and transactions have been eliminated in consolidation. During 2011, Horsehead Materials Recycling, LLC, which had no assets or liabilities, was dissolved.
NOTE B — SUMMARY OF SIGNIFICANT ACCOUNTING POLICIES
A summary of the significant accounting policies consistently applied in the preparation of the accompanying consolidated financial statements follows.
Use of Estimates
The preparation of financial statements in conformity with accounting principles generally accepted in the United States of America requires management to make estimates and assumptions that affect the reported amounts of assets and liabilities and disclosure of contingent assets and liabilities at the date of the financial statements and the reported amounts of revenues and expenses during the reporting period. The more significant items requiring the use of management estimates and assumptions relate to inventory reserves, bad debt reserves, environmental and asset retirement obligations, workers’ compensation liabilities, reserves for contingencies and litigation and fair value of financial instruments and business acquisitions. Management bases its estimates on the Company’s historical experience and its expectations of the future and on various other assumptions that are believed to be reasonable under the circumstances. Actual results could differ from those estimates.
Revenue Recognition
The Company recognizes revenues from the sale of finished goods at the point of passage of title or risk of loss, which is generally at the time of shipment. The Company’s service fee revenue is generally recognized at the time of receipt of electric arc furnace (“EAF”) dust, which the Company collects from steel mini-mill operators.
F-6
HORSEHEAD HOLDING CORP. AND SUBSIDIARIES
NOTES TO CONSOLIDATED FINANCIAL STATEMENTS — (Continued)
The components of net sales for the years ended December 31, 2011, 2010 and 2009 are as follows:
| | | | | | | | | | | | |
| | | 2011 | | | 2010 | | | 2009 | |
Zinc and nickel material goods | | $ | 365,300 | | | $ | 305,371 | | | $ | 176,628 | |
Service fee revenue | | | 63,839 | | | | 65,113 | | | | 32,581 | |
Other | | | 22,041 | | | | 11,878 | | | | 7,321 | |
| | | | | | | | | | | | |
| | $ | 451,180 | | | $ | 382,362 | | | $ | 216,530 | |
| | | | | | | | | | | | |
No customer exceeded 10% of consolidated net sales. However, our ten largest customers comprise 39% of our consolidated sales. Three customers comprise 86% of INMETCO’s net sales. Products and services are sold primarily to customers in the hot-dipped galvanizing, rubber, stainless steel and mini-mill markets.
Shipping and Handling Fees and Costs
The Company classifies all amounts billed to a customer in a sales transaction related to shipping and handling as revenue. The Company records shipping and handling costs incurred in cost of sales.
Cash and Cash Equivalents
The Company considers all highly liquid investments with maturities of approximately 90 days or less when purchased to be cash equivalents.
Accounts Receivable
The majority of the Company’s accounts receivable are due from customers primarily in the steel, rubber and galvanizing industries. Credit is extended based on an evaluation of a customer’s financial condition. Generally collateral is not required. Accounts receivable are stated at amounts due from customers net of an allowance for doubtful accounts. Accounts receivable outstanding longer than the contractual payment terms are considered past due. The Company determines its allowance by considering a number of factors, including the length of time trade accounts receivable are past due, the Company’s previous loss history, the customer’s current ability to pay its obligation to the Company, and the condition of the general economy and industry as a whole. The Company writes off accounts receivable when they become uncollectible. Payments subsequently received on such receivables are credited to the allowance for doubtful accounts. In 2010, the Company wrote off $22 in uncollectable accounts and recovered $292 of previously written off balances. In 2011, the Company wrote off $1,364 in uncollectable accounts and recovered $2 in previously written off balances. The provision for bad debt expense was $187, $(484) and $1,475 for 2011, 2010 and 2009, respectively. The accounts receivable balance at December 31, 2010 includes $8,267 from the Company’s insurance carrier relating to business interruption and property damage claims associated with the refinery incident at the Company’s Monaca, Pennsylvania facility in July of 2010.
Inventories
Inventories, which consist primarily of zinc and nickel-bearing materials, zinc products and supplies and spare parts, are valued at the lower-of-cost-or-market (“LCM”) using a weighted average actual cost method. Raw materials are purchased, as well as produced from the processing of EAF dust. Supplies and spare parts inventory used in the production process are purchased. Work-in-process and finished goods inventories are valued based on the costs of raw materials plus applicable conversion costs, including depreciation and overhead costs relating to associated process facilities.
F-7
HORSEHEAD HOLDING CORP. AND SUBSIDIARIES
NOTES TO CONSOLIDATED FINANCIAL STATEMENTS — (Continued)
Zinc and nickel are traded as commodities on the London Metals Exchange (“LME”) and, accordingly, product inventories are subject to price fluctuations. When reviewing inventory for LCM adjustments, the Company considers both the forward metals prices as quoted on the LME as of the reporting date and average LME price for the month ended in determining our estimate of net realizable value to determine if an adjustment is required. Our product revenues are based on the current or prior months’ LME average price. The LME average price upon which our product revenue is based has been reasonably correlated with the forward LME price that we use to make the lower of cost or market adjustments. See Footnote H — Inventories for further discussion on LCM adjustments.
Property, Plant and Equipment
Property, plant and equipment are stated at cost or acquisition date fair value. Depreciation is provided using the straight-line method. Ordinary maintenance and repairs are expensed as incurred; replacements and betterments are capitalized if they extend the useful life of the related asset. The estimated useful lives of property, plant and equipment are as follows:
| | | | |
Buildings, land and building improvements | | | 3 - 40 years | |
Machinery and equipment | | | 3 - 30 years | |
The Company reviews the carrying value of its intangible assets and long-lived assets for impairment whenever events or circumstances indicate that the carrying amounts may not be recoverable. In the event the Company would determine the carrying amounts would not be recovered, an impairment charge would be recorded for the difference between the fair value and the carrying value.
See Note F — Asset Write-Downs and Disposals for a discussion of asset write-downs in 2011 and 2009. There were no such events or circumstances during 2010 and therefore no impairment write-downs were charged to operations.
Environmental Obligations
The Company accrues for costs associated with environmental obligations when such costs are probable and reasonably estimated. Accruals for estimated costs are generally undiscounted and are adjusted as further information develops or circumstances change.
Insurance Claim Liabilities
The Company accrues for costs associated with self-insured retention under certain insurance policies (primarily workers’ compensation) based on estimates of claims, including projected development, from information provided by the third party administrator and the insurance carrier. Accruals for estimated costs are undiscounted and are subject to change based on development of such claims.
Asset Retirement Obligations
The fair values of asset retirement obligations are recognized in the period they are incurred if a reasonable estimate of fair value can be made. Asset retirement obligations primarily relate to environmental remediation at three Company locations. The liability is estimated based upon cost studies prepared to estimate environmental remediation upon closure and for purposes of obtaining state permits to operate the facilities. The liability is discounted using the Company’s estimated credit-adjusted risk free interest rate at the time the obligations are recognized.
F-8
HORSEHEAD HOLDING CORP. AND SUBSIDIARIES
NOTES TO CONSOLIDATED FINANCIAL STATEMENTS — (Continued)
Income Taxes
Deferred income taxes reflect the tax consequences on future years of differences between the tax bases of assets and liabilities and their respective financial reporting amounts. The Company recognizes the financial statement benefit of a tax position only after determining that the relevant tax authority would more likely than not sustain the position following an audit. For tax positions meeting the more-likely-than-not threshold, the amount recognized in the financial statements is the largest benefit that has a greater than 50 percent likelihood of being realized upon ultimate settlement with the relevant tax authority.
Stock-Based Compensation
The Company has a stock-based compensation plan and an equity incentive plan which are more fully described in Note S. Employee stock options granted on or after January 1, 2006 are expensed by the Company over the option vesting period, based on the estimated fair value of the award on the date of the grant using the Black-Scholes option-pricing model.
Financial Instruments
The following methods are used to estimate the fair value of the Company’s financial instruments:
Cash and cash equivalents, accounts receivable, notes payable due within one year, accounts payable, and accrued expenses approximate their fair value due to the short-term nature of these instruments. The money market demand account is considered to be in level 1 of the fair value hierarchy (see Note G – Cash and Cash Equivalents).
The financial swap and financial option instruments are carried at fair value and are considered to be in level 2 of the fair value hierarchy. The Company recognizes changes in fair value within the consolidated statements of operations as they occur (see Note T – Accounting for Derivative Instruments and Hedging Activities).
The Company’s Convertible Notes were initially valued at fair value and subsequently are carried at amortized cost. The fair value is considered to be in level 3 of the fair value hierarchy (see Note N – Long Term Debt).
The Company does not purchase, hold or sell derivative financial instruments unless it has an existing asset or obligation or anticipates a future activity that is likely to occur and will result in exposing it to market risk. The Company uses various strategies to manage its market risk, including the use of derivative instruments to limit, offset or reduce such risk. Derivative financial instruments are used to manage well-defined commodity price risks from the Company’s primary business activity. The fair values of derivative instruments are based upon a comparison of the Company’s internal valuations to the valuations provided by third party counterparties with whom they have entered into substantially identical derivative contracts. The Company also compares the counterparties valuations to ensure that there is an acceptable level of consistency among them. The valuations utilize forward pricing and an implied volatility of the underlying commodity as well as interest rate forwards and are therefore subject to fluctuation based on the movements of the commodity markets.
The Company is exposed to credit loss should counter-parties or clearing agents with which it has entered into derivative transactions become unable to satisfy their obligations in accordance with the underlying agreements. To minimize the risk of such losses, the Company utilizes LME-registered contracts entered into with the London Clearing House for a majority of the contracts.
Foreign Currency Translation
The functional currency of our Zochem subsidiary, which was acquired on November 1, 2011, is Canadian Dollars. Assets and liabilities are translated at period-end exchange rates. Income and expense items are
F-9
HORSEHEAD HOLDING CORP. AND SUBSIDIARIES
NOTES TO CONSOLIDATED FINANCIAL STATEMENTS — (Continued)
translated at weighted average rates of exchange prevailing during the year. Translation adjustments are included in other comprehensive income.
Supplemental Disclosure of Cash Flow Information
Cash paid for net interest in 2011, 2010 and 2009 approximated $253, $70 and $797, respectively. Cash paid for income taxes in 2011, 2010 and 2009 approximated $8,826, $8,740 and $753, respectively.
Reclassifications
Certain reclassifications have been made to the prior years’ consolidated financial statements to conform to the 2011 presentation.
Recently Issued Accounting Pronouncements
In May 2011, the Financial Accounting Standards Board (“FASB”) issued guidance clarifying how to measure and disclose fair value. This guidance amends the application of the “highest and best use” concept to be used only in the measurement of fair value of nonfinancial assets, clarifies that the measurement of the fair value of equity-classified financial instruments should be performed from the perspective of a market participant who holds the instrument as an asset, clarifies that an entity that manages a group of financial assets and liabilities on the basis of its net risk exposure can measure those financial instruments on the basis of its net exposure to those risks, and clarifies when premiums and discounts should be taken into account when measuring fair value. The fair value disclosure requirements also were amended. The Company does not believe that the adoption of the amended guidance will have significant effect on its consolidated financial statements. The amended guidance is effective prospectively for interim and annual periods beginning after December 15, 2011.
In June 2011, the FASB issued guidance eliminating the option to present components of other comprehensive income (“OCI”) in the statement of stockholders’ equity. The new guidance now requires entities to present all nonowner changes in stockholders’ equity either as a continuous statement of comprehensive income or as two separate but consecutive statements. The components of OCI have not changed, nor have the guidance on when OCI items are reclassified to net income; however, the amendments require entities to present all reclassification adjustments from OCI to net income on the face of the statement of comprehensive income. Subsequently in December 2011, the FASB issued additional guidance which indefinitely defers the previously announced requirement to present on the face of the financial statements reclassification adjustments for items that are reclassified from OCI to net income in the statements where the components of net income and the components of OCI are presented. The amendments in these standards do not change the items that must be reported in OCI, when an item must be reclassified to net income, or change the option for an entity to present components of OCI gross or net of the effect of income taxes. The Company does not believe that the adoption of either of the amended guidance’s will have a significant effect on its consolidated financial statements. The amended guidance’s are effective for fiscal years and interim periods within those fiscal years beginning after December 15, 2011.
NOTE C — EQUITY OFFERINGS
On September 1, 2009, the SEC declared effective the Company’s registration statement on Form S-3 originally filed by the Company with the SEC on July 16, 2009. On September 16, 2009, the Company completed an underwritten public offering of 8,050 shares of its common stock, including 1,050 shares sold pursuant to the underwriter’s exercise of their over-allotment option to purchase additional shares. At the public offering price of $10.50 per share, the aggregate price of shares of common stock sold by the Company was $84,525. The net proceeds realized by the Company from the offering, after accounting for $4,226 in underwriting discounts and commissions and $514 in expenses relating to the offering, were $79,785. The Company is using the net proceeds for general corporate purposes, which include capital expenditures, working capital, acquisitions and investments.
F-10
HORSEHEAD HOLDING CORP. AND SUBSIDIARIES
NOTES TO CONSOLIDATED FINANCIAL STATEMENTS — (Continued)
NOTE D — ACQUISITION OF BUSINESS
On November 1, 2011, the Company purchased all of the outstanding shares of Zochem, a zinc oxide producer located in Brampton, Ontario Canada, from Hudson Bay Mining and Smelting Co., Limited (“HudBay”). The Company paid $15,078 in cash at closing. The acquisition resulted in a gain on bargain purchase. The seller was motivated to sell the assets of Zochem as they were no longer deemed a core part of the seller’s business and their focus was to pursue development projects to further long term growth. The Company believes the acquisition broadens its geographic reach, diversifies its customer base and markets for zinc oxide, and provides added operational flexibility.
The acquisition has been accounted for using the acquisition method of accounting which requires, among other things, that assets acquired and liabilities assumed be recognized at their fair values as of the acquisition date. The following table summarizes the amounts recognized for assets acquired and liabilities assumed as of the acquisition date.
The purchase price was allocated as follows:
| | | | |
| | | Final
October 31, 2011 | |
Cash | | $ | — | |
Accounts receivable | | | 9,887 | |
Inventories | | | 6,281 | |
Prepaid expenses and other current assets | | | 114 | |
Property, plant and equipment | | | 6,898 | |
Intangible assets | | | 332 | |
HudBay Master Trust Receivable | | | 4,101 | |
Other assets | | | 381 | |
| | | | |
Total identifiable assets purchased | | | 27,994 | |
Accounts payable | | | 266 | |
Accrued expenses and other current liabilities | | | 2,846 | |
Noncurrent deferred income tax liability | | | 169 | |
Other long-term liabilities | | | 4,715 | |
| | | | |
Total liabilities assumed | | | 7,996 | |
Net assets purchased | | $ | 19,998 | |
Purchase price | | $ | 15,078 | |
Gain on bargain purchase | | $ | 4,920 | |
| | | | |
The Company recognized approximately $970 of acquisition related costs. These costs were expensed when incurred and are recorded in selling, general and administrative expense in the Consolidated Statement of Operations for the year ended December 31, 2011. The Company only expects to incur minimal additional acquisition related costs during the year ending December 31, 2012. The amount of revenue and net income related to Zochem which is included in the consolidated income statement for 2011 are $9,935 and $4,912, respectively.
Upon the determination that the Company was going to recognize a gain related to the bargain purchase of Zochem, the Company reassessed its assumptions and measurement of identifiable assets acquired and specified liabilities assumed and concluded that the valuation procedures and resulting measures were appropriate. As a result, the Company determined that the estimated fair values of assets acquired and liabilities assumed exceeded the purchase price by approximately $4,920 which was recorded as a gain on bargain purchase in its Consolidated Statement of Operations for the year ended December 31, 2011.
F-11
HORSEHEAD HOLDING CORP. AND SUBSIDIARIES
NOTES TO CONSOLIDATED FINANCIAL STATEMENTS — (Continued)
On December 31, 2009, the Company purchased all of the issued and outstanding capital stock of INMETCO, from Vale Inco Americas Inc. The Company also assumed certain financial assurance obligations associated with environmental regulatory requirements. The final purchase price, after post-closing adjustments, was $38,567 and was settled in the first quarter of 2010.
The purchase price was allocated as follows:
| | | | |
| | | Final | |
Cash | | $ | 763 | |
Accounts receivable | | | 8,970 | |
Inventories | | | 6,190 | |
Prepaid expenses and other current assets | | | 500 | |
Deferred income tax asset | | | 672 | |
Property, plant and equipment | | | 35,175 | |
Intangible assets | | | 2,400 | |
Other assets | | | 54 | |
| | | | |
Total identifiable assets purchased | | | 54,724 | |
Accounts payable | | | 2,314 | |
Accrued expenses and other current liabilities | | | 1,895 | |
Deferred income tax liability | | | 10,421 | |
Other long-term liabilities | | | 1,527 | |
| | | | |
Total liabilities assumed | | | 16,157 | |
Net assets purchased | | | 38,567 | |
Purchase price | | $ | 38,567 | |
| | | | |
NOTE E — NEW MARKETS TAX CREDIT PROGRAM FINANCING
On June 8, 2009, the Company completed a financing arrangement under the New Markets Tax Credit (“NMTC”) program to help fund its expansion project in Barnwell, South Carolina. The arrangement provides $5,925 of NMTC funds to be used for completion of the development of the project site and construction of buildings and other real property. The funds and the accrued interest thereon were held in escrow and were released upon completion of the aforementioned project site development. In December 2010, funds totaling $4,925 were released from escrow in accordance with the provisions of the program. The remaining funds were recorded as “Restricted cash” on the consolidated balance sheet of the Company as of December 31, 2010. In March 2011, the remaining funds and accrued interest totaling $1,023 were released from escrow in accordance with the provisions of the program.
A portion of the funds are in the form of an equity investment by Banc of America CDE III, LLC and CCM Community Development IV LLC, in the amount of $5,670. The equity holders are consolidated in the Company’s consolidated balance sheets as of December 31, 2011 and 2010 and do not share in the earnings and losses of the Company, however, they are entitled to guaranteed payments of 2% per annum on their investment. The equity holders also have the option (the “purchase option”) of having their investment purchased by the Company at the end of their seven year investment period in the project. The purchase option totals $360 and is treated as a reduction of their equity holdings and is recorded in “Other long-term liabilities” on the consolidated balance sheets of the Company as of December 31, 2011 and 2010. The Company incurred $838 in equity issuance costs related to the financing arrangement which were deducted from the equity proceeds, leaving net proceeds of $4,472 as a non-controlling interest in the Company’s Stockholders’ equity section as of
F-12
HORSEHEAD HOLDING CORP. AND SUBSIDIARIES
NOTES TO CONSOLIDATED FINANCIAL STATEMENTS — (Continued)
December 31, 2009. The first two guaranteed payments were made in January of 2010 and 2011 which reduced the balance of the non-controlling interest to $4,292 at December 31, 2011. A portion of the NMTC funds are in the form of a seven-year loan in the amount of $255. The loan is recorded in “Long-term debt, less current maturities” on the consolidated balance sheets of the Company as of December 31, 2011 and 2010.
NOTE F — ASSET WRITE-DOWNS AND DISPOSALS
In 2011, the Company recorded an impairment charge of $9,797 related to the Monaca, Pennsylvania facility, to adjust the net book value of the assets for the potential partial closure and/or disposition of the facility as a result of the expected future start-up of the new zinc plant currently under construction in North Carolina. The write-down resulted in a reduction of $16,301 in the cost and $6,504 in the accumulated depreciation of the Company’s property, plant and equipment. The Company plans on closing the smelting operation when the new zinc plant is commissioned in late 2013 but has not made any final decisions regarding other operations at the site. The useful lives of the assets related to the smelting operation were reduced to two years on December 31, 2011. Additional depreciation charges are not deemed to be material in 2012 and 2013. The impairment charge calculations were performed using average expected future cash flows under various likelihoods of asset retirements or dispositions. The cash flows were then discounted and compared to the book value of the related assets resulting in the impairment charge. The total amount of this write-down is included in “Cost of sales of zinc material and other goods (excluding depreciation)” on the Consolidated Statement of Operations. The net book value of the remaining assets of the Monaca, Pennsylvania facility was approximately $50,000 at December 31, 2011. The Company will continue to evaluate the carrying values of these assets each quarter.
In 2009, the Company wrote-down to net realizable value certain machinery and equipment and supplies inventories by $1,056 primarily related to its Beaumont, Texas recycling facility. The write-down resulted in a reduction of $1,349 in the cost and $628 in the accumulated depreciation of the Company’s machinery and equipment and $335 in its supplies inventories. In the third quarter of 2009, the Company made a decision to proceed with the completion of the construction of its Barnwell, South Carolina recycling facility and started both kilns in 2010. The Waelz kiln process that will be used at the Barnwell facility is a lower cost process than the process that was used at the Beaumont facility, therefore, management does not intend to use the higher cost capacity at the Beaumont facility. The total amount of the write-down is included in “Cost of sales of zinc material and other goods (excluding depreciation)” on the consolidated statement of operations.
Also, in 2011, the Company wrote off the remaining asset value of $507 related to the Beaumont, Texas recycling facility’s property, plant and equipment and supplies inventory due to plans to exit the facility in 2012. The write-down resulted in a reduction of $1,651 in the cost and $1,229 in the accumulated depreciation of the Company’s property, plant and equipment and $85 in its supplies inventories. The total amount of this write-down is included in “Cost of sales of zinc material and other goods (excluding depreciation)” on the consolidated statement of operations.
The Company incurred a loss of $203 in 2010 and a loss of $97 in 2009 on the disposal of machinery and equipment. The cost and accumulated depreciation of the assets disposed were $341 and $138 in 2010 and $270 and $173 in 2009. The Company did not record any disposals of assets in 2011.
NOTE G — CASH AND CASH EQUIVALENTS
Cash and cash equivalents consisted of the following at December 31, 2011 and 2010.
| | | | | | | | |
| | | 2011 | | | 2010 | |
Cash in bank | | $ | 163,392 | | | $ | 84,549 | |
Money market demand account | | | 25,108 | | | | 25,008 | |
| | | | | | | | |
| | $ | 188,500 | | | $ | 109,557 | |
| | | | | | | | |
F-13
HORSEHEAD HOLDING CORP. AND SUBSIDIARIES
NOTES TO CONSOLIDATED FINANCIAL STATEMENTS — (Continued)
The Company’s cash in bank balance is held in three U.S. banks and one Canadian bank at December 31, 2011 and three U.S. banks at December 31, 2010. The Company carries deposits in excess of federally insured amounts. At December 31, 2011, the Company had $5,551 in cash held at foreign institutions.
The money market demand accounts carried interest rates of 0.40% at December 31, 2011 and 2010, respectively. The balances approximate fair value.
See Footnote L — Restricted Cash and Footnote N — Long-Term Debt for additional information regarding increases in the Company’s cash in bank balance at December 31, 2011.
NOTE H — INVENTORIES
Inventories consisted of the following at December 31, 2011 and 2010:
| | | | | | | | |
| | | 2011 | | | 2010 | |
Raw materials | | $ | 12,205 | | | $ | 13,202 | |
Work-in-process | | | 4,025 | | | | 7,289 | |
Finished goods | | | 23,393 | | | | 17,486 | |
Supplies and spare parts | | | 13,807 | | | | 12,878 | |
| | | | | | | | |
| | $ | 53,430 | | | $ | 50,855 | |
| | | | | | | | |
Inventories are net of reserves for slow moving inventory of $3,663 and $2,546 at December 31, 2011 and 2010, respectively. The provisions for slow-moving inventory were $1,117, $(425) and $84 for 2011, 2010 and 2009, respectively.
The Company recorded LCM adjustments of $786 and $52 to its finished goods inventory during the third and fourth quarters of 2011, respectively, due to the decline of the LME zinc price. No LCM adjustment was recorded in 2010. The continued decline of the average LME price of zinc in 2008 which continued during the first quarter of 2009 resulted in the Company recording LCM adjustments of $2,822 to its finished goods inventory in the first quarter of 2009.
NOTE I — PREPAID EXPENSES AND OTHER CURRENT ASSETS
Prepaid expenses and other current assets consists of the following at December 31, 2011 and 2010.
| | | | | | | | |
| | | 2011 | | | 2010 | |
Refundable income taxes | | $ | 9,617 | | | $ | 11,762 | |
Prepaid hedge contracts | | | 17,723 | | | | 984 | |
Other | | | 2,972 | | | | 3,432 | |
| | | | | | | | |
| | $ | 30,312 | | | $ | 16,178 | |
| | | | | | | | |
See Footnote T — Accounting for Derivative Instruments and Hedging Activities for more information regarding Prepaid hedge contracts.
F-14
HORSEHEAD HOLDING CORP. AND SUBSIDIARIES
NOTES TO CONSOLIDATED FINANCIAL STATEMENTS — (Continued)
NOTE J — PROPERTY, PLANT AND EQUIPMENT
Property, plant and equipment consisted of the following at December 31, 2011 and 2010:
| | | | | | | | |
| | | 2011 | | | 2010 | |
Land and land improvements | | $ | 23,518 | | | $ | 18,412 | |
Buildings and building improvements | | | 38,659 | | | | 38,614 | |
Machinery and equipment | | | 240,185 | | | | 229,768 | |
Construction in progress | | | 47,691 | | | | 8,326 | |
| | | | | | | | |
| | | 350,053 | | | | 295,120 | |
Less accumulated depreciation | | | (90,001 | ) | | | (76,468 | ) |
| | | | | | | | |
| | $ | 260,052 | | | $ | 218,652 | |
| | | | | | | | |
Depreciation expense for 2011, 2010 and 2009 was $21,277, $17,880 and $15,637, respectively. In 2011, the Company capitalized $597 of interest related to construction of the new zinc facility. The above footnote disclosure includes the assets of the Bartlesville, Oklahoma facility and the Monaca, Pennsylvania power plant which are currently temporarily idled due to economic conditions.
NOTE K — INTANGIBLE ASSETS
Intangible assets consisted of the following at December 31, 2011 and 2010.
| | | | | | | | |
| | | 2011 | | | 2010 | |
Customer contracts | | $ | 10,915 | | | $ | 10,915 | |
Customer relationships | | | 1,518 | | | | 1,400 | |
Non-compete agreement | | | 789 | | | | 789 | |
Trademark | | | 806 | | | | 600 | |
Technology | | | 400 | | | | 400 | |
| | | | | | | | |
| | | 14,428 | | | | 14,104 | |
Less accumulated amortization | | | (1,821 | ) | | | (1,078 | ) |
| | | | | | | | |
| | $ | 12,607 | | | $ | 13,026 | |
| | | | | | | | |
The intangible assets are being amortized on a straight-line basis over their useful lives, which are fifteen to twenty years for the customer contracts and customer relationships, three to twenty years for the trademark, seventeen years for the non-compete agreement and ten years for the technology asset. The Company amortized $743 and $732 in 2011 and 2010, respectively and will amortize approximately $803 each year for the next five years and thereafter. The Company recognized intangible assets related to the Zochem acquisition on November 1, 2011 for customer relationships and trademarks.
NOTE L — RESTRICTED CASH
Restricted cash is related to the following at December 31, 2011 and 2010.
| | | | | | | | |
| | | 2011 | | | 2010 | |
Letters of credit | | $ | — | | | $ | 21,379 | |
ESOI deferred purchase price obligation | | | 2,500 | | | | 3,997 | |
NMTC | | | — | | | | 1,023 | |
| | | | | | | | |
| | $ | 2,500 | | | $ | 26,399 | |
| | | | | | | | |
F-15
HORSEHEAD HOLDING CORP. AND SUBSIDIARIES
NOTES TO CONSOLIDATED FINANCIAL STATEMENTS — (Continued)
The restricted cash relating to the ESOI deferred purchase price obligation is held in third-party managed trust accounts and was invested in money market and other liquid investment accounts.
During the first quarter of 2011, $2,520 was released from restricted cash and transferred to operating cash. This previously restricted cash represented the remaining restricted balance of $1,023, related to the financing and development of the Barnwell, South Carolina site which began operations in April 2010, in accordance with the provisions of the New Markets Tax Credit program, and $1,497 related to reduced collateral requirements under the ESOI purchase agreement.
During the third quarter of 2011, $21,379 was released from restricted cash and transferred to operating cash. Restricted cash totaling $2,708 relating to environmental obligations at our Palmerton location was released and replaced by a surety bond. The additional $18,671 in restricted cash was released and replaced with letters of credit under our new $60,000 Revolving Credit and Security Agreement (the “Revolving Credit Agreement”) which was entered into on September 28, 2011. See Footnote N — Long Term Debt for additional information regarding our new Revolving Credit Agreement.
NOTE M — DEPOSITS AND OTHER
Deposits and other at December 31, 2011 and 2010 consisted of the following:
| | | | | | | | |
| | | 2011 | | | 2010 | |
Noncurrent hedge contracts | | $ | 13,703 | | | $ | — | |
Deferred finance costs | | | 2,936 | | | | — | |
HudBay Master Trust Receivable | | | 4,039 | | | | — | |
Other | | | 619 | | | | 320 | |
| | | | | | | | |
| | $ | 21,297 | | | $ | 320 | |
| | | | | | | | |
See Footnote T — Accounting for Derivative Instruments and Hedging Activities for additional information regarding noncurrent hedge contracts. See Footnote N – Long Term Debt for additional information regarding deferred finance costs relating to the issuance of Convertible Notes and the closing of the Revolving Credit Agreement. As part of the acquisition of Zochem, the Company assumed the pension asset related to Zochem’s defined benefit plans and has set up a receivable from HudBay for the transfer of these assets. See Footnote R – Employee Benefit Plans for additional information regarding Zochem’s defined benefit pension plans.
NOTE N — LONG-TERM DEBT
Long-term debt consisted of the following at December 31, 2011 and 2010:
| | | | | | | | |
| | | 2011 | | | 2010 | |
Loan payable, related to NMTC | | $ | 255 | | | $ | 255 | |
$100.0 million 3.80% Convertible Notes due July 2017, net of debt discount | | | 79,408 | | | | — | |
| | | | | | | | |
| | | 79,663 | | | | 255 | |
Less portion currently payable | | | — | | | | — | |
| | | | | | | | |
| | $ | 79,663 | | | $ | 255 | |
| | | | | | | | |
The loan payable is associated with the NMTC program discussed in Note E — New Markets Tax Credit Program Financing. It is an interest only loan with principal due at the end of the term.
F-16
HORSEHEAD HOLDING CORP. AND SUBSIDIARIES
NOTES TO CONSOLIDATED FINANCIAL STATEMENTS — (Continued)
Convertible Senior Notes
On July 27, 2011, the Company issued $100,000 of 3.80% Convertible Senior Notes due 2017 (the “Convertible Notes”) in a private placement. The Company received proceeds of $100,000 and recognized $3,481 in issuance costs in connection with the offering. The Company intends to use the proceeds from the offering for the initial stages of construction of the new state-of-the-art zinc and diversified metal production facility under construction in Rutherford County, North Carolina and for general corporate purposes, including working capital needs, investment in business initiatives, capital expenditures and acquisitions.
The Convertible Notes will pay interest semiannually in arrears on July 1 and January 1 of each year, beginning on January 1, 2012, at a rate of 3.80% per annum and will mature on July 1, 2017. The Convertible Notes are convertible into shares of the Company’s common stock, cash, or a combination of the Company’s common stock and cash, at the Company’s election, at an initial conversion rate of 0.0666667 shares of the Company’s common stock per $1 principal amount of the Convertible Notes (approximately 6.666.67 underlying shares), which is equivalent to an initial conversion price of approximately $15.00 per share of common stock, subject to adjustment in certain circumstances, as defined in the indenture governing the Convertible Notes. The Company has stated that it intends to settle the par value in cash and the conversion spread in either cash, shares or a combination of both.
The Convertible Notes are senior unsecured obligations and will rank senior in right of payment to our future indebtedness that is expressly subordinated in right of payment to the notes; equal in right of payment to our existing and future unsecured indebtedness that is not so subordinated; effectively junior in right of payment to any of our secured indebtedness, to the extent of the value of the assets securing such indebtedness; and structurally junior to all existing and future indebtedness and other liabilities (including trade payables) of our subsidiaries.
Holders of the Convertible Notes may convert their Convertible Notes at the applicable conversion rate at any time on or after April 1, 2017 until the close of business on the second business day immediately preceding the maturity date. The Notes may be converted prior to April 1, 2017 only under certain circumstances. If the Company undergoes a fundamental change, as defined in the indenture governing the Convertible Notes, holders may require the Company to repurchase for cash all or a portion of their notes at a price equal to 100% of the principal amount of the notes to be repurchased plus any accrued and unpaid interest up to, but excluding the fundamental change repurchase date. The Company does not have the right to redeem the Convertible Notes prior to the stated maturity date of July 1, 2017 and no sinking fund is provided for the Convertible Notes.
In accordance with the guidance under ASC 815-015 Embedded Derivatives and ASC 470-20 Debt with Conversion and other Options, the Company separately accounted for the liability and equity components of the Convertible Notes to reflect the Company’s nonconvertible borrowing rate when interest cost is recognized in subsequent periods. The fair value of the liability component of the Convertible Notes was calculated to be $78,174 and was determined by measuring the fair value of a similar liability that does not have an associated equity component. The nonconvertible rate was determined by the Company to be 8.5%. The carrying amount of the embedded conversion option (the debt discount) of $21,826 was determined by deducting the fair value of the liability component from the initial proceeds of the Convertible Notes and was recorded, net of deferred taxes of $8,101, as additional paid-in capital. The Company is accreting the long-term debt balance to par value over the term of the bonds using the interest method as required by ASC 835-30 Imputation of Interest.
Costs of $3,481 associated with the issuance were allocated to the liability and equity components in proportion to the allocation of the proceeds of the Convertible Notes. As such, $2,721 were accounted for as debt issuance costs attributable to the liability component of the Convertible Notes and were capitalized in the Company’s Consolidated Balance Sheet as a component of other assets. These costs are being amortized to interest expense over the term of the Convertible Notes and are included as a component of interest expense in
F-17
HORSEHEAD HOLDING CORP. AND SUBSIDIARIES
NOTES TO CONSOLIDATED FINANCIAL STATEMENTS — (Continued)
the Company’s Consolidated Statement of Operations. The Company recognized interest expense of $192 related to the amortization of debt issuance costs for 2011. The remaining issuance costs of $760 were accounted for as equity issuance costs and recorded in additional-paid in capital.
During 2011, the Company recognized $2,861 in interest expense related to the Convertible Notes. Interest expense includes the contractual interest coupon of 3.80% and amortization of the discount on the liability component. This interest expense reflects an effective interest rate of 8.5%.
The carrying amount of the Convertible Notes was $79,408 with an unamortized discount of $20,592 at December 31, 2011. The fair value of the Convertible Notes at December 31, 2011 was estimated to be $93,000, the midpoint between the bid and asking price, per quotes obtained from active markets. The carrying amount of the equity component was $12,879 at December 31, 2011. The accumulated accretion related to the equity component was $846 at December 31, 2011.
Revolving Credit and Security Agreement
On September 28, 2011, the Company’s subsidiary Horsehead Corporation (“Horsehead”) entered into a Revolving Credit Agreement, as borrower, to support liquidity needs for the Company’s new zinc facility currently under construction in Rutherford County, North Carolina and to allow for the availability of previously restricted cash. Horsehead Holding Corp. also entered into the Revolving Credit Agreement, as guarantor of Horsehead’s obligations.
The Revolving Credit Agreement provides for a five-year senior secured revolving credit facility in an aggregate principal amount of up to $60,000. The aggregate amount of loans permitted to be made under the revolving credit facility may not exceed a borrowing base consisting of the lesser of: (a) $60,000, minus the aggregate undrawn amount of outstanding letters of credit, and (b) the sum of a certain portion of eligible accounts receivable and eligible inventory of Horsehead, minus the aggregate undrawn amount of outstanding letters of credit and certain availability reserves. Up to an aggregate of $30,000 will be available to Horsehead for the issuance of letters of credit, which reduces availability under the Revolving Credit Agreement. At December 31, 2011, the Company had $17,781 in letters of credit outstanding under the Revolving Credit Agreement. Horsehead’s obligations under the Revolving Credit Agreement are secured by a first priority lien (subject to certain permitted liens) on substantially all of the tangible and intangible assets of Horsehead. At December 31, 2011, there were no outstanding borrowings under the Revolving Credit Agreement. Undrawn availability under the Revolving Credit Agreement was $30,302 at December 31, 2011.
Borrowings by Horsehead under the Revolving Credit Agreement will bear interest at a rate per annum which, at the option of Horsehead, can be either: (a) a domestic rate equal to the “alternate base rate,” as determined under the Revolving Credit Agreement, plus an applicable margin (ranging from 0.25% to 1.00%) based on average undrawn availability, or (b) a eurodollar rate equal to the “eurodollar rate,” as determined under the Revolving Credit Agreement, plus an applicable margin (ranging from 1.75% to 2.50%) based on average undrawn availability. Horsehead will pay a letter of credit fee to the lenders under the Revolving Credit Agreement ranging from 1.75% to 2.50%, based on average undrawn availability, and a fronting fee to the issuing bank equal to 0.25% per annum on the average daily face amount of each outstanding letter of credit, as well as certain other related charges and expenses.
The Revolving Credit Agreement contains customary events of default. During an event of default, if the agent or lenders holding greater than 66 2/3% of the advances under the facility so elect, the interest rate applied to any outstanding obligations will be equal to the otherwise applicable rate (including the highest applicable margin) plus 2.0% and any letter of credit fees will be increased by 2.0%. Upon (a) the occurrence of an event of default related to the bankruptcy of Horsehead or Horsehead Holding Corporation or (b) at the option of lenders holding greater than 66 2/3% of the advances under the facility, the occurrence of any other event of default, all obligations under the Revolving Credit Agreement will become immediately due and payable.
F-18
HORSEHEAD HOLDING CORP. AND SUBSIDIARIES
NOTES TO CONSOLIDATED FINANCIAL STATEMENTS — (Continued)
Horsehead will pay an unused line fee to the lenders under the Revolving Credit Agreement ranging from 0.25% to 0.375% per annum, based on average undrawn availability, times the amount by which the maximum revolving advance amount exceeds the average daily unpaid balance of revolver loans and undrawn amount of any outstanding letters of credit during any calendar quarter.
The Revolving Credit Agreement contains a minimum fixed charge coverage ratio of 1.15:1.00 which Horsehead must comply with in the event that undrawn availability is less than or equal to $10,000 on any business day or is less than or equal to $12,500 for any consecutive five business days. The Revolving Credit Agreement also contains customary restrictive negative covenants as well as customary reporting and other affirmative covenants. The Company was in compliance with all covenants at December 31, 2011.
The Company incurred issuance costs of $428 in connection with the Revolving Credit Agreement. These costs were capitalized in the Company’s Consolidated Balance Sheet as a component of other assets. The issuance costs will be amortized to interest expense over the term of the Revolving Credit Agreement. Interest expense of $21 related to the amortization of deferred finance costs was recorded in 2011.
Other
At December 31, 2011, the Company had $17,781 of letters of credit outstanding under the new $60,000 Revolving Credit Agreement to collateralize self-insured claims for workers’ compensation and other general insurance claims and to collateralize closure bonds for two of the Company’s three facilities located in Pennsylvania. The Company also has a surety bond outstanding in the amount of $2,579 to collateralize a closure bond for the Company’s third facility located in Pennsylvania. At December 31, 2010, the Company had $20,360 of letters of credit outstanding relating to these obligations which was collateralized by restricted cash of $21,379.
Aggregate future maturities of long-term debt are as follows:
| | | | |
Year Ending December 31, | | | |
2016 | | $ | 255 | |
2017 | | | 100,000 | |
| | | | |
| | $ | 100,255 | |
| | | | |
NOTE O — ACCRUED EXPENSES
Accrued expenses at December 31, 2011 and December 31, 2010 consisted of the following:
| | | | | | | | |
| | | 2011 | | | 2010 | |
Employee related costs | | $ | 10,056 | | | $ | 8,877 | |
EAF dust processing reserve | | | 4,488 | | | | 4,826 | |
Workers Compensation insurance claim liabilities (see Note Q) | | | 2,400 | | | | 2,400 | |
Unearned tolling revenue | | | 2,055 | | | | 1,872 | |
Other | | | 12,525 | | | | 8,286 | |
| | | | | | | | |
| | $ | 31,524 | | | $ | 26,261 | |
| | | | | | | | |
F-19
HORSEHEAD HOLDING CORP. AND SUBSIDIARIES
NOTES TO CONSOLIDATED FINANCIAL STATEMENTS — (Continued)
NOTE P — INCOME TAXES
The components of income (loss) before income taxes for the years ended December 31 are as follows:
| | | | | | | | | | | | |
| | | 2011 | | | 2010 | | | 2009 | |
United States | | $ | 27,430 | | | $ | 39,179 | | | $ | (44,160 | ) |
Canada | | | 4,926 | | | | — | | | | — | |
| | | | | | | | | | | | |
Total | | $ | 32,356 | | | $ | 39,179 | | | $ | (44,160 | ) |
| | | | | | | | | | | | |
The components of income tax provision (benefit) for the years ended December 31, 2011, 2010 and 2009 are as follows:
| | | | | | | | | | | | |
| | | 2011 | | | 2010 | | | 2009 | |
Current provision (benefit): | | | | | | | | | | | | |
Federal | | $ | 3,616 | | | $ | (2,815 | ) | | $ | (25,189 | ) |
State and local | | | 1,492 | | | | 1,369 | | | | (986 | ) |
Foreign | | | 146 | | | | — | | | | — | |
| | | | | | | | | | | | |
| | | 5,254 | | | | (1,446 | ) | | | (26,175 | ) |
Deferred provision (benefit): | | | | | | | | | | | | |
Federal | | | 5,029 | | | | 17,907 | | | | 10,584 | |
State and local | | | 750 | | | | (2,052 | ) | | | (1,098 | ) |
Foreign | | | (131 | ) | | | — | | | | — | |
| | | | | | | | | | | | |
| | | 5,648 | | | | 15,855 | | | | 9,486 | |
| | | | | | | | | | | | |
Income tax provision (benefit) | | $ | 10,902 | | | $ | 14,409 | | | $ | (16,689 | ) |
| | | | | | | | | | | | |
The reconciliation between income tax expense (benefit) and the amount computed by applying the statutory federal income tax rate of 35% to income before income taxes is as follows:
| | | | | | | | | | | | |
| | | 2011 | | | 2010 | | | 2009 | |
Income taxes at statutory rate | | $ | 11,325 | | | $ | 13,713 | | | $ | (15,456 | ) |
State and local income taxes, net of federal tax effect | | | 1,457 | | | | (444 | ) | | | (1,354 | ) |
Domestic production activity deduction | | | (46 | ) | | | 197 | | | | 571 | |
Transaction cost | | | 287 | | | | — | | | | — | |
Gain on acquisition | | | (1,714 | ) | | | — | | | | — | |
Other | | | (407 | ) | | | 943 | | | | (450 | ) |
| | | | | | | | | | | | |
Income tax provision (benefit) | | $ | 10,902 | | | $ | 14,409 | | | $ | (16,689 | ) |
| | | | | | | | | | | | |
F-20
HORSEHEAD HOLDING CORP. AND SUBSIDIARIES
NOTES TO CONSOLIDATED FINANCIAL STATEMENTS — (Continued)
The components of the Company’s net deferred tax asset (liability) at December 31, 2011 and 2010 are as follows:
| | | | | | | | |
| | | 2011 | | | 2010 | |
Deferred tax assets: | | | | | | | | |
Accrued fringe benefits | | $ | 1,172 | | | $ | 677 | |
Prepaid hedge contracts | | | — | | | | 667 | |
Stock compensation | | | 2,767 | | | | 2,243 | |
State tax credits | | | 2,180 | | | | 2,180 | |
State net operating loss carryforward | | | 1,428 | | | | 859 | |
Inventory | | | 1,541 | | | | 3,505 | |
Partnership 704(b) | | | 1,998 | | | | — | |
Other | | | 4,030 | | | | 4,656 | |
| | | | | | | | |
Total deferred tax assets | | | 15,116 | | | | 14,787 | |
| | | | | | | | |
Deferred tax liabilities: | | | | | | | | |
Property, plant and equipment | | | (45,161 | ) | | | (44,174 | ) |
Accrued hedge contracts | | | (5,515 | ) | | | — | |
Deferred financing costs | | | (7,644 | ) | | | — | |
Intangible assets | | | (933 | ) | | | (889 | ) |
Other | | | (1,298 | ) | | | (1,189 | ) |
| | | | | | | | |
Total deferred tax liabilities | | | (60,551 | ) | | | (46,252 | ) |
Gross deferred tax liability | | | (45,435 | ) | | | (31,465 | ) |
Valuation reserve | | | (325 | ) | | | (196 | ) |
| | | | | | | | |
Net deferred tax liability | | $ | (45,760 | ) | | $ | (31,661 | ) |
| | | | | | | | |
The above deferred tax assets and liabilities at December 31, 2011 and 2010 have been included in the Company’s consolidated balance sheets as follows:
| | | | | | | | |
| | | 2011 | | | 2010 | |
Current deferred tax asset | | $ | — | | | $ | 6,090 | |
Current deferred tax (liability) | | | (1,716 | ) | | | — | |
| | | | | | | | |
Net current deferred tax (liability) asset | | | (1,716 | ) | | | 6,090 | |
Non-current deferred tax asset | | | 1,855 | | | | 1,984 | |
Non-current deferred tax (liability) | | | (45,899 | ) | | | (39,735 | ) |
| | | | | | | | |
Net non-current deferred tax (liability) | | | (44,044 | ) | | | (37,751 | ) |
Net deferred tax asset (liability) | | $ | 45,760 | | | $ | (31,661 | ) |
| | | | | | | | |
The effective tax rates for 2011 and 2010 were 33.7% and 36.8%, respectively.
The Company and its subsidiaries file income tax returns in the U.S. and various state jurisdictions. Tax regulations within each jurisdiction are subject to the interpretation of the related tax laws and regulations and require significant judgment to apply. The tax years that remain subject to examination generally range from 2007 through 2011. Due to the acquisition of Zochem on November 1, 2011, the Company will file a tax return
F-21
HORSEHEAD HOLDING CORP. AND SUBSIDIARIES
NOTES TO CONSOLIDATED FINANCIAL STATEMENTS — (Continued)
in Canada. U.S. income taxes and foreign withholding taxes are not provided on undistributed earnings of foreign subsidiaries because it is expected such earnings will be permanently reinvested in the operations of such subsidiaries. It is not practical to determine the amount of income tax liability that would result had such earnings been repatriated.
The Company generated tax net operating losses as a result of increased capital expenditure incentives enacted during 2010.
As of December 31, 2011 and 2010, the Company had state net operating loss carry forward benefits of $1,428 and $859 which will begin to expire in 2021. The Company had state investment tax credit benefits of $2,180 that will expire between 2021 and 2026. The Company recorded a $325 valuation allowance as it is more likely that not that the credits will not be fully realized.
The Company had no unrecognized tax benefits as of December 31, 2011 and 2010, respectively. The Company classifies all income tax related interest and penalties as interest expense, which were not significant for 2011, 2010 and 2009.
NOTE Q — OTHER LONG-TERM LIABILITIES
Other long-term liabilities consisted of the following at December 31, 2011 and 2010:
| | | | | | | | |
| | | 2011 | | | 2010 | |
Environmental obligations | | $ | 626 | | | $ | 2,141 | |
Insurance claim liabilities | | | 6,699 | | | | 6,628 | |
Asset retirement obligations | | | 3,891 | | | | 2,861 | |
Deferred purchase price obligation | | | 5,335 | | | | 5,374 | |
Pension liability | | | 4,445 | | | | — | |
Other | | | 432 | | | | 497 | |
| | | | | | | | |
| | $ | 21,428 | | | $ | 17,501 | |
| | | | | | | | |
Environmental obligations
Upon the acquisition of the operating assets and the assumption of certain liabilities of Horsehead Industries, Inc. in 2003 (see Note A — Organization), the Company assumed certain liabilities related to environmental issues cited in a 1995 Consent Decree (the “Consent Decree”) between Horsehead Industries, Inc. and the United States Environmental Protection Agency (“EPA”) and the Pennsylvania Department of Environmental Protection (“PADEP). The Consent Decree calls for, among other things, the removal of certain materials containing lead from the Company’s Palmerton, Pennsylvania facility and the construction of a storage building for calcine feed materials at the Palmerton facility. The removal of the lead containing material was completed in 2008. The environmental obligation related to the storage building was recorded based on the estimated undiscounted costs required to achieve compliance with the Consent Decree and totaled $1,457 at December 31, 2010. In June 2011, the Company received notice from PADEP concurring with our assessment that construction of the storage building for calcine feed was not necessary in light of the material management practices employed at the Palmerton, Pennsylvania facility which comply with applicable environmental regulations for the facility. The reserve for $1,457 formerly established on our balance sheet was removed during the second quarter of 2011.
Environmental obligations also include estimated post-closure costs required by the EPA’s Resource Conservation and Recovery Act (“RCRA”) related to a portion of the property at the Company’s Bartlesville, Oklahoma facility. This liability was recorded based on the estimated costs required to achieve compliance with
F-22
HORSEHEAD HOLDING CORP. AND SUBSIDIARIES
NOTES TO CONSOLIDATED FINANCIAL STATEMENTS — (Continued)
the RCRA. In 2006, a post-closure permit was issued by the Oklahoma Department of Environmental Quality which triggered the beginning of a 30 year period of post-closure care. Based on the Company’s annual review of the estimated annual costs required for the care specified under the permit, the liability was adjusted in 2011 and 2010 to reflect the discounted net present value of these costs using an undiscounted obligation of $1,471 in 2011 and $1,554 in 2010 and a discount rate of 6%. The environmental obligations related to Bartlesville at December 31, 2011 totaled $669, of which $43 is recorded as a current liability. The liability was $728 at December 31, 2010, of which $44 is recorded as a current liability.
Insurance claim liabilities
Insurance claim liabilities represent the non-current portion of the company’s liabilities for self-insured retention under certain insurance policies, primarily related to workers’ compensation. The Company estimates $2,400 of workers’ compensation claims will be paid in 2012 (see Note 0 — Accrued Expenses).
Asset retirement obligations
The Company currently recognizes a liability for the present value of future asset retirement obligations if a reasonable estimate of the fair value of that liability can be made. The associated asset retirement costs are capitalized as part of the carrying amount of the long-lived asset. Three such assets and related liabilities exist.
The first is for the environmental remediation upon ultimate closure of the Ellwood City facility. The original long lived asset cost was determined to be $744 and is being amortized and accreted over a 20 year period.
The second is for the ultimate closure of the Monaca facility’s fully permitted landfill. The original long lived asset cost was determined to be $632 and is being amortized and accreted over an 18 year period. During the fourth quarter of 2011, the Company received notification from PADEP that an additional bond would be required to fulfill obligations related to the landfill at the Monaca facility. The Company determined the additional long lived asset to be $832 and this amount is being amortized and accreted over a 10 year period.
The third relates to the permitted storage units at the Palmerton facility. Its original cost was valued at $206 and is being amortized and accreted over a 25 year period.
The related depreciation expense for 2011, 2010 and 2009 associated with the capitalized costs was $52, $55 and $43, respectively, and the related expense (which is included in interest expense) associated with accreting the liability for 2011, 2010 and 2009 was $196, $183 and $103, respectively.
Deferred asset purchase price obligations
The Company is paying a portion of the purchase price of ESOI’s EAF dust collection business in a series of annual fixed and quarterly variable payments through 2025. The Company was required to provide security in the amount of $4,000 for the fixed portion of the payments until December 31, 2010. In 2009, the Company paid $4,000 into an escrow account to satisfy the requirement. See Note L — Restricted Cash. The amount of the security was reduced to $2,500 in January 2011.
The payments have been discounted using rates of approximately 8.4% and 12.0% for the fixed and variable payments, respectively. The discount rates were determined based on the average yield on comparable corporate bonds and the industry weighted average cost of capital. At December 31, 2011 and 2010, the net present value of the payments were approximately $6,217 and $6,780, respectively, of which $881 is recorded as a current liability at December 31, 2011 and $1,406 is recorded as a current liability at December 31, 2010.
F-23
HORSEHEAD HOLDING CORP. AND SUBSIDIARIES
NOTES TO CONSOLIDATED FINANCIAL STATEMENTS — (Continued)
Pension liability
As a result of the acquisition of Zochem, the Company assumed the pension assets, which are recorded as a receivable from HudBay’s Master Trust at December 31, 2011, and related pension liability for the defined pension benefit plans for salaried and hourly employees. For further discussion of the pension liability see Footnote R – Employee Benefit Plans.
NOTE R — EMPLOYEE BENEFIT PLANS
The Company maintains two defined contribution 401(k) plans that cover substantially all of its employees at the Horsehead and INMETCO locations. All Horsehead and INMETCO salaried employees and INMETCO hourly employees are automatically enrolled at 4% of their pay upon date of hire. Effective October 1, 2009, the Company amended the eligibility requirements in the plan covering the Horsehead Corporation hourly employees. Under the amendment, hourly employees are eligible to enroll ninety days after their date of hire. Employees may make elective deferral contributions to the plans subject to certain plan and statutory limitations. The Company makes all contributions to the plans on behalf of each employee who has achieved one year of service.
Under the plans covering the salaried employees and the INMETCO hourly employees, the Company contributes 3% of an employee’s total compensation and also matches 50% up to the first 4% of an employee’s deferral contribution based on total compensation. The provisions for all contributions to the plan for 2011, 2010 and 2009 were approximately $1,008, $956 and $601, respectively.
In 2011, 2010 and 2009, the Company made contributions and matching contributions to the plans covering the Horsehead Corporation hourly employees in accordance with the provisions of the various basic labor agreements. The provisions for all contributions for 2011, 2010 and 2009 were approximately $1,457, $1,381 and $1,361 respectively.
As part of the acquisition of Zochem, Inc, on November 1, 2011, the Company assumed the pension assets, which are recorded as a receivable from HudBay’s Master Trust at December 31, 2011, and pension liability for both the hourly and salary pension plans which were in effect at the time of the acquisition. The hourly and salaried plan cover 36 active and 24 retired employees. These plans are maintained and contributions are made in accordance with the Pension Benefits Act of Ontario, which prescribes the minimum contributions that the Company must make to the Plans.
Expense related to the plan for the two months ended December 31, 2011 was $44.
Net periodic pension costs for the two months ended December 31, 2011:
| | | | |
| | | For the two
months ended
December 31,
2011 | |
Components of net periodic benefit cost: | | | | |
Service Cost | | $ | 34 | |
Interest Cost | | | 32 | |
Expected return on plan assets | | | (42 | ) |
Amortization of prior service cost | | | 9 | |
Losses | | | 9 | |
Currency translation | | | 2 | |
Settlements and curtailments | | | — | |
| | | | |
Net periodic benefit cost | | $ | 44 | |
| | | | |
F-24
HORSEHEAD HOLDING CORP. AND SUBSIDIARIES
NOTES TO CONSOLIDATED FINANCIAL STATEMENTS — (Continued)
Net periodic pension cost that is expected to be recognized from the amortization of prior service cost, net loss and transition asset is estimated to be $46 in 2011.
The change in the funded status of the pension plans for the two months ended December 31, 2011 is as follows:
| | | | |
| | | For the two
months ended
December 31,
2011 | |
Change in benefit obligation: | | | | |
Benefit obligation at October 31, 2011 | | $ | 4,525 | |
Service cost | | | 34 | |
Interest cost | | | 33 | |
Plan participant’s contributions | | | — | |
Actuarial (gains) losses | | | (1 | ) |
Currency translation | | | (135 | ) |
Benefits paid | | | (11 | ) |
| | | | |
Benefit obligation at end of year | | $ | 4,445 | |
| |
Change in plan assets: | | | | |
HudBay Master Trust Receivable at October 31, 2011 | | $ | 4,101 | |
HudBay Master Trust Receivable at end of year | | $ | 4,039 | |
Funded status of plan | | $ | (406 | ) |
| | | | |
| | | | |
| | | December 31,
2011 | |
Amounts recognized in the balance sheet consist of: | | | | |
Noncurrent assets — see Footnote M — Deposits and other | | $ | 4,039 | |
Noncurrent liabilities — see Footnote Q — Other long term liabilities | | $ | 4,445 | |
Prior to the acquisition date of November 1, 2011, the hourly and salary defined benefit plans of Zochem were included in the Master Trust of HudBay. As part of the purchase agreement, HudBay agreed to fully fund both pension plans as of June 30, 2011 and transfer cash to the Zochem plans. As of October 31 and December 31, 2011 the plan had a receivable from HudBay’s Master Trust of $4,101 and $4,039, respectively. As of February 27, 2012, 100% of the agreed upon pension assets had been transferred.
The measurement date for both the hourly and salaried plan is December 31, 2011.
The accumulated benefit obligation for all defined benefit pension plans as of December 31, 2011 was $4,262 .
The expected contributions by the Company for 2012 are estimated to be $393.
Benefit payments for pension benefits, which are primarily funded by the pension plan are expected to be paid as follows:
| | | | |
2012 | | $ | 117 | |
2013 | | | 133 | |
2014 | | | 149 | |
2015 | | | 152 | |
2016 | | | 156 | |
2017 — 2021 | | | 813 | |
F-25
HORSEHEAD HOLDING CORP. AND SUBSIDIARIES
NOTES TO CONSOLIDATED FINANCIAL STATEMENTS — (Continued)
The weighted average assumptions as of December 31, 2011 were as follows:
| | |
Discount rate | | 4.50% |
Expected return on plan assets | | 6.75% |
Salaried plan — average salary increase rate | | 2.50% per year plus a merit scale |
Salaried plan — average salary increase rate | | 0.00% |
These assumptions are used to develop the projected obligation at fiscal year end and to develop net periodic benefit cost for the subsequent fiscal year. Therefore, for fiscal 2011, the assumptions used to determine net periodic benefit costs were established at December 31, 2010, while the assumptions used to determine the benefit obligations were established at December 31, 2011. The Canadian Institute of Actuaries has partnered with Natcan Investment Management to produce yield curves. The yield curve indicates a discount rate of 4.5% would be appropriate.
The Company’s planned investment policy for assets of the plans is to obtain a reasonable long-term return consistent with the level of risk assumed. The Company also seeks to control the cost of funding the plans within prudent levels of risk through the investment of plan assets and seeks to provide diversification of assets in an effort to avoid the risk of large losses and to maximize the return to the plans consistent with market and economic risk.
NOTE S — STOCK-BASED COMPENSATION
The Company adopted a stock option plan in 2004 (the “2004 Plan”) with subsequent amendments in December 2005 and November 2006. The 2004 Plan provides for the granting of options to acquire shares of common stock of the Company to key employees of the Company and its subsidiaries. A total of 1,685 shares are authorized and reserved for issuance under the 2004 Plan. Options granted under the 2004 Plan are non-qualified stock options within the meaning of Section 409A of the Internal Revenue Code of 1986, as amended. The 2004 Plan is administered by a committee designed by the Board of Directors of the Company which makes all determinations relating to the 2004 Plan including, but not limited to, those individuals who shall be granted options, the date each option shall vest and become exercisable, the number of shares to be subject to each option, and the option price. All options granted under the 2004 Plan to date are fully vested due to the change in ownership of the Company in 2007 that resulted from an equity offering and stock repurchase. The options may be exercised at any time prior to September 15, 2014.
The following summarizes the activity under the 2004 Plan:
| | | | | | | | | | | | |
| | | Number of
Shares | | | Range of
Exercise
Price | | | Weighted
Average
Exercise Price | |
Options outstanding at January 1, 2007 | | | 1,035 | | | $ | 1.01-$7.39 | | | $ | 1.82 | |
Exercised in 2007 | | | 394 | | | $ | 1.01-$7.39 | | | $ | 1.82 | |
| | | | | | | | | | | | |
Options outstanding at December 31, 2007 | | | 641 | | | $ | 1.01-$7.39 | | | $ | 1.82 | |
Exercised in 2008 | | | 478 | | | $ | 1.01-$7.39 | | | $ | 2.10 | |
| | | | | | | | | | | | |
Options outstanding at December 31, 2008 | | | 163 | | | $ | 1.01 | | | $ | 1.01 | |
Exercised in 2009 | | | 12 | | | $ | 1.01 | | | $ | 1.01 | |
| | | | | | | | | | | | |
Options outstanding at December 31, 2009 | | | 151 | | | $ | 1.01 | | | $ | 1.01 | |
Exercised in 2010 | | | 13 | | | $ | 1.01 | | | $ | 1.01 | |
| | | | | | | | | | | | |
Options outstanding at December 31, 2010 | | | 138 | | | $ | 1.01 | | | $ | 1.01 | |
Exercised in 2011 | | | 0 | | | $ | 1.01 | | | $ | 1.01 | |
| | | | | | | | | | | | |
Options outstanding at December 31, 2011 | | | 138 | | | $ | 1.01 | | | $ | 1.01 | |
| | | | | | | | | | | | |
F-26
HORSEHEAD HOLDING CORP. AND SUBSIDIARIES
NOTES TO CONSOLIDATED FINANCIAL STATEMENTS — (Continued)
The aggregate intrinsic value at December 31, 2011 of the options outstanding under the 2004 Plan was $1,104.
At December 31, 2011, the outstanding options under the 2004 Plan had 2.70 years of remaining life.
In 2006, the Company adopted The Horsehead Holding Corp. 2006 Long-Term Equity Incentive Plan (“the 2006 Plan”) which provides for grants of stock options, stock appreciation rights, restricted stock, restricted stock units, deferred stock units and other equity-based awards. Directors, officers and other employees of the Company, as well as others performing services for the Company, are eligible for grants under the 2006 Plan. The 2006 Plan is administered by the Company’s Board of Directors (“the Board”).
A total of 1,489 shares of the Company’s common stock were initially authorized for issuance under the 2006 Plan, which amount increases annually by an amount equal to 1% of the number of shares on the Company’s common stock outstanding or such lesser amount determined by the Company’s Board of Directors (the “Board”). The number of shares available for issuance under the 2006 Plan is subject to adjustment in the event of a reorganization, stock split, merger or similar change in the corporate structure or the outstanding shares of common stock. In the event of any of these occurrences, the Company may make any adjustments considered appropriate to, among other things, the number and kind of shares, options or other property available for issuance under the 2006 Plan or covered by grants previously made under the 2006 Plan. The shares available for issuance under the 2006 Plan may be, in whole or in part, authorized and unissued or held as treasury shares.
The following is a summary of the material terms of the 2006 Plan.
Eligibility — Directors, officers and other employees of the Company, as well as other individuals performing services for the Company or to whom the Company has extended an offer of employment, are eligible to receive grants under the 2006 Plan. However, only employees may receive grants of incentive stock options.
Stock Options — The Board may award grants, subject to certain limitations, of incentive stock options conforming to the provisions of Section 422 of the Internal Revenue Code, and other non-qualified stock options.
The exercise price of an option granted under the 2006 Plan may not be less than fair market value on the date of the grant.
The Board will determine the term of each option in its discretion. However, no term may exceed ten years from the date of grant, or, in the case of an incentive option granted to a person who owns stock representing more than 10% of our voting power, five years from the date of grant.
Stock Appreciation Rights(“SARs”) — SARs entitle a participant to receive the amount by which the fair market value of a share of the Company’s common stock on the date of exercise exceeds the grant price of the SAR. The grant price and the term of a SAR will be determined by the Board, except that the grant price of a SAR may not be less than the fair market value of the shares of the Company’s common stock on the grant date.
Termination of Options and SARs — Options and SARs under the 2006 Plan, whether or not then exercisable, generally cease vesting when a grantee ceases to be a director, officer or employee of, or to otherwise perform services for the Company.
Restricted Stock — The Board may award restricted stock subject to the conditions and restrictions, and for the duration, which will generally be at least six months, that it determines in its discretion. Unless the Board determines otherwise, all restrictions on a grantee’s restricted stock will lapse when the grantee ceases to be a director, officer or employee of, or to otherwise perform services for the Company.
Restricted Stock Units; Deferred Stock Units — The Board may award restricted stock units subject to the conditions and restrictions, and for the duration, which will generally be at least six months, that it determines in its discretion. Each restricted stock unit is equivalent in value to one share of common stock and entitles the grantee to receive one share of common stock for each restricted stock unit at the end of the vesting period applicable to such restricted stock unit. Unless the Board determines otherwise, all restrictions on a grantee’s restricted stock units will lapse when the grantee ceases to be a director, officer or employee of, or to otherwise perform services for the Company.
F-27
HORSEHEAD HOLDING CORP. AND SUBSIDIARIES
NOTES TO CONSOLIDATED FINANCIAL STATEMENTS — (Continued)
Performance Awards — The Board may grant performance awards contingent upon achievement of specified performance criteria. Performance awards may include specific dollar-value target awards, such as performance units, the value of which is established by the Board at the time of grant, and/or performance shares, the value of which is equal to the fair market value of a share of common stock on the date of grant. A performance award may be paid in cash and/or shares of the Company’s common stock or other securities.
Vesting — The terms and conditions of each award made under the equity incentive plan, including vesting requirements, will be set forth consistent with the 2006 Plan in a written agreement with the grantee. Except in limited circumstances, no award under the 2006 Plan may vest and become exercisable within six months of the date of grant, unless the Board determines otherwise.
Amendment and Termination of the Equity Incentive Plan — The Board may amend or terminate the 2006 Plan in its discretion, except that no amendment will become effective without prior approval of the company’s stockholders if such approval is necessary for continued compliance with applicable stock exchange listing requirements. Furthermore, any termination may not materially and adversely affect any outstanding rights or obligations under the 2006 Plan without the affected participant’s consent. If not previously terminated by the Board, the 2006 Plan will terminate on the tenth anniversary of its adoption.
On January 16, 2007, the Board authorized the issuance of options to purchase 1,085 shares of the Company’s common stock to certain officers and employees of the Company under terms of the 2006 Plan. The exercise price is $13.00 per share. The options have a term of ten years and vest ratably over a 5 year period from date of grant. Generally, the vested options may be exercised any time after November 30, 2007 and before the earliest of January 24, 2017 or the date of the option holder’s employment termination.
The fair value at the date of grant for these options was $6.28, as estimated on the date of grant using the Black-Scholes option pricing model. The significant assumptions used were a risk-free interest rate of 5.15%, expected volatility of 40%, an expected life of 6.25 years, no expected dividends and a forfeiture rate of zero. The related compensation expense for 2011, 2010 and 2009 was $1,223, $915 and $1,291, respectively. Unrecognized compensation expense as of December 31, 2011, 2010 and 2009 was $51, $1,274 and $2,711, respectively. As of December 31, 2011, 490 options were vested and fully exercisable.
The following summarizes the option activity under the 2006 Plan:
| | | | | | | | | | | | |
| | | Number of
Shares | | | Range of
Exercise Price | | | Weighted
Average
Exercise Price | |
Options granted on January 16, 2007 | | | 1,085 | | | $ | 13.00 | | | $ | 13.00 | |
Cancelled in 2007 | | | 5 | | | | 13.00 | | | | 13.00 | |
| | | | | | | | | | | | |
Options outstanding at December 31, 2007 | | | 1,080 | | | | 13.00 | | | | 13.00 | |
Cancelled in 2008 | | | 10 | | | | 13.00 | | | | 13.00 | |
| | | | | | | | | | | | |
Options outstanding at December 31, 2008 | | | 1,070 | | | $ | 13.00 | | | $ | 13.00 | |
Cancelled in 2009 | | | 25 | | | | 13.00 | | | | 13.00 | |
| | | | | | | | | | | | |
Options outstanding at December 31, 2009 | | | 1,045 | | | $ | 13.00 | | | $ | 13.00 | |
Cancelled in 2010 | | | 116 | | | | 13.00 | | | | 13.00 | |
Exercised in 2010 | | | 90 | | | | 13.00 | | | | 13.00 | |
| | | | | | | | | | | | |
Options outstanding at December 31, 2010 | | | 839 | | | $ | 13.00 | | | $ | 13.00 | |
Exercised in 2011 | | | 181 | | | | 13.00 | | | | 13.00 | |
| | | | | | | | | | | | |
Options outstanding at December 31, 2011 | | | 658 | | | $ | 13.00 | | | $ | 13.00 | |
| | | | | | | | | | | | |
F-28
HORSEHEAD HOLDING CORP. AND SUBSIDIARIES
NOTES TO CONSOLIDATED FINANCIAL STATEMENTS — (Continued)
The options outstanding under the 2006 Plan had no intrinsic value at December 31, 2010 since the exercise price was lower that the stock price at December 31, 2011. At December 31, 2011, each option had 5.04 years of remaining contractual life.
In 2011, the Company granted a total of 240 restricted stock units at a per unit average grant date fair value of $13.20 per unit. The units vest over a one or five year service period. In 2010 and 2009, the Company granted a total of 208 and 322 restricted stock units at a per unit average grant date fair value of $9.92 and $4.98, respectively. The units vest over a five-year service period. The Company assumed a forfeiture rate of zero in estimating compensation expense at the grant date. Upon vesting, the underlying stock will be issued for par value. In 2011, 44 restricted stock units vested having an intrinsic value of $653. In 2010, 33 restricted stock units vested having an intrinsic value of $436. In 2009, 19 restricted stock units vested having an intrinsic value of $224. The related compensation expense for 2011, 2010 and 2009 was $1,761, $945 and $862. Unrecognized compensation expense as of December 31, 2011, 2010 and 2009 was $4,161, $2,873 and $2,545. The compensation expense related to the restricted stock units will be recognized as $1,357 in 2012, $1,221 in 2013, $975 in 2014, $606 in 2015 and $2 in 2016. As of December 31, 2011, there were 724 restricted stock units outstanding having a remaining contractual life ranging from 1.25 years to 4.17 years.
NOTE T — ACCOUNTING FOR DERIVATIVE INSTRUMENTS AND HEDGING ACTIVITIES
The Company’s business consists principally of the sale of zinc and nickel-based products. As a result, its results of operations are subject to risk of fluctuations in the market prices of these metals. While the Company’s finished products are generally priced based on a spread to the price of zinc or nickel, as applicable, on the London Metal Exchange (“LME”), its revenues are impacted significantly by changes in the market prices of these metals. The Company pursues various hedging strategies as described below to reduce its exposure to movements in the prices of zinc, copper, lead and nickel.
The Company’s marketing strategy includes a metal hedging program that allows customers to secure a firm price for future deliveries under a sales contract. Hedges are entered into based on firm sales contracts to deliver specified quantities of product on a monthly basis for terms generally not exceeding one year. The Company’s raw material purchases related to such firm price contracts are at varying zinc and copper prices that are based on the LME. In order to protect its cash flow related to firm price sales contracts, the Company enters into fixed-to-variable swap contracts to convert the LME-based fixed sales price back to variable. Thus, if raw material costs increase as a result of LME zinc or copper price increases, the related sales value and related cash flows will also increase. As of December 31, 2011, the fixed portions of these zinc swap contracts ranged from a monthly average of $0.82 to $0.93 per pound. The Company did not have any copper fixed-to-variable contracts outstanding at December 31, 2011.
The Company entered into variable-to-fixed swap contracts as a financial hedge of a portion of its exposure to the movements in the LME prices of lead and nickel. For instance, under an agreement, the Company manages the lead co-product of its EAF dust recycling operation by providing it to a lead smelter as a feedstock for the production of lead. There were no outstanding variable-to-fixed swap contracts for lead and nickel as of December 31, 2011.
The Company has hedged approximately 14.2 tons of zinc with fixed-to-variable future swap contracts at December 31, 2011, all of which settle at various dates up to and including March 31, 2013. The Company received cash of $650 and $509 from the settlement of these swap contracts for the years ended December 31, 2011 and 2010, respectively.
F-29
HORSEHEAD HOLDING CORP. AND SUBSIDIARIES
NOTES TO CONSOLIDATED FINANCIAL STATEMENTS — (Continued)
In 2009, the Company purchased put options for 2010 for a financial hedge of approximately 100 tons of zinc, having a strike price of $0.65 per pound at a cost of $5,276. At the time of the purchases, the options represented approximately 80% of the Company’s anticipated sales volume for 2010. In 2010, the Company purchased put options for 2011 for a financial hedge of approximately 99 tons of zinc having a strike price of $0.65 per pound at a cost of $3,005. The Company also sold put options for 2011 having a strike price of $0.55 per pound for approximately 35 tons of zinc and received $230. The options settle monthly on an average LME pricing basis. For the years ended December 31, 2011, 2010 and 2009, the average LME zinc prices were above the strike prices for the contracts. Consequently, they expired with no settlement payment due the Company.
At December 31, 2011, the Company has zinc put options with an $0.85 per pound strike price outstanding, which cover approximately 160,000 tons of zinc production, representing approximately 75% of the expected shipments for the period from January 2012 through June 2013. These put options are in place to provide protection to operating cash flow in the event that zinc prices decline below that level during the construction of the new zinc facility. In June 2011, the Company entered into hedge arrangements in which we bought put options with a strike price of $0.85 per pound, sold call options with a strike price of $1.20 per pound and bought call options with a strike price of $1.81 per pound. The value of these bought and sold positions resulted in a zero cash outlay. The hedges reduced our exposure to future declines in zinc prices below $0.85 per pound. We would not, however, have been able to participate in increased zinc prices beyond $1.20 per pound until the zinc price reached $1.81 per pound. The $1.81 per pound call options were bought in order to cap the potential collateral requirements surrounding these hedge arrangements. During the fourth quarter of 2011, with forward zinc prices lower than when the program was implemented, the Company bought back the $1.20 per pound sold call option positions at a cost of $15,743 and realized a gain of $13,430. The repurchase of these $1.20 per pound call options effectively eliminated both the risk of a potential cash collateral requirement and the limitation to the Company’s profitability, in the event that zinc prices increase above the $1.20 per pound during that period. As a result of these hedges, we were subject to potential margin calls if the forward zinc prices increased prior to settlement. In the event of a margin call, unsecured credit provided by our clearing agent would apply first. After the use of the credit that they provided, we would be required to put cash on deposit with the clearing agent as security for eventual settlement of the hedge positions. This deposit would be classified as a restricted asset. We do not have any cash on deposit with any clearing agent at December 31, 2011. The zinc call options with a $1.81 per pound strike price continue to be held at December 31, 2011 but their value was negligible.
The gains and losses resulting from the Company’s hedging activities are recorded in the Consolidated Statements of Operations as indicated in the table below.
| | | | | | | | | | | | |
| | | For the year ended December 31, | |
| | | 2011 | | | 2010 | | | 2009 | |
Gains (losses) included in net sales: | | | | | | | | | | | | |
Put options | | $ | 15,103 | | | $ | (2,932 | ) | | $ | (11,385 | ) |
Swaps | | | (754 | ) | | | (530 | ) | | | 3,194 | |
| | | | | | | | | | | | |
| | | 14,349 | | | | (3,462 | ) | | | (8,191 | ) |
| | | | | | | | | | | | |
Gains (losses) included in cost of sales: | | | | | | | | | | | | |
Swaps | | | (2 | ) | | | 286 | | | | (20 | ) |
| | | | | | | | | | | | |
| | $ | 14,347 | | | $ | (3,176 | ) | | $ | (8,211 | ) |
| | | | | | | | | | | | |
F-30
HORSEHEAD HOLDING CORP. AND SUBSIDIARIES
NOTES TO CONSOLIDATED FINANCIAL STATEMENTS — (Continued)
The fair value of the swap contracts and put options as of December 31, 2011 and 2010 are listed in the table below.
| | | | | | | | |
| Fair Value Measurements Using Significant Other Observable Inputs (Level 2) | |
| |
| | | December 31, | |
| | | 2011 | | | 2010 | |
Options and swaps included in Prepaid expenses and other assets | | $ | 17,723 | | | $ | 984 | |
| | | | | | | | |
Options included in Deposits and other | | $ | 13,703 | | | $ | — | |
| | | | | | | | |
Swaps included in Accrued expenses | | $ | 970 | | | $ | — | |
| | | | | | | | |
The fair values of derivative instruments are based upon a comparison of the Company’s internal valuations to the valuations provided by third party counterparties with whom they have entered into substantially identical derivative contracts. The Company also compares the counterparties valuations to ensure that there is an acceptable level of consistency among them. The put option valuations utilize forward pricing and an implied volatility of the underlying commodity as well as interest rate forwards and are therefore subject to fluctuation based on the movements of the commodity markets. The swap valuations are based on the official LME closing valuations at the end of the trading day on December 31, 2011 and December 31, 2010, using the mid-point of the closing bid and ask prices on all open swap positions regardless of the holder. The closing prices are supervised by the London Clearing House and are regulated by the Financial Services Authority, the financial regulatory body in the United Kingdom.
The Company is exposed to credit loss in cases where counter-parties with which they have entered into derivative transactions are unable to pay the Company when they owe the Company funds as a result of agreements with them. To minimize the risk of such losses, the Company utilizes LME-registered contracts entered into with the London Clearing House for a majority of their contracts. The Company does not require collateral and does not enter into master netting arrangements. The clearing agent for the majority of the Company’s hedges had been MF Global UK Ltd, a U.K. affiliate of MF Global. On November 1, 2011, MF Global Holdings Ltd. and MF Global Finance USA filed for U.S. bankruptcy protection under Chapter 11 of the U.S. Bankruptcy Code, and a special administration order was issued in the United Kingdom in respect of MF Global UK Limited, appointing partners of KPMG LLP as joint administrators responsible for managing its business. The Company successfully transferred all of their LME – registered contracts, which included all of their put and call options for 2012 and 2013, to an alternate clearing member of the London Clearing House. On November 11, 2011, the Company received notification via email from MF Global UK Ltd. (in special administration) notifying it that all outstanding Over the Counter (“OTC”) hedge positions would be closed with an effective date of November 1, 2011. The Company has taken the position that “closed” means terminated with no additional settlements due and no value remaining as of November 1, 2011. The net value of these outstanding OTC positions was $366 and their value was written off during the fourth quarter of 2011.
NOTE U — CONTINGENCIES
The Company is subject to federal, state and local laws designed to protect the environment and believes that as a general matter, its policies, practices and procedures are properly designed to reasonably prevent risk of environmental damage and financial liability to the Company.
The Company is party to various litigation, claims and disputes, including labor regulation claims and OSHA and environmental regulation violations, some of which are for substantial amounts, arising in the ordinary course of business. While the ultimate effect of such actions cannot be predicted with certainty, the Company expects that the outcome of these matters will not result in a material adverse effect on its business, financial condition or results of operations.
F-31
HORSEHEAD HOLDING CORP. AND SUBSIDIARIES
NOTES TO CONSOLIDATED FINANCIAL STATEMENTS — (Continued)
On July 2, 2010, the Company renewed a Consent Order and Agreement with the Pennsylvania Department of Environmental Protection (“PADEP”) related to the resolution of fugitive emission violations at its Monaca, Pennsylvania facility. The original Consent Order and Agreement was entered into on June 28, 2006 and required planning for, implementing and reporting on actions to mitigate fugitive air emissions at its Monaca, Pennsylvania facility. The renewed Consent Order and Agreement requires development and submittal of a preventative maintenance plan following approval by the PADEP. In addition, the Company is required to implement a plan for replacing bags in baghouses on a scheduled basis. Finally, the Company is required to submit quarterly progress reports to the PADEP on the above activities. The Consent Order and Agreement required that the Company continue to pay a civil penalty of $6.5 each month until June 15, 2011, and $9.0 each month from July 2011 through termination of the Consent Order and Agreement in June 2012.
NOTE V — EARNINGS PER SHARE
Basic earnings (loss) per common share (“EPS”) are computed by dividing net income or loss by the weighted average number of common shares outstanding for the period. Diluted earnings per share are computed similarly to basic earnings per share except that the denominator is increased to include the number of shares that would have been outstanding if the potentially dilutive common shares had been issued. The Company uses the treasury stock method when calculating the dilutive effect in basic EPS.
Diluted EPS for periods with a net loss is calculated by dividing the net loss by the weighted average number of basic shares outstanding.
The information used to compute basic and diluted earnings (loss) per share is as follows:
| | | | | | | | | | | | |
| | | 2011 | | | 2010 | | | 2009 | |
Basic earnings (loss) per share: | | | | | | | | | | | | |
Net income (loss) | | $ | 21,454 | | | $ | 24,770 | | | $ | (27,471 | ) |
Weighted average shares outstanding — basic | | | 43,652 | | | | 43,353 | | | | 37,604 | |
Basic earnings (loss) per share | | $ | 0.49 | | | $ | 0.57 | | | $ | (0.73 | ) |
| | | | | | | | | | | | |
Diluted earnings (loss) per share: | | | | | | | | | | | | |
Net income (loss) | | $ | 21,454 | | | $ | 24,770 | | | $ | (27,471 | ) |
Weighted average shares outstanding — diluted | | | 44,161 | | | | 43,668 | | | | 37,604 | |
Diluted earnings (loss) per share | | $ | 0.49 | | | $ | 0.57 | | | $ | (0.73 | ) |
| | | | | | | | | | | | |
Reconciliation of average shares outstanding — basic to average shares outstanding — diluted: | | | | | | | | | | | | |
Weighted average shares outstanding — basic | | | 43,652 | | | | 43,353 | | | | 37,604 | |
Effect of dilutive securities: | | | | | | | | | | | | |
Options | | | 212 | | | | 87 | | | | — | |
Restricted stock units | | | 297 | | | | 228 | | | | — | |
| | | | | | | | | | | | |
Weighted average shares outstanding — diluted | | | 44,161 | | | | 43,668 | | | | 37,604 | |
| | | | | | | | | | | | |
| | | | | | | | | | | | | | | | |
| | | Exercise
price | | | 2011 | | | 2010 | | | 2009 | |
| Anti-dilutive shares excluded from earnings per share calculation | | | | | | | | | | | | | | | | |
Options | | $ | 13.00 | | | | — | | | | 839 | | | | 1,045 | |
Options | | $ | 1.01 | | | | — | | | | — | | | | 151 | |
Restricted stock units | | | — | | | | — | | | | — | | | | 462 | |
| | | | | | | | | | | | | | | | |
Total | | | | | | | — | | | | 839 | | | | 1,658 | |
F-32
HORSEHEAD HOLDING CORP. AND SUBSIDIARIES
NOTES TO CONSOLIDATED FINANCIAL STATEMENTS — (Continued)
On July 27, 2011, the Company issued $100,000 of Convertible Notes. The Convertible Notes are convertible at a conversion price of approximately $15.00 per share into cash, shares or a combination of both at the Company’s election. According to guidance under ASC 260 Earnings Per Share, if an entity issues a contract that may be settled in common stock or cash at the election of the entity or holder, then it is presumed that the contract will be settled in shares unless past experience or a stated policy provides a reasonable basis to believe that the contract will be paid partially or wholly in cash and the “if converted” method shall not be used. The Company has stated that it intends to settle the par value in cash and the conversion spread in either cash, shares or a combination of both. The Company will utilize the modified treasury stock method and assume dilution if the average stock price for the quarter exceeds the conversion price. The share dilution will be calculated by dividing the conversion spread value by the average share price for the quarter. During 2011, the average stock price was lower than the exercise price for the Convertible Notes and therefore no conversion spread was recognized and no dilution assumed.
NOTE W — COMMITMENTS
Operating Leases
The Company has operating leases for equipment and railroad cars which expire at various dates through December 2021. Future minimum lease payments under these non-cancelable operating leases as of December 31, 2011 are as follows:
| | | | |
Years Ending December 31, | | Amounts | |
2012 | | $ | 4,317 | |
2013 | | | 3,677 | |
2014 | | | 3,155 | |
2015 | | | 2,067 | |
2016 | | | 1,729 | |
Thereafter | | | 1,829 | |
| | | | |
| | $ | 16,774 | |
| | | | |
Rent expense for all operating leases for 2011, 2010 and 2009 approximated $5,115, $4,583 and $3,927 respectively.
Long Term Purchase Agreements
The Company had a coal supply agreement through 2011 for the coal requirements of its power plant located in Monaca, Pennsylvania. The agreement required the Company to purchase 325 tons for 2011 resulting in purchase commitments of approximately $16,981 for 2011. The commitment was subject to adjustment in connection with the fuel surcharge and other provisions of the agreement. In September 2011, the Company entered into a new power purchase agreement to supply its electrical power needs at its Monaca, Pennsylvania facility and temporarily idled its Monaca power plant. During the third quarter of 2011, the Company began to sell its remaining coal obligations under this contract to third parties and sold all remaining requirements by the end of 2011. The Company recognized a loss of approximately $1,700 in 2011 associated with the sale of excess coal. In 2011 and 2010, the Company purchased 357 tons and 390 tons, respectively, at a total cost, including fees and fuel surcharges, of $19,476 and $18,918, respectively.
F-33
HORSEHEAD HOLDING CORP. AND SUBSIDIARIES
NOTES TO CONSOLIDATED FINANCIAL STATEMENTS — (Continued)
NOTE X — SELECTED QUARTERLY FINANCIAL DATA (Unaudited)
| | | | | | | | | | | | | | | | |
| | | Quarter Ended | |
| | | December 31, | | | September 30, | | | June 30, | | | March 31, | |
| 2011 | | | | | | | | | | | | | | | | |
Sales | | $ | 100,355 | | | $ | 145,840 | | | $ | 95,791 | | | $ | 109,214 | |
Cost of sales (excluding depreciation and amortization) . | | | 113,517 | | | | 96,084 | | | | 91,120 | | | | 76,680 | |
Depreciation and amortization | | | 6,135 | | | | 5,289 | | | | 5,339 | | | | 5,262 | |
Net income (loss) | | | (12,704 | ) | | | 23,054 | | | | (3,660 | ) | | | 14,764 | |
Earnings (loss) per common share: | | | | | | | | | | | | | | | | |
Basic | | $ | (0.29 | ) | | $ | 0.53 | | | $ | (0.08 | ) | | $ | 0.34 | |
Diluted | | $ | (0.29 | ) | | $ | 0.52 | | | $ | (0.08 | ) | | $ | 0.33 | |
2010 | | | | | | | | | | | | | | | | |
Sales | | $ | 96,299 | | | $ | 90,549 | | | $ | 98,538 | | | $ | 96,976 | |
Cost of sales (excluding depreciation) | | | 63,018 | | | | 85,524 | | | | 79,848 | | | | 77,132 | |
Depreciation and amortization | | | 5,400 | | | | 4,430 | | | | 4,241 | | | | 4,541 | |
Net income | | | 14,633 | | | | (2,353 | ) | | | 5,708 | | | | 6,782 | |
Earnings per common share: | | | | | | | | | | | | | | | | |
Basic | | $ | 0.34 | | | $ | (0.05 | ) | | $ | 0.13 | | | $ | 0.16 | |
Diluted | | $ | 0.33 | | | $ | (0.05 | ) | | $ | 0.13 | | | $ | 0.16 | |
| | | | |
| | | December 31, | | | September 30, | | | June 30, | | | March 31, | |
2011 Pro forma including Zochem | | | | | | | | | | | | | | | | |
Sales | | $ | 107,300 | | | $ | 164,506 | | | $ | 122,208 | | | $ | 134,257 | |
Cost of sales (excluding depreciation and amortization) | | | 119,511 | | | | 113,553 | | | | 114,788 | | | | 99,487 | |
Depreciation and amortization | | | 6,165 | | | | 5,385 | | | | 5,437 | | | | 5,358 | |
Net income (loss) | | | (15,072 | ) | | | 23,811 | | | | (2,420 | ) | | | 15,388 | |
Earnings (loss) per common share: | | | | | | | | | | | | | | | | |
Basic | | $ | (0.34 | ) | | $ | 0.54 | | | $ | (0.06 | ) | | $ | 0.35 | |
Diluted | | $ | (0.34 | ) | | $ | 0.54 | | | $ | (0.06 | ) | | $ | 0.35 | |
The following pro forma information presents the financial results of the Company as if the acquisition of Zochem had occurred on January 1, 2010. These amounts have been calculated after applying the Company’s accounting policies and adjusting the results of Zochem to reflect the additional depreciation and amortization that would have been charged assuming the fair value adjustments to property, plant and equipment, intangible assets and inventory had been applied on January 1, 2010, together with the resulting tax effects. Excluded in the proforma net income for the year ended December 31, 2010 is the gain on bargain purchase from the acquisition of Zochem. This pro forma information has been prepared for comparative purposes and does not purport to be indicative of what would have occurred had the acquisition been completed on January 1, 2010 for Zochem, nor are they indicative of any future results.
NOTE Y — SEGMENT INFORMATION
The Company operates as two segments, zinc products and services and nickel products and services. The segment zinc products and services segment processes EAF dust and other zinc-bearing material to produce and
F-34
HORSEHEAD HOLDING CORP. AND SUBSIDIARIES
NOTES TO CONSOLIDATED FINANCIAL STATEMENTS — (Continued)
sell zinc metal and zinc-based products. The nickel products and services segment processes a variety of metal-bearing waste material generated primarily by the specialty steel industry. It provides tolling services and produces and sells nickel-chromium-iron remelt alloy to the stainless and specialty steel industries.
The following table presents information regarding the Company’s segment information as of December 31, 2011 and 2010:
| | | | | | | | | | | | | | | | |
| 2011 | | Zinc products
and services | | | Nickel
products and
services | | | Corporate,
eliminations
and other | | | Total | |
Net sales | | $ | 389,767 | | | $ | 62,477 | | | $ | (1,064 | ) | | $ | 451,180 | |
Depreciation and amortization | | | 19,118 | | | | 2,907 | | | | — | | | | 22,025 | |
Income (loss) before tax | | | 16,684 | | | | 18,593 | | | | (2,921 | ) | | | 32,356 | |
2010 | | | | | | | | | | | | | | | | |
Net sales | | $ | 329,139 | | | $ | 54,162 | | | $ | (939 | ) | | $ | 382,362 | |
Depreciation and amortization | | | 15,903 | | | | 2,709 | | | | — | | | | 18,612 | |
Income before tax | | | 24,522 | | | | 14,379 | | | | 278 | | | | 39,179 | |
| | | | | | | | | | | | | | | | |
| | | Zinc products
and services | | | Nickel
products and
services | | | Corporate
and other | | | Total | |
2011 | | | | | | | | | | | | | | | | |
Property, plant and equipment | | $ | 227,257 | | | $ | 32,795 | | | $ | — | | | $ | 260,052 | |
Capital expenditures | | | 63,076 | | | | 1,633 | | | | — | | | | 64,709 | |
Total assets | | | 313,661 | | | | 85,505 | | | | 232,326 | | | | 631,492 | |
2010 | | | | | | | | | | | | | | | | |
Property, plant and equipment | | $ | 184,726 | | | $ | 33,926 | | | $ | — | | | $ | 218,652 | |
Capital expenditures | | | 43,397 | | | | 1,307 | | | | — | | | | 44,704 | |
Total assets | | | 269,299 | | | | 68,138 | | | $ | 158,699 | | | | 496,136 | |
NOTE Z — PRO FORMA INFORMATION
The following pro forma information presents the financial results of the Company as if the acquisition of INMETCO had occurred on January 1, 2008 and as if the acquisition of Zochem had occurred on January 1, 2010. These amounts have been calculated after applying the Company’s accounting policies and adjusting the results of INMETCO and Zochem to reflect the additional depreciation and amortization that would have been charged assuming the fair value adjustments to property, plant and equipment, intangible assets and inventory had been applied on January 1, 2010, together with the resulting tax effects. Excluded in the proforma net income for the year ended December 31, 2010 is the gain on bargain purchase from the acquisition of Zochem. This pro forma information has been prepared for comparative purposes and does not purport to be indicative of what would have occurred had the acquisition been completed on January 1, 2008 for INMETCO and on January 1, 2010 for Zochem, nor are they indicative of any future results.
| | | | | | | | | | | | |
Pro forma consolidated results | | 2011 | | | 2010 | | | 2009 | |
Net sales | | $ | 528,271 | | | $ | 476,706 | | | $ | 255,533 | |
Net income (loss) | | | 21,707 | | | | 28,235 | | | | (26,590 | ) |
Basic earnings (loss) per share | | $ | 0.50 | | | $ | 0.65 | | | $ | (0.71 | ) |
Diluted earnings (loss) per share | | $ | 0.49 | | | $ | 0.65 | | | $ | (0.71 | ) |
F-35
HORSEHEAD HOLDING CORP. AND SUBSIDIARIES
NOTES TO CONSOLIDATED FINANCIAL STATEMENTS — (Continued)
NOTE 1 MONACA, PENNSYLVANIA ACCIDENT INSURANCE RECOVERYNOTE AA — MONACA, PENNSYLVANIA ACCIDENT INSURANCE RECOVERY
On July 22, 2010, an incident occurred at the Company’s Monaca, PA facility which resulted in the complete shutdown of the plant’s refinery operations. Each of the 10 columns used to produce zinc oxide and refined zinc metal in the refining facility was rebuilt. Production operations resumed late in 2010 as these repairs were completed. The Company pursued recovery of the cost of repairs, lost profit and other losses from its zinc oxide and refined metal production during the rebuilding period, subject to customary deductibles, under the Company’s business interruption and property insurance. As of March 31, 2011, the Company incurred $17,902 in clean-up, repair and other costs associated with the explosion. The Company submitted a claim totaling $33,831 and reached a final settlement in the amount of $29,614 in the first quarter of 2011.
The Company had recorded insurance recovery of $19,267 at December 31, 2010, of which $14,276 related to business interruption and $4,991 related to property damage. The estimated allocation of the remaining settlement of $10,347 was $3,248 for business interruption and $7,099 for property damage. As of December 31, 2011, the entire insurance recoveries of $29,614 were received in cash. At December 31, 2010, $8,267 of the recoveries were included in accounts receivable on the Company’s Consolidated Balance Sheet.
The costs and insurance recoveries are summarized in the table below.
| | | | | | | | | | | | |
| | | Total | | | 2011 | | | 2010 | |
Cost of clean-up and repairs included in cost of sales of zinc material and other goods | | $ | 7,760 | | | $ | 982 | | | $ | 6,778 | |
Business interruption insurance recovery. | | | (17,524 | ) | | | (3,248 | ) | | | (14,276 | ) |
Property damage insurance recovery | | | (12,090 | ) | | | (7,099 | ) | | | (4,991 | ) |
| | | | | | | | | | | | |
Total insurance recovery | | $ | (29,614 | ) | | $ | (10,347 | ) | | $ | (19,267 | ) |
Income related to insurance recovery included in cost of sales (excluding depreciation and amortization) | | | (21,854 | ) | | | (9,365 | ) | | | (12,489 | ) |
Selling, general and administrative expenses | | | 303 | | | | 69 | | | | 234 | |
| | | | | | | | | | | | |
Income related to insurance recovery | | $ | (21,551 | ) | | $ | (9,296 | ) | | $ | (12,255 | ) |
| | | | | | | | | | | | |
Costs included in finished goods inventories | | | | | | $ | 170 | | | $ | 790 | |
| | | | | | | | | | | | |
Costs capitalized | | | | | | $ | 282 | | | $ | 8,597 | |
| | | | | | | | | | | | |
Insurance proceeds receivable included in accounts receivable | | | | | | $ | — | | | $ | 8,267 | |
| | | | | | | | | | | | |
F-36
Schedule Condensed Financial Information of RegistrantSchedule I :Condensed Financial Information of Registrant
HORSEHEAD HOLDING CORP.
CONDENSED BALANCE SHEETS –PARENT COMPANY ONLY
December 31, 2011 and 2010
(Amounts in thousands)
| | | | | | | | |
| | | 2011 | | | 2010 | |
ASSETS | |
Cash and cash equivalents | | $ | 166,423 | | | $ | 90,597 | |
Prepaid expenses and other current assets | | | 21 | | | | 13 | |
Loan receivable | | | 14,823 | | | | 14,823 | |
Other assets | | | 2,530 | | | | — | |
Investment in and advances to subsidiary | | | 305,328 | | | | 263,096 | |
| | | | | | | | |
Total assets | | $ | 489,125 | | | $ | 368,529 | |
| | | | | | | | |
LIABILITIES AND STOCKHOLDERS’ EQUITY | |
Accounts payable | | $ | 97 | | | $ | 61 | |
Accrued expenses | | | 1,541 | | | | — | |
Long term debt | | | 79,408 | | | | — | |
Stockholders’ equity | | | | | | | | |
Common stock | | | 436 | | | | 435 | |
Additional paid-in-capital | | | 232,562 | | | | 214,406 | |
Retained earnings | | | 175,081 | | | | 153,627 | |
| | | | | | | | |
Total stockholders’ equity | | | 408,079 | | | | 368,468 | |
| | |
Total liabilities and stockholders’ equity | | $ | 489,125 | | | $ | 368,529 | |
| | | | | | | | |
See notes to condensed financial statements of the registrant
HORSEHEAD HOLDING CORP.
CONDENSED STATEMENTS OF OPERATIONS – PARENT COMPANY ONLY
FOR THE YEARS ENDED DECEMBER 31, 2011, 2010 AND 2009
(Amounts in thousands)
| | | | | | | | | | | | |
| | | 2011 | | | 2010 | | | 2009 | |
Selling, general and administrative | | $ | 1,792 | | | $ | 1,065 | | | $ | 982 | |
Equity in income (loss) of subsidiary, net of taxes (benefit) of $10,902, $14,409 and $(16,689) for 2011, 2010 and 2009, respectively | | | 24,375 | | | | 24,492 | | | | (27,405 | ) |
Interest income | | | 1,293 | | | | 1,343 | | | | 916 | |
Interest expense | | | 2,422 | | | | — | | | | — | |
| | | | | | | | | | | | |
Income (loss) before taxes | | | 21,454 | | | | 24,770 | | | | (27,471 | ) |
| | | |
Income tax (benefit) | | | — | | | | — | | | | — | |
| | | | | | | | | | | | |
NET INCOME | | $ | 21,454 | | | $ | 24,770 | | | $ | (27,471 | ) |
| | | | | | | | | | | | |
See notes to condensed financial statements of the registrant
F-37
HORSEHEAD HOLDING CORP.
CONDENSED STATEMENTS OF CASH FLOWS — PARENT COMPANY ONLY
FOR THE YEARS ENDED DECEMBER 31, 2011, 2010 AND 2009
(Amounts in thousands)
| | | | | | | | | | | | |
| | | 2011 | | | 2010 | | | 2009 | |
Cash Flows from Operating Activities: | | | | | | | | | | | | |
Net income (loss) | | $ | 21,454 | | | $ | 24,770 | | | $ | (27,471 | ) |
Adjustments to reconcile net income (loss) to net cash provided by (used in) operating activities: | | | | | | | | | | | | |
Equity in (income) loss of subsidiary | | | (24,375 | ) | | | (24,492 | ) | | | 27,405 | |
Non-cash compensation expense | | | 2,984 | | | | 1,860 | | | | 2,153 | |
Accretion on convertible debt | | | 1,235 | | | | — | | | | — | |
Amortization of deferred finance costs | | | 191 | | | | — | | | | — | |
Changes in operating assets and liabilities: | | | | | | | | | | | | |
Decrease in prepaid expenses and other current assets | | | (8 | ) | | | (13 | ) | | | (1 | ) |
Increase in note receivable due to interest | | | — | | | | (448 | ) | | | (507 | ) |
Increase (decrease) in accounts payable | | | 36 | | | | (55 | ) | | | 54 | |
Increase in accrued expenses | | | 1,541 | | | | — | | | | — | |
| | | | | | | | | | | | |
Net cash provided by operating activities | | | 3,058 | | | | 1,622 | | | | 1,633 | |
| | | |
Cash Flows from Investing Activities: | | | | | | | | | | | | |
Advances (to) from subsidiaries | | | (10,882 | ) | | | 2,467 | | | | (3,908 | ) |
Acquisitions | | | (15,078 | ) | | | (4,467 | ) | | | (33,237 | ) |
| | | | | | | | | | | | |
Net cash (used in) investing activities | | | (25,960 | ) | | | (2,100 | ) | | | (37,145 | ) |
| | | |
Cash Flows from Financing Activities: | | | | | | | | | | | | |
Proceeds from equity offering, net of expenses | | | — | | | | — | | | | 79,785 | |
Proceeds from the issuance of convertible notes | | | 100,000 | | | | — | | | | — | |
Debt Issuance Costs | | | (2,721 | ) | | | — | | | | — | |
Equity Issuance Costs | | | (760 | ) | | | — | | | | — | |
Proceeds from exercise of stock options | | | 2,360 | | | | 1,183 | | | | 12 | |
Tax effect of share based compensation | | | (151 | ) | | | (153 | ) | | | (93 | ) |
Issuance of notes receivable | | | — | | | | — | | | | (13,955 | ) |
| | | | | | | | | | | | |
Net cash provided by financing activities | | | 98,728 | | | | 1,030 | | | | 65,749 | |
| | | |
NET INCREASE IN CASH AND CASH EQUIVALENTS | | | 75,826 | | | | 552 | | | | 30,237 | |
Cash and cash equivalents at beginning of year | | | 90,597 | | | | 90,045 | | | | 59,808 | |
| | | | | | | | | | | | |
Cash and cash equivalents at end of year | | $ | 166,423 | | | $ | 90,597 | | | $ | 90,045 | |
| | | | | | | | | | | | |
See notes to condensed financial statements of the registrant
F-38
HORSEHEAD HOLDING CORP.
NOTES TO CONDENSED FINANCIAL STATEMENTS OF REGISTRANT
NOTE 1. The condensed financial information includes only the financial information for the Registrant, Horsehead Holding Corp., excluding all of its consolidated subsidiaries. The schedule is required based upon the limitations on dividends and distributions that its subsidiary, Horsehead Corporation, can make to the registrant under the terms of its Revolving Credit and Security Agreement as described in Note N — Long Term Debt to the consolidated financial statements.
F-39
EXHIBIT INDEX
| | |
Exhibit Number | | Description of Document |
| |
| 2.1 | | Stock Purchase Agreement dated as of December 1, 2009 among the Registrant, Vale Inco Americas Inc, and Vale Inco Limited (incorporated by reference to Exhibit 2.1 of the Registrant’s Current Report on Form 8-K, filed on December 4, 2009) |
| |
| 3.1 | | Second Amended and Restated Certificate of Incorporation of the Registrant (incorporated by reference to Exhibit 3.1 of the Registrant’s Registration Statement on Form S-1 (File No. 333-142113), filed on April 13, 2007) |
| |
| 3.2 | | Amended and Restated By-laws of the Registrant (incorporated by reference to Exhibit 3.2 of the Registrant’s Registration Statement on Form S-1 (File No. 333-142113), filed on April 13, 2007) |
| |
| 4.1 | | Indenture, dated as of July 27, 2011, between Horsehead Holding Corp. and U.S. Bank National Association, as trustee. (incorporated by reference to Exhibit 4.1 of the Registrant’s Current Report on Form 8-K filed on July 27, 2011) |
| |
| 4.2 | | Form of 3.80% Convertible Senior Notes due 2017 (incorporated by reference to Exhibit 4.2 of the Registrant’s Current Report on Form 8-K filed on July 27, 2011 (included as Exhibit A to Exhibit 4.1)) |
| |
| 4.3 | | Specimen Common Stock Certificate (incorporated by reference to Exhibit 4.1 of the Registrant’s Registration Statement on Form S-1 (File No. 333-142113), filed on April 13, 2007) |
| |
| 10.1 | | Revolving Credit and Security Agreement, dated as of September 28, 2011, by and among Horsehead Corporation, as borrower, Horsehead Holding Corp., as guarantor, and PNC Bank, National Association, as agent and lender. (incorporated by reference to Exhibit 10.1 of the registrant’s Current Report on Form 8-K filed on September 30, 2011) |
| |
| 10.2 | | Horsehead Holding Corp. Amended and Restated 2006 Long-Term Equity Incentive Plan (incorporated by reference to Exhibit 10.1 of the Registrant’s Amendment No. 2 to Registration Statement on Form S-1 (File No. 333-142113), filed on July 2, 2007)† |
| |
| 10.3 | | Form of Option Agreement issued under 2006 Long-Term Equity Incentive Plan (incorporated by reference to Exhibit 10.2 of the Registrant’s Registration Statement on Form S-1 (File No. 333-142113), filed on April 13, 2007)† |
| |
| 10.4 | | Second Amended and Restated Horsehead Holding Corp. 2004 Stock Option Plan (incorporated by reference to Exhibit 10.3 of the Registrant’s Registration Statement on Form S-1 (File No. 333-142113), filed on April 13, 2007)† |
| |
| 10.5 | | Form of Option Agreement issued under 2004 Stock Option Plan (incorporated by reference to Exhibit 10.4 of the Registrant’s Registration Statement on Form S-1 (File No. 333-142113), filed on April 13, 2007)† |
| |
| 10.6 | | Employment Agreement, dated as of November 30, 2006 by and between Horsehead Corporation and James M. Hensler (incorporated by reference to Exhibit 10.5 of the Registrant’s Registration Statement on Form S-1 (File No. 333-142113), filed on April 13, 2007)† |
| |
| 10.7 | | Employment Agreement, dated as of January 3, 2011 by and between Horsehead Corporation and James M. Hensler (incorporated by reference to Exhibit 10.1 of the Registrant’s Current Report filed on Form 8-K on January 4, 2011)† |
| |
| 10.8 | | Employment Agreement, dated as of November 30, 2006 by and between Horsehead Corporation and Robert D. Scherich (incorporated by reference to Exhibit 10.6 of the Registrant’s Registration Statement on Form S-1 (File No. 333-142113), filed on April 13, 2007)† |
| |
| 10.9 | | Employment Agreement, dated as of January 3, 2011 by and between Horsehead Corporation and Robert D. Scherich (incorporated by reference to Exhibit 10.2 of the Registrant’s Current Report filed on Form 8-K on January 4, 2011)† |
E-1
| | |
| |
| 10.10 | | Employment Agreement, dated as of November 30, 2006 by and between Horsehead Corporation and Ali Alavi (incorporated by reference to Exhibit 10.7 of the Registrant’s Registration Statement on Form S-1 (File No. 333-142113), filed on April 13, 2007)† |
| |
| 10.11 | | Employment Agreement, dated as of January 3, 2011 by and between Horsehead Corporation and Ali Alavi (incorporated by reference to Exhibit 10.3 of the Registrant’s Current Report filed on Form 8-K on January 4, 2011)† |
| |
| 10.12 | | Financing Agreement dated as of July 15, 2005 by and among Horsehead Corporation, Horsehead Intermediary Corp., Chestnut Ridge Railroad Corp., The CIT Group/Business Credit, Inc., PNC Bank National Association and certain lenders party thereto (incorporated by reference to Exhibit 10.9 of the Registrant’s Registration Statement on Form S-1 (File No. 333-142113), filed on April 13, 2007) |
| |
| 10.13 | | Amendment No. 1 to CIT Financing Agreement dated as of October 21, 2005 (incorporated by reference to Exhibit 10.10 of the Registrant’s Registration Statement on Form S-1 (File No. 333-142113), filed on April 13, 2007) |
| |
| 10.14 | | Amendment No. 2 to CIT Financing Agreement dated as of January 18, 2006 (incorporated by reference to Exhibit 10.11 of the Registrant’s Registration Statement on Form S-1 (File No. 333-142113), filed on April 13, 2007) |
| |
| 10.15 | | Amendment No. 3 to CIT Financing Agreement dated as of April 28, 2006 (incorporated by reference to Exhibit 10.12 of the Registrant’s Registration Statement on Form S-1 (File No. 333-142113), filed on April 13, 2007) |
| |
| 10.16 | | Amendment No. 4 to CIT Financing Agreement dated as of October 25, 2006 (incorporated by reference to Exhibit 10.13 of the Registrant’s Registration Statement on Form S-1 (File No. 333-142113), filed on April 13, 2007) |
| |
| 10.17 | | Amendment No. 5 to CIT Financing Agreement dated as of December 14, 2007 (incorporated by reference to Exhibit 10.14 of the Registrant’s Annual Report on Form 10-K filed on March 31, 2008) |
| |
| 10.18 | | Consent and Amendment, dated as of June 4, 2009, between Horsehead Corporation, Chestnut Ridge Railroad Corp., The CIT Group/Business Credit, Inc. and PNC Bank, National Association (incorporated by reference to Exhibit 10.1 of the Registrant’s Current Report on Form 8-K filed on June 10, 2009) |
| |
| 10.19 | | Amendment No. 6 to CIT Financing Agreement dated as of June 30, 2009 (incorporated by reference to Exhibit 10.1 of the Registrant’s Current Report on Form 8-K filed on July 6, 2009) |
| |
| 10.20 | | Letter agreement, dated as of December 11, 2009, between Horsehead Corporation and The CIT Group/Business Credit, Inc. (incorporated by reference to Exhibit 10.1 of the Registrant’s Current Report on Form 8-K filed on December 15, 2009) |
| |
| 10.21 | | Financing Agreement dated as of July 15, 2005 by and among Horsehead Corporation, Horsehead Intermediary Corp., Chestnut Ridge Railroad Corp., CML I, LLC (as successor by assignment to Contrarian Service Company, LLC) and Contrarian Financial Services Company, LLC (incorporated by reference to Exhibit 10.15 of the Registrant’s Registration Statement on Form S-1 (File No. 333-142113), filed on April 13, 2007) |
| |
| 10.22 | | Amendment No. 1 to Contrarian Financing Agreement dated as of January 18, 2006 (incorporated by reference to Exhibit 10.15 of the Registrant’s Registration Statement on Form S-1 (File No. 333-142113), filed on April 13, 2007) |
| |
| 10.23 | | Amendment No. 2 to Contrarian Financing Agreement dated as of April 28, 2006 (incorporated by reference to Exhibit 10.16 of the Registrant’s Registration Statement on Form S-1 (File No. 333-142113), filed on April 13, 2007) |
| |
| 10.24 | | Amendment No. 3 to Contrarian Financing Agreement dated as of October 25, 2006 (incorporated by reference to Exhibit 10.17 of the Registrant’s Registration Statement on Form S-1 (File No. 333-142113), filed on April 13, 2007) |
| |
| 10.25 | | Letter Agreement re: Retention Bonus Arrangement, dated October 31, 2006, between the Registrant and James M. Hensler (incorporated by reference to Exhibit 10.19 of the Registrant’s Registration Statement on Form S-1 (File No. 333-142113), filed on April 13, 2007)† |
E-2
| | |
| |
| 10.26 | | Letter Agreement re: Retention Bonus Arrangement, dated October 31, 2006, between the Registrant and Robert D. Scherich (incorporated by reference to Exhibit 10.20 of the Registrant’s Registration Statement on Form S-1 (File No. 333-142113), filed on April 13, 2007)† |
| |
| 10.27 | | Letter Agreement re: Retention Bonus Arrangement, dated October 31, 2006, between the Registrant and Ali Alavi (incorporated by reference to Exhibit 10.21 of the Registrant’s Registration Statement on Form S-1 (File No. 333-142113), filed on April 13, 2007)† |
| |
| 10.28 | | Form of Restricted Stock Agreement issued under the Horsehead Holding Corp. Amended and Restated 2006 Long-Term Equity Incentive Plan (incorporated by reference to Exhibit 10.27 of the Registrant’s Amendment No. 2 to Registration Statement on Form S-1 (File No. 333-142113), filed on July 2, 2007)† |
| |
| 10.29 | | First Amendment to Employment Agreement, dated as of December 24, 2008, between Horsehead Corporation and James M. Hensler (incorporated by reference to Exhibit 10.22 of the Registrant’s Annual Report on Form 10-K filed on March 16, 2009)† |
| |
| 10.30 | | Second Amendment to Employment Agreement, dated as of June 22, 2009, between Horsehead Corporation and James M. Hensler (incorporated by reference to Exhibit 10.1 of the Registrant’s Current Report on Form 8-K filed on June 24, 2009)† |
| |
| 10.31 | | First Amendment to Employment Agreement, dated as of December 24, 2008, between Horsehead Corporation and Robert D. Scherich (incorporated by reference to Exhibit 10.23 of the Registrant’s Annual Report on Form 10-K filed on March 16, 2009)† |
| |
| 10.32 | | Second Amendment to Employment Agreement, dated as of June 22, 2009, between Horsehead Corporation and Robert D. Scherich (incorporated by reference to Exhibit 10.2 of the Registrant’s Current Report on Form 8-K filed on June 24, 2009)† |
| |
| 10.33 | | First Amendment to Employment Agreement, dated as of December 24, 2008, between Horsehead Corporation and Ali Alavi (incorporated by reference to Exhibit 10.24 of the Registrant’s Annual Report on Form 10-K filed on March 16, 2009)† |
| |
| 10.34 | | Second Amendment to Employment Agreement, dated as of June 22, 2009, between Horsehead Corporation and Ali Alavi (incorporated by reference to Exhibit 10.3 of the Registrant’s Current Report on Form 8-K filed on June 24, 2009)† |
| |
| 10.35 | | Form of Performance Contingent Restricted Stock Unit Award Agreement issued under the Amended and Restated 2006 Long-Term Equity Incentive Plan (incorporated by reference to Exhibit 10.25 of the Registrant’s Annual Report on Form 10-K filed on March 16, 2009)† |
| |
| 10.36 | | Form of Restricted Stock Unit Award Agreement issued under the Amended and Restated 2006 Long-Term Equity Incentive Plan (incorporated by reference to Exhibit 10.26 of the Registrant’s Annual Report on Form 10-K filed on March 16, 2009)† |
| |
| 21.1 | | List of subsidiaries of the Registrant |
| |
| 23.1 | | Consent of Grant Thornton LLP, independent registered public accounting firm |
| |
| 24.1 | | Power of Attorney (included in the signature page to this report) |
| |
| 31.1 | | Certification of Principal Executive Officer pursuant to Section 302 of the Sarbanes-Oxley Act of 2002 |
| |
| 31.2 | | Certification of Principal Financial Officer pursuant to Section 302 of the Sarbanes-Oxley Act of 2002 |
| |
| 32.1 | | Section 1350 Certification of Chief Executive Officer and Chief Financial Officer |
| |
| 101.INS | | Instance Document |
| |
| 101.SCH | | Schema Document |
| |
| 101.CAL | | Calculation Linkbase Document |
| |
| 101.LAB | | Labels Linkbase Document |
| |
| 101.PRE | | Presentation Linkbase Document |
| |
| 101.DEF | | Definition Linkbase Document |
| † | Management contract or compensatory plan or arrangement. |
E-3