Exhibit (c)-(2)
ProjectSunflower DISCUSSION MA TERIALS FOR THE SPECIAL COMMITTEE NOVEMBER 16, 2017 | PRELIMINARY DRAFT – C ONFIDENTIAL – S UBJECT TO FURTHER REVIEW

Table of Contents Page 3 6 18 23 24 29 31 1. 2. 3. 4. Transaction Overview Selected Public Market Observations Financial Analyses Appendices Illustrative Selected Companies Information Illustrative Selected Transactions Information Disclaimer 2 CONFIDENTIAL – PRELIMINARY – SUBJECT TO FURTHER REVIEW

Transaction Overview

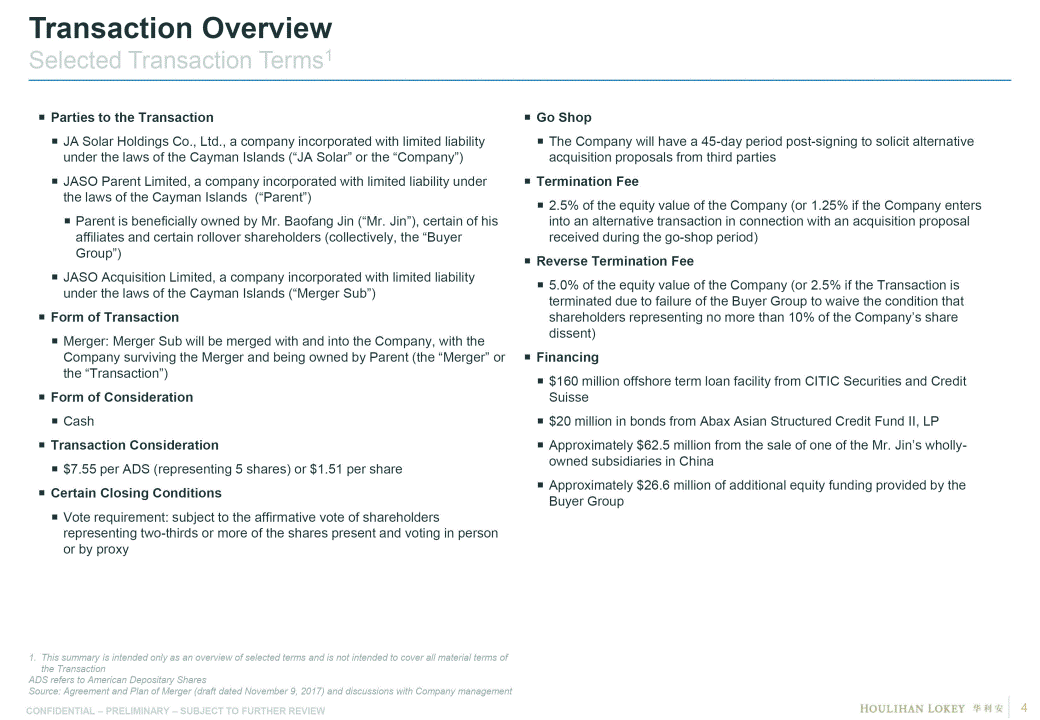
Transaction Overview Selected Transaction Terms1 Parties to the Transaction JA Solar Holdings Co., Ltd., a company incorporated with limited liability under the laws of the Cayman Islands (“JA Solar” or the “Company”) JASO Parent Limited, a company incorporated with limited liability under the laws of the Cayman Islands (“Parent”) Parent is beneficially owned by Mr. Baofang Jin (“Mr. Jin”), certain of his affiliates and certain rollover shareholders (collectively, the “Buyer Group”) JASO Acquisition Limited, a company incorporated with limited liability under the laws of the Cayman Islands (“Merger Sub”) Form of Transaction Merger: Merger Sub will be merged with and into the Company, with the Company surviving the Merger and being owned by Parent (the “Merger” or the “Transaction”) Form of Consideration Cash Transaction Consideration $7.55 per ADS (representing 5 shares) or $1.51 per share Certain Closing Conditions Vote requirement: subject to the affirmative vote of shareholders representing two-thirds or more of the shares present and voting in person or by proxy Go Shop The Company will have a 45-day period post-signing to solicit alternative acquisition proposals from third parties Termination Fee 2.5% of the equity value of the Company (or 1.25% if the Company enters into an alternative transaction in connection with an acquisition proposal received during the go-shop period) Reverse Termination Fee 5.0% of the equity value of the Company (or 2.5% if the Transaction is terminated due to failure of the Buyer Group to waive the condition that shareholders representing no more than 10% of the Company’s share dissent) Financing $160 million offshore term loan facility from CITIC Securities and Credit Suisse $20 million in bonds from Abax Asian Structured Credit Fund II, LP Approximately $62.5 million from the sale of one of the Mr. Jin’s wholly-owned subsidiaries in China Approximately $26.6 million of additional equity funding provided by the Buyer Group 1. This summary is intended only as an overview of selected terms and is not intended to cover all material terms of the Transaction ADS refers to American Depositary Shares Source: Agreement and Plan of Merger (draft dated November 9, 2017) and discussions with Company management 4 CONFIDENTIAL – PRELIMINARY – SUBJECT TO FURTHER REVIEW
Transaction Overview Transaction Value Overview Summary of Proposed Transaction Value Implied Premiums to Historical ADS Trading Prices (dollars and ADSs in millions, except per ADS price) (dollar per ADS) Per ADS Transaction Consideration [2] ADS Outstanding [1] Implied Premium of Per ADS Transaction Consideration over Closing ADS Price Security Trading Period Prior to Announcement ADS Price (Based on Trading Price on) 6/5/17 [8] ADS 48.0 $7.55 Implied Values 1-Day $6.39 18.2% Implied Common Equity $362.1 5-Day Average $6.74 12.1% Adjustments: Add: Total Debt [3] Less: Cash and Cash Equivalents [4] Less: Long-Term Deposits [5] Add: Noncontrolling Interest 1,098.5 (309.1) (8.3) 0.03 10-Day Average $6.92 9.1% 1-Month Average $7.08 6.7% 3-Month Average $6.44 17.2% Implied Enterprise Value $1,143.3 6-Month Average $5.86 28.9% Implied Transaction Multiples Adjusted EBITDA LTM (9/30/17) [6] NFY 2017E (12/31/2017) [7] NFY+1 2018E (12/31/2018) [7] NFY+2 2019E (12/31/2019) [7] 1-Year Average $6.17 22.3% 4.6x 4.5x 4.4x 4.2x 52-Week High 8/9/16 $7.98 (5.4%) 52-Week Low 1/30/17 $4.51 67.4% Note: Notes Receivable of $12.7 million treated as net working capital based on discussions with Company Management. Note Receivable represents fair value of non interest bearing bank drafts that have been arranged with third-party financial institutions by certain customers to settle purchases from the Company 1. Based on 47.8 million outstanding ADS as of 6/14/2017, the net shares issuable under the Treasury Method from outstanding options of 0.9 million, and 0.1 million of Restricted Stock Units 2. The Company received revised offer from the Buyer Group on 10/27/2017 to $7.55 per ADS for all the outstanding ADSs of the Company 3. Per Company SEC filings as of 9/30/2017.Total Debt includes current maturities of $636.3 million, long-term debt of $288.7 million, accrued interest of $8.4 million and capital leases of $165.2 million 4. Per Company SEC filings as of 9/30/2017. Excludes $162.1 million of restricted cash related to amounts temporarily held by banks as collateral for issuance of letters of credit, letters of guarantee, bank acceptance notes as well as certain bank borrowings, which are not available for use. Restricted cash is assumed to be a part of net working capital 5. Per Company SEC filings as of 9/30/2017. Represents long-term deposits related to a guarantee for a power station lease 6. Per Company SEC filings as of 9/30/2017 7. Per Company management projections 8. Represents the final trading day prior to the original June 5, 2017 offer made by the Buyer Group of $6.80 per ADS ADS refers to American Depositary Shares; LTM refers to the most recently completed 12-month period for which financial information has been made public; E refers to estimated; NFY refers to next fiscal year; NFY+1 refers to the year following NFY; NFY+2 refers to the year following NFY+1; Adjusted EBITDA refers to Earnings Before Interest, Taxes, Depreciation & Amortization, adjusted for certain non-recurring items Source: Company management, Company SEC filings and Capital IQ CONFIDENTIAL – PRELIMINARY – SUBJECT TO FURTHER REVIEW 5

Selected Public Market Observations

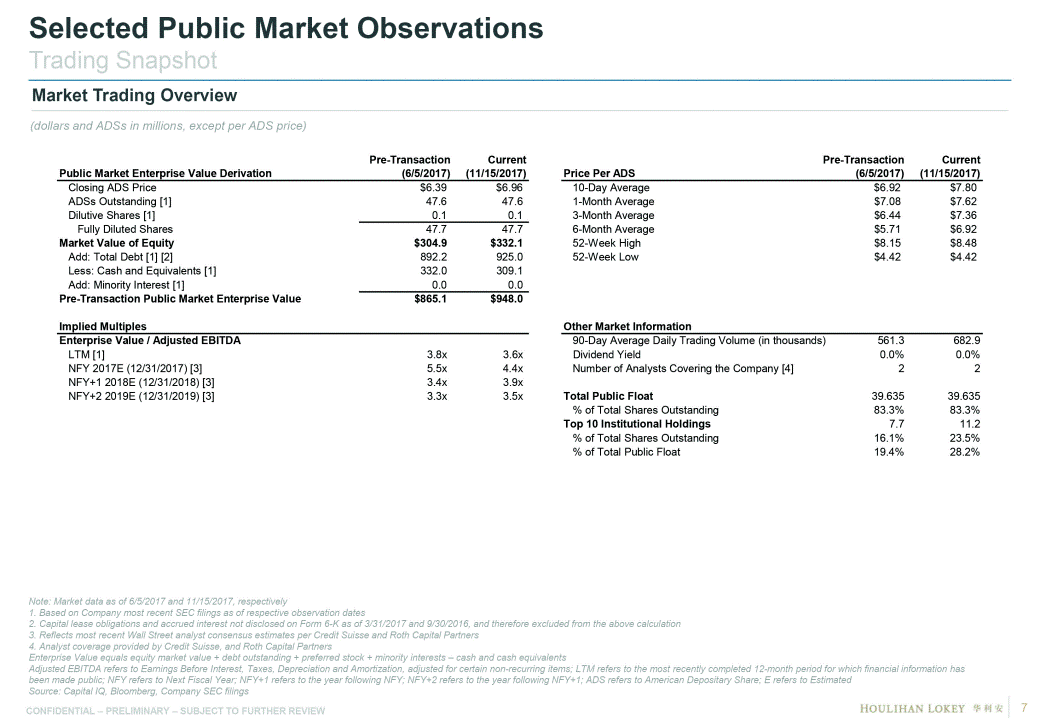
Selected Public Market Observations Trading Snapshot Market Trading Overview (dollars and ADSs in millions, except per ADS price) Less: Cash and Equivalents [1] 332.0 309.1 Add: Minority Interest [1] 0.0 0.0 % of Total Shares Outstanding op 10 Institutional Holdings 83.3% 83.3% 7.7 11.2 % of Total Shares Outstanding 16.1% 23.5% % of Total Public Float 19.4% 28.2% T Note: Market data as of 6/5/2017 and 11/15/2017, respectively 1. Based on Company most recent SEC filings as of respective observation dates 2. Capital lease obligations and accrued interest not disclosed on Form 6-K as of 3/31/2017 and 9/30/2016, and therefore excluded from the above calculation 3. Reflects most recent Wall Street analyst consensus estimates per Credit Suisse and Roth Capital Partners 4. Analyst coverage provided by Credit Suisse, and Roth Capital Partners Enterprise Value equals equity market value + debt outstanding + preferred stock + minority interests – cash and cash equivalents Adjusted EBITDA refers to Earnings Before Interest, Taxes, Depreciation and Amortization, adjusted for certain non-recurring items; LTM refers to the most recently completed 12-month period for which financial information has been made public; NFY refers to Next Fiscal Year; NFY+1 refers to the year following NFY; NFY+2 refers to the year following NFY+1; ADS refers to American Depositary Share; E refers to Estimated Source: Capital IQ, Bloomberg, Company SEC filings CONFIDENTIAL – PRELIMINARY – SUBJECT TO FURTHER REVIEW 7
Selected Public Market Observations Ownership Structure Current Ownership Structure (ADS Holder Detail) Current Ownership Structure Buyer Group ADS Holder ADS Held Ownership % Total Buyer Group Ownership 7,890,595 16.5% Rollover Shareholders [2] 4,427,755 9.2% Unaffiliated ADS Holders ADS Held Ownership % Options 0.3% Numeric Investors LLC 2,490,383 5.2% Morgan Stanley, Investment Banking and Brokerage Investments 1,603,274 3.3% Guggenheim Partners LLC 1,568,422 3.3% Lion Point Capital 1,470,766 3.1% Renaissance Technologies Corp. 999,871 2.1% Two Sigma Investments, LP 784,482 1.6% Two Sigma Advisors, LP 624,913 1.3% Invesco PowerShares Capital Management LLC 559,445 1.2% Aronson Johnson Ortiz, LP 548,886 1.1% Teachers Insurance and Annuity Association of America - College Retirement Equities Fund 510,500 1.1% Guinness Atkinson Asset Management, Inc 509,250 1.1% Guinness Asset Management Limited 406,348 0.8% Other ADS Holders 23,423,492 48.8% Unaffiliated Shareholders 74.0% Buyer Group 16.5% Rollover Shareholder 9.2% 1. Jinglong Group (32.96% owned by Mr.Jin) is a member of the Buyer Group 2. Rollover shares belong to Huang Chin Tien, Wong Chi Fung, and Wong Pak Wai 3. Based on 47.8 million outstanding ADS as of 6/14/2017, the net shares issuable under the Treasury Method from outstanding options of 0.9 million, and Restricted Stock Units of 0.1 million ADS refers to American Depositary Shares; Each ADS represents five outstanding shares Source: Company management, Capital IQ CONFIDENTIAL – PRELIMINARY – SUBJECT TO FURTHER REVIEW 8

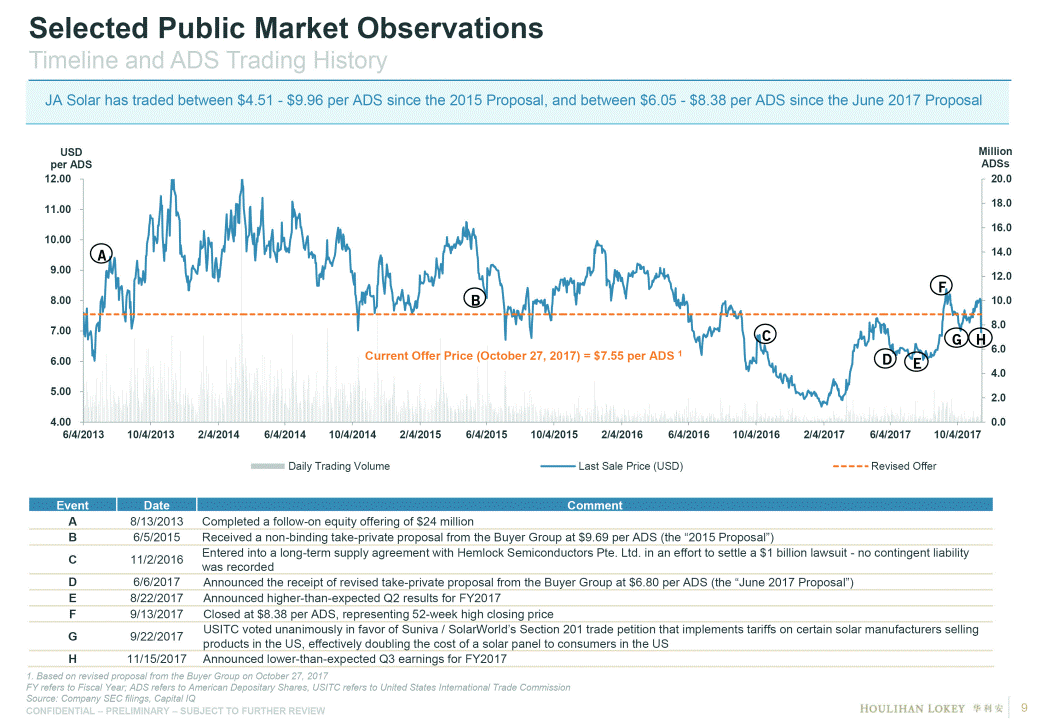
Selected Public Market Observations Timeline and ADS Trading History JA Solar has traded between $4.51 - $9.96 per ADS since the 2015 Proposal, and between $6.05 - $8.38 per ADS since the June 2017 Proposal USD per ADS 12.00 11.00 10.00 A 9.00 8.00 7.00 Million ADSs 20.0 18.0 16.0 14.0 12.0 F B10.0 8.0 CGH 6.00 5.00 Current Offer Price (October 27, 2017) = $7.55 per ADS 1 6.0 DE 4.0 2.0 4.00 6/4/2013 10/4/2013 2/4/2014 6/4/2014 10/4/2014 2/4/2015 6/4/2015 10/4/2015 2/4/2016 6/4/2016 10/4/2016 2/4/2017 6/4/2017 10/4/2017 0.0 Daily Trading Volume Last Sale Price (USD) Revised Offer 1. Based on revised proposal from the Buyer Group on October 27, 2017 FY refers to Fiscal Year; ADS refers to American Depositary Shares, USITC refers to United States International Trade Commission Source: Company SEC filings, Capital IQ CONFIDENTIAL – PRELIMINARY – SUBJECT TO FURTHER REVIEW 9
Selected Public Market Observations Relative ADS/Stock Price Performance 160.0% 140.0% Buyer Group made offer at $6.80 per ADS Index Scale - 100% Baseline on November 15, 2013 100.0% 80.0% 60.0% Selected Companies Index: (17.3%) JA Solar: (40.2%) 40.0% 20.0% 11/2013 3/2014 7/2014 11/2014 3/2015 7/2015 11/2015 3/2016 7/2016 11/2016 3/2017 7/2017 11/2017 Note: The Selected Companies index is equally weighted and includes Canadian Solar Inc., JinkoSolar Holdings Co., Ltd., Eging Photovoltaic Technology Co., Ltd., Hanwha Q Cells Co., Ltd. and First Solar, Inc. ADS refers to American Depositary Shares Source: Capital IQ as of 11/15/2017 CONFIDENTIAL – PRELIMINARY – SUBJECT TO FURTHER REVIEW 10

Selected Public Market Observations Relative ADS/Stock Price Performance (cont.) 160.0% Buyer Group made offer at $6.80 per ADS 140.0% S&P500 Index: 42.6% Index Scale - 100% Baseline on November 15, 2013 100.0% 80.0% 60.0% JA Solar: (40.2%) 40.0% 20.0% 11/2013 3/2014 7/2014 11/2014 3/2015 7/2015 11/2015 3/2016 7/2016 11/2016 3/2017 7/2017 11/2017 ADS refers to American Depositary Shares Source: Capital IQ as of 11/15/2017 CONFIDENTIAL – PRELIMINARY – SUBJECT TO FURTHER REVIEW 11

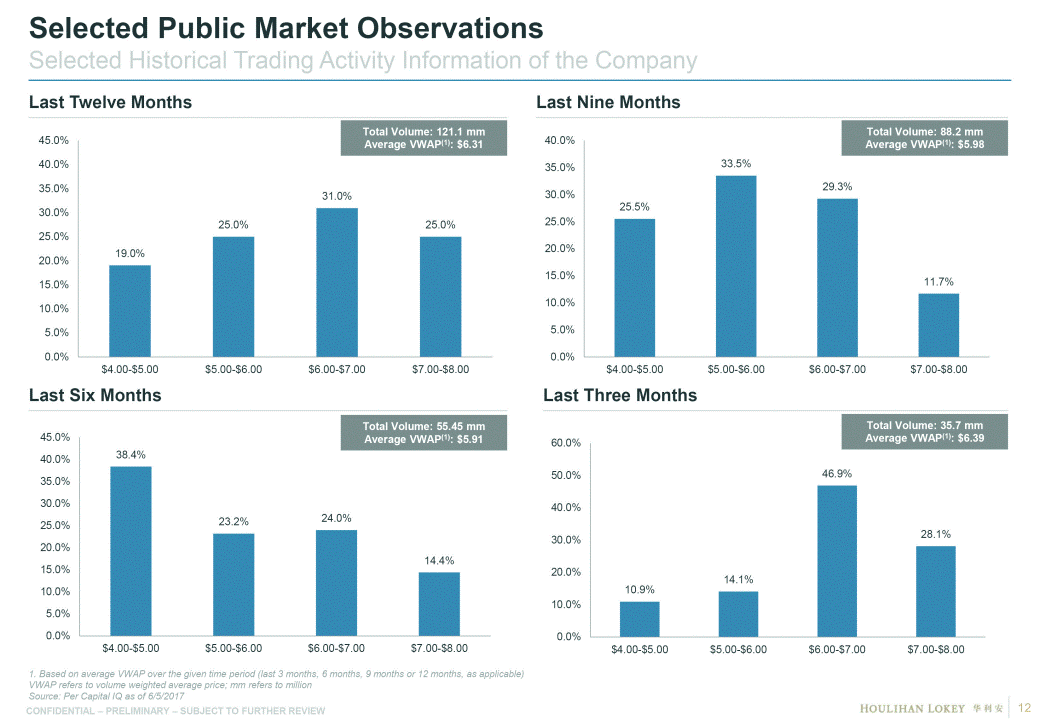
Selected Public Market Observations Selected Historical Trading Activity Information of the Company Last Twelve Months Last Nine Months 45.0% 40.0% 35.0% 30.0% 25.0% 20.0% 15.0% 10.0% 5.0% 19.0% 25.0% 31.0% Total Volume: 121.1 mm Average VWAP(1): $6.31 25.0% 40.0% 35.0% 30.0% 25.0% 20.0% 15.0% 10.0% 5.0% 25.5% 33.5% 29.3% Total Volume: 88.2 mm Average VWAP(1): $5.98 11.7% 0.0% $4.00-$5.00 $5.00-$6.00 $6.00-$7.00 $7.00-$8.00 0.0% $4.00-$5.00 $5.00-$6.00 $6.00-$7.00 $7.00-$8.00 Last Six Months Last Three Months 45.0% 40.0% 35.0% 30.0% 25.0% 20.0% 15.0% 10.0% 5.0% 0.0% 38.4% 23.2% 24.0% Total Volume: 55.45 mm Average VWAP(1): $5.91 14.4% 60.0% 50.0% 40.0% 30.0% 20.0% 10.0% 0.0% 10.9% 14.1% 46.9% Total Volume: 35.7 mm Average VWAP(1): $6.39 28.1% $4.00-$5.00 $5.00-$6.00 $6.00-$7.00 $7.00-$8.00 $4.00-$5.00 $5.00-$6.00 $6.00-$7.00 $7.00-$8.00 1. Based on average VWAP over the given time period (last 3 months, 6 months, 9 months or 12 months, as applicable) VWAP refers to volume weighted average price; mm refers to million Source: Per Capital IQ as of 6/5/2017 CONFIDENTIAL – PRELIMINARY – SUBJECT TO FURTHER REVIEW 12
Selected Public Market Observations Current Float and Trading Observations Public Float / Shares Outstanding 100.0% 90.0% 80.0% 70.0% 60.0% 76.6% 70.9% 76.2% 62.5% 83.3% 73.6% 62.6% 50.0% 40.0% 30.0% 20.0% 10.0% 6.0% 0.0% Canadian Solar Eging First Solar JinkoSolar Hanwha Q Cells JA Solar Median Mean 90–Day Average Daily Volume / Public Float 3.00% 2.85% 2.50% 2.00% 1.50% 2.07% 1.35% 2.31% 1.44% 1.76% 1.68% 1.00% 0.50% 0.00% 0.04% Canadian Solar Eging First Solar JinkoSolar Hanwha Q Cells JA Solar Median Mean Source: Capital IQ as of 11/15/17 CONFIDENTIAL – PRELIMINARY – SUBJECT TO FURTHER REVIEW 13

Selected Public Market Observations Float and Trading Observations as of June 5, 2017 Public Float / Shares Outstanding 100.0% 90.0% 80.0% 70.0% 60.0% 76.3% 63.1% 76.1% 70.1% 83.3% 73.1% 62.5% 50.0% 40.0% 30.0% 20.0% 10.0% 6.0% 0.0% Canadian Solar Eging First Solar JinkoSolar Hanwha Q Cells JA Solar Median Mean 90–Day Average Daily Volume / Public Float 4.00% 3.50% 3.60% 3.00% 2.50% 2.00% 1.50% 1.00% 2.16% 1.14% 2.05% 1.18% 1.62% 1.70% 0.50% 0.00% 0.05% Canadian Solar Eging First Solar JinkoSolar Hanwha Q Cells JA Solar Median Mean Source: Capital IQ as of 6/5/17 CONFIDENTIAL – PRELIMINARY – SUBJECT TO FURTHER REVIEW 14

Selected Public Market Observations Comparison of Current Management Projections and Analyst Consensus Management Projections Wall Street Analyst Consensus Revenue Adjusted EBITDA $3,507.2 $262.4 $270.5 $254.7 $263.0 $2,595.9 $2,702.0 $2,865.2 $2,469.4 $2,309.7 $214.0 FY2017E FY2018E FY2019E FY2017E FY2018E FY2019E Adjusted EBIT Capital Expenditures $100.3 $88.0 $94.3 $98.2 $78.0 $80.0 $408.5 $421.0 $228.6 $218.0 $218.0 $118.2 FY2017E FY2018E FY2019E FY2017E FY2018E FY2019E Note: Wall Street analyst consensus includes estimates from Credit Suisse and Roth Capital Partners. For Adjusted EBIT and Capital Expenditures, Wall Street analyst consensus estimate is solely based on Roth Capital Partners’ research FY refers to Fiscal Year; E refers to Estimated; Adjusted EBITDA refers to Earnings Before Interest, Taxes, Depreciation & Amortization, adjusted for certain non-recurring items Source: Company Management, Wall Street Projections from Credit Suisse and Roth Capital Partners CONFIDENTIAL – PRELIMINARY – SUBJECT TO FURTHER REVIEW 15

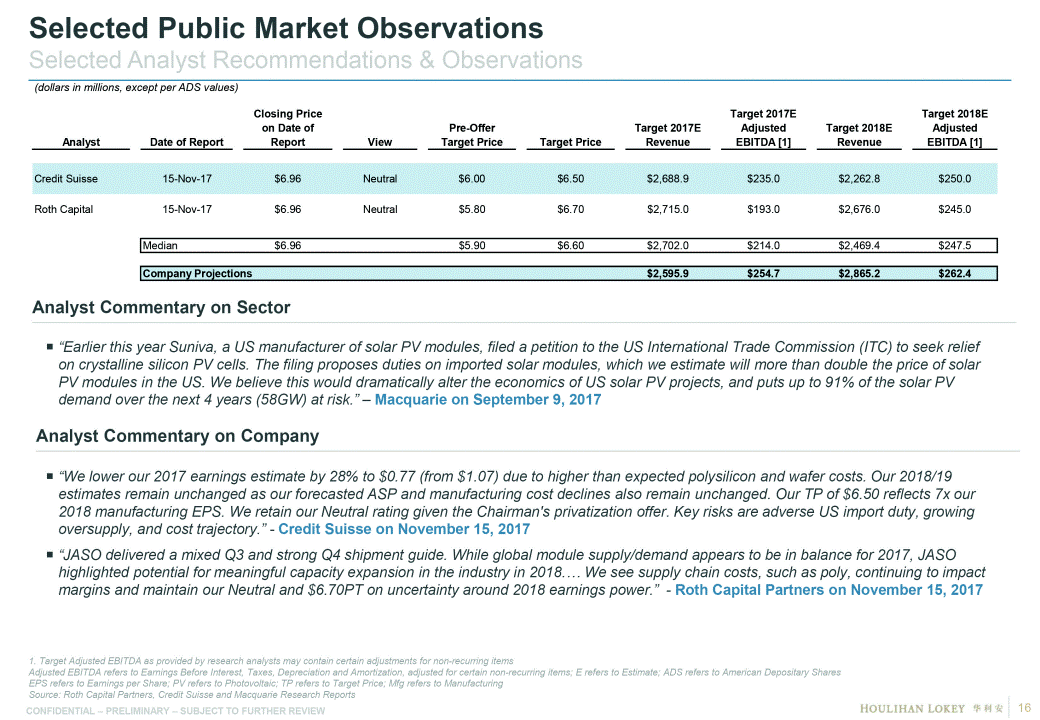
Selected Public Market Observations Selected Analyst Recommendations & Observations (dollars in millions, except per ADS values) Analyst Date of Report Closing Price on Date of Report View Pre-Offer Target Price Target Price Target 2017E Revenue Target 2017E Adjusted EBITDA [1] Target 2018E Revenue Target 2018E Adjusted EBITDA [1] Credit Suisse 15-Nov-17 $6.96 Neutral $6.00 $6.50 $2,688.9 $235.0 $2,262.8 $250.0 Roth Capital 15-Nov-17 $6.96 Neutral $5.80 $6.70 $2,715.0 $193.0 $2,676.0 $245.0 Median $6.96 $5.90 $6.60 $2,702.0 $214.0 $2,469.4 $247.5 Company Projections $2,595.9 $254.7 $2,865.2 $262.4 Analyst Commentary on Sector “Earlier this year Suniva, a US manufacturer of solar PV modules, filed a petition to the US International Trade Commission (ITC) to seek relief on crystalline silicon PV cells. The filing proposes duties on imported solar modules, which we estimate will more than double the price of solar PV modules in the US. We believe this would dramatically alter the economics of US solar PV projects, and puts up to 91% of the solar PV demand over the next 4 years (58GW) at risk.” – Macquarie on September 9, 2017 Analyst Commentary on Company “We lower our 2017 earnings estimate by 28% to $0.77 (from $1.07) due to higher than expected polysilicon and wafer costs. Our 2018/19 estimates remain unchanged as our forecasted ASP and manufacturing cost declines also remain unchanged. Our TP of $6.50 reflects 7x our 2018 manufacturing EPS. We retain our Neutral rating given the Chairman's privatization offer. Key risks are adverse US import duty, growing oversupply, and cost trajectory.” - Credit Suisse on November 15, 2017 “JASO delivered a mixed Q3 and strong Q4 shipment guide. While global module supply/demand appears to be in balance for 2017, JASO highlighted potential for meaningful capacity expansion in the industry in 2018.… We see supply chain costs, such as poly, continuing to impact margins and maintain our Neutral and $6.70PT on uncertainty around 2018 earnings power.” - Roth Capital Partners on November 15, 2017 1. Target Adjusted EBITDA as provided by research analysts may contain certain adjustments for non-recurring items Adjusted EBITDA refers to Earnings Before Interest, Taxes, Depreciation and Amortization, adjusted for certain non-recurring items; E refers to Estimate; ADS refers to American Depositary Shares EPS refers to Earnings per Share; PV refers to Photovoltaic; TP refers to Target Price; Mfg refers to Manufacturing Source: Roth Capital Partners, Credit Suisse and Macquarie Research Reports CONFIDENTIAL – PRELIMINARY – SUBJECT TO FURTHER REVIEW 16
Selected Public Market Observations Equity Analyst Price Targets for JA Solar Since Q4 2016, equity analysts have consistently issued price targets for JA Solar lower than the current offer of $7.55 per ADS USD per ADS R R C 12.00 11.00 Current Offer Price (October 27, 2017) = $7.55 per ADS 1 10.00 R R R R R R R C R C C C R R 4.00 3.00 6/4/2013 10/4/2013 2/4/2014 6/4/2014 10/4/2014 2/4/2015 6/4/2015 10/4/2015 2/4/2016 6/4/2016 10/4/2016 2/4/2017 6/4/2017 10/4/2017 C R Note: Only considers analysts estimates utilizing traditional valuation methodologies. Excludes price targets based on 2015 Proposal and June 2017 Proposal 1. Based on revised proposal price from the Buyer Group in October 2017 ADS refers to American Depositary Shares; Q refers to quarter Source: Company SEC filings, Capital IQ CONFIDENTIAL – PRELIMINARY – SUBJECT TO FURTHER REVIEW 17

Financial Analyses

Financial Analyses Summary Implied Equity Value Per ADS Reference Range Per ADS Transaction Consideration of $7.551 Discounted Cash Flow 2.5% - 3.0% Discount Rate: 10.0% - 11.0% $2.81 $7.33 $0.00 $2.00 $4.00 $6.00 $8.00 $10.00 $12.00 ADS refers to American Depositary Shares 1. Based on revised proposal price from the Buyer Group on October 27, 2017 Source: Company management CONFIDENTIAL – PRELIMINARY – SUBJECT TO FURTHER REVIEW 19

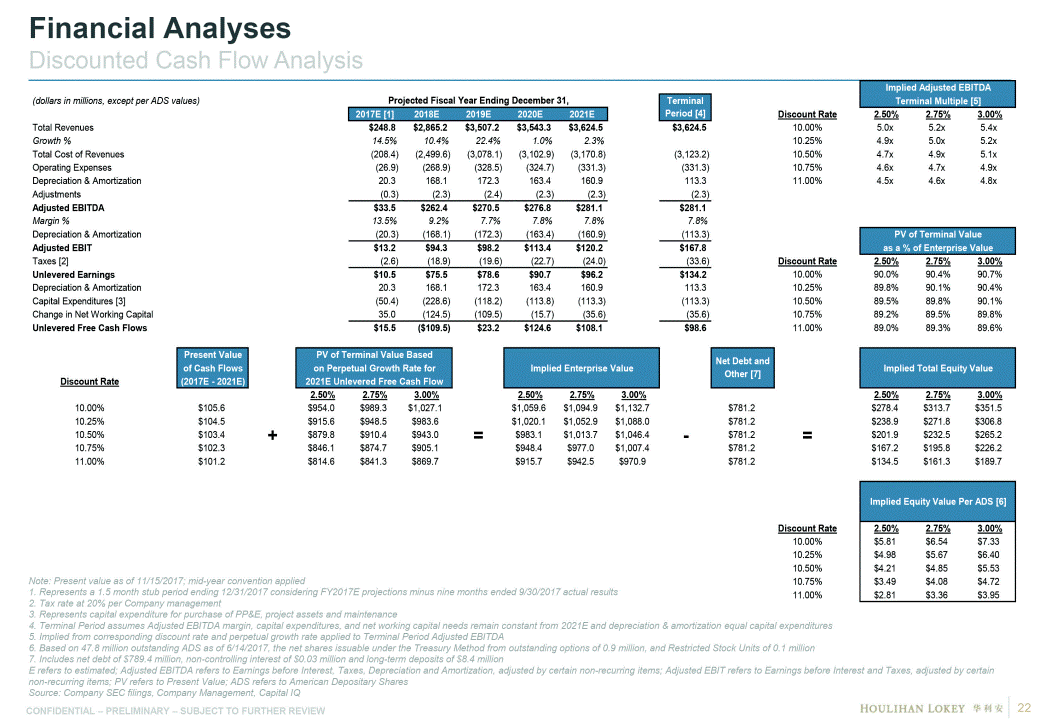
Financial Analyses Summary (cont.) (dollars and ADSs in millions, except per ADS price) Discounted Cash Flow Analysis Gordon Growth 2.50% --3.00% Discount Rate 10.00% --11.00% Implied Enterprise Value Reference Range $915.7 --$1,132.7 Cash and Cash Equivalents as of 9/30/2017 $309.1 --$309.1 Long-Term Deposits as of 9/30/2017 [1] $8.3 --$8.3 Implied Total Enterprise Value Reference Range $1,233.1 --$1,450.1 Total Debt as of 9/30/17 ($1,098.5) --($1,098.5) Noncontrolling Interest as of 9/30/17 ($0.03) --($0.03) Implied Total Equity Value Reference Range $134.5 --$351.5 ADSs Outstanding [2] 48.0 --48.0 Implied Per ADS Reference Range $2.81 --$7.33 1. Represents long-term power station leasing deposits 2. Based on 47.8 million outstanding ADS as of 6/14/2017, the net shares issuable under the Treasury Method from outstanding options of 0.9 million, and Restricted Stock Units of 0.1 million ADS refers to American Depositary Shares Source: Company Management, Company SEC filings CONFIDENTIAL – PRELIMINARY – SUBJECT TO FURTHER REVIEW 20

Financial Analyses Selected Historical and Projected Financial Information (dollars in millions) Fiscal Year Ending December 31, LTM Ended Fiscal Year Ending December 31, CAGR 2017E to 2021E Solar Modules, Cells and Other Products Electricity Generation $1,816.9 3.6 $2,078.0 9.9 $2,244.1 22.5 NA NA $2,542.5 53.4 $2,812.8 52.4 $3,454.9 52.3 $3,493.0 50.2 $3,576.8 47.7 Growth % Total Cost of Revenues Gross Profit Margin % Operating Expenses Depreciation & Amortization Total Adjustments [1] 14.7% (1,734.0) 8.6% (1,936.2) 14.5% (2,257.6) 10.4% (2,499.6) 22.4% (3,078.1) 1.0% (3,102.9) 2.3% (3,170.8) (1,537.4) (2,366.5) $283.1 15.6% (176.3) 110.5 15.6 $353.9 17.0% (220.4) 123.1 25.1 $330.3 14.6% (200.3) 131.5 (19.7) $335.7 12.4% (204.1) 137.2 (20.8) $338.3 13.0% (235.7) 154.4 (2.3) $365.5 12.8% (268.9) 168.1 (2.3) $429.1 12.2% (328.5) 172.3 (2.4) $440.4 12.4% (324.7) 163.4 (2.3) $453.7 12.5% (331.3) 160.9 (2.3) Margin % Growth % Depreciation & Amortization 12.8% 13.5% 21.0% (123.1) 10.7% -14.2% (131.5) 9.2% 9.8% 5.3% (154.4) 9.2% 3.0% (168.1) 7.7% 3.1% (172.3) 7.8% 2.3% (163.4) 7.8% 1.5% (160.9) (110.5) (137.2) Margin % 6.7% 7.6% 4.9% 4.1% 3.9% 3.3% 2.8% 3.2% 3.3% Additional Financial Information Capital Expenditures Net Working Capital Change in Net Working Capital Manufacturing Capacity and Shipment (GW) [2] Cell Capacity Cell Shipment Module Capacity Module Shipment Average Selling Price ($ / Watt) Cell Module Adjustments ($187.5) $308.0 ($197.1) $311.8 ($3.7) ($421.7) $280.8 $30.9 ($355.8) $270.3 ($408.5) $236.6 $44.3 ($228.6) $361.1 ($124.5) ($118.2) $470.6 ($109.5) ($113.8) $486.4 ($15.7) ($113.3) $522.0 ($35.6) 2.8 0.7 2.8 2.4 4.4 0.3 3.9 3.7 5.5 0.3 5.5 4.6 5.5 0.3 5.5 6.4 6.9 0.3 7.0 6.3 7.4 0.1 9.0 7.9 8.5 0.0 10.0 10.0 9.5 0.0 11.0 11.0 10.0 0.0 12.0 12.0 $2.30 $3.90 $3.50 $0.30 $3.20 $1.80 $0.30 $0.39 $0.20 $0.39 $0.21 $0.35 NMF $0.35 NMF $0.32 NMF $0.30 Note: Forecast provided by Company management converted to USD utilizing Bloomberg forward pricing curve as of 11/15/2017 1. Total adjustments include adjustments for Hemlock accrued interests from 2014 to 2016 and adjustments for Loss from Purchase Commitments and Contract Termination Costs from 2015 to 2016. See note 3 and note 4 below 2. Cell shipment is significantly less than cell capacity, as solar cells are primarily for internal consumption as solar cells are assembled into solar modules 3. Refers to accrued late payment interest charges and reversal due to Supply Agreement with Hemlock Semiconductors Pte. Ltd. 4. Includes loss from purchase commitments and contract termination costs and impairment loss from project assets 5. Company management indicated that the Company incurs approximately $2.3 million annually in public company expenses not included in the forecast provided LTM refers to the most recently completed 12-month period for which financial information has been made public ; E refers to Estimated; Adjusted EBITDA refers to Earnings Before Interest, Taxes, Depreciation & Amortization, adjusted for certain non-recurring items; CAGR refers to Compound Annual Growth Rate; NA refers to Not Available; NMF refers to not meaningful figure; GW refers to Giga Watt Source: Company SEC filings, Projections provided by Company Management, Capital IQ CONFIDENTIAL – PRELIMINARY – SUBJECT TO FURTHER REVIEW 21 Hemlock Accrued Interest [3] Loss from Purchase Commitments and Contract Termination Costs [4] Income/ (Loss) for Equity Investment in a Joint Venture Public Company Expenses [5] Total Adjustments $15.1$19.1($43.7)($45.6)$0.0$0.0$0.0$0.0$0.0 0.05.022.623.50.00.00.00.00.0 0.51.01.41.80.00.00.00.00.0 0.00.00.0(0.6)(2.3)(2.3)(2.4)(2.3)(2.3) $15.6$25.1($19.7)($20.8)($2.3)($2.3)($2.4)($2.3)($2.3) 1.7% Adjusted EBIT$122.4$158.6$110.4$110.7$100.3$94.3$98.2$113.4$120.2 3.1% Adjusted EBITDA$232.9$281.7$241.8$248.0$254.7$262.4$270.5$276.8$281.1 9.8% Total Revenues$1,820.5$2,088.0$2,266.6$2,702.1$2,595.9$2,865.2$3,507.2$3,543.3$3,624.5 2017E2018E2019E2020E2021E 9/30/17 201420152016

Financial Analyses Discounted Cash Flow Analysis Discount Rate 2.50% 5.0x 4.9x 4.7x 4.6x 4.5x 2.75% 5.2x 5.0x 4.9x 4.7x 4.6x 3.00% 5.4x 5.2x 5.1x 4.9x 4.8x Total Revenues Growth % Total Cost of Revenues Operating Expenses Depreciation & Amortization Adjustments Adjusted EBITDA Margin % Depreciation & Amortization Adjusted EBIT Taxes [2] Unlevered Earnings Depreciation & Amortization Capital Expenditures [3] Change in Net Working Capital Unlevered Free Cash Flows 10.00% 10.25% 10.50% 10.75% 11.00% $248.8 14.5% (208.4) (26.9) 20.3 (0.3) $2,865.2 10.4% (2,499.6) (268.9) 168.1 (2.3) $3,507.2 22.4% (3,078.1) (328.5) 172.3 (2.4) $3,543.3 1.0% (3,102.9) (324.7) 163.4 (2.3) $3,624.5 2.3% (3,170.8) (331.3) 160.9 (2.3) $3,624.5 (3,123.2) (331.3) 113.3 (2.3) $33.5 13.5% (20.3) $262.4 9.2% (168.1) $270.5 7.7% (172.3) $276.8 7.8% (163.4) $281.1 7.8% (160.9) $281.1 7.8% (113.3) $13.2 (2.6) $94.3 (18.9) $98.2 (19.6) $113.4 (22.7) $120.2 (24.0) $167.8 (33.6) Discount Rate 2.50% 90.0% 89.8% 89.5% 89.2% 89.0% 2.75% 90.4% 90.1% 89.8% 89.5% 89.3% 3.00% 90.7% 90.4% 90.1% 89.8% 89.6% $10.5 20.3 (50.4) 35.0 $75.5 168.1 (228.6) (124.5) $78.6 172.3 (118.2) (109.5) $90.7 163.4 (113.8) (15.7) $96.2 160.9 (113.3) (35.6) $134.2 113.3 (113.3) (35.6) 10.00% 10.25% 10.50% 10.75% 11.00% $15.5 ($109.5) $23.2 $124.6 $108.1 $98.6 Discount Rate 2.50% $954.0 $915.6 $879.8 $846.1 $814.6 2.75% $989.3 $948.5 $910.4 $874.7 $841.3 3.00% $1,027.1 $983.6 $943.0 $905.1 $869.7 2.50% $1,059.6 $1,020.1 $983.1 $948.4 $915.7 2.75% $1,094.9 $1,052.9 $1,013.7 $977.0 $942.5 3.00% $1,132.7 $1,088.0 $1,046.4 $1,007.4 $970.9 2.50% $278.4 $238.9 $201.9 $167.2 $134.5 2.75% $313.7 $271.8 $232.5 $195.8 $161.3 3.00% $351.5 $306.8 $265.2 $226.2 $189.7 10.00% 10.25% 10.50% 10.75% 11.00% $105.6 $104.5 $103.4 $102.3 $101.2 $781.2 $781.2 $781.2 $781.2 $781.2 + = - = Discount Rate 10.00% 10.25% 10.50% 10.75% 11.00% Note: Present value as of 11/15/2017; mid-year convention applied 1. Represents a 1.5 month stub period ending 12/31/2017 considering FY2017E projections minus nine months ended 9/30/2017 actual results 2. Tax rate at 20% per Company management 3. Represents capital expenditure for purchase of PP&E, project assets and maintenance 4. Terminal Period assumes Adjusted EBITDA margin, capital expenditures, and net working capital needs remain constant from 2021E and depreciation & amortization equal capital expenditures 5. Implied from corresponding discount rate and perpetual growth rate applied to Terminal Period Adjusted EBITDA 6. Based on 47.8 million outstanding ADS as of 6/14/2017, the net shares issuable under the Treasury Method from outstanding options of 0.9 million, and Restricted Stock Units of 0.1 million 7. Includes net debt of $789.4 million, non-controlling interest of $0.03 million and long-term deposits of $8.4 million E refers to estimated; Adjusted EBITDA refers to Earnings before Interest, Taxes, Depreciation and Amortization, adjusted by certain non-recurring items; Adjusted EBIT refers to Earnings before Interest and Taxes, adjusted by certain non-recurring items; PV refers to Present Value; ADS refers to American Depositary Shares Source: Company SEC filings, Company Management, Capital IQ CONFIDENTIAL – PRELIMINARY – SUBJECT TO FURTHER REVIEW 22 Implied Equity Value Per ADS [6] 2.50% 2.75% 3.00% $5.81$6.54$7.33 $4.98$5.67$6.40 $4.21$4.85$5.53 $3.49$4.08$4.72 $2.81$3.36$3.95 Implied Total Equity Value Net Debt and Other [7] Implied Enterprise Value PV of Terminal Value Based on Perpetual Growth Rate for 2021E Unlevered Free Cash Flow Present Value of Cash Flows (2017E - 2021E) PV of Terminal Value as a % of Enterprise Value 2017E [1]2018E2019E2020E2021E Period [4] (dollars in millions, except per ADS values)Projected Fiscal Year Ending December 31,Terminal Implied Adjusted EBITDA Terminal Multiple [5]
Appendices

Appendices Illustrative Selected Companies Information

Illustrative Selected Selected Companies Companies Information (dollars in millions, except per share/ADS values) Share/ADS Price [1] Equity Market Value [1][2] Enterprise Value [3] Enterprise Value to Adjusted EBITDA Selected Company LTM NFY (2017E) [4] NFY+1 (2018E) [4] NFY+2 (2019E) [4] *Canadian Solar Inc. EGing Photovoltaic Technology *First Solar, Inc. *JinkoSolar Holding Co., Ltd. Hanwha Q CELLS Co., Ltd. $17.46 $0.78 $60.60 $27.02 $8.18 $1,035.6 913.1 6,384.3 982.7 684.0 $2,904.7 754.5 4,042.5 2,478.2 1,324.6 11.5x 11.4x 7.1x 12.3x 7.7x 9.2x NMF 11.5x 18.3x 7.3x 8.7x NMF 12.6x 17.9x 7.1x 9.5x NMF 9.0x 17.6x 6.4x . Selected Companies Observations The Selected Companies are generally larger and more diversified than JA Solar The Selected Companies are generally less focused on cell manufacturing than JA Solar and more focused on higher margin downstream activities JA Solar derives significantly more of its revenue from China (approximately 50%) relative to the Selected Companies (approximately 30% on average) JA Solar’s products sell at a lower average selling price relative to the Selected Companies based on perceived quality and consistency of products, amongst other factors JA Solar has, over the past three years, traded at a LTM EV/EBITDA multiple discount to the Selected Companies of between 1.6x and 9.8x Note: No company shown for illustrative purposes is identical to the Company * Represents company contacted as part of the market check process in 2015 1. Based on closing prices as of 11/15/17. JinkoSolar Holding Co., Ltd, Hanwha Q CELLS Co., Ltd, and JA Solar Holdings Co Ltd trading prices on per ADS basis 2. Based on reported fully-diluted shares 3. Enterprise Value equals equity market value + debt outstanding + preferred stock + minority interests – cash and cash equivalents 4. Multiples based on forward-looking financial information Adjusted EBITDA refers to Earnings Before Interest, Taxes, Depreciation & Amortization, adjusted for certain non-recurring items; LTM refers to the most recently completed 12-month period for which financial information has been made public ; NFY refers to next fiscal year; NFY+1 refers to the year following NFY; NFY+2 refers to the year following NFY+1; NA refers to not available figure; NMF refers to not meaningful figure Source: SEC filings, Capital IQ, Bloomberg CONFIDENTIAL – PRELIMINARY – SUBJECT TO FURTHER REVIEW 25 JA Solar Holdings Co Ltd (Trading Price and Street Proj.) $6.96 $332.1 $948.0 3.6x 4.4x 3.9x 3.5x JA Solar Holdings Co Ltd (Offer Price and Street Proj.) $7.55 $362.1 $1,143.3 4.4x 5.3x 4.7x 4.2x JA Solar Holdings Co Ltd (Offer Price and Management Proj.) $7.55 $362.1 $1,143.3 4.6x 4.5x 4.4x 4.2x Low 7.1x 7.3x 7.1x 6.4x High 12.3x 18.3x 17.9x 17.6x Median 11.4x 10.4x 10.7x 9.3x Mean 10.0x 11.6x 11.6x 10.6x

Illustrative Selected Companies Information Historical LTM EV/EBITDA Trading Multiples vs. Selected Companies 20.0x 17.5x 15.0x 12.5x 10.0x Median LTM EV/EBITDA Multiple of Selected Public Companies: 8.0x 7.5x 5.0x Median LTM EV/EBITDA Multiple of JA Solar: 3.6x 2.5x 0.0x 11/2014 2/2015 5/2015 8/2015 11/2015 2/2016 5/2016 8/2016 11/2016 2/2017 5/2017 8/2017 11/2017 Note: The Selected Companies index is equally weighted and includes Canadian Solar Inc., JinkoSolar Holdings Co., Ltd., Eging Photovoltaic Technology Co., Ltd., Hanwha Q Cells Co., Ltd. and First Solar, Inc. ADS refers to American Depositary Shares; LTM refers to the most recently completed 12-month period for which financial information has been made public; EV refers to Enterprise Value; EBITDA refers to Earnings Before Interest, Taxes, Depreciation & Amortization, adjusted for certain non-recurring items Source: Capital IQ as of 11/15/2017 CONFIDENTIAL – PRELIMINARY – SUBJECT TO FURTHER REVIEW 26 Buyer Group made offer at $6.80 per ADS Median Selected Companies LTM EV/EBITDA Median JA Solar LTM EV/EBITDA JA Solar has historically traded at a discount between 1.6x and 9.8x, or an average of 4.4x, to the Selected Companies on an EV/LTM EBITDA basis

Illustrative Selected Companies Selected Companies Benchmarking Information Note: No company used in this analysis for comparative purposes is identical to the Company EV refers to Enterprise Value; LTM refers to the most recently completed 12-month period for which financial information has been made public; Adjusted EBITDA refers to Earnings before Interest, Taxes, Depreciation and Amortization, adjusted by certain non-recurring items; NFY refers to next fiscal year for which financial information has not been made public, other than for the Company, in which case NFY refers to fiscal year 2017 projected financials provided by Company management; NFY+1 refers to the year after next fiscal year, other than for the Company, in which case NFY+1 refers to fiscal year 2018 projected financials provided by Company management; CAPEX refers to Capital Expenditure; NA refers to not available figure; NMF refers to not meaningful figure Source: SEC filings, Capital IQ, Company management 27 CONFIDENTIAL – PRELIMINARY – SUBJECT TO FURTHER REVIEW Liquidity (Current Ratio as of 11/15/17) First Solar, Inc. 6.9 EGing Photovoltaic Technology 1.7 JinkoSolar Holding Co., Ltd. 1.0 Hanwha Q CELLS Co., Ltd. 1.0 Canadian Solar Inc. 1.0 JA Solar 1.0 Profitability (NFY+1 Adjusted EBITDA to NFY+1 Revenue) First Solar, Inc. 13.2% Canadian Solar Inc. 8.4% Hanwha Q CELLS Co., Ltd. 8.2% JinkoSolar Holding Co., Ltd. 3.7% EGing Photovoltaic Technology NA JA Solar 9.2% Profitability (NFY Adjusted EBITDA to NFY Revenue) First Solar, Inc. 11.6% Hanwha Q CELLS Co., Ltd. 8.4% Canadian Solar Inc. 8.0% JinkoSolar Holding Co., Ltd. 3.5% EGing Photovoltaic Technology NA JA Solar 9.8% Profitability (LTM Adjusted EBITDA to LTM Revenue) First Solar, Inc. 19.1% EGing Photovoltaic Technology 10.1% Canadian Solar Inc. 8.5% Hanwha Q CELLS Co., Ltd. 7.5% JinkoSolar Holding Co., Ltd. 5.5% JA Solar 9.2% Projected Growth (NFY+2 Adjusted EBITDA) First Solar, Inc. 13.0% Hanwha Q CELLS Co., Ltd. 6.7% JinkoSolar Holding Co., Ltd. 1.9% Canadian Solar Inc. -1.3% EGing Photovoltaic Technology NA JA Solar 3.0% Projected Growth (NFY+2 Revenue) Hanwha Q CELLS Co., Ltd. 2.7% JinkoSolar Holding Co., Ltd. 0.6% Canadian Solar Inc. -1.7% First Solar, Inc. -9.4% EGing Photovoltaic Technology NA JA Solar 16.2% Projected Growth (NFY+1 Adjusted EBITDA) Canadian Solar Inc. 6.3% Hanwha Q CELLS Co., Ltd. 3.3% JinkoSolar Holding Co., Ltd. 2.5% First Solar, Inc. -8.5% EGing Photovoltaic Technology NA JA Solar 3.0% Projected Growth (NFY+1 Revenue) Hanwha Q CELLS Co., Ltd. 5.2% Canadian Solar Inc. 1.2% JinkoSolar Holding Co., Ltd. -3.5% First Solar, Inc. -19.6% EGing Photovoltaic Technology NA JA Solar 10.4% Projected Growth (NFY Adjusted EBITDA) Canadian Solar Inc. 67.9% Hanwha Q CELLS Co., Ltd. -34.9% First Solar, Inc. -52.9% JinkoSolar Holding Co., Ltd. -60.4% EGing Photovoltaic Technology NA JA Solar 5.3% Projected Growth (NFY Revenue) Canadian Solar Inc. 37.7% JinkoSolar Holding Co., Ltd. 21.2% First Solar, Inc. 2.3% Hanwha Q CELLS Co., Ltd. -10.7% EGing Photovoltaic Technology NA JA Solar 14.5% Historical Growth (1-Fiscal Year Adjusted EBITDA) Hanwha Q CELLS Co., Ltd. 44.1% JinkoSolar Holding Co., Ltd. 29.1% EGing Photovoltaic Technology 6.4% First Solar, Inc. -6.4% Canadian Solar Inc. -50.7% JA Solar -14.2% Historical Growth (2-Fiscal Year Adjusted EBITDA) Hanwha Q CELLS Co., Ltd. 120.5% JinkoSolar Holding Co., Ltd. 32.3% EGing Photovoltaic Technology 23.7% First Solar, Inc. 5.9% Canadian Solar Inc. -36.9% JA Solar 1.9% Historical Growth (1-Fiscal Year Revenue) JinkoSolar Holding Co., Ltd. 38.5% Hanwha Q CELLS Co., Ltd. 34.7% EGing Photovoltaic Technology 5.1% First Solar, Inc. -17.5% Canadian Solar Inc. -17.7% JA Solar 8.6% Historical Growth (2-Fiscal Year Revenue) JinkoSolar Holding Co., Ltd. 48.2% Hanwha Q CELLS Co., Ltd. 28.7% EGing Photovoltaic Technology 26.1% Canadian Solar Inc. -1.8% First Solar, Inc. -6.7% JA Solar 11.6% Size (Enterprise Value as of 11/15/17, millions) First Solar, Inc. $4,042.5 Canadian Solar Inc. $2,904.7 JinkoSolar Holding Co., Ltd. $2,478.2 Hanwha Q CELLS Co., Ltd. $1,324.6 EGing Photovoltaic Technology $754.5 Size (LTM Revenue, millions) JinkoSolar Holding Co., Ltd. $3,647.4 First Solar, Inc. $2,979.7 Canadian Solar Inc. $2,950.1 Hanwha Q CELLS Co., Ltd. $2,282.7 EGing Photovoltaic Technology $654.0 JA Solar $2,651.9

Illustrative Selected Companies Information Selected Companies Benchmarking (cont.) Note: No company used in this analysis for comparative purposes is identical to the Company 1. Capital lease obligations not disclosed on Form 6-K as of 9/30/2017 and therefore excluded from the above calculation NA refers to not available figure; GW refers to Giga Watt; MW refers to Mega Watt; Days of A/R refers to Days of Accounts Receivable; Days of A/P refers to Days of Accounts Payable; $/W refers to dollar per watt Source: SEC filings, Capital IQ, Company management 28 CONFIDENTIAL – PRELIMINARY – SUBJECT TO FURTHER REVIEW Internal Investment (3-Year Average CAPEX to Revenue) JinkoSolar Holding Co., Ltd. 21.7% Canadian Solar Inc. 19.6% EGing Photovoltaic Technology 9.6% Hanwha Q CELLS Co., Ltd. 7.4% First Solar, Inc. 6.6% JA Solar 12.9% Internal Investment (LTM CAPEX to LTM Revenue) Canadian Solar Inc. 37.7% First Solar, Inc. 12.4% JinkoSolar Holding Co., Ltd. 11.3% EGing Photovoltaic Technology 9.5% Hanwha Q CELLS Co., Ltd. 7.7% JA Solar 13.2% Relative Depreciation (LTM D&A to LTM Adjusted EBITDA) EGing Photovoltaic Technology 84.9% JinkoSolar Holding Co., Ltd. 49.1% Canadian Solar Inc. 44.9% Hanwha Q CELLS Co., Ltd. 41.6% First Solar, Inc. 26.1% JA Solar 55.3% Profitability (2016 FY Average Selling Price-Cells, $/W) JinkoSolar Holding Co., Ltd. 0.17 Hanwha Q CELLS Co., Ltd. NA Canadian Solar Inc. NA EGing Photovoltaic Technology NA First Solar, Inc. NA JA Solar 0.26 Profitability (2016 FY Average Selling Price-Modules, $/W) Hanwha Q CELLS Co., Ltd. 0.53 Canadian Solar Inc. 0.51 JinkoSolar Holding Co., Ltd. 0.50 First Solar, Inc. 0.48 EGing Photovoltaic Technology 0.46 JA Solar 0.46 Liquidity (2016 FY Cash Coversion Cycle) First Solar, Inc. 101.3 JinkoSolar Holding Co., Ltd. 89.3 Hanwha Q CELLS Co., Ltd. 65.5 EGing Photovoltaic Technology 0.4 Canadian Solar Inc. (21.2) JA Solar 64.7 Liquidity (2016 FY Days of Inventory) JinkoSolar Holding Co., Ltd. 79.9 First Solar, Inc. 77.5 Hanwha Q CELLS Co., Ltd. 68.5 EGing Photovoltaic Technology 47.7 Canadian Solar Inc. 47.6 JA Solar 56.9 Liquidity (2016 FY Days of A/P) EGing Photovoltaic Technology 143.9 Canadian Solar Inc. 130.1 Hanwha Q CELLS Co., Ltd. 87.1 JinkoSolar Holding Co., Ltd. 84.1 First Solar, Inc. 39.9 JA Solar 56.9 Liquidity (2016 FY Days of A/R) EGing Photovoltaic Technology 96.6 JinkoSolar Holding Co., Ltd. 93.5 Hanwha Q CELLS Co., Ltd. 84.2 First Solar, Inc. 63.8 Canadian Solar Inc. 61.3 JA Solar 64.7 Capacity Utilization (2016 FY Modules Shipped / Manufacturing Capacity) First Solar, Inc. 172.2% Hanwha Q CELLS Co., Ltd. 110.4% JinkoSolar Holding Co., Ltd. 95.8% EGing Photovoltaic Technology 91.6% Canadian Solar Inc. 84.3% JA Solar 83.8% Capacity Utilization (2016 FY Cells Capacity / Module Capacity) Hanwha Q CELLS Co., Ltd. 100.0% EGing Photovoltaic Technology 75.0% JinkoSolar Holding Co., Ltd. 61.5% Canadian Solar Inc. 39.5% First Solar, Inc. NMF JA Solar 100.0% Size (2016 FY Modules Shipped, MW) JinkoSolar Holding Co., Ltd. 6,225 Canadian Solar Inc. 5,200 Hanwha Q CELLS Co., Ltd. 4,583 First Solar, Inc. 3,100 EGing Photovoltaic Technology 1,527 JA Solar 4,607 Size (2016 FY Manufacturing Capacity-Modules, GW) JinkoSolar Holding Co., Ltd. 6.5 Canadian Solar Inc. 6.2 Hanwha Q CELLS Co., Ltd. 4.2 First Solar, Inc. 1.8 EGing Photovoltaic Technology 1.6 JA Solar 5.5 Size (2016 FY Manufacturing Capacity-Cells, GW) Hanwha Q CELLS Co., Ltd. 4.2 JinkoSolar Holding Co., Ltd. 4.0 Canadian Solar Inc. 2.4 EGing Photovoltaic Technology 1.2 First Solar, Inc. 0.0 JA Solar 5.5 Leverage (Debt to EBITDA as of 11/15/17) Canadian Solar Inc. 9.8 x JinkoSolar Holding Co., Ltd. 8.6 x Hanwha Q CELLS Co., Ltd. 5.7 x First Solar, Inc. 0.7 x EGing Photovoltaic Technology 0.6 x JA Solar [1] 3.5 x

Appendices Illustrative Selected Transactions Information

Illustrative Selected Transactions Information Selected Transactions (USD in millions) 10/16/2017 Gintech Energy Corporation Neo Solar Power Corporation 100.0% $377.3 $329.7 NMF 12.7x 12.9x -19.8% Tianjin Zhonghuan Semiconductor Co., Ltd. 05/03/2016 GD Solar Co., Ltd. 90.0% $105.2 $105.2 NA NA NA NA Investment & Management Co., Ltd. 11/24/2014 REC Solar ASA Bluestar Elkem Investment Co. Ltd. 100.0% $637.0 $563.8 7.9x 7.7x 6.2x 11.5% LDK Solar High-Tech (Hefei) Co., Ltd. 09/13/2013 Tongwei Group Co., Ltd. 100.0% $141.1 $141.1 NA NA NA NA Selected Transactions Observations The target companies in the Selected Transactions generally had more operations outside of China than JA Solar With the exception of Trina Solar Limited, the target companies in the Selected Transactions generally had less manufacturing production capacity than JA Solar Certain target companies in the Selected Transactions were private companies prior to the transactions and therefore had relatively limited public or reliable information on which to rely Certain target companies in the Selected Transactions exhibited negative EBITDA at the time of the respective transaction and therefore do not yield a meaningful comparison to JA Solar Note: No company shown for illustrative purposes is identical to the Company, and no transaction shown for illustrative purposes is identical to the Transaction 1. Implied EV refers to implied enterprise value of target company, based on the announced transaction equity price and other public information available at the time of the announcement 2. Based on reported metric for the most recent LTM period prior to the announcement of the transaction Enterprise Value equals equity market value + debt outstanding + preferred stock + minority interests – cash and cash equivalents; Adjusted EBITDA refers to Earnings Before Interest, Taxes, Depreciation & Amortization, adjusted for certain non-recurring items; LTM refers to the most recently completed 12-month period for which financial information has been made public; NFY refers to next fiscal year; NFY+1 refers to the year following NFY; NA refers to not available figure; NMF refers to not meaningful figure Source: SEC filings, Capital IQ CONFIDENTIAL – PRELIMINARY – SUBJECT TO FURTHER REVIEW 30 Mean 7.6x 9.1x 8.3x -6.1% Median 7.6x 7.7x 6.2x -5.6% 11/19/2012 DelSolar Co., Ltd. Neo Solar Power Corporation 85.0% $105.7 $207.7 NMF NA NA -27.3% 06/17/2014 Silevo, Inc. SolarCity Corporation 100.0% $115.8 $200.0 NMF NA NA NMF 12/14/2015 Trina Solar Limited Shanghai Xingsheng Equity 94.2% $992.8 $2,216.6 7.3x 7.0x 6.0x 10.9% 10/16/2017 Solartech Energy Corp. Neo Solar Power Corporation 100.0% $226.5 $321.9 NMF NMF NMF -5.6% Announced Date Target Company Acquiror % Sought Implied Equity Value Implied EV [1] Implied EV / LTM EBITDA [2] Implied EV / NFY EBITDA Implied EV / NFY+1 EBITDA EBITDA Margin %

Appendices Disclaimer

Disclaimer This presentation, and any supplemental information (written or oral) or other documents provided in connection therewith (collectively, the “materials”), are provided solely for the information of the Special Committee (the “Committee”) of the Board of Directors (the “Board”) of JA Solar Holdings Co., Ltd. (the “Company”) by Houlihan Lokey in connection with the Committee’s consideration of a potential transaction (the “Transaction”) involving the Company. This presentation is incomplete without reference to, and should be considered in conjunction with, any supplemental information provided by and discussions with Houlihan Lokey in connection therewith. Any defined terms used herein shall have the meanings set forth herein, even if such defined terms have been given different meanings elsewhere in the materials. The materials are for discussion purposes only. Houlihan Lokey expressly disclaims any and all liability which may be based on the materials and any errors therein or omissions therefrom. The materials were prepared for specific persons familiar with the business and affairs of the Company for use in a specific context and were not prepared with a view to public disclosure or to conform with any disclosure standards under any state, federal or international securities laws or other laws, rules or regulations, and none of the Committee, the Company or Houlihan Lokey takes any responsibility for the use of the materials by persons other than the Committee. The materials are provided on a confidential basis solely for the information of the Committee and may not be disclosed, summarized, reproduced, disseminated or quoted or otherwise referred to, in whole or in part, without Houlihan Lokey’s express prior written consent. Notwithstanding any other provision herein, the Company (and each employee, representative or other agent of the Company) may disclose to any and all persons without limitation of any kind, the tax treatment and tax structure of any transaction and all materials of any kind (including opinions or other tax analyses, if any) that are provided to the Company relating to such tax treatment and structure. However, any information relating to the tax treatment and tax structure shall remain confidential (and the foregoing sentence shall not apply) to the extent necessary to enable any person to comply with securities laws. For this purpose, the tax treatment of a transaction is the purported or claimed U.S. income or franchise tax treatment of the transaction and the tax structure of a transaction is any fact that may be relevant to understanding the purported or claimed U.S. income or franchise tax treatment of the transaction. If the Company plans to disclose information pursuant to the first sentence of this paragraph, the Company shall inform those to whom it discloses any such information that they may not rely upon such information for any purpose without Houlihan Lokey’s prior written consent. Houlihan Lokey is not an expert on, and nothing contained in the materials should be construed as advice with regard to, legal, accounting, regulatory, insurance, tax or other specialist matters. Houlihan Lokey’s role in reviewing any information was limited solely to performing such a review as it deemed necessary to support its own advice and analysis and was not on behalf of the Committee. The materials necessarily are based on financial, economic, market and other conditions as in effect on, and the information available to Houlihan Lokey as of, the date of the materials. Although subsequent developments may affect the contents of the materials, Houlihan Lokey has not undertaken, and is under no obligation, to update, revise or reaffirm the materials. The materials are not intended to provide the sole basis for evaluation of the Transaction and do not purport to contain all information that may be required. The materials do not address the underlying business decision of the Company or any other party to proceed with or effect the Transaction. The materials do not constitute any opinion, nor do the materials constitute a recommendation to the Board, the Committee, the Company, any security holder of the Company or any other party as to how to vote or act with respect to any matter relating to the Transaction or otherwise or whether to buy or sell any assets or securities of any company. Houlihan Lokey’s only opinion is the opinion, if any, that is actually delivered to the Committee. The materials may not reflect information known to other professionals in other business areas of Houlihan Lokey and its affiliates. The preparation of the materials was a complex process involving quantitative and qualitative judgments and determinations with respect to the financial, comparative and other analytic methods employed and the adaption and application of these methods to the unique facts and circumstances presented and, therefore, is not readily susceptible to partial analysis or summary description. Furthermore, Houlihan Lokey did not attribute any particular weight to any analysis or factor considered by it, but rather made qualitative judgments as to the significance and relevance of each analysis and factor. Each analytical technique has inherent strengths and weaknesses, and the nature of the available information may further affect the value of particular techniques. Accordingly, the analyses contained in the materials must be considered as a whole. Selecting portions of the analyses, analytic methods and factors without considering all analyses and factors could create a misleading or incomplete view. The materials reflect judgments and assumptions with regard to industry performance, general business, economic, regulatory, market and financial conditions and other matters, many of which are beyond the control of the participants in the Transaction. Any estimates of value contained in the materials are not necessarily indicative of actual value or predictive of future results or values, which may be significantly more or less favorable. Any analyses relating to the value of assets, businesses or securities do not purport to be appraisals or to reflect the prices at which any assets, businesses or securities may actually be sold. The materials do not constitute a valuation opinion or credit rating. The materials do not address the consideration to be paid or received in, the terms of any arrangements, understandings, agreements or documents related to, or the form, structure or any other portion or aspect of, the Transaction or otherwise. Furthermore, the materials do not address the fairness of any portion or aspect of the Transaction to any party. In preparing the materials, Houlihan Lokey has not conducted any physical inspection or independent appraisal or evaluation of any of the assets, properties or liabilities (contingent or otherwise) of the Company or any other party and has no obligation to evaluate the solvency of the Company or any other party under any law. 32 CONFIDENTIAL – PRELIMINARY – SUBJECT TO FURTHER REVIEW
Disclaimer (cont.) All budgets, projections, estimates, financial analyses, reports and other information with respect to operations (including estimates of potential cost savings and expenses) reflected in the materials have been prepared by management of the relevant party or are derived from such budgets, projections, estimates, financial analyses, reports and other information or from other sources, which involve numerous and significant subjective determinations made by management of the relevant party and/or which such management has reviewed and found reasonable. The budgets, projections and estimates (including, without limitation, estimates of potential cost savings and synergies) contained in the materials may or may not be achieved and differences between projected results and those actually achieved may be material. Houlihan Lokey has relied upon representations made by management of the Company and other participants in the Transaction that such budgets, projections and estimates have been reasonably prepared in good faith on bases reflecting the best currently available estimates and judgments of such management (or, with respect to information obtained from public sources, represent reasonable estimates), and Houlihan Lokey expresses no opinion with respect to such budgets, projections or estimates or the assumptions on which they are based. The scope of the financial analysis contained herein is based on discussions with the Company (including, without limitation, regarding the methodologies to be utilized), and Houlihan Lokey does not make any representation, express or implied, as to the sufficiency or adequacy of such financial analysis or the scope thereof for any particular purpose. Houlihan Lokey has assumed and relied upon the accuracy and completeness of the financial and other information provided to, discussed with or reviewed by it without (and without assuming responsibility for) independent verification of such information, makes no representation or warranty (express or implied) in respect of the accuracy or completeness of such information and has further relied upon the assurances of the Company and other participants in the Transaction that they are not aware of any facts or circumstances that would make such information inaccurate or misleading. In addition, Houlihan Lokey has relied upon and assumed, without independent verification, that there has been no change in the business, assets, liabilities, financial condition, results of operations, cash flows or prospects of the Company or any other participant in the Transaction since the respective dates of the most recent financial statements and other information, financial or otherwise, provided to, discussed with or reviewed by Houlihan Lokey that would be material to its analyses, and that the final forms of any draft documents reviewed by Houlihan Lokey will not differ in any material respect from such draft documents. The materials are not an offer to sell or a solicitation of an indication of interest to purchase any security, option, commodity, future, loan or currency. The materials do not constitute a commitment by Houlihan Lokey or any of its affiliates to underwrite, subscribe for or place any securities, to extend or arrange credit, or to provide any other services. In the ordinary course of business, certain of Houlihan Lokey’s affiliates and employees, as well as investment funds in which they may have financial interests or with which they may co-invest, may acquire, hold or sell, long or short positions, or trade or otherwise effect transactions, in debt, equity, and other securities and financial instruments (including loans and other obligations) of, or investments in, the Company, any Transaction counterparty, any other Transaction participant, any other financially interested party with respect to any transaction, other entities or parties that are mentioned in the materials, or any of the foregoing entities’ or parties’ respective affiliates, subsidiaries, investment funds, portfolio companies and representatives (collectively, the “Interested Parties”), or any currency or commodity that may be involved in the Transaction. Houlihan Lokey provides mergers and acquisitions, restructuring and other advisory and consulting services to clients, which may have in the past included, or may currently or in the future include, one or more Interested Parties, for which services Houlihan Lokey has received, and may receive, compensation. Although Houlihan Lokey in the course of such activities and relationships or otherwise may have acquired, or may in the future acquire, information about one or more Interested Parties or the Transaction, or that otherwise may be of interest to the Company, Houlihan Lokey shall have no obligation to, and may not be contractually permitted to, disclose such information, or the fact that Houlihan Lokey is in possession of such information, to the Company or to use such information on the Company’s behalf. Houlihan Lokey’s personnel may make statements or provide advice that is contrary to information contained in the materials. 33 CONFIDENTIAL – PRELIMINARY – SUBJECT TO FURTHER REVIEW
CORPORATE FINANCE FINANCIAL ADVISORY SERVICES FINANCIAL RESTRUCTURING STRATEGIC CONSULTING HL.com 34 CONFIDENTIAL – PRELIMINARY – SUBJECT TO FURTHER REVIEW
