F I N A N C I A L S T A T E M E N T S Solasglas Investments, LP For the years ended December 31, 2022, 2021 and 2020 With Report of Independent Auditors
Solasglas Investments, LP Financial Statements As of December 31, 2022 and 2021 and for the years ended December 31, 2022, 2021 and 2020 Contents Report of Independent Auditors………………………….…………………………………. 1 Statements of Assets, Liabilities and Partners’ Capital…………………….…………...…... 2 Condensed Schedules of Investments……………………………………….………………. 3 Statements of Operations……………………………………………………………………. 13 Statements of Changes in Partners’ Capital…………………………………………………. 14 Statements of Cash Flows…………………………………………………...………………. 15 Notes to Financial Statements………………………………………………...………...…... 16
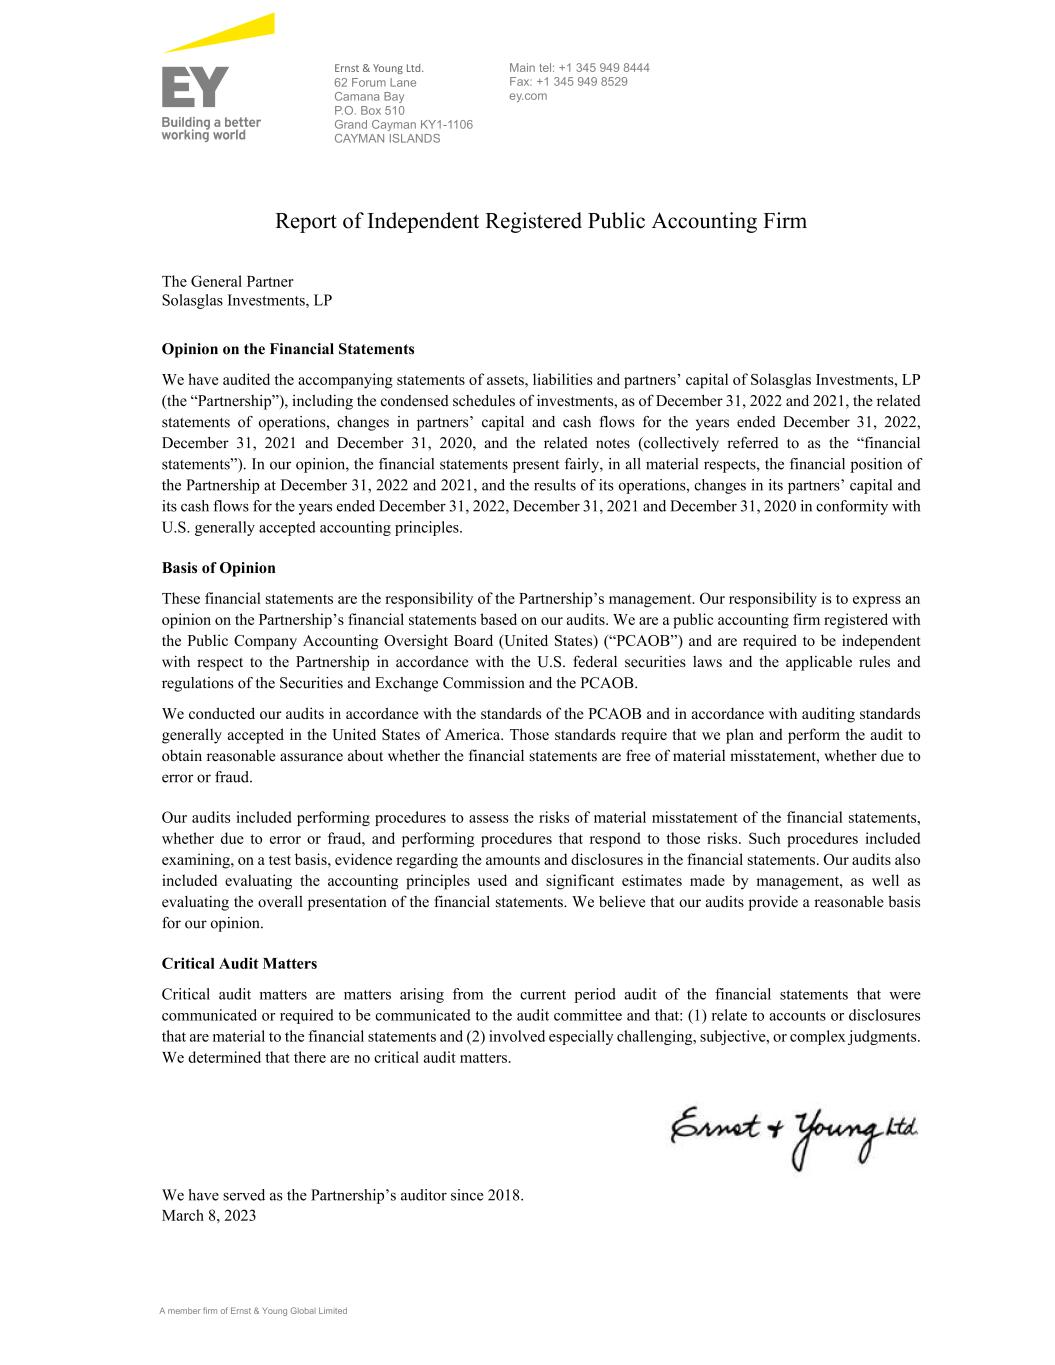
A member firm of Ernst & Young Global Limited Ernst & Young Ltd. 62 Forum Lane Camana Bay P.O. Box 510 Grand Cayman KY1-1106 CAYMAN ISLANDS Main tel: +1 345 949 8444 Fax: +1 345 949 8529 ey.com Report of Independent Registered Public Accounting Firm The General Partner Solasglas Investments, LP Opinion on the Financial Statements We have audited the accompanying statements of assets, liabilities and partners’ capital of Solasglas Investments, LP (the “Partnership”), including the condensed schedules of investments, as of December 31, 2022 and 2021, the related statements of operations, changes in partners’ capital and cash flows for the years ended December 31, 2022, December 31, 2021 and December 31, 2020, and the related notes (collectively referred to as the “financial statements”). In our opinion, the financial statements present fairly, in all material respects, the financial position of the Partnership at December 31, 2022 and 2021, and the results of its operations, changes in its partners’ capital and its cash flows for the years ended December 31, 2022, December 31, 2021 and December 31, 2020 in conformity with U.S. generally accepted accounting principles. Basis of Opinion These financial statements are the responsibility of the Partnership’s management. Our responsibility is to express an opinion on the Partnership’s financial statements based on our audits. We are a public accounting firm registered with the Public Company Accounting Oversight Board (United States) (“PCAOB”) and are required to be independent with respect to the Partnership in accordance with the U.S. federal securities laws and the applicable rules and regulations of the Securities and Exchange Commission and the PCAOB. We conducted our audits in accordance with the standards of the PCAOB and in accordance with auditing standards generally accepted in the United States of America. Those standards require that we plan and perform the audit to obtain reasonable assurance about whether the financial statements are free of material misstatement, whether due to error or fraud. Our audits included performing procedures to assess the risks of material misstatement of the financial statements, whether due to error or fraud, and performing procedures that respond to those risks. Such procedures included examining, on a test basis, evidence regarding the amounts and disclosures in the financial statements. Our audits also included evaluating the accounting principles used and significant estimates made by management, as well as evaluating the overall presentation of the financial statements. We believe that our audits provide a reasonable basis for our opinion. Critical Audit Matters Critical audit matters are matters arising from the current period audit of the financial statements that were communicated or required to be communicated to the audit committee and that: (1) relate to accounts or disclosures that are material to the financial statements and (2) involved especially challenging, subjective, or complex judgments. We determined that there are no critical audit matters. We have served as the Partnership’s auditor since 2018. March 8, 2023
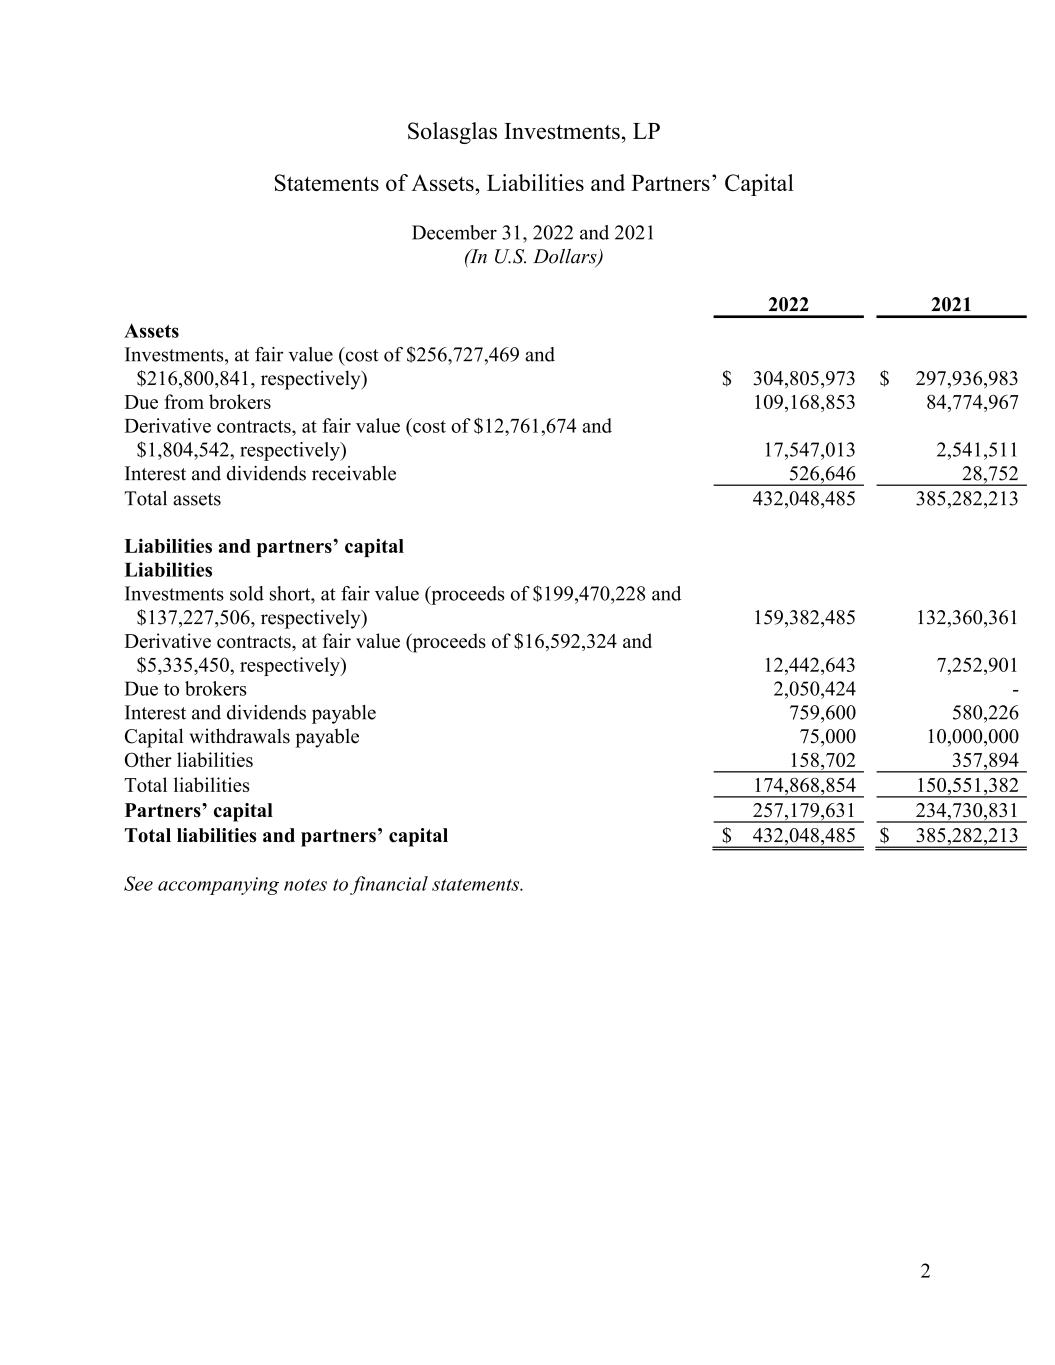
Solasglas Investments, LP Statements of Assets, Liabilities and Partners’ Capital December 31, 2022 and 2021 (In U.S. Dollars) 2 2022 2021 Assets Investments, at fair value (cost of $256,727,469 and $216,800,841, respectively) $ 304,805,973 $ 297,936,983 Due from brokers 109,168,853 84,774,967 Derivative contracts, at fair value (cost of $12,761,674 and $1,804,542, respectively) 17,547,013 2,541,511 Interest and dividends receivable 526,646 28,752 Total assets 432,048,485 385,282,213 Liabilities and partners’ capital Liabilities Investments sold short, at fair value (proceeds of $199,470,228 and $137,227,506, respectively) 159,382,485 132,360,361 Derivative contracts, at fair value (proceeds of $16,592,324 and $5,335,450, respectively) 12,442,643 7,252,901 Due to brokers Interest and dividends payable 2,050,424 759,600 - 580,226 Capital withdrawals payable 75,000 10,000,000 Other liabilities 158,702 357,894 Total liabilities 174,868,854 150,551,382 Partners’ capital 257,179,631 234,730,831 Total liabilities and partners’ capital $ 432,048,485 $ 385,282,213 See accompanying notes to financial statements.
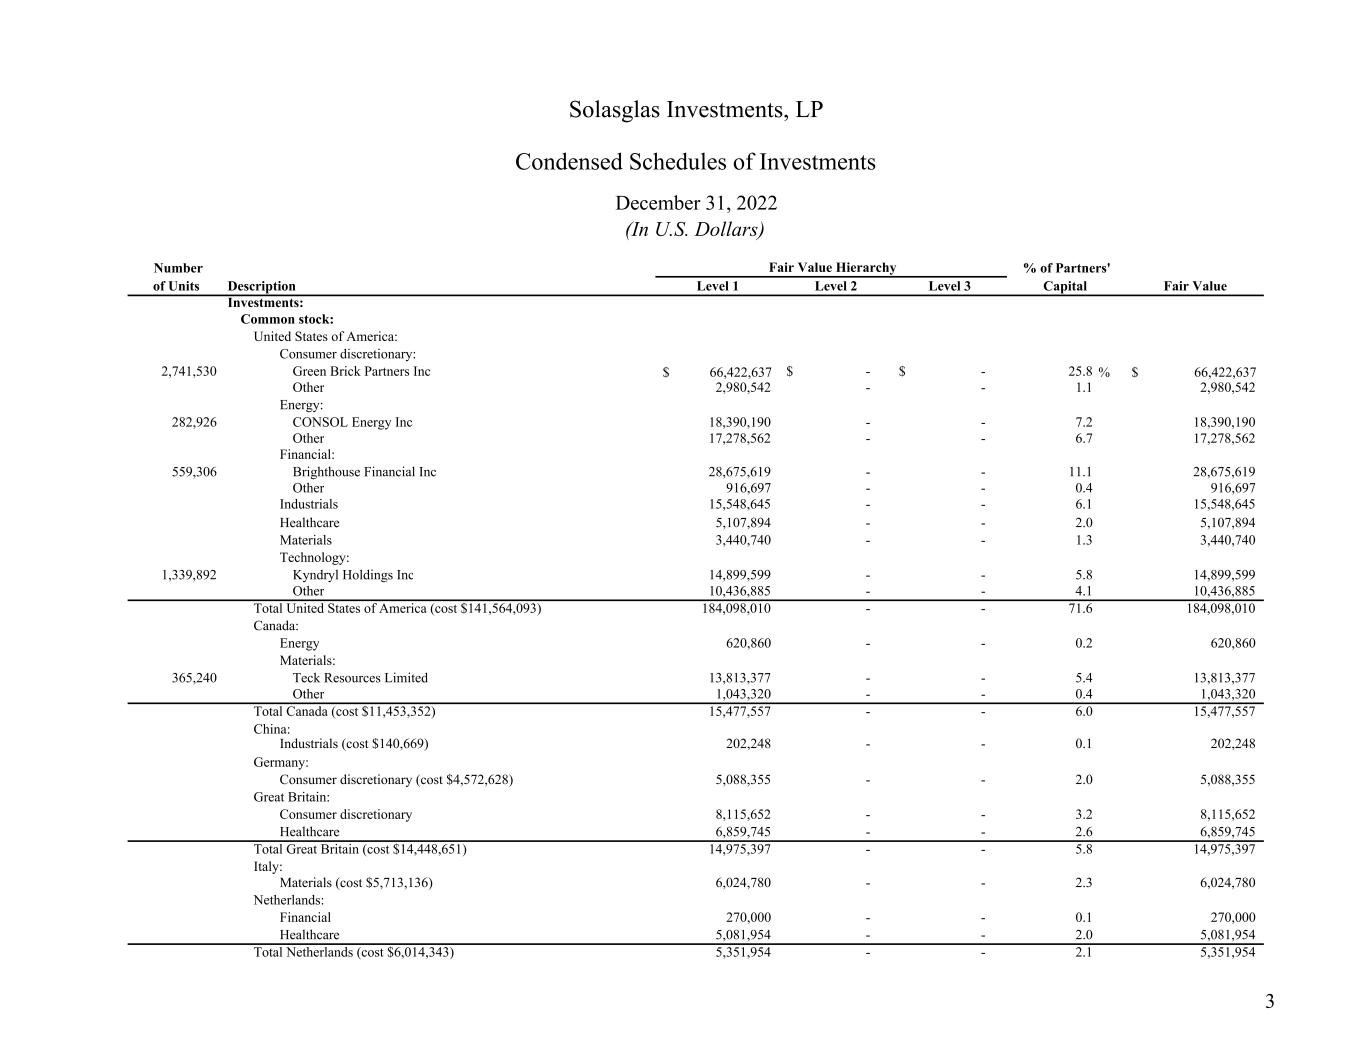
Description Level 1 Level 2 Level 3 Investments: Common stock: United States of America: Consumer discretionary: 2,741,530 Green Brick Partners Inc 66,422,637$ -$ -$ 25.8 % 66,422,637$ Other 2,980,542 - - 1.1 2,980,542 Energy: 282,926 CONSOL Energy Inc 18,390,190 - - 7.2 18,390,190 Other 17,278,562 - - 6.7 17,278,562 Financial: 559,306 Brighthouse Financial Inc 28,675,619 - - 11.1 28,675,619 Other 916,697 - - 0.4 916,697 Industrials 15,548,645 - - 6.1 15,548,645 Healthcare 5,107,894 - - 2.0 5,107,894 Materials 3,440,740 - - 1.3 3,440,740 Technology: 1,339,892 Kyndryl Holdings Inc 14,899,599 - - 5.8 14,899,599 Other 10,436,885 - - 4.1 10,436,885 Total United States of America (cost $141,564,093) 184,098,010 - - 71.6 184,098,010 Canada: Energy 620,860 - - 0.2 620,860 Materials: 365,240 Teck Resources Limited 13,813,377 - - 5.4 13,813,377 Other 1,043,320 - - 0.4 1,043,320 Total Canada (cost $11,453,352) 15,477,557 - - 6.0 15,477,557 China: Industrials (cost $140,669) 202,248 - - 0.1 202,248 Germany: Consumer discretionary (cost $4,572,628) 5,088,355 - - 2.0 5,088,355 Great Britain: Consumer discretionary 8,115,652 - - 3.2 8,115,652 Healthcare 6,859,745 - - 2.6 6,859,745 Total Great Britain (cost $14,448,651) 14,975,397 - - 5.8 14,975,397 Italy: Materials (cost $5,713,136) 6,024,780 - - 2.3 6,024,780 Netherlands: Financial 270,000 - - 0.1 270,000 Healthcare 5,081,954 - - 2.0 5,081,954 Total Netherlands (cost $6,014,343) 5,351,954 - - 2.1 5,351,954 Solasglas Investments, LP Condensed Schedules of Investments Number of Units Fair Value Hierarchy Fair Value December 31, 2022 % of Partners' Capital (In U.S. Dollars) 3
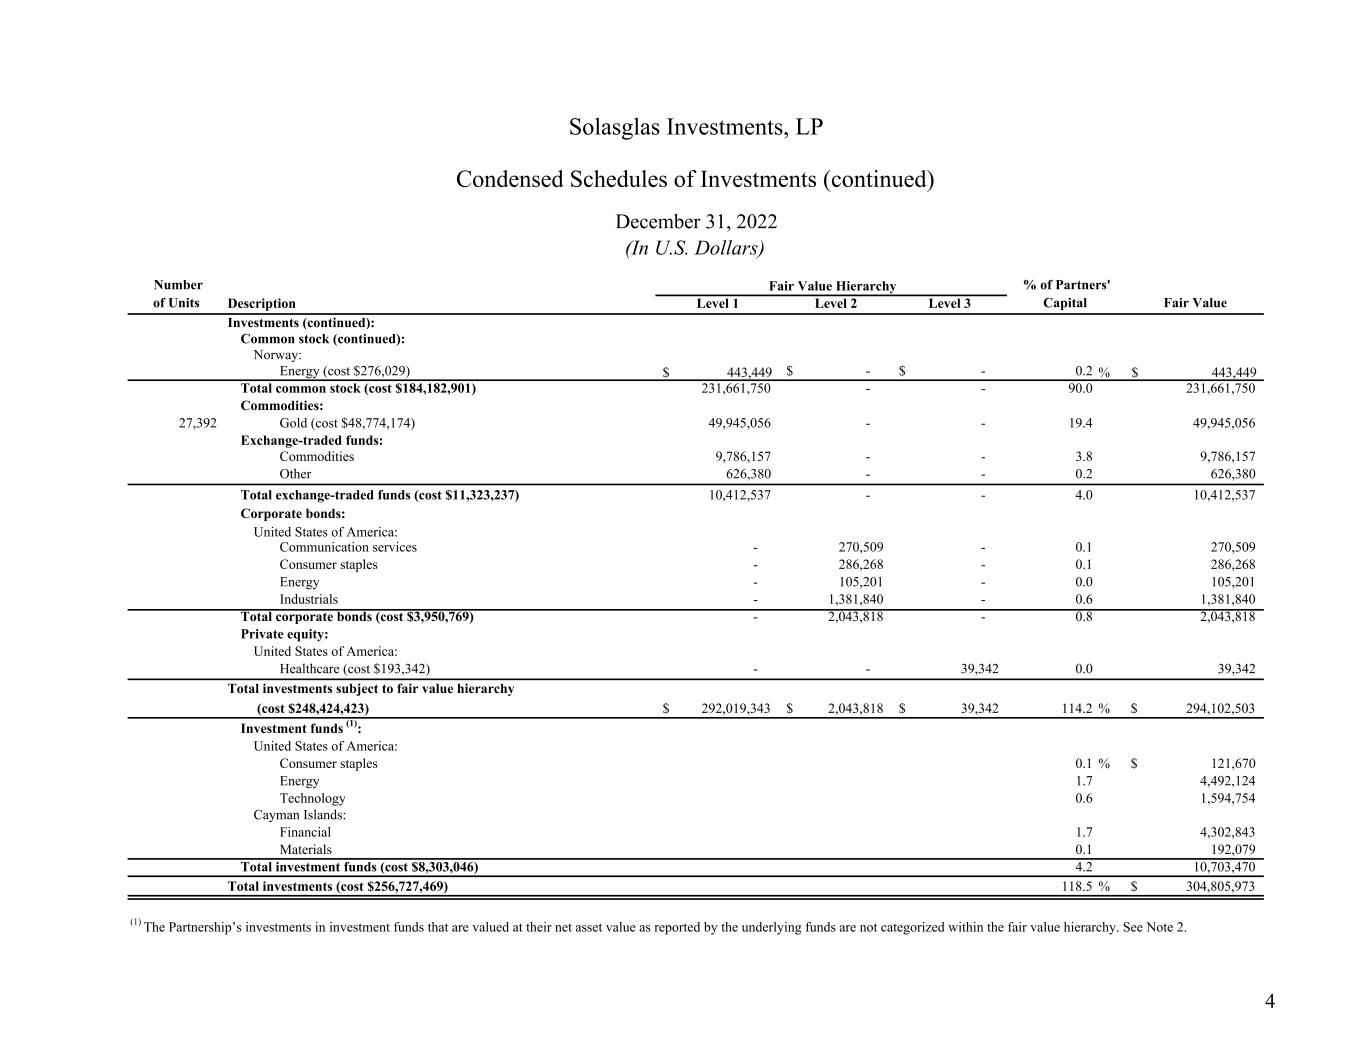
Description Level 1 Level 2 Level 3 Investments (continued): Common stock (continued): Norway: Energy (cost $276,029) 443,449$ -$ -$ 0.2 % 443,449$ Total common stock (cost $184,182,901) 231,661,750 - - 90.0 231,661,750 Commodities: 27,392 Gold (cost $48,774,174) 49,945,056 - - 19.4 49,945,056 Exchange-traded funds: Commodities 9,786,157 - - 3.8 9,786,157 Other 626,380 - - 0.2 626,380 Total exchange-traded funds (cost $11,323,237) 10,412,537 - - 4.0 10,412,537 Corporate bonds: United States of America: Communication services - 270,509 - 0.1 270,509 Consumer staples - 286,268 - 0.1 286,268 Energy - 105,201 - 0.0 105,201 Industrials - 1,381,840 - 0.6 1,381,840 Total corporate bonds (cost $3,950,769) - 2,043,818 - 0.8 2,043,818 Private equity: United States of America: Healthcare (cost $193,342) - - 39,342 0.0 39,342 Total investments subject to fair value hierarchy (cost $248,424,423) 292,019,343$ 2,043,818$ 39,342$ 114.2 % 294,102,503$ Investment funds (1): United States of America: Consumer staples 0.1 % 121,670$ Energy 1.7 4,492,124 Technology 0.6 1,594,754 Cayman Islands: Financial 1.7 4,302,843 Materials 0.1 192,079 Total investment funds (cost $8,303,046) 4.2 10,703,470 Total investments (cost $256,727,469) 118.5 % 304,805,973$ (1) The Partnership’s investments in investment funds that are valued at their net asset value as reported by the underlying funds are not categorized within the fair value hierarchy. See Note 2. Solasglas Investments, LP Condensed Schedules of Investments (continued) Number of Units Fair Value Hierarchy Fair Value December 31, 2022 % of Partners' Capital (In U.S. Dollars) 4
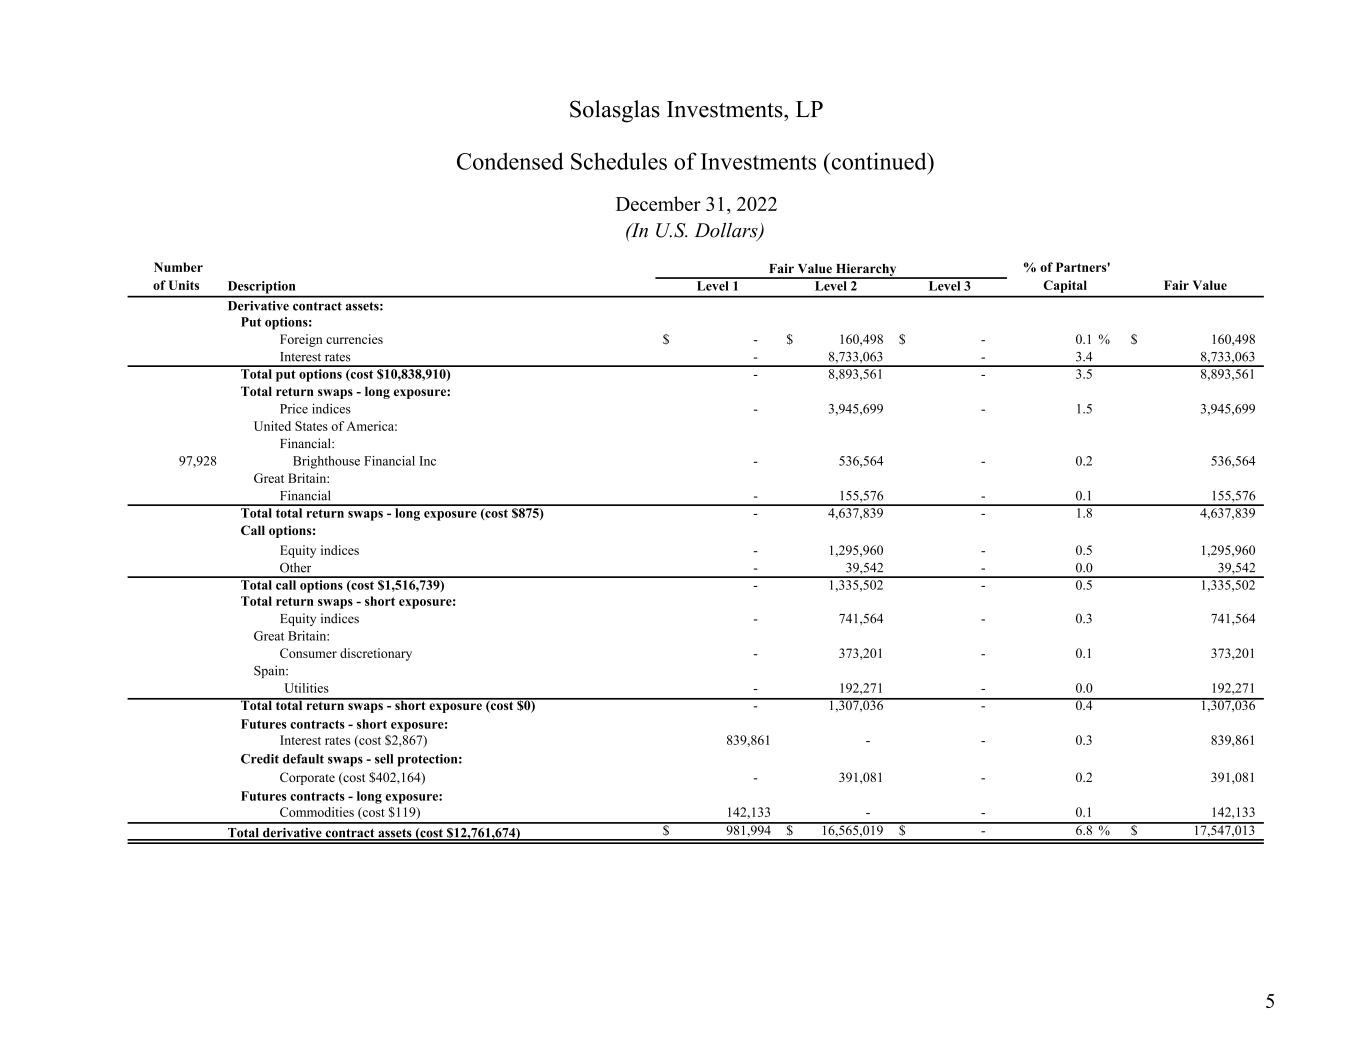
Description Level 1 Level 2 Level 3 Derivative contract assets: Put options: Foreign currencies -$ 160,498$ -$ 0.1 % 160,498$ Interest rates - 8,733,063 - 3.4 8,733,063 Total put options (cost $10,838,910) - 8,893,561 - 3.5 8,893,561 Total return swaps - long exposure: Price indices - 3,945,699 - 1.5 3,945,699 United States of America: Financial: 97,928 Brighthouse Financial Inc - 536,564 - 0.2 536,564 Great Britain: Financial - 155,576 - 0.1 155,576 Total total return swaps - long exposure (cost $875) - 4,637,839 - 1.8 4,637,839 Call options: Equity indices - 1,295,960 - 0.5 1,295,960 Other - 39,542 - 0.0 39,542 Total call options (cost $1,516,739) - 1,335,502 - 0.5 1,335,502 Total return swaps - short exposure: Equity indices - 741,564 - 0.3 741,564 Great Britain: Consumer discretionary - 373,201 - 0.1 373,201 Spain: Utilities - 192,271 - 0.0 192,271 Total total return swaps - short exposure (cost $0) - 1,307,036 - 0.4 1,307,036 Futures contracts - short exposure: Interest rates (cost $2,867) 839,861 - - 0.3 839,861 Credit default swaps - sell protection: Corporate (cost $402,164) - 391,081 - 0.2 391,081 Futures contracts - long exposure: Commodities (cost $119) 142,133 - - 0.1 142,133 Total derivative contract assets (cost $12,761,674) 981,994$ 16,565,019$ -$ 6.8 % 17,547,013$ Solasglas Investments, LP Condensed Schedules of Investments (continued) December 31, 2022 % of Partners' Capital Number of Units Fair Value Hierarchy Fair Value (In U.S. Dollars) 5
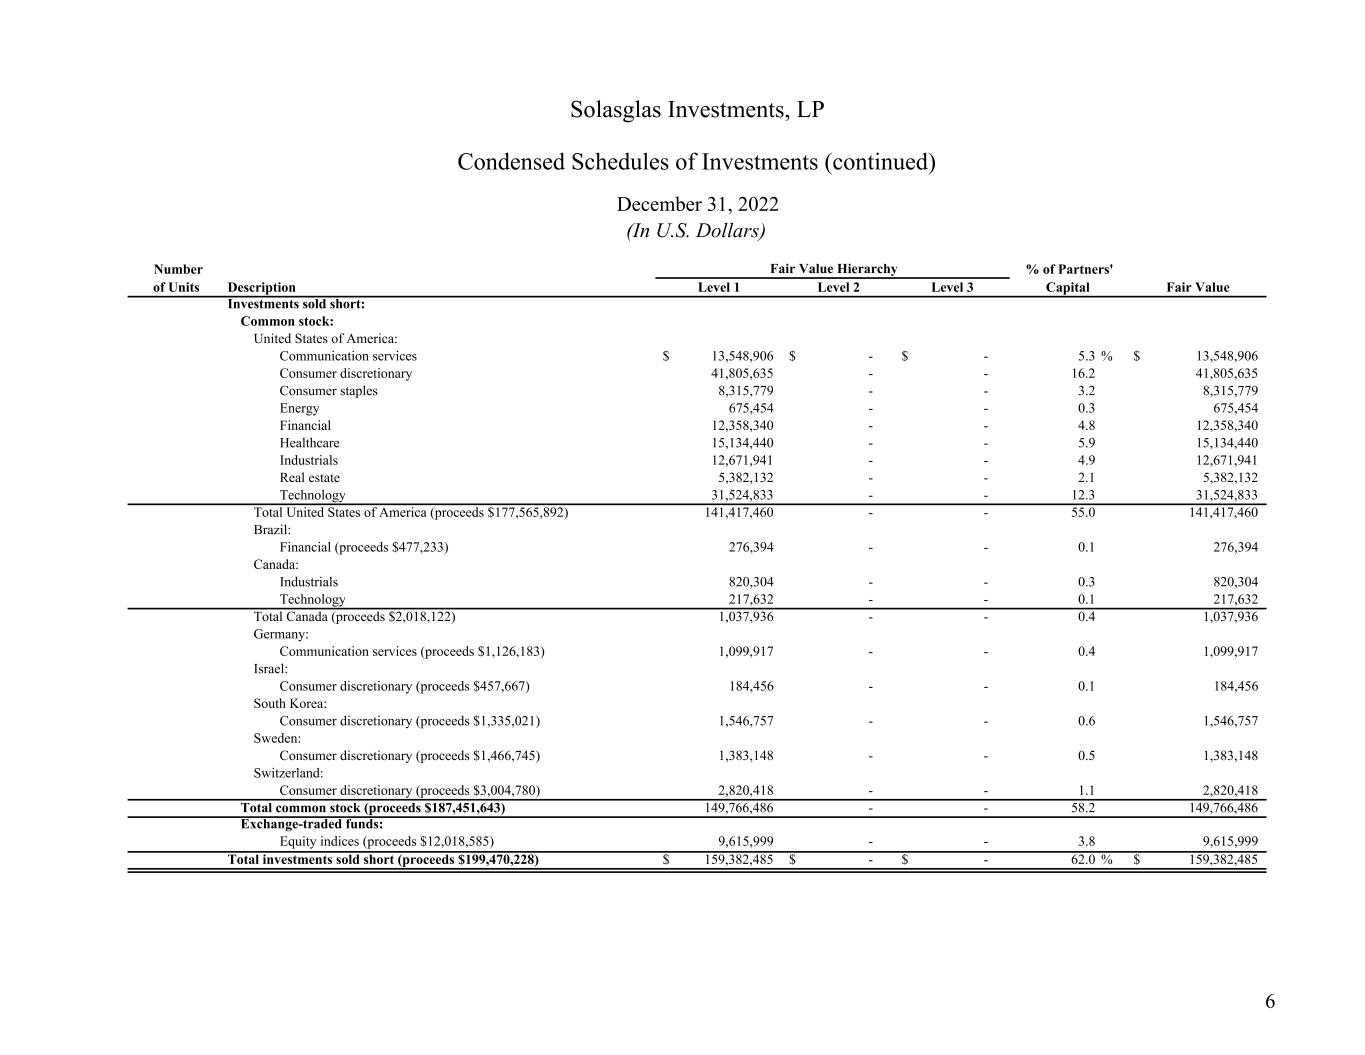
Description Level 1 Level 2 Level 3 Investments sold short: Common stock: United States of America: Communication services 13,548,906$ -$ -$ 5.3 % 13,548,906$ Consumer discretionary 41,805,635 - - 16.2 41,805,635 Consumer staples 8,315,779 - - 3.2 8,315,779 Energy 675,454 - - 0.3 675,454 Financial 12,358,340 - - 4.8 12,358,340 Healthcare 15,134,440 - - 5.9 15,134,440 Industrials 12,671,941 - - 4.9 12,671,941 Real estate 5,382,132 - - 2.1 5,382,132 Technology 31,524,833 - - 12.3 31,524,833 Total United States of America (proceeds $177,565,892) 141,417,460 - - 55.0 141,417,460 Brazil: Financial (proceeds $477,233) 276,394 - - 0.1 276,394 Canada: Industrials 820,304 - - 0.3 820,304 Technology 217,632 - - 0.1 217,632 Total Canada (proceeds $2,018,122) 1,037,936 - - 0.4 1,037,936 Germany: Communication services (proceeds $1,126,183) 1,099,917 - - 0.4 1,099,917 Israel: Consumer discretionary (proceeds $457,667) 184,456 - - 0.1 184,456 South Korea: Consumer discretionary (proceeds $1,335,021) 1,546,757 - - 0.6 1,546,757 Sweden: Consumer discretionary (proceeds $1,466,745) 1,383,148 - - 0.5 1,383,148 Switzerland: Consumer discretionary (proceeds $3,004,780) 2,820,418 - - 1.1 2,820,418 Total common stock (proceeds $187,451,643) 149,766,486 - - 58.2 149,766,486 Exchange-traded funds: Equity indices (proceeds $12,018,585) 9,615,999 - - 3.8 9,615,999 Total investments sold short (proceeds $199,470,228) 159,382,485$ -$ -$ 62.0 % 159,382,485$ (In U.S. Dollars) Solasglas Investments, LP Condensed Schedules of Investments (continued) December 31, 2022 Fair Value Hierarchy Fair Value Number of Units % of Partners' Capital 6
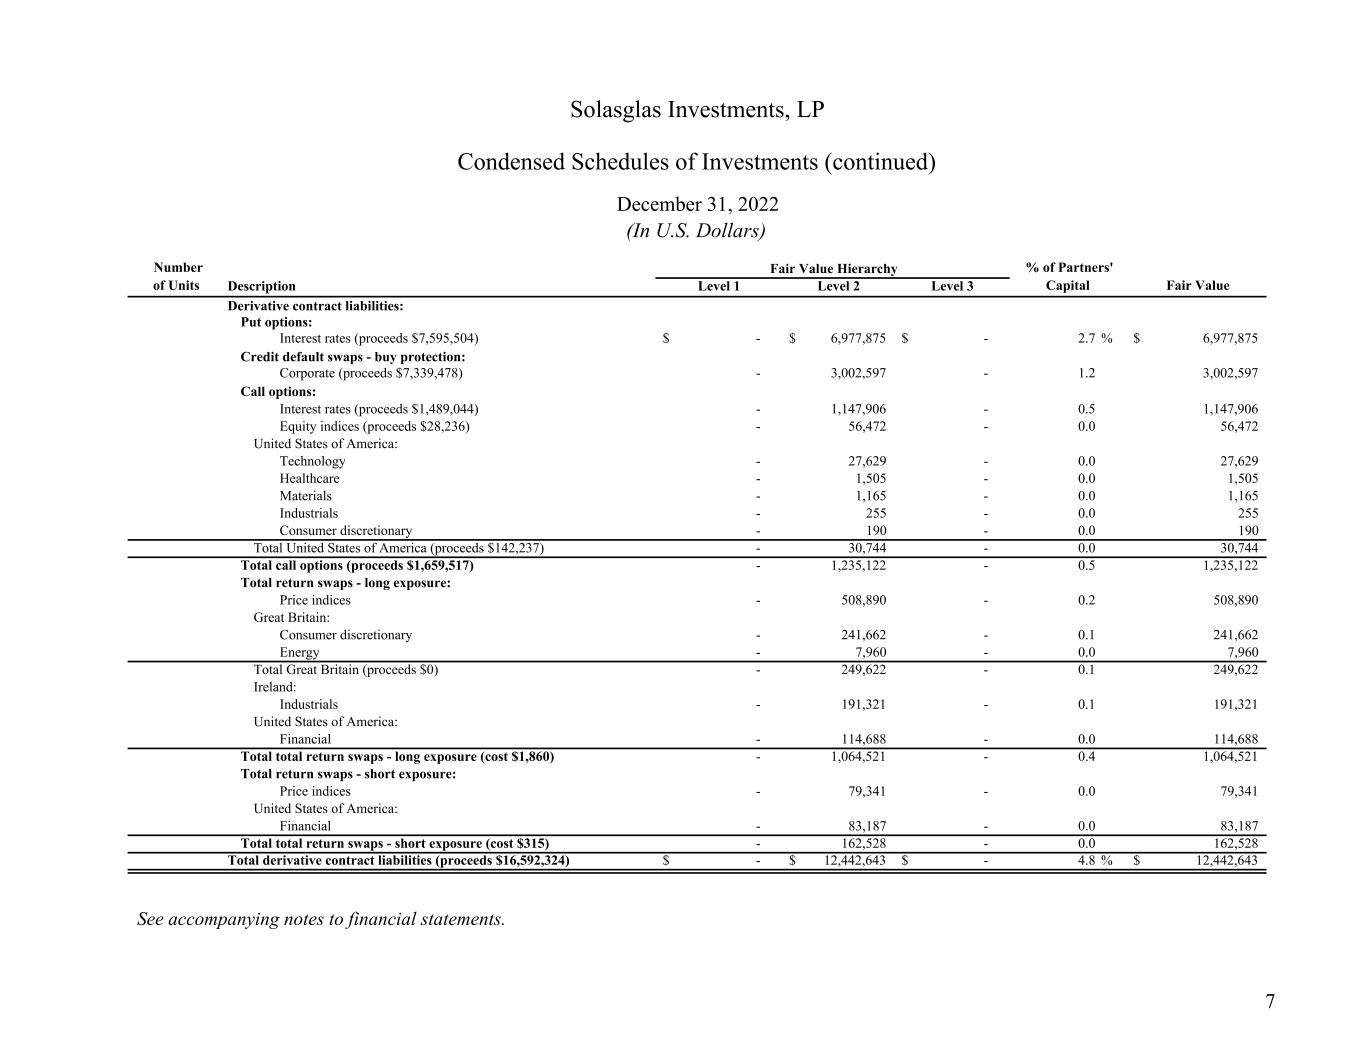
Description Level 1 Level 2 Level 3 Derivative contract liabilities: Put options: Interest rates (proceeds $7,595,504) -$ 6,977,875$ -$ 2.7 % 6,977,875$ Credit default swaps - buy protection: Corporate (proceeds $7,339,478) - 3,002,597 - 1.2 3,002,597 Call options: Interest rates (proceeds $1,489,044) - 1,147,906 - 0.5 1,147,906 Equity indices (proceeds $28,236) - 56,472 - 0.0 56,472 United States of America: Technology - 27,629 - 0.0 27,629 Healthcare - 1,505 - 0.0 1,505 Materials - 1,165 - 0.0 1,165 Industrials - 255 - 0.0 255 Consumer discretionary - 190 - 0.0 190 Total United States of America (proceeds $142,237) - 30,744 - 0.0 30,744 Total call options (proceeds $1,659,517) - 1,235,122 - 0.5 1,235,122 Total return swaps - long exposure: Price indices - 508,890 - 0.2 508,890 Great Britain: Consumer discretionary - 241,662 - 0.1 241,662 Energy - 7,960 - 0.0 7,960 Total Great Britain (proceeds $0) - 249,622 - 0.1 249,622 Ireland: Industrials - 191,321 - 0.1 191,321 United States of America: Financial - 114,688 - 0.0 114,688 Total total return swaps - long exposure (cost $1,860) - 1,064,521 - 0.4 1,064,521 Total return swaps - short exposure: Price indices - 79,341 - 0.0 79,341 United States of America: Financial - 83,187 - 0.0 83,187 Total total return swaps - short exposure (cost $315) - 162,528 - 0.0 162,528 Total derivative contract liabilities (proceeds $16,592,324) -$ 12,442,643$ -$ 4.8 % 12,442,643$ See accompanying notes to financial statements. Fair Value Hierarchy Fair Value (In U.S. Dollars) Solasglas Investments, LP Condensed Schedules of Investments (continued) December 31, 2022 % of Partners' Capital Number of Units 7
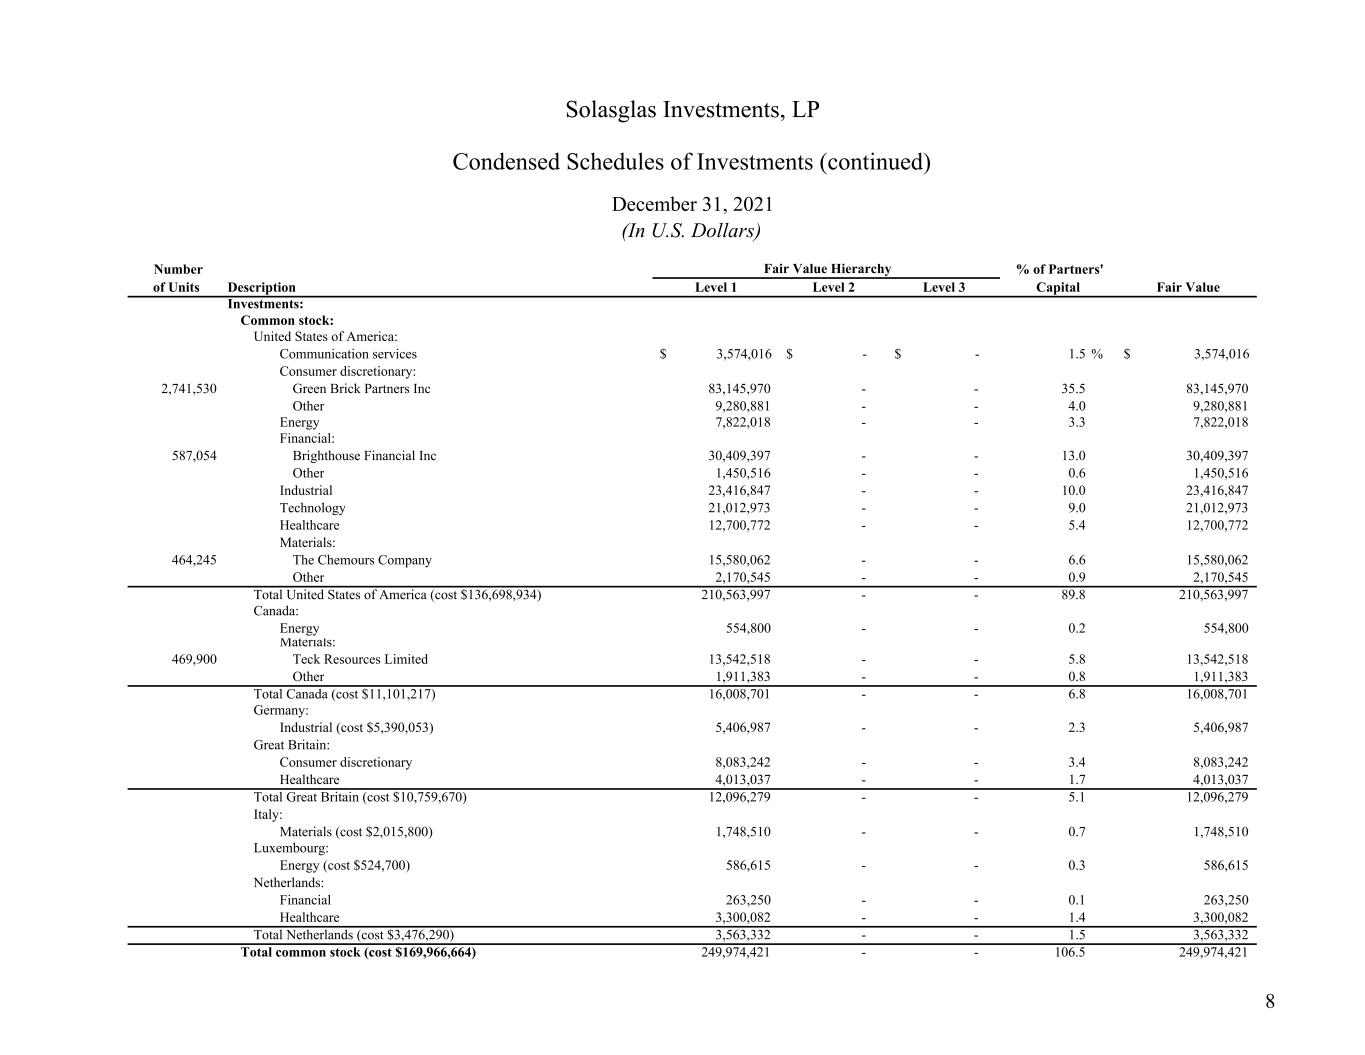
Description Level 1 Level 2 Level 3 Investments: Common stock: United States of America: Communication services 3,574,016$ -$ -$ 1.5 % 3,574,016$ Consumer discretionary: 2,741,530 Green Brick Partners Inc 83,145,970 - - 35.5 83,145,970 Other 9,280,881 - - 4.0 9,280,881 Energy 7,822,018 - - 3.3 7,822,018 Financial: 587,054 Brighthouse Financial Inc 30,409,397 - - 13.0 30,409,397 Other 1,450,516 - - 0.6 1,450,516 Industrial 23,416,847 - - 10.0 23,416,847 Technology 21,012,973 - - 9.0 21,012,973 Healthcare 12,700,772 - - 5.4 12,700,772 Materials: 464,245 The Chemours Company 15,580,062 - - 6.6 15,580,062 Other 2,170,545 - - 0.9 2,170,545 Total United States of America (cost $136,698,934) 210,563,997 - - 89.8 210,563,997 Canada: Energy 554,800 - - 0.2 554,800 Materials: 469,900 Teck Resources Limited 13,542,518 - - 5.8 13,542,518 Other 1,911,383 - - 0.8 1,911,383 Total Canada (cost $11,101,217) 16,008,701 - - 6.8 16,008,701 Germany: Industrial (cost $5,390,053) 5,406,987 - - 2.3 5,406,987 Great Britain: Consumer discretionary 8,083,242 - - 3.4 8,083,242 Healthcare 4,013,037 - - 1.7 4,013,037 Total Great Britain (cost $10,759,670) 12,096,279 - - 5.1 12,096,279 Italy: Materials (cost $2,015,800) 1,748,510 - - 0.7 1,748,510 Luxembourg: Energy (cost $524,700) 586,615 - - 0.3 586,615 Netherlands: Financial 263,250 - - 0.1 263,250 Healthcare 3,300,082 - - 1.4 3,300,082 Total Netherlands (cost $3,476,290) 3,563,332 - - 1.5 3,563,332 Total common stock (cost $169,966,664) 249,974,421 - - 106.5 249,974,421 Solasglas Investments, LP Condensed Schedules of Investments (continued) Number of Units Fair Value Hierarchy Fair Value December 31, 2021 % of Partners' Capital (In U.S. Dollars) 8
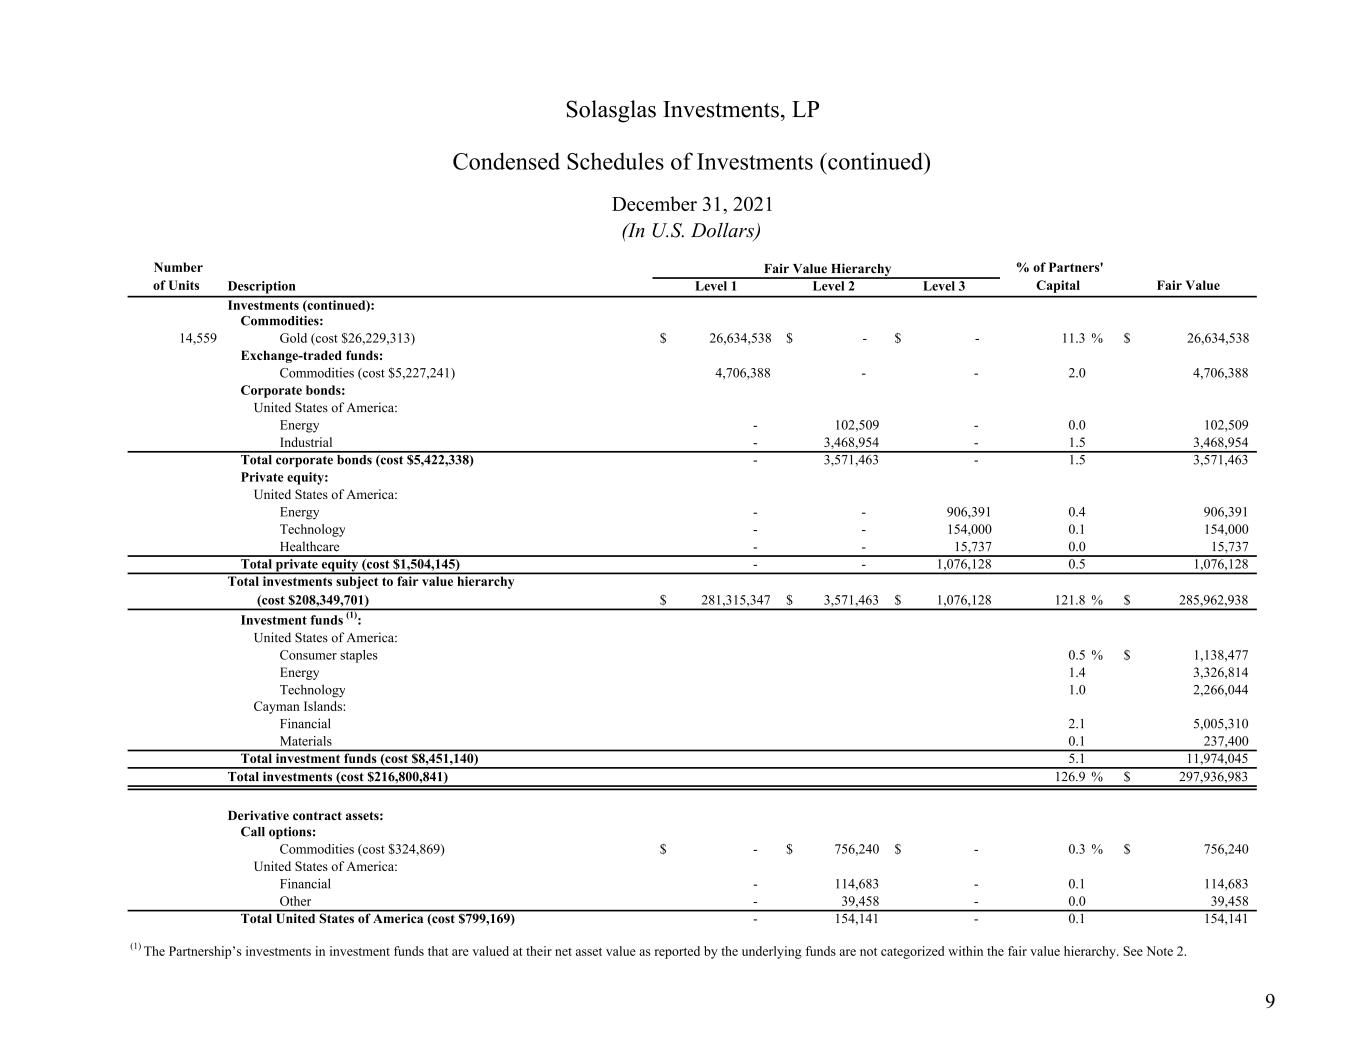
Description Level 1 Level 2 Level 3 Investments (continued): Commodities: 14,559 Gold (cost $26,229,313) 26,634,538$ -$ -$ 11.3 % 26,634,538$ Exchange-traded funds: Commodities (cost $5,227,241) 4,706,388 - - 2.0 4,706,388 Corporate bonds: United States of America: Energy - 102,509 - 0.0 102,509 Industrial - 3,468,954 - 1.5 3,468,954 Total corporate bonds (cost $5,422,338) - 3,571,463 - 1.5 3,571,463 Private equity: United States of America: Energy - - 906,391 0.4 906,391 Technology - - 154,000 0.1 154,000 Healthcare - - 15,737 0.0 15,737 Total private equity (cost $1,504,145) - - 1,076,128 0.5 1,076,128 Total investments subject to fair value hierarchy (cost $208,349,701) 281,315,347$ 3,571,463$ 1,076,128$ 121.8 % 285,962,938$ Investment funds (1): United States of America: Consumer staples 0.5 % 1,138,477$ Energy 1.4 3,326,814 Technology 1.0 2,266,044 Cayman Islands: Financial 2.1 5,005,310 Materials 0.1 237,400 Total investment funds (cost $8,451,140) 5.1 11,974,045 Total investments (cost $216,800,841) 126.9 % 297,936,983$ Derivative contract assets: Call options: Commodities (cost $324,869) -$ 756,240$ -$ 0.3 % 756,240$ United States of America: Financial - 114,683 - 0.1 114,683 Other - 39,458 - 0.0 39,458 Total United States of America (cost $799,169) - 154,141 - 0.1 154,141 (1) The Partnership’s investments in investment funds that are valued at their net asset value as reported by the underlying funds are not categorized within the fair value hierarchy. See Note 2. Solasglas Investments, LP Condensed Schedules of Investments (continued) Number of Units Fair Value Hierarchy Fair Value December 31, 2021 % of Partners' Capital (In U.S. Dollars) 9
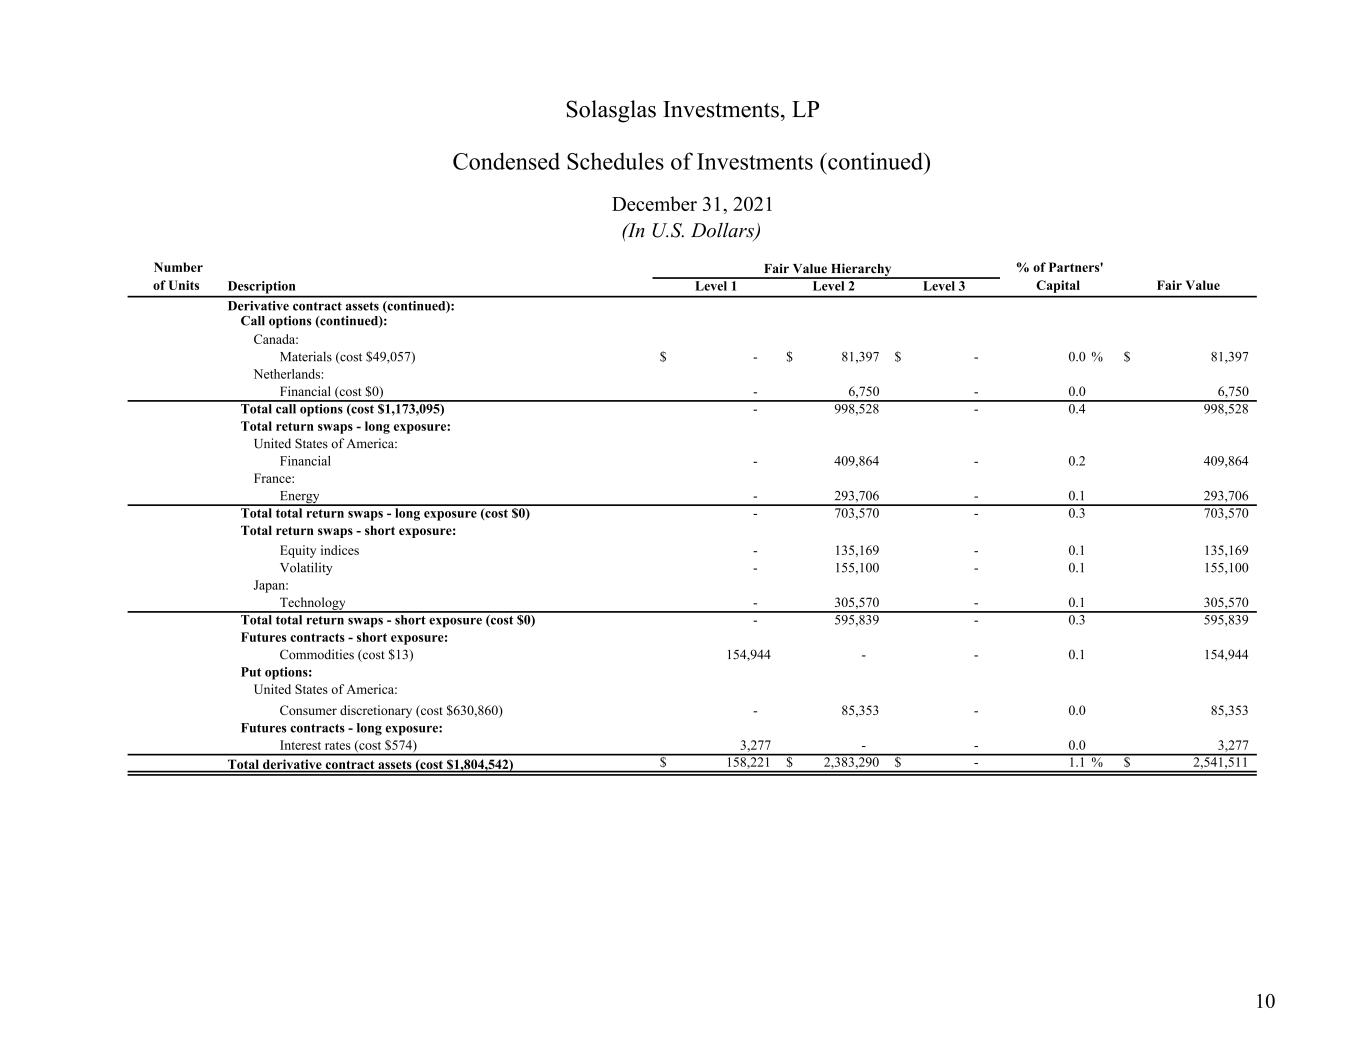
Description Level 1 Level 2 Level 3 Derivative contract assets (continued): Call options (continued): Canada: Materials (cost $49,057) -$ 81,397$ -$ 0.0 % 81,397$ Netherlands: Financial (cost $0) - 6,750 - 0.0 6,750 Total call options (cost $1,173,095) - 998,528 - 0.4 998,528 Total return swaps - long exposure: United States of America: Financial - 409,864 - 0.2 409,864 France: Energy - 293,706 - 0.1 293,706 Total total return swaps - long exposure (cost $0) - 703,570 - 0.3 703,570 Total return swaps - short exposure: Equity indices - 135,169 - 0.1 135,169 Volatility - 155,100 - 0.1 155,100 Japan: Technology - 305,570 - 0.1 305,570 Total total return swaps - short exposure (cost $0) - 595,839 - 0.3 595,839 Futures contracts - short exposure: Commodities (cost $13) 154,944 - - 0.1 154,944 Put options: United States of America: Consumer discretionary (cost $630,860) - 85,353 - 0.0 85,353 Futures contracts - long exposure: Interest rates (cost $574) 3,277 - - 0.0 3,277 Total derivative contract assets (cost $1,804,542) 158,221$ 2,383,290$ -$ 1.1 % 2,541,511$ Solasglas Investments, LP Condensed Schedules of Investments (continued) December 31, 2021 % of Partners' Capital Number of Units Fair Value Hierarchy Fair Value (In U.S. Dollars) 10
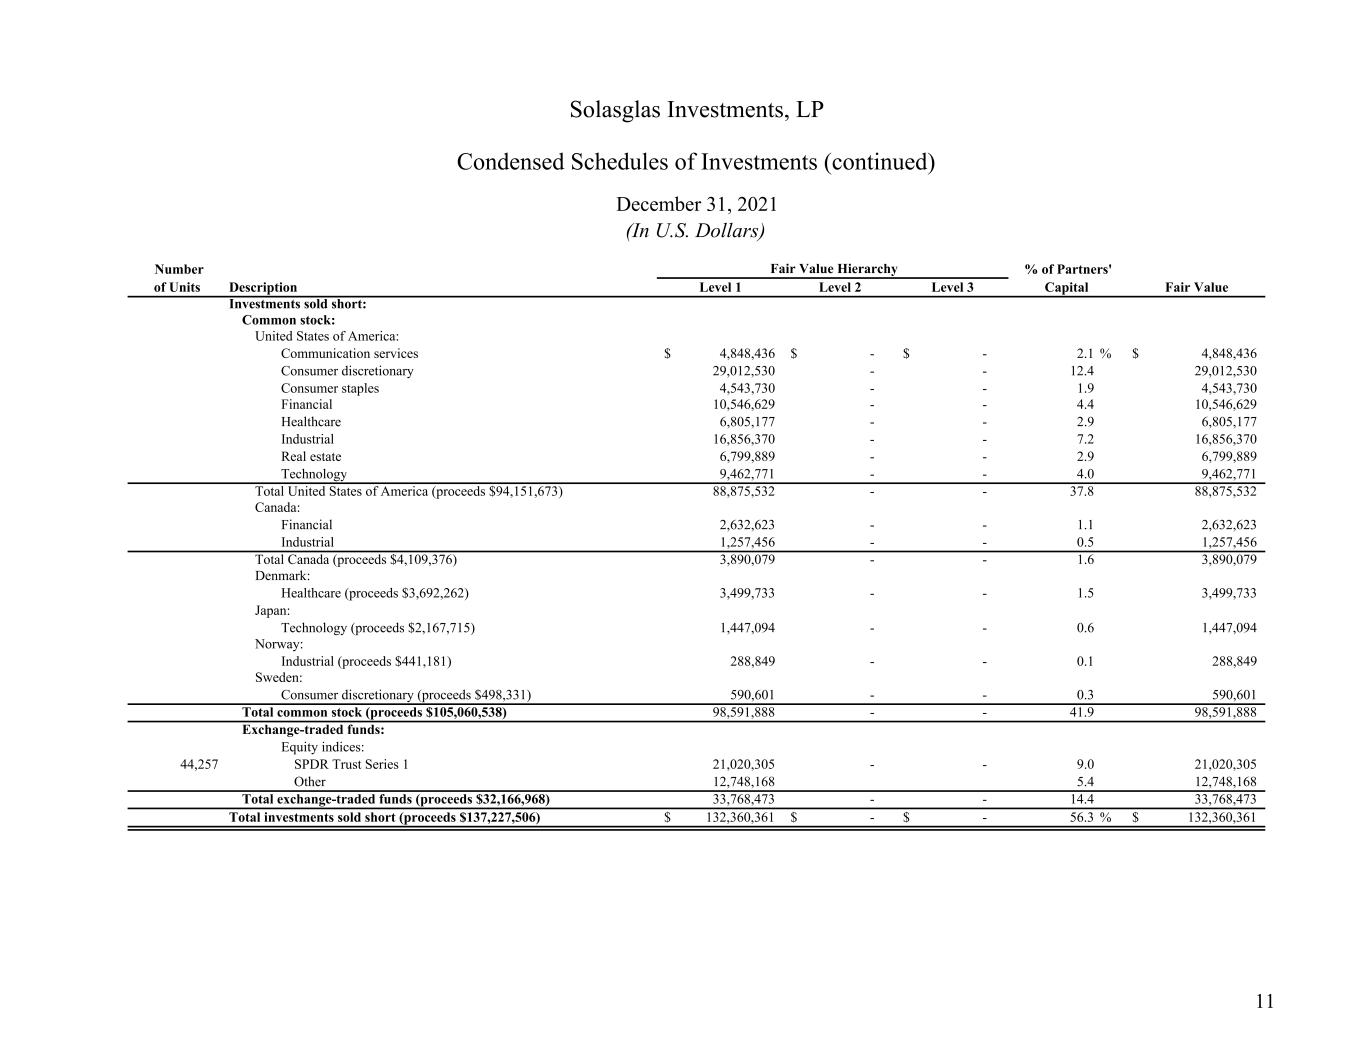
Description Level 1 Level 2 Level 3 Investments sold short: Common stock: United States of America: Communication services 4,848,436$ -$ -$ 2.1 % 4,848,436$ Consumer discretionary 29,012,530 - - 12.4 29,012,530 Consumer staples 4,543,730 - - 1.9 4,543,730 Financial 10,546,629 - - 4.4 10,546,629 Healthcare 6,805,177 - - 2.9 6,805,177 Industrial 16,856,370 - - 7.2 16,856,370 Real estate 6,799,889 - - 2.9 6,799,889 Technology 9,462,771 - - 4.0 9,462,771 Total United States of America (proceeds $94,151,673) 88,875,532 - - 37.8 88,875,532 Canada: Financial 2,632,623 - - 1.1 2,632,623 Industrial 1,257,456 - - 0.5 1,257,456 Total Canada (proceeds $4,109,376) 3,890,079 - - 1.6 3,890,079 Denmark: Healthcare (proceeds $3,692,262) 3,499,733 - - 1.5 3,499,733 Japan: Technology (proceeds $2,167,715) 1,447,094 - - 0.6 1,447,094 Norway: Industrial (proceeds $441,181) 288,849 - - 0.1 288,849 Sweden: Consumer discretionary (proceeds $498,331) 590,601 - - 0.3 590,601 Total common stock (proceeds $105,060,538) 98,591,888 - - 41.9 98,591,888 Exchange-traded funds: Equity indices: 44,257 SPDR Trust Series 1 21,020,305 - - 9.0 21,020,305 Other 12,748,168 5.4 12,748,168 Total exchange-traded funds (proceeds $32,166,968) 33,768,473 - - 14.4 33,768,473 Total investments sold short (proceeds $137,227,506) 132,360,361$ -$ -$ 56.3 % 132,360,361$ (In U.S. Dollars) Solasglas Investments, LP Condensed Schedules of Investments (continued) December 31, 2021 Fair Value Hierarchy Fair Value Number of Units % of Partners' Capital 11
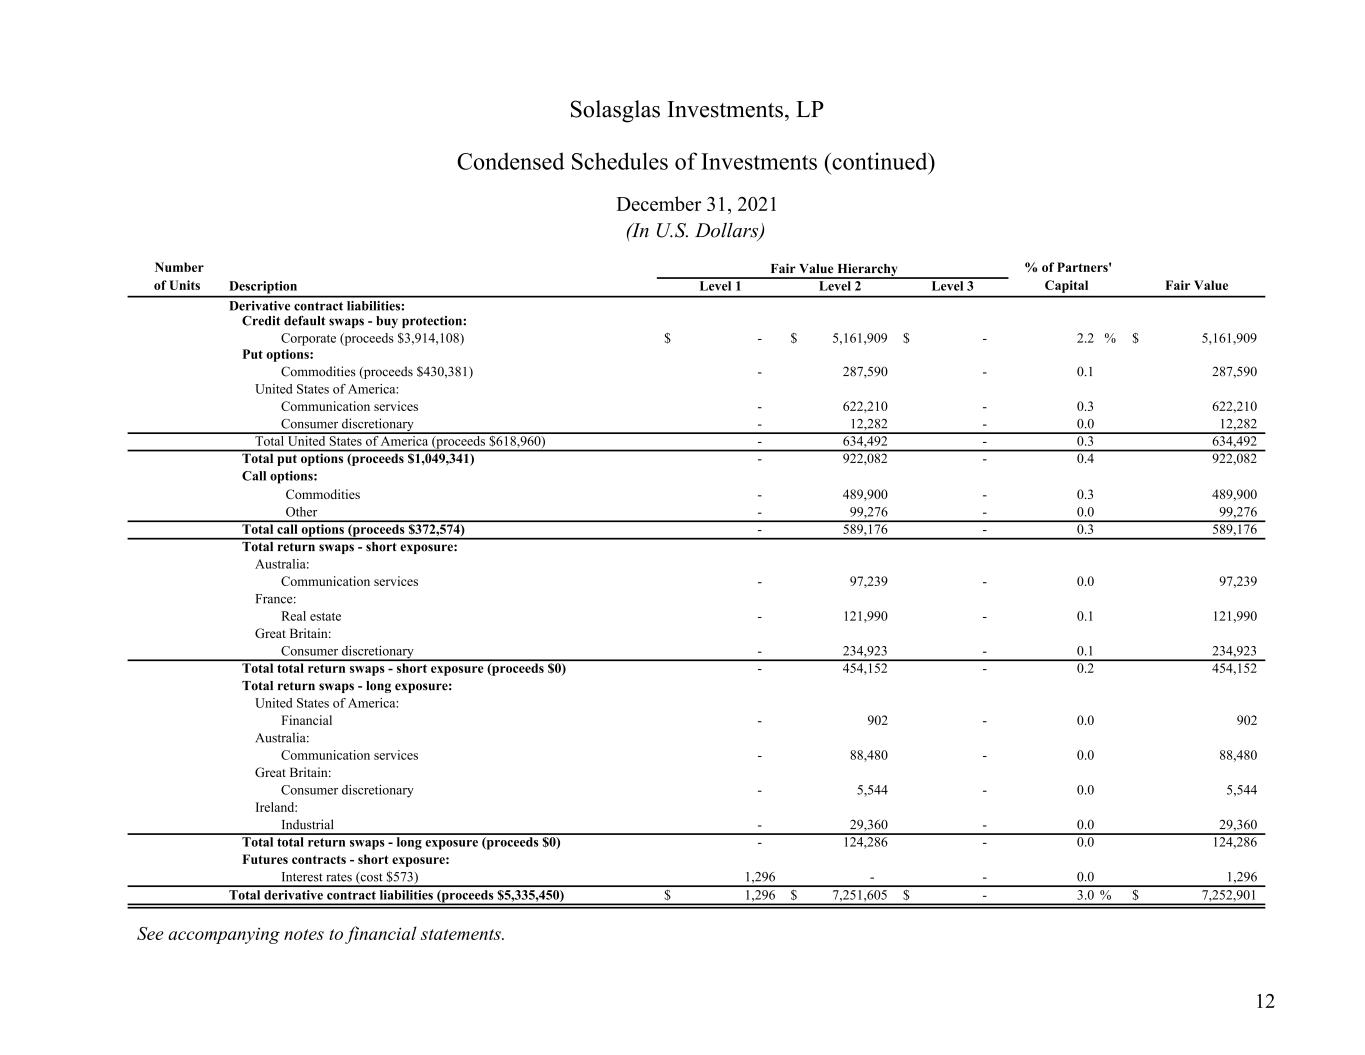
Description Level 1 Level 2 Level 3 Derivative contract liabilities: Credit default swaps - buy protection: Corporate (proceeds $3,914,108) -$ 5,161,909$ -$ 2.2 % 5,161,909$ Put options: Commodities (proceeds $430,381) - 287,590 - 0.1 287,590 United States of America: Communication services - 622,210 - 0.3 622,210 Consumer discretionary - 12,282 - 0.0 12,282 Total United States of America (proceeds $618,960) - 634,492 - 0.3 634,492 Total put options (proceeds $1,049,341) - 922,082 - 0.4 922,082 Call options: Commodities - 489,900 - 0.3 489,900 Other - 99,276 - 0.0 99,276 Total call options (proceeds $372,574) - 589,176 - 0.3 589,176 Total return swaps - short exposure: Australia: Communication services - 97,239 - 0.0 97,239 France: Real estate - 121,990 - 0.1 121,990 Great Britain: Consumer discretionary - 234,923 - 0.1 234,923 Total total return swaps - short exposure (proceeds $0) - 454,152 - 0.2 454,152 Total return swaps - long exposure: United States of America: Financial - 902 - 0.0 902 Australia: Communication services - 88,480 - 0.0 88,480 Great Britain: Consumer discretionary - 5,544 - 0.0 5,544 Ireland: Industrial - 29,360 - 0.0 29,360 Total total return swaps - long exposure (proceeds $0) - 124,286 - 0.0 124,286 Futures contracts - short exposure: Interest rates (cost $573) 1,296 - - 0.0 1,296 Total derivative contract liabilities (proceeds $5,335,450) 1,296$ 7,251,605$ -$ 3.0 % 7,252,901$ See accompanying notes to financial statements. Fair Value Hierarchy Fair Value (In U.S. Dollars) Solasglas Investments, LP Condensed Schedules of Investments (continued) December 31, 2021 % of Partners' Capital Number of Units 12
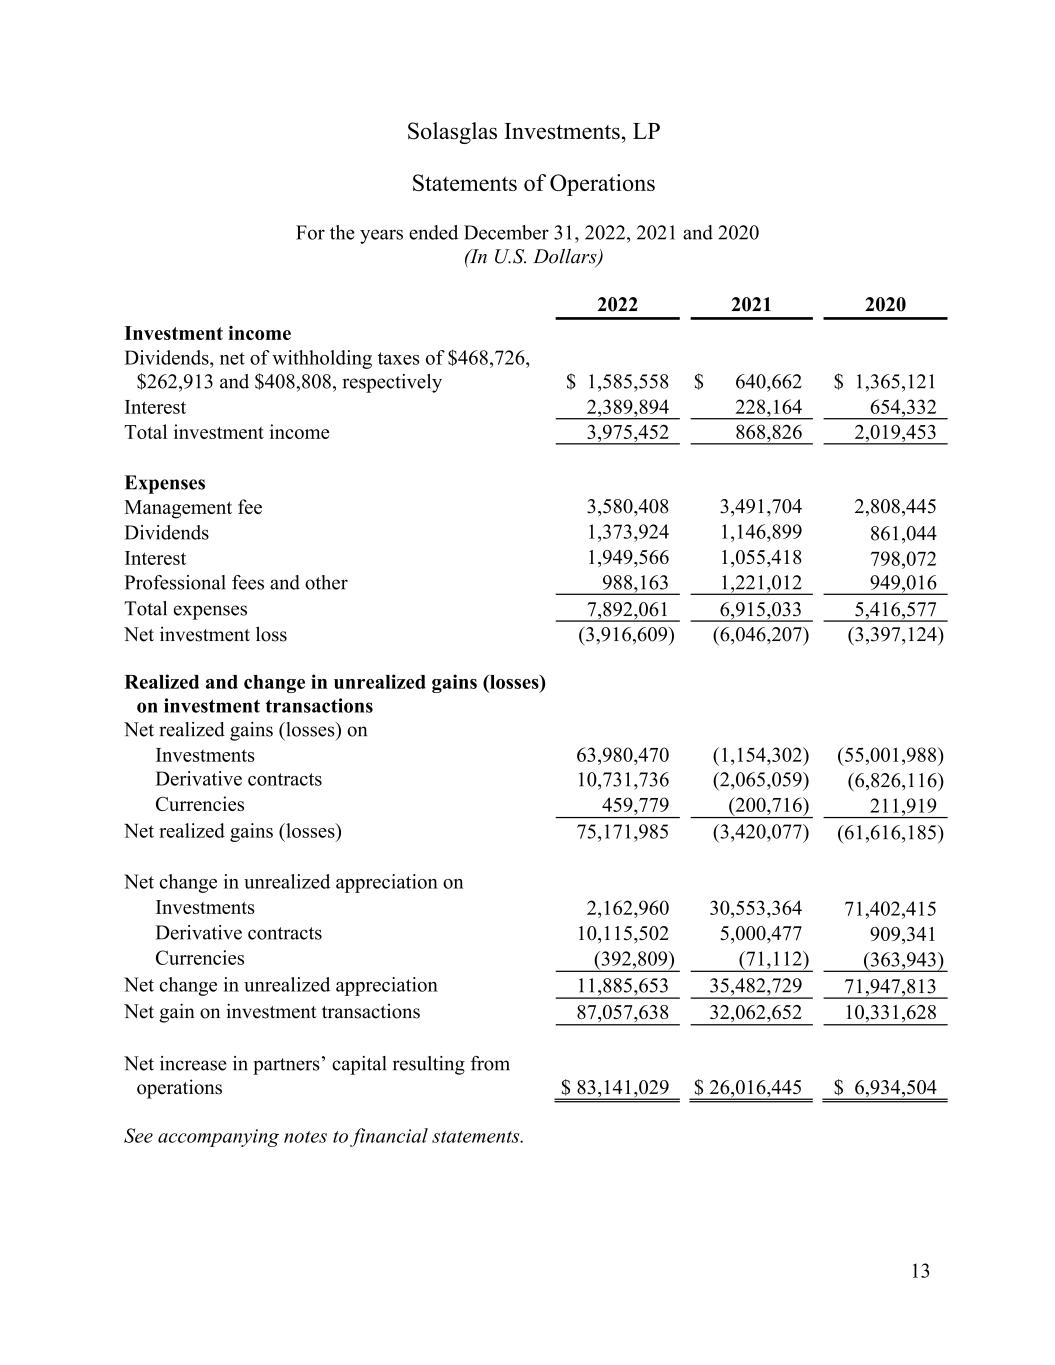
Solasglas Investments, LP Statements of Operations For the years ended December 31, 2022, 2021 and 2020 (In U.S. Dollars) 13 2022 2021 2020 Investment income Dividends, net of withholding taxes of $468,726, $262,913 and $408,808, respectively $ 1,585,558 $ 640,662 $ 1,365,121 Interest 2,389,894 228,164 654,332 Total investment income 3,975,452 868,826 2,019,453 Expenses Management fee 3,580,408 3,491,704 2,808,445 Dividends 1,373,924 1,146,899 861,044 Interest 1,949,566 1,055,418 798,072 Professional fees and other 988,163 1,221,012 949,016 Total expenses 7,892,061 6,915,033 5,416,577 Net investment loss (3,916,609) (6,046,207) (3,397,124) Realized and change in unrealized gains (losses) on investment transactions Net realized gains (losses) on Investments 63,980,470 (1,154,302) (55,001,988) Derivative contracts 10,731,736 (2,065,059) (6,826,116) Currencies 459,779 (200,716) 211,919 Net realized gains (losses) 75,171,985 (3,420,077) (61,616,185) Net change in unrealized appreciation on Investments 2,162,960 30,553,364 71,402,415 Derivative contracts 10,115,502 5,000,477 909,341 Currencies (392,809) (71,112) (363,943) Net change in unrealized appreciation 11,885,653 35,482,729 71,947,813 Net gain on investment transactions 87,057,638 32,062,652 10,331,628 Net increase in partners’ capital resulting from operations $ 83,141,029 $ 26,016,445 $ 6,934,504 See accompanying notes to financial statements.
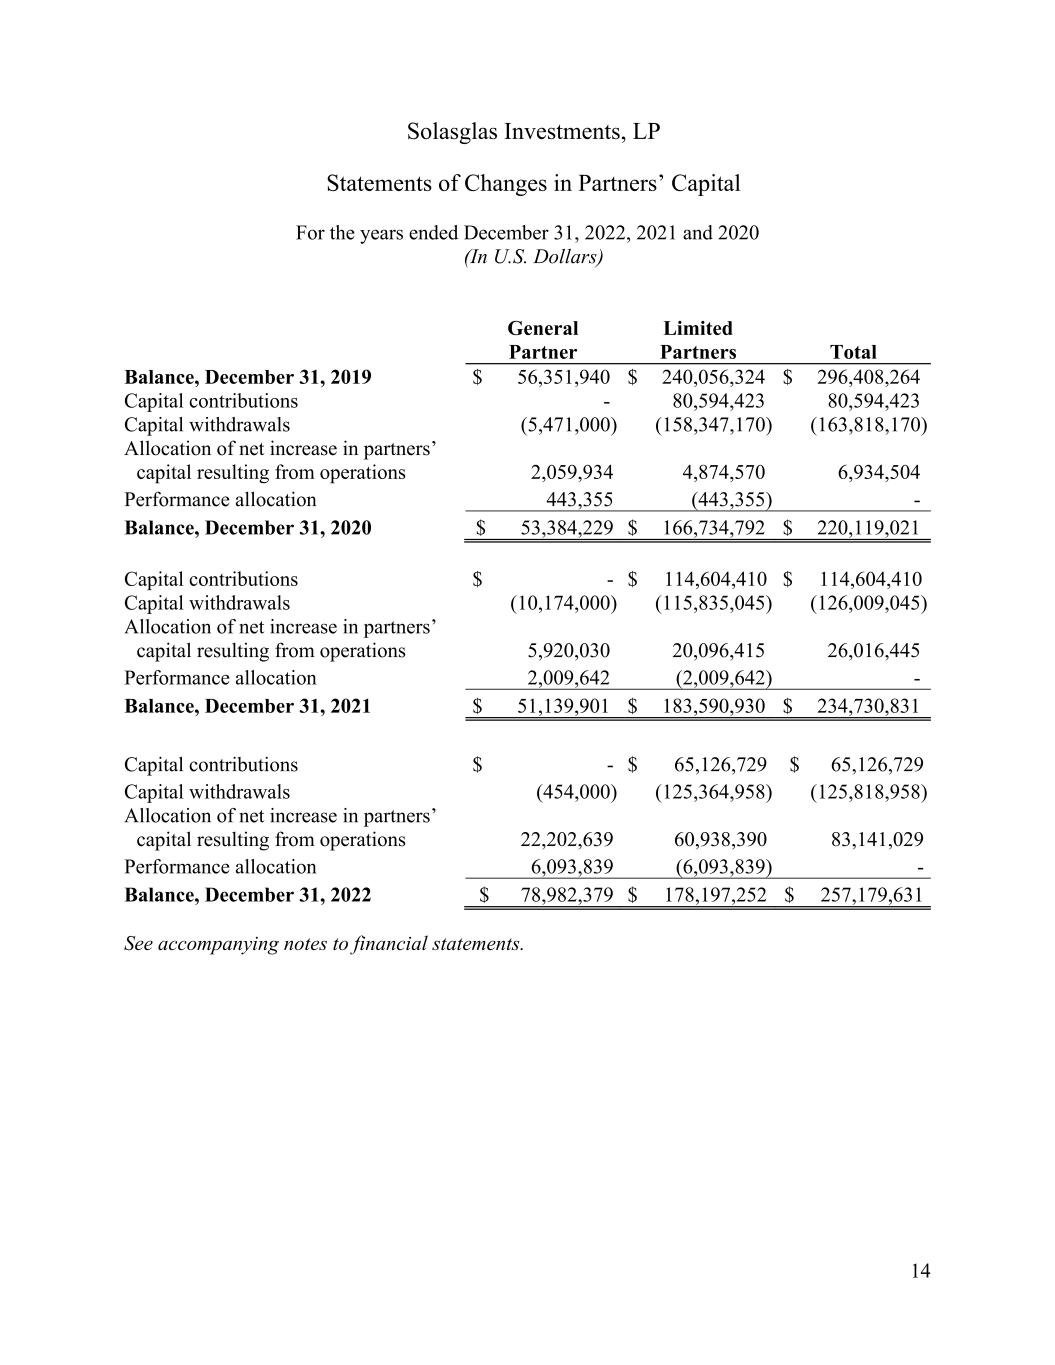
Solasglas Investments, LP Statements of Changes in Partners’ Capital For the years ended December 31, 2022, 2021 and 2020 (In U.S. Dollars) 14 General Partner Limited Partners Total Balance, December 31, 2019 $ 56,351,940 $ 240,056,324 $ 296,408,264 Capital contributions - 80,594,423 80,594,423 Capital withdrawals (5,471,000) (158,347,170) (163,818,170) Allocation of net increase in partners’ capital resulting from operations 2,059,934 4,874,570 6,934,504 Performance allocation 443,355 (443,355) - Balance, December 31, 2020 $ 53,384,229 $ 166,734,792 $ 220,119,021 Capital contributions $ - $ 114,604,410 $ 114,604,410 Capital withdrawals (10,174,000) (115,835,045) (126,009,045) Allocation of net increase in partners’ capital resulting from operations 5,920,030 20,096,415 26,016,445 Performance allocation 2,009,642 (2,009,642) - Balance, December 31, 2021 $ 51,139,901 $ 183,590,930 $ 234,730,831 Capital contributions $ - $ 65,126,729 $ 65,126,729 Capital withdrawals (454,000) (125,364,958) (125,818,958) Allocation of net increase in partners’ capital resulting from operations 22,202,639 60,938,390 83,141,029 Performance allocation 6,093,839 (6,093,839) - Balance, December 31, 2022 $ 78,982,379 $ 178,197,252 $ 257,179,631 See accompanying notes to financial statements.
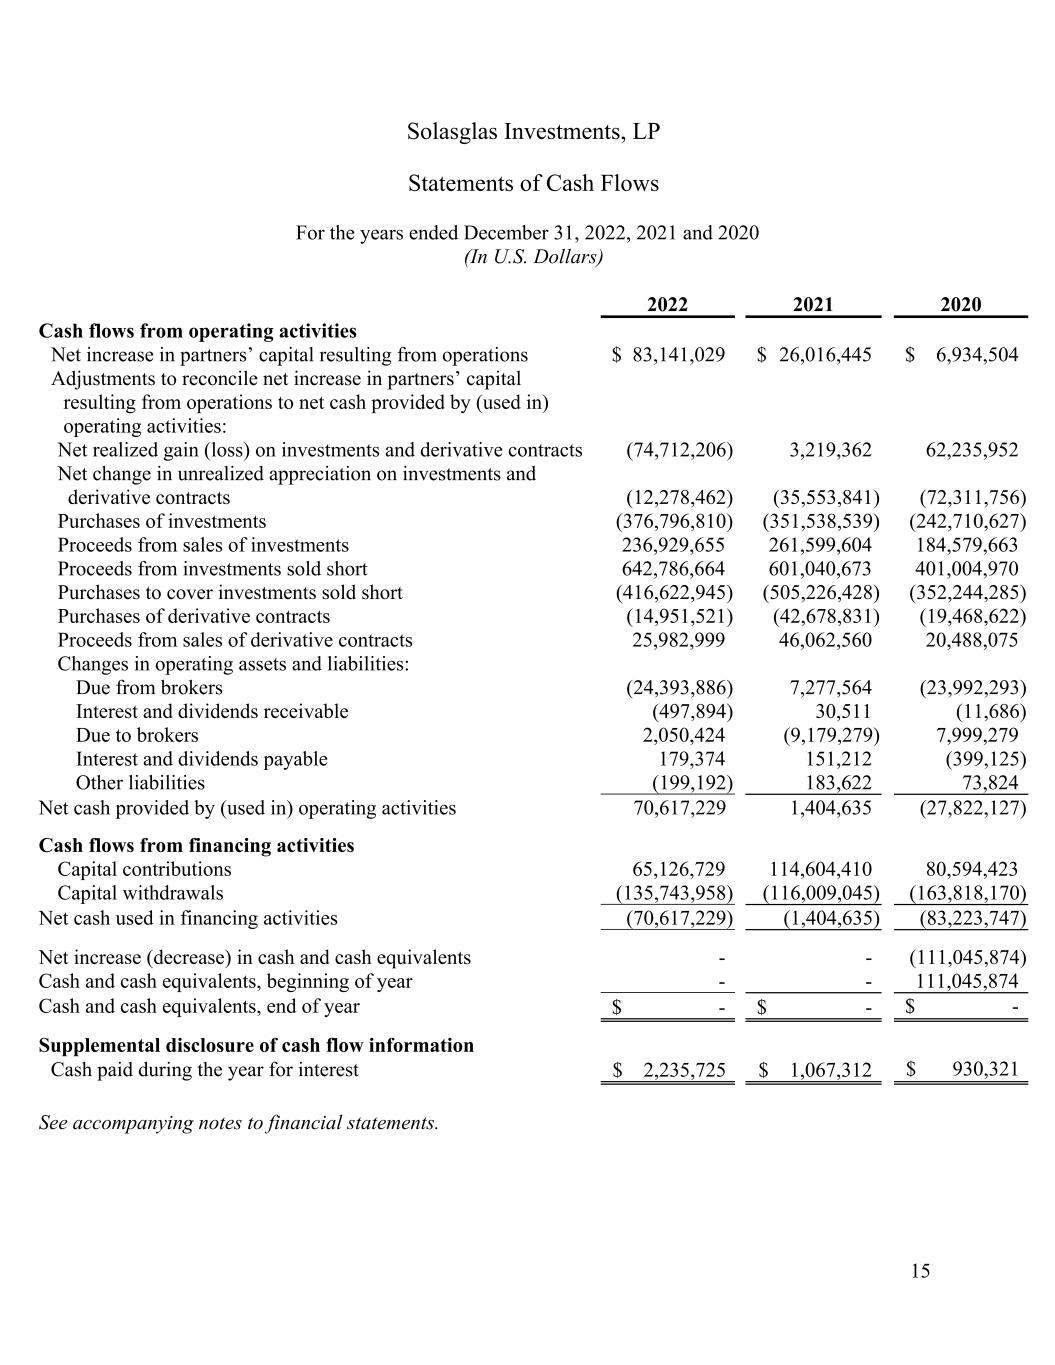
Solasglas Investments, LP Statements of Cash Flows For the years ended December 31, 2022, 2021 and 2020 (In U.S. Dollars) 15 2022 2021 2020 Cash flows from operating activities Net increase in partners’ capital resulting from operations $ 83,141,029 $ 26,016,445 $ 6,934,504 Adjustments to reconcile net increase in partners’ capital resulting from operations to net cash provided by (used in) operating activities: Net realized gain (loss) on investments and derivative contracts (74,712,206) 3,219,362 62,235,952 Net change in unrealized appreciation on investments and derivative contracts (12,278,462) (35,553,841) (72,311,756) Purchases of investments (376,796,810) (351,538,539) (242,710,627) Proceeds from sales of investments 236,929,655 261,599,604 184,579,663 Proceeds from investments sold short 642,786,664 601,040,673 401,004,970 Purchases to cover investments sold short (416,622,945) (505,226,428) (352,244,285) Purchases of derivative contracts (14,951,521) (42,678,831) (19,468,622) Proceeds from sales of derivative contracts 25,982,999 46,062,560 20,488,075 Changes in operating assets and liabilities: Due from brokers (24,393,886) 7,277,564 (23,992,293) Interest and dividends receivable (497,894) 30,511 (11,686) Due to brokers 2,050,424 (9,179,279) 7,999,279 Interest and dividends payable 179,374 151,212 (399,125) Other liabilities (199,192) 183,622 73,824 Net cash provided by (used in) operating activities 70,617,229 1,404,635 (27,822,127) Cash flows from financing activities Capital contributions 65,126,729 114,604,410 80,594,423 Capital withdrawals (135,743,958) (116,009,045) (163,818,170) Net cash used in financing activities (70,617,229) (1,404,635) (83,223,747) Net increase (decrease) in cash and cash equivalents - - (111,045,874) Cash and cash equivalents, beginning of year - - 111,045,874 Cash and cash equivalents, end of year $ - $ - $ - Supplemental disclosure of cash flow information Cash paid during the year for interest $ 2,235,725 $ 1,067,312 $ 930,321 See accompanying notes to financial statements.
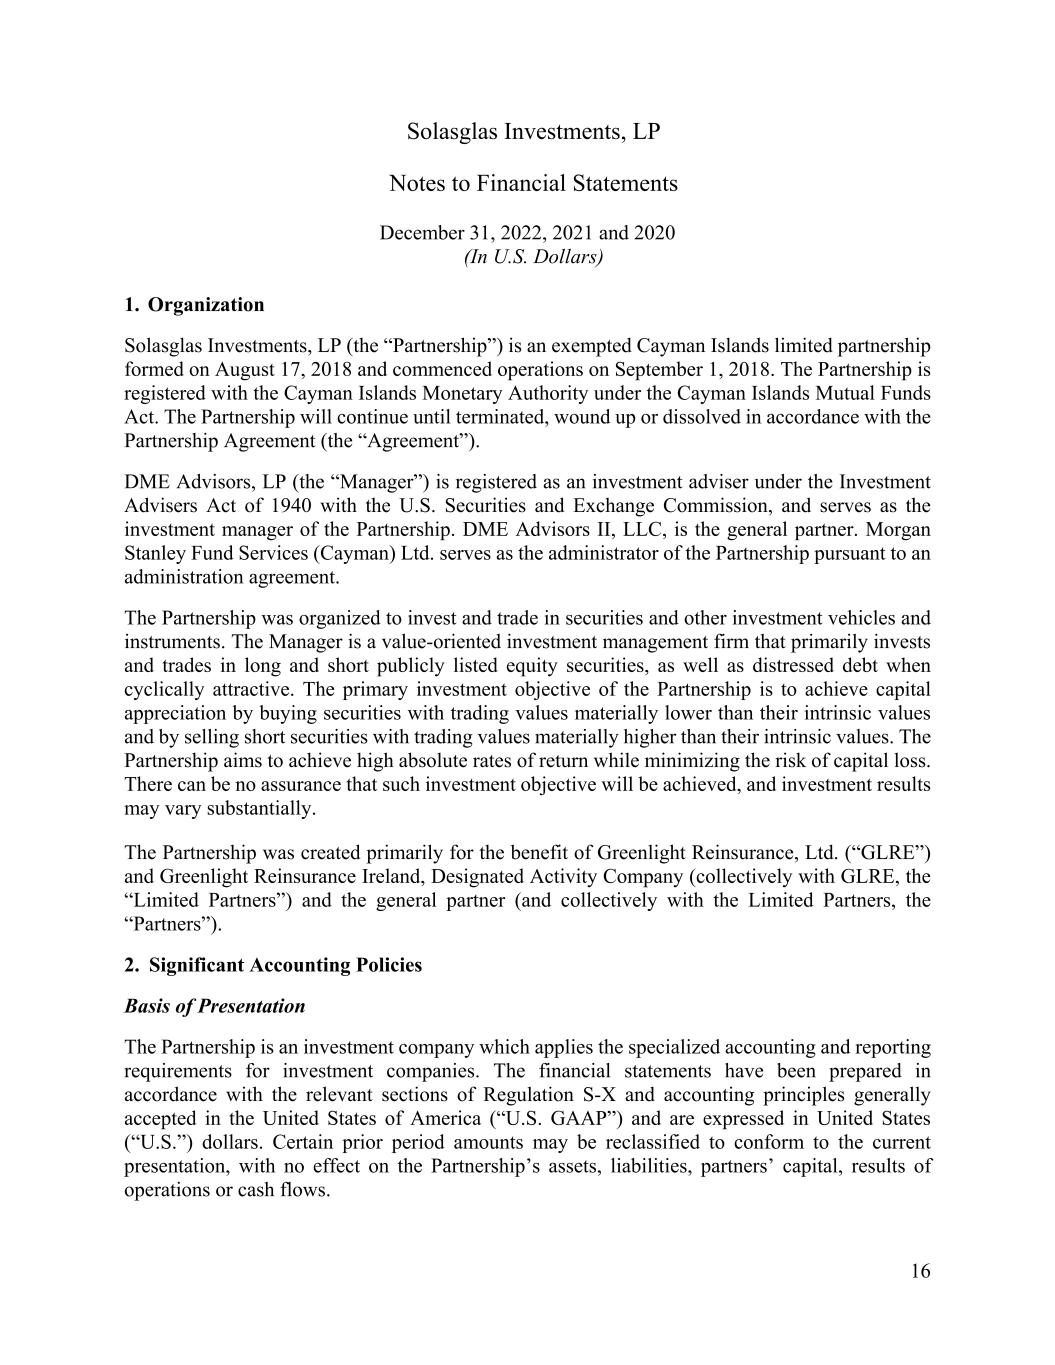
Solasglas Investments, LP Notes to Financial Statements December 31, 2022, 2021 and 2020 (In U.S. Dollars) 16 1. Organization Solasglas Investments, LP (the “Partnership”) is an exempted Cayman Islands limited partnership formed on August 17, 2018 and commenced operations on September 1, 2018. The Partnership is registered with the Cayman Islands Monetary Authority under the Cayman Islands Mutual Funds Act. The Partnership will continue until terminated, wound up or dissolved in accordance with the Partnership Agreement (the “Agreement”). DME Advisors, LP (the “Manager”) is registered as an investment adviser under the Investment Advisers Act of 1940 with the U.S. Securities and Exchange Commission, and serves as the investment manager of the Partnership. DME Advisors II, LLC, is the general partner. Morgan Stanley Fund Services (Cayman) Ltd. serves as the administrator of the Partnership pursuant to an administration agreement. The Partnership was organized to invest and trade in securities and other investment vehicles and instruments. The Manager is a value-oriented investment management firm that primarily invests and trades in long and short publicly listed equity securities, as well as distressed debt when cyclically attractive. The primary investment objective of the Partnership is to achieve capital appreciation by buying securities with trading values materially lower than their intrinsic values and by selling short securities with trading values materially higher than their intrinsic values. The Partnership aims to achieve high absolute rates of return while minimizing the risk of capital loss. There can be no assurance that such investment objective will be achieved, and investment results may vary substantially. The Partnership was created primarily for the benefit of Greenlight Reinsurance, Ltd. (“GLRE”) and Greenlight Reinsurance Ireland, Designated Activity Company (collectively with GLRE, the “Limited Partners”) and the general partner (and collectively with the Limited Partners, the “Partners”). 2. Significant Accounting Policies Basis of Presentation The Partnership is an investment company which applies the specialized accounting and reporting requirements for investment companies. The financial statements have been prepared in accordance with the relevant sections of Regulation S-X and accounting principles generally accepted in the United States of America (“U.S. GAAP”) and are expressed in United States (“U.S.”) dollars. Certain prior period amounts may be reclassified to conform to the current presentation, with no effect on the Partnership’s assets, liabilities, partners’ capital, results of operations or cash flows.
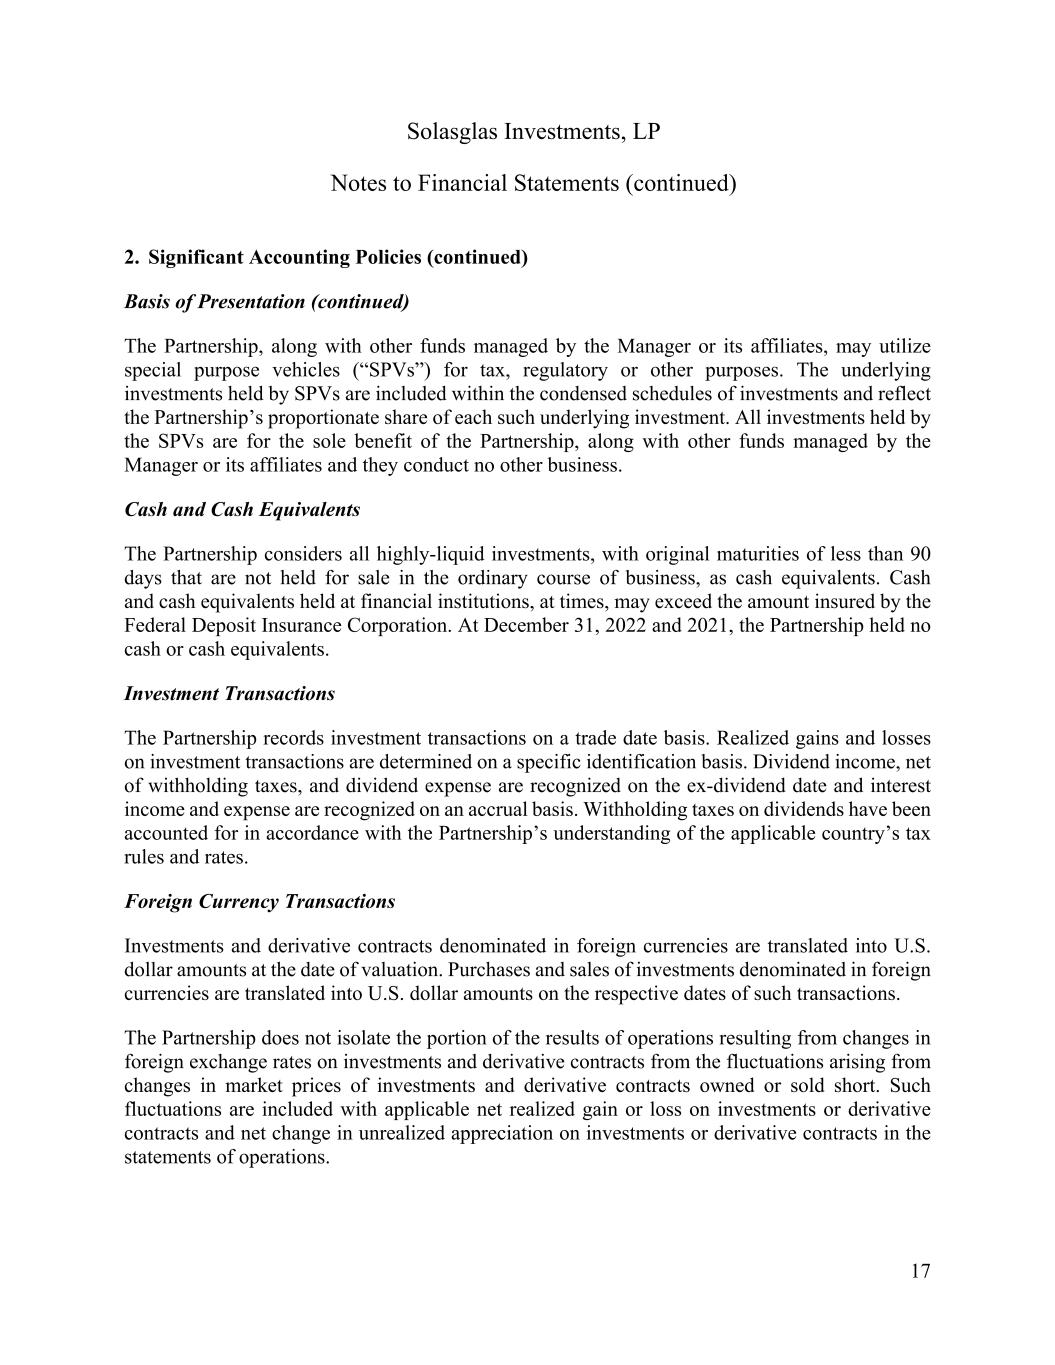
Solasglas Investments, LP Notes to Financial Statements (continued) 17 2. Significant Accounting Policies (continued) Basis of Presentation (continued) The Partnership, along with other funds managed by the Manager or its affiliates, may utilize special purpose vehicles (“SPVs”) for tax, regulatory or other purposes. The underlying investments held by SPVs are included within the condensed schedules of investments and reflect the Partnership’s proportionate share of each such underlying investment. All investments held by the SPVs are for the sole benefit of the Partnership, along with other funds managed by the Manager or its affiliates and they conduct no other business. Cash and Cash Equivalents The Partnership considers all highly-liquid investments, with original maturities of less than 90 days that are not held for sale in the ordinary course of business, as cash equivalents. Cash and cash equivalents held at financial institutions, at times, may exceed the amount insured by the Federal Deposit Insurance Corporation. At December 31, 2022 and 2021, the Partnership held no cash or cash equivalents. Investment Transactions The Partnership records investment transactions on a trade date basis. Realized gains and losses on investment transactions are determined on a specific identification basis. Dividend income, net of withholding taxes, and dividend expense are recognized on the ex-dividend date and interest income and expense are recognized on an accrual basis. Withholding taxes on dividends have been accounted for in accordance with the Partnership’s understanding of the applicable country’s tax rules and rates. Foreign Currency Transactions Investments and derivative contracts denominated in foreign currencies are translated into U.S. dollar amounts at the date of valuation. Purchases and sales of investments denominated in foreign currencies are translated into U.S. dollar amounts on the respective dates of such transactions. The Partnership does not isolate the portion of the results of operations resulting from changes in foreign exchange rates on investments and derivative contracts from the fluctuations arising from changes in market prices of investments and derivative contracts owned or sold short. Such fluctuations are included with applicable net realized gain or loss on investments or derivative contracts and net change in unrealized appreciation on investments or derivative contracts in the statements of operations.
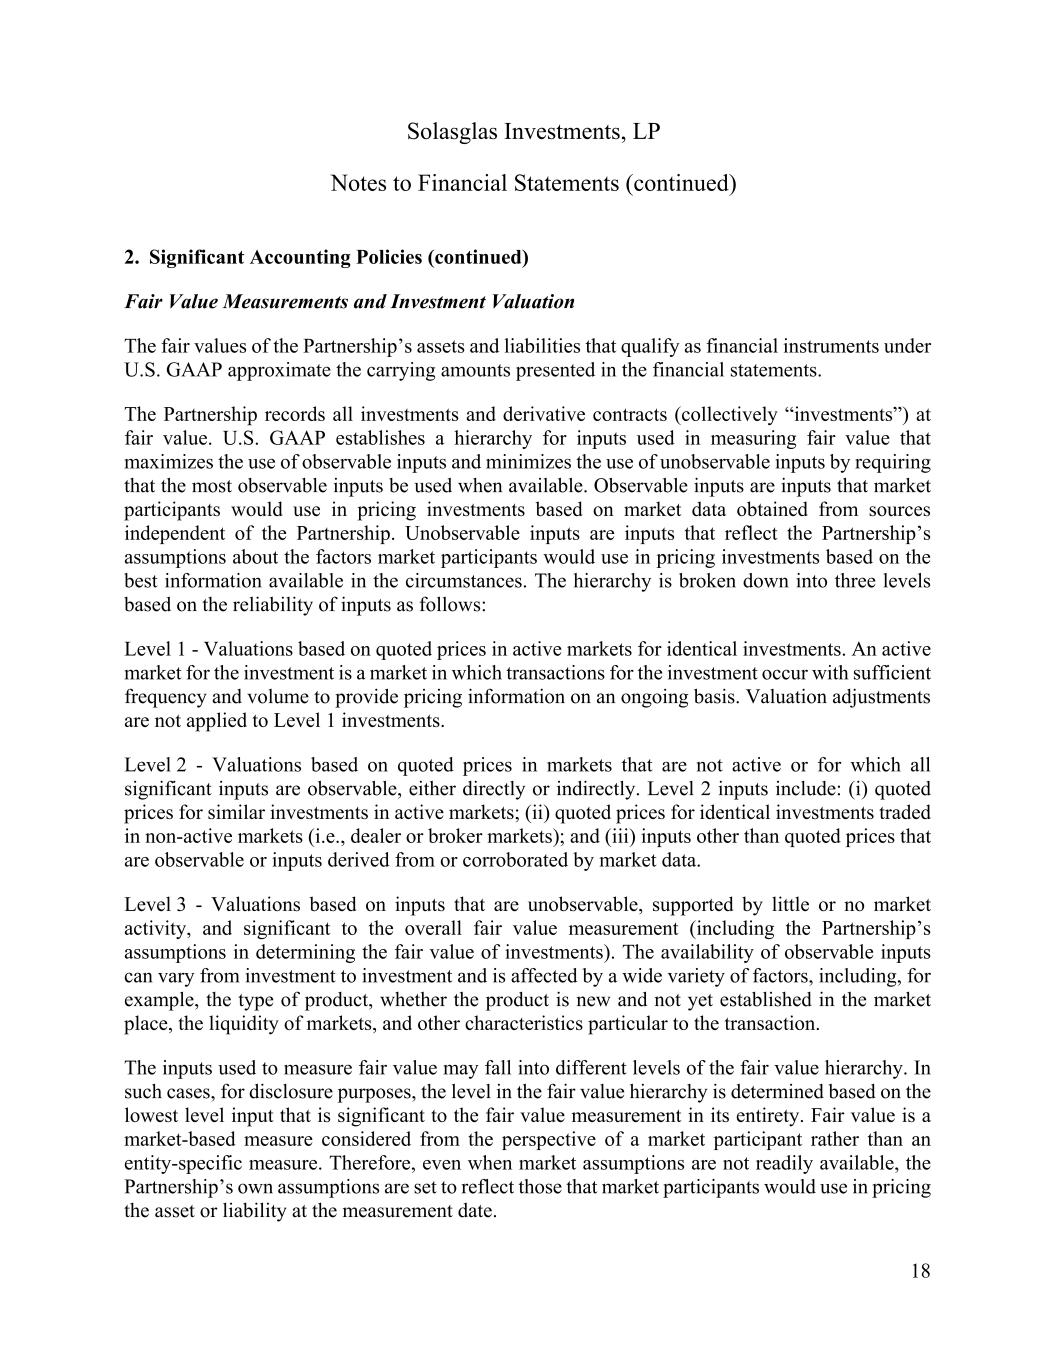
Solasglas Investments, LP Notes to Financial Statements (continued) 18 2. Significant Accounting Policies (continued) Fair Value Measurements and Investment Valuation The fair values of the Partnership’s assets and liabilities that qualify as financial instruments under U.S. GAAP approximate the carrying amounts presented in the financial statements. The Partnership records all investments and derivative contracts (collectively “investments”) at fair value. U.S. GAAP establishes a hierarchy for inputs used in measuring fair value that maximizes the use of observable inputs and minimizes the use of unobservable inputs by requiring that the most observable inputs be used when available. Observable inputs are inputs that market participants would use in pricing investments based on market data obtained from sources independent of the Partnership. Unobservable inputs are inputs that reflect the Partnership’s assumptions about the factors market participants would use in pricing investments based on the best information available in the circumstances. The hierarchy is broken down into three levels based on the reliability of inputs as follows: Level 1 - Valuations based on quoted prices in active markets for identical investments. An active market for the investment is a market in which transactions for the investment occur with sufficient frequency and volume to provide pricing information on an ongoing basis. Valuation adjustments are not applied to Level 1 investments. Level 2 - Valuations based on quoted prices in markets that are not active or for which all significant inputs are observable, either directly or indirectly. Level 2 inputs include: (i) quoted prices for similar investments in active markets; (ii) quoted prices for identical investments traded in non-active markets (i.e., dealer or broker markets); and (iii) inputs other than quoted prices that are observable or inputs derived from or corroborated by market data. Level 3 - Valuations based on inputs that are unobservable, supported by little or no market activity, and significant to the overall fair value measurement (including the Partnership’s assumptions in determining the fair value of investments). The availability of observable inputs can vary from investment to investment and is affected by a wide variety of factors, including, for example, the type of product, whether the product is new and not yet established in the market place, the liquidity of markets, and other characteristics particular to the transaction. The inputs used to measure fair value may fall into different levels of the fair value hierarchy. In such cases, for disclosure purposes, the level in the fair value hierarchy is determined based on the lowest level input that is significant to the fair value measurement in its entirety. Fair value is a market-based measure considered from the perspective of a market participant rather than an entity-specific measure. Therefore, even when market assumptions are not readily available, the Partnership’s own assumptions are set to reflect those that market participants would use in pricing the asset or liability at the measurement date.
Solasglas Investments, LP Notes to Financial Statements (continued) 19 2. Significant Accounting Policies (continued) Fair Value Measurements and Investment Valuation (continued) A description of the valuation techniques applied and inputs utilized in measuring fair value of the Partnership’s major categories of assets and liabilities as of December 31, 2022 and 2021 are as follows: Common Stock and Exchange-Traded Funds Common stock and exchange-traded funds are generally valued based on quoted prices from the relevant exchange. To the extent these investments are actively traded, they are categorized in Level 1 of the fair value hierarchy. In instances when investments in common stock or exchange- traded funds are not actively traded or valuation adjustments are applied, they are categorized in Level 2 of the fair value hierarchy and in instances where significant inputs are unobservable, they are categorized in Level 3 of the fair value hierarchy. Corporate Bonds The fair value of corporate bonds are estimated using recently executed transactions and market price quotations (where observable). When recent transactions or observable price quotations are not available, fair value is determined based on cash flow models. These investments are generally categorized in Level 2 of the fair value hierarchy; in instances where significant inputs are unobservable, they are categorized in Level 3 of the fair value hierarchy. Commodities Actively traded commodities are valued based on quoted dealer prices and are categorized in Level 1 of the fair value hierarchy. Commodities that are not actively traded are generally included in Level 2 of the fair value hierarchy. Investment Funds Investments in investment funds are valued at their net asset value as reported by the underlying fund’s administrator or manager. Management of the underlying funds generally charge management and/or incentive fees to the Partnership and other investors in the underlying funds. Such fees are included in the net asset value reported by the Partnership for the investment funds. The management and incentive fees range from 0-1.5% and 0-20%, respectively, subject to conditions and terms of each investment fund’s legal agreements. Due to restrictions on the transferability and timing of withdrawals from the investment funds, the amounts realized upon liquidation will likely differ from such reported values. As of December 31, 2022 and 2021, none of the Partnership’s investments in investment funds allow for a voluntary right of withdrawal. Investments valued based on their unadjusted net asset value are not categorized within the fair value hierarchy.
Solasglas Investments, LP Notes to Financial Statements (continued) 20 2. Significant Accounting Policies (continued) Fair Value Measurements and Investment Valuation (continued) The Manager may determine that the net asset value provided by the underlying fund does not represent fair value. In such situations, the fair value of the underlying fund will be valued in accordance with the Partnership’s valuation policy. This may include calculating an independent value of the underlying fund’s assets and liabilities, reviewing secondary market transactions, or other techniques depending upon the circumstances. At December 31, 2022 and 2021, no investment funds were valued by management of the Partnership as all were based on values reported by the underlying fund. Private Equity The transaction price is used as the best estimate of fair value upon acquisition. Thereafter, valuation is based on an assessment of each investment, incorporating factors that consider the evaluation of financing and sale transactions with third parties, financial information provided by management of the investee company, expected cash flows and market-based information, including comparable transactions, performance multiples and changes in market outlook, among other factors. These investments are included in Level 3 of the fair value hierarchy. Derivative Contracts The fair value of derivatives actively traded on a national exchange and based on quoted prices from the relevant exchange are categorized in Level 1 of the fair value hierarchy. Over-the-counter (“OTC”) derivatives valued based on market price quotations and listed derivatives that are not actively traded are generally categorized in Level 2 of the fair value hierarchy. Fair values for other OTC derivative investments are based on pricing models intended to approximate the amounts that would be paid to or received from a third party in settlement of the respective contract. Factors taken into consideration include credit spreads, market liquidity and concentrations, foreign currency rates, and funding and administrative costs incurred over the lives of the investments. As these inputs are typically observable, these OTC derivatives are also categorized within Level 2 of the fair value hierarchy. Refer to Note 4 for additional information on the Partnership’s derivative contracts.
Solasglas Investments, LP Notes to Financial Statements (continued) 21 2. Significant Accounting Policies (continued) Investments Sold Short The Partnership has sold investments that it does not own and will, therefore, be obligated to purchase such investments at a future date. A gain, limited to the price at which the Partnership sold the investment, or a loss, unlimited in amount, will be realized upon the liquidation of the investment. The Partnership has recorded this obligation in the financial statements at fair value. There is an element of market risk in that, if the investments increase in value, it will be necessary to purchase the investments at a cost in excess of the obligation reflected in the statements of assets, liabilities and partners’ capital. Use of Estimates The preparation of the financial statements in conformity with U.S. GAAP requires the Partnership to make estimates and assumptions that affect the reported amounts of assets and liabilities and disclosures of contingent assets and liabilities at the date of the financial statements and the reported amounts of income and expenses during the reporting year. Actual results could differ from those estimates and those differences could be material. Income Taxes The Partnership is not subject to taxes on income, capital gains or withholding tax in the Cayman Islands. Each partner in the Partnership may be subject to taxation on its share of the Partnership’s ordinary income and capital gains. In certain jurisdictions other than the Cayman Islands, taxes are withheld at the source on dividends and interest received by the Partnership. Capital gains derived by the Partnership in such jurisdictions generally will be exempt from foreign income or withholding taxes at the source. U.S. GAAP requires the evaluation of tax positions taken or expected to be taken to determine whether it is more likely than not that a tax position will be sustained upon examination, including resolution of any related appeals or litigation processes. In evaluating whether a tax position has met the more likely than not recognition threshold, the Partnership presumes that the position will be examined by the appropriate taxing authority that has full knowledge of all relevant information. Tax positions not deemed to meet a more likely than not threshold would be recorded as an income tax expense in the current period. Upon the completion of any potential examination by U.S. federal, state or foreign tax jurisdiction in which the Partnership trades, tax adjustments may be necessary and retroactive to all open tax years. If an adjustment is necessary, the Partnership would recognize interest and penalties, if any, related to unrecognized tax as income tax expense in the statements of operations. As of December 31, 2022 and 2021, there was no impact to the financial statements relating to accounting for uncertainty in income taxes.
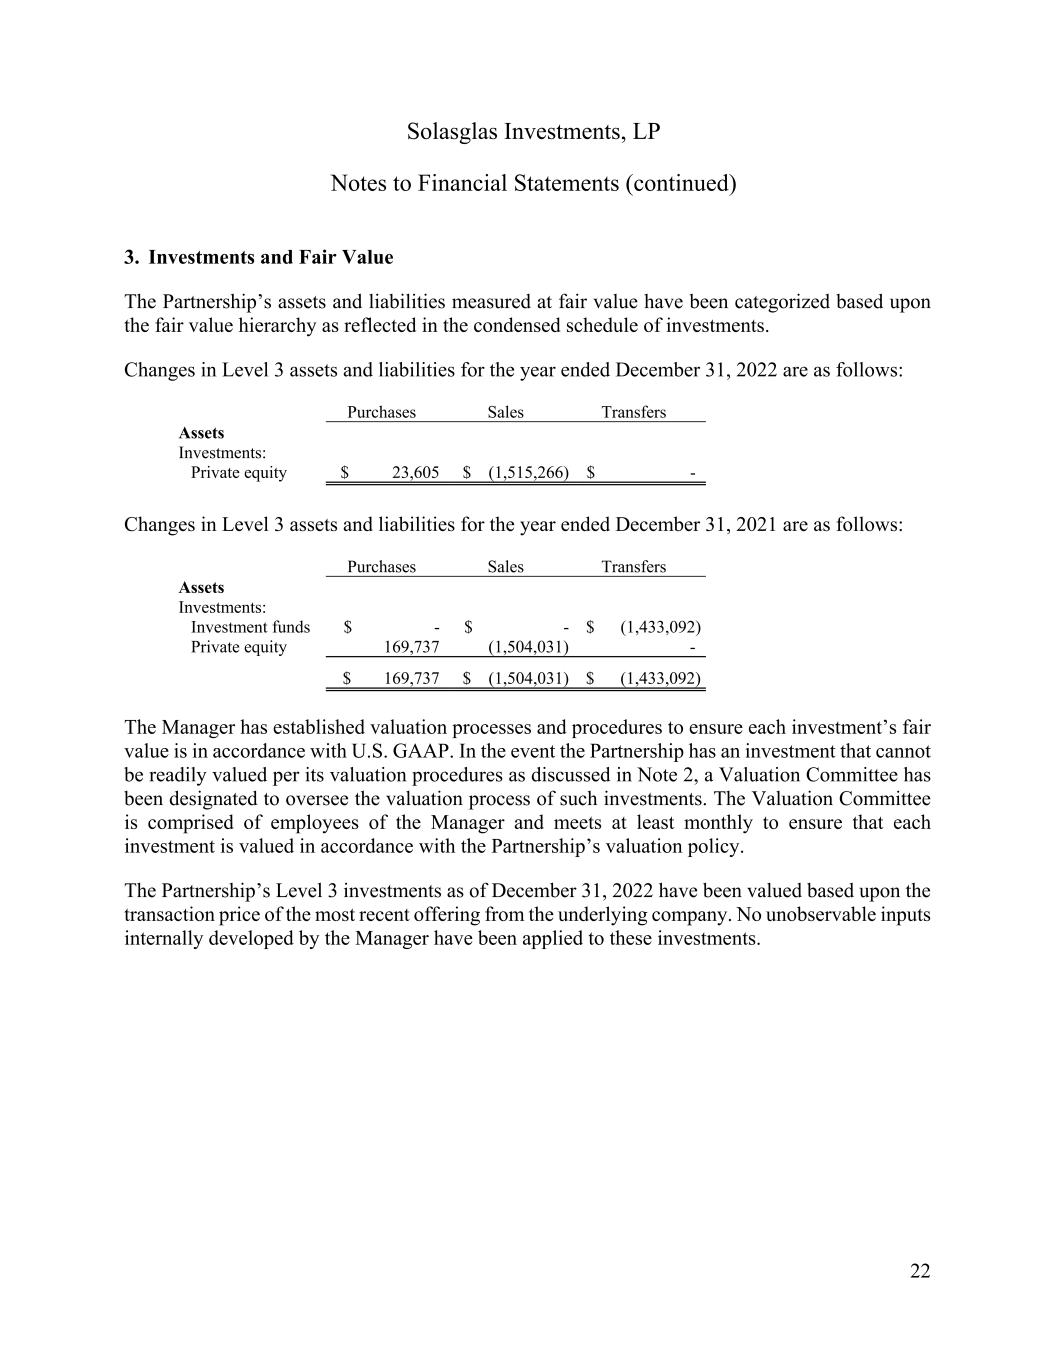
Solasglas Investments, LP Notes to Financial Statements (continued) 22 3. Investments and Fair Value The Partnership’s assets and liabilities measured at fair value have been categorized based upon the fair value hierarchy as reflected in the condensed schedule of investments. Changes in Level 3 assets and liabilities for the year ended December 31, 2022 are as follows: Purchases Sales Transfers Assets Investments: Private equity $ 23,605 $ (1,515,266) $ - Changes in Level 3 assets and liabilities for the year ended December 31, 2021 are as follows: Purchases Sales Transfers Assets Investments: Investment funds $ - $ - $ (1,433,092) Private equity 169,737 (1,504,031) - $ 169,737 $ (1,504,031) $ (1,433,092) The Manager has established valuation processes and procedures to ensure each investment’s fair value is in accordance with U.S. GAAP. In the event the Partnership has an investment that cannot be readily valued per its valuation procedures as discussed in Note 2, a Valuation Committee has been designated to oversee the valuation process of such investments. The Valuation Committee is comprised of employees of the Manager and meets at least monthly to ensure that each investment is valued in accordance with the Partnership’s valuation policy. The Partnership’s Level 3 investments as of December 31, 2022 have been valued based upon the transaction price of the most recent offering from the underlying company. No unobservable inputs internally developed by the Manager have been applied to these investments.
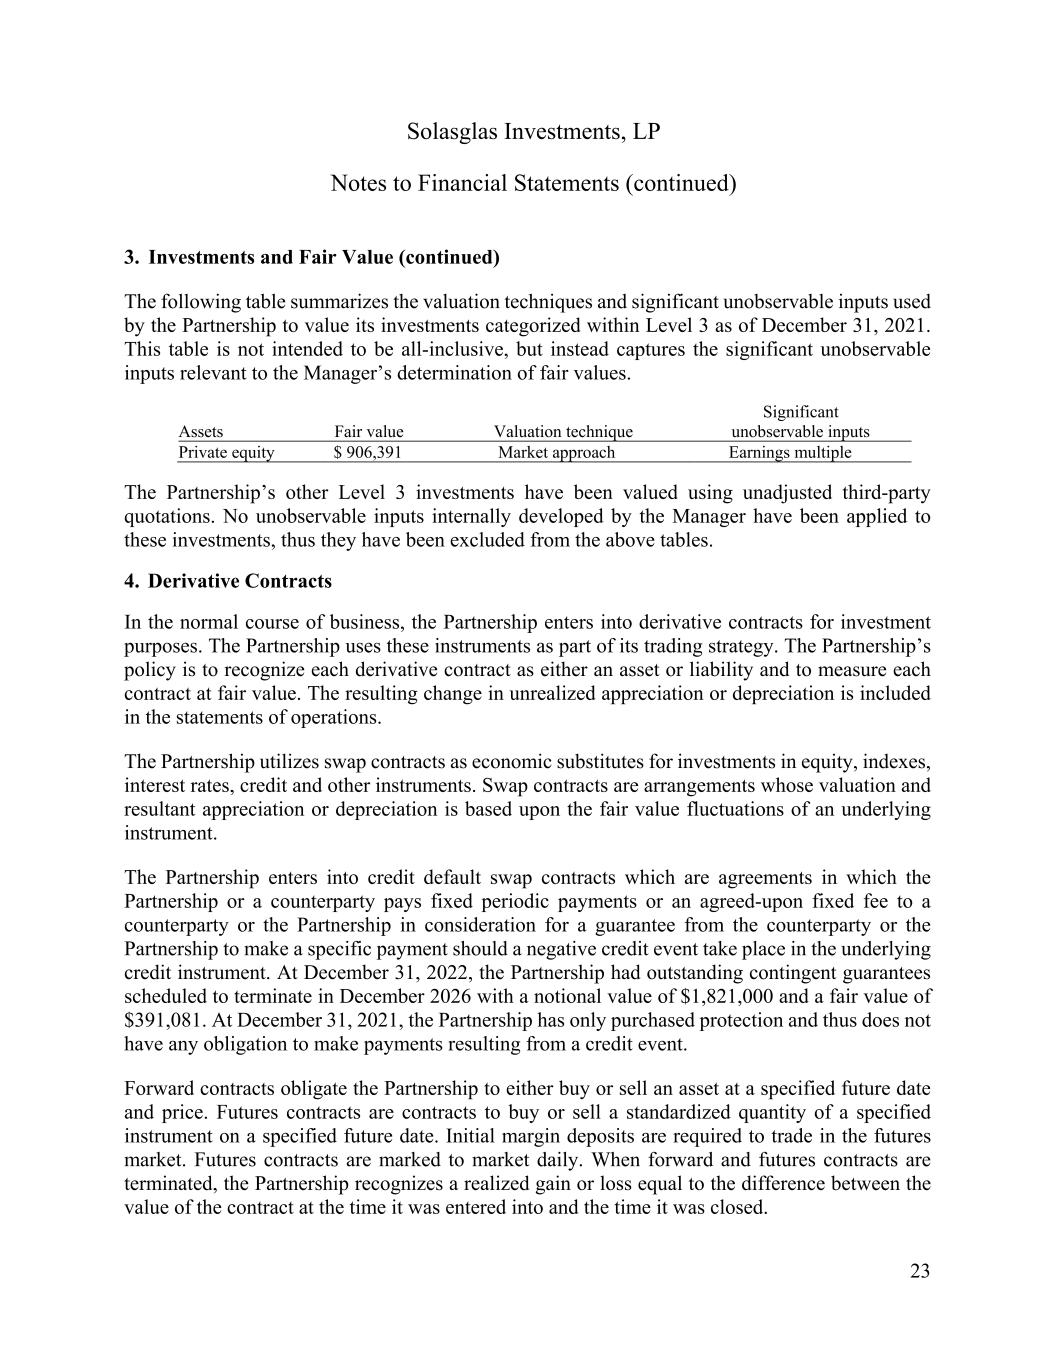
Solasglas Investments, LP Notes to Financial Statements (continued) 23 3. Investments and Fair Value (continued) The following table summarizes the valuation techniques and significant unobservable inputs used by the Partnership to value its investments categorized within Level 3 as of December 31, 2021. This table is not intended to be all-inclusive, but instead captures the significant unobservable inputs relevant to the Manager’s determination of fair values. Assets Fair value Valuation technique Significant unobservable inputs Private equity $ 906,391 Market approach Earnings multiple The Partnership’s other Level 3 investments have been valued using unadjusted third-party quotations. No unobservable inputs internally developed by the Manager have been applied to these investments, thus they have been excluded from the above tables. 4. Derivative Contracts In the normal course of business, the Partnership enters into derivative contracts for investment purposes. The Partnership uses these instruments as part of its trading strategy. The Partnership’s policy is to recognize each derivative contract as either an asset or liability and to measure each contract at fair value. The resulting change in unrealized appreciation or depreciation is included in the statements of operations. The Partnership utilizes swap contracts as economic substitutes for investments in equity, indexes, interest rates, credit and other instruments. Swap contracts are arrangements whose valuation and resultant appreciation or depreciation is based upon the fair value fluctuations of an underlying instrument. The Partnership enters into credit default swap contracts which are agreements in which the Partnership or a counterparty pays fixed periodic payments or an agreed-upon fixed fee to a counterparty or the Partnership in consideration for a guarantee from the counterparty or the Partnership to make a specific payment should a negative credit event take place in the underlying credit instrument. At December 31, 2022, the Partnership had outstanding contingent guarantees scheduled to terminate in December 2026 with a notional value of $1,821,000 and a fair value of $391,081. At December 31, 2021, the Partnership has only purchased protection and thus does not have any obligation to make payments resulting from a credit event. Forward contracts obligate the Partnership to either buy or sell an asset at a specified future date and price. Futures contracts are contracts to buy or sell a standardized quantity of a specified instrument on a specified future date. Initial margin deposits are required to trade in the futures market. Futures contracts are marked to market daily. When forward and futures contracts are terminated, the Partnership recognizes a realized gain or loss equal to the difference between the value of the contract at the time it was entered into and the time it was closed.
Solasglas Investments, LP Notes to Financial Statements (continued) 24 4. Derivative Contracts (continued) The Partnership may buy and write put and call options or warrants through the OTC market or through an exchange. The buyer of an option has the right to purchase (in the case of a call option) or sell (in the case of a put option) a specified quantity of a specific financial instrument at a specified price prior to or on a specified expiration date. The writer of an option is exposed to the risk of loss if the market price of the underlying financial instrument declines (in the case of a put option) or increases (in the case of a call option). The premium received by the Partnership upon writing an option contract is recorded as a liability and marked to market on a daily basis. The writer of an option can never profit by more than the premium paid by the buyer. In the case of a written call option, losses could be unlimited and in the case of written put options, losses are limited to the number of contracts written multiplied by the applicable strike price. As of December 31, 2022, the Partnership had written call options with a fair value of $1,235,122 and had written put options with a fair value of $6,977,875. As of December 31, 2021, the Partnership had written call options with a fair value of $589,176 and had written put options with a fair value of $922,082. Potential losses on the Partnership’s written options are not representative of its net economic exposure as the Partnership has long and short exposure across a variety of different financial instruments, whereby losses on one instrument are offset by gains in other instruments. The following tables set forth the gross fair value of derivative asset and liability contracts by primary risk type as of December 31, 2022 and 2021. The fair values of these derivatives are presented on a gross basis, even when derivatives are subject to master netting arrangements. The tables also include information on the volume of derivative activity that is approximated, on an absolute basis, by the average quarterly outstanding notional amounts for the years ended December 31, 2022 and 2021.
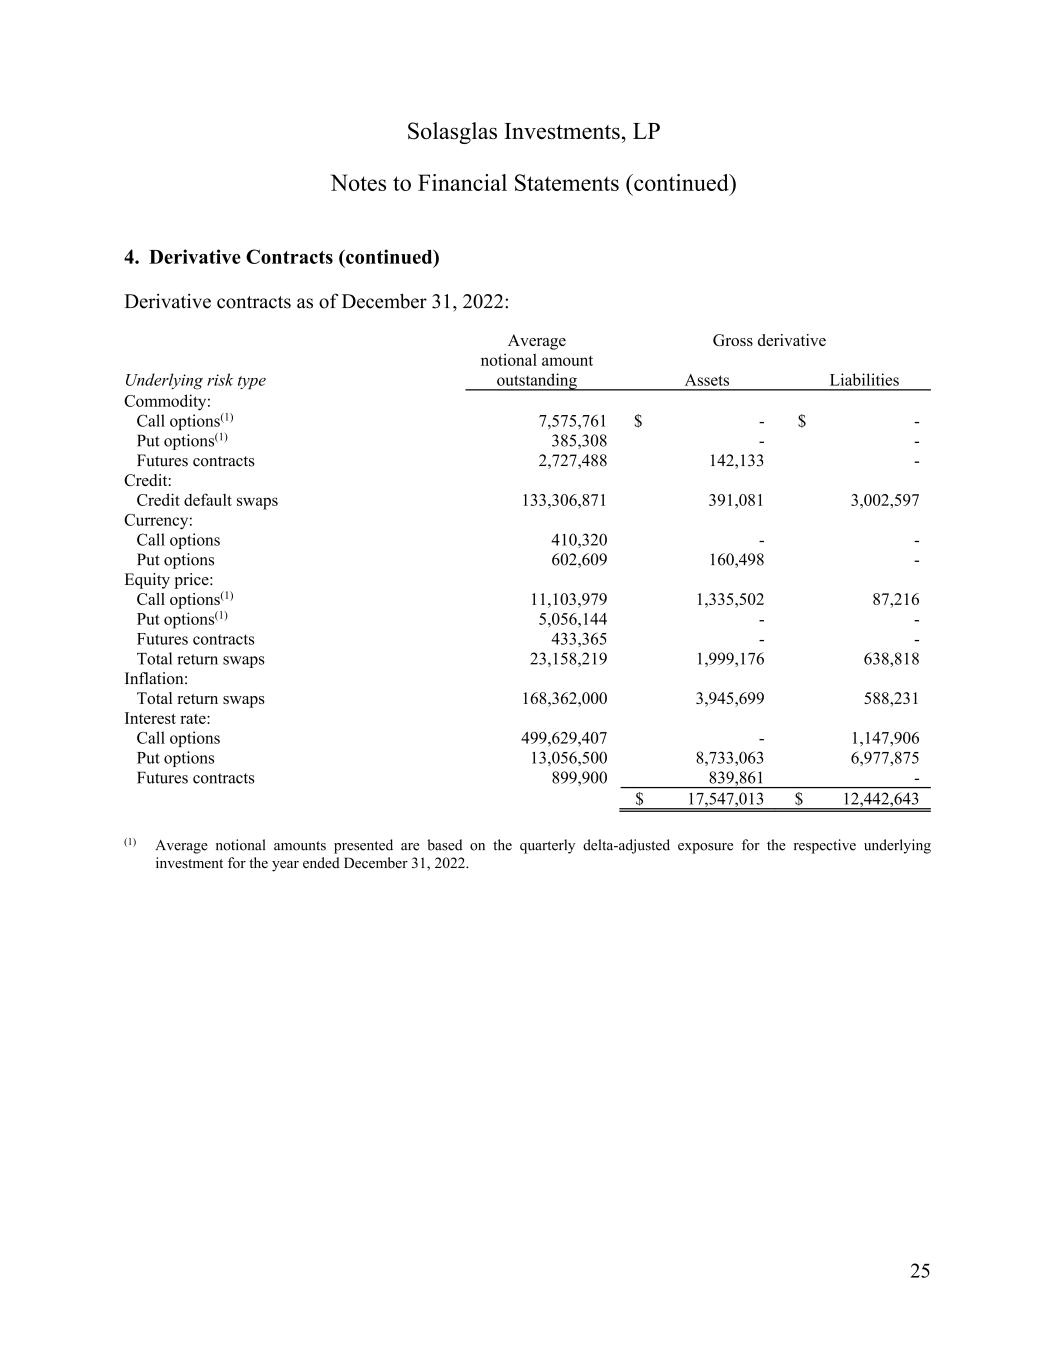
Solasglas Investments, LP Notes to Financial Statements (continued) 25 4. Derivative Contracts (continued) Derivative contracts as of December 31, 2022: Average Gross derivative Underlying risk type notional amount outstanding Assets Liabilities Commodity: Call options(1) 7,575,761 $ - $ - Put options(1) 385,308 - - Futures contracts 2,727,488 142,133 - Credit: Credit default swaps 133,306,871 391,081 3,002,597 Currency: Call options 410,320 - - Put options 602,609 160,498 - Equity price: Call options(1) 11,103,979 1,335,502 87,216 Put options(1) 5,056,144 - - Futures contracts 433,365 - - Total return swaps 23,158,219 1,999,176 638,818 Inflation: Total return swaps 168,362,000 3,945,699 588,231 Interest rate: Call options 499,629,407 - 1,147,906 Put options 13,056,500 8,733,063 6,977,875 Futures contracts 899,900 839,861 - $ 17,547,013 $ 12,442,643 (1) Average notional amounts presented are based on the quarterly delta-adjusted exposure for the respective underlying investment for the year ended December 31, 2022.
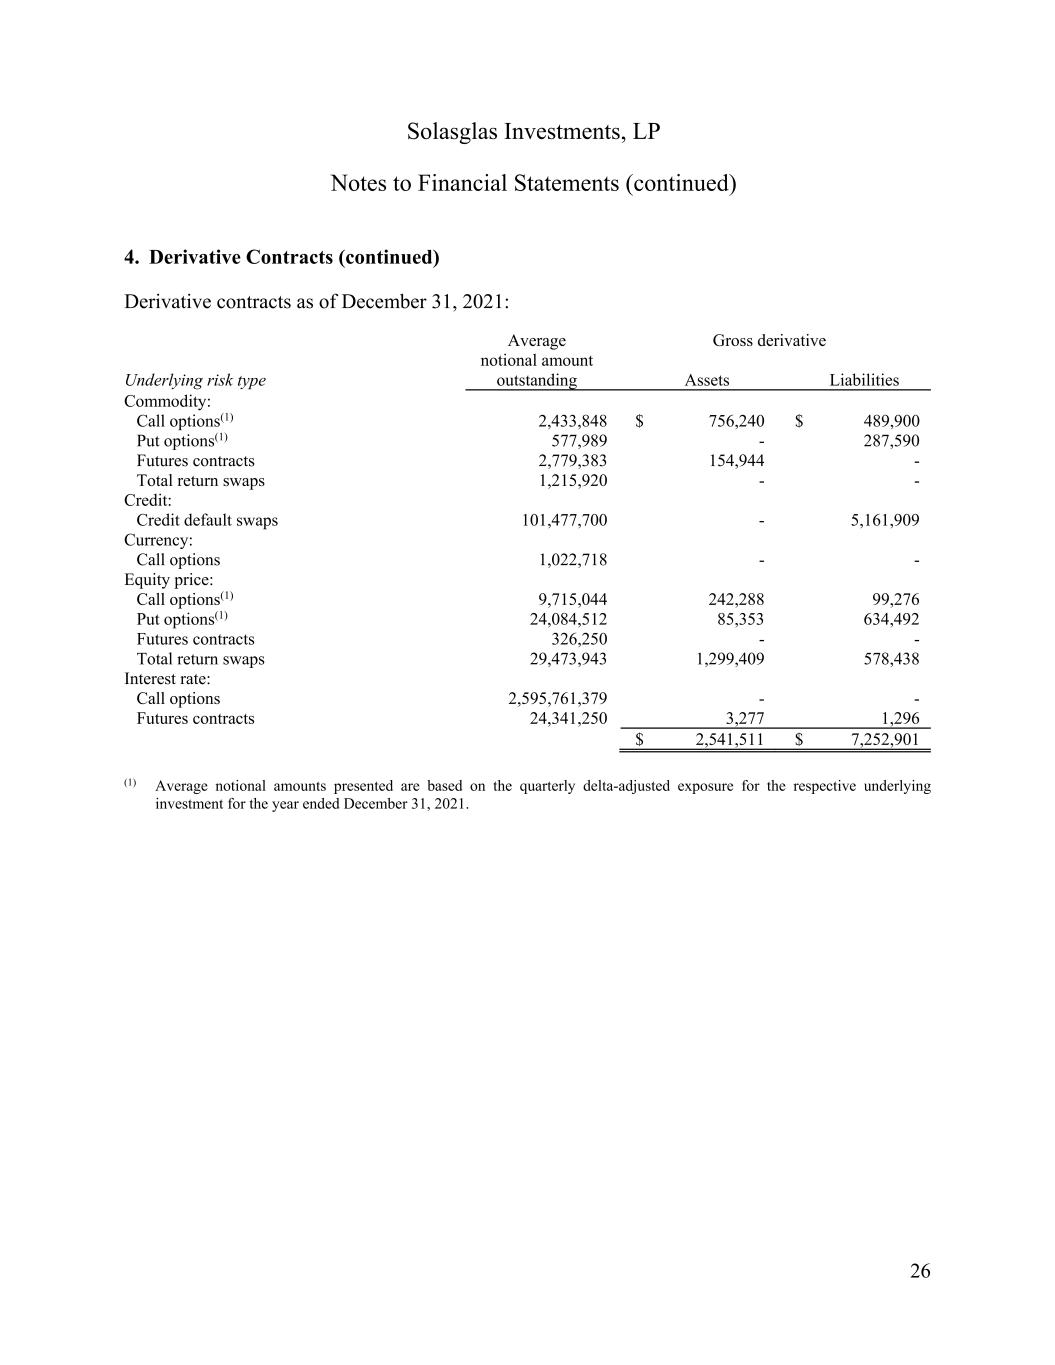
Solasglas Investments, LP Notes to Financial Statements (continued) 26 4. Derivative Contracts (continued) Derivative contracts as of December 31, 2021: Average Gross derivative Underlying risk type notional amount outstanding Assets Liabilities Commodity: Call options(1) 2,433,848 $ 756,240 $ 489,900 Put options(1) 577,989 - 287,590 Futures contracts 2,779,383 154,944 - Total return swaps 1,215,920 - - Credit: Credit default swaps 101,477,700 - 5,161,909 Currency: Call options 1,022,718 - - Equity price: Call options(1) 9,715,044 242,288 99,276 Put options(1) 24,084,512 85,353 634,492 Futures contracts 326,250 - - Total return swaps 29,473,943 1,299,409 578,438 Interest rate: Call options 2,595,761,379 - - Futures contracts 24,341,250 3,277 1,296 $ 2,541,511 $ 7,252,901 (1) Average notional amounts presented are based on the quarterly delta-adjusted exposure for the respective underlying investment for the year ended December 31, 2021.
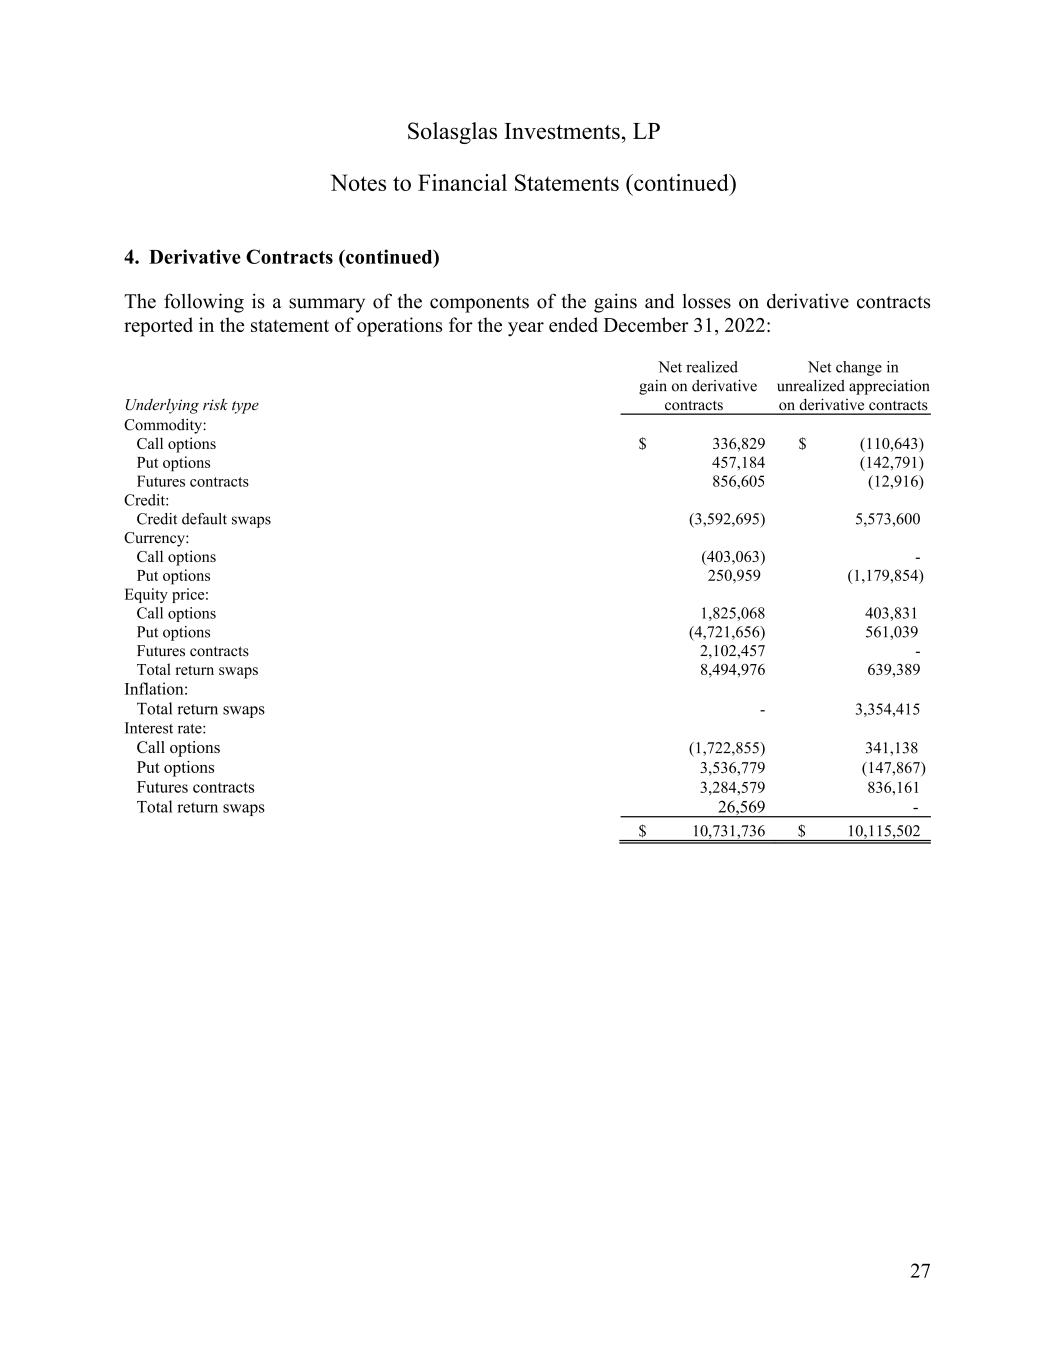
Solasglas Investments, LP Notes to Financial Statements (continued) 27 4. Derivative Contracts (continued) The following is a summary of the components of the gains and losses on derivative contracts reported in the statement of operations for the year ended December 31, 2022: Underlying risk type Net realized gain on derivative contracts Net change in unrealized appreciation on derivative contracts Commodity: Call options $ 336,829 $ (110,643) Put options 457,184 (142,791) Futures contracts 856,605 (12,916) Credit: Credit default swaps (3,592,695) 5,573,600 Currency: Call options (403,063) - Put options 250,959 (1,179,854) Equity price: Call options 1,825,068 403,831 Put options (4,721,656) 561,039 Futures contracts 2,102,457 - Total return swaps 8,494,976 639,389 Inflation: Total return swaps - 3,354,415 Interest rate: Call options (1,722,855) 341,138 Put options 3,536,779 (147,867) Futures contracts 3,284,579 836,161 Total return swaps 26,569 - $ 10,731,736 $ 10,115,502
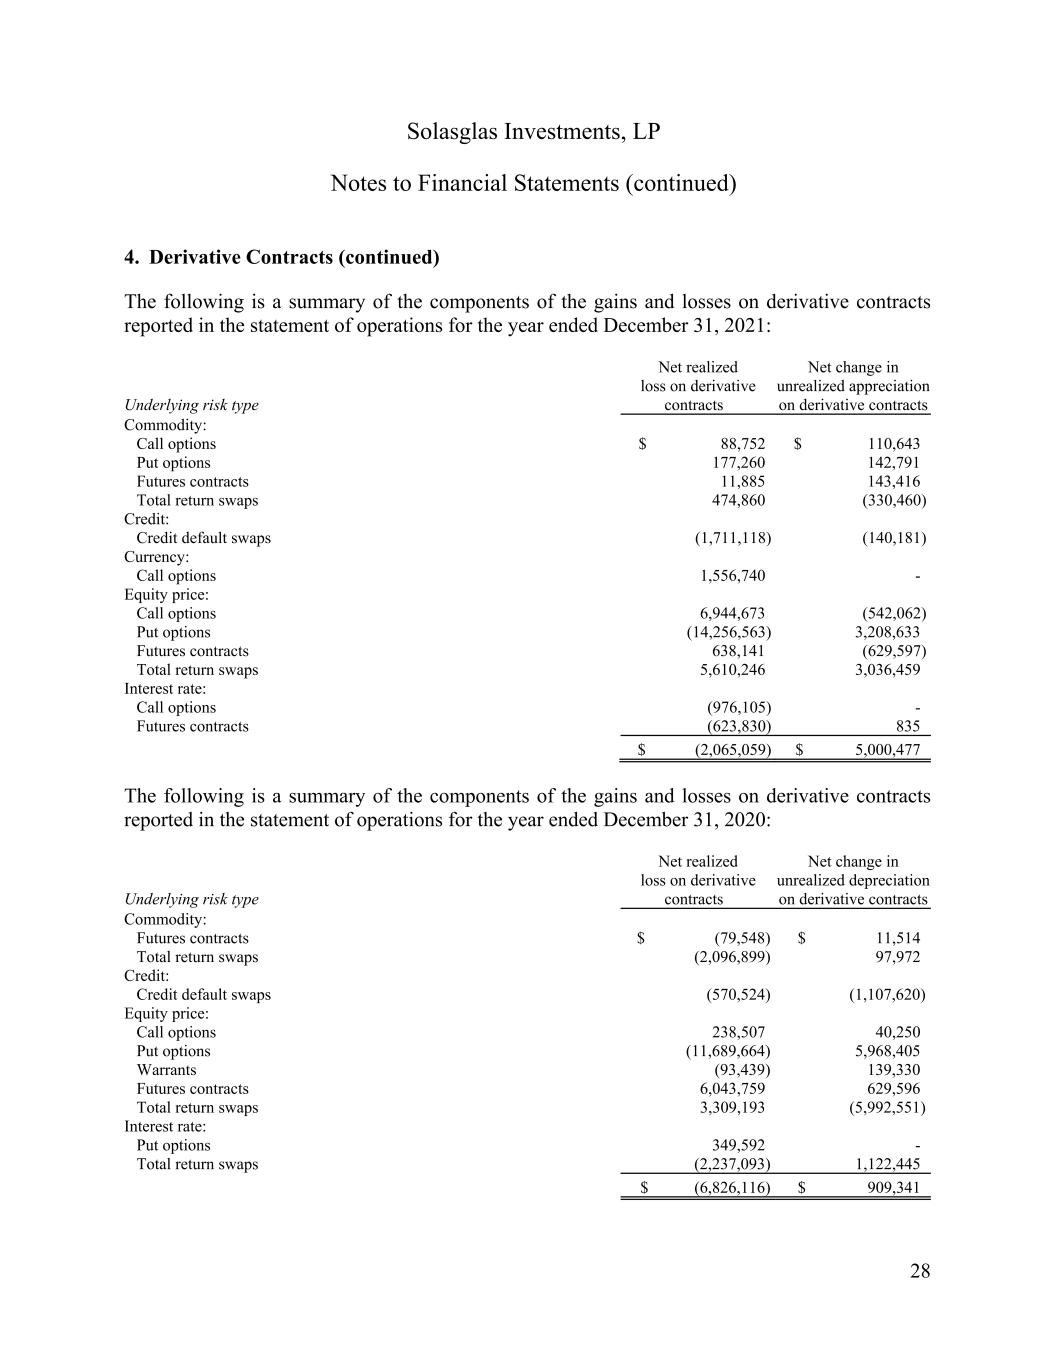
Solasglas Investments, LP Notes to Financial Statements (continued) 28 4. Derivative Contracts (continued) The following is a summary of the components of the gains and losses on derivative contracts reported in the statement of operations for the year ended December 31, 2021: Underlying risk type Net realized loss on derivative contracts Net change in unrealized appreciation on derivative contracts Commodity: Call options $ 88,752 $ 110,643 Put options 177,260 142,791 Futures contracts 11,885 143,416 Total return swaps 474,860 (330,460) Credit: Credit default swaps (1,711,118) (140,181) Currency: Call options 1,556,740 - Equity price: Call options 6,944,673 (542,062) Put options (14,256,563) 3,208,633 Futures contracts 638,141 (629,597) Total return swaps 5,610,246 3,036,459 Interest rate: Call options (976,105) - Futures contracts (623,830) 835 $ (2,065,059) $ 5,000,477 The following is a summary of the components of the gains and losses on derivative contracts reported in the statement of operations for the year ended December 31, 2020: Underlying risk type Net realized loss on derivative contracts Net change in unrealized depreciation on derivative contracts Commodity: Futures contracts $ (79,548) $ 11,514 Total return swaps (2,096,899) 97,972 Credit: Credit default swaps (570,524) (1,107,620) Equity price: Call options 238,507 40,250 Put options (11,689,664) 5,968,405 Warrants (93,439) 139,330 Futures contracts 6,043,759 629,596 Total return swaps 3,309,193 (5,992,551) Interest rate: Put options 349,592 - Total return swaps (2,237,093) 1,122,445 $ (6,826,116) $ 909,341
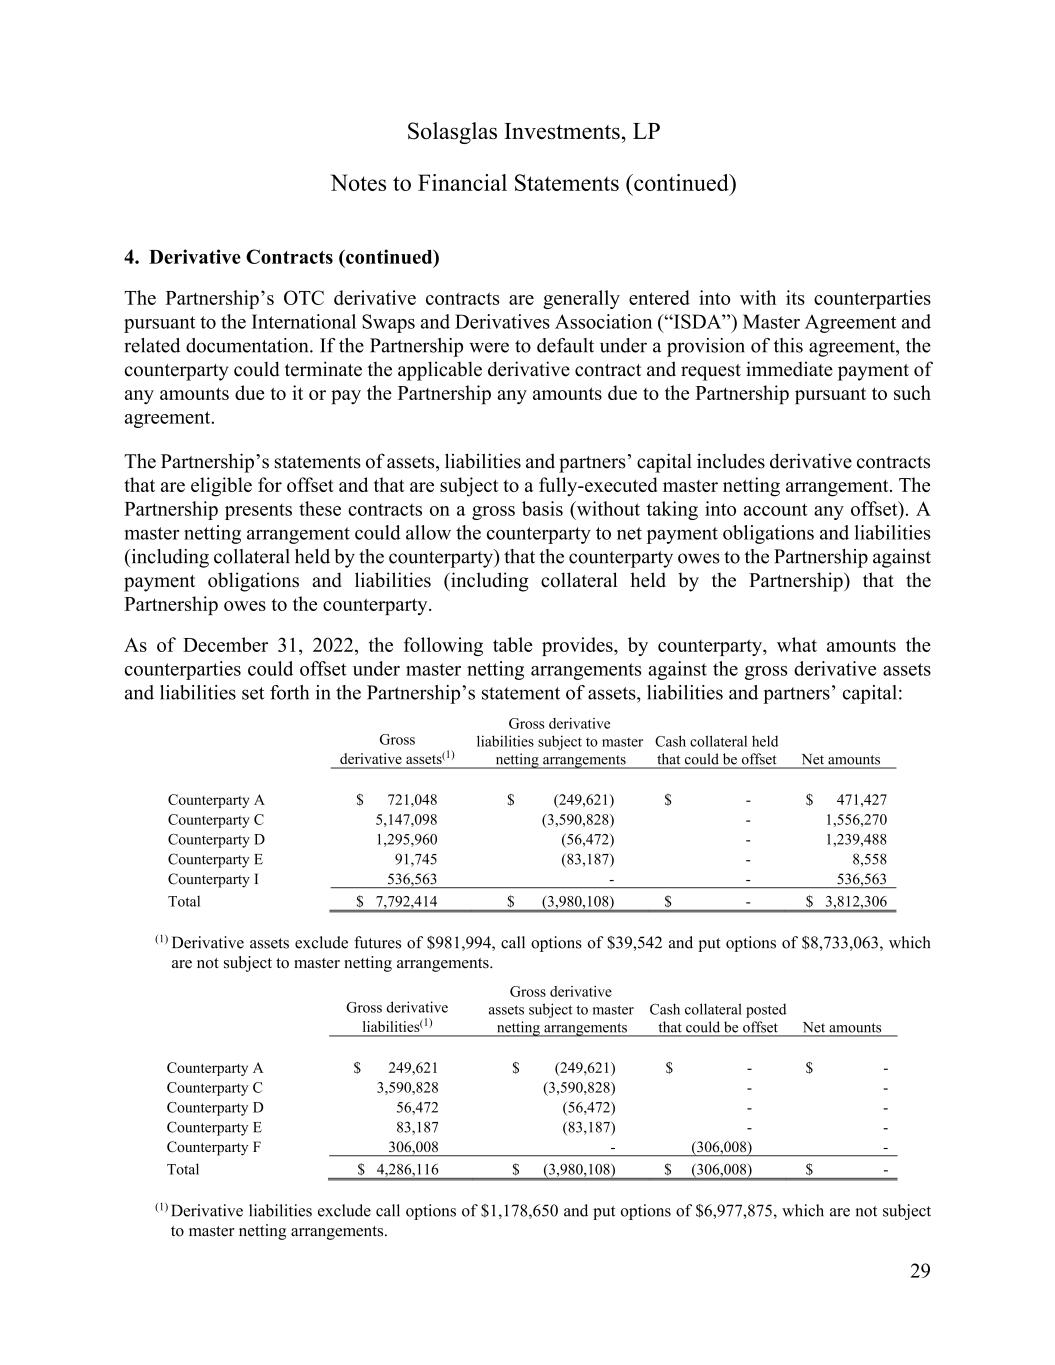
Solasglas Investments, LP Notes to Financial Statements (continued) 29 4. Derivative Contracts (continued) The Partnership’s OTC derivative contracts are generally entered into with its counterparties pursuant to the International Swaps and Derivatives Association (“ISDA”) Master Agreement and related documentation. If the Partnership were to default under a provision of this agreement, the counterparty could terminate the applicable derivative contract and request immediate payment of any amounts due to it or pay the Partnership any amounts due to the Partnership pursuant to such agreement. The Partnership’s statements of assets, liabilities and partners’ capital includes derivative contracts that are eligible for offset and that are subject to a fully-executed master netting arrangement. The Partnership presents these contracts on a gross basis (without taking into account any offset). A master netting arrangement could allow the counterparty to net payment obligations and liabilities (including collateral held by the counterparty) that the counterparty owes to the Partnership against payment obligations and liabilities (including collateral held by the Partnership) that the Partnership owes to the counterparty. As of December 31, 2022, the following table provides, by counterparty, what amounts the counterparties could offset under master netting arrangements against the gross derivative assets and liabilities set forth in the Partnership’s statement of assets, liabilities and partners’ capital: Gross derivative assets(1) Gross derivative liabilities subject to master netting arrangements Cash collateral held that could be offset Net amounts Counterparty A $ 721,048 $ (249,621) $ - $ 471,427 Counterparty C 5,147,098 (3,590,828) - 1,556,270 Counterparty D 1,295,960 (56,472) - 1,239,488 Counterparty E 91,745 (83,187) - 8,558 Counterparty I 536,563 - - 536,563 Total $ 7,792,414 $ (3,980,108) $ - $ 3,812,306 (1) Derivative assets exclude futures of $981,994, call options of $39,542 and put options of $8,733,063, which are not subject to master netting arrangements. Gross derivative liabilities(1) Gross derivative assets subject to master netting arrangements Cash collateral posted that could be offset Net amounts Counterparty A $ 249,621 $ (249,621) $ - $ - Counterparty C 3,590,828 (3,590,828) - - Counterparty D 56,472 (56,472) - - Counterparty E 83,187 (83,187) - - Counterparty F 306,008 - (306,008) - Total $ 4,286,116 $ (3,980,108) $ (306,008) $ - (1) Derivative liabilities exclude call options of $1,178,650 and put options of $6,977,875, which are not subject to master netting arrangements.
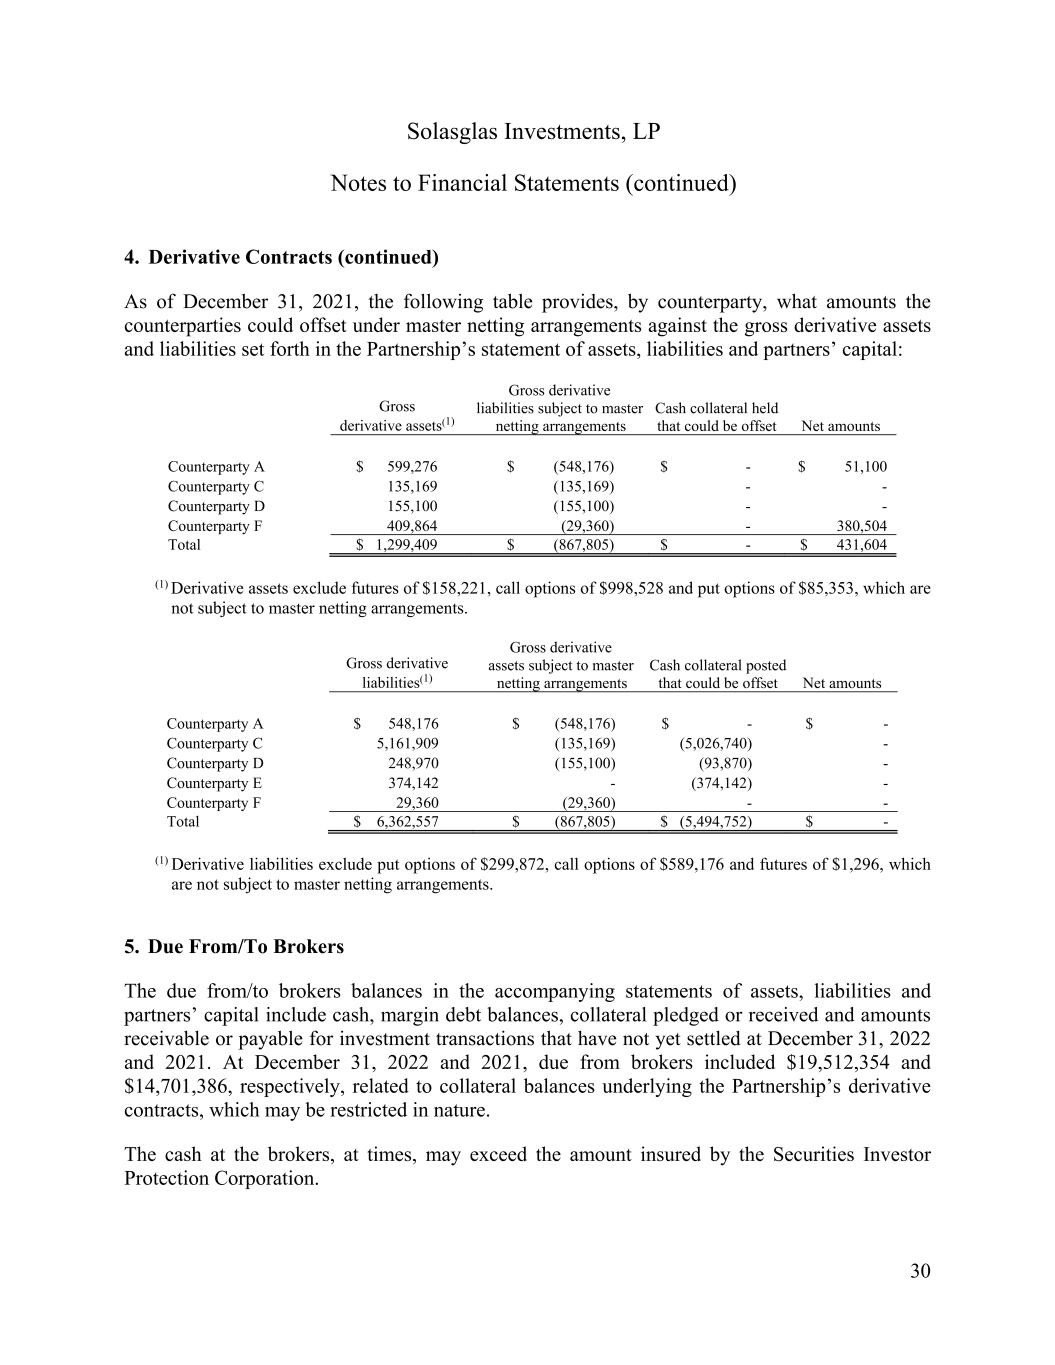
Solasglas Investments, LP Notes to Financial Statements (continued) 30 4. Derivative Contracts (continued) As of December 31, 2021, the following table provides, by counterparty, what amounts the counterparties could offset under master netting arrangements against the gross derivative assets and liabilities set forth in the Partnership’s statement of assets, liabilities and partners’ capital: Gross derivative assets(1) Gross derivative liabilities subject to master netting arrangements Cash collateral held that could be offset Net amounts Counterparty A $ 599,276 $ (548,176) $ - $ 51,100 Counterparty C 135,169 (135,169) - - Counterparty D 155,100 (155,100) - - Counterparty F 409,864 (29,360) - 380,504 Total $ 1,299,409 $ (867,805) $ - $ 431,604 (1) Derivative assets exclude futures of $158,221, call options of $998,528 and put options of $85,353, which are not subject to master netting arrangements. Gross derivative liabilities(1) Gross derivative assets subject to master netting arrangements Cash collateral posted that could be offset Net amounts Counterparty A $ 548,176 $ (548,176) $ - $ - Counterparty C 5,161,909 (135,169) (5,026,740) - Counterparty D 248,970 (155,100) (93,870) - Counterparty E 374,142 - (374,142) - Counterparty F 29,360 (29,360) - - Total $ 6,362,557 $ (867,805) $ (5,494,752) $ - (1) Derivative liabilities exclude put options of $299,872, call options of $589,176 and futures of $1,296, which are not subject to master netting arrangements. 5. Due From/To Brokers The due from/to brokers balances in the accompanying statements of assets, liabilities and partners’ capital include cash, margin debt balances, collateral pledged or received and amounts receivable or payable for investment transactions that have not yet settled at December 31, 2022 and 2021. At December 31, 2022 and 2021, due from brokers included $19,512,354 and $14,701,386, respectively, related to collateral balances underlying the Partnership’s derivative contracts, which may be restricted in nature. The cash at the brokers, at times, may exceed the amount insured by the Securities Investor Protection Corporation.
Solasglas Investments, LP Notes to Financial Statements (continued) 31 6. Partnership Terms and Related Party Transactions Management Fees The Partnership pays the Manager, an affiliate of the general partner, a monthly management fee in advance equal to 0.125% (1.5% per annum) of each limited partner’s Investment Portfolio, in accordance with the Partnership Agreement (the “Agreement”). The Investment Portfolio is equal to the product of a limited partner’s capital account at the beginning of each month multiplied by a ratio agreed upon by the Partners in accordance with the Agreement. Allocation of Income (Loss) and Performance Allocation The Agreement specifies that the net increase or decrease in partners’ capital resulting from operations for each fiscal period shall be allocated to the partners in proportion to the ratio of each partner’s capital account to the sum of all capital accounts with the exception of net income or loss on security transactions deemed new issues (“New Issues”) as defined by the Financial Industry Regulatory Authority, Inc. (“FINRA”). The net increase on New Issues is allocated to the Partners based on each partner’s eligibility to participate in New Issues. The Agreement also specifies that any investment may, from time to time, be deemed a Designated Security by the Manager. The net increase or decrease on Designated Securities will be allocated as deemed appropriate by the Manager. At the end of each calendar year, 20% of the net increase in partners’ capital resulting from operations (subject to a reduction to 10% for an amount equal to any carryforward loss as specified in the Agreement) is reallocated to the capital account of the general partner from the capital account of each limited partner as a performance allocation. Withdrawal Policy The Limited Partners may withdraw all or part of their capital account with a three day notice period, subject to the terms and restrictions set forth in the Agreement. The general partner shall give ten days’ written notice to the Limited Partners prior to making a withdrawal that would cause its capital account to be less than ten percent of the aggregate capital accounts of all partners. Contribution Policy The Limited Partners may contribute capital to the Partnership in accordance with the Agreement. From time to time, the general partner may contribute additional capital to ensure that its capital account balance is at least ten percent of the aggregate capital account balances of all partners.

Solasglas Investments, LP Notes to Financial Statements (continued) 32 6. Partnership Terms and Related Party Transactions (continued) Other Related Party Transactions The President of the Manager serves as the chairman of the board of directors of Green Brick Partners, Inc. The Partnership is responsible for the payment of its own operating and other expenses. For operational efficiency, an affiliate of the Manager may act as a common pay agent and pay for some of these expenses on behalf of the Partnership and will subsequently be reimbursed. There was no such liability on December 31, 2022 or 2021. 7. Risks In the normal course of business, the performance of any investment is subject to numerous factors which are not predictable by or within the control of the Partnership. Such factors include a wide range of economic, political, competitive and other conditions that may affect investments in general or specific industries or companies. These investments may include investments sold short, commodities, options, swaps and other derivative contracts. The Partnership’s investment objective necessarily subjects the Partnership to various significant risks, both on and off balance sheet, including those that follow. The following summary is not intended to be a comprehensive summary of all risks relating to the operations and investment activities that the Partnership is exposed to. Market Risk Market risk represents the potential loss that can be caused by a change in the fair value of an investment. The Partnership’s exposure to market risk may be due to many factors, including the movement in interest rates, foreign exchange rates, indices, market volatility, and commodity and security values underlying its investments. Lack of Valuation Data; Limited Liquidity of Investments The Partnership may invest in securities and other assets which are subject to legal or other restrictions on transfer or for which no liquid market exists. The market prices for such investments tend to be volatile and may not be readily ascertainable, and the Partnership may not be able to sell such investments when the Partnership desires to do so or to realize what the Partnership perceives to be the fair value of such investments in the event of a sale. The Partnership may not be able to readily dispose of such illiquid investments and, in some cases, may be contractually prohibited from disposing of such investments for a specified period of time. Restricted securities may sell at a price lower than similar securities that are not subject to restrictions on resale.

Solasglas Investments, LP Notes to Financial Statements (continued) 33 7. Risks (continued) Potential Concentration of Investments The Partnership seeks to maintain a diversified portfolio. Although the Manager expects to spread the Partnership’s capital among a number of investments, it may depart from such policy from time to time and may hold a few, relatively large positions in relation to the Partnership’s capital (subject to the investment guidelines per the Agreement). Since the Partnership’s portfolio is not necessarily widely diversified, the net assets of the Partnership may be subject to more rapid changes in value than would be the case if the Partnership maintained a more diversified investment portfolio. Investments in Foreign Securities Investments in foreign securities involve certain risks not typically associated with investing in U.S. securities, such as risks relating to (a) currency exchange matters between the U.S. dollar and the various foreign currencies in which the Partnership’s portfolio securities will be denominated and costs associated with conversion of investment principal and income from one currency into another, (b) differences between the U.S. and foreign securities markets, (c) political, social or economic instability, and (d) certain tax-related risks including, without limitation, uncertainties in the application of tax laws by non-U.S. jurisdictions, the imposition of withholding and other taxes on dividends, interest, capital gains or other income. Investments Sold Short Short sales require the Partnership to borrow a security that it does not own. If the price of a security sold short increases, the Partnership may have to provide additional collateral to maintain the short position. This could require the Partnership to increase the amount of the Partnership’s leverage or sell other portfolio investments to provide such additional collateral. Also, the lender of the securities sold short can request their return. Under adverse market conditions, the Partnership might not be able to purchase securities to meet the delivery requirement or may not be able to borrow securities from other lenders. In such an event, the Partnership may be subject to a mandatory close-out of the short position, which could result in unintended costs and losses. It may not be possible to borrow securities when the Manager wishes to make a short sale, particularly in illiquid markets. Traditional lenders of securities might be less likely to lend securities under certain market conditions. As a result, the Partnership may not be able to effectively pursue a short selling strategy due to a limited supply of securities available for borrowing. In addition, regulatory authorities may impose restrictions and prohibitions on short selling activities that could adversely affect the Partnership’s ability to engage in short sales or borrow certain securities in connection with short sales.
Solasglas Investments, LP Notes to Financial Statements (continued) 34 7. Risks (continued) Leverage As part of the Partnership’s investment strategy (subject to the investment guidelines per the Agreement) and subject to applicable margin and other limitations, the Partnership may borrow funds from its counterparties in order to make additional investments and thereby increase both the possibility of gain and risk of loss. Consequently, the effect of fluctuations in the market value of the Partnership’s portfolio would be amplified. In addition, the Partnership could potentially create leverage via the use of instruments such as options, swaps and other derivative contracts. Credit Risk Although the Partnership intends to enter into transactions only with counterparties that the Manager believes to be creditworthy, there can be no assurance that a counterparty will not default and that the Partnership will not sustain a loss on a transaction as a result. If an obligor (such as the issuer or a party offering credit enhancement) for an investment held by the Partnership, a counterparty to a derivative contract with the Partnership, or a prime broker or other service provider to the Partnership, fails to pay, otherwise defaults or is perceived to be less creditworthy, a security’s credit rating is downgraded or the credit quality or value of any underlying assets declines, the value of such investment could decline. In addition, the Partnership may incur expenses to protect the Partnership’s interests in securities experiencing these events. Counterparty Risk The Partnership has relationships that provide prime brokerage, derivative intermediation and financing services that permit the Partnership to trade in a variety of markets and asset classes as well as custody its cash, investments and derivatives. However, there can be no assurance that the Partnership will be able to maintain such relationships. An inability to maintain such relationships could limit the Partnership’s trading activities, create losses, preclude the Partnership from engaging in certain transactions or prevent the Partnership from trading at optimal rates and terms. The assets of the Partnership will generally be held in accounts maintained for it by its prime brokers or in accounts with other market participants, including non-U.S. sub-custodians. The accounts generally will not be segregated, bankruptcy-remote accounts titled in the Partnership’s name and, therefore, a failure of any broker or market participant is likely to have a greater adverse impact than if the assets, or the accounts in which they are held, were registered in the name of the Partnership. In addition, because the Partnership’s investments generally will be held in margin accounts, and the prime brokers will have the ability to lend those securities to other market participants, the Partnership’s ability to recover all of its assets in the context of a bankruptcy or other failure of a prime broker may be further limited.
Solasglas Investments, LP Notes to Financial Statements (continued) 35 7. Risks (continued) Counterparty Risk (continued) Many of the markets in which the Partnership will effect transactions are not exchange-based. The stability and liquidity of OTC transactions will depend in large part on the creditworthiness of the parties to the transactions. OTC transactions could expose the Partnership to the risk that a counterparty will not settle a transaction in accordance with its terms or because of a credit or liquidity problem, causing the Partnership to suffer a loss. Such counterparty risk is accentuated where the Partnership has concentrated its transactions with a single or small group of counterparties. If a counterparty defaults, under normal circumstances the Partnership will have contractual remedies against the counterparty. However, exercising such contractual rights may involve delays or costs. Furthermore, there is a risk that a counterparty could become insolvent. In such an event, the Partnership’s ability to recover securities from such counterparty or receive payment of claims therefore may be significantly delayed and the Partnership may recover less than the full value of its securities. This is particularly true with respect to counterparties located in jurisdictions outside the United States where the application of non-U.S. insolvency laws may be subject to substantial limitations and uncertainties. Currency Risk It is expected that the Partnership’s portfolio will contain investments denominated in currencies other than the U.S. dollar. Changes in the value of other currencies against the value of the U.S. dollar could have an adverse impact on the performance of the Partnership. The Partnership may enter into currency hedging transactions, but is not required or expected to do so, and such transactions have an associated cost that could reduce investment returns. Spot and forward currency prices are highly volatile and price movements for spot and forward currency contracts may be influenced by, among other things, the foregoing risks. Commitments In the normal course of business, the Partnership enters into contracts that contain a variety of representations and warranties and which provide general indemnifications. The Partnership’s maximum exposure under these arrangements is unknown, as this would involve future claims against the Partnership that have not yet occurred. However, the Partnership has not had prior claims or losses pursuant to these contracts and expects the risk of loss to be remote. At December 31, 2022 and 2021, the Partnership is committed to invest up to $6,185,568, and $6,364,159, respectively, of additional capital in various investments.
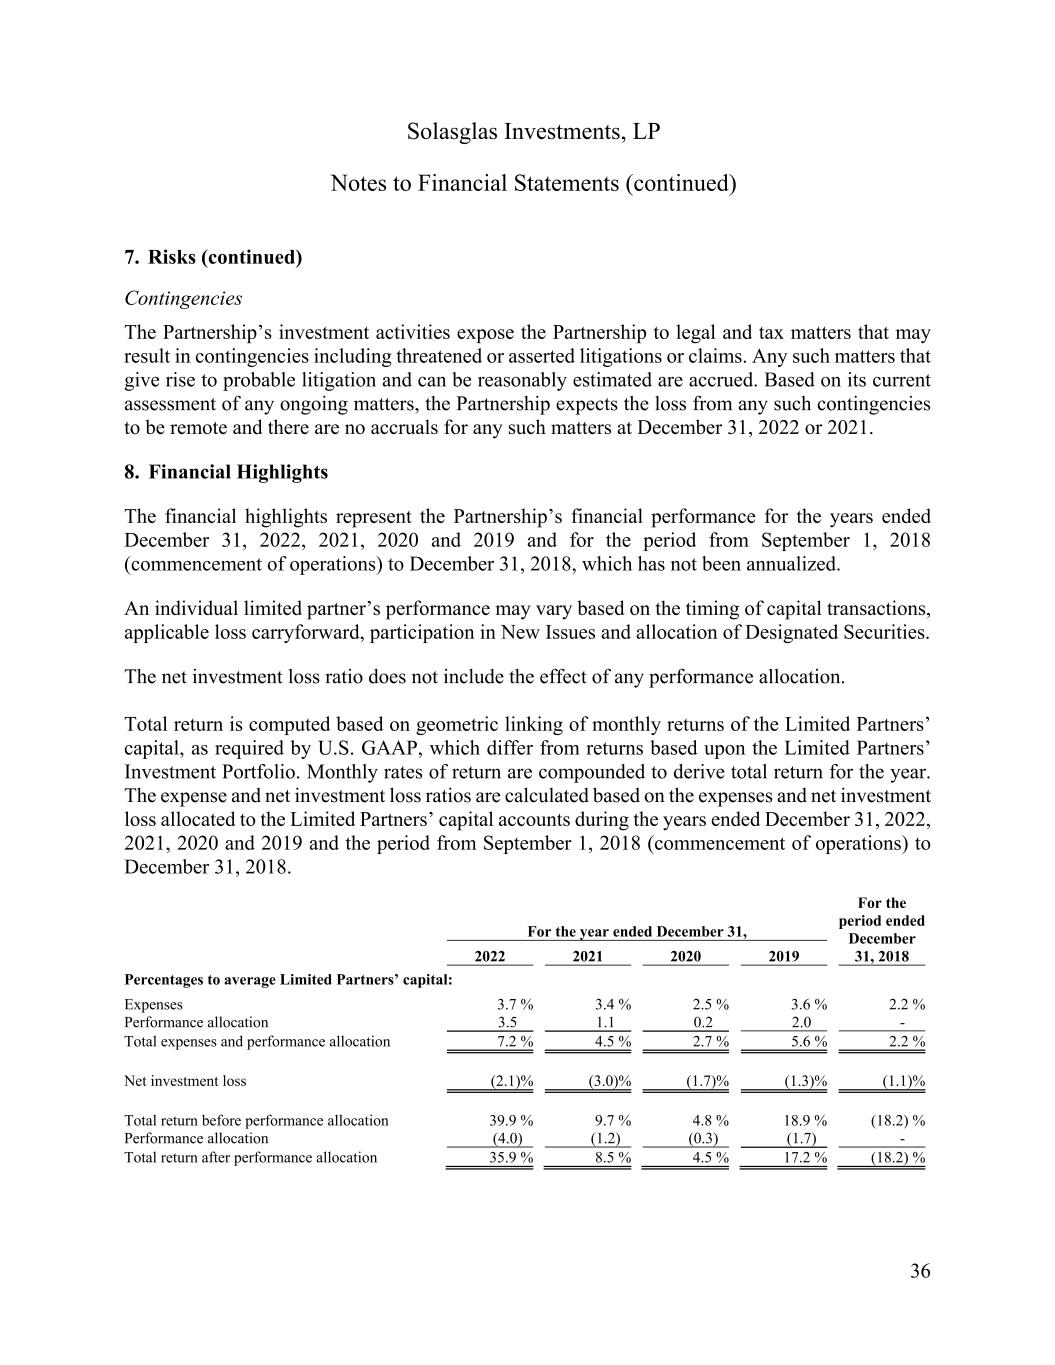
Solasglas Investments, LP Notes to Financial Statements (continued) 36 7. Risks (continued) Contingencies The Partnership’s investment activities expose the Partnership to legal and tax matters that may result in contingencies including threatened or asserted litigations or claims. Any such matters that give rise to probable litigation and can be reasonably estimated are accrued. Based on its current assessment of any ongoing matters, the Partnership expects the loss from any such contingencies to be remote and there are no accruals for any such matters at December 31, 2022 or 2021. 8. Financial Highlights The financial highlights represent the Partnership’s financial performance for the years ended December 31, 2022, 2021, 2020 and 2019 and for the period from September 1, 2018 (commencement of operations) to December 31, 2018, which has not been annualized. An individual limited partner’s performance may vary based on the timing of capital transactions, applicable loss carryforward, participation in New Issues and allocation of Designated Securities. The net investment loss ratio does not include the effect of any performance allocation. Total return is computed based on geometric linking of monthly returns of the Limited Partners’ capital, as required by U.S. GAAP, which differ from returns based upon the Limited Partners’ Investment Portfolio. Monthly rates of return are compounded to derive total return for the year. The expense and net investment loss ratios are calculated based on the expenses and net investment loss allocated to the Limited Partners’ capital accounts during the years ended December 31, 2022, 2021, 2020 and 2019 and the period from September 1, 2018 (commencement of operations) to December 31, 2018. For the year ended December 31, For the period ended December 31, 2018 2022 2021 2020 2019 Percentages to average Limited Partners’ capital: Expenses 3.7 % 3.4 % 2.5 % 3.6 % 2.2 % Performance allocation 3.5 1.1 0.2 2.0 - Total expenses and performance allocation 7.2 % 4.5 % 2.7 % 5.6 % 2.2 % Net investment loss (2.1)% (3.0)% (1.7)% (1.3)% (1.1)% Total return before performance allocation 39.9 % 9.7 % 4.8 % 18.9 % (18.2) % Performance allocation (4.0) (1.2) (0.3) (1.7) - Total return after performance allocation 35.9 % 8.5 % 4.5 % 17.2 % (18.2) %
Solasglas Investments, LP Notes to Financial Statements (continued) 37 9. Subsequent Events Subsequent events have been evaluated by the Manager from January 1, 2023 through March 8, 2023, the date the financial statements were available to be issued. The Manager has determined that there are no material events that would require disclosure in the Partnership’s financial statements.


