UNITED STATES
SECURITIES AND EXCHANGE COMMISSION
Washington, D.C. 20549
FORM N-CSR
CERTIFIED SHAREHOLDER REPORT OF REGISTERED
MANAGEMENT INVESTMENT COMPANIES
| | |
Investment Company Act file number | | 811-22003 |
Nuveen Core Equity Alpha Fund
(Exact name of registrant as specified in charter)
Nuveen Investments
333 West Wacker Drive
Chicago, IL 60606
(Address of principal executive offices) (Zip code)
Gifford R. Zimmerman
Nuveen Investments
333 West Wacker Drive
Chicago, IL 60606
(Name and address of agent for service)
Registrant’s telephone number, including area code: (312) 917-7700
Date of fiscal year end: December 31
Date of reporting period: December 31, 2019
Form N-CSR is to be used by management investment companies to file reports with the Commission not later than 10 days after the transmission to stockholders of any report that is required to be transmitted to stockholders under Rule 30e-1 under the Investment Company Act of 1940 (17 CFR 270.30e-1). The Commission may use the information provided on Form N-CSR in its regulatory, disclosure review, inspection, and policymaking roles.
A registrant is required to disclose the information specified by Form N-CSR, and the Commission will make this information public. A registrant is not required to respond to the collection of information contained in Form N-CSR unless the Form displays a currently valid Office of Management and Budget (“OMB”) control number. Please direct comments concerning the accuracy of the information collection burden estimate and any suggestions for reducing the burden to Secretary, Securities and Exchange Commission, 450 Fifth Street, NW, Washington, DC 20549-0609. The OMB has reviewed this collection of information under the clearance requirements of 44 U.S.C. ss. 3507.
ITEM 1. REPORTS TO STOCKHOLDERS.

Closed-End Funds
31 December 2019
Nuveen
Closed-End Funds
| | |
| JCE | | Nuveen Core Equity Alpha Fund |
Beginning on January 1, 2021, as permitted by regulations adopted by the Securities and Exchange Commission, paper copies of the Fund’s annual and semi-annual shareholder reports will no longer be sent by mail, unless you specifically request paper copies of the reports. Instead, the reports will be made available on the Fund’s website (www.nuveen.com), and you will be notified by mail each time a report is posted and provided with a website link to access the report.
If you have already elected to receive shareholder reports electronically, you will not be affected by this change and you need not take any action. You may elect to receive shareholder reports and other communications from the Fund electronically anytime by contacting the financial intermediary (such as a broker-dealer or bank) through which you hold your Fund shares or, if you are a direct investor, by enrolling at www.nuveen.com/e-reports.
You may elect to receive all future shareholder reports in paper free of charge at any time by contacting your financial intermediary or, if you are a direct investor, (i) by calling 800-257-8787 and selecting option #2 or (ii) by logging into your Investor Center account at www.computershare.com/investor and clicking on “Communication Preferences.” Your election to receive reports in paper will apply to all funds held in your account with your financial intermediary or, if you are a direct investor, to all your directly held Nuveen Funds and any other directly held funds within the same group of related investment companies.
Annual Report
IMPORTANT DISTRIBUTION NOTICE
for Shareholders of the Nuveen Core Equity Alpha Fund (JCE)
Annual Shareholder Report for the period ending December 31, 2019
The Nuveen Core Equity Alpha Fund (JCE) seeks to offer attractive cash flow to its shareholders, by converting the expected long-term total return potential of the Fund’s portfolio of investments into regular quarterly distributions. Following is a discussion of the Managed Distribution Policy the Fund uses to achieve this.
The Fund pays quarterly common share distributions that seek to convert the Fund’s expected long-term total return potential into regular cash flow. As a result, the Fund’s regular common share distributions (presently $0.2500 per share, respectively) may be derived from a variety of sources, including:
| | • | | net investment income consisting of regular interest and dividends, |
| | • | | realized capital gains or, |
| | • | | possibly, returns of capital representing in certain cases unrealized capital appreciation. |
Such distributions are sometimes referred to as “managed distributions.” The Fund seeks to establish a distribution rate that roughly corresponds to the Adviser’s projections of the total return that could reasonably be expected to be generated by the Fund over an extended period of time. The Adviser may consider many factors when making such projections, including, but not limited to, long-term historical returns for the asset classes in which the Fund invests. As portfolio and market conditions change, the distribution amount and distribution rate on the Common Shares under the Fund’s Managed Distribution Policy could change.
When it pays a distribution, the Fund provides holders of its Common Shares a notice of the estimated sources of the Fund’s distributions (i.e., what percentage of the distributions is estimated to constitute ordinary income, short-term capital gains, long-term capital gains, and/or a non-taxable return of capital) on a year-to-date basis. It does this by posting the notice on its website (www.nuveen.com/cef), and by sending it in written form.
You should not draw any conclusions about the Fund’s investment performance from the amount of this distribution or from the terms of the Fund’s Managed Distribution Policy. The Fund’s actual financial performance will likely vary from month-to-month and from year-to-year, and there may be extended periods when the distribution rate will exceed the Fund’s actual total returns. The Managed Distribution Policy provides that the Board may amend or terminate the Policy at any time without prior notice to Fund shareholders. There are presently no reasonably foreseeable circumstances that might cause the Fund to terminate its Managed Distribution Policy.
Table of Contents
3
Chair’s Letter to Shareholders

Dear Shareholders,
Financial markets finished 2019 on a high note, despite the challenges of a weak start to the year, a slower global economy and heightened geopolitical risks. While global manufacturing languished, consumers remained resilient amid tight labor markets, growing wages and tame inflation. Global business sentiment, however, was less optimistic due to trade frictions and weaker global demand. Across advanced economies growth in corporate profits and earnings was subdued in 2019. Nevertheless, the Federal Reserve’s (Fed) pivot to easing monetary conditions, along with liquidity provided by other central banks around the world, provided confidence that the economic cycle could be extended. Additionally, the year ended with a reduction in trade tensions and Brexit uncertainty, although the next phase of U.S.-China trade negotiations are expected to be more challenging and the U.K. has a relatively short transition window in which to redefine its relationship with the European Union.
We continue to anticipate muted economic growth and increased market volatility this year. The U.S. economy held steady in the second half of 2019, although growth for the year overall moderated from 2018’s pace. Consumer confidence remains underpinned by low unemployment and modest wage growth. Looser financial conditions, in part driven by the Fed’s three interest rate cuts in 2019, have revived momentum in the housing market and should continue to encourage borrowing by consumers and businesses. Although consumer spending in Europe and Japan, like in the U.S., has remained supported by jobs growth and rising wages, economic growth there appears more fragile. The COVID-19 coronavirus outbreak poses a new downside risk to the global economy, as disruptions to both demand and production ripple through global supply chains. We are closely monitoring the situation.
At Nuveen, we still see investment opportunities in the maturing economic environment, but we are taking a selective approach. If you’re concerned about where the markets are headed from here, we encourage you to work with your financial advisor to review your time horizon, risk tolerance and investment goals. On behalf of the other members of the Nuveen Fund Board, we look forward to continuing to earn your trust in the months and years ahead.
Sincerely,

Terence J. Toth
Chair of the Board
February 21, 2020
4
Portfolio Managers’ Comments
Nuveen Core Equity Alpha Fund (JCE)
The equity portion of the Fund is managed by Intech Investment Management LLC (Intech), an independently managed subsidiary of Janus Henderson Group plc. The portfolio management team is composed of Dr. Adrian Banner, CEO/CIO, and Vassilios Papathanakos, PhD.
The Fund also employs a call option strategy managed by Nuveen Asset Management, LLC (NAM), an affiliate of Nuveen Fund Advisors, LLC, the Fund’s investment adviser. David A. Friar and Jody I. Hrazanek oversee this program.
Effective February 28, 2019, Joseph W. Runnels, CFA is no longer a portfolio manager of the Fund.
Here the Intech team members, along with the NAM team, discuss economic and financial markets, their management strategies and the performance of the Fund for the twelve-month reporting period ended December 31, 2019.
What factors affected the U.S. economy and financial markets during the twelve-month reporting period ended December 31, 2019?
The U.S. economy reached the tenth year of expansion since the previous recession ended in June 2009, marking the longest expansion in U.S. history. In the fourth quarter of 2019, gross domestic product (GDP) grew at an annualized rate of 2.1%, according to the “advance” estimate by the Bureau of Economic Analysis. GDP measures the value of goods and services produced by the nation’s economy less the value of the goods and services used up in production, adjusted for price changes. In the final months of the year, the economy was boosted by moderate consumer spending, along with positive contributions from government spending and trade, which offset weakness in business investment. For 2019 as a whole, U.S. GDP grew 2.3%, a decline from 2.9% in 2018 and the slowest pace since 2016.
Consumer spending, the largest driver of the economy, remained well supported by low unemployment, wage gains and tax cuts. As reported by the Bureau of Labor Statistics, the unemployment rate fell to 3.5% in December 2019 from 3.9% in December 2018 and job gains averaged around 176,000 per month for the past twelve months. As the jobs market has tightened, average hourly earnings grew at an annualized rate of 2.9% in December 2019. However, inflation remained subdued. The Bureau of Labor Statistics said the Consumer Price Index (CPI) increased 2.3% over the twelve-month reporting period ended December 31, 2019 before seasonal adjustment.
Low mortgage rates and low inventory drove home prices moderately higher in this reporting period, despite declining new home sales and housing starts. The S&P CoreLogic Case-Shiller U.S. National Home Price Index, which covers all nine U.S. census divisions, was up 3.5% year-over-year in November 2019 (most recent data available at the time this report was prepared). The10-City and20-City Composites reported year-over-year increases of 2.0% and 2.6%, respectively.
This material is not intended to be a recommendation or investment advice, does not constitute a solicitation to buy, sell or hold a security or an investment strategy and is not provided in a fiduciary capacity. The information provided does not take into account the specific objectives or circumstances of any particular investor, or suggest any specific course of action. Investment decisions should be made based on an investor’s objectives and circumstances and in consultation with his or her advisors.
Certain statements in this report are forward-looking statements. Discussions of specific investments are for illustration only and are not intended as recommendations of individual investments. The forward-looking statements and other views expressed herein are those of the portfolio managers as of the date of this report. Actual future results or occurrences may differ significantly from those anticipated in any forward-looking statements and the views expressed herein are subject to change at any time, due to numerous market and other factors. The Fund disclaims any obligation to update publicly or revise any forward-looking statements or views expressed herein.
Refer to the Glossary of Terms Used in this report for further definition of the terms used within this section.
5
Portfolio Managers’ Comments(continued)
As data pointed to slower momentum in the overall economy, the Federal Reserve (Fed) notably shifted its stance. Although the Fed had indicated in December 2018 that there could be two more rate hikes in 2019, global growth concerns kept the central bank on the sidelines. As expected by the markets, the Fed left rates unchanged throughout the first half of 2019 while speculation increased that the Fed’s next move would be a rate cut. At the July 2019, September 2019 and October 2019 policy committee meetings, the Fed announced a 0.25% cut to its main policy rate. Markets registered disappointment with the Fed’s explanation that the rate cuts were a“mid-cycle adjustment,” rather than a prolonged easing period, and its signal that there would be no additional rate cuts in 2019. Also in the latter half of 2019, the Fed announced it would stop shrinking its bond portfolio sooner than scheduled, as well as began buying short-term Treasury bills to help money markets operate smoothly and maintain short-term borrowing rates at low levels. Fed Chairman Powell emphasized that the Treasury bill purchases were not a form of quantitative easing.
During the twelve-month reporting period, geopolitical news remained a prominent market driver. Tariff and trade policy topped the list of concerns, most prominently the U.S.-China relations. After several rounds of talks, escalating rhetoric from both sides and a series of tariff increases, tensions appeared to ease in the later months of 2019. The U.S. and China signaled their agreement on a partial trade deal, which included rolling back some tariffs, increasing China’s purchases of U.S. agriculture products and the consideration of intellectual property, technology and financial services rights. (Subsequent to the close of the reporting period, the “phase one” deal was signed on January 15, 2020.) While much of the focus remained on the U.S.-China relationship, trade spats between the U.S. and Mexico, the European Union, Brazil and Argentina also arose throughout the period. More than a year after the three countries signed onto the U.S., Mexico and Canada Agreement (USMCA) trade deal, which replaces the North American Free Trade Agreement, the U.S. House of Representatives approved the deal in December 2019 (and, subsequent to the close of the reporting period, the Senate voted in January 2020 to approve it). Global manufacturing and export data continued to show evidence of trade-related slumps, which increased worries that the slowdown would spread into other segments of the global economy.
The Brexit saga also appeared to make a breakthrough by the end of 2019. After former Prime Minister Theresa May was unable to secure a Brexit deal by the original March 29, 2019 deadline, she resigned as of June 7, 2019. When her successor, Boris Johnson, failed to meet the EU’s first deadline extension of October 31, 2019, the EU approved a “flextension” to January 31, 2020. A U.K. general election was scheduled for December 2019, wherein the Conservative Party won a large majority and bolstered Prime Minister Johnson’s mandate to get Brexit done. A few days later, the British Parliament passed the Brexit Bill. In Italy, investors worried about another potential budget clash between the eurosceptic coalition government and the EU. However, following the unexpected resignation of the prime minister in August 2019, the newly formed coalition government appeared to take a less antagonistic stance. Europe also contended with the “yellow vest” protests in France, immigration policy concerns, Russian sanctions and political risk in Turkey.
Elsewhere, anti-government protests erupted across Latin America, Hong Kong and Lebanon during 2019, and Venezuela’s economic and political crisis deepened. In Argentina, markets were shocked by the defeat of incumbent President Macri, prompting concerns about the economic policies favored by the incoming Fernandez administration. Brazil’s Bolsonaro administration achieved a legislative win on pension reform and kept the economy on a path of modest growth. Europe’s traditional centrist parties lost seats in the May 2019 Parliamentary elections and populist parties saw marginal gains. The ruling parties in India and South Africa maintained their majorities, where slower economic growth could complicate their respective reform mandates.
The S&P 500® Index returned 31.49% in 2019, as strong returns in the first and fourth quarters helped deliver its best annual return since 2013 and an annual return of over 30% for just the fifth time in the last three decades.
6
How did the Fund perform during this twelve-month reporting period ended December 31, 2019?
The table in the Performance Overview and Holding Summaries section of this report provides total returns for theone-year, five-year andten-year periods ended December 31, 2109. The Fund’s total returns at net asset value (NAV) are compared with the performance of a corresponding market index. For the twelve-month reporting period ended December 31, 2019 the Fund underperformed the S&P 500® Index, but outperformed the Blended Index.
What key strategies were used to manage the Fund during this twelve-month reporting period ended December 31, 2019?
The investment objective of the Fund is to provide an attractive level of total return, primarily through long-term capital appreciation and secondarily through income and gains. The Fund invests in a portfolio of common stocks selected from the stocks comprising the S&P 500® Index, using a proprietary mathematical process designed by Intech and also employs risk reduction techniques. Typically, the Fund’s equity portfolio will hold 150 – 450 stocks included in the S&P 500® Index.
The Fund also employs an option strategy that seeks to enhance the Fund’s risk-adjusted performance over time by means of attempting to reduce volatility of the Fund’s returns relative to the returns of the S&P 500® Index. The Fund expects to write (sell) call options on a custom basket of equities with a notional value of up to 50% of the value of the equity portfolio. The goal of the Fund’s equity portfolio is to produce long-term returns in excess of the S&P 500® Index with an equal or lesser amount of risk.
Intech uses a purely portfolio-theoretic methodology, and does not specifically select stocks or overweight sectors in response to market conditions or expectations. Instead, they modify the Fund’s equity holdings in an attempt to construct a portfolio that is slightly more efficient than the S&P 500® Index, by using an optimization program that analyzes a stock’s relative volatility and its return correlation with other equities. Effectively, the investment process tends to favor stocks with higher relative volatility and lower correlation as they offer more potential to capture volatility through regular rebalancing. Intech’s investment process doesn’t select stocks based on their potential for future performance, but combines securities based on how their stock prices move relative to the index in order to increase the potential for trading profits at time of rebalancing.
The strategy generated a positive trading profit during the year and benefited from a favorable positioning within the energy sector. From a stock specific standpoint, an overweight to TransDigm Group Inc, Intuitive Surgical Inc and Advanced Micro Devices Inc, which performed strongly, were among the positive contributors during the reporting period.
The portfolio faced headwinds from its positioning in the smaller names and adverse sector positioning relative to the S&P 500® Index during the reporting period. Specifically, average underweights to some strong performing mega cap technology-oriented names, including Apple Inc, Microsoft Corp, Amazon.com, Facebook and Alphabet, were among the biggest detractors during the reporting period. Additionally, an underweight to a few strongly performingmega-cap banks also detracted from performance, including JPMorgan Chase & Co. and Bank of America. The portfolio has eliminated its holdings in Amazon, Facebook, Alphabet, JPMorgan Chase & Co. and Bank of America.
As mentioned previously, the Fund also wrote call options with average expirations between 30 and 90 days. This was done in an effort to enhance returns, although it meant the Fund did relinquish some of the upside potential of its equity portfolio. During the reporting period, stock market volatility as measured by the Chicago Board Options Exchange (Cboe) Volatility Index® (the ”VIX®”) ended the reporting period at 13.78. The VIX®’s year-over- year decline was one of largest in history. As a result, the Fund maintained an overwrite percentage during most of the reporting period averaging around 34%. NAM utilized Russell 2000® Index options. Unlike other indexes, the Russell 2000® Index had periods of flat performance throughout the reporting period. While, NAM was able to collect more premium income as it was a favorable environment for writing options on the Russell 2000® Index, the strategy detracted from performance.
7
Common Share Information
DISTRIBUTION INFORMATION
The following 19(a) Notice presents the Fund’s most current distribution information as of November 30, 2019 as required by certain exempted regulatory relief the Fund has received.
Because the ultimate tax character of your distributions depends on the Fund’s performance for its entire fiscal year (which is the calendar year for the Fund) as well as certain fiscal year-end (FYE) tax adjustments, estimated distribution source information you receive with each distribution may differ from the tax information reported to you on your Fund’s IRS Form 1099 statement.
DISTRIBUTION INFORMATION – AS OF NOVEMBER 30, 2019
This notice provides shareholders with information regarding fund distributions, as required by current securities laws. You should not draw any conclusions about the Fund’s investment performance from the amount of this distribution or from the terms of the Fund’s Managed Distribution Policy.
The Fund may in certain periods distribute more than its income and net realized capital gains, and the Fund currently estimates that it has done so for the fiscal year-to-date period. In such instances, a portion of the distribution may be a return of capital. A return of capital may occur, for example, when some or all of the money that you invested in the Fund is paid back to you. A return of capital distribution does not necessarily reflect the Fund’s investment performance and should not be confused with “yield” or “income.”
The amounts and sources of distributions set forth below are only estimates and are not being provided for tax reporting purposes. The actual amounts and sources of the amounts for tax reporting purposes will depend upon the Fund’s investment experience during the remainder of its fiscal year and may be subject to changes based on tax regulations. The Fund will send you a Form 1099-DIV for the calendar year that will tell you how to report these distributions for federal income tax purposes. More details about the Fund’s distributions and the basis for these estimates are available on www.nuveen.com/cef.
The following table provides estimates of the Fund’s distribution sources, reflecting year-to-date cumulative experience through the latest month-end. The Fund attributes these estimates equally to each regular distribution throughout the year. Consequently, the estimated information shown below is for the current distribution, and also represents an updated estimate for all prior months in the year.
8
Data as of November 30, 2019
| | | | | | | | | | | | | | | | | | | | | | | | | | | | | | | | | | | | |
| | | | | | Estimated Per Share Sources of Distribution1 | | | Estimated Percentage of the Distribution1 | |
| JCE (FYE 12/31) | | Per Share
Distribution | | | Net
Investment
Income | | | Long-Term
Gains | | | Short-Term
Gains | | | Return of
Capital | | | Net
Investment
Income | | | Long-Term
Gains | | | Short-Term
Gains | | | Return of
Capital | |
Current Quarter | | $ | 0.2500 | | | $ | 0.0218 | | | $ | 0.0365 | | | $ | 0.0000 | | | $ | 0.1917 | | | | 8.70 | % | | | 14.60 | % | | | 0.00 | % | | | 76.70 | % |
Fiscal YTD | | $ | 1.0000 | | | $ | 0.0872 | | | $ | 0.1459 | | | $ | 0.0000 | | | $ | 0.7669 | | | | 8.70 | % | | | 14.60 | % | | | 0.00 | % | | | 76.70 | % |
| 1 | Net investment income (NII) is a projection through the end of the current calendar quarter using actual data through the stated month-end date above. Capital gain amounts are as of the stated date above. The estimated per share sources above include an allocation of the NII based on prior year attributions which can be expected to differ from the actual final attributions for the current year. |
The following table provides information regarding JCE’s distributions and total return performance over various time periods. This information is intended to help you better understand whether returns for the specified time periods were sufficient to meet distributions.
Data as of November 30, 2019
| | | | | | | | | | | | | | | | | | | | | | | | | | | | |
| | | | | | | | | | | | Annualized | | | Cumulative | |
JCE (FYE 12/31) Inception Date | | Quarterly
Distribution | | | Fiscal YTD Distribution | | | Net Asset Value (NAV) | | | 5-Year Return on NAV | | | Fiscal YTD Dist Rate on NAV1 | | | Fiscal YTD Return on NAV | | | Fiscal YTD Dist Rate on NAV1 | |
Mar 2007 | | $ | 0.2500 | | | $ | 1.0000 | | | $ | 14.99 | | | | 8.10 | % | | | 6.67 | % | | | 24.47 | % | | | 6.67 | % |
| 1 | As a percentage of 11/29/19 NAV. |
DISTRIBUTION INFORMATION – AS OF DECEMBER 31, 2019
The following tables provide information regarding the Fund’s common share distributions and total return performance for the fiscal year ended December 31, 2019. This information is intended to help you better understand whether the Fund’s returns for the specified time period were sufficient to meet its distributions.
Data as of December 31, 2019
| | | | | | | | | | | | | | | | | | | | | | | | | | | | | | | | | | | | |
| | | Per Share Sources of Distribution | | | Percentage of the Distribution | |
| JCE (FYE 12/31) | | Per Share
Distribution | | | Net
Investment
Income | | | Long-Term
Gains | | | Short-Term
Gains | | | Return of
Capital1 | | | Net
Investment
Income | | | Long-Term
Gains | | | Short-Term
Gains | | | Return of
Capital1 | |
Fiscal YTD | | $ | 1.0000 | | | $ | 0.0973 | | | $ | 0.5489 | | | $ | 0.0000 | | | $ | 0.3538 | | | | 9.73 | % | | | 54.89 | % | | | 0.00 | % | | | 35.38 | % |
| | | | | | | | | | | | | | | | |
| | | | | | Annualized | |
| JCE (FYE 12/31) Inception Date | | Net Asset
Value (NAV) | | | 1-Year
Return on NAV | | | 5-Year
Return on NAV | | | Fiscal YTD Dist Rate on NAV | |
Mar 2007 | | $ | 15.04 | | | | 26.96 | % | | | 8.53 | % | | | 6.65 | % |
| 1 | Return of Capital may represent unrealized gains, return of shareholder’s principal, or both. In certain circumstances, all or a portion of the return of capital may be characterized as ordinary income under federal tax law. The actual tax characterization will be provided to shareholders on Form 1099-DIV shortly after calendar year-end. |
CHANGE IN METHOD OF PUBLISHING NUVEENCLOSED-END FUND DISTRIBUTION AMOUNTS
During November 2019, the NuveenClosed-End Funds discontinued the practice of announcing Fund distribution amounts and timing via press release. Instead, information about the NuveenClosed-End Funds’ monthly and quarterly periodic distributions to shareholders are posted and can be found on Nuveen’sClosed-End Fund resource page, which is atwww.nuveen.com/closed-end-fund-distributions, along with other Nuveenclosed-end fund product updates. Shareholders can expect regular distribution information to be posted on www.nuveen.com on the first business day of each month. To ensure that our shareholders have timely access to the latest information, a subscribe function can be activated at this link here, or at this web page(www.nuveen.com/en-us/people/about-nuveen/for-the-media).
9
Common Share Information(continued)
COMMON SHARE EQUITY SHELF PROGRAM
During the current reporting period, the Fund was authorized by the Securities and Exchange Commission to issue additional common shares through an equity shelf program (“Shelf Offering”). Under this program the Fund, subject to market conditions, may raise additional capital from time to time in varying amounts and offering methods at a net price at or above the Fund’s NAV per common share. Under the Shelf Offering, the Fund was authorized to issue additional shares as shown in the accompanying table.
| | | | |
| | | JCE | |
Additional authorized common shares | | | 1,600,000 | * |
| * | Represents additional authorized common shares for the period February 25, 2019 through December 31, 2019. |
During the current reporting period, the Fund did not sell common shares through its shelf program.
Refer to the Notes to Financial Statements, Note 5 – Fund Shares, Common Shares Equity Shelf Programs and Offering Costs for further details of Shelf Offering and the Fund’s transactions.
COMMON SHARE REPURCHASES
During August 2019, the Fund’s Board of Trustees reauthorized an open-market share repurchase program, allowing the Fund to repurchase an aggregate of up to approximately 10% of its outstanding shares.
As of December 31, 2019, and since the inception of the Fund’s repurchase program, the Fund has cumulatively repurchased and retired its outstanding common shares as shown in the accompanying table.
| | | | |
| | | JCE | |
Common Shares cumulatively repurchased and retired | | | 449,800 | |
Common Shares authorized for repurchase | | | 1,605,000 | |
During the current reporting period, the Fund did not repurchase any of its outstanding common shares.
OTHER COMMON SHARE INFORMATION
As of December 31, 2019, and during the current reporting period, the Fund’s common share price was trading at a premium/(discount) to its common share NAV as shown in the accompanying table.
| | | | |
| | | JCE | |
Common Share NAV | | $ | 15.04 | |
Common Share price | | $ | 14.62 | |
Premium/(Discount) to NAV | | | (2.79 | )% |
12-month average premium/(discount) to NAV | | | (2.83 | )% |
10
Risk Considerations and Investment Policy Updates
Risk Considerations
Fund shares are not guaranteed or endorsed by any bank or other insured depository institution, and are not federally insured by the Federal Deposit Insurance Corporation.
Nuveen Core Equity Alpha Fund (JCE)
Investing in closed-end funds involves risk; principal loss is possible. There is no guarantee the Fund’s investment objectives will be achieved. Closed-end fund shares may frequently trade at a discount or premium to their net asset value.Common stock returns often have experienced significant volatility. The Fund may not participate in any appreciation of its equity portfolio as fully as it would if the Fund did not sellcall options. In addition, the Fund will continue to bear the risk of declines in the value of the equity portfolio. Becauseindex options are settled in cash, sellers of index call options, such as the Fund, cannot provide in advance for their potential settlement obligations by acquiring and holding the underlying securities. For these and other risks, includingtax risk, please see the Fund’s webpage at www.nuveen.com/JCE.
Investment Policy Updates
Change in Investment Policy
The Fund has recently adopted the following policy regarding limits to investments in illiquid securities:
While there are no such limits imposed by applicable regulations, certain NuveenClosed-End Funds formerly had investment policies that placed limits on a Fund’s ability to invest in illiquid securities. All exchange-listed Nuveen Closed-End Funds now have no formal limit on their ability to invest in such illiquid securities, but the Fund’s portfolio management team will monitor such investments in the regular, overall management of the Fund’s portfolio securities.
11
| | |
| JCE | | Nuveen Core Equity Alpha Fund Performance Overview and Holding Summaries as of December 31, 2019 |
Refer to Glossary of Terms Used in this Report for further definition of terms used within this section.
Average Annual Total Returns as of December 31, 2019
| | | | | | | | | | | | |
| | | Average Annual | |
| | | 1-Year | | | 5-Year | | | 10-Year | |
| JCE at Common Share NAV | | | 26.96% | | | | 8.53% | | | | 12.14% | |
| JCE at Common Share Price | | | 30.26% | | | | 8.46% | | | | 13.20% | |
| Blended Index1 | | | 23.38% | | | | 9.37% | | | | 10.31% | |
| S&P 500® Index | | | 31.49% | | | | 11.70% | | | | 13.56% | |
Past performance is not predictive of future results. Current performance may be higher or lower than the data shown. Returns do not reflect the deduction of taxes that shareholders may have to pay on Fund distributions or upon the sale of Fund shares. Returns at NAV are net of Fund expenses, and assume reinvestment of distributions. Comparative index return information is provided for the Fund’s shares at NAV only. Indexes are not available for direct investment.
Common Share Price Performance —Weekly Closing Price
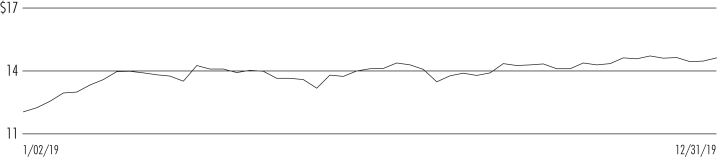
| 1 | The Blended Index consists of: 1) 50% of the S&P 500® Index and 2) 50% of the CBOE S&P 500® Buy/write Index(BXM). |
12
This data relates to the securities held in the Fund’s portfolio of investments as of the end of the reporting period. It should not be construed as a measure of performance for the Fund itself. Holdings are subject to change.
Fund Allocation
(% of net assets)
| | | | |
| Common Stocks | | | 99.8% | |
| Repurchase Agreements | | | 0.5% | |
| Other Assets Less Liabilities | | | (0.3)% | |
Net Assets | | | 100% | |
Portfolio Composition
(% of total investments)
| | | | |
| Health Care Equipment & Supplies | | | 7.4% | |
| IT Services | | | 6.9% | |
| Equity Real Estate Investment Trust | | | 5.9% | |
| Specialty Retail | | | 5.2% | |
| Oil, Gas & Consumable Fuels | | | 5.0% | |
| Software | | | 4.9% | |
| Capital Markets | | | 4.9% | |
| Insurance | | | 4.0% | |
| Health Care Providers & Services | | | 3.9% | |
| Pharmaceuticals | | | 2.8% | |
| Electric Utilities | | | 2.7% | |
| Road & Rail | | | 2.5% | |
| Multiline Retail | | | 2.5% | |
| Semiconductors & Semiconductor Equipment | | | 2.4% | |
| Media | | | 2.4% | |
| Aerospace & Defense | | | 2.2% | |
| Commercial Services & Supplies | | | 2.1% | |
| Technology Hardware, Storage & Peripherals | | | 2.0% | |
| Banks | | | 1.9% | |
| Chemicals | | | 1.8% | |
| Food Products | | | 1.8% | |
| Electronic Equipment, Instruments & Components | | | 1.8% | |
| Food & Staples Retailing | | | 1.7% | |
| Communications Equipment | | | 1.6% | |
| Other | | | 19.2% | |
| Repurchase Agreements | | | 0.5% | |
Total | | | 100% | |
Top Five Issuers
(% of total investments)
| | | | |
| Intuitive Surgical Inc | | | 2.4% | |
| CSX Corp | | | 1.8% | |
| Progressive Corp | | | 1.7% | |
| HCA Inc | | | 1.6% | |
| NextEra Energy Inc | | | 1.5% | |
13
Report of Independent Registered Public Accounting Firm
To the Board of Trustees and Shareholders of
Nuveen Core Equity Alpha Fund
Opinion on the Financial Statements
We have audited the accompanying statement of assets and liabilities, including the portfolio of investments, of Nuveen Core Equity Alpha Fund (the “Fund”) as of December 31, 2019, the related statement of operations for the year ended December 31, 2019, the statement of changes in net assets for each of the two years in the period ended December 31, 2019, including the related notes, and the financial highlights for each of the five years in the period ended December 31, 2019 (collectively referred to as the “financial statements”). In our opinion, the financial statements present fairly, in all material respects, the financial position of the Fund as of December 31, 2019, the results of its operations for the year then ended, the changes in its net assets for each of the two years in the period ended December 31, 2019 and the financial highlights for each of the five years in the period ended December 31, 2019 in conformity with accounting principles generally accepted in the United States of America.
Basis for Opinion
These financial statements are the responsibility of the Fund’s management. Our responsibility is to express an opinion on the Fund’s financial statements based on our audits. We are a public accounting firm registered with the Public Company Accounting Oversight Board (United States) (PCAOB) and are required to be independent with respect to the Fund in accordance with the U.S. federal securities laws and the applicable rules and regulations of the Securities and Exchange Commission and the PCAOB.
We conducted our audits of these financial statements in accordance with the standards of the PCAOB. Those standards require that we plan and perform the audit to obtain reasonable assurance about whether the financial statements are free of material misstatement, whether due to error or fraud.
Our audits included performing procedures to assess the risks of material misstatement of the financial statements, whether due to error or fraud, and performing procedures that respond to those risks. Such procedures included examining, on a test basis, evidence regarding the amounts and disclosures in the financial statements. Our audits also included evaluating the accounting principles used and significant estimates made by management, as well as evaluating the overall presentation of the financial statements. Our procedures included confirmation of securities owned as of December 31, 2019 by correspondence with the custodian and brokers; when replies were not received from brokers, we performed other auditing procedures. We believe that our audits provide a reasonable basis for our opinion.
PricewaterhouseCoopers LLP
Chicago, Illinois
February 27, 2020
We have served as the auditor of one or more investment companies in Nuveen Funds since 2002.
14
| | |
| JCE | | Nuveen Core Equity Alpha Fund Portfolio of Investments December 31, 2019 |
| | | | | | | | | | | | | | | | |
| Shares | | | Description (1) | | | | | | | | Value | |
| | | | |
| | | | LONG-TERM INVESTMENTS – 99.8% | | | | | | | | | | | | |
| | |
| | | | COMMON STOCKS – 99.8% | | | | | |
| |
| | | | Aerospace & Defense – 2.2% | |
| | | | |
| | 4,490 | | | Arconic Inc | | | | | | | | | | $ | 138,157 | |
| | 9,585 | | | Boeing Co, (2) | | | | | | | | | | | 3,122,410 | |
| | 10,800 | | | Textron Inc | | | | | | | | | | | 481,680 | |
| | 2,846 | | | TransDigm Group Inc, (3) | | | | | | | | | | | 1,593,760 | |
| | | | Total Aerospace & Defense | | | | | | | | | | | 5,336,007 | |
| | | | |
| | | | Air Freight & Logistics – 0.6% | | | | | | | | | |
| | | | |
| | 15,000 | | | CH Robinson Worldwide Inc | | | | | | | | | | | 1,173,000 | |
| | 2,893 | | | Expeditors International of Washington Inc | | | | | | | | | | | 225,712 | |
| | 294 | | | FedEx Corp | | | | | | | | | | | 44,456 | |
| | | | Total Air Freight & Logistics | | | | | | | | | | | 1,443,168 | |
| | | | |
| | | | Airlines – 0.4% | | | | | | | | | |
| | | | |
| | 689 | | | Alaska Air Group Inc | | | | | | | | | | | 46,680 | |
| | 10,900 | | | United Airlines Holdings Inc, (3) | | | | | | | | | | | 960,181 | |
| | | | Total Airlines | | | | | | | | | | | 1,006,861 | |
| | | | |
| | | | Auto Components – 0.0% | | | | | | | | | |
| | | | |
| | 502 | | | Aptiv PLC | | | | | | | | | | | 47,675 | |
| | | | |
| | | | Automobiles – 0.1% | | | | | | | | | |
| | | | |
| | 4,405 | | | General Motors Co | | | | | | | | | | | 161,223 | |
| | 1,007 | | | Harley-Davidson Inc | | | | | | | | | | | 37,450 | |
| | | | Total Automobiles | | | | | | | | | | | 198,673 | |
| | | | |
| | | | Banks – 1.9% | | | | | | | | | |
| | | | |
| | 3,199 | | | Citizens Financial Group Inc | | | | | | | | | | | 129,911 | |
| | 3,824 | | | Comerica Inc | | | | | | | | | | | 274,372 | |
| | 16,536 | | | Fifth Third Bancorp | | | | | | | | | | | 508,316 | |
| | 762 | | | First Republic Bank | | | | | | | | | | | 89,497 | |
| | 55,500 | | | Huntington Bancshares Inc, (2) | | | | | | | | | | | 836,940 | |
| | 8,538 | | | KeyCorp | | | | | | | | | | | 172,809 | |
| | 361 | | | M&T Bank Corp | | | | | | | | | | | 61,280 | |
| | 17,760 | | | People’s United Financial Inc | | | | | | | | | | | 300,144 | |
| | 3,101 | | | PNC Financial Services Group Inc | | | | | | | | | | | 495,012 | |
| | 59,374 | | | Regions Financial Corp, (2) | | | | | | | | | | | 1,018,858 | |
| | 1,441 | | | SVB Financial Group, (3) | | | | | | | | | | | 361,749 | |
| | 1,752 | | | Truist Financial Corp | | | | | | | | | | | 98,673 | |
| | 3,115 | | | Zions Bancorp NA | | | | | | | | | | | 161,731 | |
| | | | Total Banks | | | | | | | | | | | 4,509,292 | |
| | | | |
| | | | Beverages – 0.1% | | | | | | | | | |
| | | | |
| | 1,415 | | | Brown-Forman Corp, Class B | | | | | | | | | | | 95,654 | |
| | 1,321 | | | Constellation Brands Inc, Class A | | | | | | | | | | | 250,660 | |
| | | | Total Beverages | | | | | | | | | | | 346,314 | |
| | | | |
| | | | Biotechnology – 0.6% | | | | | | | | | |
| | | | |
| | 1,057 | | | Alexion Pharmaceuticals Inc, (3) | | | | | | | | | | | 114,315 | |
| | 1,310 | | | Amgen Inc | | | | | | | | | | | 315,802 | |
| | 325 | | | Biogen Inc, (3) | | | | | | | | | | | 96,437 | |
| | 2,864 | | | Incyte Corp, (3) | | | | | | | | | | | 250,084 | |
| | 1,799 | | | Regeneron Pharmaceuticals Inc, (3) | | | | | | | | | | | 675,489 | |
| | | | Total Biotechnology | | | | | | | | | | | 1,452,127 | |
| | | | |
| | | | Building Products – 0.4% | | | | | | | | | |
| | | | |
| | 3,666 | | | Allegion PLC | | | | | | | | | | | 456,564 | |
| | 2,774 | | | AO Smith Corp | | | | | | | | | | | 132,153 | |
15
| | |
| |
| JCE | | Nuveen Core Equity Alpha Fund(continued) |
| | Portfolio of Investments December 31, 2019 |
| | | | | | | | | | | | | | | | |
| Shares | | | Description (1) | | | | | | | | Value | |
| | | | |
| | | | Building Products(continued) | | | | | | | | | |
| | | | |
| | 1,619 | | | Fortune Brands Home & Security Inc | | | | | | | | | | $ | 105,786 | |
| | 6,092 | | | Masco Corp | | | | | | | | | | | 292,355 | |
| | | | Total Building Products | | | | | | | | | | | 986,858 | |
| | | | |
| | | | Capital Markets – 4.9% | | | | | | | | | |
| | | | |
| | 2,874 | | | Bank of New York Mellon Corp | | | | | | | | | | | 144,648 | |
| | 127 | | | BlackRock Inc | | | | | | | | | | | 63,843 | |
| | 14,537 | | | CME Group Inc | | | | | | | | | | | 2,917,867 | |
| | 10,147 | | | E*TRADE Financial Corp | | | | | | | | | | | 460,369 | |
| | 17,447 | | | Franklin Resources Inc | | | | | | | | | | | 453,273 | |
| | 427 | | | Intercontinental Exchange Inc | | | | | | | | | | | 39,519 | |
| | 13,158 | | | Invesco Ltd | | | | | | | | | | | 236,581 | |
| | 7,925 | | | Moody’s Corp | | | | | | | | | | | 1,881,474 | |
| | 7,198 | | | Morgan Stanley | | | | | | | | | | | 367,962 | |
| | 5,000 | | | MSCI Inc | | | | | | | | | | | 1,290,900 | |
| | 2,020 | | | Nasdaq Inc | | | | | | | | | | | 216,342 | |
| | 1,928 | | | Northern Trust Corp | | | | | | | | | | | 204,831 | |
| | 1,147 | | | Raymond James Financial Inc | | | | | | | | | | | 102,610 | |
| | 7,835 | | | S&P Global Inc | | | | | | | | | | | 2,139,347 | |
| | 10,937 | | | T Rowe Price Group Inc | | | | | | | | | | | 1,332,564 | |
| | | | Total Capital Markets | | | | | | | | | | | 11,852,130 | |
| | | | |
| | | | Chemicals – 1.8% | | | | | | | | | |
| | | | |
| | 2,690 | | | Celanese Corp | | | | | | | | | | | 331,193 | |
| | 8,245 | | | CF Industries Holdings Inc | | | | | | | | | | | 393,616 | |
| | 543 | | | Eastman Chemical Co | | | | | | | | | | | 43,038 | |
| | 197 | | | Ecolab Inc | | | | | | | | | | | 38,019 | |
| | 2,726 | | | FMC Corp | | | | | | | | | | | 272,109 | |
| | 3,433 | | | International Flavors & Fragrances Inc | | | | | | | | | | | 442,926 | |
| | 678 | | | LyondellBasell Industries NV, Class A | | | | | | | | | | | 64,057 | |
| | 34,644 | | | Mosaic Co, (2) | | | | | | | | | | | 749,696 | |
| | 1,452 | | | PPG Industries Inc | | | | | | | | | | | 193,828 | |
| | 3,305 | | | Sherwin-Williams Co | | | | | | | | | | | 1,928,600 | |
| | | | Total Chemicals | | | | | | | | | | | 4,457,082 | |
| | | | |
| | | | Commercial Services & Supplies – 2.1% | | | | | | | | | |
| | | | |
| | 4,400 | | | Cintas Corp | | | | | | | | | | | 1,183,952 | |
| | 9,916 | | | Copart Inc, (3) | | | | | | | | | | | 901,761 | |
| | 25,900 | | | Republic Services Inc | | | | | | | | | | | 2,321,417 | |
| | 20,700 | | | Rollins Inc | | | | | | | | | | | 686,412 | |
| | | | Total Commercial Services & Supplies | | | | | | | | | | | 5,093,542 | |
| | | | |
| | | | Communications Equipment – 1.6% | | | | | | | | | |
| | | | |
| | 9,137 | | | Cisco Systems Inc | | | | | | | | | | | 438,211 | |
| | 5,500 | | | F5 Networks Inc, (3) | | | | | | | | | | | 768,075 | |
| | 29,620 | | | Juniper Networks Inc | | | | | | | | | | | 729,541 | |
| | 11,967 | | | Motorola Solutions Inc | | | | | | | | | | | 1,928,362 | |
| | | | Total Communications Equipment | | | | | | | | | | | 3,864,189 | |
| | | | |
| | | | Construction & Engineering – 0.1% | | | | | | | | | |
| | | | |
| | 1,517 | | | Jacobs Engineering Group Inc | | | | | | | | | | | 136,272 | |
| | 2,131 | | | Quanta Services Inc | | | | | | | | | | | 86,753 | |
| | | | Total Construction & Engineering | | | | | | | | | | | 223,025 | |
| | | | |
| | | | Consumer Finance – 0.8% | | | | | | | | | |
| | | | |
| | 3,238 | | | American Express Co | | | | | | | | | | | 403,099 | |
| | 420 | | | Capital One Financial Corp | | | | | | | | | | | 43,222 | |
| | 14,700 | | | Discover Financial Services | | | | | | | | | | | 1,246,854 | |
| | 7,720 | | | Synchrony Financial | | | | | | | | | | | 277,997 | |
| | | | Total Consumer Finance | | | | | | | | | | | 1,971,172 | |
16
| | | | | | | | | | | | | | | | |
| Shares | | | Description (1) | | | | | | | | Value | |
| | | | |
| | | | Containers & Packaging – 0.8% | | | | | | | | | |
| | | | |
| | 2,185 | | | Avery Dennison Corp | | | | | | | | | | $ | 285,842 | |
| | 20,035 | | | Ball Corp | | | | | | | | | | | 1,295,663 | |
| | 8,814 | | | Sealed Air Corp | | | | | | | | | | | 351,062 | |
| | | | Total Containers & Packaging | | | | | | | | | | | 1,932,567 | |
| | | | |
| | | | Distributors – 0.1% | | | | | | | | | |
| | | | |
| | 6,626 | | | LKQ Corp, (3) | | | | | | | | | | | 236,548 | |
| | | | |
| | | | Diversified Consumer Services – 0.1% | | | | | | | | | |
| | | | |
| | 9,003 | | | H&R Block Inc | | | | | | | | | | | 211,390 | |
| | | | |
| | | | Diversified Telecommunication Services – 0.1% | | | | | | | | | |
| | | | |
| | 10,543 | | | CenturyLink Inc | | | | | | | | | | | 139,273 | |
| | | | |
| | | | Electric Utilities – 2.7% | | | | | | | | | |
| | | | |
| | 4,432 | | | Entergy Corp | | | | | | | | | | | 530,954 | |
| | 3,467 | | | Evergy Inc | | | | | | | | | | | 225,667 | |
| | 3,858 | | | Eversource Energy | | | | | | | | | | | 328,200 | |
| | 21,300 | | | Exelon Corp | | | | | | | | | | | 971,067 | |
| | 9,700 | | | FirstEnergy Corp | | | | | | | | | | | 471,420 | |
| | 14,544 | | | NextEra Energy Inc | | | | | | | | | | | 3,521,975 | |
| | 4,365 | | | Pinnacle West Capital Corp | | | | | | | | | | | 392,544 | |
| | 2,797 | | | Xcel Energy Inc | | | | | | | | | | | 177,582 | |
| | | | Total Electric Utilities | | | | | | | | | | | 6,619,409 | |
| | | | |
| | | | Electrical Equipment – 0.5% | | | | | | | | | |
| | | | |
| | 9,607 | | | AMETEK Inc | | | | | | | | | | | 958,202 | |
| | 1,434 | | | Eaton Corp PLC | | | | | | | | | | | 135,828 | |
| | 262 | | | Rockwell Automation Inc | | | | | | | | | | | 53,100 | |
| | | | Total Electrical Equipment | | | | | | | | | | | 1,147,130 | |
| | | | |
| | | | Electronic Equipment, Instruments & Components – 1.8% | | | | | | | | | |
| | | | |
| | 21,705 | | | Amphenol Corp, Class A | | | | | | | | | | | 2,349,132 | |
| | 19,723 | | | Corning Inc | | | | | | | | | | | 574,137 | |
| | 2,186 | | | IPG Photonics Corp, (3) | | | | | | | | | | | 316,795 | |
| | 9,775 | | | Keysight Technologies Inc, (3) | | | | | | | | | | | 1,003,208 | |
| | 1,278 | | | TE Connectivity Ltd | | | | | | | | | | | 122,484 | |
| | | | Total Electronic Equipment, Instruments & Components | | | | | | | | | | | 4,365,756 | |
| | | | |
| | | | Energy Equipment & Services – 0.2% | | | | | | | | | |
| | | | |
| | 6,299 | | | Halliburton Co | | | | | | | | | | | 154,136 | |
| | 7,133 | | | National Oilwell Varco Inc | | | | | | | | | | | 178,682 | |
| | 10,393 | | | TechnipFMC PLC | | | | | | | | | | | 222,826 | |
| | | | Total Energy Equipment & Services | | | | | | | | | | | 555,644 | |
| | | | |
| | | | Entertainment – 0.5% | | | | | | | | | |
| | | | |
| | 6,574 | | | Activision Blizzard Inc | | | | | | | | | | | 390,627 | |
| | 2,487 | | | Netflix Inc, (3) | | | | | | | | | | | 804,719 | |
| | 836 | | | Take-Two Interactive Software Inc, (3) | | | | | | | | | | | 102,351 | |
| | | | Total Entertainment | | | | | | | | | | | 1,297,697 | |
| | | | |
| | | | Equity Real Estate Investment Trust – 5.9% | | | | | | | | | |
| | | | |
| | 4,075 | | | American Tower Corp | | | | | | | | | | | 936,517 | |
| | 14,643 | | | Apartment Investment & Management Co, Class A | | | | | | | | | | | 756,311 | |
| | 5,115 | | | AvalonBay Communities Inc | | | | | | | | | | | 1,072,615 | |
| | 4,145 | | | Crown Castle International Corp | | | | | | | | | | | 589,212 | |
| | 13,463 | | | Digital Realty Trust Inc | | | | | | | | | | | 1,612,060 | |
| | 4,412 | | | Duke Realty Corp | | | | | | | | | | | 152,964 | |
| | 10,300 | | | Equity Residential | | | | | | | | | | | 833,476 | |
| | 3,033 | | | Extra Space Storage Inc | | | | | | | | | | | 320,345 | |
| | 12,900 | | | Healthpeak Properties Inc | | | | | | | | | | | 444,663 | |
| | 8,256 | | | Host Hotels & Resorts Inc | | | | | | | | | | | 153,149 | |
| | 1,470 | | | Iron Mountain Inc | | | | | | | | | | | 46,849 | |
17
| | |
| |
| JCE | | Nuveen Core Equity Alpha Fund(continued) |
| | Portfolio of Investments December 31, 2019 |
| | | | | | | | | | | | | | | | |
| Shares | | | Description (1) | | | | | | | | Value | |
| | | | |
| | | | Equity Real Estate Investment Trust(continued) | | | | | | | | | |
| | | | |
| | 4,837 | | | Kimco Realty Corp | | | | | | | | | | $ | 100,174 | |
| | 6,700 | | | Mid-America Apartment Communities Inc | | | | | | | | | | | 883,462 | |
| | 15,206 | | | Prologis Inc, (2) | | | | | | | | | | | 1,355,463 | |
| | 14,946 | | | Realty Income Corp | | | | | | | | | | | 1,100,474 | |
| | 2,800 | | | Simon Property Group Inc | | | | | | | | | | | 417,088 | |
| | 27,875 | | | UDR Inc | | | | | | | | | | | 1,301,762 | |
| | 25,100 | | | Welltower Inc | | | | | | | | | | | 2,052,678 | |
| | 1,893 | | | Weyerhaeuser Co | | | | | | | | | | | 57,169 | |
| | | | Total Equity Real Estate Investment Trust | | | | | | | | | | | 14,186,431 | |
| | | | |
| | | | Food & Staples Retailing – 1.7% | | | | | | | | | |
| | | | |
| | 10,055 | | | Costco Wholesale Corp | | | | | | | | | | | 2,955,365 | |
| | 8,900 | | | Sysco Corp | | | | | | | | | | | 761,306 | |
| | 6,260 | | | Walgreens Boots Alliance Inc | | | | | | | | | | | 369,090 | |
| | | | Total Food & Staples Retailing | | | | | | | | | | | 4,085,761 | |
| | | | |
| | | | Food Products – 1.8% | | | | | | | | | |
| | | | |
| | 31,700 | | | Archer-Daniels-Midland Co, (2) | | | | | | | | | | | 1,469,295 | |
| | 18,900 | | | Hormel Foods Corp | | | | | | | | | | | 852,579 | |
| | 2,286 | | | Kellogg Co | | | | | | | | | | | 158,100 | |
| | 3,019 | | | Kraft Heinz Co | | | | | | | | | | | 97,001 | |
| | 1,741 | | | Lamb Weston Holdings Inc | | | | | | | | | | | 149,778 | |
| | 9,364 | | | McCormick & Co Inc | | | | | | | | | | | 1,589,352 | |
| | 933 | | | Tyson Foods Inc, Class A | | | | | | | | | | | 84,940 | |
| | | | Total Food Products | | | | | | | | | | | 4,401,045 | |
| | |
| | | | Health Care Equipment & Supplies – 7.4% | | | | |
| | | | |
| | 27,416 | | | Abbott Laboratories | | | | | | | | | | | 2,381,354 | |
| | 701 | | | ABIOMED Inc, (3) | | | | | | | | | | | 119,584 | |
| | 149 | | | Align Technology Inc, (3) | | | | | | | | | | | 41,577 | |
| | 34,300 | | | Baxter International Inc, (2) | | | | | | | | | | | 2,868,166 | |
| | 4,870 | | | Becton Dickinson and Co, (2) | | | | | | | | | | | 1,324,494 | |
| | 1,394 | | | Boston Scientific Corp, (3) | | | | | | | | | | | 63,037 | |
| | 2,671 | | | Cooper Cos Inc | | | | | | | | | | | 858,165 | |
| | 12,597 | | | DENTSPLY SIRONA Inc | | | | | | | | | | | 712,864 | |
| | 2,380 | | | Edwards Lifesciences Corp, (3) | | | | | | | | | | | 555,230 | |
| | 24,215 | | | Hologic Inc, (3) | | | | | | | | | | | 1,264,265 | |
| | 4,600 | | | IDEXX Laboratories Inc, (3) | | | | | | | | | | | 1,201,198 | |
| | 9,636 | | | Intuitive Surgical Inc, (3) | | | | | | | | | | | 5,696,321 | |
| | 4,600 | | | ResMed Inc | | | | | | | | | | | 712,862 | |
| | | | Total Health Care Equipment & Supplies | | | | | | | | | | | 17,799,117 | |
| |
| | | | Health Care Providers & Services – 3.9% | |
| | | | |
| | 5,370 | | | Anthem Inc | | | | | | | | | | | 1,621,901 | |
| | 1,196 | | | Cardinal Health Inc | | | | | | | | | | | 60,494 | |
| | 30,928 | | | Centene Corp, (2), (3) | | | | | | | | | | | 1,944,443 | |
| | 1,625 | | | Cigna Corp | | | | | | | | | | | 332,296 | |
| | 2,492 | | | DaVita Inc, (3) | | | | | | | | | | | 186,975 | |
| | 26,993 | | | HCA Inc, (2) | | | | | | | | | | | 3,989,835 | |
| | 13,200 | | | Henry Schein Inc, (3) | | | | | | | | | | | 880,704 | |
| | 1,053 | | | Humana Inc | | | | | | | | | | | 385,946 | |
| | 594 | | | Universal Health Services Inc, Class A | | | | | | | | | | | 85,215 | |
| | | | Total Health Care Providers & Services | | | | | | | | | | | 9,487,809 | |
| |
| | | | Hotels, Restaurants & Leisure – 1.3% | |
| | | | |
| | 4,949 | | | Carnival Corp | | | | | | | | | | | 251,558 | |
| | 388 | | | Chipotle Mexican Grill Inc, (3) | | | | | | | | | | | 324,799 | |
| | 2,714 | | | Hilton Worldwide Holdings Inc | | | | | | | | | | | 301,010 | |
| | 1,264 | | | Marriott International Inc, Class A | | | | | | | | | | | 191,407 | |
| | 12,439 | | | MGM Resorts International | | | | | | | | | | | 413,845 | |
| | 4,045 | | | Norwegian Cruise Line Holdings Ltd, (3) | | | | | | | | | | | 236,268 | |
| | 3,077 | | | Royal Caribbean Cruises Ltd | | | | | | | | | | | 410,810 | |
| | 2,815 | | | Wynn Resorts Ltd | | | | | | | | | | | 390,919 | |
18
| | | | | | | | | | | | | | | | |
| Shares | | | Description (1) | | | | | | | | Value | |
| |
| | | | Hotels, Restaurants & Leisure(continued) | |
| | | | |
| | 6,109 | | | Yum! Brands Inc | | | | | | | | | | $ | 615,360 | |
| | | | Total Hotels, Restaurants & Leisure | | | | | | | | | | | 3,135,976 | |
| |
| | | | Household Durables – 0.3% | |
| | | | |
| | 1,009 | | | Leggett & Platt Inc | | | | | | | | | | | 51,287 | |
| | 840 | | | Lennar Corp, Class A | | | | | | | | | | | 46,864 | |
| | 4,482 | | | PulteGroup Inc | | | | | | | | | | | 173,902 | |
| | 2,784 | | | Whirlpool Corp | | | | | | | | | | | 410,723 | |
| | | | Total Household Durables | | | | | | | | | | | 682,776 | |
| |
| | | | Household Products – 1.2% | |
| | | | |
| | 30,672 | | | Church & Dwight Co Inc, (2) | | | | | | | | | | | 2,157,468 | |
| | 5,055 | | | Clorox Co | | | | | | | | | | | 776,145 | |
| | | | Total Household Products | | | | | | | | | | | 2,933,613 | |
| |
| | | | Independent Power & Renewable Electricity Producers – 1.6% | |
| | | | |
| | 104,498 | | | AES Corp, (2) | | | | | | | | | | | 2,079,510 | |
| | 42,400 | | | NRG Energy Inc, (2) | | | | | | | | | | | 1,685,400 | |
| | | | Total Independent Power & Renewable Electricity Producers | | | | | | | | | | | 3,764,910 | |
| | | | |
| | | | Insurance – 4.0% | | | | | | | | | |
| | | | |
| | 14,600 | | | Aflac Inc | | | | | | | | | | | 772,340 | |
| | 9,673 | | | Allstate Corp | | | | | | | | | | | 1,087,729 | |
| | 9,987 | | | Arthur J Gallagher & Co | | | | | | | | | | | 951,062 | |
| | 2,243 | | | Assurant Inc | | | | | | | | | | | 294,013 | |
| | 7,781 | | | Cincinnati Financial Corp | | | | | | | | | | | 818,172 | |
| | 544 | | | Everest Re Group Ltd | | | | | | | | | | | 150,601 | |
| | 495 | | | Globe Life Inc | | | | | | | | | | | 52,099 | |
| | 2,190 | | | Lincoln National Corp | | | | | | | | | | | 129,232 | |
| | 1,356 | | | Loews Corp | | | | | | | | | | | 71,176 | |
| | 7,754 | | | MetLife Inc | | | | | | | | | | | 395,221 | |
| | 6,805 | | | Principal Financial Group Inc | | | | | | | | | | | 374,275 | |
| | 55,200 | | | Progressive Corp, (2) | | | | | | | | | | | 3,995,928 | |
| | 4,697 | | | Prudential Financial Inc | | | | | | | | | | | 440,297 | |
| | 6,771 | | | Unum Group | | | | | | | | | | | 197,442 | |
| | | | Total Insurance | | | | | | | | | | | 9,729,587 | |
| |
| | | | Interactive Media & Services – 0.1% | |
| | | | |
| | 6,167 | | | Twitter Inc, (3) | | | | | | | | | | | 197,652 | |
| |
| | | | Internet & Direct Marketing Retail – 0.1% | |
| | | | |
| | 3,622 | | | eBay Inc | | | | | | | | | | | 130,790 | |
| | | | |
| | | | IT Services – 6.9% | | | | | | | | | |
| | | | |
| | 1,302 | | | Accenture PLC, Class A | | | | | | | | | | | 274,162 | |
| | 1,497 | | | Akamai Technologies Inc, (3) | | | | | | | | | | | 129,311 | |
| | 17,905 | | | Automatic Data Processing Inc | | | | | | | | | | | 3,052,803 | |
| | 378 | | | Broadridge Financial Solutions Inc | | | | | | | | | | | 46,698 | |
| | 9,053 | | | DXC Technology Co | | | | | | | | | | | 340,302 | |
| | 6,500 | | | Fiserv Inc, (3) | | | | | | | | | | | 751,595 | |
| | 599 | | | FleetCor Technologies Inc, (3) | | | | | | | | | | | 172,344 | |
| | 7,000 | | | Gartner Inc, (3) | | | | | | | | | | | 1,078,700 | |
| | 9,345 | | | Global Payments Inc | | | | | | | | | | | 1,706,023 | |
| | 11,343 | | | Mastercard Inc, Class A | | | | | | | | | | | 3,386,906 | |
| | 15,000 | | | Paychex Inc | | | | | | | | | | | 1,275,900 | |
| | 13,788 | | | PayPal Holdings Inc, (2), (3) | | | | | | | | | | | 1,491,448 | |
| | 13,200 | | | VeriSign Inc, (3) | | | | | | | | | | | 2,543,376 | |
| | 1,575 | | | Visa Inc | | | | | | | | | | | 295,943 | |
| | 6,765 | | | Western Union Co | | | | | | | | | | | 181,167 | |
| | | | Total IT Services | | | | | | | | | | | 16,726,678 | |
| |
| | | | Leisure Products – 0.1% | |
| | | | |
| | 1,505 | | | Hasbro Inc | | | | | | | | | | | 158,943 | |
19
| | |
| |
| JCE | | Nuveen Core Equity Alpha Fund(continued) |
| | Portfolio of Investments December 31, 2019 |
| | | | | | | | | | | | | | | | |
| Shares | | | Description (1) | | | | | | | | Value | |
| |
| | | | Life Sciences Tools & Services – 1.4% | |
| | | | |
| | 4,110 | | | Agilent Technologies Inc | | | | | | | | | | $ | 350,624 | |
| | 6,315 | | | Illumina Inc, (3) | | | | | | | | | | | 2,094,938 | |
| | 4,505 | | | IQVIA Holdings Inc, (3) | | | | | | | | | | | 696,068 | |
| | 214 | | | Mettler-Toledo International Inc, (3) | | | | | | | | | | | 169,762 | |
| | | | Total Life Sciences Tools & Services | | | | | | | | | | | 3,311,392 | |
| |
| | | | Machinery – 1.5% | |
| | | | |
| | 1,155 | | | Caterpillar Inc | | | | | | | | | | | 170,570 | |
| | 3,938 | | | Cummins Inc | | | | | | | | | | | 704,744 | |
| | 6,538 | | | Deere & Co | | | | | | | | | | | 1,132,774 | |
| | 1,043 | | | Flowserve Corp | | | | | | | | | | | 51,910 | |
| | 785 | | | Illinois Tool Works Inc | | | | | | | | | | | 141,010 | |
| | 2,400 | | | Ingersoll-Rand PLC | | | | | | | | | | | 319,008 | |
| | 3,237 | | | PACCAR Inc | | | | | | | | | | | 256,047 | |
| | 679 | | | Parker-Hannifin Corp | | | | | | | | | | | 139,752 | |
| | 2,795 | | | Snap-on Inc | | | | | | | | | | | 473,473 | |
| | 817 | | | Stanley Black & Decker Inc | | | | | | | | | | | 135,410 | |
| | 826 | | | Xylem Inc | | | | | | | | | | | 65,080 | |
| | | | Total Machinery | | | | | | | | | | | 3,589,778 | |
| |
| | | | Media – 2.4% | |
| | | | |
| | 1,919 | | | Charter Communications Inc, Class A, (3) | | | | | | | | | | | 930,869 | |
| | 8,800 | | | Discovery Inc, Class A, (3) | | | | | | | | | | | 288,112 | |
| | 47,648 | | | Discovery Inc, (2), (3) | | | | | | | | | | | 1,452,787 | |
| | 3,715 | | | DISH Network Corp, Class A, (3) | | | | | | | | | | | 131,771 | |
| | 18,288 | | | Fox Corp, Class A | | | | | | | | | | | 677,936 | |
| | 21,521 | | | Fox Corp, Class B | | | | | | | | | | | 783,364 | |
| | 3,872 | | | Interpublic Group of Cos Inc | | | | | | | | | | | 89,443 | |
| | 27,019 | | | News Corp, Class A | | | | | | | | | | | 382,049 | |
| | 11,736 | | | Omnicom Group Inc | | | | | | | | | | | 950,851 | |
| | | | Total Media | | | | | | | | | | | 5,687,182 | |
| |
| | | | Metals & Mining – 0.1% | |
| | | | |
| | 4,210 | | | Freeport-McMoRan Inc | | | | | | | | | | | 55,235 | |
| | 2,313 | | | Nucor Corp | | | | | | | | | | | 130,176 | |
| | | | Total Metals & Mining | | | | | | | | | | | 185,411 | |
| |
| | | | Multiline Retail – 2.5% | |
| | | | |
| | 10,300 | | | Dollar General Corp | | | | | | | | | | | 1,606,594 | |
| | 25,700 | | | Dollar Tree Inc, (3) | | | | | | | | | | | 2,417,085 | |
| | 14,600 | | | Kohl’s Corp | | | | | | | | | | | 743,870 | |
| | 9,846 | | | Macy’s Inc | | | | | | | | | | | 167,382 | |
| | 1,985 | | | Nordstrom Inc | | | | | | | | | | | 81,246 | |
| | 8,751 | | | Target Corp | | | | | | | | | | | 1,121,966 | |
| | | | Total Multiline Retail | | | | | | | | | | | 6,138,143 | |
| |
| | | | Multi-Utilities – 1.5% | |
| | | | |
| | 20,600 | | | Ameren Corp | | | | | | | | | | | 1,582,080 | |
| | 16,435 | | | CenterPoint Energy Inc | | | | | | | | | | | 448,183 | |
| | 13,600 | | | CMS Energy Corp | | | | | | | | | | | 854,624 | |
| | 409 | | | DTE Energy Co | | | | | | | | | | | 53,117 | |
| | 9,500 | | | NiSource Inc | | | | | | | | | | | 264,480 | |
| | 6,400 | | | Public Service Enterprise Group Inc | | | | | | | | | | | 377,920 | |
| | 1,067 | | | WEC Energy Group Inc | | | | | | | | | | | 98,409 | |
| | | | Total Multi-Utilities | | | | | | | | | | | 3,678,813 | |
| |
| | | | Oil, Gas & Consumable Fuels – 5.1% | |
| | | | |
| | 3,265 | | | Cimarex Energy Co | | | | | | | | | | | 171,380 | |
| | 48,633 | | | ConocoPhillips, (2) | | | | | | | | | | | 3,162,604 | |
| | 7,972 | | | Devon Energy Corp | | | | | | | | | | | 207,033 | |
| | 3,982 | | | Diamondback Energy Inc | | | | | | | | | | | 369,769 | |
| | 17,600 | | | Hess Corp | | | | | | | | | | | 1,175,856 | |
| | 5,330 | | | HollyFrontier Corp | | | | | | | | | | | 270,284 | |
| | 53,900 | | | Kinder Morgan Inc, (2) | | | | | | | | | | | 1,141,063 | |
20
| | | | | | | | | | | | | | | | |
| Shares | | | Description (1) | | | | | | | | Value | |
| |
| | | | Oil, Gas & Consumable Fuels(continued) | |
| | | | |
| | 61,381 | | | Marathon Oil Corp | | | | | | | | | | $ | 833,554 | |
| | 3,619 | | | Marathon Petroleum Corp | | | | | | | | | | | 218,045 | |
| | 11,018 | | | Noble Energy Inc | | | | | | | | | | | 273,687 | |
| | 6,911 | | | Occidental Petroleum Corp | | | | | | | | | | | 284,802 | |
| | 32,600 | | | ONEOK Inc, (2) | | | | | | | | | | | 2,466,842 | |
| | 1,282 | | | Phillips 66 | | | | | | | | | | | 142,828 | |
| | 583 | | | Pioneer Natural Resources Co | | | | | | | | | | | 88,249 | |
| | 7,682 | | | Valero Energy Corp | | | | | | | | | | | 719,419 | |
| | 28,360 | | | Williams Cos Inc | | | | | | | | | | | 672,699 | |
| | | | Total Oil, Gas & Consumable Fuels | | | | | | | | | | | 12,198,114 | |
| |
| | | | Personal Products – 0.6% | |
| | | | |
| | 22,360 | | | Coty Inc, Class A | | | | | | | | | | | 251,550 | |
| | 5,803 | | | Estee Lauder Cos Inc, Class A | | | | | | | | | | | 1,198,552 | |
| | | | Total Personal Products | | | | | | | | | | | 1,450,102 | |
| |
| | | | Pharmaceuticals – 2.8% | |
| | | | |
| | 3,425 | | | Allergan PLC | | | | | | | | | | | 654,757 | |
| | 21,219 | | | Eli Lilly & Co | | | | | | | | | | | 2,788,813 | |
| | 11,286 | | | Merck & Co Inc | | | | | | | | | | | 1,026,462 | |
| | 15,866 | | | Mylan NV, (3) | | | | | | | | | | | 318,907 | |
| | 3,497 | | | Perrigo Co PLC | | | | | | | | | | | 180,655 | |
| | 5,720 | | | Pfizer Inc | | | | | | | | | | | 224,110 | |
| | 11,427 | | | Zoetis Inc | | | | | | | | | | | 1,512,363 | |
| | | | Total Pharmaceuticals | | | | | | | | | | | 6,706,067 | |
| |
| | | | Professional Services – 1.1% | |
| | | | |
| | 5,800 | | | IHS Markit Ltd | | | | | | | | | | | 437,030 | |
| | 11,943 | | | Nielsen Holdings PLC | | | | | | | | | | | 242,443 | |
| | 13,600 | | | Robert Half International Inc | | | | | | | | | | | 858,840 | |
| | 7,252 | | | Verisk Analytics Inc | | | | | | | | | | | 1,083,014 | |
| | | | Total Professional Services | | | | | | | | | | | 2,621,327 | |
| |
| | | | Real Estate Management & Development – 0.2% | |
| | | | |
| | 6,394 | | | CBRE Group Inc, Class A, (3) | | | | | | | | | | | 391,888 | |
| | |
| | | | Road & Rail – 2.6% | | | | |
| | | | |
| | 59,615 | | | CSX Corp, (2) | | | | | | | | | | | 4,313,741 | |
| | 4,411 | | | Kansas City Southern | | | | | | | | | | | 675,589 | |
| | 5,207 | | | Norfolk Southern Corp | | | | | | | | | | | 1,010,835 | |
| | 808 | | | Union Pacific Corp | | | | | | | | | | | 146,078 | |
| | | | Total Road & Rail | | | | | | | | | | | 6,146,243 | |
| |
| | | | Semiconductors & Semiconductor Equipment – 2.4% | |
| | | | |
| | 30,760 | | | Advanced Micro Devices Inc, (2), (3) | | | | | | | | | | | 1,410,654 | |
| | 2,605 | | | Analog Devices Inc | | | | | | | | | | | 309,578 | |
| | 6,910 | | | Applied Materials Inc | | | | | | | | | | | 421,786 | |
| | 5,126 | | | KLA Corp | | | | | | | | | | | 913,300 | |
| | 1,090 | | | Lam Research Corp | | | | | | | | | | | 318,716 | |
| | 2,050 | | | Maxim Integrated Products Inc | | | | | | | | | | | 126,096 | |
| | 1,718 | | | Microchip Technology Inc | | | | | | | | | | | 179,909 | |
| | 1,978 | | | Micron Technology Inc, (3) | | | | | | | | | | | 106,377 | |
| | 2,662 | | | Qorvo Inc, (3) | | | | | | | | | | | 309,404 | |
| | 3,506 | | | QUALCOMM Inc | | | | | | | | | | | 309,334 | |
| | 1,949 | | | Skyworks Solutions Inc | | | | | | | | | | | 235,595 | |
| | 12,605 | | | Xilinx Inc | | | | | | | | | | | 1,232,391 | |
| | | | Total Semiconductors & Semiconductor Equipment | | | | | | | | | | | 5,873,140 | |
| |
| | | | Software – 5.0% | |
| | | | |
| | 3,900 | | | Adobe Inc, (3) | | | | | | | | | | | 1,286,259 | |
| | 7,427 | | | Cadence Design Systems Inc, (3) | | | | | | | | | | | 515,137 | |
| | 6,300 | | | Citrix Systems Inc | | | | | | | | | | | 698,670 | |
| | 13,300 | | | Fortinet Inc, (3) | | | | | | | | | | | 1,419,908 | |
21
| | |
| |
| JCE | | Nuveen Core Equity Alpha Fund(continued) |
| | Portfolio of Investments December 31, 2019 |
| | | | | | | | | | | | | | | | |
| Shares | | | Description (1) | | | | | | | | Value | |
| |
| | | | Software(continued) | |
| | | | |
| | 9,145 | | | Intuit Inc | | | | | | | | | | $ | 2,395,350 | |
| | 14,419 | | | Microsoft Corp | | | | | | | | | | | 2,273,876 | |
| | 13,654 | | | NortonLifeLock Inc | | | | | | | | | | | 348,450 | |
| | 1,287 | | | Oracle Corp | | | | | | | | | | | 68,185 | |
| | 17,600 | | | salesforcecom Inc, (3) | | | | | | | | | | | 2,862,464 | |
| | 605 | | | Synopsys Inc, (3) | | | | | | | | | | | 84,216 | |
| | | | Total Software | | | | | | | | | | | 11,952,515 | |
| |
| | | | Specialty Retail – 5.2% | |
| | | | |
| | 1,057 | | | Advance Auto Parts Inc | | | | | | | | | | | 169,289 | |
| | 2,600 | | | AutoZone Inc, (3) | | | | | | | | | | | 3,097,406 | |
| | 2,373 | | | Best Buy Co Inc | | | | | | | | | | | 208,349 | |
| | 1,258 | | | CarMax Inc, (3) | | | | | | | | | | | 110,289 | |
| | 22,707 | | | Gap Inc | | | | | | | | | | | 401,460 | |
| | 8,137 | | | L Brands Inc | | | | | | | | | | | 147,443 | |
| | 5,545 | | | O’Reilly Automotive Inc, (3) | | | | | | | | | | | 2,430,152 | |
| | 18,155 | | | Ross Stores Inc | | | | | | | | | | | 2,113,605 | |
| | 366 | | | Tiffany & Co | | | | | | | | | | | 48,916 | |
| | 49,055 | | | TJX Cos Inc, (2) | | | | | | | | | | | 2,995,298 | |
| | 1,535 | | | Tractor Supply Co | | | | | | | | | | | 143,430 | |
| | 2,453 | | | Ulta Beauty Inc, (3) | | | | | | | | | | | 620,952 | |
| | | | Total Specialty Retail | | | | | | | | | | | 12,486,589 | |
| |
| | | | Technology Hardware, Storage & Peripherals – 2.0% | |
| | | | |
| | 5,993 | | | Apple Inc | | | | | | | | | | | 1,759,844 | |
| | 11,548 | | | Hewlett Packard Enterprise Co | | | | | | | | | | | 183,151 | |
| | 21,900 | | | NetApp Inc | | | | | | | | | | | 1,363,275 | |
| | 5,296 | | | Seagate Technology PLC | | | | | | | | | | | 315,112 | |
| | 13,106 | | | Western Digital Corp | | | | | | | | | | | 831,838 | |
| | 11,201 | | | Xerox Holdings Corp | | | | | | | | | | | 412,981 | |
| | | | Total Technology Hardware, Storage & Peripherals | | | | | | | | | | | 4,866,201 | |
| |
| | | | Textiles, Apparel & Luxury Goods – 1.4% | |
| | | | |
| | 3,978 | | | Capri Holdings Ltd, (3) | | | | | | | | | | | 151,761 | |
| | 5,000 | | | NIKE Inc, Class B | | | | | | | | | | | 506,550 | |
| | 2,953 | | | PVH Corp | | | | | | | | | | | 310,508 | |
| | 25,300 | | | VF Corp | | | | | | | | | | | 2,521,398 | |
| | | | Total Textiles, Apparel & Luxury Goods | | | | | | | | | | | 3,490,217 | |
| |
| | | | Trading Companies & Distributors – 1.0% | |
| | | | |
| | 14,800 | | | Fastenal Co | | | | | | | | | | | 546,860 | |
| | 1,055 | | | United Rentals Inc, (3) | | | | | | | | | | | 175,942 | |
| | 5,000 | | | WW Grainger Inc | | | | | | | | | | | 1,692,600 | |
| | | | Total Trading Companies & Distributors | | | | | | | | | | | 2,415,402 | |
| |
| | | | Water Utilities – 0.3% | |
| | | | |
| | 6,471 | | | American Water Works Co Inc | | | | | | | | | | | 794,962 | |
| | | | Total Long-Term Investments (cost $191,425,748) | | | | | | | | | | | 240,698,103 | |
| | | | |
Principal
Amount (000) | | | Description (1) | | Coupon | | | Maturity | | | Value | |
| |
| | | | SHORT-TERM INVESTMENTS – 0.5% | |
| |
| | | | REPURCHASE AGREEMENTS – 0.5% | |
| | | | |
| $ | 1,118 | | | Repurchase Agreement with Fixed Income Clearing Corporation, dated 12/31/19,
repurchase price $1,118,313, collateralized by $1,010,000, U.S. Treasury Bonds,
3.000%, due 5/15/45, value $1,140,956 | | | 0.650% | | | | 1/02/20 | | | $ | 1,118,273 | |
| | | | Total Short-Term Investments (cost $1,118,273) | | | | | | | | | | | 1,118,273 | |
| | | | Total Investments (cost $192,544,021) – 100.3% | | | | | | | | | | | 241,816,376 | |
| | | | Other Assets Less Liabilities – (0.3)% (4) | | | | | | | | | | | (792,290 | ) |
| | | | Net Assets Applicable to Common Shares – 100% | | | | | | | | | | $ | 241,024,086 | |
22
Investments in Derivatives
Options Written
| | | | | | | | | | | | | | | | | | | | | | | | |
| Description (5) | | Type | | | Number of
Contracts | | | Notional
Amount (6) | | | Exercise
Price | | | Expiration
Date | | | Value | |
Russell 2000® Index | | | Call | | | | (200 | ) | | $ | (33,000,000 | ) | | | 1,650 | | | | 1/17/20 | | | $ | (666,000 | ) |
Russell 2000® Index | | | Call | | | | (200 | ) | | | (33,200,000 | ) | | | 1,660 | | | | 1/17/20 | | | | (523,000 | ) |
Total Options Written (premiums received $950,984) | | | | | | | (400 | ) | | $ | (66,200,000 | ) | | | | | | | | | | $ | (1,189,000 | ) |
For Fund portfolio compliance purposes, the Fund’s industry classifications refer to any one or more of the industrysub-classifications used by one or more widely recognized market indexes or ratings group indexes, and/or as defined by Fund management. This definition may not apply for purposes of this report, which may combine industrysub-classifications into sectors for reporting ease.
| (1) | All percentages shown in the Portfolio of Investments are based on net assets applicable to common shares unless otherwise noted. |
| (2) | Investment, or portion of investment, has been pledged to collateralized the net payment obligations for investments in derivatives. |
| (3) | Non-income producing; issuer has not declared a dividend within the past twelve months. |
| (4) | Other assets less liabilities includes the unrealized appreciation (depreciation) of certain over-the-counter (“OTC”) derivatives as presented on the Statement of Assets and Liabilities, when applicable. The unrealized appreciation (depreciation) of OTC-cleared and exchange-traded derivatives is recognized as part of the cash collateral at brokers and/or the receivable or payable for variation margin as presented on the Statement of Assets and Liabilities, when applicable. Other assets less liabilities also includes the value of options as presented on the Statement of Assets and Liabilities. |
| (5) | Exchange-traded, unless otherwise noted. |
| (6) | For disclosure purposes, Notional Amount is calculated by multiplying the Number of Contracts by the Exercise Price by 100. |
See accompanying notes to financial statements.
23
Statement of Assets and Liabilities
December 31, 2019
| | | | |
Assets | | | | |
Long-term investments, at value (cost $191,425,748) | | $ | 240,698,103 | |
Short-term investments, at value (cost approximates value) | | | 1,118,273 | |
Cash | | | 88,037 | |
Receivables for: | | | | |
Dividends | | | 390,350 | |
Interest | | | 20 | |
Deferred offering costs | | | 255,245 | |
Other assets | | | 32,475 | |
Total assets | | | 242,582,503 | |
Liabilities | | | | |
Options written, at value (premiums received $950,984) | | | 1,189,000 | |
Payable for Investments purchased – regular settlement | | | 67,977 | |
Accrued expenses: | | | | |
Management fees | | | 184,121 | |
Trustees fees | | | 34,775 | |
Other | | | 82,544 | |
Total liabilities | | | 1,558,417 | |
Net assets applicable to common shares | | $ | 241,024,086 | |
Common shares outstanding | | | 16,028,573 | |
Net asset value (“NAV”) per common share outstanding | | $ | 15.04 | |
Net assets applicable to common shares consist of: | | | | |
Common shares, $0.01 par value per share | | $ | 160,286 | |
Paid-in-surplus | | | 191,926,045 | |
Total distributable earnings | | | 48,937,755 | |
Net assets applicable to common shares | | $ | 241,024,086 | |
Authorized common shares | | | Unlimited | |
See accompanying notes to financial statements.
24
Statement of Operations
Year Ended December 31, 2019
| | | | |
Investment income | | | | |
Dividends | | $ | 3,768,402 | |
Interest | | | 22,988 | |
Total investment income | | | 3,791,390 | |
Expenses | | | | |
Management fees | | | 2,086,588 | |
Custodian fees | | | 60,443 | |
Trustees fees | | | 6,298 | |
Professional fees | | | 50,760 | |
Shareholder reporting expenses | | | 32,459 | |
Shareholder servicing agent fees | | | 447 | |
Stock exchange listing fees | | | 6,862 | |
Investor relations expenses | | | 19,906 | |
Other | | | 48,344 | |
Total expenses | | | 2,312,107 | |
Net investment income (loss) | | | 1,479,283 | |
Realized and Unrealized Gain (Loss) | | | | |
Net realized gain (loss) from: | | | | |
Investments | | | 4,366,627 | |
Options written | | | (1,544,346 | ) |
Change in net unrealized appreciation (depreciation) of: | | | | |
Investments | | | 49,648,637 | |
Options written | | | (219,260 | ) |
Net realized and unrealized gain (loss) | | | 52,251,658 | |
Net increase (decrease) in net assets applicable to common shares from operations | | $ | 53,730,941 | |
See accompanying notes to financial statements.
25
Statement of Changes in Net Assets
| | | | | | | | |
| | | Year
Ended
12/31/19 | | | Year
Ended
12/31/18 | |
Operations | | | | | | | | |
Net investment income (loss) | | $ | 1,479,283 | | | $ | 1,110,055 | |
Net realized gain (loss) from: | | | | | | | | |
Investments | | | 4,366,627 | | | | 13,442,959 | |
Futures contracts | | | — | | | | 31,255 | |
Options written | | | (1,544,346 | ) | | | 1,752,574 | |
Change in net unrealized appreciation (depreciation) of: | | | | | | | | |
Investments | | | 49,648,637 | | | | (31,601,847 | ) |
Futures contracts | | | — | | | | (44,113 | ) |
Options written | | | (219,260 | ) | | | (162,987 | ) |
Net increase (decrease) in net assets applicable to common shares from operations | | | 53,730,941 | | | | (15,472,104 | ) |
Distributions to Common Shareholders | | | | | | | | |
Dividends | | | (10,357,203 | ) | | | (17,785,983 | ) |
Return of capital | | | (5,671,370 | ) | | | — | |
Decrease in net assets applicable to common shares from distributions to common shareholders | | | (16,028,573 | ) | | | (17,785,983 | ) |
Capital Share Transactions | | | | | | | | |
Net proceeds from common shares issued to shareholders due to reinvestment of distributions | | | — | | | | 105,172 | |
Net increase (decrease) in net assets applicable to common shares from capital share transactions | | | — | | | | 105,172 | |
Net increase (decrease) in net assets applicable to common shares | | | 37,702,368 | | | | (33,152,915 | ) |
Net assets applicable to common shares at the beginning of period | | | 203,321,718 | | | | 236,474,633 | |
Net assets applicable to common shares at the end of period | | $ | 241,024,086 | | | $ | 203,321,718 | |
See accompanying notes to financial statements.
26
THIS PAGE INTENTIONALLY LEFT BLANK
27
Financial Highlights
Selected data for a common share outstanding throughout each period:
| | | | | | | | | | | | | | | | | | | | | | | | | | | | | | | | | | | | | | | | |
| | | | |
| | | | | | Investment Operations | | | Less Distributions to
Common Shareholders | | | Common Share | |
| | | Beginning
Common
Share
NAV | | | Net
Investment
Income
(Loss)(a) | | | Net
Realized/
Unrealized
Gain (Loss) | | | Total | | | From
Net
Investment
Income | | | From
Accumu-
lated
Net
Realized
Gains | | | Return
of
Capital | | | Total | | | Ending
NAV | | | Ending
Share
Price | |
Year Ended 12/31: | |
2019 | | $ | 12.68 | | | $ | 0.09 | | | $ | 3.27 | | | $ | 3.36 | | | $ | (0.10 | ) | | $ | (0.55 | ) | | $ | (0.35 | ) | | $ | (1.00 | ) | | $ | 15.04 | | | $ | 14.62 | |
2018 | | | 14.76 | | | | 0.07 | | | | (1.04 | ) | | | (0.97 | ) | | | (0.07 | ) | | | (1.04 | ) | | | — | | | | (1.11 | ) | | | 12.68 | | | | 12.03 | |
2017 | | | 14.27 | | | | 0.18 | | | | 2.84 | | | | 3.02 | | | | (0.17 | ) | | | (2.36 | ) | | | — | | | | (2.53 | ) | | | 14.76 | | | | 14.60 | |
2016 | | | 14.93 | | | | 0.13 | | | | 0.35 | | | | 0.48 | | | | (0.13 | ) | | | (0.44 | ) | | | (0.57 | ) | | | (1.14 | ) | | | 14.27 | | | | 13.08 | |
2015 | | | 17.49 | | | | 0.09 | | | | 0.10 | | | | 0.19 | | | | (0.10 | ) | | | (2.65 | ) | | | — | | | | (2.75 | ) | | | 14.93 | | | | 14.27 | |
28
| | | | | | | | | | | | | | | | | | | | | | |
| | | | Common Share Supplemental Data/
Ratio Applicable to Common Shares | |
Common Share
Total Returns | | | | | | Ratios to Average Net Assets | | | | |
Based
on
NAV(b) | | |
Based
on
Share
Price(b) | | | Ending
Net Assets
(000) | | | Expenses | | | Net
Investment
Income (Loss) | | | Portfolio
Turnover
Rate(c) | |
| | | | | | | | | | | | | | | | | | | | | | |
| | 26.96 | % | | | 30.26 | % | | $ | 241,024 | | | | 1.01 | % | | | 0.64 | % | | | 35 | % |
| | (7.17 | ) | | | (10.86 | ) | | | 203,322 | | | | 1.01 | | | | 0.47 | | | | 121 | |
| | 21.72 | | | | 31.85 | | | | 236,475 | | | | 1.02 | | | | 1.18 | | | | 159 | |
| | 3.25 | | | | (0.41 | ) | | | 228,600 | | | | 1.03 | | | | 0.87 | | | | 110 | |
| | 1.64 | | | | (1.70 | ) | | | 239,280 | | | | 1.03 | | | | 0.54 | | | | 93 | |
| (a) | Per share Net Investment Income (Loss) is calculated using the average daily shares method. |
| (b) | Total Return Based on Common Share NAV is the combination of changes in common share NAV, reinvested dividend income at NAV and reinvested capital gains distributions at NAV, if any. The last dividend declared in the period, which is typically paid on the first business day of the following month, is assumed to be reinvested at the ending NAV. The actual reinvest price for the last dividend declared in the period may often be based on the Fund’s market price (and not its NAV), and therefore may be different from the price used in the calculation. Total returns are not annualized. |
Total Return Based on Common Share Price is the combination of changes in the market price per share and the effect of reinvested dividend income and reinvested capital gains distributions, if any, at the average price paid per share at the time of reinvestment. The last dividend declared in the period, which is typically paid on the first business day of the following month, is assumed to be reinvested at the ending market price. The actual reinvestment for the last dividend declared in the period may take place over several days, and in some instances may not be based on the market price, so the actual reinvestment price may be different from the price used in the calculation. Total returns are not annualized.
| (c) | Portfolio Turnover Rate is calculated based on the lesser of long-term purchases or sales (as disclosed in Note 4 – Portfolio Securities and Investments in Derivatives, Investment Transactions) divided by the average long-term market value during the period. |
See accompanying notes to financial statements.
29
Notes to Financial Statements
1. General Information
Fund Information
Nuveen Core Equity Alpha Fund (the “Fund”) is registered under the Investment Company Act of 1940 (the “1940 Act”), as amended, as a diversified closed-end management investment company. The Fund’s common shares are listed on the New York Stock Exchange (“NYSE”) and trade under the ticker symbol “JCE.” The Fund was organized as a Massachusetts business trust on January 9, 2007.
The end of the reporting period for the Fund is December 31, 2019, and the period covered by these Notes to Financial Statements is the fiscal year ended December 31, 2019 (the “current fiscal period”).
Investment Adviser and Sub-Adviser
The Fund’s investment adviser is Nuveen Fund Advisors, LLC (the “Adviser”), a subsidiary of Nuveen, LLC (“Nuveen”). Nuveen is the investment management arm of Teachers Insurance and Annuity Association of America (TIAA). The Adviser has overall responsibility for management of the Fund, oversees the management of the Fund’s portfolio, manages the Fund’s business affairs and provides certain clerical, bookkeeping and other administrative services and if necessary, asset allocation decisions. The Adviser has entered into sub-advisory agreements with Intech Investment Management LLC (“Intech”), an independently managed indirect subsidiary of Janus Henderson Group plc., and Nuveen Asset Management, LLC, (“NAM”), a subsidiary of the Adviser, (each a “Sub-Adviser” and collectively, the “Sub-Advisers”). Intech manages the Fund’s investment portfolio, while NAM manages the Fund’s investments in option contracts.
2. Significant Accounting Policies
The accompanying financial statements were prepared in accordance with accounting principles generally accepted in the United States of America (“U.S. GAAP”), which may require the use of estimates made by management and the evaluation of subsequent events. Actual results may differ from those estimates. The Fund is an investment company and follows the accounting guidance in the Financial Accounting Standards Board (“FASB”) Accounting Standards Codification 946, Financial Services – Investment Companies. The net asset value (“NAV”) for financial reporting purposes may differ from the NAV for processing security and common share transactions. The NAV for financial reporting purposes includes security and common share transactions through the date of the report. Total return is computed based on the NAV used for processing security and common share transactions. The following is a summary of the significant accounting policies consistently followed by the Fund.
Compensation
The Fund pays no compensation directly to those of its trustees who are affiliated with the Adviser or to its officers, all of whom receive remuneration for their services to the Fund from the Adviser or its affiliates. The Fund’s Board of Trustees (the “Board”) has adopted a deferred compensation plan for independent trustees that enables trustees to elect to defer receipt of all or a portion of the annual compensation they are entitled to receive from certain Nuveen-advised funds. Under the plan, deferred amounts are treated as though equal dollar amounts had been invested in shares of select Nuveen-advised funds.
Distributions to Common Shareholders
Distributions to shareholders are recorded on the ex-dividend date. The amount, character and timing of distributions are determined in accordance with federal income tax regulations, which may differ from U.S. GAAP.
The Fund makes quarterly cash distributions to common shareholders of a stated dollar amount per share. Subject to approval and oversight by the Board, the Fund seeks to maintain a stable distribution level designed to deliver the long-term return potential of the Fund’s investment strategy through regular quarterly distributions (a “Managed Distribution Program”). Total distributions during a calendar year generally will be made from the Fund’s net investment income, net realized capital gains and net unrealized capital gains in the Fund’s portfolio, if any. The portion of distributions paid attributed to net unrealized gains, if any, is distributed from the Fund’s assets and is treated by shareholders as a nontaxable distribution (“return of capital”) for tax purposes. In the event that total distributions during a calendar year exceed the Fund’s total return on NAV, the difference will reduce NAV per share. If the Fund’s total return on NAV exceeds total distributions during a calendar year, the excess will be reflected as an increase in NAV per share. The final determination of the source and character of all distributions paid by the Fund during the fiscal year is made after the end of the fiscal year and is reflected in the financial statements contained in the annual report as of December 31 each year.
The tax character of Fund distributions for a fiscal year is dependent upon the amount and tax character of distributions received from securities held in the Fund’s portfolio. Distributions received from certain securities in which the Fund invests, most notably real estate investment trust securities, may be characterized for tax purposes as ordinary income, long-term capital gain and/or a return of capital. The issuer of a security reports the tax character of its
30
distributions only once per year, generally during the first two months of the calendar year. The distribution is included in the Fund’s ordinary income until such time the Fund is notified by the issuer of the actual tax character. Dividend income, net realized gain (loss) and unrealized appreciation (depreciation) recognized on the Statement of Operations reflect the amounts of ordinary income, capital gain, and/or return of capital as reported by the issuers of such securities for distributions during the current fiscal period.
Indemnifications
Under the Fund’s organizational documents, its officers and trustees are indemnified against certain liabilities arising out of the performance of their duties to the Fund. In addition, in the normal course of business, the Fund enters into contracts that provide general indemnifications to other parties. The Fund’s maximum exposure under these arrangements is unknown as this would involve future claims that may be made against the Fund that have not yet occurred. However, the Fund has not had prior claims or losses pursuant to these contracts and expects the risk of loss to be remote.
Investments and Investment Income
Securities transactions are accounted for as of the trade date for financial reporting purposes. Realized gains and losses on securities transactions are based upon the specific identification method. Dividend income is recorded on the ex-dividend date or, for foreign securities, when information is available. Non-cash dividends received in the form of stock, if any, are recognized on the ex-dividend date and recorded at fair value. Interest income is recorded on an accrual basis. Interest income also reflects payment-in-kind (“PIK”) interest and paydown gains and losses, if any. PIK interest represents income received in the form of securities in lieu of cash.
Netting Agreements
In the ordinary course of business, the Fund may enter into transactions subject to enforceable master repurchase agreements, International Swaps and Derivative Association, Inc. (ISDA) master agreements or other similar arrangements (“netting agreements”). Generally, the right to offset in netting agreements allows the Fund to offset certain securities and derivatives with a specific counterparty, when applicable, as well as any collateral received or delivered to that counterparty based on the terms of the agreements. Generally, the Fund manages its cash collateral and securities collateral on a counterparty basis.
The Fund’s investments subject to netting agreements as of the end of the reporting period, if any, are further described in Note 4 – Portfolio Securities and Investments in Derivatives.
New Accounting Pronouncements and Rule Issuances
Fair Value Measurement: Disclosure Framework
During August 2018, the FASB issued Accounting Standards Update (“ASU”) 2018-13 (“ASU 2018-13”), Fair Value Measurement: Disclosure Framework – Changes to the Disclosure Requirements for Fair Value Measurements. ASU 2018-13 modifies the disclosures required by Topic 820, Fair Value Measurements. The amendments in ASU 2018-13 are effective for all entities for fiscal years, and interim periods within those fiscal years, beginning after December 15, 2019. Management has early implemented this guidance and it did not have a material impact on the Fund’s financial statements.
3. Investment Valuation and Fair Value Measurements
The fair valuation input levels as described below are for fair value measurement purposes.
The Fund’s investments in securities are recorded at their estimated fair value. Fair value is defined as the price that would be received upon selling an investment or transferring a liability in an orderly transaction to an independent buyer in the principal or most advantageous market for the investment. A three-tier hierarchy is used to maximize the use of observable market data and minimize the use of unobservable inputs and to establish classification of fair value measurements for disclosure purposes. Observable inputs reflect the assumptions market participants would use in pricing the asset or liability. Observable inputs are based on market data obtained from sources independent of the reporting entity. Unobservable inputs reflect the reporting entity’s own assumptions about the assumptions market participants would use in pricing the asset or liability. Unobservable inputs are based on the best information available in the circumstances. The following is a summary of the three-tiered hierarchy of valuation input levels.
| | |
| Level 1 – | | Inputs are unadjusted and prices are determined using quoted prices in active markets for identical securities. |
| Level 2 – | | Prices are determined using other significant observable inputs (including quoted prices for similar securities, interest rates, credit spreads, etc.). |
| Level 3 – | | Prices are determined using significant unobservable inputs (including management’s assumptions in determining the fair value of investments). |
Common stocks and other equity-type securities are valued at the last sales price on the securities exchange on which such securities are primarily traded and are generally classified as Level 1. Securities primarily traded on the Nasdaq National Market (“Nasdaq”) are valued at the Nasdaq Official Closing Price and are generally classified as Level 1. However, securities traded on a securities exchange or Nasdaq for which there were no transactions on a given day or securities not listed on a securities exchange or Nasdaq are valued at the quoted bid price and are generally classified as Level 2.
31
Notes to Financial Statements(continued)
Prices of fixed-income securities are provided by an independent pricing service (“pricing service”) approved by the Board. The pricing service establishes a security’s fair value using methods that may include consideration of the following: yields or prices of investments of comparable quality, type of issue, coupon, maturity and rating, market quotes or indications of value from security dealers, evaluations of anticipated cash flows or collateral, general market conditions and other information and analysis, including the obligor’s credit characteristics considered relevant. These securities are generally classified as Level 2. In pricing certain securities, particularly less liquid and lower quality securities, the pricing service may consider information about a security, its issuer or market activity provided by the Adviser. These securities are generally classified as Level 2 or Level 3 depending on the observability of the significant inputs.
Index options are valued at the 4:00 p.m. Eastern Time (ET) close price of the NYSE, and are generally classified as Level 1. Options traded in the over-the-counter market are valued using an evaluated mean price and are generally classified as Level 2.
Repurchase agreements are valued at contract amount plus accrued interest, which approximates market value. These securities are generally classified as Level 2.
Certain securities may not be able to be priced by the pre-established pricing methods as described above. Such securities may be valued by the Board and/or its appointee at fair value. These securities generally include, but are not limited to, restricted securities (securities which may not be publicly sold without registration under the Securities Act of 1933, as amended) for which a pricing service is unable to provide a market price; securities whose trading has been formally suspended; debt securities that have gone into default and for which there is no current market quotation; a security whose market price is not available from a pre-established pricing source; a security with respect to which an event has occurred that is likely to materially affect the value of the security after the market has closed but before the calculation of the Fund’s NAV (as may be the case in non-U.S. markets on which the security is primarily traded) or make it difficult or impossible to obtain a reliable market quotation; and a security whose price, as provided by the pricing service, is not deemed to reflect the security’s fair value. As a general principle, the fair value of a security would appear to be the amount that the owner might reasonably expect to receive for it in a current sale. A variety of factors may be considered in determining the fair value of such securities, which may include consideration of the following: yields or prices of investments of comparable quality, type of issue, coupon, maturity and rating, market quotes or indications of value from security dealers, evaluations of anticipated cash flows or collateral, general market conditions and other information and analysis, including the obligor’s credit characteristics considered relevant. These securities are generally classified as Level 2 or Level 3 depending on the observability of the significant inputs. Regardless of the method employed to value a particular security, all valuations are subject to review by the Board and/or its appointee.
The inputs or methodologies used for valuing securities are not an indication of the risks associated with investing in those securities. The following is a summary of the Fund’s fair value measurements as of the end of the reporting period:
| | | | | | | | | | | | | | | | |
| | | Level 1 | | | Level 2 | | | Level 3 | | | Total | |
Long-Term Investments*: | | | | | | | | | | | | | | | | |
Common Stocks | | $ | 240,698,103 | | | $ | — | | | $ | — | | | $ | 240,698,103 | |
| | | | |
Short-Term Investments: | | | | | | | | | | | | | | | | |
Repurchase Agreements | | | — | | | | 1,118,273 | | | | — | | | | 1,118,273 | |
| | | | |
Investments in Derivatives: | | | | | | | | | | | | | | | | |
Options Written | | | (1,189,000 | ) | | | — | | | | — | | | | (1,189,000 | ) |
Total | | $ | 239,509,103 | | | $ | 1,118,273 | | | $ | — | | | $ | 240,627,376 | |
| * | Refer to the Fund’s Portfolio of Investments for industry classifications. |
4. Portfolio Securities and Investments in Derivatives
Portfolio Securities
Repurchase Agreements
In connection with transactions in repurchase agreements, it is the Fund’s policy that its custodian take possession of the underlying collateral securities, the fair value of which exceeds the principal amount of the repurchase transaction, including accrued interest, at all times. If the counterparty defaults, and the fair value of the collateral declines, realization of the collateral may be delayed or limited.
The following table presents the repurchase agreements for the Fund that are subject to netting agreements as of the end of the reporting period, and the collateral delivered related to those repurchase agreements.
| | | | | | | | | | | | |
| Counterparty | | Short-Term
Investments, at Value | | | Collateral
Pledged (From)
Counterparty* | | | Net
Exposure | |
Fixed Income Clearing Corporation | | $ | 1,118,273 | | | $ | (1,118,273 | ) | | $ | — | |
| * | As of the end of the reporting period, the value of the collateral pledged from the counterparty exceeded the value of the repurchase agreements. Refer to the Fund’s Portfolio of Investments for details on the repurchase agreements. |
32
Zero Coupon Securities
A zero coupon security does not pay a regular interest coupon to its holders during the life of the security. Income to the holder of the security comes from accretion of the difference between the original purchase price of the security at issuance and the par value of the security at maturity and is effectively paid at maturity. The market prices of zero coupon securities generally are more volatile than the market prices of securities that pay interest periodically.
Investment Transactions
Long-term purchases and sales (excluding derivative transactions) during the current fiscal period aggregated $79,473,714 and $94,435,231, respectively.
The Fund may purchase securities on a when-issued or delayed-delivery basis. Securities purchased on a when-issued or delayed-delivery basis may have extended settlement periods; interest income is not accrued until settlement date. Any securities so purchased are subject to market fluctuation during this period. The Fund has earmarked securities in its portfolio with a current value at least equal to the amount of the when-issued/delayed-delivery purchase commitments. If the Fund has outstanding when-issued/delayed-delivery purchases commitments as of the end of the reporting period, such amounts are recognized on the Statement of Assets and Liabilities.
Investments in Derivatives
The Fund is authorized to invest in certain derivative instruments, such as futures, options and swap contracts. The Fund limits its investments in futures, options on futures and swap contracts to the extent necessary for the Adviser to claim the exclusion from registration by the Commodity Futures Trading Commission as a commodity pool operator with respect to the Fund. The Fund records derivative instruments at fair value, with changes in fair value recognized on the Statement of Operations, when applicable. Even though the Fund’s investments in derivatives may represent economic hedges, they are not considered to be hedge transactions for financial reporting purposes.
Options Transactions
When the Fund writes an option, an amount equal to the net premium received (the premium less commission) is recognized as a component of “Options written, at value” on the Statement of Assets and Liabilities and is subsequently adjusted to reflect the current value of the written option until the option is exercised or expires or the Fund enters into a closing purchase transaction. The changes in the value of options written during the fiscal period are recognized as a component of “Change in net unrealized appreciation (depreciation) of options written” on the Statement of Operations. When an option is exercised or expires or the Fund enters into a closing purchase transaction, the difference between the net premium received and any amount paid at expiration or on executing a closing purchase transaction, including commission, is recognized as a component of “Net realized gain (loss) from options written” on the Statement of Operations. The Fund, as a writer of an option has no control over whether the underlying instrument may be sold (called) or purchased (put) and as a result bears the risk of an unfavorable change in the market value of the instrument or index underlying the written option. There is also the risk the Fund may not be able to enter into a closing transaction because of an illiquid market.
During the current fiscal period, the Fund continued to write call options on stock indexes, while investing in a portfolio of equities, to enhance returns while foregoing some upside potential of its equity portfolio.
The average notional amount of outstanding options written during the current fiscal period was as follows:
| | | | |
Average notional amount of outstanding options written* | | | $(66,915,000) | |
| * | The average notional amount is calculated based on the outstanding notional at the beginning of the current fiscal period and at the end of each fiscal quarter within the current fiscal period. |
The following table presents the fair value of all options written by the Fund as of the end of the reporting period, the location of these instruments on the Statement of Assets and Liabilities and the primary underlying risk exposure.
| | | | | | | | | | | | | | | | | | |
| | | | | Location on the Statement of Assets and Liabilities | |
Underlying
Risk Exposure | | Derivative
Instrument | | Asset Derivatives | | | | | | (Liability) Derivatives | |
| | Location | | Value | | | | | | Location | | Value | |
| Equity price | | Options written | | — | | $ | — | | | | | | | Options written, at value | | $ | (1,189,000 | ) |
The following table presents the amount of net realized gain (loss) and change in net unrealized appreciation (depreciation) recognized on options written on the Statement of Operations during the current fiscal period, and the primary underlying risk exposure.
| | | | | | | | | | |
| Underlying Risk Exposure | | Derivative
Instrument | | Net Realized
Gain (Loss) from
Options Written | | | Change in Net
Unrealized Appreciation
(Depreciation) of
Options Written | |
Equity price | | Options written | | $ | (1,544,346 | ) | | $ | (219,260 | ) |
33
Notes to Financial Statements(continued)
Market and Counterparty Credit Risk
In the normal course of business the Fund may invest in financial instruments and enter into financial transactions where risk of potential loss exists due to changes in the market (market risk) or failure of the other party to the transaction to perform (counterparty credit risk). The potential loss could exceed the value of the financial assets recorded on the financial statements. Financial assets, which potentially expose the Fund to counterparty credit risk, consist principally of cash due from counterparties on forward, option and swap transactions, when applicable. The extent of the Fund’s exposure to counterparty credit risk in respect to these financial assets approximates their carrying value as recorded on the Statement of Assets and Liabilities.
The Fund helps manage counterparty credit risk by entering into agreements only with counterparties the Adviser believes have the financial resources to honor their obligations and by having the Adviser monitor the financial stability of the counterparties. Additionally, counterparties may be required to pledge collateral daily (based on the daily valuation of the financial asset) on behalf of the Fund with a value approximately equal to the amount of any unrealized gain above a pre-determined threshold. Reciprocally, when the Fund has an unrealized loss, the Fund has instructed the custodian to pledge assets of the Fund as collateral with a value approximately equal to the amount of the unrealized loss above a pre-determined threshold. Collateral pledges are monitored and subsequently adjusted if and when the valuations fluctuate, either up or down, by at least the pre-determined threshold amount.
5. Fund Shares
Common Shares
Common Shares Equity Shelf Programs and Offering Costs
The Fund has filed a registration statement with the Securities and Exchange Commission (“SEC”) authorizing the Fund to issue additional common shares through one or more equity shelf programs (“Shelf Offering”), which became effective with the SEC during the current fiscal period.
Under this Shelf Offering, the Fund, subject to market conditions, may raise additional equity capital by issuing additional common shares from time to time in varying amounts and by different offering methods at a net price at or above the Fund’s NAV per common share. In the event the Fund’s Shelf Offering registration statement is no longer current, the Fund may not issue additional common shares until a post-effective amendment to the registration statement has been filed with the SEC.
Additional authorized common shares, common shares sold and offering proceeds, net of offering costs under the Fund’s Shelf Offering during the Fund’s current and prior fiscal period were as follows:
| | | | |
| | | Year Ended
12/31/19 | |
Additional authorized common shares | | | 1,600,000 | * |
Common shares sold | | | — | |
Offering proceeds, net of offerings cost | | | — | |
| * | Represents additional authorized common shares for the period February 25, 2019 through December 31, 2019. |
Costs incurred by the Fund in connection with its initial shelf registration are recorded as a prepaid expense and recognized as “Deferred offering costs” on the Statement of Assets and Liabilities. These costs are amortized pro rata as shares are sold and are recognized as a component of “Proceeds from shelf offering, net of offering costs” on the Statement of Changes in Net Assets. Any deferred offering costs remaining one year after effectiveness of the initial shelf registration will be expensed. Costs incurred by the Funds to keep the shelf registration current are expensed as incurred and recognized as a component of “Other expenses” on the Statement of Operations.
Common Shares Transactions
Transactions in common shares during the Fund’s current and prior fiscal period were as follows:
| | | | | | | | |
| | | Year Ended
12/31/19 | | | Year Ended
12/31/18 | |
Common shares issued to shareholders due to reinvestment of distributions | | | — | | | | 6,887 | |
6. Income Tax Information
The Fund intends to distribute substantially all of its net investment company taxable income to shareholders and to otherwise comply with the requirements of Subchapter M of the Internal Revenue Code applicable to regulated investment companies. In any year when the Fund realizes net capital gains, the Fund may choose to distribute all or a portion of its net capital gains to shareholders, or alternatively, to retain all or a portion of its net capital gains and pay federal corporate income taxes on such retained gains.
For all open tax years and all major taxing jurisdictions, management of the Fund has concluded that there are no significant uncertain tax positions that would require recognition in the financial statements. Open tax years are those that are open for examination by taxing authorities (i.e., generally the last
34
four tax year ends and the interim tax period since then). Furthermore, management of the Fund is also not aware of any tax positions for which it is reasonably possible that the total amounts of unrecognized tax benefits will significantly change in the next twelve months.
The following information is presented on an income tax basis. Differences between amounts for financial statement and federal income tax purposes are primarily due to timing differences in recognizing certain gains and losses on investment transactions and the recognition of unrealized gain or loss for tax (mark-to-market) on options contracts. To the extent that differences arise that are permanent in nature, such amounts are reclassified within the capital accounts as detailed below. Temporary differences do not require reclassification. Temporary and permanent differences do not impact the NAV of the Fund.
The table below presents the cost and unrealized appreciation (depreciation) of the Fund’s investment portfolio, as determined on a federal income tax basis, as of December 31, 2019.
For purposes of this disclosure, derivative tax cost is generally the sum of any upfront fees or premiums exchanged and any amounts unrealized for income statement reporting but realized in income and/or capital gains for tax reporting. If a particular derivative category does not disclose any tax unrealized appreciation or depreciation, the change in value of those derivatives have generally been fully realized for tax purposes.
| | | | |
Tax cost of investments | | $ | 191,441,357 | |
Gross unrealized: | | | | |
Appreciation | | $ | 53,087,755 | |
Depreciation | | | (3,901,736 | ) |
Net unrealized appreciation (depreciation) of investments | | $ | 49,186,019 | |
Permanent differences, primarily due to distribution reallocations, resulted in reclassifications among the Fund’s components of common shares net assets as of December 31, 2019, the Fund’s tax year end.
| | | | |
| The tax components of undistributed net ordinary income and net long-term capital gains as of December 31, 2019, the Fund’s tax year end, were as follows: | |
Undistributed net ordinary income | | $ | — | |
Undistributed net long-term capital gains | | | — | |
|
| The tax character of distributions paid during the Fund’s tax years ended December 31, 2019 and December 31, 2018 was designated for purposes of the dividends paid deduction as follows: | |
| 2019 | | | |
Distributions from net ordinary income1 | | $ | 1,559,550 | |
Distributions from net long-term capital gains2 | | | 8,797,653 | |
Return of capital | | | 5,671,370 | |
| |
| 2018 | | | |
Distributions from net ordinary income1 | | $ | 1,178,049 | |
Distributions from net long-term capital gains | | | 16,607,934 | |
Return of capital | | | — | |
| 1 | Net ordinary income consists of net taxable income derived from dividends, interest, and net short-term capital gains, if any. |
| 2 | The Fund designates as long-term capital gain dividend, pursuant to Internal Revenue Code Section 852(b)(3), the amount necessary to reduce earnings and profits of the Fund related to net capital gain to zero for the tax year ended December 31, 2019. |
| | | | |
|
| The Fund has elected to defer late-year losses in accordance with federal income tax rules. These losses are treated as having arisen on the first day of the following fiscal year. The Fund has elected to defer losses as follows: | |
Post-October capital losses3 | | $ | 215,930 | |
Late-year ordinary losses4 | | | — | |
| 3 | Capital losses incurred from November 1, 2019 through December 31, 2019, the Fund’s tax year end. |
| 4 | Specified losses incurred from November 1, 2019 through December 31, 2019. |
7. Management Fees
The Fund’s management fee compensates the Adviser for overall investment advisory and administrative services and general office facilities. The Sub-Advisers are compensated for their services to the Fund from the management fees paid to the Adviser.
The Fund’s management fee consists of two components – a fund-level fee, based only on the amount of assets within the Fund, and a complex-level fee, based on the aggregate amount of all eligible fund assets managed by the Adviser. This pricing structure enables Fund shareholders to benefit from growth in the assets within the Fund as well as from growth in the amount of complex-wide assets managed by the Adviser.
35
Notes to Financial Statements(continued)
The annual fund-level fee, payable monthly, is calculated according to the following schedule:
| | | | |
| Average Daily Managed Assets* | | Fund-Level Fee Rate | |
For the first $500 million | | | 0.7500 | % |
For the next $500 million | | | 0.7250 | |
For the next $500 million | | | 0.7000 | |
For the next $500 million | | | 0.6750 | |
For managed assets over $2 billion | | | 0.6500 | |
The annual complex-level fee, payable monthly, is calculated by multiplying the current complex-wide fee rate, determined according to the following schedule by the Fund’s daily managed assets:
| | | | |
| Complex-Level Eligible Asset Breakpoint Level* | | Effective Complex-Level Fee
Rate at Breakpoint Level | |
$55 billion | | | 0.2000 | % |
$56 billion | | | 0.1996 | |
$57 billion | | | 0.1989 | |
$60 billion | | | 0.1961 | |
$63 billion | | | 0.1931 | |
$66 billion | | | 0.1900 | |
$71 billion | | | 0.1851 | |
$76 billion | | | 0.1806 | |
$80 billion | | | 0.1773 | |
$91 billion | | | 0.1691 | |
$125 billion | | | 0.1599 | |
$200 billion | | | 0.1505 | |
$250 billion | | | 0.1469 | |
$300 billion | | | 0.1445 | |
| * | For the complex-level fees, managed assets include closed-end fund assets managed by the Adviser that are attributable to certain types of leverage. For these purposes, leverage includes the funds’ use of preferred stock and borrowings and certain investments in the residual interest certificates (also called inverse floating rate securities) in tender option bond (TOB) trusts, including the portion of assets held by a TOB trust that has been effectively financed by the trust’s issuance of floating rate securities, subject to an agreement by the Adviser as to certain funds to limit the amount of such assets for determining managed assets in certain circumstances. The complex-level fee is calculated based upon the aggregate daily managed assets of all Nuveen open-end and closed-end funds that constitute “eligible assets.” Eligible assets do not include assets attributable to investments in other Nuveen funds or assets in excess of a determined amount (originally $2 billion) added to the Nuveen fund complex in connection with the Adviser’s assumption of the management of the former First American Funds effective January 1, 2011, but do not include certain assets of certain Nuveen funds that were reorganized into funds advised by an affiliate of the Adviser during the 2019 calendar year. As of December 31, 2019, the complex-level fee for the Fund was 0.1562%. |
8. Borrowing Arrangements
Inter-Fund Borrowing and Lending
The SEC has granted an exemptive order permitting registered open-end and closed-end Nuveen funds to participate in an inter-fund lending facility whereby the Nuveen funds may directly lend to and borrow money from each other for temporary purposes (e.g., to satisfy redemption requests or when a sale of securities “fails,” resulting in an unanticipated cash shortfall) (the “Inter-Fund Program”). The closed-end Nuveen funds, including the Fund covered by this shareholder report, will participate only as lenders, and not as borrowers, in the Inter-Fund Program because such closed-end funds rarely, if ever, need to borrow cash to meet redemptions. The Inter-Fund Program is subject to a number of conditions, including, among other things, the requirements that (1) no fund may borrow or lend money through the Inter-Fund Program unless it receives a more favorable interest rate than is typically available from a bank or other financial institution for a comparable transaction; (2) no fund may borrow on an unsecured basis through the Inter-Fund Program unless the fund’s outstanding borrowings from all sources immediately after the inter-fund borrowing total 10% or less of its total assets; provided that if the borrowing fund has a secured borrowing outstanding from any other lender, including but not limited to another fund, the inter-fund loan must be secured on at least an equal priority basis with at least an equivalent percentage of collateral to loan value; (3) if a fund’s total outstanding borrowings immediately after an inter-fund borrowing would be greater than 10% of its total assets, the fund may borrow through the inter-fund loan on a secured basis only; (4) no fund may lend money if the loan would cause its aggregate outstanding loans through the Inter-Fund Program to exceed 15% of its net assets at the time of the loan; (5) a fund’s inter-fund loans to any one fund shall not exceed 5% of the lending fund’s net assets; (6) the duration of inter-fund loans will be limited to the time required to receive payment for securities sold, but in no event more than seven days; and (7) each inter-fund loan may be called on one business day’s notice by a lending fund and may be repaid on any day by a borrowing fund. In addition, a Nuveen fund may participate in the Inter-Fund Program only if and to the extent that such participation is consistent with the fund’s investment objective and investment policies. The Board is responsible for overseeing the Inter-Fund Program.
The limitations detailed above and the other conditions of the SEC exemptive order permitting the Inter-Fund Program are designed to minimize the risks associated with Inter-Fund Program for both the lending fund and the borrowing fund. However, no borrowing or lending activity is without risk. When a fund borrows money from another fund, there is a risk that the loan could be called on one day’s notice or not renewed, in which case the fund may have to borrow from a bank at a higher rate or take other actions to payoff such loan if an inter-fund loan is not available from another fund. Any delay in repayment to a lending fund could result in a lost investment opportunity or additional borrowing costs.
During the current reporting period, the Fund did not enter into any inter-fund loan activity.
36
Additional Fund Information(Unaudited)
| | | | | | | | |
| Board of Trustees | | | | | | | | |
| Jack B. Evans | | William C. Hunter | | Albin F. Moschner | | John K. Nelson | | Judith M. Stockdale |
| Carole E. Stone | | Terence J. Toth | | Margaret L. Wolff | | Robert L. Young | | |
| | | | | | | | |
| | | | | |
Investment Adviser Nuveen Fund Advisors, LLC 333 West Wacker Drive Chicago, IL 60606 | | Custodian State Street Bank
& Trust Company One Lincoln Street Boston, MA 02111 | | Legal Counsel Chapman and Cutler LLP Chicago, IL 60603 | | Independent Registered
Public Accounting Firm PricewaterhouseCoopers LLP One North Wacker Drive Chicago, IL 60606 | | Transfer Agent and
Shareholder Services Computershare Trust Company, N.A. 150 Royall Street Canton, MA 02021 (800) 257-8787 |
Distribution Information
The Fund hereby designates its percentage of dividends paid from net ordinary income as dividends qualifying for the dividends received deduction (“DRD”) for corporations and its percentage as qualified dividend income (“QDI”) for individuals under Section 1(h)(11) of the Internal Revenue Code as shown in the accompanying table. The actual qualified dividend income distributions will be reported to shareholders on Form 1099-DIV which will be sent to shareholders shortly after calendar year end.
| | | | |
% of QDI | | | 100.0% | |
% of DRD | | | 100.0% | |
Portfolio of Investments Information
The Fund is required to file its complete schedule of portfolio holdings with the Securities and Exchange Commission (SEC) for the first and third quarters of each fiscal year as an exhibit to its report on Form N-PORT. You may obtain this information on the SEC’s website at http://www.sec.gov.
Nuveen Funds’ Proxy Voting Information
You may obtain (i) information regarding how each fund voted proxies relating to portfolio securities held during the most recent twelve-month period ended June 30, without charge, upon request, by calling Nuveen toll-free at (800) 257-8787 or on Nuveen’s website at www.nuveen.com and (ii) a description of the policies and procedures that each fund used to determine how to vote proxies relating to portfolio securities without charge, upon request, by calling Nuveen toll free at(800) 257-8787. You may also obtain this information directly from the SEC. Visit the SEC on-line at http://www.sec.gov.
CEO Certification Disclosure
The Fund’s Chief Executive Officer (CEO) has submitted to the New York Stock Exchange (NYSE) the annual CEO certification as required by Section 303A.12(a) of the NYSE Listed Company Manual. The Fund has filed with the SEC the certification of its CEO and Chief Financial Officer required by Section 302 of theSarbanes-Oxley Act.
Common Share Repurchases
The Fund intends to repurchase, through its open-market share repurchase program, shares of its own common stock at such times and in such amounts as is deemed advisable. During the period covered by this report, the Fund repurchased shares of its common stock, as shown in the accompanying table. Any future repurchases will be reported to shareholders in the next annual or semi-annual report.
| | | | |
| | | JCE | |
Common shares repurchased | | | — | |
FINRA BrokerCheck
The Financial Industry Regulatory Authority (FINRA) provides information regarding the disciplinary history of FINRA member firms and associated investment professionals. This information as well as an investor brochure describing FINRA BrokerCheck is available to the public by calling the FINRA BrokerCheck Hotline number at (800) 289-9999 or by visiting www.FINRA.org.
37
Glossary of Terms Used in this Report
(Unaudited)
| ∎ | | Average Annual Total Return: This is a commonly used method to express an investment’s performance over a particular, usually multi-year time period. It expresses the return that would have been necessary each year to equal the investment’s actual cumulative performance (including change in NAV or market price and reinvested dividends and capital gains distributions, if any) over the time period being considered. |
| ∎ | | Blended Index: A blend of returns consisting of 1) 50% of the S&P 500® Index and 2) 50% of the CBOE S&P 500® Buy/write Index(BXM), which is a passive total return index based on selling the near-term, at-the-money S&P 500® Index (SPX) call option against the S&P 500® Index portfolio each month, on the day the current contract expires. Index returns assume reinvestment of distributions, but do not include the effects of any applicable sales charges or management fees. |
| ∎ | | Chicago Board Options Exchange (CBOE) Volatility Index® (VIX®): An index that is a key measure of market expectations of near-term volatility conveyed by S&P 500® option prices. Since its introduction in 1993, VIX has been considered by many to be the world’s premier barometer of investor sentiment and market volatility (www.cboe.com). Index returns assume reinvestment of distributions, but do not include the effects of any applicable sales charges or management fees. |
| ∎ | | Gross Domestic Product (GDP): The total market value of all final goods and services produced in a country/region in a given year, equal to total consumer, investment and government spending, plus the value of exports, minus the value of imports. |
| ∎ | | Net Asset Value (NAV) Per Share: A fund’s Net Assets is equal to its total assets (securities, cash, accrued earnings and receivables) less its total liabilities. NAV per share is equal to the fund’s Net Assets divided by its number of shares outstanding. |
| ∎ | | Russell 2000® Index: A market-weighted index published by the Frank Russell Company measuring the performance of the 2,000 smallest companies in the Russell 3000® Index. The Russell 3000® is made up of 3,000 of the largest U.S. stocks and represents approximately 98% of the U.S. equity market. The Russell 2000® serves as a benchmark for small-cap stocks in the U.S. Index returns assume reinvestment of distributions, but do not reflect any applicable sales charges or management fees. |
| ∎ | | S&P 500®: An unmanaged index generally considered representative of the U.S. stock market. Index returns assume reinvestment of distributions, but do not reflect any applicable sales charges or management fees. |
38
Reinvest Automatically, Easily and Conveniently
Nuveen makes reinvesting easy. A phone call is all it takes to set up your reinvestment account.
Nuveen Closed-End Funds Automatic Reinvestment Plan
Your Nuveen Closed-End Fund allows you to conveniently reinvest distributions in additional Fund shares.
By choosing to reinvest, you’ll be able to invest money regularly and automatically, and watch your investment grow through the power of compounding. Just like distributions in cash, there may be times when income or capital gains taxes may be payable on distributions that are reinvested.
It is important to note that an automatic reinvestment plan does not ensure a profit, nor does it protect you against loss in a declining market.
Easy and convenient
To make recordkeeping easy and convenient, each quarter you’ll receive a statement showing your total distributions, the date of investment, the shares acquired and the price per share, and the total number of shares you own.
How shares are purchased
The shares you acquire by reinvesting will either be purchased on the open market or newly issued by the Fund. If the shares are trading at or above net asset value at the time of valuation, the Fund will issue new shares at the greater of the net asset value or 95% of the then-current market price. If the shares are trading at less than net asset value, shares for your account will be purchased on the open market. If the Plan Agent begins purchasing Fund shares on the open market while shares are trading below net asset value, but the Fund’s shares subsequently trade at or above their net asset value before the Plan Agent is able to complete its purchases, the Plan Agent may cease open-market purchases and may invest the uninvested portion of the distribution in newly-issued Fund shares at a price equal to the greater of the shares’ net asset value or 95% of the shares’ market value on the last business day immediately prior to the purchase date. Distributions received to purchase shares in the open market will normally be invested shortly after the distribution payment date. No interest will be paid on distributions awaiting reinvestment. Because the market price of the shares may increase before purchases are completed, the average purchase price per share may exceed the market price at the time of valuation, resulting in the acquisition of fewer shares than if the distribution had been paid in shares issued by the Fund. A pro rata portion of any applicable brokerage commissions on open market purchases will be paid by Plan participants. These commissions usually will be lower than those charged on individual transactions.
Flexible
You may change your distribution option or withdraw from the Plan at any time, should your needs or situation change.
You can reinvest whether your shares are registered in your name, or in the name of a brokerage firm, bank, or other nominee. Ask your investment advisor if his or her firm will participate on your behalf. Participants whose shares are registered in the name of one firm may not be able to transfer the shares to another firm and continue to participate in the Plan.
The Fund reserves the right to amend or terminate the Plan at any time. Although the Fund reserves the right to amend the Plan to include a service charge payable by the participants, there is no direct service charge to participants in the Plan at this time.
Call today to start reinvesting distributions
For more information on the Nuveen Automatic Reinvestment Plan or to enroll in or withdraw from the Plan, speak with your financial advisor or call us at (800) 257-8787.
39
Board Members & Officers
(Unaudited)
The management of the Funds, including general supervision of the duties performed for the Funds by the Adviser, is the responsibility of the Board of Trustees of the Funds. The number of trustees of the Funds is set at nine. None of the trustees who are not “interested” persons of the Funds (referred to herein as “independent board members”) has ever been a director or employee of, or consultant to, Nuveen or its affiliates. The names and business addresses of the trustees and officers of the Funds, their principal occupations and other affiliations during the past five years, the number of portfolios each Trustee oversees and other directorships they hold are set forth below.
| | | | | | | | |
| | | | |
| | | | | | | | | |
Name, Year of Birth & Address | | Position(s) Held with the Funds | | Year First Elected or Appointed and Term(1)
| | Principal Occupation(s) Including other Directorships During Past 5 Years | | Number of Portfolios in Fund Complex Overseen by Board Member |
| | | | |
| | | | | | | | | |
|
| Independent Board Members: |
| | | | |
∎ TERENCE J. TOTH | | | | | | Formerly, aCo-Founding Partner, Promus Capital (2008-2017); Director, Quality Control Corporation (since 2012); member: Catalyst Schools of Chicago Board (since 2008) and Mather Foundation Board (since 2012), and chair of its Investment Committee; formerly, Director, Fulcrum IT Services LLC (2010-2019); formerly, Director, Legal & General Investment Management America, Inc. (2008-2013); formerly, CEO and President, Northern Trust Global Investments (2004-2007): Executive Vice President, Quantitative Management & Securities Lending (2000-2004); prior thereto, various positions with Northern Trust Company (since 1994); formerly, Member, Northern Trust Mutual Funds Board (2005-2007), Northern Trust Global Investments Board (2004-2007), Northern Trust Japan Board (2004-2007), Northern Trust Securities Inc. Board (2003-2007) and Northern Trust Hong Kong Board (1997-2004). | | |
1959 333 W. Wacker Drive Chicago, IL 60606 | | Chairman and Board Member | | 2008 Class II | | 157 |
| | | | | | |
| | | | |
∎ JACK B. EVANS | | | | | | Chairman (since 2019), formerly, President (1996-2019), The Hall-Perrine Foundation, a private philanthropic corporation; Director and Chairman, United Fire Group, a publicly held company; Director, Public Member, American Board of Orthopaedic Surgery (since 2015); Life Trustee of Coe College and the Iowa College Foundation; formerly, PresidentPro-Tem of the Board of Regents for the State of Iowa University System; formerly, Director, Alliant Energy and The Gazette Company; formerly, Director, Federal Reserve Bank of Chicago; formerly, President and Chief Operating Officer, SCI Financial Group, Inc., a regional financial services firm. | | |
1948 333 W. Wacker Drive Chicago, IL 60606 | | Board Member | | 1999 Class III | | 157 |
| | | | | | |
| | | | |
∎ WILLIAM C. HUNTER | | | | | | Dean Emeritus, formerly, Dean, Tippie College of Business, University of Iowa (2006-2012); Director of Wellmark, Inc. (since 2009); past Director (2005-2015), and past President (2010-2014) Beta Gamma Sigma, Inc., The International Business Honor Society; formerly, Director (2004-2018) of Xerox Corporation; Dean and Distinguished Professor of Finance, School of Business at the University of Connecticut (2003-2006); previously, Senior Vice President and Director of Research at the Federal Reserve Bank of Chicago (1995-2003); formerly, Director (1997-2007), Credit Research Center at Georgetown University. | | |
1948 333 W. Wacker Drive Chicago, IL 60606 | | Board Member | | 2003 Class I | | 157 |
| | | | |
| | | | |
∎ ALBIN F. MOSCHNER | | | | | | Founder and Chief Executive Officer, Northcroft Partners, LLC, a management consulting firm (since 2012); formerly, Chairman (2019), and Director (2012-2019), USA Technologies, Inc., a provider of solutions and services to facilitate electronic payment transactions; formerly, Director, Wintrust Financial Corporation (1996-2016); previously, held positions at Leap Wireless International, Inc., including Consultant (2011-2012), Chief Operating Officer (2008-2011), and Chief Marketing Officer (2004-2008); formerly, President, Verizon Card Services division of Verizon Communications, Inc. (2000-2003); formerly, President, One Point Services at One Point Communications (1999-2000); formerly, Vice Chairman of the Board, Diba, Incorporated (1996-1997); formerly, various executive positions (1991-1996) and Chief Executive Officer (1995-1996) of Zenith Electronics Corporation. | | |
1952 333 W. Wacker Drive Chicago, IL 60606 | | Board Member | | 2016 Class III | | 157 |
| | | | | | |
40
| | | | | | | | |
| | | | |
| | | | | | | | | |
Name, Year of Birth & Address | | Position(s) Held with the Funds | | Year First Elected or Appointed and Term(1)
| | Principal Occupation(s) Including other Directorships During Past 5 Years | | Number of Portfolios in Fund Complex Overseen by Board Member |
| | | | |
| | | | | | | | | |
|
| Independent Board Members (continued): |
| | | | |
∎ JOHN K. NELSON | | | | | | Member of Board of Directors of Core12 LLC. (since 2008), a private firm which develops branding, marketing and communications strategies for clients; served The President’s Council of Fordham University (2010-2019) and previously a Director of the Curran Center for Catholic American Studies (2009-2018); formerly, senior external advisor to the Financial Services practice of Deloitte Consulting LLP. (2012-2014); former Chair of the Board of Trustees of Marian University (2010-2014 as trustee, 2011-2014 as Chair); formerly Chief Executive Officer of ABN AMRO Bank N.V., North America, and Global Head of the Financial Markets Division (2007-2008), with various executive leadership roles in ABN AMRO Bank N.V. between 1996 and 2007. | | |
1962 333 W. Wacker Drive Chicago, IL 60606 | | Board Member | | 2013 Class II | | 157 |
| | | | | | |
| | | | |
∎ JUDITH M. STOCKDALE | | | | | | Board Member, Land Trust Alliance (since 2013); formerly, Board Member, U.S. Endowment for Forestry and Communities (2013-2019); formerly, Executive Director(1994-2012), Gaylord and Dorothy Donnelley Foundation; prior thereto, Executive Director, Great Lakes Protection Fund (1990-1994). | | |
1947 333 W. Wacker Drive Chicago, IL 60606 | | Board Member | | 1997 Class I | | 157 |
| | | | |
∎ CAROLE E. STONE | | | | | | Former Director, Chicago Board Options Exchange, Inc. (2006-2017); and C2 Options Exchange, Incorporated (2009-2017); Director, Cboe, Global Markets, Inc., formerly, CBOE Holdings, Inc. (since 2010); formerly, Commissioner, New York State Commission on Public Authority Reform (2005-2010). | | |
1947 333 W. Wacker Drive Chicago, IL 60606 | | Board Member | | 2007 Class I | | 157 |
| | | | |
∎ MARGARET L. WOLFF | | | | | | Formerly, member of the Board of Directors (2013-2017) of Travelers Insurance Company of Canada and The Dominion of Canada General Insurance Company (each, a part of Travelers Canada, the Canadian operation of The Travelers Companies, Inc.); formerly, Of Counsel, Skadden, Arps, Slate, Meagher & Flom LLP (Mergers & Acquisitions Group) (2005-2014); Member of the Board of Trustees of New York-Presbyterian Hospital (since 2005); Member (since 2004) and Chair (since 2015) of the Board of Trustees of The John A. Hartford Foundation (a philanthropy dedicated to improving the care of older adults); formerly, Member (2005-2015) and Vice Chair (2011-2015) of the Board of Trustees of Mt. Holyoke College. | | |
1955 333 W. Wacker Drive Chicago, IL 60606 | | Board Member | | 2016 Class I | | 157 |
| | | | | | |
| | | | |
∎ ROBERT L. YOUNG(2) | | | | | | Formerly, Chief Operating Officer and Director, J.P.Morgan Investment Management Inc. (2010-2016); formerly, President and Principal Executive Officer (2013-2016), and Senior Vice President and Chief Operating Officer (2005-2010), of J.P.Morgan Funds; formerly, Director and various officer positions for J.P.Morgan Investment Management Inc. (formerly, JPMorgan Funds Management, Inc. and formerly, One Group Administrative Services) and JPMorgan Distribution Services, Inc. (formerly, One Group Dealer Services, Inc.) (1999-2017). | | |
1963 333 W. Wacker Drive Chicago, IL 60606 | | Board Member | | 2017 Class II | | 157 |
| | | | | | |
41
Board Members & Officers(continued)
(Unaudited)
| | | | | | | | |
| | | | |
| | | | | | | | | |
Name, Year of Birth & Address | | Position(s) Held
with the Funds | | Year First
Elected or
Appointed(3) | | Principal Occupation(s) During Past 5 Years | | |
| | | | |
| | | | | | | | | |
| | | | |
| Officers of the Funds: | | | | | | | | |
| | | | |
∎ CEDRIC H. ANTOSIEWICZ | | | | | | Senior Managing Director (since 2017), formerly, Managing Director (2004-2017) of Nuveen Securities, LLC; Senior Managing Director (since 2017), formerly, Managing Director (2014-2017) of Nuveen Fund Advisors, LLC. | | |
1962 333 W. Wacker Drive Chicago, IL 60606 | | Chief Administrative Officer | | 2007 | | |
| | | | |
∎ NATHANIEL T. JONES | | | | | | Managing Director (since 2017), formerly, Senior Vice President (2016-2017), formerly, Vice President (2011-2016) of Nuveen; Managing Director (since 2015) of Nuveen Fund Advisors, LLC; Chartered Financial Analyst. | | |
1979 333 W. Wacker Drive Chicago, IL 60606 | | Vice President and Treasurer | | 2016 | | |
| | | | |
∎ WALTER M. KELLY | | | | | | Managing Director (since 2017), formerly, Senior Vice President(2008-2017) of Nuveen. | | |
1970 333 W. Wacker Drive Chicago, IL 60606 | | Chief Compliance Officer and Vice President | | 2003 | | |
| | | | |
∎ DAVID J. LAMB | | | | | | Managing Director (since 2017), formerly, Senior Vice President of Nuveen (since 2006), Vice President prior to 2006. | | |
1963 333 W. Wacker Drive Chicago, IL 60606 | | Vice President | | 2015 | | |
| | | | |
∎ TINA M. LAZAR | | | | | | Managing Director (since 2017), formerly, Senior Vice President(2014-2017) of Nuveen Securities, LLC. | | |
1961 333 W. Wacker Drive Chicago, IL 60606 | | Vice President | | 2002 | | |
| | | | |
∎ BRIAN J. LOCKHART | | | | | | Managing Director (since 2019) of Nuveen Fund Advisors, LLC; Managing Director (since 2017), formerly, Vice President (2010-2017) of Nuveen; Head of Investment Oversight (since 2017), formerly, Team Leader of Manager Oversight (2015-2017); Chartered Financial Analyst and Certified Financial Risk Manager. | | |
1974 333 W. Wacker Drive Chicago, IL 60606 | | Vice President | | 2019 | | |
| | | | | | |
| | | | |
∎ JACQUES M. LONGERSTAEY | | | | | | Senior Managing Director, Chief Risk Officer, Nuveen, LLC (since May 2019); Senior Managing Director (since May 2019) of Nuveen Fund Advisors, LLC; formerly, Chief Investment and Model Risk Officer, Wealth & Investment Management Division, Wells Fargo Bank (NA) (from 2013-2019). | | |
1963 8500 Andrew Carnegie Blvd. Charlotte, NC 28262 | | Vice President | | 2019 | | |
| | | | | | |
42
| | | | | | | | |
| | | | |
| | | | | | | | | |
Name, Year of Birth & Address | | Position(s) Held with the Funds | | Year First Elected or Appointed(3) | | Principal Occupation(s) During Past 5 Years | | |
| | | | |
| | | | | | | | | |
| | |
| Officers of the Funds (continued): | | | | |
| | | | |
∎ KEVIN J. MCCARTHY | | | | | | Senior Managing Director (since 2017) and Secretary and General Counsel (since 2016) of Nuveen Investments, Inc., formerly, Executive Vice President (2016-2017) and Managing Director and Assistant Secretary (2008-2016); Senior Managing Director (since 2017) and Assistant Secretary (since 2008) of Nuveen Securities, LLC, formerly Executive Vice President (2016-2017) and Managing Director (2008-2016); Senior Managing Director (since 2017), Secretary (since 2016) andCo-General Counsel (since 2011) of Nuveen Fund Advisors, LLC, formerly, Executive Vice President (2016-2017), Managing Director (2008-2016) and Assistant Secretary (2007-2016); Senior Managing Director (since 2017), Secretary (since 2016) and Associate General Counsel (since 2011) of Nuveen Asset Management, LLC, formerly Executive Vice President (2016-2017) and Managing Director and Assistant Secretary (2011-2016); Senior Managing Director (since 2017) and Secretary (since 2016) of Nuveen Investments Advisers, LLC, formerly Executive Vice President (2016-2017); Vice President (since 2007) and Secretary (since 2016), formerly, Assistant Secretary, of NWQ Investment Management Company, LLC, Symphony Asset Management LLC, Santa Barbara Asset Management, LLC and Winslow Capital Management, LLC (since 2010). Senior Managing Director (since 2017) and Secretary (since 2016) of Nuveen Alternative Investments, LLC. | | |
1966 333 W. Wacker Drive Chicago, IL 60606 | | Vice President and Assistant Secretary | | 2007 | | |
| | | | | | |
| | | | |
∎ JON SCOTT MEISSNER | | | | | | Managing Director of Mutual Fund Tax and Financial Reporting groups at Nuveen (since 2017); Managing Director of Nuveen Fund Advisors, LLC (since 2019); Senior Director of Teachers Advisors, LLC and TIAA-CREF Investment Management, LLC (since 2016); Senior Director (since 2015) Mutual Fund Taxation to the TIAA-CREF Funds, the TIAA-CREF Life Funds, the TIAA Separate AccountVA-1 and the CREF Accounts; has held various positions with TIAA since 2004. | | |
1973 8500 Andrew Carnegie Blvd. Charlotte, NC 28262 | | Vice President | | 2019 | | |
| | | | | | |
| | | | |
∎ WILLIAM T. MEYERS | | | | | | Senior Managing Director (since 2017), formerly, Managing Director(2016-2017), Senior Vice President (2010-2016) of Nuveen Securities, LLC and Nuveen Fund Advisors, LLC; Senior Managing Director (since 2017), formerly, Managing Director (2016-2017), Senior Vice President (2010-2016) of Nuveen, has held various positions with Nuveen since 1991. | | |
1966 333 W. Wacker Drive Chicago, IL 60606 | | Vice President | | 2018 | | |
| | | | | | |
| | | | |
∎ MICHAEL A. PERRY | | | | | | Executive Vice President (since 2017), previously Managing Director (from 2016), of Nuveen Fund Advisors, LLC and Nuveen Alternative Investments, LLC; Executive Vice President (since 2017), formerly, Managing Director(2015-2017), of Nuveen Securities, LLC; formerly, Managing Director(2010-2015) of UBS Securities, LLC. | | |
1967 333 W. Wacker Drive Chicago, IL 60606 | | Vice President | | 2017 | | |
| | | | | | |
| | | |
∎ CHRISTOPHER M. ROHRBACHER | | | | Managing Director (since 2017) and Assistant Secretary of Nuveen Securities, LLC; Managing Director (since 2017), formerly, Senior Vice President(2016-2017),Co-General Counsel (since 2019) and Assistant Secretary (since 2016) of Nuveen Fund Advisors, LLC; Managing Director (since 2017), formerly, Senior Vice President (2012-2017) and Associate General Counsel (since 2016), formerly, Assistant General Counsel (2008-2016) of Nuveen. | | |
1971 333 W. Wacker Drive Chicago, IL 60606 | | Vice President and Assistant Secretary | | 2008 | | |
| | | | | | |
| | | | |
∎ WILLIAM A. SIFFERMANN | | | | | | Managing Director (since 2017), formerly Senior Vice President (2016-2017) and Vice President (2011-2016) of Nuveen. | | |
1975 333 W. Wacker Drive Chicago, IL 60606 | | Vice President | | 2017 | | |
43
Board Members & Officers(continued)
(Unaudited)
| | | | | | | | |
| | | | |
| | | | | | | | | |
Name, Year of Birth & Address | | Position(s) Held with the Funds | | Year First Elected or Appointed(3) | | Principal Occupation(s) During Past 5 Years | | |
| | | | |
| | | | | | | | | |
| | |
| Officers of the Funds (continued): | | | | |
| | | | |
∎ E. SCOTT WICKERHAM | | | | | | Senior Managing Director, Head of Fund Administration at Nuveen, LLC (since 2019), formerly, Managing Director; Senior Managing Director (since 2019), Nuveen Fund Advisers, LLC; Principal Financial Officer, Principal Accounting Officer and Treasurer (since 2017) to the TIAA-CREF Funds, the TIAA-CREF Life Funds, the TIAA Separate AccountVA-1 and the Treasurer (since 2017) to the CREF Accounts; Senior Director, TIAA-CREF Fund Administration (2014-2015); has held various positions with TIAA since 2006. | | |
1973 TIAA 730 Third Avenue New York, NY 10017 | | Vice President and Controller | | 2019 | | |
| | | | | | |
| | | | |
∎ MARK L. WINGET | | | | | | Vice President and Assistant Secretary of Nuveen Securities, LLC (since 2008); Vice President and Assistant Secretary of Nuveen Fund Advisors, LLC (since 2019); Vice President (since 2010) and Associate General Counsel (since 2016), formerly, Assistant General Counsel (2008-2016) of Nuveen. | | |
1968 333 W. Wacker Drive Chicago, IL 60606 | | Vice President and Assistant Secretary | | 2008 | | |
| | | | |
∎ GIFFORD R. ZIMMERMAN | | | | | | Managing Director (since 2002), and Assistant Secretary of Nuveen Securities, LLC; Managing Director (since 2004) and Assistant Secretary (since 1994) of Nuveen Investments, Inc.; Managing Director (since 2002), Assistant Secretary (since 1997) andCo-General Counsel (since 2011) of Nuveen Fund Advisors, LLC; Managing Director, Assistant Secretary and Associate General Counsel of Nuveen Asset Management, LLC (since 2011); Vice President (since 2017), formerly, Managing Director (2003-2017) and Assistant Secretary (since 2003) of Symphony Asset Management LLC; Managing Director and Assistant Secretary (since 2002) of Nuveen Investments Advisers, LLC; Vice President and Assistant Secretary of NWQ Investment Management Company, LLC (since 2002), Santa Barbara Asset Management, LLC (since 2006), and of Winslow Capital Management, LLC, (since 2010); Chartered Financial Analyst. | | |
1956 333 W. Wacker Drive Chicago, IL 60606 | | Vice President Secretary | | 1988 | | |
| | | | | | |
| (1) | The Board of Trustees is divided into three classes, Class I, Class II, and Class III, with each being elected to serve until the third succeeding annual shareholders’ meeting subsequent to its election or thereafter in each case when its respective successors are duly elected or appointed, except two board members are elected by the holders of Preferred Shares, when applicable, to serve until the next annual shareholders’ meeting subsequent to its election or thereafter in each case when its respective successors are duly elected or appointed. The year first elected or appointed represents the year in which the board member was first elected or appointed to any fund in the Nuveen complex. |
| (2) | Effective July 1, 2017, Mr. Young was appointed as a Board Member of each of the Nuveen Funds except Nuveen Diversified Dividend and Income Fund (JDD) and Nuveen Real Estate Income Fund (JRS). Effective February 27, 2020, Mr. Young was appointed as a Board Member of JDD and JRS. |
| (3) | Officers serve one year terms through August of each year. The year first elected or appointed represents the year in which the Officer was first elected or appointed to any fund in the Nuveen complex. |
44
Notes
45
Notes
46
Notes
47
Nuveen:
Serving Investors for Generations
Since 1898, financial advisors and their clients have relied on Nuveen to provide
dependable investment solutions through continued adherence to proven, long-term investing
principles. Today, we offer a range of high quality solutions designed to
be integral components of a well-diversified core portfolio.
Focused on meeting investor needs.
Nuveen is the investment manager of TIAA. We have grown into one of the world’s premier global asset managers, with specialist knowledge across all major asset classes and particular strength in solutions that provide income for investors and that draw on our expertise in alternatives and responsible investing. Nuveen is driven not only by the independent investment processes across the firm, but also the insights, risk management, analytics and other tools and resources that a truly world-class platform provides. As a global asset manager, our mission is to work in partnership with our clients to create solutions which help them secure their financial future.
Find out how we can help you.
To learn more about how the products and services of Nuveen may be able to help you meet your financial goals, talk to your financial advisor, or call us at(800) 257-8787. Please read the information provided carefully before you invest. Investors should consider the investment objective and policies, risk considerations, charges and expenses of any investment carefully.
Where applicable, be sure to obtain a prospectus, which contains this and other relevant information. To obtain a prospectus, please contact your securities representative or Nuveen, 333 W. Wacker Dr., Chicago, IL 60606. Please read the prospectus carefully before you invest or send money.
Learn more about Nuveen Funds at:www.nuveen.com/closed-end-funds
| | | | |
Nuveen Securities, LLC, member FINRA and SIPC |
333 West Wacker Drive Chicago, IL 60606 | www.nuveen.com | | | | EAN-F-1219D
1077300-INV-Y-02/21 |
ITEM 2. CODE OF ETHICS.
As of the end of the period covered by this report, the registrant has adopted a code of ethics that applies to the registrant’s principal executive officer, principal financial officer, principal accounting officer or controller, or persons performing similar functions. There were no amendments to or waivers from the Code during the period covered by this report. The registrant has posted the code of ethics on its website at www.nuveen.com/fund-governance. (To view the code, click on Code of Conduct.)
ITEM 3. AUDIT COMMITTEE FINANCIAL EXPERT.
As of the end of the period covered by this report, the registrant’s Board of Directors or Trustees (“Board”) determined that the registrant has at least one “audit committee financial expert” (as defined in Item 3 of Form N-CSR) serving on its Audit Committee. The registrant’s audit committee financial experts are Carole E. Stone, Jack B. Evans and William C. Hunter, who are “independent” for purposes of Item 3 of Form N-CSR.
Ms. Stone served for five years as Director of the New York State Division of the Budget. As part of her role as Director, Ms. Stone was actively involved in overseeing the development of the State’s operating, local assistance and capital budgets, its financial plan and related documents; overseeing the development of the State’s bond-related disclosure documents and certifying that they fairly presented the State’s financial position; reviewing audits of various State and local agencies and programs; and coordinating the State’s system of internal audit and control. Prior to serving as Director, Ms. Stone worked as a budget analyst/examiner with increasing levels of responsibility over a 30 year period, including approximately five years as Deputy Budget Director. Ms. Stone has also served as Chair of the New York State Racing Association Oversight Board, as Chair of the Public Authorities Control Board, as a Commissioner on the New York State Commission on Public Authority Reform and as a member of the Boards of Directors of several New York State public authorities. These positions have involved overseeing operations and finances of certain entities and assessing the adequacy of project/entity financing and financial reporting. Currently, Ms. Stone is on the Board of Directors of CBOE Holdings, Inc., of the Chicago Board Options Exchange, and of C2 Options Exchange. Ms. Stone’s position on the boards of these entities and as a member of both CBOE Holdings’ Audit Committee and its Finance Committee has involved, among other things, the oversight of audits, audit plans and preparation of financial statements.
Mr. Evans was formerly President and Chief Operating Officer of SCI Financial Group, Inc., a full service registered broker-dealer and registered investment adviser (“SCI”). As part of his role as President and Chief Operating Officer, Mr. Evans actively supervised the Chief Financial Officer (the “CFO”) and actively supervised the CFO’s preparation of financial statements and other filings with various regulatory authorities. In such capacity, Mr. Evans was actively involved in the preparation of SCI’s financial statements and the resolution of issues raised in connection therewith. Mr. Evans has also served on the audit committee of various reporting companies. At such companies, Mr. Evans was involved in the oversight of audits, audit plans, and the preparation of financial statements. Mr. Evans also formerly chaired the audit committee of the Federal Reserve Bank of Chicago.
Mr. Hunter was formerly a Senior Vice President at the Federal Reserve Bank of Chicago. As part of his role as Senior Vice President, Mr. Hunter was the senior officer responsible for all operations of each of the Economic Research, Statistics, and Community and Consumer Affairs units at the Federal Reserve Bank of Chicago. In such capacity, Mr. Hunter oversaw the subunits of the Statistics and Community and Consumer Affairs divisions responsible for the analysis and evaluation of bank and bank holding company financial statements and financial filings. Prior to serving as Senior Vice President at the Federal Reserve Bank of Chicago, Mr. Hunter was the Vice President of the Financial Markets unit at the Federal Reserve Bank of Atlanta where he supervised financial staff and bank holding company analysts who analyzed and evaluated bank and bank holding company financial statements. Mr. Hunter also currently serves on the Boards of Directors of Xerox Corporation and Wellmark, Inc. as well as on the Audit Committees of such Boards. As an Audit Committee member, Mr. Hunter’s responsibilities include, among other things, reviewing financial statements, internal audits and internal controls over financial reporting. Mr. Hunter also formerly was a Professor of Finance at the University of Connecticut School of Business and has authored numerous scholarly articles on the topics of finance, accounting and economics.
ITEM 4. PRINCIPAL ACCOUNTANT FEES AND SERVICES.
The following tables show the amount of fees that PricewaterhouseCoopers LLP, the Fund’s auditor, billed to the Fund during the Fund’s last two full fiscal years. For engagements with PricewaterhouseCoopers LLP the Audit Committee approved in advance all audit services and non-audit services that PricewaterhouseCoopers LLP provided to the Fund, except for those non-audit services that were subject to the pre-approval exception under Rule 2-01 of Regulation S-X (the “pre-approval exception”). The pre-approval exception for services provided directly to the Fund waives the pre-approval requirement for services other than audit, review or attest ser
vices if: (A) the aggregate amount of all such services provided constitutes no more than 5% of the total amount of revenues paid by the Fund to its accountant during the fiscal year in which the services are provided; (B) the Fund did not recognize the services as non-audit services at the time of the engagement; and (C) the services are promptly brought to the Audit Committee’s attention, and the Committee (or its delegate) approves the services before the audit is completed.
The Audit Committee has delegated certain pre-approval responsibilities to its Chair (or, in her absence, any other member of the Audit Committee).
SERVICES THAT THE FUND’S AUDITOR BILLED TO THE FUND
| | | | | | | | | | | | | | | | |
Fiscal Year Ended | | Audit Fees Billed
to Fund1 | | | Audit-Related Fees
Billed to Fund2 | | | Tax Fees
Billed to Fund 3 | | | All Other Fees
Billed to Fund 4 | |
December 31, 2019 | | $ | 34,360 | | | $ | 16,500 | | | $ | 0 | | | $ | 0 | |
| | | | | | | | | | | | | | | | |
| | | | | | | | | | | | | | | | |
Percentage approved pursuant to pre-approval exception | | | 0 | % | | | 0 | % | | | 0 | % | | | 0 | % |
| | | | | | | | | | | | | | | | |
| | | | | | | | | | | | | | | | |
December 31, 2018 | | $ | 34,335 | | | $ | 0 | | | $ | 2,752 | | | $ | 0 | |
| | | | | | | | | | | | | | | | |
| | | | | | | | | | | | | | | | |
Percentage approved pursuant to pre-approval exception | | | 0 | % | | | 0 | % | | | 0 | % | | | 0 | % |
| | | | | | | | | | | | | | | | |
1 “Audit Fees” are the aggregate fees billed for professional services for the audit of the Fund’s annual financial statements and services provided in connection with statutory and regulatory filings or engagements.
2 “Audit Related Fees” are the aggregate fees billed for assurance and related services reasonably related to the performance of the audit or review of financial statements that are not reported under “Audit Fees”. These fees include offerings related to the Fund’s common shares and leverage.
3 “Tax Fees” are the aggregate fees billed for professional services for tax advice, tax compliance, and tax planning. These fees include: all global withholding tax services; excise and state tax reviews; capital gain, tax equalization and taxable basis calculation performed by the principal accountant.
4 “All Other Fees” are the aggregate fees billed for products and services other than “Audit Fees”, “Audit-Related Fees” and “Tax Fees”. These fees represent all “Agreed-Upon Procedures” engagements pertaining to the Fund’s use of leverage.
SERVICES THAT THE FUND’S AUDITOR BILLED TO THE
ADVISER AND AFFILIATED FUND SERVICE PROVIDERS
The following tables show the amount of fees billed by PricewaterhouseCoopers LLP to Nuveen Fund Advisors, LLC (formerly Nuveen Fund Advisors, Inc.) (the “Adviser”), and any entity controlling, controlled by or under common control with the Adviser that provides ongoing services to the Fund (“Affiliated Fund Service Provider”), for engagements directly related to the Fund’s operations and financial reporting, during the Fund’s last two full fiscal years.
The tables also show the percentage of fees subject to the pre-approval exception. The pre-approval exception for services provided to the Adviser and any Affiliated Fund Service Provider (other than audit, review or attest services) waives the pre-approval requirement if: (A) the aggregate amount of all such services provided constitutes no more than 5% of the total amount of revenues paid to PricewaterhouseCoopers LLP by the Fund, the Adviser and Affiliated Fund Service Providers during the fiscal year in which the services are provided that would have to be pre-approved by the Audit Committee; (B) the Fund did not recognize the services as non-audit services at the time of the engagement; and (C) the services are promptly brought to the Audit Committee’s attention, and the Committee (or its delegate) approves the services before the Fund’s audit is completed.
| | | | | | | | | | | | |
Fiscal Year Ended | | Audit-Related Fees
Billed to Adviser and
Affiliated Fund Service
Providers | | | Tax Fees Billed to
Adviser and
Affiliated Fund
Service Providers | | | All Other Fees
Billed to Adviser
and Affiliated Fund
Service Providers | |
December 31, 2019 | | $ | 0 | | | $ | 0 | | | $ | 0 | |
| | | | | | | | | | | | |
| | | | | | | | | | | | |
Percentage approved pursuant to pre-approval exception | | | 0 | % | | | 0 | % | | | 0 | % |
| | | | | | | | | | | | |
| | | | | | | | | | | | |
December 31, 2018 | | $ | 0 | | | $ | 0 | | | $ | 0 | |
| | | | | | | | | | | | |
| | | | | | | | | | | | |
Percentage approved pursuant to pre-approval exception | | | 0 | % | | | 0 | % | | | 0 | % |
| | | | | | | | | | | | |
NON-AUDIT SERVICES
The following table shows the amount of fees that PricewaterhouseCoopers LLP billed during the Fund’s last two full fiscal years for non-audit services. The Audit Committee is required to pre-approve non-audit services that PricewaterhouseCoopers LLP provides to the Adviser and any Affiliated Fund Services Provider, if the engagement related directly to the Fund’s operations and financial reporting (except for those subject to the pre-approval exception described above). The Audit Committee requested and received information from PricewaterhouseCoopers LLP about any non-audit services that PricewaterhouseCoopers LLP rendered during the Fund’s last fiscal year to the Adviser and any Affiliated Fund Service Provider. The Committee considered this information in evaluating PricewaterhouseCoopers LLP’s independence.
| | | | | | | | | | | | | | | | |
Fiscal Year Ended | | Total Non-Audit Fees
Billed to Fund | | | Total Non-Audit Fees
billed to Adviser and
Affiliated Fund Service
Providers (engagements
related directly to the
operations and financial
reporting of the Fund) | | | Total Non-Audit Fees
billed to Adviser and
Affiliated Fund Service
Providers (all other
engagements) | | | Total | |
December 31, 2019 | | $ | 0 | | | $ | 0 | | | $ | 0 | | | $ | 0 | |
December 31, 2018 | | $ | 2,752 | | | $ | 0 | | | $ | 0 | | | $ | 2,752 | |
“Non-Audit Fees billed to Fund” for both fiscal year ends represent “Tax Fees” and “All Other Fees” billed to Fund in their respective amounts from the previous table.
Less than 50 percent of the hours expended on the principal accountant’s engagement to audit the registrant’s financial statements for the most recent fiscal year were attributed to work performed by persons other than the principal accountant’s full-time, permanent employees.
Audit Committee Pre-Approval Policies and Procedures. Generally, the Audit Committee must approve (i) all non-audit services to be performed for the Fund by the Fund’s independent accountants and (ii) all audit and non-audit services to be performed by the Fund’s independent accountants for the Affiliated Fund Service Providers with respect to operations and financial reporting of the Fund. Regarding tax and research projects conducted by the independent accountants for the Fund and Affiliated Fund Service Providers (with respect to operations and financial reports of the Fund) such engagements will be (i) pre-approved by the Audit Committee if they are expected to be for amounts greater than $10,000; (ii) reported to the Audit Committee chair for her verbal approval prior to engagement if they are expected to be for amounts under $10,000 but greater than $5,000; and (iii) reported to the Audit Committee at the next Audit Committee meeting if they are expected to be for an amount under $5,000.
ITEM 5. AUDIT COMMITTEE OF LISTED REGISTRANTS.
The registrant’s Board has a separately designated Audit Committee established in accordance with Section 3(a)(58)(A) of the Securities Exchange Act of 1934, as amended (15 U.S.C. 78c(a)(58)(A)). As of the end of the period covered by this report, the members of the audit committee are Jack B. Evans, William C. Hunter, John K. Nelson, Judith M. Stockdale and Carole E. Stone, Chair.
ITEM 6. SCHEDULE OF INVESTMENTS.
(a) See Portfolio of Investments in Item 1.
(b) Not applicable.
ITEM 7. DISCLOSURE OF PROXY VOTING POLICIES AND PROCEDURES FOR CLOSED-END MANAGEMENT INVESTMENT COMPANIES.
Nuveen Fund Advisors, LLC, f/k/a Nuveen Fund Advisors, Inc. (“NFALLC”) is the registrant’s investment adviser (NFALLC is also referred to as the “Adviser”.) NFALLC is responsible for the selection and on-going monitoring of the Fund’s investment portfolio, managing the Fund’s business affairs and providing certain clerical, bookkeeping and administrative services. The Adviser has engaged Intech Investment Management LLC (“Intech”) and Nuveen Asset Management, LLC (“Nuveen Asset Management”) (Intech and Nuveen Asset Management are also collectively referred to as “Sub-Advisers”), as Sub-Advisers to provide discretionary investment advisory services. As part of these services, the Adviser has also delegated to the Sub-Adviser the full responsibility for proxy voting on securities held in its portfolio and related duties in accordance with the Sub-Adviser’s policy and procedures. The Adviser periodically will monitor the Sub-Adviser’s voting to ensure that it is carrying out its duties. The Sub-Adviser’s proxy voting policies and procedures are summarized as follows:
Nuveen Asset Management
The registrant invests its assets primarily in fixed income securities and cash management securities. In the rare event that a fixed income issuer were to issue a proxy or that the registrant were to receive a proxy issued by a cash management security, NAM would either engage an independent third party to determine how the proxy should be voted or vote the proxy with the consent, or based on the instructions, of the registrant’s Board of Trustees or its representative. A member of NAM’s legal department would oversee the administration of the voting, and ensure that records were maintained in accordance with Rule 206(4)-6, reports were filed with the SEC on Form N-PX, and the results provided to the registrant’s Board of Trustees and made available to shareholders as required by applicable rules.
Intech
The Fund is responsible for voting proxies on securities held in its portfolio. When the Fund receives a proxy, the decision regarding how to vote such proxy will be made by Intech in accordance with its proxy voting procedures.
Intech has engaged Institutional Shareholder Services Inc. (“ISS”), to vote all Fund proxies in accordance with ISS’ Benchmark Proxy Voting Guidelines (“ISS Recommendations”). Intech has engaged the services of the Janus Henderson Denver Operations Control Group, a division of Janus Henderson Group Plc, an indirect owner of Intech, to oversee ISS in the administration of its proxy voting. Intech has adopted procedures and controls to avoid and mitigate conflicts of interest that may arise in connection with proxy voting.
In light of such procedures and controls, it is not expected that any conflicts will arise in the proxy voting process. In the unusual circumstance that a particular proxy vote may present a potential conflict, the matter shall be referred to Intech’s Proxy and Engagement Review Group, which is composed of Intech’s Chief Operating Officer & General Counsel, Chief Financial Officer and Chief Compliance Officer. To the extent that a conflict of interest is identified, Intech will vote the proxy according to the ISS recommendation unless otherwise determined by the Proxy and Engagement Review Group, and Intech will report the resolution of the vote to the Fund’s Proxy Voting Committee.
ITEM 8. PORTFOLIO MANAGERS OF CLOSED-END MANAGEMENT INVESTMENT COMPANIES.
Nuveen Fund Advisors, LLC is the registrant’s investment adviser (also referred to as the “Adviser”). The Adviser is responsible for the selection and on-going monitoring of the Fund’s investment portfolio, managing the Fund’s business affairs and providing certain clerical, bookkeeping and administrative services. The Adviser has engaged Nuveen Asset Management, LLC (“Nuveen Asset Management” or “Sub-Adviser”), as Sub-Adviser to provide discretionary investment advisory services. The following section provides information on the portfolio managers at the Sub-Adviser:
| Item 8(a)(1). | PORTFOLIO MANAGER BIOGRAPHIES |
As of the date of filing this report, the following individuals at the Sub-Adviser have primary responsibility for the day-to-day implementation of the Fund’s investment strategy:
David Friar, Managing Director and Portfolio Manager (since 2011) of Nuveen Asset Management, entered the financial services industry in 1998. He is the lead manager of the equity index, mid cap index, small cap index and enhanced equity index strategies and related institutional portfolios. He joined the team managing the Equity, mid cap and small cap Index Strategies in 2000 and became part of the enhanced equity index team in 2007. He joined the firm in 1999 as a member of the performance measurement group.
Jody Hrazanek joined Nuveen in May 2018 from Voya Investment Management (2005 to 2018) where she was head of Strategy Design and Implementation. In this role, she was portfolio manager for a number of multi-asset strategies including target date, portable alpha and option overlay strategies. Ms. Hrazanek has been a portfolio manager of the Fund since September 1, 2018. She is the lead portfolio manager in Nuveen’s multi asset and strategic solutions investment team. She leads structured investments strategies, including volatility management, option overlay and related portfolios.
| Item 8(a)(2). | OTHER ACCOUNTS MANAGED BY PORTFOLIO MANAGERS |
In addition to the Fund, as of December 31, 2019, the portfolio managers are also primarily responsible for the day-to-day portfolio management of the following accounts:
| | | | | | | | | | | | | | | | | | | | | | | | | | | | | | | | | | | | |
| | | (ii) Number of Other Accounts Managed and Assets by Account Type | | | (iii) Number of Other Accounts and Assets for Which Advisory Fee is Performance-Based | |
(i) Name of Portfolio Manager | | Other
Registered
Investment
Companies | | | Other
Pooled
Investment
Vehicles | | | Other
Accounts | | | Other
Registered
Investment
Companies | | | Other
Pooled
Investment
Vehicles | | | Other
Accounts | |
David Friar | | | 4 | | | $ | 2.28 billion | | | | 0 | | | $ | 0 | | | | 0 | | | $ | 0 | | | | N/A | | | | N/A | | | | N/A | |
| | | | | | | | | | | | | | | | | | | 1 | * | | $ | 95 million | | | | | | | | | | | | | |
Jody Hrazanek | | | 4 | | | $ | 2.28 billion | | | | 0 | | | $ | 0 | | | | 6 | | | $ | 72.4 million | | | | N/A | | | | N/A | | | | N/A | |
| | | | | | | | | | | | | | | | | | | 1 | * | | $ | 71 million | | | | | | | | | | | | | |
| * | Other Accounts-overlay strategies – The portfolio manager is responsible for the management of overlay strategies employed by this account that use derivative instruments either to obtain, offset or substitute for certain portfolio exposures beyond those provided by the account’s underlying portfolios. |
POTENTIAL MATERIAL CONFLICTS OF INTEREST
Actual or apparent conflicts of interest may arise when a portfolio manager has day-to-day management responsibilities with respect to more than one account. More specifically, portfolio managers who manage multiple accounts are presented a number of potential conflicts, including, among others, those discussed below.
The management of multiple accounts may result in a portfolio manager devoting unequal time and attention to the management of each account. Nuveen Asset Management seeks to manage such competing interests for the time and attention of portfolio managers by having portfolio managers focus on a particular investment discipline. Most accounts managed by a portfolio manager in a particular investment strategy are managed using the same investment models.
If a portfolio manager identifies a limited investment opportunity which may be suitable for more than one account, an account may not be able to take full advantage of that opportunity due to an allocation of filled purchase or sale orders across all eligible accounts. To deal with these situations, Nuveen Asset Management has adopted procedures for allocating limited opportunities across multiple accounts.
With respect to many of its clients’ accounts, Nuveen Asset Management determines which broker to use to execute transaction orders, consistent with its duty to seek best execution of the transaction. However, with respect to certain other accounts, Nuveen Asset Management may be limited by the client with respect to the selection of brokers or may be instructed to direct trades through a particular broker. In these cases, Nuveen Asset Management may place separate, non-simultaneous, transactions for a Fund and other accounts which may temporarily affect the market price of the security or the execution of the transaction, or both, to the detriment of the Fund or the other accounts.
Some clients are subject to different regulations. As a consequence of this difference in regulatory requirements, some clients may not be permitted to engage in all the investment techniques or transactions or to engage in these transactions to the same extent as the other accounts managed by the portfolio manager. Finally, the appearance of a conflict of interest may arise where Nuveen Asset Management has an incentive, such as a performance-based management fee, which relates to the management of some accounts, with respect to which a portfolio manager has day-to-day management responsibilities.
Conflicts of interest may also arise when the Sub-Adviser invests one or more of its client accounts in different or multiple parts of the same issuer’s capital structure, including investments in public versus private securities, debt versus equity, or senior versus junior/subordinated debt, or otherwise where there are different or inconsistent rights or benefits. Decisions or actions such as investing, trading, proxy voting, exercising, waiving or amending rights or covenants, workout activity, or serving on a board, committee or other involvement in governance may result in conflicts of interest between clients holding different securities or investments. Generally, individual portfolio managers will seek to act in a manner that they believe serves the best interest of the accounts they manage. In cases where a portfolio manager or team faces a conflict among its client accounts, it will seek to act in a manner that it believes best reflects its overall fiduciary duty, which may result in relative advantages or disadvantages for particular accounts.
Nuveen Asset Management has adopted certain compliance procedures which are designed to address these types of conflicts common among investment managers. However, there is no guarantee that such procedures will detect each and every situation in which a conflict arises.
| Item 8(a)(3). | FUND MANAGER COMPENSATION |
As of the most recently completed fiscal year end, the primary portfolio managers compensation is as follows:
Portfolio managers are compensated through a combination of base salary and variable components consisting of (i) a cash bonus; (ii) a long-term performance award; and (iii) participation in a profits interest plan.
Base salary. A portfolio manager’s base salary is determined based upon an analysis of the portfolio manager’s general performance, experience and market levels of base pay for such position.
Cash bonus. A portfolio manager is eligible to receive an annual cash bonus that is based on three variables: risk-adjusted investment performance relative to benchmark generally measured over the most recent three and five year periods (unless the portfolio manager’s tenure is shorter), ranking versus Morningstar peer funds generally measured over the most recent three and five year periods (unless the portfolio manager’s tenure is shorter), and management and peer reviews.
Long-term performance award. A portfolio manager is eligible to receive a long-term performance award that vests after three years. The amount of the award when granted is based on the same factors used in determining the cash bonus. The value of the award at the completion of the three-year vesting period is adjusted based on the risk-adjusted investment performance of Fund(s) managed by the portfolio manager during the vesting period and the performance of the TIAA organization as a whole.
Profits interest plan. Portfolio managers are eligible to receive profits interests in Nuveen Asset Management and its affiliate, Teachers Advisors, LLC, which vest over time and entitle their holders to a percentage of the firms’ annual profits. Profits interests are allocated to each portfolio manager based on such person’s overall contribution to the firms.
There are generally no differences between the methods used to determine compensation with respect to the Fund and the Other Accounts shown in the table above.
| Item 8(a)(4). | OWNERSHIP OF JCE SECURITIES AS OF DECEMBER 31, 2019 |
| | | | | | | | | | | | | | | | | | | | | | | | |
Name of Portfolio Manager | | None | | $1 -
$10,000 | | | $10,001-
$50,000 | | $50,001-
$100,000 | | | $100,001-
$500,000 | | | $500,001-
$1,000,000 | | | Over $1,000,000 | |
David Friar | | X | | | | | | | | | | | | | | | | | | | | | | |
Jody Hrazanek | | X | | | | | | | | | | | | | | | | | | | | | | |
Intech
| Item 8(a)(1). | PORTFOLIO MANAGER BIOGRAPHIES |
As of the date of filing this report, a team of investment professionals, consisting of Dr. Adrian Banner and Dr. Vassilios Papathanakos, works together to implement the mathematical portfolio management process.
Adrian Banner, Ph.D., is chief executive officer and chief investment officer of Intech. Dr. Banner was named chief executive officer in November 2012 and concurrently is the firm’s chief investment officer, a position he has held since January 2012. Previously, Dr. Banner was co-chief investment officer beginning January 2009, senior investment officer from September 2007 to January 2009, and joined Intech in August 2002 as director of research. Since that time, Dr. Banner has been an integral part of the firm’s Princeton-based research team. Dr. Banner has extensive knowledge of Intech’s trading systems, optimization programs and research initiatives, both on an operational and theoretical basis. Dr. Banner supervises the implementation of the portfolio optimization, management, and trading processes. He conducts mathematical research on the investment process and reviews and recommends improvements. Dr. Banner earned his Ph.D. in mathematics from Princeton University and his M.Sc. and B.Sc., also in mathematics, from the University of New South Wales, Australia.
Vassilios Papathanakos, Ph.D., is executive vice president and deputy chief investment officer of Intech. He was named executive vice president in January 2014 and deputy chief investment officer in November 2012. Prior to that, he was the firm’s director of research since July 2007, and joined Intech in October 2006 as associate director of research. Dr. Papathanakos is jointly responsible, with Dr. Banner, for the day-to-day implementation of Intech’s investment process and trading operations. Dr. Papathanakos received his Ph.D. in Physics from Princeton University in November 2006 and earned a B.S. in Physics from the University of Ioannina, Greece, in July 2001. Dr. Papathanakos has also accumulated a long teaching experience, instructing courses in all undergraduate and graduate levels, assisting in the development of new courses and coaching new teaching assistants.
No one person of the investment team is primarily responsible for implementing the investment strategy of the portion of the Nuveen Core Equity Alpha Fund allocated to Intech.
| Item 8(a)(2). | OTHER ACCOUNTS MANAGED BY PORTFOLIO MANAGERS |
In addition to managing the Equity Portfolio, Dr. Banner is also primarily responsible for the day-to-day portfolio management of the following accounts. Information is provided as of December 31, 2019, unless otherwise indicated:
| | | | | | | | |
Type of Account Managed | | Number of Accounts | | | Assets | |
Registered Investment Company | | | 8 | | | $ | 3,544,966,973 | |
Other Pooled Investment* | | | 28 | | | $ | 6,831,351,142 | |
Other Accounts** | | | 101 | | | $ | 34,843,717,586 | |
In addition to managing the Equity Portfolio, Dr. Papathanakos is also primarily responsible for the day-to-day portfolio management of the following accounts. Information is provided as of December 31, 2019, unless otherwise indicated:
| | | | | | | | |
Type of Account Managed | | Number of Accounts | | | Assets | |
Registered Investment Company | | | 8 | | | $ | 3,544,966,973 | |
Other Pooled Investment* | | | 28 | | | $ | 6,831,351,142 | |
Other Accounts** | | | 101 | | | $ | 34,843,717,586 | |
| * | 3 of the accounts included in the total, consisting of $3,490,613,635 of the total assets in the category, have performance-based advisory fees. |
| ** | 28 of the accounts included in the total, consisting of $15,608,644,797 of the total assets in the category, have performance-based advisory fees. |
Material Conflicts of Interest. Actual or apparent conflicts of interest may arise when a portfolio manager has day-to-day management responsibilities with respect to more than one account. More specifically, a portfolio manager who manages multiple accounts is presented with the following potential conflicts:
| | • | | The management of multiple accounts may result in a portfolio manager devoting unequal time and attention to the management of each account. Intech believes its mathematical investment process and the procedures it has in place are reasonably designed to mitigate these potential conflicts and risks. Specifically, Intech’s mathematical investment process significantly removes investment discretion. |
| | • | | If a portfolio manager identifies a limited investment opportunity that may be suitable for more than one account, an account may not be able to take full advantage of that opportunity due to an allocation of filled purchase or sale orders across all eligible accounts. For Intech, all allocations are based on computer-generated target weightings and trades occur simultaneously for all accounts on a rotating basis. Before submission for execution, trades are reviewed by the trader for errors or discrepancies. Trades are submitted to designated brokers in a single electronic file at one time during the day, pre-allocated to individual clients, and average-priced for the day, where markets permit such practices. In the event that an aggregated order is not completely filled, executed shares are allocated to participating client accounts in proportion to the order. |
| | • | | Intech has an established procedure for the selection, approval, management and annual review of broker relationships. Intech gives primary consideration to obtaining the most favorable price and efficient execution. Intech may, however, pay a higher commission than would otherwise be necessary for a particular transaction when, in Intech’s opinion, to do so would further the goal of obtaining the best available execution. Intech does not participate in soft dollar or directed brokerage commission arrangements and will not accept directed brokerage instructions. Intech has a policy of paying commissions for execution services only and does not purchase research or other services from or through brokers using commissions. |
| | • | | The Fund is subject to different regulation from the other pooled investment vehicles and other accounts managed by the portfolio manager. As a consequence |
| | of this difference in regulatory requirements, the Fund may not be permitted to engage in all the investment techniques or transactions or to engage in these transactions to the same extent as the other accounts managed by the portfolio manager. Intech’s mathematical investment process may result in situations in which some of its clients may sell securities when other clients purchase the same securities at or about the same time. In an attempt to reduce the likelihood of the orders matching up in the market and in an effort to maintain the confidentiality of Intech’s trading activities for purposes of improved execution, Intech isolates its sale orders from its purchase orders with different brokers handling each order. |
Intech has adopted certain compliance procedures that are designed to address these types of conflicts common among investment managers. However, there is no guarantee that such procedures will detect each and every situation in which a conflict arises.
| Item 8(a)(3). | FUND MANAGER COMPENSATION |
As of the most recently completed fiscal year end, the primary portfolio managers compensation is as follows:
Salary and Cash Bonus. With respect to Intech, as of December 31, 2019, the compensation structure of the investment personnel is determined by Intech and is summarized below.
For managing the Fund and all other accounts, the investment personnel receive base pay in the form of a fixed annual salary paid and a cash bonus as determined by Intech, which is based on overall corporate performance and each individual’s contributions.
Long-Term Incentive Compensation. Investment personnel that are part owners of Intech, also receive compensation by virtue of their ownership interest in Intech. They may elect to defer payment of a designated percentage of their fixed compensation and/or up to all of their variable compensation in accordance with Janus Henderson’s Executive Income Deferral Program.
| Item 8(a)(4). | OWNERSHIP OF JCE SECURITIES AS OF DECEMBER 31, 2019 |
| | | | | | | | | | | | | | | | | | | | | | | | |
Name of Portfolio Manager | | None | | $1 -
$10,000 | | | $10,001-
$50,000 | | $50,001-
$100,000 | | | $100,001-
$500,000 | | | $500,001-
$1,000,000 | | | Over $1,000,000 | |
Dr. Banner | | X | | | | | | | | | | | | | | | | | | | | | | |
Dr. Papathanakos | | X | | | | | | | | | | | | | | | | | | | | | | |
ITEM 9. PURCHASES OF EQUITY SECURITIES BY CLOSED-END MANAGEMENT INVESTMENT COMPANY AND AFFILIATED PURCHASERS.
Not applicable.
ITEM 10. SUBMISSION OF MATTERS TO A VOTE OF SECURITY HOLDERS.
There have been no material changes to the procedures by which shareholders may recommend nominees to the registrant’s Board implemented after the registrant last provided disclosure in response to this Item.
ITEM 11. CONTROLS AND PROCEDURES.
| | (a) | The registrant’s principal executive and principal financial officers, or persons performing similar functions, have concluded that the registrant’s disclosure controls and procedures (as defined in Rule 30a-3(c) under the Investment Company Act of 1940, as amended (the “1940 Act”) (17 CFR 270.30a-3(c))) are effective, as of a date within 90 days of the filing date of this report that includes the disclosure required by this paragraph, based on their evaluation of the controls and procedures required by Rule 30a-3(b) under the 1940 Act (17 CFR 270.30a-3(b)) and Rules 13a-15(b) or 15d-15 (b) under the Securities Exchange Act of 1934, as amended (the “Exchange Act”) (17 CFR 240.13a-15(b) or 240.15d-15 (b)). |
| | (b) | There were no changes in the registrant’s internal control over financial reporting (as defined in Rule 30a-3(d) under the 1940 Act (17 CFR 270.30a-3(d)) that occurred during the period covered by this report that has materially affected, or is reasonably likely to materially affect, the registrant’s internal control over financial reporting. |
ITEM 12. DISCLOSURE OF SECURITIES LENDING ACTIVITIES FOR CLOSED-END MANAGEMENT INVESTMENT COMPANIES.
Not applicable.
ITEM 13. EXHIBITS.
File the exhibits listed below as part of this Form.
(a)(1) Any code of ethics, or amendment thereto, that is the subject of the disclosure required by Item 2, to the extent that the registrant intends to satisfy the Item 2 requirements through filing of an exhibit: Not applicable because the code is posted on registrant’s website at www.nuveen.com/fund-governance and there were no amendments during the period covered by this report. (To view the code, click on Code of Conduct.)
(a)(2) A separate certification for each principal executive officer and principal financial officer of the registrant as required by Rule 30a-2(a) under the 1940 Act (17 CFR 270.30a-2(a)) in the exact form set forth below: Ex-99.CERT Attached hereto.
(a)(3) Any written solicitation to purchase securities under Rule 23c-1 under the 1940 Act (17 CFR 270.23c-1) sent or given during the period covered by the report by or on behalf of the registrant to 10 or more persons. Not applicable.
(a)(4) Change in registrant’s independent public accountant. Not applicable.
(b) If the report is filed under Section 13(a) or 15(d) of the Exchange Act, provide the certifications required by Rule 30a-2(b) under the 1940 Act (17 CFR 270.30a-2(b)); Rule 13a-14(b) or Rule 15d-14(b) under the Exchange Act (17 CFR 240.13a-14(b) or 240.15d-14(b)), and Section 1350 of Chapter 63 of Title 18 of the United States Code (18 U.S.C. 1350) as an exhibit. A certification furnished pursuant to this paragraph will not be deemed “filed” for purposes of Section 18 of the Exchange Act (15 U.S.C. 78r), or otherwise subject to the liability of that section. Such certification will not be deemed to be incorporated by reference into any filing under the Securities Act of 1933 or the Exchange Act, except to the extent that the registrant specifically incorporates it by reference. Ex-99.906 CERT attached hereto.
SIGNATURES
Pursuant to the requirements of the Securities Exchange Act of 1934 and the Investment Company Act of 1940, the registrant has duly caused this report to be signed on its behalf by the undersigned, thereunto duly authorized.
(Registrant) Nuveen Core Equity Alpha Fund
| | | | |
| By (Signature and Title) | | /s/ Gifford R. Zimmerman | | |
| | Gifford R. Zimmerman | | |
| | Vice President and Secretary | | |
| |
| Date: March 6, 2020 | | |
Pursuant to the requirements of the Securities Exchange Act of 1934 and the Investment Company Act of 1940, this report has been signed below by the following persons on behalf of the registrant and in the capacities and on the dates indicated.
| | | | |
| By (Signature and Title) | | /s/ Cedric H. Antosiewicz | | |
| | Cedric H. Antosiewicz | | |
| | Chief Administrative Officer | | |
| | (principal executive officer) | | |
| |
| Date: March 6, 2020 | | |
| | |
| By (Signature and Title) | | /s/ E. Scott Wickerham | | |
| | E. Scott Wickerham | | |
| | Vice President and Controller | | |
| | (principal financial officer) | | |
| |
| Date: March 6, 2020 | | |