Technical Report on the Pre-Feasibility
Study on the Pinyon Plain Project,
Coconino County, Arizona, USA
Energy Fuels Inc.
SLR Project No: 138.02544.00006
Effective Date:
December 31, 2022
Report Date:
February 23, 2023
Amended:
March 6, 2024
Prepared by:
SLR International Corporation
Qualified Persons:
Mark Mathisen, CPG
R. Dennis Bergen, P.Eng.
Jeffrey Woods, MMSA, QP
Lee (Pat) Gochnour, MMSA QP
Grant Malensek, M.Eng., P.Eng.

Technical Report on the Pre-Feasibility Study on the Pinyon Plain Project, Coconino County, Arizona, USA
SLR Project No: 138.02544.00006
Prepared by
SLR International Corporation
1658 Cole Blvd, Suite 100
Lakewood, CO 80401
USA
for
Energy Fuels Inc.
225 Union Blvd., Suite 600
Lakewood, CO 80228
USA
Effective Date - December 31, 2022
Report Date - February 23, 2023
Amended - March 6, 2024
Prepared by: Mark Mathisen, CPG R. Dennis Bergen, P.Eng. Jeffrey Woods, MMSA QP Lee (Pat) Gochnour, MMSA QP Grant Malensek, M.Eng., P.Eng. Peer Reviewed by: Deborah McCombe, P.Geo. | Approved by: Project Manager Grant Malensek, M.Eng., P.Eng. Project Director Richard Lambert, M.B.A., P.E., P.Eng. |
FINAL
Distribution: 1 copy - Energy Fuels Inc.
1 copy - SLR International Corporation

CONTENTS
| 1.0 SUMMARY | 1-1 |
| | |
| 1.1 Executive Summary | 1-1 |
| | |
| 1.2 Economic Analysis | 1-4 |
| | |
| 1.3 Technical Summary | 1-12 |
| | |
| 2.0 INTRODUCTION | 2-1 |
| | |
| 2.1 Sources of Information | 2-1 |
| | |
| 2.2 List of Abbreviations | 2-3 |
| | |
| 3.0 RELIANCE ON OTHER EXPERTS | 3-1 |
| | |
| 3.1 Reliance on Information Provided by the Registrant | 3-1 |
| | |
| 4.0 PROPERTY DESCRIPTION AND LOCATION | 4-1 |
| | |
| 4.1 Location | 4-1 |
| | |
| 4.2 Land Tenure | 4-3 |
| | |
| 4.3 Required Permits, Authorizations and Status | 4-5 |
| | |
| 4.4 Royalties | 4-5 |
| | |
| 4.5 Other Significant Risks | 4-5 |
| | |
| 5.0 ACCESSIBILITY, CLIMATE, LOCAL RESOURCES, INFRASTRUCTURE AND PHYSIOGRAPHY | 5-1 |
| | |
| 5.1 Accessibility | 5-1 |
| | |
| 5.2 Vegetation | 5-1 |
| | |
| 5.3 Climate | 5-1 |
| | |
| 5.4 Local Resources | 5-1 |
| | |
| 5.5 Infrastructure | 5-1 |
| | |
| 5.6 Physiography | 5-2 |
| | |
| 6.0 HISTORY | 6-1 |
| | |
| 6.1 Prior Ownership | 6-1 |
| | |
| 6.2 Exploration and Development History | 6-2 |
| | |
| 6.3 Past Production | 6-3 |
| | |
| 7.0 GEOLOGICAL SETTING AND MINERALIZATION | 7-1 |
| | |
| 7.1 Regional Geology | 7-1 |
| | |
| 7.2 Local Geology | 7-4 |
| | |
| 7.3 Mineralization | 7-7 |
| | |
| 8.0 DEPOSIT TYPES | 8-1 |
| | |
| 9.0 EXPLORATION | 9-1 |
| | |
| 9.1 Geotechnical | 9-1 |
| 10.0 DRILLING | 10-1 |
| | |
| 10.1 Drilling | 10-1 |
| | |
| 11.0 SAMPLE PREPARATION, ANALYSES, AND SECURITY | 11-1 |
| | |
| 11.1 Sample Preparation and Analysis | 11-1 |
| | |
| 11.2 Sample Security | 11-4 |
| | |
| 11.3 Quality Assurance and Quality Control | 11-4 |
| | |
| 11.4 Density Analyses | 11-15 |
| | |
| 11.5 Conclusions | 11-15 |
| | |
| 12.0 DATA VERIFICATION | 12-1 |
| | |
| 12.1 SLR Data Verification (2021) | 12-1 |
| | |
| 12.2 Audit of Drill hole Database | 12-1 |
| | |
| 12.3 Verification of Assay Table | 12-1 |
| | |
| 12.4 Limitations | 12-1 |
| | |
| 12.5 Conclusion | 12-1 |
| | |
| 13.0 MINERAL PROCESSING AND METALLURGICAL TESTING | 13-1 |
| | |
| 13.1 Metallurgical Testing | 13-1 |
| | |
| 13.2 Opinion of Adequacy | 13-8 |
| | |
| 14.0 MINERAL RESOURCE ESTIMATE | 14-1 |
| | |
| 14.1 Summary | 14-1 |
| | |
| 14.2 Resource Database | 14-3 |
| | |
| 14.3 Geological Interpretation | 14-4 |
| | |
| 14.4 Resource Assays | 14-8 |
| | |
| 14.5 Treatment of High Grade Assays | 14-8 |
| | |
| 14.6 Compositing | 14-11 |
| | |
| 14.7 Trend Analysis | 14-12 |
| | |
| 14.8 Search Strategy and Grade Interpolation Parameters | 14-14 |
| | |
| 14.9 Bulk Density | 14-15 |
| | |
| 14.10 Block Models | 14-16 |
| | |
| 14.11 Cut-off Grade | 14-17 |
| | |
| 14.12 Classification | 14-18 |
| | |
| 14.13 Block Model Validation | 14-21 |
| | |
| 14.14 Grade Tonnage Sensitivity | 14-24 |
| | |
| 14.15 Mineral Resource Reporting | 14-27 |
| | |
| 15.0 MINERAL RESERVE ESTIMATE | 15-1 |
| | |
| 15.1 Summary | 15-1 |
| | |
| 15.2 Dilution | 15-2 |
| | |
| 15.3 Extraction | 15-2 |
| 15.4 Cut-off Grade | 15-2 |
| | |
| 15.5 Classification | 15-3 |
| | |
| 15.6 Reconciliation | 15-3 |
| | |
| 16.0 MINING METHODS | 16-1 |
| | |
| 16.1 Mine Design | 16-1 |
| | |
| 16.2 Mining Method | 16-4 |
| | |
| 16.3 Geotechnical | 16-5 |
| | |
| 16.4 Hydrological | 16-5 |
| | |
| 16.5 Preproduction Schedule | 16-7 |
| | |
| 16.6 Life of Mine Plan | 16-7 |
| | |
| 16.7 Mine Infrastructure | 16-10 |
| | |
| 16.8 Mine Equipment | 16-14 |
| | |
| 16.9 Personnel Requirements | 16-15 |
| | |
| 17.0 RECOVERY METHODS | 17-1 |
| | |
| 17.1 Process Description | 17-1 |
| | |
| 17.2 Process Design Criteria | 17-3 |
| | |
| 18.0 PROJECT INFRASTRUCTURE | 18-1 |
| | |
| 19.0 MARKET STUDIES AND CONTRACTS | 19-1 |
| | |
| 19.1 Markets | 19-1 |
| | |
| 19.2 Contracts | 19-3 |
| | |
| 20.0 ENVIRONMENTAL STUDIES, PERMITTING, AND PLANS, NEGOTIATIONS, OR AGREEMENTS WITH LOCAL INDIVIDUALS OR GROUPS | 20-1 |
| | |
| 20.1 Environmental Studies | 20-1 |
| | |
| 20.2 Social and Community Requirements | 20-1 |
| | |
| 20.3 Water Management | 20-1 |
| | |
| 20.4 Permitting | 20-4 |
| | |
| 20.5 Mineral Examination | 20-5 |
| | |
| 20.6 Negotiations and Agreements with Local Groups | 20-5 |
| | |
| 20.7 Mine Closure Remediation and Reclamation Plans | 20-6 |
| | |
| 20.8 Opinion of Adequacy | 20-6 |
| | |
| 21.0 CAPITAL AND OPERATING COSTS | 21-1 |
| | |
| 21.1 Capital Costs | 21-1 |
| | |
| 21.2 Operating Costs | 21-3 |
| | |
| 22.0 ECONOMIC ANALYSIS | 22-1 |
| | |
| 22.1 Economic Criteria | 22-1 |
| | |
| 22.2 Cash Flow Analysis | 22-2 |
| | |
| 22.3 Sensitivity Analysis | 22-5 |
| | |
| 23.0 ADJACENT PROPERTIES | 23-1 |
| 23.1 Other Breccia Pipes | 23-1 |
| | |
| 24.0 OTHER RELEVANT DATA AND INFORMATION | 24-1 |
| | |
| 25.0 INTERPRETATION AND CONCLUSIONS | 25-1 |
| | |
| 25.1 Geology and Mineral Resources | 25-1 |
| | |
| 25.2 Mining and Mineral Reserves | 25-1 |
| | |
| 25.3 Mineral Processing | 25-2 |
| | |
| 25.4 Infrastructure | 25-2 |
| | |
| 25.5 Environment | 25-2 |
| | |
| 26.0 RECOMMENDATIONS | 26-1 |
| | |
| 26.1 Geology and Mineral Resources | 26-1 |
| | |
| 26.2 Mining and Mineral Reserves | 26-1 |
| | |
| 26.3 Mineral Processing | 26-1 |
| | |
| 26.4 Infrastructure | 26-1 |
| | |
| 26.5 Environment | 26-1 |
| | |
| 27.0 REFERENCES | 27-1 |
| | |
| 28.0 DATE AND SIGNATURE PAGE | 28-1 |
| | |
| 29.0 CERTIFICATE OF QUALIFIED PERSON | 29-1 |
| | |
| 29.1 Grant A. Malensek | 29-1 |
| | |
| 29.2 Mark B. Mathisen | 29-3 |
| | |
| 29.3 R. Dennis Bergen | 29-5 |
| | |
| 29.4 Jeffery L. Woods | 29-7 |
| | |
| 29.5 Lee (Pat) Gochnour | 29-8 |
| | |
| 30.0 APPENDIX 1 | 30-1 |
TABLES
| Table 1-1:2023 Proposed Underground Drilling Budget for Main-Lower and Juniper Zones | 1-3 |
| | |
| Table 1-2:After-Tax Cash Flow Summary | 1-8 |
| | |
| Table 1-3:After-tax Sensitivity Analysis | 1-9 |
| | |
| Table 1-4:Summary of Attributable Uranium Mineral Resources - Effective Date December 31, 2022 | 1-15 |
| | |
| Table 1-5:Summary of Attributable Copper Mineral Resources - Effective Date December 31, 2022 | 1-15 |
| | |
| Table 1-6:Summary of Estimated Mineral Reserves - December 31, 2022 | 1-17 |
| | |
| Table 1-7:Capital Cost Estimate | 1-18 |
| | |
| Table 1-8:Operating Cost Summary | 1-19 |
| | |
| Table 2-1:Summary of QP Responsibilities | 2-2 |
| | |
| Table 4-1:Claims Held by EFR for the Pinyon Plain Project | 4-3 |
| | |
| Table 6-1:Drilling at Pinyon Plain Project by Previous Operators | 6-2 |
| | |
| Table 10-1:Underground Drill hole Database Summary | 10-1 |
| | |
| Table 10-2:Selected Copper and Uranium Assay Intercepts | 10-3 |
| | |
| Table 10-3:Declustered Cu Assay Statistics | 10-5 |
| | |
| Table 11-1:QA/QC Samples for the Pinyon Plain Project Drilling | 11-5 |
| | |
| Table 11-2:Summary of QA/QC Submittals | 11-6 |
| | |
| Table 11-3:Expected Values and Ranges of Copper CRM | 11-8 |
| | |
| Table 11-4:Summary of CRM Performance | 11-8 |
| | |
| Table 11-5:Basic Comparative Statistics of 2017 Duplicate Assays | 11-12 |
| | |
| Table 11-6:Check Assays List | 11-13 |
| | |
| Table 13-1:Conventional Acid Leach Test Results | 13-2 |
| | |
| Table 13-2:Roasted Acid Test Results | 13-3 |
| | |
| Table 13-3:Summary of Uranium and Copper Recoveries (Hazen) | 13-8 |
| | |
| Table 14-1:Summary of Attributable Uranium Mineral Resources - Effective Date December 31, 2022 | 14-2 |
| | |
| Table 14-2:Summary of Attributable Copper Mineral Resources - Effective Date December 31, 2022 | 14-3 |
| | |
| Table 14-3:Summary of Available Drill hole Data | 14-4 |
| | |
| Table 14-4:Summary Statistics of Uncapped U3O8 Assays | 14-8 |
| | |
| Table 14-5:Summary Statistics of Uncapped vs. Capped Assays | 14-9 |
| Table 14-6:Summary of Uranium Composite Data by Zone | 14-11 |
| | |
| Table 14-7:Estimation Steps of Block Model Variables | 14-14 |
| | |
| Table 14-8:Uranium Interpolation Plan | 14-15 |
| | |
| Table 14-9:Summary of Block Model Variables | 14-16 |
| | |
| Table 14-10:Pinyon Plain Project Cut-off Grade Calculation for Mineral Resources | 14-17 |
| | |
| Table 14-11:Comparison of Block and Composite Uranium Grades | 14-24 |
| | |
| Table 14-12:Block Model Sensitivity to Cut-off Grade and Uranium Price in the Main-Lower and Juniper Zones (Indicated) | 14-25 |
| | |
| Table 14-13:Block Model Sensitivity to Cut-off Grade and Uranium Price in the Main-Lower and Juniper Zones (Inferred) | 14-26 |
| | |
| Table 14-14:Summary of Attributable Uranium Mineral Resources - Effective Date December 31, 2022 | 14-27 |
| | |
| Table 14-15:Summary of Attributable Copper Mineral Resources - Effective Date December 31, 2022 | 14-28 |
| | |
| Table 15-1:Summary of Mineral Reserve Estimate - December 31, 2022 | 15-1 |
| | |
| Table 15-2:Cut Off Grade Calculation for Mineral Reserves | 15-2 |
| | |
| Table 16-1:Life of Mine Development and Production Plan | 16-8 |
| | |
| Table 16-2:Life of Mine Production Plan | 16-9 |
| | |
| Table 16-3:Required Underground Mining Equipment Purchases and Rebuilds | 16-14 |
| | |
| Table 16-4:Personnel Requirements | 16-15 |
| | |
| Table 17-1: Principal Process Operation Criteria | 17-4 |
| | |
| Table 19-1:TradeTech Uranium Market Price Forecast (Real & Nominal US$/lb U3O8) | 19-2 |
| | |
| Table 20-1:Environmental Permits for Operation | 20-5 |
| | |
| Table 21-1:Life of Mine Capital Equipment | 21-1 |
| | |
| Table 21-3:Reclamation Cost | 21-2 |
| | |
| Table 21-2:Operating Costs Summary | 21-3 |
| | |
| Table 21-4:Processing Operating Costs | 21-3 |
| | |
| Table 22-1:After-Tax Cash Flow Summary | 22-4 |
| | |
| Table 22-2:After-tax Sensitivity Analysis | 22-5 |
| | |
| Table 26-1:2023 Proposed Underground Drilling Budget for Main-Lower and Juniper Zones | 26-1 |
FIGURES
| Figure 1-1:Annual Mine Production | 1-6 |
| | |
| Figure 1-2:After-Tax Metrics Summary | 1-7 |
| | |
| Figure 1-3:After-tax NPV 5% Cash flow Sensitivity | 1-11 |
| | |
| Figure 1-4:After-tax IRR Cash flow Sensitivity | 1-12 |
| | |
| Figure 4-1:Location Map | 4-2 |
| | |
| Figure 4-2:Land Tenure Map | 4-4 |
| | |
| Figure 7-1:Regional Geologic Map | 7-2 |
| | |
| Figure 7-2:Regional Stratigraphic Column | 7-3 |
| | |
| Figure 7-3:Cross Section of Local Geology | 7-5 |
| | |
| Figure 7-4:Pinyon Plain Horizontal Slice Main Zone - Slice 5,200' Level | 7-6 |
| | |
| Figure 10-1:Surface Drill hole Collar Locations | 10-2 |
| | |
| Figure 10-2:Histogram of Declustered Cu Assays | 10-5 |
| | |
| Figure 11-1:Results of Blank Samples | 11-7 |
| | |
| Figure 11-2:Control Charts of Copper CRM | 11-9 |
| | |
| Figure 11-3:Average Copper Grade of CRM Over Time | 11-10 |
| | |
| Figure 11-4:Scatter Plot of Independent vs Primary Laboratory Check Assay Results for U3O8 | 11-13 |
| | |
| Figure 11-5:Scatter Plot of Independent vs. Primary Laboratory Check Assay Results for Copper | 11-14 |
| | |
| Figure 11-6:Scatter Pot of the Weighted Average of Probe and Assay U3O8 Results Over Drill hole Intercepts within the Main Zone | 11-15 |
| | |
| Figure 13-1:Laboratory Comparison - Conventional Leaching | 13-5 |
| | |
| Figure 13-2:Laboratory Comparison - Roasting Pre-Treatment and Leaching | 13-5 |
| | |
| Figure 14-1:Uranium and Copper Mineralized Zones | 14-7 |
| | |
| Figure 14-2:Histogram of U3O8 Resource Assay in M_01 and J_1_01 Domains | 14-10 |
| | |
| Figure 14-3:Log Normal Probability Plot with Capping Grades | 14-10 |
| | |
| Figure 14-4:Length Histogram | 14-12 |
| | |
| Figure 14-5:U3O8 Variogram Models | 14-13 |
| | |
| Figure 14-6:Block Classification within the Main Zone | 14-20 |
| | |
| Figure 14-7:Cross Section Comparing Block and Composite U3O8 Grades in the Main Zone | 14-22 |
| | |
| Figure 14-8:Plan View Comparing Block and Composite U3O8 Grades in the Main Zone | 14-23 |
| | |
| Figure 14-9:Indicated Grade Tonnage Curve Main-Lower and Juniper Zones | 14-25 |
| | |
| Figure 14-10:Inferred Grade Tonnage Curve Main-Lower and Juniper Zones | 14-26 |
| | |
| Figure 16-1:Pinyon Plain Overall Mine Design and Naming Conventions | 16-3 |
| | |
| Figure 16-2:Pinyon Plan Mine Shaft Plan View | 16-11 |
| | |
| Figure 16-3:Pinyon Plain Ventilation Design | 16-13 |
| | |
| Figure 17 1: White Mesa Mill - Location Map | 17-5 |
| | |
| Figure 17 2: White Mesa Mill - Site Map | 17-6 |
| | |
| Figure 17 3: White Mesa Mill Block Diagram Flow Sheet | 17-7 |
| | |
| Figure 18-1:Pinyon Plain Mine Facility Layout | 18-2 |
| Figure 19-1:TradeTech Uranium Market Price Forecast (Real & Nominal US$/lb U3O8) | 19-3 |
| | |
| Figure 20-1:Process Flow Diagram for Pinyon Plain Mine | 20-3 |
| | |
| Figure 22-1:Annual Mine Production | 22-2 |
| | |
| Figure 22-2:After-Tax Metrics Summary | 22-3 |
| | |
| Figure 22-3:After-tax NPV 5% Cash flow Sensitivity | 22-7 |
| | |
| Figure 22-4:After-tax IRR Cash flow Sensitivity | 22-8 |
APPENDIX TABLES AND FIGURES
| Table 30-1:SLR Base Case Cash Flow Summary | 30-2 |
1.0 SUMMARY
1.1 Executive Summary
SLR International Corporation (SLR) was retained by Energy Fuels Inc. (Energy Fuels), the parent company of Energy Fuels Resources (USA) Inc. (EFR), to prepare a Technical Report on the Pre-Feasibility Study (PFS) with respect to the Pinyon Plain Project (Pinyon Plain or the Project), located in Coconino County, Arizona, USA. EFR owns 100% of the Project.
This report has been amended to provide details on the process recovery circuit at the White Mesa Mill in Section 17, and associated disclosure in Sections 1, 25, and 26, and correct minor typographical errors.
EFR's parent company, Energy Fuels Inc., is incorporated in Ontario, Canada. EFR is a US-based uranium and vanadium exploration and mine development company with projects located in the states of Colorado, Utah, Arizona, Wyoming, Texas, and New Mexico. EFR is listed on the NYSE American Stock Exchange (symbol: UUUU) and the Toronto Stock Exchange (symbol: EFR).
This Technical Report satisfies the requirements of Canadian National Instrument 43-101 Standards of Disclosure for Mineral Projects (NI 43-101) and the United States Securities and Exchange Commission's (SEC) Modernized Property Disclosure Requirements for Mining Registrants as described in Subpart 229.1300 of Regulation S-K, Disclosure by Registrants Engaged in Mining Operations (S-K 1300) and Item 601 (b)(96) Technical Report Summary. The purpose of this Technical Report is to disclose the results of a PFS for the Project.
The Project is a uranium and copper breccia pipe deposit in northern Arizona. The Project is permitted and has a 1,470 ft deep shaft, headframe, hoist, compressor, and surface facilities including line power. The Project is currently being developed in preparation for production. Environmental compliance activities continue with all infrastructure for mine development in place. EFR envisages this as a mechanized mining underground operation in which the ore will be hoisted to surface and then trucked to a mill for processing based on a toll milling agreement.
Energy Fuels plans to operate the mine at a rate of up to 292 short tons per day (stpd) of ore, averaging 143 stpd of ore. The mine life extends for a total of 28 months. The life of mine plan includes mining 134,500 tons of ore grading 0.58% U3O8, yielding 1.57 million pounds (Mlb) of U3O8. Process recovery is estimated to be 96% to produce 1.51 Mlb of U3O8. There are additional Mineral Resources at depth below the Mineral Reserves in the current mine plan.
1.1.1 Conclusions
SLR offers the following interpretations and conclusions on the Project:
1.1.1.1 Geology and Mineral Resources
• Mineral Resources have been classified in accordance with the definitions for Mineral Resources in S-K 1300, which are consistent with Canadian Institute of Mining, Metallurgy and Petroleum (CIM) Definition Standards for Mineral Resources and Mineral Reserves dated May 10, 2014 (CIM, 2014) definitions which are incorporated by reference in NI 43-101.
• In the SLR QP's opinion, the assumptions, parameters, and methodology used for the Pinyon Plain Mineral Resource estimate is appropriate for the style of mineralization and mining methods.
• The SLR QP is of the opinion the block models are adequate for public disclosure and to support mining activities. The effective date of the Mineral Resource estimate is December 31, 2022.
• Mineral Resource estimates exclude previously reported uranium mineralization from the Cap and Upper zones as a condition of current Arizona Department of Environmental Quality (ADEQ) Aquifer Protection Permit which limits mining between the elevations of 5,340 ft and 4,508 ft.
• Mineral Resources are based on a $65/lb uranium price at an equivalent uranium (% eU3O8, referring to radiometric logs converted to grades) cut-off grade of 0.30% based on a combination of longhole stoping, shrinkage stoping, and drifting underground mining methods; ore from the Project will be trucked 320 miles to the White Mesa Mill located near Blanding, Utah. Development rock will be temporarily stored on surface, then will be used at the end of mining to fill the voids created by mining the breccia pipe and the developed shafts.
• Indicated uranium Mineral Resources total 37,000 tons at an average grade of 0.95% eU3O8 for a total of 703,000 lb U3O8. Inferred Mineral Resources total 5,000 tons at an average grade of 0.50% eU3O8 for a total of 48,000 lb U3O8.
• Sampling and assaying procedures have been adequately completed and carried out using industry standard quality assurance/quality control (QA/QC) practices. These practices include, but are not limited to, sampling, assaying, chain of custody of the samples, sample storage, use of third-party laboratories, standards, blanks, and duplicates.
• The SLR QP considers the estimation procedures employed at Pinyon Plain, including compositing, top-cutting, variography, block model construction, and interpolation to be reasonable and in line with industry standard practice.
• The SLR QP finds the classification criteria to be reasonable.
1.1.1.2 Mining and Mineral Reserves
• Mineral Reserve estimates, as prepared by EFR and reviewed and accepted by SLR, have been classified in accordance with the definitions for Mineral Reserves in S-K 1300 which are consistent with CIM (2014) definitions which are incorporated by reference in NI 43-101.
• The Proven and Probable Mineral Reserve estimate is 134,500 tons grading 0.58% U3O8 containing 1.57 Mlb of U3O8 and is comprised of 7,800 tons grading 0.33% U3O8 of Proven Mineral Reserves containing 0.05 Mlb of U3O8 plus 136,700 tons grading 0.60% U3O8 of Probable Mineral Reserves containing 1.52 Mlb of U3O8
• The Mineral Reserves are based upon a cut-off grade of 0.32% U3O8.
• Mineral Reserves were estimated based on stope designs utilizing a mine planning software within a 0.15% U3O8 wireframe.
• The Mineral Reserves include 35% dilution at zero grade.
• Measured Mineral Resources were converted to Proven Mineral Reserves and Probable Mineral Resources were converted to Probable Mineral Reserves.
• No Inferred Mineral Resources were converted into Mineral Reserves.
• The existing shaft will be used for the mine access and rock hoisting.
• The ore will be mined using longhole stoping for the majority of the ore and breasting of roofs and/or ribs for narrow mineralized zones.
• Ore will be mucked and hauled by load-haul-dump (LHD) loaders to a grizzly over the loading pocket feed.
• A ventilation raise will be bored in the centre of the orebody to provide an exhaust airway and emergency egress.
The SLR QP is not aware of any mining, metallurgical, infrastructure, permitting, or other relevant factors that could materially affect the Mineral Reserve estimate.
1.1.1.3 Mineral Processing
• There is sufficient metallurgical testing to support a uranium process recovery of 96% at the White Mesa Mill.
• The metallurgical test results provided by White Mesa Mill Laboratory personnel indicated that metallurgical recoveries using optimum roasting and leach conditions will be approximately 96% for uranium. The White Mesa Mill has a significant operating history for the uranium solvent extraction (SX) circuit which includes processing of relatively high copper content with no detrimental impact to the uranium recovery or product grade.
1.1.1.4 Infrastructure
- There is suitable existing or planned infrastructure to support the planned operations.
1.1.1.5 Environment
• EFR has secured all of the permits required to construct, operate, and close the Pinyon Plain Project.
o Some permits require regular update/renewal.
o These permits involved significant public participation opportunity.
• Financial assurance is in place to guarantee all reclamation will occur. This amount will be reviewed on a regular basis (at least every five years) to cover any changes at site and/or for any inflationary issue(s).
1.1.2 Recommendations
SLR offers the following recommendations regarding the advancement of the Project.
1.1.2.1 Geology and Mineral Resources
1. Convert Inferred Mineral Resources to Indicated Mineral Resources within the Main-Lower and Juniper zones by completing underground delineation drilling program per the estimated budget shown in Table 1-1.
Table 1-1: 2023 Proposed Underground Drilling Budget for Main-Lower and Juniper Zones
Energy Fuels Inc. - Pinyon Plain Project
Category | Number of Drill
Holes/Assay | Total Feet
Drilled | Unit Cost | Budget |
(US$/ft) | (US$) |
Underground Delineation Drilling | 45 | 11,250 | 31.00 | 349,000 |
1.1.2.2 Mining and Mineral Reserves
1. Continue preproduction development and preparations for production.
2. Develop grade control and production reconciliation procedures.
3. Develop a program of monitoring the geotechnical conditions in the stopes and development headings.
4. Monitor the water inflow rate of the ventilation raise pilot hole.
5. Prepare contingency plans for mine dewatering in the event that the ventilation raise encounters a water bearing strata.
6. Prepare contingency plans for additional dewatering due to water inflow to the ventilation raise.
Select the ventilation raise contractor and confirm the schedule for the work.
7. Secure contractor proposals for the ventilation raise development and prepare for development.
1.1.2.3 Mineral Processing
1. Investigate modifications required to recover copper at White Mesa Mill.
1.1.2.4 Infrastructure
None
1.1.2.5 Environment
1. Consider development of an environmental management system that lists environmental roles and responsibilities of site personnel, permit conditions, and monitoring requirements for use should someone else unfamiliar with environmental matters have to perform them.
2. Establish a reclamation revegetation test plot program to ensure species selected will work at the site.
1.2 Economic Analysis
An after-tax Cash Flow Projection has been generated from the Life of Mine production schedule and capital and operating cost estimates, as summarized in Table 1-2. A summary of the key criteria is provided below.
1.2.1 Economic Criteria
1.2.1.1 Revenue
Total mill feed processed: 134 thousand tons
Average processing rate: 216 stpd (steady state)
U3O8 head grade: 0.58%
Average mill recovery: 96%
Recovered U3O8: 1.51 Mlb
Metal price: $60/lb U3O8
Yellowcake product trucking cost from the toll mill to customer: $0.175/lb U3O8
1.2.1.2 Capital and Operating Costs
• Pre-production period: Four months
• Mine life: 24 months
• LOM capital costs, excluding reclamation, of $8.7 million on Q4 2022 US dollar basis
• LOM operating cost (excluding royalties but including severance taxes) of $50.5 million or $372/ton milled on Q4 2022 US dollar basis
1.2.1.3 Royalties and Severance Taxes
A 3.5% private royalty is payable for the Project based on sliding scale of the value of production expressed in lb/t along with allowances for mining and ore hauling. The royalty payments over the mine life are approximately $1.88/t ore.
Arizona has a severance tax that is 2.5% of the net severance base, which is 50% of the difference between the gross value of production (revenue) and the production costs. Thus, a rate of 1.25% is used to reflect this 50% base reduction. The Arizona severance tax payable to the Project is estimated at $3.70/t ore during LOM.
1.2.1.4 Income Taxes
EFR states it is not liable for corporate income tax (CIT) expenditures as a corporation, including the period that the Project is expected to operate. In addition, the short mine life of 24 months makes an estimate of income tax payable using a standard tax methodology difficult. Therefore, a proforma CIT estimate was added with the assumption that the Project was a stand-alone entity for tax purposes and does not reflect the company's actual filing position with following assumptions:
A Federal income tax rate of 10.5% is used in this analysis. This rate takes into account the percentage depletion deduction which allows profitable mining companies to reduce their taxable income by 50% and then the remaining amount is taxed at the current Federal tax rate of 21% so that the net rate is 10.5%.
The Arizona state income tax rate is 4.9% so the combined Federal and state rate is 15.4%%
The tax amounts may be negative some months as the pre-tax cash flow dips below zero. However, as taxable income is computed on an annual basis and as the annual amounts for the first 24 months are all positive, the sum of the monthly tax amounts will be positive. In the remaining 24 months after the mine ceases operation, there are negative cash flows which can be carried back to profitable years to receive a tax refund. Thus, the project total income tax is the pre-tax cash flow x 15.4%.
CIT payable for LOM totals $6.0 million.
1.2.2 Cash Flow Analysis
The Project production schedule is presented in Figure 1-1 and the resulting after-tax free cash flow profile is shown in Figure 1-2.

Figure 1-1: Annual Mine Production
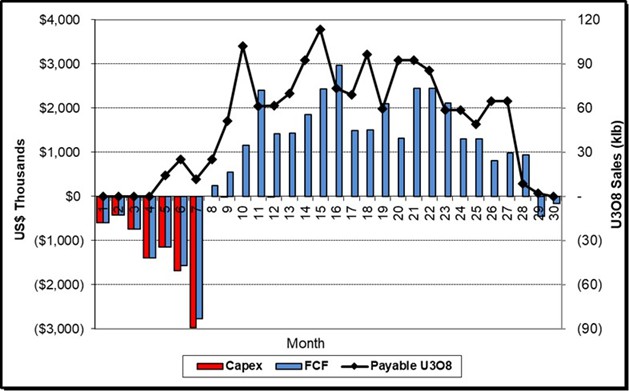
Figure 1-2: After-Tax Metrics Summary
Table 1-2 presents a summary of the Project economics at an average U3O8 price of $60.00/lb. The full annual cash flow model is presented in Appendix 1.
On a pre-tax basis, the undiscounted cash flow totals $28.9 million over the mine life. The pre-tax Net Present Value (NPV) at a 5% discount rate is $26.5 million and the Internal Rate of Return (IRR) is 14%.
On an after-tax basis, the undiscounted cash flow totals $22.8 million over the mine life. The after-tax NPV at 5% discount rate is $20.9 million and the IRR is 12%.
LOM Project cost metrics are as follows:
• Cash Operating Costs: $33.91/lb U3O8
• All-in Sustaining Costs: $34.84/lb U3O8
• All-in Costs: $40.66/lb U3O8
Table 1-2: After-Tax Cash Flow Summary
Energy Fuels Inc. - Pinyon Plain Project
Item | Unit | Value |
U3O8 Price | $/lb | $60.00 |
U3O8 Sales | klb | 1,505 |
Total Gross Revenue | US$ 000 | 90,300 |
Product Transport to Market | US$ 000 | (263) |
Royalties | US$ 000 | (253) |
Total Net Revenue | US$ 000 | 89,783 |
Mining Cost | US$ 000 | (13,581) |
Ore Trucking Cost | US$ 000 | (9,681) |
Process Cost | US$ 000 | (25,817) |
G & A Cost | US$ 000 | (941) |
Severance Tax | US$ 000 | (497) |
Total Operating Costs | US$ 000 | (50,518) |
Operating Margin | US$ 000 | 39,266 |
Corporate Income Tax | US$ 000 | (6,046) |
Working Capital | US$ 000 | 0 |
Operating Cash Flow | US$ 000 | 33,220 |
Development Capital | US$ 000 | (8,748) |
Closure/Reclamation Capital | US$ 000 | (1,407) |
Total Capital | US$ 000 | (10,155) |
| | |
Pre-tax Free Cash Flow | US$ 000 | 29,110 |
Pre-tax NPV @ 5% | US$ 000 | 26,682 |
Pre-tax NPV @ 8% | US$ 000 | 25,318 |
Pre-tax NPV @ 12% | US$ 000 | 23,602 |
Pre-tax IRR | % | 14% |
| | |
After-tax Free Cash Flow | US$ 000 | 23,064 |
After-tax NPV @ 5% | US$ 000 | 21,072 |
After-tax NPV @ 8% | US$ 000 | 19,954 |
After-tax NPV @ 12% | US$ 000 | 18,545 |
After-tax IRR | % | 12% |
Item | Unit | Value |
| | |
Cash Operating Costs | $/l U3O8 | 33.91 |
All-in Sustaining Costs | $/l U3O8 | 34.84 |
All-in Costs | $/l U3O8 | 40.66 |
1.2.3 Sensitivity Analysis
Project risks can be identified in both economic and non-economic terms. Key economic risks were examined by running cash flow sensitivities calculated over a range of variations based on realistic fluctuations within the listed factors:
U3O8 price: 10% increments between $51/lb and $76/lb
Head grade: -/+ 20%
Recovery: -20%/+4% (96% is base case already)
Operating cost per ton milled: -10% to 25% (AACE Class 3 range)
Capital cost: -10% to 25% (AACE Class 3 range)
The after-tax cash flow sensitivities for the base case are shown in Table 1-3, Figure 1-3, and Figure 1-4. The Project is most sensitive to head grade, uranium price, and recovery, and only slightly less sensitive to operating cost and capital cost at a Class 3 accuracy level. The sensitivities to metallurgical recovery, head grade, and metal price are nearly identical.
Table 1-3: After-tax Sensitivity Analysis
Energy Fuels Inc. - Pinyon Plain Project
Factor Change | U3O8 Price
(US$/lb) | NPV at 5%
(US$ 000) | IRR
(%) |
0.80 | $48 | $6,996 | 6% |
0.90 | $54 | $14,034 | 9% |
1.00 | $60 | $21,072 | 12% |
1.10 | $66 | $28,111 | 15% |
1.20 | $72 | $35,149 | 17% |
Factor Change | Head Grade
(% U3O8) | NPV at 5%
(US$ 000) | IRR
(%) |
0.80 | 0.47% | $7,066 | 6% |
0.90 | 0.52% | $14,072 | 10% |
1.00 | 0.58% | $21,072 | 12% |
1.10 | 0.64% | $28,074 | 15% |
1.20 | 0.70% | $35,073 | 17% |
Factor Change | Metallurgical Recovery
(%) | NPV at 5%
(US$ 000) | IRR
(%) |
0.80 | 77% | $7,037 | 6% |
0.90 | 86% | $14,055 | 10% |
1.00 | 96% | $21,072 | 12% |
1.03 | 98% | $22,827 | 13% |
1.04 | 100% | $23,879 | 13% |
Factor Change | Operating Costs
(US$/ton milled) | NPV at 5%
(US$ 000) | IRR
(%) |
0.90 | $45,019 | $24,988 | 14% |
0.95 | $47,520 | $23,030 | 13% |
1.00 | $50,021 | $21,072 | 12% |
1.13 | $56,273 | $16,178 | 10% |
1.25 | $62,526 | $11,284 | 8% |
Factor Change | Capital Costs
(US$ M) | NPV at 5%
(US$ 000) | IRR
(%) |
0.90 | $9,481 | $21,928 | 13% |
0.95 | $9,930 | $21,500 | 13% |
1.00 | $10,378 | $21,072 | 12% |
1.13 | $11,500 | $20,002 | 11% |
1.25 | $12,621 | $18,932 | 10% |

Figure 1-3: After-tax NPV 5% Cash flow Sensitivity
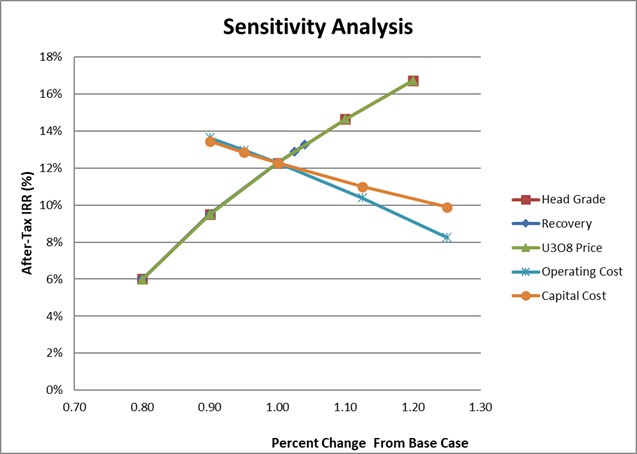
Figure 1-4: After-tax IRR Cash flow Sensitivity
1.3 Technical Summary
1.3.1 Property Description and Location
The Project is a fully permitted underground uranium and copper deposit in northern Arizona, located on a 17-acre site within the Kaibab National Forest. It is situated 153 mi north of Phoenix, 86 mi northwest of Flagstaff, and seven miles southeast of Tusayan, in Sections 19 and 20, Township 29 North, Range 03 East, Gila and Salt River Meridian (GSRM), Coconino County, Arizona. The Project is located on the Coconino Plateau within the Colorado Plateau, at an elevation of approximately 6,500 feet above sea level (ft ASL).
1.3.2 Land Tenure
EFR's property position at the Project consists of nine unpatented mining claims (Canyon 64-66, 74-76, and 84-86), located on USFS land, encompassing approximately 186 acres. EFR acquired the Project in June 2012 and has a 100% interest in the claims. The Project is located at latitude 35°52'58.65" N and longitude 112° 5'47.05" W. All claims are in good standing until September 1, 2023.
1.3.3 Existing Infrastructure
Existing infrastructure includes a shaft, headframe, hoist, compressor, surface maintenance shops, employee offices, a water well, evaporation pond, water treatment plant, rock stockpile pads, water tanks and a fuel tank. An existing power line terminates at the site.
1.3.4 History
Uranium exploration and mining of breccia pipe deposits started in the region in 1951.
The Project is located on mining claims held by EFR, a wholly owned subsidiary of EFR Arizona Strip LLC. These mining claims were originally staked by Gulf Mineral Resources (Gulf) in April 1978, who have maintained a royalty on the property through various changes in ownership. The exploration and development carried out by the previous owners included surface and underground drilling, developing a deep water well, and constructing a 1,470 ft deep mine shaft and conveyances for underground exploration which are currently operational.
No past production has occurred at the Project.
1.3.5 Geology and Mineralization
Parts of two distant physiographic provinces are found in Arizona: the Basin and Range Province located in the southern portion of the state; and the Colorado Plateau Province located across the northern and central portions of the state. Pinyon Plain lies within the Colorado Plateau Province.
The region has experienced volcanic activity since the Pliocene epoch. A number of lava-capped buttes rise above the general landscape, and lava flows cover large areas in the southern part of the district. Faulting has exerted significant control on the geologic development and geomorphic history of the region. Major structural features include the Grand Wash, Hurricane, and Toroweap fault systems, all trending generally north-south with an eastern up-thrown side. These faults are topographically prominent and show impressive scarps though other less prominent fault systems exist.
The surface expression of the Pinyon Plain breccia pipe is a broad shallow depression in the Permian Kaibab Formation. The pipe is essentially vertical with an average diameter of less than 200 ft but is considerably narrower through the Coconino and Hermit horizons (80 ft in diameter). The cross-sectional area is in the order of 20,000 ft2 to 25,000 ft2. The pipe extends for at least 2,300 ft vertically from the Toroweap limestone to the upper Redwall horizons. The ultimate depth of the pipe is unknown. Uranium mineralization is concentrated in an annular ring within the breccia pipe.
Mineralization extends vertically both inside and outside the pipe over approximately 1,700 vertical ft, but potentially economic grade mineralization has been found mainly in the collapsed portions of the Coconino, Hermit, and Esplanade horizons and at the margins of the pipe in fracture zones. Sulfide zones are found scattered throughout the pipe but are especially concentrated in a sulfide cap near the Toroweap-Coconino contact, where the cap averages 20 ft in thickness and consists of pyrite and bravoite, an iron-nickel sulfide. The mineralization assemblage consists of uranium-pyrite-hematite with massive copper sulfide mineralization common in and near the uranium zone. The strongest mineralization appears to occur in the lower Hermit-upper Esplanade horizons in an annular fracture zone.
In the mineralized zone, the uranium mineralization occurs largely as blebs, streaks, small veins, and fine disseminations of uraninite/pitchblende (UO2). Mineralization is mainly confined to matrix material, but may extend into clasts and larger breccia fragments, particularly where these fragments are Coconino sandstone. In addition to uranium, copper mineralization is also found within the breccia pipe. Typically replacing the matrix material, copper occurs as chalcocite, bornite, tennantite, and covellite. Arsenic is present where tennantite mineralization occurs. Additionally, lower quantities of silver, zinc, lead, molybdenum, copper, nickel, and vanadium are present and scattered throughout the pipe.
1.3.6 Exploration Status
Gulf drilled eight exploration holes at the site from 1978 through May 1982 but found only low-grade uranium in this pipe. Additional drilling completed by EFNI in 1983 identified a major deposit. No drilling activity was completed on the Project between EFNI's final drill program in 1994 and EFR's underground drilling program in 2016 to 2017.
1.3.7 Mineral Resources
Mineral Resources have been classified in accordance with the definitions for Mineral Resources in S-K 1300, which are consistent with Canadian Institute of Mining, Metallurgy and Petroleum (CIM) Definition Standards for Mineral Resources and Mineral Reserves dated May 10, 2014 (CIM, 2014) definitions which are incorporated by reference in NI 43-101.
The Project resource database, dated June 17, 2017, includes drilling results from 1978 to 2017 and includes surveyed drill hole collar locations (including dip and azimuth), assay, radiometric probe, and lithology data from 130 diamond drill holes totalling 79,775 ft of drilling.
A geologic and resource model of the breccia pipe host was constructed based on drill logs. Mineralization wireframes for U3O8 were based on assays at a nominal cut-off grade of 0.15%. Low and high grade copper wireframes were based on nominal cut-off grades of 1% and 8%, respectively.
The previously reported Mineral Resources estimate with an effective date of December 31, 2021 (SLR, 2022) disclosed both uranium and copper Mineral Resources in the Main and Main-Lower zones. Copper processing adds significantly higher milling costs and thus a higher equivalent uranium cut-off grade was used to report resources at the Main-Lower and Juniper zones. EFR has not included copper in the Mineral Reserve estimate but could add a copper circuit to the mill in the future. As a result, uranium and copper mineralization are now reported separately in this updated Mineral Resource. In addition, the following are important changes in the reporting of Mineral Resources:
• All previously reported uranium Mineral Resources in the Main Zone have been converted into Mineral Reserves (Section 15).
• In 2022, EFR moved from a General Aquifer Protection Permit to an Individual Aquifer Protection Permit with ADEQ. In an effort to protect the perched aquifer in the Coconino sandstone, ADEQ requested and EFR agreed to limit mining between the elevations of 5,340 feet above sea level (ft ASL) and 4,508 ft ASL. As a result, this updated Mineral Resource report excludes previously reported uranium mineralization from the Cap and Upper zones.
Table 1-4 summarizes uranium Mineral Resources based on a $65/lb uranium price at an equivalent uranium cut-off grade 0.30% eU3O8 for the Main-Lower and Juniper zones with an effective date of December 31, 2022. The resources stated in this report supersede any previous Mineral Resources reported for the Project.
Table 1-4: Summary of Attributable Uranium Mineral Resources - Effective Date December 31, 2022
Energy Fuels Inc. - Pinyon Plain Project
Classification | Zone | Cut-Off
Grade | Tonnage | Grade | Contained
Metal | Metallurgical
Recovery
U3O8 |
(% eU3O8) | (tons) | (% eU3O8) | (lb U3O8) | (%) |
Indicated | Juniper I | 0.3 | 37,000 | 0.95 | 703,000 | 96 |
Total Indicated | | | 37,000 | 0.95 | 703,000 | 96 |
Inferred | Main-Lower | 0.3 | 2,000 | 0.48 | 16,000 | 96 |
Juniper I | 0.3 | 2,000 | 0.58 | 24,000 | 96 |
Juniper II | 0.3 | 1,000 | 0.36 | 8,000 | 96 |
Total Inferred | | | 5,000 | 0.50 | 48,000 | 96 |
Notes:
1. SEC S-K-1300 definitions were followed for all Mineral Resource categories. These definitions are also consistent with CIM (2014) definitions in NI 43-101.
2. Mineral Resources are estimated at 0.30% eU3O8 with an estimated metallurgical recovery of 96% for uranium.
3. Mineral Resources are estimated using a long-term uranium price of US$65 per pound
4. No minimum mining width was used in determining Mineral Resources.
5. Bulk density is 0.082 ton/ft3 (12.2 ft3/ton or 2.63 t/m3).
6. Mineral Resources are exclusive of Mineral Reserves and do not have demonstrated economic viability.
7. Numbers may not add due to rounding.
8. Mineral Resources are 100% attributable to EFR and are in situ.
Table 1-5 lists copper Mineral Resource associated with the Main and Main-Lower zones at Pinyon Plain. Further study is required to determine if the copper associated with uranium mineralization in the zones may eventually be processed and add value to the project.
Table 1-5: Summary of Attributable Copper Mineral Resources - Effective Date December 31, 2022
Energy Fuels Inc. - Pinyon Plain Project
Classification | Zone | Cut-Off
Grade | Tonnage | Grade | Contained Metal | Metallurgical
Recovery Cu |
(% U3O8 Eq) | (tons) | (% Cu) | (lb Cu) | (%) |
Measured | Main | 0.4 | 6,000 | 9.6 | 1,155,000 | 90 |
Indicated | Main | 0.4 | 90,000 | 5.9 | 10,553,000 | 90 |
Total Measured + Indicated | | | 96,000 | 6.1 | 11,708,000 | 90 |
Inferred | Main-Lower | 0.4 | 4,000 | 6.5 | 470,000 | 90 |
Notes:
1. SEC S-K-1300 definitions were followed for all Mineral Resource categories. These definitions are also consistent with CIM (2014) definitions in NI 43-101.
2. For the Main and Main-Lower zones of the Pinyon Plain Project, a 0.40% uranium equivalent cut-off grade (% U3O8 Eq) was applied to account for both the copper and uranium mineralization. The %U3O8 Eq grade term is not the same as the eU3O8 % grade term which indicates probe rather than assay data listed elsewhere in this report.
3. Mineral Resources are estimated using a long-term uranium price of $65 per pound and a copper price of $4.00 per lb.
4. A copper to U3O8 conversion factor of 18.19 was used for converting copper grades to equivalent U3O8 grades (U3O8 Eq) for cut-off grade evaluation and reporting.
5. For the Pinyon Plain Project, Mineral Resource tonnages of uranium and copper cannot be added as they overlap in the Main and Main-Lower zones.
6. No minimum mining width was used in determining Mineral Resources.
7. Bulk density is 0.082 ton/ft3 (12.2 ft3/ton or 2.63 t/m3).
8. Mineral Resources are exclusive of Mineral Reserves and do not have demonstrated economic viability.
9. Numbers may not add due to rounding.
10. Mineral Resources are 100% attributable to EFR and are in situ.
The SLR QP is of the opinion that with consideration of the recommendations summarized in Section 1 and Section 26, any issues relating to all relevant technical and economic factors likely to influence the prospect of economic extraction can be resolved with further work.
The SLR QP is of the opinion that there are no other known environmental, permitting, legal, social, or other factors that would affect the development of the Mineral Resources.
While the estimate of uranium and copper Mineral Resources is based on the SLR QP's judgment that there are reasonable prospects for economic extraction, no assurance can be given that Mineral Resources will eventually convert to Mineral Reserves.
1.3.8 Mineral Reserves
Mineral Reserve estimates for Pinyon Plain are based on the Mineral Resources as of December 31, 2022, and a mine design including modifying factors such as stope shapes and sizes, external dilution, and mining extraction factors. Table 1-6 summarizes the estimated Mineral Reserves. Mineral Resource to Mineral Reserve conversion was 100% within the Main zone based on the stopes within the mine design, with the remaining zones (Main-Lower and Juniper) not considered for inclusion as Mineral Reserves.
The proposed mining methods at Pinyon Plain, similar to other past producing breccia pipe deposits in northern Arizona, includes a combination of longhole stoping, shrinkage stoping, and drifting. Development rock, temporarily stockpiled on surface, will be used to fill the stope voids and shafts after mining is complete. Metallurgical test results provided by White Mesa Mill laboratory personnel indicated that metallurgical recoveries using optimum roasting and leach conditions will be approximately 96% for uranium.
An underground mine design completed by EFR for U3O8 mineralization only was based on assays at a nominal cut-off grade envelope grading 0.15% U3O8. The breakeven cut-off grade is 0.32% U3O8. Production is based on underground mining methods and processing via a toll milling agreement.
Copper mineralization at the site has been excluded from the Mineral Reserve estimates.
Table 1-6: Summary of Estimated Mineral Reserves - December 31, 2022
Energy Fuels Inc. - Pinyon Plain Project
Classification | Cut-Off
Grade | Tonnage | Grade | Contained
Metal | Metallurgical Recovery U3O8 |
(% U3O8 ) | (tons) | (% eU3O8) | (lb U3O8) | (%) |
Main Zone |
Proven | 0.32 | 7,800 | 0.33 | 50,800 | 96 |
Probable | 0.32 | 126,700 | 0.60 | 1,517,000 | 96 |
Total Proven + Probable | | 134,500 | 0.58 | 1,567,800 | 96 |
Notes:
1. CIM (2014) definitions were followed for Mineral Reserves.
2. Mineral Reserves are estimated using a long-term uranium price of US$60.00 per pound.
3. Underground Mineral Reserves were estimated by creating stope shapes. The stope shapes were created using a grade envelope of 0.15% U3O8, with a minimum mining width of 5 ft (including hanging wall and footwall dilution), on 10 ft vertical stope heights.
4. The breakeven cut-off grade is 0.32% U3O8,
5. A mining extraction factor of 95% was applied to the underground stopes, while underground development assumed a 100% mining extraction factor.
6. Mining Reserves are in situ.
7. The density varies according to the block model.
8. Numbers may not add due to rounding.
The SLR QP is not aware of any mining, metallurgical, infrastructure, permitting, or other relevant factors that could materially affect the Mineral Reserve estimate.
1.3.9 Mining Method
Mineralization is found in fractures which range from single high grade structures to intersections forming large zones; several mining methods will be employed based on the size and geometry of the mineralization. The majority and largest ore zones at Pinyon Plain will be mined by longhole stoping. Narrower mineralized zones will be mined as a single drift using jackleg drills with breasting of the roof and ribs to the ore extents. In some cases, the sill may be blasted and mucked out (termed a "floor pull"). All broken material will be hauled by diesel powered load-haul-dump (LHD) low profile loaders to a muck raise located on the mining level and dropped to the lowest mining level (the 5130 level) or the muck raise located off the spiral ramp. From either location, a LHD will rehandle the muck and tram it to the dump pocket located at the 1-5 shaft station.
All mining levels are accessed through a spiral ramp located on the south side of the orebody. The spiral ramp will connect the mine shaft from the 1-4 to the 1-5 shaft stations. All mine development in ore and waste will be through 10 ft square drifts and accessed from the production shaft at the 1-4 and 1-5 shaft stations. Five mining levels will be developed in the orebody, spaced 30 ft to 35 ft apart vertically from the 5130 level to the 5283 levels.
The mine will operate on a single 12 hour day shift, 7 days per week, 355 days per year. Daily rock production averages 143 stpd of ore and 41 stpd of waste over the life of mine. The maximum daily production from the mine is 343 tons of ore plus waste.
1.3.10 Mineral Processing
Ore will be transported to the White Mesa Mill for processing based on a toll milling agreement. Energy Fuels owns and operates White Mesa Mill, which is located near Blanding, Utah. White Mesa Mill is 270 road miles to 320 road miles from the Pinyon Plain Mine, depending on the route.
The White Mesa Mill currently utilizes agitated hot acid leach and solvent extraction to recover uranium. Historical and metallurgical tests, along with White Mesa Mill production records, confirm this processing method will recover approximately 96% of the contained uranium.
The White Mesa Mill was constructed in 1979 to 1980, and is currently fully operational. All required facility infrastructure items are in place at the White Mesa Mill for processing of Pinyon Plain Mine mineralization.
1.3.11 Project Infrastructure
The Pinyon Plain Mine is a developed site with gravel road access and facilities, including line power. Infrastructure at the Project has been designed to accommodate all mining and transportation requirements. In addition to the mine shaft, existing mine infrastructure includes offices, mine dry, warehousing, development rock storage, standby generators, fuelling station, fresh water well, monitor wells and water tanks, a containment pond, electrical power, rapid response services, explosive magazines, equipment utilities, and a workshop. The haulage distance from the Project to the White Mesa Mill in Blanding, Utah, is 320 miles.
1.3.12 Market Studies
EFR has signed uranium sales contracts with major nuclear utilities for a portion of the production from the Project. These contracts provide for sales prices that are expected to be consistent with the prices forecast by TradeTech through the period of planned production from the property. In that event, realized uranium prices may be $2 to $4 higher that the $60/lb that SLR has used for the cash flow analysis if the Project operates within this timeframe.
1.3.13 Environmental, Permitting and Social Considerations
EFR has secured all permits necessary to construct, operate, and close the Project. Permitting involved public participation and involvement. EFR maintains regular interactions with the regulatory community.
1.3.14 Capital and Operating Cost Estimates
The base case capital cost estimate summarized in Table 1‑7 covers the three year life of the Project and are based on Q4 2022 US dollars. Based on the American Association of Cost Engineers (AACE) International classifications, Class 3 estimates have an accuracy range between -10% to -20% (low-end) to +10% to +30% (high-end) (AACE International, 2012). The base case capital and operating cost estimates are within the Class 3 ranges and would meet the S-K 1300 standard of ± 25% accuracy and ≤15% contingency.
Table 1-7: Capital Cost Estimate
Energy Fuels Inc. - Pinyon Plain Project
Pinyon Plain Underground Mine Capital Equipment | Units | Total Cost |
Mine Development | $ 000 | 3,799 |
Loading Pocket & Installation | $ 000 | 129 |
Underground Equipment | $ 000 | 590 |
Ventilation Fans and heater | $ 000 | 1,726 |
Ventilation Raise | $ 000 | 1,219 |
Surface Works | $ 000 | 140 |
Subtotal UG Capital Before Contingency | $ 000 | 7,603 |
| Contingency | $ 000 | 1,368 |
| Total UG Capital Cost | $ 000 | 8,748 |
| Reclamation | $ 000 | 1,407 |
| Total Capital Costs | $ 000 | 10,155 |
Pinyon Plain Underground Mine Capital Equipment | Units | Total Cost |
Contingency | $ 000 | 1,368 |
Total UG Capital Cost | $ 000 | 8,748 |
Reclamation | $ 000 | 1,407 |
Total Capital Costs | $ 000 | 10,155 |
Operating costs are based on EFR’s operating experience. Table 1‑8 shows the operating costs used in the economic evaluation of the Project in Q4 2022 dollars with no contingency applied.
Table 1-8: Operating Cost Summary
Energy Fuels Inc. - Pinyon Plain Project
Area | Cost | Unit |
Mining | $101.00 | $/ore ton mined |
Haulage | $72.00 | $/ore ton mined |
Processing | $192.00 | $/ore ton mined |
G&A | $7.00 | $/ore ton mined |
TOTAL OPEX | $372.00 | $/ore ton mined |
2.0 INTRODUCTION
SLR International Corporation (SLR) was retained by Energy Fuels Inc. (Energy Fuels), the parent company of Energy Fuels Resources (USA) Inc. (EFR), to prepare a Technical Report on the Pre-Feasibility Study (PFS) with respect to the Pinyon Plain Project (Pinyon Plain or the Project), located in Coconino County, Arizona, USA. EFR owns 100% of the Project.
This report has been amended to provide details on the process recovery circuit at the White Mesa Mill in Section 17, and associated disclosure in Sections 1, 25, and 26, and correct minor typographical errors.
EFR's parent company, Energy Fuels Inc., is incorporated in Ontario, Canada. EFR is a US-based uranium and vanadium exploration and mine development company with projects located in the states of Colorado, Utah, Arizona, Wyoming, Texas, and New Mexico. EFR is listed on the NYSE American Stock Exchange (symbol: UUUU) and the Toronto Stock Exchange (symbol: EFR).
This Technical Report satisfies the requirements of Canadian National Instrument 43-101 Standards of Disclosure for Mineral Projects (NI 43-101) and the United States Securities and Exchange Commission's (SEC) Modernized Property Disclosure Requirements for Mining Registrants as described in Subpart 229.1300 of Regulation S-K, Disclosure by Registrants Engaged in Mining Operations (S-K 1300) and Item 601 (b)(96) Technical Report Summary. The purpose of this Technical Report is to disclose the results of a PFS for the Project.
The Project is a uranium and copper breccia pipe deposit in northern Arizona. The Project is permitted and has a 1,470 ft deep shaft, headframe, hoist, compressor, and surface facilities including line power. The Project is currently being developed in preparation for production. Environmental compliance activities continue with all infrastructure for mine development in place. EFR envisages this as a mechanized mining underground operation in which the ore will be hoisted to surface and then trucked to a mill for processing based on a toll milling agreement.
Energy Fuels plans to operate the mine at a rate of up to 292 short tons per day (stpd) of ore, averaging 143 stpd of ore. The mine life extends for a total of 28 months. The life of mine plan includes mining 134,500 tons of ore grading 0.58% U3O8, yielding 1.57 million pounds (Mlb) of U3O8. Process recovery is estimated to be 96% to produce 1.51 Mlb of U3O8. There are additional Mineral Resources at depth below the Mineral Reserves in the current mine plan.
2.1 Sources of Information
Sources of information and data contained in this Technical Report or used in its preparation are from publicly available sources in addition to private information owned by EFR, including that of past property owners.
Mark B. Mathisen, C.P.G., Principal Geologist, SLR, who is an independent qualified person visited the Project under care and maintenance on November 16, 2021. Mr. Mathisen toured the operational areas, project offices, and water treatment facility (WTF) and conducted discussions with EFR Project geologists on current and future plans of operations.
The QPs, Messrs. Malensek and Gochnour, visited Pinyon Plain on October 27, 2022. Messrs. Malensek and Gochnour toured the surface and underground operational areas, project offices, and water treatment facility (WTF) and conducted discussions with EFR site personnel on current and future plans of operations.
Table 2-1 presents a summary of the QP responsibilities for this Technical Report.
Table 2-1: Summary of QP Responsibilities
Energy Fuels Inc. - Pinyon Plain Project
Qualified Person | Company | Title/Position | Section |
Grant A. Malensek, M.Eng., P. Eng. | SLR | Senior Principal Mining Engineer | 1.2, 1.3.12, 1.3.14, 19, 21, 22, 30 |
Mark B. Mathisen, C.P.G. | SLR | Principal Geologist | 1.1.1.1, 1.1.2.1, 1.3.1, 1.3.2, 1.3.4-1.3.7, 2-12, 14, 23, 24, 25.1, 26.1 |
R. Dennis Bergen, P.Eng. | SLR | Associate Principal Mining Engineer | 1.1.1.2, 1.1.2.2, 1.3.8, 1.3.9, 15, 16, 25.2, 26.2 |
Jeffrey L. Woods, MMSA QP | Woods Process Services | Principal Consulting Metallurgist | 1.1.1.3, 1.1.1.4, 1.1.2.3, 1.3.3, 1.3.10, 1.3.11, 13, 17, 18, 25.3, 25.4, 26.3, 26.4 |
Lee (Pat) Gochnour, MMSA (QP) | Gochnour & Associate, Inc. | Associate Principal Environmental Specialist | 1.1.1.5, 1.1.2.5, 1.3.13, 20, 25.5, 26.5 |
All | - | - | 27 |
During the preparation of this Technical Report, discussions were held with personnel from EFR:
• Dan Kapostasy, P.G., Director of Technical Services
• Gordon Sobering, PE, QP, Chief Engineer
• Scott Bakken, P.G., Vice President, Regulatory Affairs
This Technical Report supersedes the previous Technical Report completed by SLR, dated February 22, 2022.
The documentation reviewed, and other sources of information, are listed at the end of this Technical Report in Section 27 References.
2.2 List of Abbreviations
The U.S. System for weights and units has been used throughout this report. Tons are reported in short tons (ton) of 2,000 lb unless otherwise noted. All currency in this Technical Report is US dollars (US$) unless otherwise noted.
Abbreviations and acronyms used in this Technical Report are listed below.
Unit Abbreviation | Definition | Unit Abbreviation | Definition |
μ | micron | L | liter |
a | annum | lb | pound |
A | ampere | m | meter |
bbl | barrels | m3 | meter cubed |
Btu | British thermal units | M | mega (million); molar |
°C | degree Celsius | Ma | one million years |
cm | centimeter | MBtu | thousand British thermal units |
cm3 | centimeter cubed | MCF | million cubic feet |
d | day | MCF/h | million cubic feet per hour |
°F | degree Fahrenheit | mi | mile |
ft ASL | feet above sea level | min | minute |
ft | foot | Mpa | megapascal |
ft2 | square foot | mph | miles per hour |
ft3 | cubic foot | MVA | megavolt-amperes |
ft/s | foot per second | MW | megawatt |
g | gram | MWh | megawatt-hour |
G | giga (billion) | ppb | part per billion |
Ga | one billion years | ppm | part per million |
gal | gallon | psia | pound per square inch absolute |
gal/d | gallon per day | psig | pound per square inch gauge |
g/L | gram per liter | rpm | revolutions per minute |
g/y | gallon per year | RL | relative elevation |
gpm | gallons per minute | s | second |
hp | horsepower | ton | short ton |
h | hour | stpa | short ton per year |
Hz | hertz | stpd | short ton per day |
in. | inch | t | metric tonne |
in2 | square inch | US$ | United States dollar |
J | joule | V | volt |
k | kilo (thousand) | W | watt |
kg/m3 | kilogram per cubic meter | wt% | weight percent |
kVA | kilovolt-amperes | WLT | wet long ton |
kW | kilowatt | y | year |
kWh | kilowatt-hour | yd3 | cubic yard |
3.0 RELIANCE ON OTHER EXPERTS
This Technical Report has been prepared by the SLR QP for EFR's parent company, Energy Fuels. The information, conclusions, opinions, and estimates contained herein are based on:
Information available to the SLR QP at the time of preparation of this Technical Report,
Assumptions, conditions, and qualifications as set forth in this Technical Report, and
Data, reports, and other information supplied by Energy Fuels and other third party sources.
3.1 Reliance on Information Provided by the Registrant
For the purpose of this Technical Report, the SLR QP has relied on information provided by Energy Fuels for the following:
Ownership information for the Project as described in Section 4 Property Description and Location and the Summary of this Technical Report relied upon a legal opinion by Parsons Behle & Latimer dated January 19, 2022, entitled Mining Claim Status Report - Pinyon Mine, Coconino County, Arizona. The SLR QP has not researched property title or mineral rights for the Project as we consider it reasonable to rely on Energy Fuels' legal counsel who is responsible for maintaining this information. The SLR QP has taken all appropriate steps, in their professional opinion, to ensure that the above information from Energy Fuels is sound.
Royalties and other encumbrances for the Project, as described in Section 4 Property Description and Location and the relevant sections of the Summary, was confirmed by Gordon Sobering, Chief Engineer for EFR in an email dated January 23, 2023.
Environmental and permitting information for the Property, as described in Section 4 Property Description and Location, Section 20 Environmental Studies, Permitting, and Social or Community Impact, and the relevant sections of the Summary was provided by Scott Bakken, Vice President, Regulatory Affairs for EFR and reviewed by the SLR QP. The permit register was also provided by Mr. Bakken in an email dated January 30, 2022. SLR is unaware of any changes in the register since the date of confirmation.
SLR has relied on EFR for guidance on applicable taxes and other government levies or interests, applicable to revenue or income, to evaluate the viability of the Mineral Reserves stated in Section 22 Economic Analysis, and the relevant sections of the Summary of this Technical Report. This information was confirmed by Kara Beck, Tax Manager for EFR in an email dated January 24, 2023. SLR is unaware of any changes to the US tax code since the date of confirmation.
Except as provided by applicable laws, any use of this Technical Report by any third party is at that party's sole risk.
4.0 PROPERTY DESCRIPTION AND LOCATION
The Project is a fully permitted underground uranium and copper deposit in northern Arizona. The mineral rights are held by EFR, a wholly-owned subsidiary of EFR Arizona Strip LLC.
4.1 Location
The Project is located in northern Arizona within the Kaibab National Forest, on a fully permitted 17-acre site. It is situated 153 mi north of Phoenix, 86 mi northwest of Flagstaff, 47 mi north of Williams, and seven miles southeast of Tusayan, in Sections 19 and 20, Township 29 North, Range 03 East, Gila and Salt River Meridian (GSRM), Coconino County, Arizona (Figure 4-1).
The geographic coordinates for the approximate center of the Project are located at latitude 35°52'58.65" N and longitude 112°5'47.05" W. All surface data coordinates are State Plane 1983 Arizona Central FIPS 0202 (US feet) system.

Figure 4-1: Location Map
4.2 Land Tenure
EFR's property position at the Project consists of nine unpatented mining claims (Canyon 64-66, 74-76, and 84-86), located on U.S. Forest Service (USFS) land, encompassing approximately 186 acres (Figure 4-2). Gulf Mineral Resources (Gulf) originally staked the claims in 1978 and various companies have maintained the claims since the original staking. EFR acquired the Project in June 2012 and has a 100% interest in the claims.
All claims, which are renewed annually in September of each year, are in good standing until September 1, 2023 (at which time they will be renewed for the following year as a matter of course). All unpatented mining claims are subject to an annual federal mining claim maintenance fee of $165 per claim plus approximately $10 per claim for county filing fees to the BLM. Table 4-1 lists the mineral claims covering the Project.
Table 4-1: Claims Held by EFR for the Pinyon Plain Project
Energy Fuels Inc. - Pinyon Plain Project
Section | Quadrant | Serial
Number | Claim Type | Claim Name | Claimant | Loc.
Date | Next Pmt
Due Date |
19 & 20 | NE(19),NW(20) | AZ101406928 | LODE CLAIM | CANYON #64 | EF ENERGY FUELS | 4/5/1978 | 9/1/2023 |
19 & 20 | NE,SE(19),NW,SW(20) | AZ101408027 | LODE CLAIM | CANYON #65 | EF ENERGY FUELS | 4/5/1978 | 9/1/2023 |
19 & 20 | SE(19),SW(20) | AZ101422944 | LODE CLAIM | CANYON #66 | EF ENERGY FUELS | 4/5/1978 | 9/1/2023 |
20 | NW | AZ101424281 | LODE CLAIM | CANYON #74 | EF ENERGY FUELS | 4/5/1978 | 9/1/2023 |
20 | NW,SW | AZ101511848 | LODE CLAIM | CANYON #75 | EF ENERGY FUELS | 4/5/1978 | 9/1/2023 |
20 | SW | AZ102522768 | LODE CLAIM | CANYON #76 | EF ENERGY FUELS | 4/5/1978 | 9/1/2023 |
20 | NE,NW | AZ101515633 | LODE CLAIM | CANYON #84 | EF ENERGY FUELS | 4/4/1978 | 9/1/2023 |
20 | NE,NW,SE,SW | AZ101403513 | LODE CLAIM | CANYON #85 | EF ENERGY FUELS | 4/4/1978 | 9/1/2023 |
20 | SE,SW | AZ101408062 | LODE CLAIM | CANYON #86 | EF ENERGY FUELS | 4/4/1978 | 9/1/2023 |

Figure 4-2: Land Tenure Map
4.3 Required Permits, Authorizations and Status
The Project is located on public lands managed by the USFS and has an approved Plan of Operations (PoO) with the USFS. The Pinyon Plain Property has also received permit authorizations through the Arizona Department of Environmental Quality (ADEQ), which include Aquifer Protection Permits for the Non-Stormwater Impoundment, Ore Stockpile and Development Rock Stockpile, an Air Quality Control Permit, and Storm Water Multi-Sector General Permit coverage. In 2015, the Property also received approval from the US Environmental Protection Agency (EPA) to Construct/Modify an Underground Uranium Mine pursuant to the National Emissions Standards for Hazardous Air Pollutants (NESHAPs).
The SLR QP is not aware of any factors or risks that may affect access, title, or the right or ability to perform the proposed work program on the Property.
4.4 Royalties
In late 2022 EFR contracted a legal firm, Parsons Behle & Latimer (the Firm), to examine evidence of title and ownership of the existing royalties on the unpatented land claims associated with the Pinyon Plain mine.
The Firm examined records of the Coconino County Recorder related to existing royalties and found a mining deed and lease dated December 1, 1982, between the Gulf Oil Corporation (Gulf) and Energy Fuels Exploration Company (EFEC) reserving a 3.5% royalty based on a sliding pricing guaranteed by the US Government based on ore grade plus allowances for mining and haulage as outlined in the United States Atomic Energy Commission (AEC) Circular 5. Additionally, a 7% net smelter return (NSR) royalty on minerals other than uranium was also agreed upon with Gulf, which is not applicable at this time since uranium is the only metal planned to be milled from the Project as outlined in the economic analysis section (Section 22) of this Technical Report.
Based on the AEC guidance, current Pinyon Plain Mineral Reserves, and EFR's uranium contracted price for Pinyon Plain ores, the calculated Pinyon Plain royalty to Gulf is $1.88 per ore ton mined.
4.5 Other Significant Risks
The SLR QP is not aware of any environmental liabilities on the Project. Energy Fuels has all required permits to conduct the proposed work on the Project. The SLR QP is not aware of any other significant factors and risks that may affect access, title, or the right or ability to perform the proposed work program on the Project.
5.0 ACCESSIBILITY, CLIMATE, LOCAL RESOURCES, INFRASTRUCTURE AND PHYSIOGRAPHY
5.1 Accessibility
Access to the Project site is via State Highway 64 and Federal Highway 180 to within five miles of the mine site, then over unsurfaced public USFS roads (Figure 4-1). The Atchison, Topeka and Santa Fe railway line passes east-west 50 mi south of the site at Williams, and a spur of the railway, which passes 10 mi west of the Project site, services the Grand Canyon National Park. Airports at Flagstaff, Phoenix, and Tusayan provide air access to the area.
Although the Coconino Plateau is sparsely populated, tourist traffic to Grand Canyon National Park results in large numbers of people passing through the region daily.
5.2 Vegetation
Vegetation on the plateaus is primarily ponderosa pine forest with some open pinyon-juniper woodland and shrubs. The local climate allows for a year-round mining operation.
5.3 Climate
The climate in northern Arizona is semi-arid, with cold winters and hot summers. January temperatures range from approximately 7°F to 57°F and July temperatures range from 52°F to 97°F. Annual precipitation, mostly in the form of rain but with some snow, is about 12 in.
5.4 Local Resources
Personnel and supplies for future mining operations are expected to be sourced from the nearby towns of Williams and Flagstaff, Arizona (50 miles and 70 miles, respectively), as well as other underground mining districts in the western United States. Although the Coconino Plateau is sparsely populated, tourist traffic to Grand Canyon National Park results in large numbers of people passing through the region daily.
5.5 Infrastructure
In addition to the mine shaft, existing surface mine infrastructure includes surface maintenance shops, employee offices and change rooms, a water well, an evaporation pond, water treatment plant, explosive magazines, water tanks, fuel tank, and rock stockpile pads (ore and development rock). Electrical power is available through an existing power line that terminates at the site.
In 1982, Energy Fuels Nuclear, Inc. (EFNI), which is not part of Energy Fuels Inc., acquired the Project. From 1982 to 1987, EFNI conducted exploration drilling, permitted the mine, constructed certain surface facilities including a headframe, hoist, and compressor, and sunk the shaft to a depth of 50 ft. From 1987 to 2013, the Project was put on standby due to low uranium prices. In 2012, EFR acquired the Project through its acquisition of Denison Mines Corporation's US assets (Denison). Beginning in 2013, EFR refurbished the surface facilities and extended the shaft an additional 228 ft to a depth of 278 ft. In late 2013, the Project was again placed on standby due to low uranium prices. In October 2015, EFR re-started the Project and committed to completing the shaft and underground delineation drilling program. From October 2015 to March 2018, the shaft was sunk to a final depth of 1,470 ft, and three development levels were started at the 1,000 ft (5,506 ft ASL), 1,220 ft (5,286 ft ASL); and 1,400 ft (5,106 ft ASL) depths, all of which have functioned as drill stations.
During 2019, a 1,000,000-gallon water tank was installed, in addition to the existing 400,000-gallon tank installed in 2017. These above-ground storage tanks are used for operational flexibility and extra water storage capacity during winter months. Three floating, downcasting, enhanced evaporators were installed in the Non-Stormwater Impoundment to aid in evaporation. The tanks and evaporators are part of Energy Fuels' water balance management practices at the site.
During 2020, a fourth floating, down-casting, enhanced evaporator was installed at the site to increase the operational flexibility of the water balance management practices. Additionally, a water capture and pumping system was installed in the shaft to segregate unimpacted water and store it for beneficial use.
During 2021, a water treatment plant was installed to process water for offsite transport. The water treatment plant was commissioned in April 2021. Water use agreements have been entered into with local farmers and ranchers through which they may utilize excess water from the Pinyon Plain Project for their own beneficial uses within the Coconino Plateau groundwater basin.
In addition to the mine shaft, existing surface mine infrastructure includes surface maintenance shops, employee offices and change rooms, a water well, an evaporation pond, explosive magazines, water tanks, fuel tank, and rock stockpile pads (ore and development rock). Electrical power is available through an existing power line that terminates at the site.
5.6 Physiography
Northern Arizona is part of the Colorado Plateau, a region of the western United States characterized by semi-arid, high-altitude, gently sloping plateaus dissected by steep walled canyons, volcanic mountain peaks, and extensive erosional escarpments. The Project is located on the Coconino Plateau within the Colorado Plateau, at an elevation of approximately 6,500 feet above sea level (ft ASL).
Overall, the land is flat lying across several square miles surrounding the Project. Elevation at the site is 6,500 ft ASL with a southern downward slope averaging 100 ft per mile. Two major regional topographical features include the Red Butte, a lava capped mesa 4.5 mi south at an elevation of 7,234 ft ASL, and the Colorado River, 15 mi to the north at an elevation of 2,500 ft ASL.
Major landforms in the general area of the Project include nearly level drainage bottoms of recent alluvium, gently sloping plateau ridgetops, and moderately sloping canyon sideslopes. Soils have developed from residual or colluvial parent materials, and outcrops of bedrock are typically exposed along shoulder slopes and ridgetops. The Coconino Rim, a north-facing escarpment east and north of the deposit, is the major landform obstructing access between Pinyon Plain and highways to the east.
6.0 HISTORY
Uranium exploration and mining of breccia pipe deposits started in the region in 1951 when a geologist with the U.S. Geological Survey noted uranium ore on the dump of an old copper prospect on the South Rim of the Grand Canyon in Northern Arizona. The prospect was inside Grand Canyon National Park, but on fee land that predated the Park. The Golden Crown Mining Company, which later merged with Western Gold and Uranium Inc., mined a significant high grade uranium deposit, the Orphan Mine, from 1956 to 1969. By the time mining ended, 4.26 million pounds (Mlb) of uranium, along with some minor amounts of copper, vanadium, and silver had been produced (Bennett, n.d.).
After the discovery of this first uranium deposit in the 1950s, an extensive search for other uranium deposits was made by the government and mining industry, but only a few low-grade prospects were found. Exploration started again in the early-1970s.
In the mid-1970s, Western Nuclear leased the Hack Canyon prospect located approximately 25 mi north of the Grand Canyon and found high grade uranium mineralization offsetting an old shallow copper-uranium site. In the next few years, a second deposit was found a mile away along a fault.
In the late-1970s, EFNI formed a uranium exploration venture with several Swiss utilities and acquired significant uranium reserves in southeast Utah. EFNI permitted and built the 2,000 stpd White Mesa Mill near Blanding, Utah, to process Colorado Plateau ore, which was expected to average 0.13% U3O8. When the uranium market fell in 1980, the higher-grade Hack Canyon property was leased by EFNI from Western Nuclear in December 1980 as a likely low-cost source of U3O8 mill feed. Development started promptly, and the Hack Canyon deposits were in production by the end of 1981. They proved to be much better than the initial estimates suggested in terms of both grade and tonnage.
As part of their exploration program, EFNI identified and investigated more than 4,000 circular features, which potentially indicate mineralized breccia pipes, in northern Arizona. Approximately 110 of the most prospective features were further explored by deep drilling, and nearly 50% of those drilled were shown to contain uranium mineralization. Ultimately, nine pipes were developed. Total mine production from the EFNI breccia pipes from 1980 through 1991 was approximately 19.1 Mlb of U3O8 at an average grade of just over 0.60% U3O8.
The Project is a uranium and copper breccia pipe deposit in northern Arizona. The Project was originally included as part of the Arizona Strip Uranium Project. The Arizona Strip Uranium Project was located in the Arizona Strip District, a mining district located in northwestern Arizona, and contained three deposits: the Pinenut Mine, the Arizona 1 Mine, and the Project. The Pinenut and Arizona 1 breccia pipes are located between the town of Fredonia, Arizona, and the Grand Canyon National Park. The Pinenut Mine was mined-out in 2015 and is currently being reclaimed. The Arizona 1 Mine is currently on standby. The Project has been considered separate from the Arizona Strip Uranium Project since 2017.
6.1 Prior Ownership
The Project is located on mining claims that EFNI acquired from Gulf in 1982. Gulf originally staked the claims in April 1978. EFNI was acquired by the Concord group in the early-1990s. The Concord group declared bankruptcy in 1995, and most of the EFNI assets, including the Project, were acquired by International Uranium Corporation (IUC) in 1997. IUC merged with Denison Mines Inc. on December 1, 2006, and the new company changed its name to Denison Mines Corporation. In June 2012, Energy Fuels Inc. acquired all of Denison's mining assets and operations in the United States. Currently the Project claims are held by EFR, a wholly-owned subsidiary of EFR Arizona Strip LLC.
6.2 Exploration and Development History
Since 1994, exploration activities undertaken on the Project have only included drilling. Prior to that, exploration activities carried out by EFR's predecessors from 1983 to 1987 include:
Ground control source audio magneto tellurium (CSAMT) surveys
Ground magnetics
Ground very low frequency (VLF) surveys
Time domain electro-magnetic surveys (TDEM)
Surface gravity surveys
Airborne electromagnetic (EM) surveys.
At the time of the acquisition by EFR the Project was permitted and contained a headframe, hoist, and compressor, and a shaft to a depth of 50 ft. EFR refurbished the surface facilities and extended the shaft an additional 228 ft to a depth of 278 ft. In late 2013, the Project was placed on standby due to low uranium prices. In October 2015, EFR re-started the Project and committed to completing the shaft and underground delineation drilling program. From October 2015 to March 2017, the shaft was sunk to a depth of 1,470 ft, and three development levels were started at the 1,003 ft, 1,220 ft, and 1,400 ft depths, all of which have functioned as drill stations.
The Project was previously referred to as the Canyon Mine, however, in November of 2020 EFR changed the project name to Pinyon Plain.
6.2.1 Drilling
The basic tool for exploring breccia pipes in northern Arizona is deep rotary drilling, supplemented by core drilling, up to a depth of 2,000 ft or more from surface. All drill holes are surveyed for deviation and logged using gamma logging equipment, as described in Section 11.1.1. Previous operators drilled 45 surface holes, including a deep water well, totalling 62,289 ft (Table 6-1). Gulf drilled eight exploration holes at the Project site from 1978 to May 1982 but found only low-grade uranium mineralization. Additional drilling by EFNI in 1983 identified economic uranium mineralization at the Pinyon Plain breccia pipe.
After EFNI identified mineralization, shallow drilling was conducted to locate the center of the collapse feature (holes S01-S13), as a guide to the throat of the underlying breccia pipe. EFNI followed this up with additional deep drilling to better define the mineralization.
Table 6-1: Drilling at Pinyon Plain Project by Previous Operators
Energy Fuels Inc. - Pinyon Plain Project
Year | Company | Location | # Holes | Total Depth
(ft) | Hole ID | Type |
1978-1982 | Gulf | Surface | 8 | 13,041 | COG Series | Rotary |
1983 | EFNI | Surface | 5 | 10,504 | CYN Series 01-05 | Rotary |
1984 | EFNI | Surface | 13 | 1,350 | CYN Series S01-S13 | Rotary |
1984 | EFNI | Surface | 10 | 18,462 | CYN Series 06-14C & 16C | Core/Rotary |
1985 | EFNI | Surface | 2 | 3,534 | CYN 15C & CYN 15W1 | Core |
Year | Company | Location | # Holes | Total Depth
(ft) | Hole ID | Type |
1986 | EFNI | Surface | 1 | 3,086 | 55-515772 | Water Well |
1994 | EFNI | Surface | 6 | 12,312 | CYN Series 17-22 | Rotary |
Total | | | 45 | 62,289 | | |
6.3 Past Production
A mine shaft and conveyances were developed for underground exploration, as described in Section 5.5, and are operational, however, no past production has occurred at the Project.
7.0 GEOLOGICAL SETTING AND MINERALIZATION
7.1 Regional Geology
The Project is located on the Colorado Plateau, south of the Grand Canyon, within the Kaibab National Forest. The Project's mineralization is controlled by a collapse structure known as a breccia pipe. This breccia pipe is one of thousands of collapse structures found on the north and south rims of the Grand Canyon. The Pinyon Plain pipe extends from the surface (Moenkopi Formation) through various geologic strata into the Redwall Limestone.
Parts of two distant physiographic provinces are found in Arizona: the Basin and Range Province located in the southern portion of the state; and the Colorado Plateau Province located across the northern and central portions of the state. Pinyon Plain lies within the Colorado Plateau Province.
Surface exposures near the Project reveal sedimentary and volcanic rocks ranging in age from upper Paleozoic to Quaternary. The area is largely underlain by Mississippian through Triassic Period sedimentary rocks, however, exposed within the Grand Canyon are older rocks reaching Precambrian in age.
The region has experienced volcanic activity since the Pliocene epoch. A number of lava-capped buttes rise above the general landscape, and lava flows cover large areas in the southern part of the district. Faulting has exerted significant control on the geologic development and geomorphic history of the region. Major structural features are the Grand Wash, Hurricane, and Toroweap fault systems, all generally trending north-south with an eastern up thrown side. These faults are topographically prominent and show impressive scarps though other less prominent fault systems exist.
The deep incision of the Grand Canyon and associated side canyons, such as Kanab Creek, have dewatered the sedimentary section. Regionally ground water is encountered in the Redwall limestone, which coincides with the deeper formations exposed in the Grand Canyon. Perched ground water, usually in very limited quantities, is often encountered at the base of the Coconino sandstone in contact with the low permeability Hermit shale sequence. Figure 7-1 is a map showing the regional geology of the Project. Figure 7-2 presents a regional stratigraphic column.

Figure 7-1: Regional Geologic Map

Figure 7-2: Regional Stratigraphic Column
7.2 Local Geology
The surface expression of the Project is a broad shallow depression in the Permian Kaibab Formation. The pipe is essentially vertical with an average diameter of less than 200 ft, but it is considerably narrower through the Coconino and Hermit horizons (80 ft in diameter). The cross-sectional area is approximately 20,000 ft² to 25,000 ft². The pipe extends for at least 2,300 ft vertically from the Toroweap limestone to the upper Redwall horizons (Figure 7-3). The ultimate depth of the pipe is unknown. Uranium mineralization is concentrated in an annular ring within the breccia pipe.
7.2.1 Structural Geology
Regional joint systems rooted below the Redwall trend northwest-southeast and northeast-southwest. The regional joints and fractures lead to upward caving of the karstic voids in the Redwall Limestone vertically through the overlying Paleozoic sediments. As surface water and groundwater interact with the pipe, a circular brecciated column forms inside of the fracture controlled boundary.
Fractures related to the pipe can surround the brecciated zone and extend thin "ring fractures" up to 300 ft beyond the breccia pipe. Vertical joints and associated breccia pipes increase permeability and porosity, leading to the mineralization observed in the region. Figure 7-4 presents a horizontal section looking down at the breccia pipe and shows the distribution of mineralization with reference to the pipe structure.
7.2.2 Alteration
The Pinyon Plain breccia pipe is surrounded by bleached zones, particularly notable in the Hermit Formation where unaltered red sediments contrast sharply with gray-green bleached material. Bleaching is common within 100 ft of the pipe boundary. Sulfide mineralization, commonly in the form of pyrite, is found as streaks or blebs within the bleached zones.

Figure 7-3: Cross Section of Local Geology

Figure 7-4: Pinyon Plain Horizontal Slice Main Zone - Slice 5,200' Level
7.3 Mineralization
Mineralization at the Project extends vertically approximately 1,700 ft, both inside and outside the pipe, but high grade uranium and copper mineralization is found primarily in the collapsed portions of the Coconino, Hermit, and Esplanade horizons and at the margins of the pipe in fracture zones. Sulfide zones are found scattered throughout the pipe but are especially concentrated (within a sulfide cap) near the Toroweap-Coconino contact, where the cap averages 20 ft thick and consists of pyrite and bravoite, an iron-nickel sulfide. The ore assemblage consists of uranium-pyrite-hematite with massive copper sulfide mineralization common in and near the high grade zone. The strongest mineralization appears to occur in the lower Hermit-upper Esplanade horizons in an annular fracture zone.
The metal of interest at the Project is uranium, though significant copper mineralization co-exists in the breccia pipe. As the rocks making up the breccia within the pipe are all sedimentary rocks, mineralization typically occurs within the matrix material (primarily sand) surrounding the larger breccia clasts.
7.3.1 Uranium Mineralization
Uranium mineralization at the Project is concentrated in three stratigraphic levels or zones (Upper/Cap, Main, and Juniper) within a collapse structure ranging from 80 ft to 230 ft wide with a vertical extension from a depth of 650 ft to over 2,100 ft, resulting in approximately 1,450 ft of mineralization. Mineralized intercepts range widely up to several tens of feet with grades in excess of 1.00% U3O8. In previous reports and EFR news releases, the mineralization was subdivided into six distinct zones; those six have been combined into the three listed above for simplicity. The Upper/Cap Zone combines the previously reported Upper and Cap Zones. The Main Zone combines the previously reported Main and Main-Lower zones, and Juniper combines the previously reported Juniper I and Juniper II zones.
Age dating of mineralization (U-Pb) indicates a range from 101 million to 260 million years, which suggests that the earliest uranium mineralization had occurred in the Permian Period before the pipes completely formed in the Triassic Period.
Consistent with other breccia pipe deposits, in the mineralized zone, the uranium mineralization occurs largely as blebs, streaks, small veins, and fine disseminations of uraninite/pitchblende (UO2). Mineralization is mainly confined to matrix material, but may extend into clasts and larger breccia fragments, particularly where these fragments are of Coconino sandstone. Uranium mineralization occurs primarily as uraninite and various uranium phase minerals (unidentifiable minerals) with lesser amounts of brannerite and uranospinite.
7.3.2 Copper Mineralization
Currently, there is no reasonable prospect for the economic extraction of copper at the Project.
Significant copper mineralization occurs at the Project within the Main zone and to a lesser extent in the Main-Lower zone, both with uranium mineralization and outside of uranium mineralization.
Copper mineralization can be disseminated throughout the matrix material (commonly replacing calcite cement) with higher-grade mineralization typically occurring as vug fills, blebs, or streaks within the matrix and sometimes zoning the breccia clasts. The highest-grade copper mineralization completely replaces the matrix cement or replaces the matrix material all together.
8.0 DEPOSIT TYPES
Paleozoic Era sedimentary rocks of northern Arizona are host to thousands of breccia pipes. The pipes extend from the Mississippian Redwall Limestone up to the Triassic Chinle Formation, a total of approximately 4,000 ft of section. Due to erosion and other factors, however, no single pipe has been observed cutting through the entire section. No pipe occurs above the Chinle Formation or below the Redwall Limestone. Breccia pipes mineralized with uranium are called Solution-Collapse Breccia Pipe Uranium deposits, which are defined as U.S. Geological Survey Model 32e (Finch, 1992).
Breccia pipes within the Arizona Strip District are vertical or near vertical, circular to elliptical bodies of broken rock comprised of slabs, rotated angular blocks and fragments of surrounding and stratigraphically higher formations. The inclusion of breccia made of stratigraphically higher formations suggests that the pipes formed by solution collapse of underlying calcareous rocks, such as the Redwall Limestone. Surrounding the blocks and slabs making up the breccia is a matrix of fine material comprised of surrounding and overlying rock from various formations. For the most part, the matrix consists of siliceous or calcareous cement.
Breccia pipes are comprised of three interrelated features: a basinal or structurally shallow depression at surface (designated by some as a collapse cone); a breccia pipe, which underlies the structural depression; and annular fracture rings, which occur outside, but at the margin of the pipes. Annular fracture rings are commonly, but not always, mineralized. The structural depression may range in diameter up to 0.5 miles or more, whereas breccia pipe diameters can range up to approximately 600 ft, but normally range from 200 ft to 300 ft in diameter.
Mineralization in the breccia pipes takes place by water flowing along fractures and through porous materials that provide conduits for fluid flow and typically takes place in stages. Wenrich and Sutphin (1989) identified at least four separate mineralizing events that occur within the Arizona Strip District pipes, with uranium and copper mineralization occurring as part of the last two mineralizing events.
To date, mineralized breccia pipes appear to occur in clusters or trends. Spacing between pipes ranges from hundreds of feet within a cluster to several miles within a trend. Pipe location may have been controlled by deep-seated faults, but karstification of the Redwall Limestone in the Mississippian and Permian Periods is considered to have initiated formation of the numerous and widespread pipes in the region.
9.0 EXPLORATION
EFR has completed no exploration work on the Project other than underground development drilling discussed in Section 10, since acquiring the properties in 2012.
9.1 Geotechnical
In 1987, the geotechnical consulting firm of Dames and Moore (1987) completed an evaluation of mine stability and subsidence potential at the Project.
The scope of work was based on a review of geologic and geotechnical data from similar breccia pipe uranium mines on the Arizona Strip (the Orphan Mine, the Hack 2 Mine, Kanab North, and the Pigeon Mine), including the stability of existing underground stopes.
Numerical modeling of stopes was analyzed at depths of 800 ft, 1,200 ft, and 1,600 ft below surface with a surrounding rock strength of 3,000 psi. Stope dimensions at these mines varied from 60 ft high by 30 ft wide (Orphan Mine) to 350 ft high by 200 ft wide (Hack 2 Mine). Ground support was limited to rock bolts in the stope backs and no backfill.
The report concluded that stopes up to 350 ft high at a depth of 1,200 ft would not develop significant stability problems as long as prudent ground supports were employed, which EFR plans to install during mining. In addition, the report predicted mined out stopes would fill with rubblized rock as a result of subsidence reaching surface in several hundred years; the surface expression would be less than two feet over a broad area and would be difficult to observe in the field.
Since the geotechnical report was produced, EFR has decided to fill stopes with waste rock generated from accessing the orebody, which will significantly reduce any post-mining surface expression from ground subsidence.
EFR has not conducted any geotechnical work at the Project since its acquisition.
10.0 DRILLING
EFR acquired the Project from Denison in 2012. Since that time, exploration work carried out by EFR at the Project has included the drilling of 80 core holes and 25 percussion holes from three subsurface levels accessed from the production shaft to delineate mineralization extents, results of which were used to update the geologic model and Mineral Resource estimates discussed in the following sections of this report.
Three mineralized zones have been identified on the Project; from top downward, they are the Upper/Cap Zone, the Main Zone, and the Juniper Zone. Mineral Resources (Section 14) are reported on the Main and Juniper Zones; the Upper/Cap Zone is currently an exploration target.
10.1 Drilling
As of the effective date of this report, EFR and its predecessors have completed 150 holes (45 surface and 105 underground), totalling 92,724 ft, from 1978 to 2017 using core, rotary, and percussion methods. No drilling was conducted on the Project from 1994 to 2016.
Drill hole collar locations are recorded on the original drill logs and radiometric logs created at the time of drilling, including easting and northing coordinates in local grid or modified NAD 1983 Arizona Central FIBPS 0202 (US feet) and elevation of collar in feet above sea level. Drill hole orientation were surveyed with a Reflex EZ Shot or similar deviation tool in the drill string every time a length of drill pipe was added.
From 2016 to 2017, EFR completed 105 underground drill holes totalling 30,314 ft from drill stations developed from the Pinyon Plain mineshaft. No drilling has taken place on the Project since 2017. A summary of drilling completed by EFR is presented in Table 10-1, and Figure 10-1 shows the locations of all the drill collars from EFR and the previous operators.
Table 10-1: Underground Drill hole Database Summary
Energy Fuels Inc. - Pinyon Plain Project
Year | Company | Location | # Holes | Total Depth
(ft) | Hole ID | Type |
2016 | EFR | 1-3 Level | 15 | 12,435 | CMCH Series 001 - 015 | Core |
2016 | EFR | 1-4 Level | 25 | 4,179 | CMLH Series 001 - 025 | Percussion |
2016-2017 | EFR | 1-4 Level | 42 | 8,420 | CMCH Series 016 - 058 | Core |
2017 | EFR | 1-5 Level | 23 | 5,401 | CMCH Series 059 - 081 | Core |
Total | | | 105 | 30,314 | | |

Figure 10-1: Surface Drill hole Collar Locations
All core was removed by the drillers from the wireline core barrel and placed in core boxes, orienting the core to fit together where possible and limiting a core box to a single run. The driller labeled the core box with the drill hole ID, box number, and start/finish depths on both the bottom of the core box and the core box lid. The driller also placed blocks or core markers in the core box to indicate the "from" and "to" depths of the core run as well as the core run number. If core was not recovered during a core run, a wooden block was placed in the core box by the driller with the "from" and "to" depths of no recovery (if known). Core was transported from the drill station by the driller or the geologist to surface for logging.
Upon arrival at the core logging facility on surface, core was photographed and screened radiometrically using a Radiation Solutions RS‐125 Super‐SPEC device and elementally using a handheld x-ray fluorescent (XRF) analyzer. Drill core recovery percentage was noted. Core was then logged by the field geologist, noting the depth of each stratigraphic unit, and a description of lithology and structures. Details noted on the lithology log include colour, texture, grain size, cementation, and mineralogy of each lithologically distinct unit, as well as the type of fracture and any voids or vugs.
All drill holes on the Property were logged with a radiometric probe to measure the natural gamma radiation, from which an indirect estimate of uranium content was made and is discussed in Section 11.1.1.
In the opinion of the SLR QP, the drilling, logging, sampling, and conversion and recovery factors at the Project meet or exceed industry standards and are adequate for use in the estimation of Mineral Resources.
10.1.1 Copper Mineralization
During exploration drilling at the Project in 2016, copper mineralization was discovered within the breccia pipe. The core from the underground drilling program was analyzed for copper mineralization with an Olympus Vanta handheld XRF device. Sections of core that showed grades of approximately 0.5% Cu or above where uranium was not present were sampled for chemical assay. Sections of core that contained uranium (identified with a scintillometer) were also sampled for chemical assay to determine both the uranium and copper content. Table 10-2 lists a number of selected composited intercepts of copper mineralization. Figure 10-2 and Table 10-3 provide some detail of the statistics associated with the copper mineralization.
Table 10-2: Selected Copper and Uranium Assay Intercepts
Energy Fuels Inc. - Pinyon Plain Project
Hole ID | Target
Zone | From
(ft) | To
(ft) | Intercept
Length
(ft) | U3O8 | Cu | Azimuth
(°) | Dip
(°) | Depth
(ft below
surface) |
2 | Main | 213 | 318 | 105.0 | 0.17% | 9.55% | 225 | -63 | 1,190 |
3 | Main | 205 | 265 | 60.0 | 0.02% | 7.66% | 213 | -63 | 1,182 |
4 | Main | 294 | 335 | 41.0 | 1.09% | 2.75% | 211 | -75 | 1,285 |
4 | Main | 335 | 342 | 7.0 | 0.01% | 9.95% | 213 | -75 | 1,320 |
5 | Main | 265 | 319 | 54.0 | 0.72% | 9.19% | 224 | -70 | 1,250 |
6 | Main | 298 | 342 | 44.0 | 0.74% | 10.22% | 228 | -75 | 1,284 |
6 | Juniper | 784 | 822 | 38.0 | 0.28% | 0.53% | 228 | -75 | 1,793 |
Hole ID | Target
Zone | From
(ft) | To
(ft) | Intercept
Length
(ft) | U3O8 | Cu | Azimuth
(°) | Dip
(°) | Depth
(ft below
surface) |
7 | Main | 302 | 348 | 46.0 | 1.37% | 13.52% | 240 | -74 | 1,287 |
7 | Juniper | 644 | 656 | 12.0 | 1.26% | 0.81% | 240 | -74 | 1,626 |
8 | Main | 316 | 374 | 58.0 | 0.75% | 13.91% | 244 | -74 | 1,305 |
1 | Main | 372 | 390 | 18.0 | 1.23% | 7.74% | 240 | -78 | 1,360 |
11 | Main | 636 | 642 | 6.0 | 16.99% | 1.20% | 240 | -78 | 1,618 |
12 | Main | 302 | 314 | 12.0 | 1.78% | 3.81% | 224 | -76 | 1,294 |
12 | Main | 332 | 340 | 8.0 | 0.84% | 26.20% | 224 | -76 | 1,318 |
13 | Main | 348 | 360 | 12.0 | 0.95% | 6.83% | 195 | -76 | 1,334 |
14 | Main | 296 | 300 | 4.0 | 8.35% | 1.64% | 200 | -75 | 1,281 |
14 | Main | 334 | 354 | 20.0 | 0.93% | 9.30% | 200 | -75 | 1,319 |
15 | Main | 436 | 444 | 8.0 | 0.02% | 12.87% | 250 | -79 | 1,420 |
16 | Main | 12 | 70 | 58.0 | 0.51% | 5.57% | 200 | -60 | 1,221 |
16 | Main | 120 | 132 | 12.0 | 1.41% | 3.28% | 200 | -60 | 1,329 |
17 | Main | 12 | 48 | 36.0 | 0.65% | 5.12% | 195 | -51 | 1,242 |
18 | Main | 3 | 53 | 50.0 | 0.22% | 5.49% | 195 | -40 | 1,238 |
19 | Main | 107 | 143 | 36.0 | 1.14% | 12.68% | 195 | -32 | 1,283 |
23 | Main | 14 | 62 | 48.0 | 0.48% | 14.25% | 175 | -60 | 1,254 |
25 | Main | 14 | 42 | 28.0 | 0.61% | 10.08% | 180 | -40 | 1,221 |
26 | Main | 18 | 42 | 24.0 | 0.56% | 18.17% | 180 | -30 | 1,221 |
26 | Main | 86 | 134 | 48.0 | 2.88% | 2.31% | 180 | -32 | 1,323 |
27 | Main | 12 | 44 | 32.0 | 0.29% | 11.54% | 180 | -20 | 1,216 |
32 | Main | 120 | 192 | 72.0 | 0.99% | 10.08% | 220 | -41 | 1,348 |
33 | Main | 4 | 76 | 72.0 | 0.11% | 5.25% | 222 | -31 | 1,240 |
33 | Main | 100 | 128 | 28.0 | 1.66% | 14.85% | 222 | -31 | 1,328 |
37 | Main | 166 | 196 | 30.5 | 1.54% | 10.35% | 240 | -50 | 1,346 |
38 | Main | 8 | 154 | 146.0 | 0.47% | 6.22% | 241 | -40 | 1,292 |
40 | Main | 12 | 112 | 100.0 | 0.90% | 9.44% | 240 | -21 | 1,288 |
43 | Main | 16 | 136 | 120.0 | 0.81% | 11.95% | 260 | -41 | 1,287 |
48 | Main | 54 | 62 | 8.0 | 3.57% | 0.29% | 280 | -41 | 1,258 |
64 | Main | 64 | 142 | 78.0 | 1.11% | 9.47% | 300 | +47 | 1,325 |
67 | Main | 142 | 190 | 48.0 | 1.78% | 11.22% | 285 | +19 | 1,346 |
69 | Main | 144 | 208 | 64.0 | 1.08% | 14.51% | 285 | +40 | 1,287 |
80 | Juniper | 290 | 298 | 8.0 | 5.03% | 0.61% | 290 | -62 | 1,538 |
81 | Juniper | 275 | 286 | 11.0 | 3.26% | 0.64% | 263 | -51 | 1,577 |
Table 10-3: Declustered Cu Assay Statistics
Energy Fuels Inc. - Pinyon Plain Project
Item | Value |
No. Samples | 3,500 |
Mean | 2.37% |
Standard Deviation | 5.14 |
Variance | 26.36 |
Coef. Of Variation | 2.17 |
Maximum | 55.66% |
Upper Quartile | 1.81% |
Median | 0.17% |
Lower Quartile | 0.04% |
Minimum | 0.00% |

Figure 10-2: Histogram of Declustered Cu Assays
11.0 SAMPLE PREPARATION, ANALYSES, AND SECURITY
11.1 Sample Preparation and Analysis
This section references the Standard Operating Procedure (SOP) Handbook for core handling, sampling, and quality assurance/quality control (QA/QC) protocols for core drilling at the Project, prepared by EFR in December 2016 (Energy Fuels, 2016).
Samples respect geological contacts and vary from 2 ft to 10 ft in length, depending on core recovery, length of the lithological unit, and mineralization. Most core samples were four feet long, except where broken along lithological or mineralization contacts. Core outside the breccia pipe was considered barren and was not sampled. Sample interval and number were marked on the core log, the core-sampling log, and the sample bags.
Sample core was cut in half, lengthwise, by technicians with a diamond saw, returning half of the split core to the core box and submitting the other half for sample preparation and analysis. The sample number, which references the drill hole name, depth, and sample length, was written on two aluminum tags. One sample tag was stapled to the sample bag and an additional sample tag was placed within the bag. The sample tag that was affixed to the outside of the sample bag also contained the sample date and the sampler's initials.
Once sampled, the remaining half core splits were returned to the core box and archived onsite.
11.1.1 Gamma Logging
All drill holes completed by EFR at the Project were logged with a Mount Sopris gamma logging unit employing a natural gamma probe. The probe measures natural gamma radiation using one 0.5-inch by 1.5-inch sodium iodide (NaI) crystal assembly. Normally, accurate concentrations can be measured in uranium grades ranging from less than 0.1% to as high as 5% U3O8. Data are logged at a speed of 15 ft to 20 ft per minute down hole and 15 ft to 20 ft per minute up hole, typically in open holes. Occasionally, unstable holes are logged through the drill pipe and the grades are adjusted for the material type and wall thickness of the pipe used.
The radiometric or gamma probe measures gamma radiation which is emitted during the natural Radioactive decay of uranium (U) and variations in the natural radioactivity originating from changes in concentrations of the trace element thorium (Th) as well as changes in concentration of the major rock forming element potassium (K).
Potassium decays into two stable isotopes (argon and calcium) which are no longer radioactive and emits gamma rays with energies of 1.46 mega electron-volts (MeV). Uranium and thorium, however, decay into daughter products which are unstable (i.e., radioactive). The decay of uranium forms a series of about a dozen radioactive elements in nature that finally decay to a stable isotope of lead. The decay of thorium forms a similar series of radioelements. As each radioelement in the series decays, it is accompanied by emissions of alpha or beta particles, or gamma rays. The gamma rays have specific energies associated with the decaying radionuclide. The most prominent of the gamma rays in the uranium series originate from decay of 214Bi (bismuth 214), and in the thorium series from decay of 208Tl (thallium 208).
The natural gamma measurement is made when a detector emits a pulse of light when struck by a gamma ray. This pulse of light is amplified by a photomultiplier tube, which outputs a current pulse that is accumulated and reported as counts per second (cps). The gamma probe is lowered to the bottom of a drill hole, and data are recorded as the tool travels to the bottom and then is pulled back up to the surface. The current pulse is carried up a conductive cable and processed by a logging system computer that stores the raw gamma cps data.
The basis of the indirect uranium grade calculation (referred to as "eU3O8" for "equivalent U3O8") is the sensitivity of the detector used in the probe, which is the ratio of cps to known uranium grade and is referred to as the probe calibration factor. Each detector's sensitivity is measured when it is first manufactured and is also periodically checked throughout the operating life of each probe against a known set of standard "test pits," with various known grades of uranium mineralization, or through empirical calculations. Application of the calibration factor, along with other probe correction factors, allows for immediate grade estimation in the field as each drill hole is logged.
Downhole total gamma data are subjected to a complex set of mathematical equations, considering the specific parameters of the probe used, speed of logging, size of bore hole, drilling fluids, and presence or absence of any type of drill hole casing. The result is an indirect measurement of uranium content within the sphere of measurement of the gamma detector.
An EFR in-house computer program known as GAMLOG converts the measured cps of the gamma rays into 0.5 ft increments of equivalent percent U3O8 (%eU3O8). GAMLOG is based on the Scott's Algorithm developed by James Scott of the Atomic Energy Commission (AEC) in 1962 (Scott, 1962) and is widely used in the industry.
The conversion coefficients for conversion of probe cps to percent equivalent uranium grades are based on the calibration results obtained at the United States Department of Energy Uranium Calibration Pits in Grand Junction, Colorado, USA.
In those holes associated with copper mineralization or where EFR personnel reported that the probe underestimated U3O8 grades above 2% due to saturation of the probe's sodium iodide crystal, (a normal occurrence associated with gamma logging for uranium), EFR used chemical assay for both copper and uranium. Where there was lower grade uranium and areas of low-grade copper mineralization, radiometric data was used in lieu of chemical assays.
11.1.1.1 Calibration
For the gamma probes to report accurate %eU3O8 values the gamma probes must be calibrated regularly. The probes are calibrated by running the probes in test pits maintained historically by the AEC and currently by the DOE. There are test pits in Grand Junction, Colorado, Grants, New Mexico, and Casper, Wyoming. The test pits have known %U3O8 values, which are measured by the probes. A dead time (DT) and K-factor can be calculated based on running the probes in the test pits. These values are necessary to convert CPS to %eU3O8. The dead time accounts for the size of the hole and the decay that occurs in the space between the probe and the wall rock. DT is measured in microseconds (μsec). The K-factor is simply a calibration coefficient used to convert the DT-corrected CPS to %eU3O8.
Quarterly or semi-annual calibration is usually sufficient. Calibration should be done more frequently if variations in data are observed or the probe is damaged.
11.1.1.2 Method
Following the completion of a rotary hole, a geophysical logging truck will be positioned over the open hole and a probe will be lowered to the hole's total depth. Typically, these probes take multiple different readings. In uranium deposits, the holes are usually logged for gamma, resistivity, standard potential, and hole deviation. Only gamma is used in the grade calculation. Once the probe is at the bottom of the hole, the probe begins recording as the probe is raised. The quality of the data is impacted by the speed the probe is removed from the hole. Experience shows a speed of 20 feet per minute is adequate to obtain data for resource modeling. Data is recorded in CPS, which is a measurement of uranium decay of uranium daughter products, specifically Bismuth-24. That data is then processed using the calibration factors to calculate a eU3O8 grade. Historically, eU3O8 grades were calculated using the AEC half amplitude method, which gives a grade over a thickness. Currently, the eU3O8 grades tend to be calculated on 0.5-foot intervals by software. Depending on the manufacturer of the probe truck and instrumentation, different methods are used to calculate the eU3O8 grade, but all, including the AEC method, are based on the two equations given below.
The first equation converts CPS to CPS corrected for the dead time (DT) determined as part of the calibration process

The second equation converts the Dead Time Corrected CPS (N) to %eU3O8 utilizing the K-factor (K)

Depending on the drilling and logging environment, additional multipliers can be added to correct for various environmental factors. Typically, these include a water factor for drill hole mud, a pipe factor if the logging is done in the drill steel, and a disequilibrium factor if the deposit is known to be in disequilibrium. Tables for water and pipe factors are readily available.
11.1.2 Core Sampling
11.1.2.1 Sample Preparation
Samples were delivered by a staff geologist to the White Mesa Mill in Blanding, Utah, for uranium and copper assaying. The White Mesa Mill Laboratory holds no certifications and no accreditations.
Upon delivery of the samples to White Mesa Mill, samples were weighed, dried for 16 to 24 hrs, and weighed again to determine the moisture content. The samples were crushed using a Bico Jaw Crusher and Metso Minerals cone crusher and split using a riffle splitter before pulverization using a ring and puck pulverizer. The crushers, splitters, and pulverisers are cleaned between uses with abrasive sand.
11.1.2.2 Assaying and Analytical Procedure
A split of the pulverized sample was digested in the laboratory in a combination of nitric, perchloric, and hydrofluoric acid, diluted, and analyzed. Determination of uranium content in the sample was performed by a spectrophotometric analysis using the Thermo Scientific Biomate 3 Spectrophotometer. Other analyses were performed either on the Perkin Elmer Optima 5300V ICP-OES or the Perkin Elmer ELAN DRC II ICP-MS. Calibrations were performed daily on these instruments, and every four in 100 analyses were spiked with a standard solution after analysis to ensure consistency of results.
11.1.3 Radiometric Equilibrium
Disequilibrium in uranium deposits is the difference between equivalent (eU3O8) grades and assayed U3O8 grades. Disequilibrium can be either positive, where the assayed grade is greater than the equivalent grades, or negative, where the assayed grade is less than the equivalent grade. A uranium deposit is in equilibrium when the daughter products of uranium decay accurately represent the uranium present. Equilibrium occurs after the uranium is deposited and has not been added to or removed by fluids after approximately one million years. Disequilibrium is determined during drilling when a piece of core is taken and measured by two different methods, a counting method (closed-can) and chemical assay. If a positive or negative disequilibrium is determined, a disequilibrium factor can be applied to eU3O8 grades to account for this issue.
A comparison of chemical data vs probe data showed that no disequilibrium factor is needed for the Project.
11.2 Sample Security
Bagged samples were placed in barrels, which were secured in the back of a truck for transport and delivered by EFR personnel to the laboratory at White Mesa Mill for analytical testing. White Mesa Mill personnel were responsible for shipping check samples to various third-party laboratories. A chain of custody form was maintained at all times.
Following analysis, dried, crushed samples were stored in sealed, plastic bottles for long-term storage. Pulverized samples were also stored in sealed, plastic bottles. All samples are stored out of the elements to ensure stored sample quality.
The laboratory at White Mesa Mill uses a combination of digital exports from the instrument's computer and hand entry from logbooks to maintain a master spreadsheet, which calculates grade based on the various inputs. Certificates of analysis were provided to EFR personnel in secured Adobe Acrobat and Microsoft Excel format.
EFR believes the sample preparation, security, and analytical procedures are acceptable for the purposes of a Mineral Resource estimate and meet industry standards.
11.3 Quality Assurance and Quality Control
Quality assurance (QA) consists of evidence to demonstrate that the assay data has precision and accuracy within generally accepted limits for the sampling and analytical method(s) used in order to have confidence in the assay data used in a resource estimate. Quality control (QC) consists of procedures used to ensure that an adequate level of quality is maintained in the process of collecting, preparing, and assaying the exploration drilling samples. In general, QA/QC programs are designed to prevent or detect contamination and allow assaying (analytical), precision (repeatability), and accuracy to be quantified. In addition, a QA/QC program can disclose the overall sampling-assaying variability of the sampling method itself.
QA/QC samples, including duplicates, blanks, certified reference materials (CRMs or standards), and checks, were submitted by the onsite team at the Project, EFR's office located in Lakewood, Colorado, and the White Mesa Mill laboratory. The submission rate and responsible party of each sample type is listed in Table 11-1.
Table 11-1: QA/QC Samples for the Pinyon Plain Project Drilling
Energy Fuels Inc. - Pinyon Plain Project
Sample Type | Responsible Party | Collection Method | Rate of Insertion |
Duplicates | Field | Field Geologist | ¼ core | 1 in 100 |
Coarse | WMM2 Lab personnel | Second split of crushed sample | 2 in 100 |
Pulp | WMM Lab personnel | Second split of pulverized sample | 2 in 100 |
CRM1 | | Lakewood Office | Shipped directly to lab | 4 in 100 |
Blank | Coarse | Lakewood Office | Shipped directly to lab | 2 in 100 |
Pulp | Lakewood Office | Shipped directly to lab | 2 in 100 |
Check Assay | | WMM Lab personnel | Split of reject sample | 4 in 100 |
CRM1 with Check Assay | | WMM Lab personnel | | 10 in 100 |
Bulk Density | | WMM Lab personnel | Core samples | As Available |
Notes:
1. CRM = Certified Reference Material
2. WMM = White Mesa Mill
CRMs and fine blanks were shuffled (random sequence applied), numbered, and catalogued in the Lakewood, Colorado, office by EFR technical personnel prior to shipment to the White Mesa Mill laboratory manager. These samples (blind to the White Mesa Mill manager, laboratory manager, and laboratory personnel) were inserted into the sample stream by the laboratory manager. The coarse blanks were not blind to the White Mesa Mill laboratory manager.
Check assays were performed by three independent laboratories (Section 11.3.4) and were submitted by White Mesa Mill personnel. Drilling and assaying were performed in 2016 and 2017; however, all assay results were received by Project personnel in 2017. Table 11-2 outlines the number of submitted QA/QC samples and the portion of the total database they comprise.
Results of the QA/QC program were compiled in a series of Microsoft Excel tables and charts on a regular basis as the program progressed and were distributed to the project and laboratory personnel. QA/QC trends were discussed as the program progressed and action was taken to correct issues.
Table 11-2: Summary of QA/QC Submittals
Energy Fuels Inc. - Pinyon Plain Project
Sample Type | Count | Percentage of Assay Samples |
Drill holes | 130 | - |
Assay Samples | 3,413 | - |
Probe Samples | 97,994 | - |
Probe / Assay Duplicates | 563 | 16% |
Coarse Blanks | 63 | 2% |
Fine Blanks | 63 | 2% |
Copper CRMs | 125 | 4% |
Field Duplicates | 36 | 1% |
Coarse Duplicates | 62 | 2% |
Pulp Duplicates | 69 | 2% |
Check Assays | 114 | 3% |
Total QA/QC Samples | 532 | 16% |
11.3.1 Blanks
The regular submission of blank material is used to assess contamination during sample preparation and to identify sample numbering errors. EFR submitted blank samples at an insertion rate of one in 50 at both the coarse and fine preparation stages. The coarse blank sample is a granite matrix sourced from ASL and certified as barren for both copper and uranium, and the fine blank material was purchased from Ore Research and Exploration (reference material OREAS 24b). OREAS 24b has certified values of 0.0038% Cu and 0.000174% U. The SLR QP reviewed the results of the blank samples submitted alongside drill core and tabulated the number of failures for both coarse and fine blanks. A blank sample was considered to have failed if the assay returned a copper or uranium value more than ten times the detection limit for the assay method. No failures were reported for the coarse or fine blank samples, as presented in Figure 11-1.
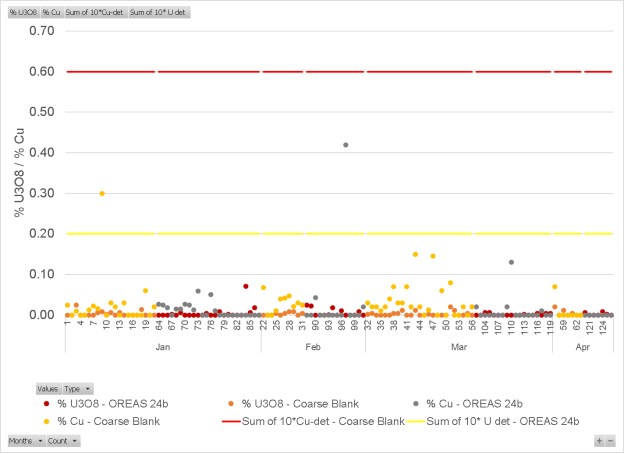
Figure 11-1: Results of Blank Samples
11.3.2 Certified Reference Material
Results of the regular submission of CRMS (standards) are used to identify problems with specific sample batches and biases associated with the primary assay laboratory. Three different copper CRMs were submitted into the sample stream at White Mesa Mill, representing low, medium, and high grade copper material for an insertion rate of one in 25. The matrix of the material, expected value, and tolerance limits are listed in Table 11-3. The CRMs were assayed using a 4-acid digest or aqua regia technique with inductively coupled plasma (ICP) or atomic absorption (AA) finish.
Table 11-3: Expected Values and Ranges of Copper CRM
Energy Fuels Inc. - Pinyon Plain Project
CRM | Cert. Date | Matrix | Expected Value
(%) | Tolerance 2 S.D.
(%) |
CDN-CM-41 | 2016 | Minto Mine: Hypogene Cu
Sulfide hosted in Granodiorite | 1.71 | 0.05 |
CDN-ME-1410 | 2014 | High Sulfide VMS | 3.80 | 0.17 |
OREAS 1131 | 2009 | Tritton Cu Project: Chalcopyrite
Breccia Ore | 13.5 | 0.8 |
Notes:
1. Certified tolerance is a 95% confidence interval from 13.3% to 13.8% Cu.
No U3O8 specific CRMs were sent to White Mesa Mill. As part of the mill's daily protocol for running samples, the equipment was calibrated daily using U3O8 CRM 129-A, sourced from the New Brunswick Laboratory at the U.S. Department of Energy. The SLR QP recommends sourcing three matrix-matched or matrix-similar CRMs for U3O8, representing low, medium, and high grades at the Project, and incorporating them into the sample stream sent to White Mesa Mill at a rate of one in 25.
The SLR QP calculated failure rates of each copper CRM, prepared contact plots, and looked at temporal trends of the CRMs. Failure rates, defined as a copper value reporting more than three standard deviations (SD) from the expected value, or two consecutive copper values reporting more than two SD from the expected values were tabulated, and are presented in Table 11-4. All CRMs assayed at White Mesa Mill displayed a low bias relative to the expected copper value, as well as a positive temporal trend, and a high failure rate. Control plots of each CRM are presented in Figure 11-2 and a graph of the average copper value by date for each CRM is shown in Figure 11-3. Two of the CRMs, CDN-CM-41 and CDN-ME-1410, are made of a material unlike the material at the Project.
The SLR QP recommends that EFR continue to monitor for low-grade bias of copper and slight low-grade bias of U3O8 at the White Mesa Mill laboratory and continue to monitor for temporal trends (change in average grade of CRM data over time) observed at White Mesa Mill laboratory. The SLR QP also recommends EFR procure CRM made from the Project resource material (matrix matched), to obtain an improved understanding of laboratory performance as applied to Project samples; source three matrix-matched or matrix-similar CRMs for U3O8 that represent low, medium, and high grade ore at the Project; incorporate the CRMs in the sample stream sent to White Mesa Mill at a rate of one in 25 and ensure the certified values of these CRMs are blind to the laboratory. In addition, submit these CRMs to independent laboratories with check assays at a rate of one in 10 to obtain a meaningful sample size for analysis.
Table 11-4: Summary of CRM Performance
Energy Fuels Inc. - Pinyon Plain Project
CRM | Expected Value
(%Cu) | Submittals | Failures | Percentage of
Failures |
CDN-CM-41 | 1.71 | 39 | 31 | 79% |
CDN-ME-1410 | 3.80 | 49 | 25 | 51% |
OREAS 113 | 13.5 | 37 | 20 | 54% |
Total | | 125 | 76 | 61% |

Figure 11-2: Control Charts of Copper CRM

Figure 11-3: Average Copper Grade of CRM Over Time
11.3.3 Duplicates
Duplicate samples help to monitor preparation and assay precision and grade variability as a function of sample homogeneity and laboratory error. The field duplicate includes the natural variability of the original core sample, as well as levels of error at various stages, including core splitting, sample size reduction in the preparatory laboratory, sub-sampling of the pulverized sample, and the analytical error. Coarse reject and pulp duplicates provide a measure of the sample homogeneity at different stages of the preparation process (crushing and pulverizing).
Field duplicate samples were collected by the onsite geologist and submitted to the laboratory as separate samples, adjacent in the sample stream and clearly marked as such. A total of 1% of the drill hole samples have been duplicated by splitting the half core sample into two quarter core samples. The duplicate protocol and procedure for collecting, submitting, and analyzing coarse and pulp duplicate assays is carried out by the White Mesa Mill. A total of 2% of the drill hole samples were resubmitted at the coarse and pulp assay preparation stages for comparison.
Results for both coarse and pulp sample pairs show excellent correlation (Table 11-5) with very good repeatability for both copper and uranium. Of the field, coarse, and pulp duplicate sample sets, however, less than 20% of each of the submitted sample types report grades above the cut-off grade of 0.29% U3O8 and less than 10% are above the expected average grade of 1% U3O8.
Over half of the field duplicates reported U3O8 values with a relative difference greater than 20%, which may be related to the uranium occurring as blebs or vug fill. Only one of the four field sample pairs within the grade range of interest, however, had a relative difference greater than 20%. Over half of the field duplicates reported copper values with a relative difference greater than 20%. Only five of the 16 sample pairs with a grade higher than 1% Cu, however, had a relative difference greater than 20%. The SLR QP recommends collecting additional field samples, in the form of ½ core, in the grade range of interest, in order to draw deeper conclusions about the nature of the material at Pinyon Plain.
The SLR QP also recommends implementing a duplicate assay protocol for field, coarse, and pulp samples that is blind to the laboratory, and recommends that the rates of insertion for duplicate samples be approximately one in 50 for field duplicates and one in 25 for coarse and pulp duplicate samples.
Table 11-5: Basic Comparative Statistics of 2017 Duplicate Assays
Energy Fuels Inc. - Pinyon Plain Project
| Field | Coarse | Pulp |
Original | Duplicate | Original | Duplicate | Original | Duplicate |
U3O8 |
Count | 36 | 36 | 62 | 62 | 69 | 69 |
Mean (%) | 0.14 | 0.13 | 0.30 | 0.31 | 1.13 | 1.12 |
Max. Value (%) | 1.45 | 1.00 | 9.71 | 9.80 | 25.90 | 25.36 |
Min. Value (%) | 0.00 | 0.00 | 0.00 | 0.00 | 0.00 | 0.00 |
Median (%) | 0.02 | 0.01 | 0.02 | 0.02 | 0.02 | 0.03 |
Variance | 0.10 | 0.06 | 1.67 | 1.73 | 19.74 | 19.03 |
Std. Dev. | 0.32 | 0.25 | 1.29 | 1.31 | 4.44 | 4.36 |
Corr. Coefficient | 0.961 | 1.000 | 1.000 |
% Diff. Btw Means | 8.5 | -2.0 | 1.3 |
Copper |
Count | 35 | 35 | 61 | 61 | 69 | 69 |
Mean (%) | 4.12 | 4.33 | 2.22 | 2.21 | 3.51 | 3.42 |
Max. Value (%) | 24.22 | 22.60 | 22.38 | 22.84 | 30.50 | 26.14 |
Min. Value (%) | 0.00 | 0.00 | 0.00 | 0.00 | 0.00 | 0.00 |
Median (%) | 0.34 | 0.44 | 0.14 | 0.12 | 0.20 | 0.20 |
Variance | 48.18 | 49.38 | 19.86 | 20.06 | 52.68 | 49.60 |
Std. Dev. | 6.94 | 7.03 | 4.46 | 4.48 | 7.26 | 7.04 |
Corr. Coefficient | 0.983 | 0.997 | 0.997 |
% Diff. Btw Means | -5.0 | 0.6 | 2.5 |
11.3.4 Check Assays
A total of 114 assays were sent for re-assay at one of three independent laboratories to ascertain if any bias is present within the primary laboratory, the White Mesa Mill laboratory:
American West Analytical Laboratories, located in Salt Lake City, Utah - Accredited by the National Environmental Laboratory Accreditation Program (NELAP) in Utah and Texas; and state accredited in Colorado, Idaho, New Mexico, Wyoming, and Missouri
Energy Laboratories, located in Casper, Wyoming - NELAP accredited Certifications USEPA: WY00002; FL-DOH NELAC: E87641; Oregon: WY200001; Utah: WY00002; Washington: C1012
Inter-Mountain Laboratory (now Pace Analytical), located in Sheridan, Wyoming - EPA, DOE, and several other accreditations (http://intermountainlabs.com/certifications.html)
The number of check assay samples sent to each laboratory is presented in Table 11-6. Because Inter-Mountain Labs (IML) is the only laboratory with a significant number of samples, and the only laboratory to include CRMs, it was chosen for comparison with the primary laboratory at White Mesa Mill. Scatter plots of the primary and independent laboratory results for U3O8 and copper are shown in Figure 11-4 and Figure 11-5, respectively.
Table 11-6: Check Assays List
Energy Fuels Inc. - Pinyon Plain Project
Laboratory | No. Check Assay Samples Sent | No. Cu CRMs Sent |
American West Analytical Labs | 10 | - |
Energy Laboratories | 5 | - |
Inter-Mountain Labs | 99 | 11 |
Total | 114 | 11 |
The results indicate a slight low bias of both copper and U3O8 results at White Mesa Mill. This finding is supported by the low bias observed in the copper CRM results from White Mesa Mill. Copper CRM results from IML are not conclusive due to the small number of samples submitted, however, the CRM results from IML were mostly slightly above the expected value, with no failures.

Notes:
1. EL = Energy Laboratories
2. IML = Inter-Mountain Labs
3. AWAL = American West Analytical Labs
Figure 11-4: Scatter Plot of Independent vs Primary Laboratory Check Assay Results for U3O8
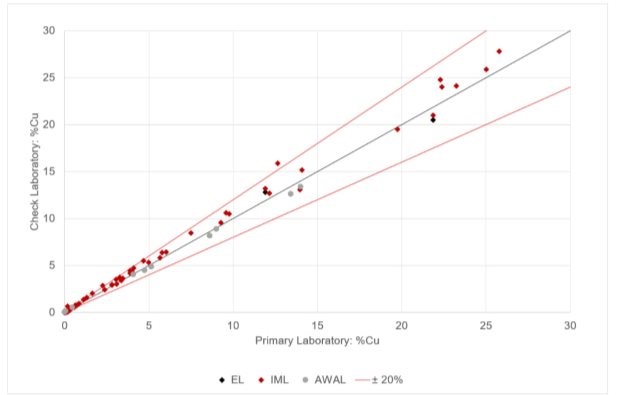
Notes:
1. EL = Energy Laboratories
2. IML = Inter-Mountain Labs
3. AWAL = American West Analytical Labs
Figure 11-5: Scatter Plot of Independent vs. Primary Laboratory Check Assay Results for Copper
11.3.5 Comparison of Probe vs. Assay Results
A total of 97,944 U3O8 0.5 ft probe samples were included in the Mineral Resource database where chemical assay data were not available. To check for disequilibrium and ensure that no bias was present between assay and probe results, EFR assayed several drill holes for which probe data were available. Drill hole intervals in the Main Zone were flagged and weighted averages were calculated for the results of each method over the interval of interest. These weighted averages were then compared using basic statistics, including scatter and quantile-quantile plots. A total of 14 sample pairs were removed that returned results above 2% U3O8, to account for probe saturation. A scatter plot of the 77 sample pair results is shown in Figure 11-6.
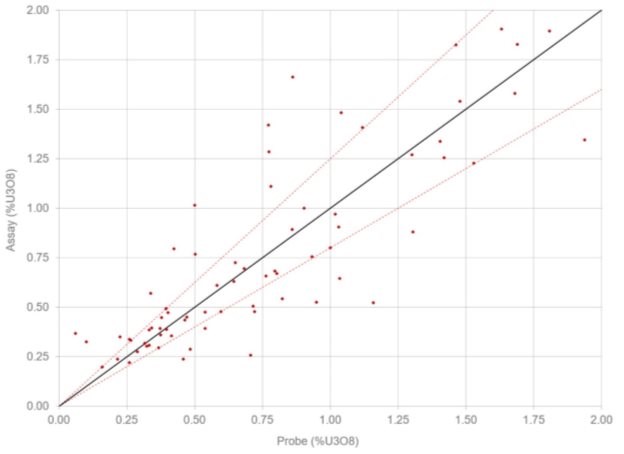
Figure 11-6: Scatter Pot of the Weighted Average of Probe and Assay U3O8 Results Over Drill hole Intercepts within the Main Zone
The results indicate good correlation between the assay and probe data, with negligible bias.
11.4 Density Analyses
Bulk densities were determined at White Mesa Mill for a majority of the samples submitted (2,630 of 3,347). A single piece of split core sample, at least four inches in length, was measured in all dimensions using calipers to calculate volume, and then weighed dry. Density was calculated using the measured volume and the mass. An additional 37, full core, six-inch samples, were submitted to White Mesa Mill to verify the caliper method. These 37 full core samples were measured with calipers to calculate volume and then weighed dry. Additionally, these samples were immersed in water to determine volume via water displacement. The densities calculated by both methods were compared. The densities calculated using the caliper method were approximately 1% greater than those calculated using water displacement on the same core samples, which is a negligible difference.
11.5 Conclusions
The SLR QP is of the opinion that the sample security, analytical procedures, and QA/QC procedures used by EFR meet industry best practices and are adequate to estimate Mineral Resources.
12.0 DATA VERIFICATION
Data verification is the process of confirming that data has been generated with proper procedures, is transcribed accurately from its original source into the project database and is suitable for use as described in this Technical Report.
As part of the resource estimation procedure, drill data is spot checked by EFR personnel and audited by the SLR QP for completeness and validity.
12.1 SLR Data Verification (2021)
The SLR QP visited the Project on November 16, 2021. Discussions were held with the EFR technical team and found them to have a strong understanding of the mineralization types and their processing characteristics, and how the analytical results are tied to the results. The SLR QP received the project data from EFR for independent review as a series of MS Excel spreadsheets and Vulcan digital files. The SLR QP used the information provided to validate the Mineral Resource interpolation, tons, grade, and classification.
12.2 Audit of Drill hole Database
The SLR QP conducted a series of verification tests on the drill hole database provided by EFR. These tests included a search for missing information and tables, unique location of drill hole collars, and overlapping sample or lithology intervals. Empty tables were limited to lithology, alteration, and geotechnical results. No database issues were identified.
12.3 Verification of Assay Table
The SLR QP compared 100% of the assay sample database for both copper and uranium to assay results in Excel format from White Mesa Mill. Several values in the database were recorded at 0% Cu or 0% U3O8. The industry standard is to record assays which return a value below detection limit at a value equal to half the detection limit. This is not expected to materially impact the Mineral Resources. No other discrepancies were found.
12.4 Limitations
There were no limitations in place restricting the ability to perform an independent verification of the Project drill hole database.
12.5 Conclusion
The SLR QP is of the opinion that database verification procedures for the Project comply with industrystandards and are adequate for the purposes of Mineral Resource estimation.
13.0 MINERAL PROCESSING AND METALLURGICAL TESTING
13.1 Metallurgical Testing
Preliminary metallurgical bench tests have been completed on samples from the Project to determine both uranium and copper metallurgical performance. Copper mineralization presents an upside to the Project, but is not considered as part of this PFS.
Test work was completed at the White Mesa Mill's metallurgical laboratory while confirmatory testing was conducted at the Australian Nuclear Science and Technology Organization (ANSTO), an independent metallurgical laboratory in New South Wales, Australia, that operates a Quality Management System which complies with the requirements ISO 9001:2015 for conduct of strategic and applied nuclear research across three themes, Nuclear Fuel Cycle, Environment, and Human Health Testing included conventional acid leaching, flotation of conventionally leached residue, and roasting pre-treatment followed by conventional acid leaching. The primary goal of the work was to determine if the existing White Mesa Mill process flow sheet would be suitable for processing the Project's mineralized material types, and if not, what process flow sheet would be appropriate while minimizing capital modifications to the White Mesa Mill circuit.
Several metallurgical testing programs have been completed on the Project's mineralized material types. The goal of these tests is to maximize uranium and copper recoveries, and to minimize changes to the White Mesa Mill circuit and any associated capital requirements, while also minimizing process operating costs and uranium deportment to the final copper product.
Two metallurgical composites were used for testing during 2016 and 2017.
The first metallurgical composite was created in October 2016 and was made from 37 core samples. White Mesa Mill laboratory testing showed the average grades for this composite were 0.81% U3O8 and 9.78% Cu. This composite was the most representative of the Main Zone of the deposit from the samples available at the time. Testing was done on this composite from October 2016 to January 2017. The preliminary conventional acid leaching test work was conducted to determine uranium and copper recoveries. Leaching conditions, including temperature, solids density, and free acid and chlorate dosages, were varied between a total of 17 tests.
Uranium recoveries were high for this test series ranging from 96.3% to 99.8%. Copper recoveries were significantly lower ranging from 18.7% to 55.5%. Sulfuric acid consumption was higher than normal for ores treated at White Mesa Mill ranging between 221 pounds per short ton (lb/ton) to 670 lb/ton. Sodium chlorate consumptions were 0 lb/ton to 164 lb/ton of feed, which is significantly higher than the normal ore range of 0 lb/ton to 30 lb/ton.
Owing to the poor copper metallurgical performance during conventional acid leaching, flotation testing of conventional leaching residue was examined. Due to the possibility of uranium deportment to the copper concentrate, it was decided to run flotation concentration tests on leached residue in order to potentially minimize uranium concentrations. Flotation of copper worked very well with rougher copper recovery at 72% with a copper concentrate grade of 33.3%. Unfortunately, uranium deportment to the concentrate exceeded normal treatment charge/refining charge (TC/RC) limits at 0.105% U3O8, making flotation an unlikely processing option.
A second (and larger) composite was made in January of 2017 and was used for testing from that point on. This composite was the most representative of the Main Zone of the deposit from the samples available at the time. The metallurgical testing composite was generated from 60 core samples representing 240 ft of half drill core (approximately 360 lb) from the Pinyon Plain deposit. A split of this composite was also sent to ANSTO in Australia for independent testing. White Mesa Mill laboratory testing showed the average grades for this composite were 0.76% U3O8 and 9.93% Cu. The primary goal of this program was to determine the metallurgical response using the conventional acid leach process currently in use at White Mesa Mill. Summary results are presented in Table 13-1 below.
As expected, uranium recoveries averaged 93.4%, ranging from a low of 68.3% to 99.8%. Copper recoveries were considerably lower, averaging 26.9% and ranging from 4% to 53.7%. Reagent consumptions using the conventional leaching averaged 900 lb/ton for sulfuric acid and 20 lb/ton for chlorate.
Table 13-1: Conventional Acid Leach Test Results
Energy Fuels Inc. - Pinyon Plain Project
Test # | Metallurgical
Recovery | Targets | Actual | Consumption
(lb/ton) |
U3O8 | Cu | Free Acid | Temp
(⁰F) | EMF | % Solids | Free
Acid | EMF | Acid | Chlorate |
1 | 98.2 | 37.6 | 85 | 85 | none | 50 | 80.9 | 385 | 224.0 | 80.0 |
2 | 98.0 | 48.6 | 80 | 80 | 500 | 50 | 76.4 | 443 | 434.0 | 128.0 |
3 | 96.8 | 50.0 | 50 | 80 | 500 | 50 | 48.5 | 457 | 361.0 | 128.0 |
4 | 94.0 | 53.7 | 20 | 80 | 500 | 50 | 18.1 | 439 | 265.0 | 144.0 |
5 | 98.0 | 46.9 | 80 | 80 | 450 | 50 | 76.9 | 438 | 420.0 | 120.0 |
6 | 99.2 | 53.3 | 80 | 80 | 500 | 33 | 85.3 | 415 | 316.0 | 80.0 |
7 | 96.7 | 35.9 | 50 | 50 | 500 | 50 | 39.7 | 658 | 280.0 | 100.0 |
8 | 96.6 | 17.0 | 50 | ambient | 500 | 50 | 51.5 | 846 | 258.0 | 80.0 |
9 | 97.0 | 33.1 | 50 | 50 | 400 | 50 | 52.4 | 396 | 309.0 | 80.0 |
10 | 95.5 | 6.8 | 50 | 50 | none | 50 | 49.5 | 409 | 228.0 | 0.0 |
11 | 96.7 | 17.2 | 50 | 50 | none | 50 | 47.0 | 416 | 246.0 | 20.0 |
12 | 80.9 | 9.2 | 50 | ambient | none | 50 | 47.5 | 401 | 228.0 | 20.0 |
13 | 80.1 | 7.8 | 80 | ambient | none | 50 | 73.0 | 398 | 291.0 | 20.0 |
14 | 99.8 | 11.9 | 50 | 60 | none | 50 | 43.1 | 366 | 220.0 | 20.0 |
15 | 97.5 | 18.4 | 50 | 60 | none | 33 | 54.9 | 366 | 362.0 | 20.0 |
16 | 97.2 | 30.6 | 50 | 60 | none | 50 | 48.5 | 386 | 276.0 | 40.0 |
17 | 96.6 | 20.7 | 20 | 50 | none | 50 | 19.1 | 357 | 154.6 | 20.0 |
18 | 97.8 | 19.0 | 20 | 80 | none | 50 | 15.2 | 325 | 147.2 | 20.0 |
19 | 82.4 | 16.6 | 50 | 60 | none | 50 | 48.0 | 318 | 209.8 | 10.0 |
20 | 68.3 | 4.0 | 50 | 60 | none | 50 | 45.6 | 278 | 180.3 | 0.0 |
Avg. | 93.4 | 26.9 | | | | | | | 270.5 | 56.5 |
Test # | Metallurgical Recovery | Targets | Actual | Consumption
(lb/ton) |
U3O8 | Cu | Free Acid | Temp
(⁰F) | EMF | % Solids | Free
Acid | EMF | Acid | Chlorate |
Max. | 99.8 | 53.7 | | | | | | | 434.0 | 144.0 |
Min. | 68.3 | 4.0 | | | | | | | 147.2 | 0.0 |
Due to low copper recoveries, a series of tests were run to determine the effect of a roasting pre-treatment. Roasting temperatures were varied between 450°C and 650°C. As shown in Table 13-2, roasting improved recoveries for both uranium and copper, averaging 86% and 87.6% respectively. Using the optimum roasting temperature of 650°C, recoveries averaged 91.6% for uranium and 94.9% for copper. Reagent consumptions on the roasted material averaged 250 lb/ton for sulfuric acid and 15 lb/ton chlorate using temperatures of 650°C for the roasting phase and 50°C for the leaching phase.
Table 13-2: Roasted Acid Test Results
Energy Fuels Inc. - Pinyon Plain Project
Test # | Roasting | Metallurgical Recovery | Targets | Actual | Consumption
(lb/ton) |
Temp
(⁰F) | Time | U3O8 | Cu | Free
Acid | Temp
(⁰F) | EMF | % Solids | Free
Acid | EMF | Acid | Chlorate |
2 | 450 | 45 | 78.8 | 85.2 | 80 | 60 | none | 4 | 76.9 | 379.0 | 5500 | 0 |
3 | 550 | 45 | 98.7 | 98.4 | 80 | 60 | none | 4 | 78.4 | 550.0 | 5500 | 0 |
4 | 650 | 45 | 99.2 | 92.2 | 80 | 60 | none | 4 | 78.4 | 603.0 | 5500 | 0 |
5 | 550 | 45 | 60.9 | 63.3 | 80 | 60 | none | 4 | 67.1 | 337.0 | 4600 | 0 |
7 | 550 | 45 | 95.4 | 87.3 | 80 | 60 | none | 4 | 59.8 | 536.0 | 4600 | 20 |
8 | 550 | 90 | 93.3 | 86.0 | 80 | 60 | none | 4 | 60.3 | 534.0 | 4600 | 20 |
9 | 550 | 45 | 85.3 | 81.8 | 80 | 80 | none | 4 | 72.0 | 349.0 | 4875 | 20 |
10 | 550 | 120 | 63.6 | 73.9 | 80 | 80 | none | 15 | 81.8 | 336.0 | 4325 | 0 |
11 | 650 | 120 | 94.7 | 96.0 | 80 | 80 | none | 15 | 75.5 | 432.0 | 4325 | 0 |
12 | 650 | 20 | 81.3 | 76.0 | 80 | 80 | none | 15 | 78.0 | 341.0 | 1195 | 0 |
13 | 650 | 40 | 89.3 | 87.4 | 80 | 80 | none | 15 | 80.9 | 382.0 | 1195 | 0 |
14 | 650 | 60 | 94.9 | 91.9 | 80 | 80 | none | 15 | 77.9 | 417.0 | 1195 | 0 |
15 | 650 | 60 | 76.4 | 88.4 | 20 | 20 | none | 15 | 24.0 | 322.0 | 460 | 0 |
16 | 650 | 60 | 82.8 | 92.0 | 50 | 50 | none | 15 | 49.9 | 400.0 | 775 | 0 |
17 | 650 | 60 | 82.6 | 92.6 | 20 | 80 | none | 15 | 20.6 | 405.0 | 506 | 0 |
18 | 650 | 60 | 84.0 | 90.3 | 80 | 20 | none | 15 | 76.0 | 354.0 | 1150 | 0 |
19 | 650 | 60 | 95.9 | 97.3 | 80 | 80 | none | 15 | 85.0 | 433.0 | 1380 | 0 |
20 | 650 | 60 | 99.1 | 92.2 | 20 | 50 | none | 15 | 17.6 | 555.0 | 450 | 10 |
Test # | Roasting | Metallurgical
Recovery | Targets | Actual | Consumption
(lb/ton) |
Temp
(⁰F) | Time | U3O8 | Cu | Free
Acid | Temp
(⁰F) | EMF | % Solids | Free
Acid | EMF | Acid | Chlorate |
21 | 650 | 60 | 30.6 | 90.9 | 30 | 50 | none | 40 | 30.9 | 412.0 | 318 | 10 |
22 | 650 | 60 | 79.7 | 93.3 | 80 | 80 | none | 40 | 83.3 | 396.0 | 580 | 0 |
23 | 650 | 60 | 97.8 | 95.4 | none | 80 | none | 33 | 41.7 | 458.0 | 479 | 10 |
24 | 650 | 60 | 95.8 | 93.4 | none | 80 | none | 33 | 26.0 | 426.0 | 350 | 10 |
25 | 650 | 60 | 96.5 | 93.7 | none | 50 | none | 33 | 51.0 | 445.0 | 450 | 10 |
26 | 650 | 60 | 80.9 | 92.0 | none | 50 | none | 20 | 26.5 | 400.0 | 450 | 10 |
27 | 650 | 60 | 86.6 | 94.5 | none | 50 | none | 20 | 22.4 | 405.0 | 450 | 10 |
28 | 650 | 60 | 97.1 | 96.3 | none | 50 | none | 20 | 31.9 | 642.0 | 450 | 20 |
29 | 650 | 60 | 97.2 | 96.7 | none | 50 | none | 20 | 28.9 | 654.0 | 450 | 20 |
30 | 440 | 60 | 68.4 | 26.2 | none | 80 | none | 33 | 45.6 | 325.0 | 350 | 10 |
31 | 606 | 60 | 93.4 | 84.6 | none | 80 | none | 33 | 25.5 | 395.0 | 350 | 10 |
32 | 770 | 60 | 89.7 | 88.2 | none | 80 | none | 33 | 15.2 | 631.0 | 350 | 10 |
Avg. | | | 86.0 | 87.6 | | | | | | | 1992.2 | 6.5 |
Max. | | | 99.2 | 98.4 | | | | | | | 5500.0 | 20 |
Min. | | | 30.6 | 26.2 | | | | | | | 317.5 | 0 |
Two different metallurgical testing programs have been completed at ANSTO's facilities in Australia. These series of tests were conducted on the second bulk composite generated at White Mesa Mill and coincide with the White Mesa Mill's program from January 2017. Pertinent test work focused on conventional acid leaching (one test) and roasting pre-treatment followed by acid leaching (six tests). Comparisons between the White Mesa Mill and ANSTO test work results are presented in Figure 13-1 and Figure 13-2 for conventional leaching and roasting pre-treatment respectively. Results from the White Mesa Mill laboratory are in red and results from the ANSTO laboratory are blue. It should be noted that the results presented incorporate the entire data set and no outliers were culled.

Figure 13-1: Laboratory Comparison - Conventional Leaching

Figure 13-2: Laboratory Comparison - Roasting Pre-Treatment and Leaching
In 2018 Hazen Research Inc. (Hazen) in Golden, Colorado conducted bench- and pilot-scale programs to demonstrate copper extraction from ore at the Project. Hazen Research holds certifications from various state regulatory agencies and from the US Environmental Protection Agency (EPA). And ELI is NELAP accredited with certifications USEPA: WY00002; FL-DOH NELAC: E87641; Oregon: WY200001; Utah: WY00002; Washington: C1012.
Bench-scale experiments were conducted to determine the preferred operating conditions for the pilot-scale roasting and leaching programs. Four roasting experiments were performed to evaluate two variables: temperature and excess air. Four batch, bench-scale sulfuric acid (H2SO4) leach tests of the batch calcines were conducted, using the leach conditions set by EFR, to measure roasting success. Four additional bench-scale leach tests of pilot kiln calcine and pre-roasted calcine also were conducted. The results of this work showed that uranium and copper recoveries exceeding 95% and 90%, respectively, could be expected from the Project ore evaluated in this program. Results suggested that leaching efficiency was controlled, in large part, by the degree of sulfide oxidation and that oxygen availability was a key variable in roasting.
A continuous roasting program was performed to demonstrate oxidative roasting of the Project ore and to generate calcine for subsequent pilot acid leaching. Target parameters for the pilot roast were discussed and accepted by EFR. The target parameters included a 4% to 5% oxygen concentration in the off-gas, 1-hour residence time, and 650°C burden temperature. Approximately 360 kg of ore were processed in the pilot kiln system. Roasted product (calcine) was collected continuously and sampled on an hourly basis. The product samples were assayed for acid insoluble sulfur to determine the extent of sulfide oxidation. The average sulfide oxidation from the product samples was 95%. During operations, a runaway temperature excursion occurred causing material to stick to the kiln wall. As a result, the residence time through the kiln may have been affected, as suggested by incomplete sulfide oxidation. A single batch pilot acid leach using 60 kg of pilot calcine was performed to confirm the leaching results and generate pregnant leach solution (PLS) for subsequent uranium and copper solvent extraction (SX). The conditions prescribed by EFR for the leach evaluation were 350 lb/ton H2SO4, 10 lb/ton sodium chlorate (NaClO3), 33% solids, and 80°C. The leaching time was 24 hours in a 70 gal agitated tank; kinetic samples were obtained at two hours, four hours, and eight hours. The final slurry was filtered in a filtering centrifuge and washed thoroughly. The PLS and wash were collected; washed solids were dried and analyzed. Uranium extraction from calcine was 95% and copper extraction was 90% at 24 hours. Kinetic data suggested that leaching was essentially complete for both metals at eight hours.
Before uranium SX, deionized (DI) water was added to the PLS to simulate the dilution that would occur in countercurrent washing of leach solids. An eight-stage continuous SX circuit was assembled using glass mixers and settlers. Solvent (tertiary amine extractant [Alamine 336], isodecanol, aliphatic diluent) was mixed with the PLS and separated in four countercurrent stages, followed by solvent scrubbing, two sodium carbonate (Na2CO3) strip stages for uranium recovery and concentration, and a wash stage to prepare the solvent for recycling. The circuit was operated for 30 hours and demonstrated greater than 99% uranium extraction with only about 2.5 mg/L U3O8 reporting to the raffinate (tailings stream). The uranium SX was operated as a precursor to copper SX and was not in itself a research and development effort.
The combined uranium SX raffinate solution became feed to copper SX. Components of the uranium SX circuit, after cleaning and tubing replacement, were used to assemble the copper SX, and the stage configuration was identical. The copper SX solvent was 20% LIX 984N (aldoxime-ketoxime blend) in aliphatic diluent. The stripping agent was 180 g/L H2SO4; no copper was introduced into the strip feed to ensure that the copper cathode produced in the electrowinning (EW) step would be 100% ore-sourced. The copper SX circuit was operated for 35 hours over 4 days and produced 15.8 L of pregnant strip solution at a concentration of 38.2 g/L Cu. Copper extraction during steady-state operation exceeded 96%, with raffinate copper levels of less than 0.3 g/L.
The copper SX strip product became feed to a small-scale, continuous copper EW operation. A single glass cell was assembled using a calcium-lead alloy anode and a stainless steel cathode. A small Hewlett Packard rectifier provided the power to apply a current density of 300 ampere per square foot (A/ft2) to the cathode. The operation design targeted a 3 g/L to 4 g/L reduction in copper concentration, from 38 g/L Cu to 34 g/L Cu. This reduction was achieved over 64 hours of continuous operation, and an approximately 50 g copper plate was produced. An impurity scan of the copper product by glow discharge mass spectroscopy (GDMS) conducted by Northern Analytical Laboratory, Inc. (NAL), in Londonderry, New Hampshire, showed generally low levels or an absence of the 78 impurities analyzed. Lead was present at 300 ppm, which was attributed to loss from the lead anode caused by a nonoptimized EW setup and operation; commercial EW operation should minimize or eliminate lead as a cathode impurity.
During the bench- and pilot-scale programs, Hazen was able to demonstrate that extraction of copper from the Project ore using EFR's process is technically feasible. The data collected from the bench-scale experiments were repeatable in the pilot-scale demonstration in terms of uranium and copper extractions. The results and observations from both programs elucidated potential issues for commercial scaleup, including material stickiness during roasting and the formation of uranium precipitate (metazeunerite, Cu(UO2)2(AsO4)2·8H2O) in diluted acid leach liquor.
Residual sulfide after roasting affects copper extraction as confirmed in the bench- and pilot-scale leaches. The average residual sulfide removed from the roasted products during the pilot-scale program was 95%, which resulted in a copper extraction of 90%.
During the pilot-scale roasting program, temperature excursions were experienced, likely due to the exothermic oxidation of sulfides. The temperature excursions caused the ore to become sticky, which may have affected the residence time through the kiln. There was still a considerable amount of residual sulfide on the roasted product, which suggests that material stuck on the kiln walls may have caused a decrease in the effective cross-sectional area of the kiln. At the end of the pilot roast program, the kiln was inspected and cleaned out. A total of 8 kg of material was found stuck on the kiln walls and required physical separation. Because of the short duration of the continuous roasting program, evaluating this phenomenon was not considered.
Acid leaching of calcine at the conditions established by EFR showed good uranium and copper dissolution, exceeding 90% for both metals in some experiments. Uranium appeared to leach more rapidly than copper. In one roast-leach experiment, copper extraction exceeded 90% in two hours of leaching; the batch roast conditions for this calcine sample were 650°C and double the standard airflow (six litres per minute, L/min). These and other data collected in the program confirm the relationship between sulfide oxidation and both leaching potential and leaching kinetics.
Uranium SX of the dilute acid leach PLS proceeded very well and showed excellent results; the use of tertiary amine for SX of uranium in a sulfate system is a proven and robust unit operation. The SX circuit operated well within the conditions evaluated. Hazen recommended that the formation of metazeunerite in the dilute PLS be further evaluated to determine the conditions of its precipitation, which deprives leach liquor of both uranium and copper.
Copper was successfully recovered from uranium SX raffinate by SX using LIX 984N. After circuit shakedown and adjustment of the overall extraction, the copper tenor in the raffinate was consistently less than 0.3 g/L Cu. Stripping using copper-free strong H2SO4 generated pregnant strip solution with more than 40 g/L Cu. Analysis of stripped, washed organic showed approximately 3 g/L Cu, suggesting that an additional strip stage may have been beneficial. Arsenic was notably absent at a significant concentration in the strip product; therefore, it was unavailable as a potential impurity in copper EW.
Copper EW from pregnant SX strip solution was carried out in a small glass cell using a single lead-calcium anode and single stainless steel cathode. Preoperational design resulted in achievement of the operating targets: 300 A/ft2 current density, and a nominal 3 g/L Cu bite in a single pass. A 50 g copper plate was produced, which contained minimal impurities (as shown by GDMS analysis) other than lead, a typical contaminant when using a lead anode. Because of the short duration of the copper EW operation, optimization of the system was not evaluated. Therefore, further evaluation of the copper EW process is recommended to determine how improvements to impurity levels can be made. The lead content, especially, can be significantly reduced or eliminated through EW operational changes to reduce cell turbulence.
The roast-acid leach, uranium SX, copper SX, and copper EW process designed by EFR for the Pinyon Plain deposit and modeled at bench and pilot scale by Hazen comprises a series of proven, robust unit operations. Each of these operations performed well in the test work. Minor idiosyncrasies in some experimental work discussed in individual report sections herein may point to potential process optimization paths, however, the overall process showed strong competency to recover and concentrate the uranium and copper values. A summary of uranium and copper recoveries from each unit operation is provided in Table 13-3.
Table 13-3: Summary of Uranium and Copper Recoveries (Hazen)
Energy Fuels Inc. - Pinyon Plain Project
Unit of Operation | Metallurgical Recovery (%) |
U | Cu |
Pilot Leach | 95 | 90 |
Uranium SX | 100 | N/A |
Copper SX | N/A | 95 |
Copper EW | N/A | 100 |
Overall Calculated Recoveries | 95 | 86 |
Notes:
1. N/A = not applicable
2. Recoveries are calculated from the inputs and outputs of individual unit operations.
To economically produce copper cathode, the copper cathode grade will need to be considered when scaling to a commercial capacity. Based on the GDMS results from NAL, certain impurities may need to be further evaluated for refinement depending on market criteria.
13.2 Opinion of Adequacy
Copper test work indicates the best scenario to process the metal is using roasting, followed by acid leach and solvent extraction. Acid leach followed by solvent extraction is the current process used for uranium recovery. Following solvent extraction, a saleable copper product could be produced by electrowinning. To recover copper from the Pinyon Plain mineralized material, some modifications to White Mesa Mill process circuits would be required. The copper modifications would be expected to include the existing vanadium solvent extraction circuit for copper extraction, the addition of a roaster to improve copper recovery, and the addition of an electrowinning circuit. Bench and pilot scale test work done by HAZEN in 2018 indicates that acid leaching after roasting pre-treatment would result in satisfactory copper and uranium recoveries.
The metallurgical test results provided by the White Mesa Mill, ANSTO, and Hazen indicate that metallurgical recoveries using optimum roasting and leach conditions are expected to be approximately 96% for uranium and 86 to 90% for copper.
The metallurgical composites that were used for metallurgical testing are representative of the various types and styles of copper and uranium mineralization for the Main Zone. The average U3O8 grades for these two test composites were close to the average grade of the U3O8 presented as a resource in this Technical Report.
There are no known processing factors or deleterious elements that could have a significant effect on potential economic extraction.
The White Mesa Mill has a significant operating history using the uranium SX circuit, which has included milling relatively high grade copper ores with no detrimental impact to the uranium recovery or product grade. Expected White Mesa Mill modifications to recover copper include utilizing the existing vanadium solvent extraction circuit for copper and the addition of an EW circuit. Carry over of uranium to the copper electrolyte is not expected and will be verified by future laboratory test work.
The SLR QP supports the conclusions of the expected performance of the metallurgical processes based on test work data from the White Mesa Mill, ANSTO, and Hazen, in addition to historical operating data from White Mesa Mill. In the SLR QP's opinion, the metallurgical test work is adequate for the purposes of Mineral Resource estimation.
14.0 MINERAL RESOURCE ESTIMATE
14.1 Summary
Mineral Resources have been classified in accordance with the definitions for Mineral Resources in S-K 1300, which are consistent with Canadian Institute of Mining, Metallurgy and Petroleum (CIM) Definition Standards for Mineral Resources and Mineral Reserves dated May 10, 2014 (CIM, 2014) definitions which are incorporated by reference in NI 43-101.
The SLR QP has reviewed and accepted the Mineral Resource estimate prepared by EFR based on block models constrained with 3D wireframes on the principal mineralized domains. Mineralized values for U3O8 and copper values were interpolated into blocks using inverse distance squared (ID2) or ordinary kriging (OK).
A geologic and resource model of the breccia pipe host was constructed based on drill logs. Mineralization wireframes for U3O8 were based on assays at a nominal cut-off grade of 0.15%. Low and high grade copper wireframes were based on nominal cut-off grades of 1% and 8%, respectively.
The previously reported Mineral Resources estimate with an effective date of December 31, 2021 (SLR, 2022) disclosed both uranium and copper Mineral Resources in the Main and Main-Lower zones and uranium only Mineral Resource in the Juniper Zone. Copper processing adds significantly higher milling costs and thus a higher equivalent uranium cut-off grade was used to report resources at the Main-Lower and Juniper zones. EFR has not included copper in the Mineral Reserve estimate but recognizes that a copper circuit could be added to the mill in the future. As a result, uranium and copper mineralization are reported separately in this updated Mineral Resource. In addition, the following are important changes in the reporting of Mineral Resources:
• All previously reported uranium Mineral Resources in the Main Zone have been converted into Mineral Reserves (Section 15) based on designed mine stopes.
• In 2022, EFR moved from a General Aquifer Protection Permit to an Individual Aquifer Protection Permit with ADEQ. In an effort to protect the perched aquifer in the Coconino sandstone, ADEQ requested and EFR agreed to limit mining between the elevations of 5,340 ft and 4,508 ft. As a result, this updated Mineral Resource report excludes previously reported uranium mineralization from the Cap and Upper zones.
Table 14-1 summarizes the uranium Mineral Resource estimate based on a $65/lb uranium price at an equivalent uranium cut-off grade of 0.30% U3O8 for the Main-Lower and Juniper zones with an effective date of December 31, 2022. The Mineral Resource is in situ. The Resources stated in this Technical Report supersede any previous Mineral Resources reported for the Project.
Table 14-1: Summary of Attributable Uranium Mineral Resources - Effective Date December 31, 2022
Energy Fuels Inc. - Pinyon Plain Project
Classification | Zone | Cut-Off
Grade | Tonnage | Grade | Contained
Metal | Metallurgical
Recovery
U3O8 |
(% U3O8) | (tons) | (% eU3O8) | (lb U3O8) | (%) |
Indicated | Juniper I | 0.3 | 37,000 | 0.95 | 703,000 | 96 |
Total Indicated | | | 37,000 | 0.95 | 703,000 | 96 |
Inferred | Main-Lower | 0.3 | 2,000 | 0.48 | 16,000 | 96 |
Juniper I | 0.3 | 2,000 | 0.58 | 24,000 | 96 |
Juniper II | 0.3 | 1,000 | 0.36 | 8,000 | 96 |
Total Inferred | | | 5,000 | 0.50 | 48,000 | 96 |
Notes:
1. SEC S-K-1300 definitions were followed for all Mineral Resource categories. These definitions are also consistent with CIM (2014) definitions in NI 43-101.
2. Mineral Resources are estimated at 0.30% U3O8 with estimated recoveries of 96% for uranium.
3. Mineral Resources are estimated using a long-term uranium price of US$65 per pound.
4. No minimum mining width was used in determining Mineral Resources.
5. Bulk density is 0.082 ton/ft3 (12.2 ft3/ton or 2.63 t/m3).
6. Mineral Resources are exclusive of Mineral Reserves and do not have demonstrated economic viability.
7. Numbers may not add due to rounding.
8. Mineral Resources are 100% attributable to EFR and are in situ.
There are no permitting constraints to EFR for processing the copper at the mill, and previous test studies conducted by Hazen (Price and Schwartz, 2018) shows that it is possible to process it. Depending on future copper price conditions, EFR may determine that it is economically beneficial to process the copper or may evaluate alternatively reprocessing it out of tails. It is also possible that additional development drilling in the Juniper Zone, expected to be completed in 2023, may encounter additional copper mineralization, making the process more economically viable.
Further study is required to determine if the copper associated with uranium mineralization in the reserve stopes may eventually be processed and add value to the project.
Table 14-2 lists the current estimated copper mineralization associated with the Main and Main-Lower zone resources at Pinyon Plain at a cut-off grade of 0.4% equivalent U3O8 due to higher processing costs for copper. Initial preliminary studies indicate that the copper does have reasonable prospects for economic extraction, however, at this time the Company's focus is on the uranium only.
Table 14-2: Summary of Attributable Copper Mineral Resources - Effective Date December 31, 2022
Energy Fuels Inc. - Pinyon Plain Project
Classification | Zone | Cut-Off
Grade | Tonnage | Grade | Contained
Metal | Metallurgical
Recovery Cu |
(% U3O8 Eq) | (tons) | (% Cu) | (lb Cu) | (%) |
Measured | Main | 0.4 | 6,000 | 9.6 | 1,155,000 | 90 |
Indicated | Main | 0.4 | 90,000 | 5.9 | 10,553,000 | 90 |
Total Measured + Indicated | | | 96,000 | 6.1 | 11,708,000 | 90 |
Inferred | Main-Lower | 0.4 | 4,000 | 6.5 | 470,000 | 90 |
Notes:
1. SEC S-K-1300 definitions were followed for all Mineral Resource categories. These definitions are also consistent with CIM (2014) definitions in NI 43-101.
2. For the Main and Main-Lower zones of the Pinyon Plain Project, a 0.40% uranium equivalent cut-off grade (% U3O8 Eq) was applied to account for both the copper and uranium mineralization. The %U3O8 Eq grade term is not the same as the eU3O8 % grade term which indicates probe rather than assay data listed elsewhere in this report.
3. Mineral Resources are estimated using a long-term uranium price of $65 per pound and a copper price of $4.00 per lb.
4. A copper to U3O8 conversion factor of 18.19 was used for converting copper grades to equivalent U3O8 grades (U3O8 Eq) for cut-off grade evaluation and reporting.
5. For the Pinyon Plain Project, Mineral Resource tonnages of uranium and copper cannot be added as they overlap in the Main and Main-Lower zones.
6. No minimum mining width was used in determining Mineral Resources.
7. Bulk density is 0.082 ton/ft3 (12.2 ft3/ton or 2.63 t/m3).
8. Mineral Resources are exclusive of Mineral Reserves and do not have demonstrated economic viability.
9. Numbers may not add due to rounding.
10. Mineral Resources are 100% attributable to EFR and are in situ.
The SLR QP is of the opinion that with consideration of the recommendations summarized in Section 1 and Section 26, any issues relating to all relevant technical and economic factors likely to influence the prospect of economic extraction can be resolved with further work.
The SLR QP is of the opinion that there are no other known environmental, permitting, legal, social, or other factors that would affect the development of the Mineral Resources.
While the estimate of uranium and copper Mineral Resources is based on the SLR QP's judgment that there are reasonable prospects for economic extraction, no assurance can be given that Mineral Resources will eventually convert to Mineral Reserves.
14.2 Resource Database
As of the effective date of this report, EFR and its predecessors have completed 150 holes (45 surface and 105 underground) totalling 92,724 ft from 1978 to 2017. No drilling was conducted on the Project from 1994 to 2016. In 2016 and 2017, EFR completed 105 underground drill holes totalling 30,314 ft at the Project. For this Resource estimate, all holes drilled from underground and 25 of the 45 surface holes were used in the modeling of mineralization. Twenty surface holes were excluded because they are located outside the pipe and contain no mineralization.
The Project resource database, dated June 17, 2017, includes drilling results from 1978 to 2017 and includes surveyed drill hole collar locations (including dip and azimuth), assay, radiometric probe, and lithology data from 130 diamond drill holes totalling 79,775 ft of drilling.
The resource dataset for the Main Zone is primarily based on assay data, supported by probe composites where assay data was not available. This practice is unique for Arizona Strip District uranium deposits, where standard practice is to use only probe assay data. The use of chemical assays within the Main Zone is due to the large copper component which is not captured with radiometric logging. A summary of the Project resource database is presented in Table 14-3.
Table 14-3: Summary of Available Drill hole Data
Energy Fuels Inc. - Pinyon Plain Project
Table | Number of Records |
Collar | 130 |
Survey | 23,483 |
Geology | 512 |
Geotech | 488 |
Lab | 3,651 |
Probe | 120,942 |
Assay, including: | |
Probe U3O8 | 97,994 |
Assay U3O8 | 3,409 |
Assay Cu | 3,409 |
14.3 Geological Interpretation
14.3.1 Uranium
Uranium mineralization at the Project is concentrated in six vertical zones (Cap, Upper, Main, Main-Lower, Juniper I, and Juniper II) within a collapse structure ranging from 100 ft to 230 ft in plan section with a vertical extension from a depth of 650 ft to over 2,100 ft below ground surface, resulting in approximately 1,450 ft of mineralization vertically. Intercepts range widely up to several tens of feet, with grades in excess of 1.00% U3O8. Uranium mineralization is hosted within each zone; copper mineralization has been modeled within the Main and Main-Lower zones only. For reporting purposes, the six zones have been combined into three geologic zones: the Upper/Cap, Main, and Juniper Zones (Figure 14-1). The bulk of mineralization for both commodities is hosted within the Main Zone. At present, no structural features other than the pipe boundary have been incorporated into the geological model.
The model of the breccia pipe host was constructed based on drill logs. Geological interpretations supporting the estimate were generated by EFR personnel and audited for completeness and accuracy by the SLR QP. Topographical surfaces, solids, and mineralized wireframes were modeled using Maptek's Vulcan software.
EFR created a series of north-south and east-west polylines spaced at 10 ft. The polylines were edited and joined together in 3D using tie lines. During this "stitching" process, polylines and/or tie lines were snapped to composite control intervals, which were interpreted using a 0.15% eU3O8 cut-off. Occasionally, lower grade intersections were included to facilitate continuity. Extension distance for the mineralized wireframes was half-way to the next hole, or approximately 20 ft vertically and horizontally past the last drill intercept. In total, 38 uranium wireframes, or domains, were contained within the three geologic zones and assigned identifier numbers for Upper/Cap (17 domains), Main (12 domains), and Juniper (9 domains). The domains ranged in size from 105 tons to 100,500 tons, for a total of 187,700 tons. Domains M_01 (Main) and J_1_01 (Juniper I) account for over 80% of the total tons. A detailed description of these two domains follows.
Within the M_01 domain, the uranium mineralization occurs within the structurally prepared breccia pipe and adjacent to the country rock forming a donut shape roughly 185 ft in diameter and extending from an elevation of 5,325 ft to 5,115 ft. Mineralization consists predominantly of uraninite/pitchblende that occurs as massive to semi-massive accumulations ranging in thickness from less than five feet to 50 ft but is generally in the 30 ft to 40 ft range (horizontally). Within this area, the center or throat of the breccia pipe is essentially barren of uranium mineralization.
EFR proposes that the underlying J_1_01 zone that extends from 4,925 ft elevation to 4,700 ft elevation may be the down-dropped center block of uranium mineralization from the overlying M_01 domain. The shape, depth extension, and horizontal thickness of the mineralization, which ranges from five feet to 50 ft but is generally 25 ft to 30 ft, generally mimics the dimensions of the unmineralized portion of the M_01 zone.
The SLR QP reviewed the uranium mineralization domains and found them to be appropriately extended beyond existing drilling, snapped, and referenced to the principal mineralization controls. The SLR QP recommends EFR continue to work to smooth the connection of the uranium wireframes between sections in future updates.
14.3.2 Copper
Copper mineralization models at Pinyon are restricted to the Main and Main-Lower zones. Copper mineralization present within the Juniper Zone has not been modeled at this time due to the much lower sample assay values overall. Final wireframe surfaces, as well as a cross section of mineralization from within the Main Zone, are shown in Figure 14-1.
Within the Main zone, the copper mineralization domain has been modeled at a nominal cut-off grade of 1% Cu, encapsulating mineralization within the breccia pipe. The mineralization tends to concentrate at the contact between the breccia pipe and the country rock, creating a toroid (donut) shape, and elongated at depth. A few flat lying structures carry mineralization into the center of the pipe. Mineralization ranges in thickness from five feet to 80 ft thick (horizontally) but is generally from 20 ft to 40 ft thick. The domain is located from 5,320 ft to 5,120 ft elevation and ranges from 50 ft. deep in the southeast of the breccia pipe and up to 200 ft deep elsewhere.
Additionally, a high grade domain has been modeled in the Main Zone at a cut-off grade of approximately 8% Cu. High grade mineralization also follows the contact with the country rock, but does not extend into the center, or to the southeast, creating a C-shape which is oriented to the southeast and vertically elongated. Mineralization has been modeled to be thickest in the northeast; however, this is also the region with the best access, and therefore the closest drill hole spacing, allowing for a more robust interpretation. The high grade domain is as elongate as the lower grade domain, but patchier, particularly at depth. The high grade domain accounts for approximately 30% of the total copper domain in the Main Zone. The copper domain overlaps approximately 50% of the uranium domain.
Within the Main-Lower Zone, mineralization has been captured within three separate wireframes, using a cut-off grade of 1% Cu, delineated using from one to five drill holes. As with the Main Zone, mineralization is modeled towards the edge of the breccia pipe. There is no high grade domain in the Main-Lower Zone.
The SLR QP reviewed the copper mineralization domains and found them to be appropriately extended beyond existing drilling, snapped, and referencing the principal mineralization controls. The SLR QP recommends that future updates to the copper mineralization include some marginal material where appropriate to increase the continuity and volume of the wireframes, particularly the high grade copper wireframe.

Figure 14-1: Uranium and Copper Mineralized Zones
14.4 Resource Assays
The mineralization wireframe models were used to code the drill hole database and to identify samples within the mineralized wireframes. These samples were extracted from the database on a group-by-group basis, subjected to statistical analyses for their respective domains, and then analyzed by means of histograms and probability plots. A total of 5,203 samples were contained within the mineralized uranium wireframes. The sample statistics are summarized by zone in Table 14-4. The coefficient of variation (CV) is a measure of variability of the data.
Table 14-4: Summary Statistics of Uncapped U3O8 Assays
Energy Fuels Inc. - Pinyon Plain Project
Zone | Count | Minimum
(%U3O8) | Maximum
(%U3O8) | Mean
(%U3O8) | Variance | SD
(%U3O8) | CV |
CAP | 99 | 0.009 | 1.040 | 0.213 | 0.020 | 0.141 | 0.660 |
UPPER | 733 | 0.000 | 4.585 | 0.337 | 0.160 | 0.405 | 1.200 |
MAIN | 3,128 | 0.000 | 45.121 | 0.886 | 5.750 | 2.397 | 2.710 |
MAIN-LOWER | 108 | 0.000 | 1.835 | 0.267 | 0.090 | 0.305 | 1.140 |
JUNIPER-1 | 955 | 0.000 | 22.720 | 0.612 | 2.580 | 1.606 | 2.630 |
JUNIPER-2 | 180 | 0.000 | 1.489 | 0.254 | 0.030 | 0.159 | 0.630 |
ALL ZONES | 5,203 | 0.000 | 45.121 | 0.710 | 4.010 | 2.002 | 2.820 |
Treatment of High Grade Assays
14.4.1 Capping Levels
Where the assay distribution is skewed positively or approaches log-normal, erratic high grade assay values can have a disproportionate effect on the average grade of a deposit. One method of treating these outliers to reduce their influence on the average grade is to cut or cap them at a specific grade level. In the absence of production data to calibrate the capping level, inspection of the assay distribution can be used to estimate a "first pass" cutting level.
The SLR QP is of the opinion that the influence of high grade uranium assays must be reduced or controlled and uses a number of industry best practice methods to achieve this goal, including capping of high grade values. The SLR QP employs a number of statistical analytical methods to determine an appropriate capping value including preparation of frequency histograms, probability plots, decile analyses, and capping curves. Using these methodologies, the SLR QP examined the selected capping values for the mineralized domains for the Project.
Examples of the capping analysis are shown in Figure 14-2 and Figure 14-3 as applied to the data set for the mineralized domains. Very high grade uranium outliers were capped at 15% U3O8 within the M_01 and J_1_01 domains, resulting in a total of 16 capped assay values. Capped assay statistics by zones are summarized in Table 14-5 and compared with uncapped assay statistics.
In the SLR QP's opinion, the selected capping values are reasonable and have been correctly applied to the raw assay values for the Pinyon Plain Mineral Resource estimate.
Table 14-5: Summary Statistics of Uncapped vs. Capped Assays
Energy Fuels Inc. - Pinyon Plain Project
Zone | Cap | Upper | Main |
Descriptive Statistics | Uncap | Cap | Uncap | Cap | Uncap | Cap |
Number of Samples | 99 | 99 | 733 | 733 | 3,128 | 3,128 |
Minimum (%U3O8) | 0.009 | 0.009 | 0.000 | 0.000 | 0.000 | 0.000 |
Maximum (%U3O8) | 1.040 | 1.040 | 4.585 | 4.585 | 45.121 | 15.000 |
Mean (%U3O8) | 0.213 | 0.213 | 0.337 | 0.337 | 0.886 | 0.842 |
Variance | 0.020 | 0.020 | 0.160 | 0.160 | 5.750 | 3.710 |
SD (%U3O8) | 0.141 | 0.141 | 0.405 | 0.405 | 2.397 | 1.927 |
CV | 0.660 | 0.660 | 1.200 | 1.200 | 2.710 | 2.290 |
Number of Caps | 0 | 0 | 0 | 0 | 0 | 13 |
Zone | Main-Lower | Juniper-1 | Juniper-2 |
Descriptive Statistics | Uncap | Cap | Uncap | Cap | Uncap | Cap |
Number of Samples | 108 | 108 | 955 | 955 | 180 | 180 |
Minimum (%U3O8) | 0.000 | 0.000 | 0.000 | 0.000 | 0.000 | 0.000 |
Maximum (%U3O8) | 1.835 | 1.835 | 22.720 | 15.000 | 1.489 | 1.489 |
Mean (%U3O8) | 0.267 | 0.267 | 0.612 | 0.595 | 0.254 | 0.254 |
Variance | 0.090 | 0.090 | 2.580 | 2.000 | 0.030 | 0.030 |
SD (%U3O8) | 0.305 | 0.305 | 1.606 | 1.414 | 0.159 | 0.159 |
CV | 1.140 | 1.140 | 2.630 | 2.380 | 0.630 | 0.630 |
Number of Caps | 0 | 0 | 0 | 3 | 0 | 0 |

Figure 14-2: Histogram of U3O8 Resource Assay in M_01 and J_1_01 Domains

Figure 14-3: Log Normal Probability Plot with Capping Grades
14.4.2 High Grade Restriction
In addition to capping thresholds, a secondary approach to reducing the influence of high grade composites is to restrict the search ellipse dimension (high yield restriction) during the estimation process. The threshold grade levels, chosen from the basic statistics and from visual inspection of the apparent continuity of very high grades within each estimation domain, may indicate the need to further limit their influence by restricting the range of their influence, which is generally set to approximately half the distance of the main search.
Upon review of the capped assays, the SLR QP agrees with EFR's approach that no high grade restrictions are required for a Mineral Resource estimation.
14.5 Compositing
Composites were created from the capped, raw assay values using the downhole compositing function of Maptek's Vulcan modeling software package. The composite lengths used during interpolation were chosen considering the predominant sampling length, the minimum mining width, style of mineralization, and continuity of grade. The majority of assay intervals within the mineralized domains varied in length from 0.5 ft (probe data) to 10 ft (assay data), as presented in Figure 14-4, with a few samples outside this range. Most assay samples were four feet, and the drill hole samples were composited to four feet, starting at the wireframe pierce point for each domain, continuing to the point at which the hole exited the domain. A small number of unsampled and missing sample intervals were ignored. Residual composites were maintained in the dataset. The composite statistics by zone are summarized in Table 14-6.
Table 14-6: Summary of Uranium Composite Data by Zone
Energy Fuels Inc. - Pinyon Plain Project
Zone | Count | Minimum
(%U3O8) | Maximum
(%U3O8) | Mean
(%U3O8) | Variance | SD
(%U3O8) | CV |
CAP | 16 | 0.076 | 0.689 | 0.220 | 0.022 | 0.148 | 0.670 |
UPPER | 101 | 0.055 | 1.683 | 0.335 | 0.069 | 0.263 | 0.786 |
MAIN | 1015 | 0.000 | 15.000 | 0.847 | 2.589 | 1.609 | 1.900 |
MAIN_LOWER | 41 | 0.000 | 1.152 | 0.251 | 0.064 | 0.253 | 1.006 |
JUNIPER-1 | 186 | 0.000 | 14.130 | 0.691 | 2.402 | 1.550 | 2.244 |
JUNIPER-2 | 25 | 0.119 | 0.619 | 0.252 | 0.010 | 0.102 | 0.405 |
ALL ZONES | 1384 | 0.000 | 15.000 | 0.753 | 2.262 | 1.504 | 1.997 |

Figure 14-4: Length Histogram
14.6 Trend Analysis
Variography
EFR generated downhole and directional variograms using the four-foot U3O8 composite values located within the M_01 and J_1_01 mineralized domains (Figure 14-5) for uranium. The variograms were used to support search ellipsoid anisotropy, linear trends observed in the data, and Mineral Resource classification decisions.
Long range directional variograms were focused in the primary plane of mineralization, which commonly strikes northeast and dips steeply to the southeast. Most ranges were interpreted to be from 40 ft to 60 ft.
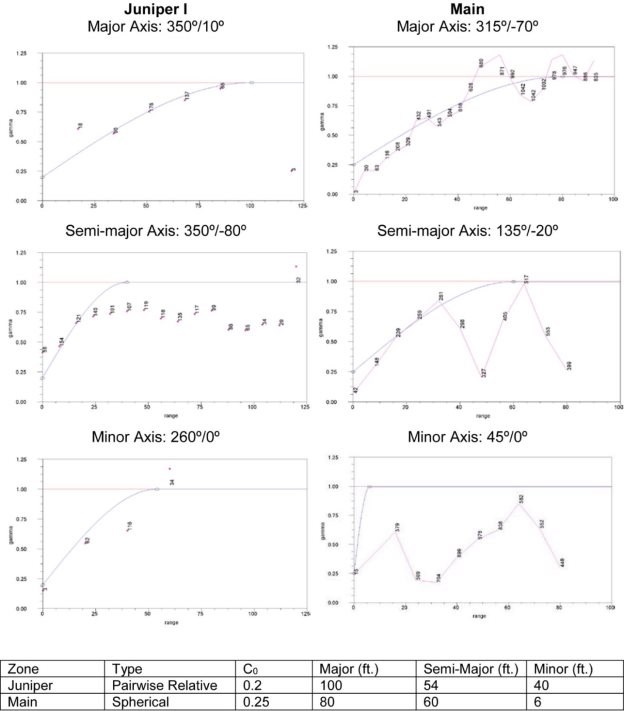
Figure 14-5: U3O8 Variogram Models
14.7 Search Strategy and Grade Interpolation Parameters
The steps in calculating the U3O8 grade are presented in Table 14-7, including a description of each step and the variable parameters. Section 14.10 describes how the cut-off grade was determined in this report.
Table 14-7: Estimation Steps of Block Model Variables
Energy Fuels Inc. - Pinyon Plain Project
Step | Description | Variable Name |
Steps 1 and 2 estimate U3O8 grade within individual wireframes |
1 | Build Uranium Estimation File | 1st Pass Estimation: canu_est_pass_1_final.bef |
| | 2nd Pass Estimation: canu_est_pass_2_final.bef |
| | 3rd Pass Estimation: canu_est_pass_3_final.bef |
2 | Run Uranium Estimation File:
Calculates U3O8_ok (2 triangulations) and U3O8_idw (38 triangulations) variables | All Uranium: July_2017_43101_Est_Run_File_U_Only.ber |
Steps 3 and 4 calculate U3O8_final (combines U3O8_ok and U3O8_idw estimations) |
3 | Block->Manipulation->Calculate | |
| Variable Name: | U3O8_final |
| Calculation = | U3O8_ok |
OK | |
| Select Blocks by bounding triangulation: | ore.tri/U3O8.tri/ok.00t to calc U3O8_final from U3O8_ok |
| Select Block centers | |
4 | Block->Manipulation->Calculate | |
| Variable Name: | U3O8_final |
| Calculation = | U3O8_idw |
OK | |
| Select Blocks by bounding triangulation: | ore.tri/U3O8.tri/idw.00t to calc U3O8_final from U3O8_idw |
| Select Block centers | |
Estimation of uranium grades was controlled by the grade zones. In the larger domain wireframes, search ellipsoid geometry of the major, semi-major, and minor axis was oriented into the structural plane of the mineralization, as indicated by the variography ranges for each domain. Within the small domain wireframes, the search ellipse was isotropic. The interpolation strategy involved setting up search parameters in three nested estimation runs for each domain. Each subsequent pass was doubled in size. A maximum of three passes was employed to interpolate all blocks.
First, second, and third pass search ellipses maintained normalized anisotropic ratios. Grade interpolation was carried out using OK on mineralized domains M_01 and J_1_01 with ID2 on all remaining mineralized domains. Depending on the pass and domain wireframe, a minimum of one to eight to a maximum of 1 to 16 composites per block estimate were employed, with a maximum of two to six composites per drill hole. Hard boundaries were used to limit the restrict composites to within the domain wireframe in which they were located. A nearest neighbor (NN) block model was also prepared for comparison purposes. Search parameters are listed in Table 14-8 for the Project.
In order to reduce the influence of very high grade composites, grades greater than a designated threshold level for each domain were restricted to shorter search ellipse dimensions. The threshold grade level of 7% eU3O8 was chosen from the basic statistics and from visual inspection of the apparent continuity of very high grades within each domain, which indicated the need to limit their influence to 32 ft by 22 ft by 4 ft or 40 ft by 21.6 ft by 16 ft, domain dependant.
Table 14-8: Uranium Interpolation Plan
Energy Fuels Inc. - Pinyon Plain Project
Domain | Wireframe1 | Interp. Type | Bearing/Plunge | First Pass Dimensions
(ft) |
CAP | c_01 | ID2 | 335°/-1° | 64 x 44 x 8 |
CAP | c_03 | ID2 | 345°/1° | 64 x 44 x 8 |
UPPER | u_04 | ID2 | 84°/-33° | 64 x 44 x 8 |
UPPER | u_08 | ID2 | 44.5°/-10° | 64 x 44 x 8 |
UPPER | u_09 | ID2 | 44.5°/-4° | 64 x 44 x 8 |
UPPER | u_10 | ID2 | 150°/-28° | 64 x 44 x 8 |
UPPER | u_12 | ID2 | 177°/2° | 64 x 44 x 8 |
MAIN | m_01 | OK | 315°/-70° | 64 x 44 x 8 |
MAIN-LOWER | ml_01 | ID2 | 345°/0° | 64 x 44 x 8 |
MAIN-LOWER | ml_02 | ID2 | 356.5°/12° | 64 x 44 x 8 |
MAIN-LOWER | ml_05 | ID2 | 245.5°/-5° | 64 x 44 x 8 |
MAIN-LOWER | ml_06 | ID2 | 287.5°/4° | 64 x 44 x 8 |
MAIN-LOWER | ml_08 | ID2 | 62.5°/-33° | 64 x 44 x 8 |
JUNIPER I | j_1_01 | OK | 350°/10° | 80 x 43.2 x 32 |
JUNIPER I | j_1_02 | ID2 | 298°/-3° | 64 x 44 x 8 |
JUNIPER II | j_2_01 | ID2 | 284.5°/0° | 64 x 44 x 8 |
Notes:
1. Wireframes not included in this table were interpolated using an omnidirectional search ellipse, the first pass of which was 20 ft x 20 ft x 20 ft.
14.8 Bulk Density
Bulk density was determined by EFR with specific gravity (SG) measurements on drill core by measuring a minimum four-inch piece of core in all directions with calipers to determine a volume. The sample is then weighed to get a mass and the density calculated. This method was used to determine the density of 2,857 samples. The density is modeled using inverse distance weighting squared and an average value across the deposit of 0.082 t/ft3 was calculated.
This method of density determination was validated using the water immersion method according to the Archimedes principle, after the core has been sealed in wax. SG is calculated as weight in air (weight in air - weight in water). Under normal atmospheric conditions, SG (a unitless ratio) is equivalent to density in t/m3. The validation utilized 37 bulk density measurements that were collected on six-inch drill core samples from the main mineralized zones to represent local major lithologic units, mineralization styles and alteration types. Samples were collected on full core, which had been retained in the core box prior to splitting for sampling. EFR determined the difference between the caliper method and water immersion method is about 1% in favor of the caliper method.
A global density of 0.082 t/ft3 was assigned to the block model.
14.9 Block Models
All modeling work was carried out using Maptek's Vulcan software version 10.0 software. The Pinyon Plain block model has 4 ft by 4 ft by 4 ft whole blocks and an origin at 646,630 ft East, 1,776,530 ft North, 4,450 ft elevation. The block model is not rotated, and extends 360 ft east-west, 320 ft north-south and 1,460 ft elevation. Before grade estimation, all model blocks were assigned density and mineralized domain codes (copper and uranium), based on majority rules. A summary of the block model variables is provided in Table 14-9.
Table 14-9: Summary of Block Model Variables
Energy Fuels Inc. - Pinyon Plain Project
Variable | Type | Default | Description |
U3O8_ok | Double | -99 | U3O8 estimation using ordinary kriging |
U3O8_idw | Double | -99 | U3O8 estimation using inverse distance |
U3O8_nn | Double | -99 | U3O8 estimation using nearest neighbor |
ok_u_est_flag | Integer | 0 | Ordinary Kriging Estimation Flag |
ok_u_samp_flag | Integer | 0 | No. of samples used in ordinary kriging |
ok_u_holes_flag | Integer | 0 | No. of holes used in ordinary kriging |
idw_u_est_flag | Integer | 0 | Inverse Distance Estimation Flag |
idw_u_samp_flag | Integer | 0 | No. of samples used in inverse distance |
idw_u_holes_flag | Integer | 0 | No. of samples used in inverse distance |
nn_u_nearest_samp | Double | 0 | Distance to nearest neighbor |
class | Integer | 0 | Block Classification |
dens | Double | 0.082 | Density of Block (Default is 12.2 cu ft/ton - 0.082) |
bound | Name | out | Mineralized Boundary Zone (C, U, M, ML, J_1, J_2) |
U3O8_final | Double | -99 | Final U3O8 idw or ok block grade |
u_tri_flag | Integer | 0 | block in U shape (in =1, out=0) |
14.10 Cut-off Grade
Two cut-off grades were used for the resource estimate. For the uranium and copper bearing zones, a 0.40% uranium equivalent (% U3O8 Eq) cut-off grade was used. For the uranium-only zones, a 0.30% eU3O8 cut-off grade was used. The two cut-off grades account for separate process campaigns with different unit costs.
Assumptions used in the determination of the Pinyon Plain uranium resource cut-off grade of 0.30% eU3O8 and the uranium and copper resource cut-off grade of 0.40% U3O8 Eq are presented in Table 14-10.
Total operating cost (mining, G&A, processing) of US$372. Per short ton for uranium only.
Total operating cost (mining, G&A, processing) of US$471. Per short ton for uranium + copper.
Royalty cost of $1.88/ton
Process recovery of 96% for uranium and 90% for copper.
• Uranium price of US$65.00/lb and copper price of US$4.00/lb. The prices are based on independent, third-party, and market analysts' average forecasts as of 2022, and the supply and demand projections are for the period 2023 to 2035. In the SLR QP's opinion, these long-term price forecasts are a reasonable basis for estimation of Mineral Resources.
Table 14-10: Pinyon Plain Project Cut-off Grade Calculation for Mineral Resources
Energy Fuels Inc. - Pinyon Plain Project
Item | Unit | Quantity |
Metal Price Uranium | US$/lb U3O8 | 65.00 |
Metal Price Copper | US$/lb Cu | 4.00 |
Process Plant Recovery Uranium | % | 96 |
Process Plant Recovery Copper | % | 90 |
Mining Cost | US$/ton processed | 101.00 |
Surface Haulage Cost | US$/ton processed | 72.00 |
Processing Cost (Uranium + Copper) | US$/ton processed | 291.00 |
Processing Cost (Uranium) | US$/ton processed | 192.00 |
G&A Cost | US$/ton processed | 7.00 |
Total Operating Cost (Uranium + Copper) | US$/ton processed | 471.00 |
Total Operating Cost | US$/ton processed | 372.00 |
Royalty Cost | US$/ton processed | 1.88 |
lb/ton | | 2,000 |
Break-Even Cut-off Grade (Uranium +Copper (% U3O8 Eq) | % | 0.40 |
Break-Even Cut-off Grade (Uranium % eU3O8) | % | 0.30 |
The SLR QP reviewed the operating costs and cut-off grade reported by EFR and is of the opinion they are reasonable for disclosing Mineral Resources.
14.11 Classification
Classification of Mineral Resources as defined in SEC Regulation S-K subpart 229.1300 were followed for classification of Mineral Resources. The Canadian Institute of Mining, Metallurgy and Petroleum definition Standards for Mineral Resources and Mineral Reserves (CIM 2014) are consistent with these definitions.
A Mineral Resource is defined as a concentration or occurrence of material of economic interest in or on the Earth's crust in such form, grade or quality, and quantity that there are reasonable prospects for economic extraction. A mineral resource is a reasonable estimate of mineralization, considering relevant factors such as cut-off grade, likely mining dimensions, location, or continuity, that with the assumed and justifiable technical and economic conditions, is likely to, in whole or in part, become economically extractable. It is not merely an inventory of all mineralization drilled or sampled.
Based on this definition of Mineral Resources, the Mineral Resources estimated in this Technical Report have been classified according to the definitions below based on geology, grade continuity, and drill hole spacing.
Measured mineral resource is that part of a mineral resource for which quantity and grade or quality are estimated on the basis of conclusive geological evidence and sampling. The level of geological certainty associated with a measured mineral resource is sufficient to allow a qualified person to apply modifying factors, as defined in this section, in sufficient detail to support detailed mine planning and final evaluation of the economic viability of the deposit. Because a measured mineral resource has a higher level of confidence than the level of confidence of either an indicated mineral resource or an inferred mineral resource, a measured mineral resource may be converted to a proven mineral reserve or to a probable mineral reserve.
Indicated mineral resource is that part of a mineral resource for which quantity and grade or quality are estimated on the basis of adequate geological evidence and sampling. The level of geological certainty associated with an indicated mineral resource is sufficient to allow a qualified person to apply modifying factors in sufficient detail to support mine planning and evaluation of the economic viability of the deposit. Because an indicated mineral resource has a lower level of confidence than the level of confidence of a measured mineral resource, an indicated mineral resource may only be converted to a probable mineral reserve.
Inferred mineral resource is that part of a mineral resource for which quantity and grade or quality are estimated on the basis of limited geological evidence and sampling. The level of geological uncertainty associated with an inferred mineral resource is too high to apply relevant technical and economic factors likely to influence the prospects of economic extraction in a manner useful for evaluation of economic viability. Because an inferred mineral resource has the lowest level of geological confidence of all mineral resources, which prevents the application of the modifying factors in a manner useful for evaluation of economic viability, an inferred mineral resource may not be considered when assessing the economic viability of a mining project and may not be converted to a mineral reserve.
The SLR QP has considered the following factors that can affect the uncertainty associated with each class of Mineral Resources:
- Reliability of sampling data:
- Drilling, sampling, sample preparation, and assay procedures follow industry standards.
- Data verification and validation work confirm drill hole sample databases are reliable.
- No significant biases were observed in the QA/QC analysis results.
Confidence in interpretation and modeling of geological and estimation domains:
Mineralization domains are interpreted manually in cross-sections and refined in longitudinal sections by an experienced resource geologist.
There is good agreement between the drill holes and mineralization wireframe shapes.
The mineralization wireframe shapes are well defined by sample data in areas classified as Measured and Indicated.
Confidence in block grade estimates:
- Measured and Indicated block grades correlate well with composite data, statistically and spatially and locally and globally.
Blocks were classified as Indicated or Inferred based on drill hole spacing, confidence in the geological interpretation, and apparent continuity of mineralization.
14.11.1 Measured Mineral Resources
Classification of Measured Resources was limited to blocks contained in the Main Zone, directly adjacent to underground drilling station 1-4, where 67 drill holes were collared in a fan pattern on general drill hole spacing of 15 feet. A cross section of block classification in the Main Zone is shown in Figure 14-6. All Measured and Indicated Resources in the Main Zone have been converted to Reserves and are excluded from the current Mineral Resource estimate.
14.11.2 Indicated Mineral Resources
The remainder of the blocks within the Main Zone, as well as the blocks in primary wireframe within Juniper I, j_1_01, were assigned a classification of Indicated, in which drill hole pierce point spacing is generally less than 25 feet from underground drilling station 1-4.
14.11.3 Inferred Mineral Resources
All remaining blocks in the model were limited to an Inferred classification.
In the SLR QP's opinion the classification of Mineral Resources is reasonable and appropriate for disclosure.

Figure 14-6: Block Classification within the Main Zone
14.12 Block Model Validation
The SLR QP reviewed and validated the block model using various modeling and interpolation aspects of the Pinyon Plain model. Observations and comments from the model validation are provided below.
Mineralization wireframes were checked for conformity to drill hole data, continuity, similarity between sections, overlaps, appropriate terminations between holes and into undrilled areas, and minimum mining thicknesses. The wireframes were snapped to drill hole intervals, are reasonably consistent, continuous, and generally representative of the extents and limits of the mineralization. The SLR QP recommends that EFR continue to work to smooth the connection of the uranium wireframes between sections in future updates.
Capping statistics were reviewed and audited for a series of individual zones and compared to the statistics of capping groups defined by EFR. The SLR QP is satisfied with the chosen caps.
Compositing routines were checked to confirm that composites started and stopped at the intersections with the wireframes and that the composite coding is consistent with the wireframes. The SLR QP is satisfied with the compositing routines and finds the composites appropriate for Mineral Resource estimation.
Contact plots were prepared for selected mineralization domains and confirmed the appropriateness of hard boundaries between the domains during estimation.
Visual inspection and comparison of drill hole composites against mineralized solids were carried out for a number of sections with focus on the Main and Juniper I domains for both copper and uranium. The mineralized solids were found to conform reasonably well to the drill hole composite grades, although some evidence of smoothing was present. A cross section and plan section comparing uranium composite and uranium block grades are presented in Figure 14-7 and Figure 14-8.

Figure 14-7: Cross Section Comparing Block and Composite U3O8 Grades in the Main Zone

Figure 14-8: Plan View Comparing Block and Composite U3O8 Grades in the Main Zone
The SLR QP reviewed the variogram models for selected mineralization groups and prepared variogram models representing selected individual mineralization domains for comparison, then validated the trend of the variogram against observed trends and grade shells created in Leapfrog Geo software. The SLR QP recommends exploring the use of dynamic anisotropy for the interpolation of mineralization within the Main Zone in future updates, where mineralization follows the contact of the breccia pipe with the country rock.
The SLR QP validated the grades estimated in the block models prepared by EFR using basic statistics, visual inspection, volumetric comparison, swath plots, and a re-estimation of a portion of the Main Zone using the ID2 method. The grades of re-estimated areas were found to be within 10%.
A statistical comparison of the estimated block grades with the four-foot composites is shown in Table 14-11. The block results compare well with the composites, indicating a reasonable overall representation of the uranium grades in the block model.
Table 14-11: Comparison of Block and Composite Uranium Grades
Energy Fuels Inc. - Pinyon Plain Project
Domain | Type | Count | Min | Max | Mean | Variance | SD | CV |
CAP | Blocks | 685 | 0.076 | 0.361 | 0.196 | 0.000 | 0.060 | 0.300 |
CAP | Comps | 16 | 0.076 | 0.689 | 0.220 | 0.022 | 0.148 | 0.670 |
UPPER | Blocks | 3,017 | 0.117 | 1.338 | 0.336 | 0.030 | 0.165 | 0.490 |
UPPER | Comps | 101 | 0.055 | 1.683 | 0.335 | 0.069 | 0.263 | 0.786 |
MAIN | Blocks | 19,339 | 0.069 | 10.887 | 0.872 | 0.910 | 0.953 | 1.090 |
MAIN | Comps | 1015 | 0.000 | 15.000 | 0.847 | 2.589 | 1.609 | 1.900 |
MAIN_LOWER | Blocks | 1,397 | 0.016 | 0.884 | 0.233 | 0.030 | 0.170 | 0.730 |
MAIN_LOWER | Comps | 41 | 0.000 | 1.152 | 0.251 | 0.064 | 0.253 | 1.006 |
JUNIPER-1 | Blocks | 10,516 | 0.034 | 11.831 | 0.724 | 1.110 | 1.054 | 1.460 |
JUNIPER-1 | Comps | 186 | 0.000 | 14.130 | 0.691 | 2.402 | 1.550 | 2.244 |
JUNIPER-2 | Blocks | 833 | 0.124 | 0.614 | 0.259 | 0.010 | 0.086 | 0.330 |
JUNIPER-2 | Comps | 25 | 0.119 | 0.619 | 0.252 | 0.010 | 0.102 | 0.405 |
14.13 Grade Tonnage Sensitivity
Table 14-12 shows the Indicated block model sensitivity to cut-off grade and uranium prices as represented in the grade tonnage curve shown in Figure 14-9.
Table 14-13 shows the Inferred block model sensitivity to cut-off grade and uranium prices as represented in the grade tonnage curve shown in Figure 14-10 .
Table 14-12: Block Model Sensitivity to Cut-off Grade and Uranium Price in the Main-Lower and Juniper Zones (Indicated)
Energy Fuels Inc. - Pinyon Plain Project
Price
($/lb U3O8) | Cut-Off Grade
(%U3O8)1 | Tonnage
(ton) | Grade
(% U3O8) | Contained Metal
(lb U3O8) |
$80 | 0.24 | 43,000 | 0.86 | 734,000 |
$75 | 0.25 | 42,000 | 0.87 | 730,000 |
$70 | 0.27 | 40,000 | 0.90 | 721,000 |
$65 | 0.30 | 37,000 | 0.95 | 703,000 |
$60 | 0.32 | 35,000 | 0.98 | 693,000 |
$55 | 0.35 | 33,000 | 1.03 | 678,000 |
$50 | 0.38 | 31,000 | 1.07 | 662,000 |
$45 | 0.42 | 28,000 | 1.14 | 641,000 |
$40 | 0.48 | 24,000 | 1.25 | 605,000 |
$35 | 0.54 | 21,000 | 1.35 | 575,000 |
$30 | 0.63 | 18,000 | 1.49 | 538,000 |
$25 | 0.76 | 15,000 | 1.68 | 491,000 |
Notes:
1. U3O8 Recovery and operating costs held constant for sensitivity analysis.
2. Base Case Scenario

Figure 14-9: Indicated Grade Tonnage Curve Main-Lower and Juniper Zones
Table 14-13: Block Model Sensitivity to Cut-off Grade and Uranium Price in the Main-Lower and Juniper Zones (Inferred)
Energy Fuels Inc. - Pinyon Plain Project
Price
($/lb U3O8) | Cut-Off Grade
(%U3O8)1 | Tonnage
(ton) | Grade
(% U3O8) | Contained Metal
(lb U3O8) |
$80 | 0.24 | 8,000 | 0.41 | 63,000 |
$75 | 0.25 | 7,000 | 0.43 | 60,000 |
$70 | 0.27 | 6,000 | 0.45 | 55,000 |
$65 | 0.30 | 5,000 | 0.50 | 48,000 |
$60 | 0.32 | 4,000 | 0.54 | 43,000 |
$55 | 0.35 | 3,200 | 0.58 | 38,000 |
$50 | 0.38 | 2,900 | 0.61 | 35,000 |
$45 | 0.42 | 2,300 | 0.66 | 31,000 |
$40 | 0.48 | 1,600 | 0.76 | 24,000 |
$35 | 0.54 | 1,200 | 0.85 | 20,000 |
$30 | 0.63 | 900 | 0.94 | 17,000 |
$25 | 0.76 | 800 | 0.97 | 15,000 |
Notes:
1. U3O8 Recovery and operating costs held constant for sensitivity analysis.
2. Base Case Scenario

Figure 14-10: Inferred Grade Tonnage Curve Main-Lower and Juniper Zones
14.14 Mineral Resource Reporting
A summary of the Pinyon Plain uranium Mineral Resources is presented in Table 14-14. Mineral Resources are based on a $65/lb uranium price at an equivalent uranium cut-off grade 0.30% eU3O88. In the SLR QP's opinion, the assumptions, parameters, and methodology used for the Pinyon Plain Mineral Resource estimate is appropriate for the style of mineralization and mining methods. The effective date of the Mineral Resource estimate is December 31, 2022.
The SLR QP is of the opinion that with consideration of the recommendations summarized in Section 1 and Section 26, any issues relating to all relevant technical and economic factors likely to influence the prospect of economic extraction can be resolved with further work. There are no other known environmental, permitting, legal, social, or other factors that would affect the development of the Mineral Resources.
While the estimate of Mineral Resources is based on the SLR QP's judgment that there are reasonable prospects for economic extraction, no assurance can be given that Mineral Resources will eventually convert to Mineral Reserves.
Table 14-14: Summary of Attributable Uranium Mineral Resources - Effective Date December 31, 2022
Energy Fuels Inc. - Pinyon Plain Project
Classification | Zone | Cut-Off Grade | Tonnage | Grade | Contained Metal | Metallurgical Recovery U3O8 |
(% eU3O8 ) | (tons) | (% eU3O8) | (lb U3O8) | (%) |
Indicated | Juniper I | 0.3 | 37,000 | 0.95 | 703,000 | 96 |
Total Indicated | | | 37,000 | 0.95 | 703,000 | 96 |
Inferred | Main-Lower | 0.3 | 2,000 | 0.48 | 16,000 | 96 |
Juniper I | 0.3 | 2,000 | 0.58 | 24,000 | 96 |
Juniper II | 0.3 | 1,000 | 0.36 | 8,000 | 96 |
Total Inferred | | | 5,000 | 0.50 | 48,000 | 96 |
Notes:
1. SEC S-K-1300 definitions were followed for all Mineral Resource categories. These definitions are also consistent with CIM (2014) definitions in NI 43-101.
2. Mineral Resources are estimated at 0.30% eU3O8 with estimated metallurgical recovery of 96% for uranium.
3. Mineral Resources are estimated using a long-term uranium price of US$65 per pound.
4. No minimum mining width was used in determining Mineral Resources.
5. Bulk density is 0.082 ton/ft3 (12.2 ft3/ton or 2.63 t/m3).
6. Mineral Resources are exclusive of Mineral Reserves and do not have demonstrated economic viability.
7. Numbers may not add due to rounding.
8. Mineral Resources are 100% attributable to EFR.
Table 14-15 lists the current estimated copper mineralization associated with the Main and Main-Lower zones at Pinyon Plain. Further study is required to determine if the copper associated with uranium mineralization in the zones may eventually be processed and add value to the project.
Table 14-15: Summary of Attributable Copper Mineral Resources - Effective Date December 31, 2022
Energy Fuels Inc. - Pinyon Plain Project
Classification | Zone | Cut-Off
Grade | Tonnage | Grade | Contained
Metal | Metallurgical
Recovery Cu |
(% U3O8 Eq) | (tons) | (% Cu) | (lb Cu) | (%) |
Measured | Main | 0.4 | 6,000 | 9.6 | 1,155,000 | 90 |
Indicated | Main | 0.4 | 90,000 | 5.9 | 10,553,000 | 90 |
Total Measured + Indicated | | | 96,000 | 6.1 | 11,708,000 | 90 |
Inferred | Main-Lower | 0.4 | 4,000 | 6.5 | 470,000 | 90 |
Notes:
1. SEC S-K-1300 definitions were followed for all Mineral Resource categories. These definitions are also consistent with CIM (2014) definitions in NI 43-101.
2. For the Main and Main-Lower zones of the Pinyon Plain Project, a 0.40% uranium equivalent cut-off grade (% U3O8 Eq) was applied to account for both the copper and uranium mineralization. The %U3O8 Eq grade term is not the same as the eU3O8 % grade term which indicates probe rather than assay data listed elsewhere in this report. For details, seethe Pinyon Plain Project below.
3. Mineral Resources are estimated using a long-term uranium price of $65 per pound and a copper price of $4.00 per lb.
4. A copper to U3O8 conversion factor of 18.19 was used for converting copper grades to equivalent U3O8 grades (U3O8 Eq) for cut-off grade evaluation and reporting.
5. For the Pinyon Plain Project, Mineral Resource tonnages of uranium and copper cannot be added as they overlap in the Main and Main-Lower zones.
6. No minimum mining width was used in determining Mineral Resources.
7. Bulk density is 0.082 ton/ft3 (12.2 ft3/ton or 2.63 t/m3).
8. Mineral Resources are exclusive of Mineral Reserves and do not have demonstrated economic viability.
9. Numbers may not add due to rounding.
10. Mineral Resources are 100% attributable to EFR.
15.0 MINERAL RESERVE ESTIMATE
15.1 Summary
The Mineral Reserve estimate for Pinyon Plain, summarized in Table 15-1, is based on the Measured and Indicated Mineral Resources as of December 31, 2022, a detailed mine design, and modifying factors such as a feasible mining method, external dilution, and mining extraction factors. Mineral Resource to Mineral Reserve conversion was 100% within the Main Zone, with the remaining zones (Main-Lower and Juniper) not considered for inclusion as Mineral Reserves. No Inferred Mineral Resources were converted to Mineral Reserves.
Based on the similarity of the Pinyon Plain deposit to other past producing breccia pipe deposits in northern Arizona, the proposed mining methods at Pinyon Plain will include a combination of longhole stoping, shrinkage stoping, and drifting. Development rock will be temporarily stored on surface and then used at the end of mining to fill voids created by mining. Metallurgical test results provided by White Mesa Mill laboratory personnel indicated that metallurgical recoveries using optimum roasting and leach conditions will be approximately 96% for uranium.
The underground mine design completed by EFR was based on grade envelopes of assays at a nominal grade of 0.15% U3O8 using underground mining methods and processing via a toll milling agreement.
Current economic conditions, mine design, and cash flow analysis do not account for processing of copper mineralization and thus copper is excluded from the Mineral Reserve estimate.
Table 15-1: Summary of Mineral Reserve Estimate - December 31, 2022
Energy Fuels Inc. - Pinyon Plain Project
Classification | Cut-Off Grade | Tonnage | Grade | Contained
Metal | Metallurgical Recovery
U3O8 |
(% U3O8 ) | (tons) | (% U3O8) | (lb U3O8) | (%) |
Main Zone |
Proven | 0.32 | 7,800 | 0.33 | 50,800 | 96 |
Probable | 0.32 | 126,700 | 0.60 | 1,517,000 | 96 |
Total Proven + Probable | | 134,500 | 0.58 | 1,567,800 | 96 |
Notes:
1. SEC S-K-1300 definitions were followed for all Mineral Reserve categories. These definitions are also consistent with CIM (2014) definitions in NI 43-101.
2. Mineral Reserves are estimated using a long-term uranium price of US$60.00/lb.
3. Underground Mineral Reserves were estimated by creating stope shapes using a grade envelope of 0.15% U3O8, with a minimum mining width of 5 ft (including hanging wall and footwall dilution), on 10 ft vertical stope heights.
4. The breakeven cut-off grade is 0.32% U3O8.
5. A mining extraction factor of 95% was applied to the underground stopes, while underground development assumed a 100% mining extraction factor.
6. Mining Reserves are in situ.
7. The density varies according to the block model.
8. Numbers may not add due to rounding.
The SLR QP is not aware of any mining, metallurgical, infrastructure, permitting, or other relevant factors that could materially affect the Mineral Reserve estimate.
15.2 Dilution
Dilution for the Mineral Reserve estimate was estimated as the material outside of the Mineral Resource limits but included within the stope designs in the application of the 0.15% U3O8 grade contour. The Mineral Reserves include 34,600 tons (35%) of dilution which has been included at zero grade.
The QP is of the opinion that the dilution estimate is appropriate considering:
The irregular shape of the deposit
The high grade nature of the ore
The target of maximum extraction
15.3 Extraction
Extraction of the planned stopes is 95%. Long hole stope ore will be drilled from successive levels sequenced upward and blasted, dropping to the lowest mine level (the 5130 level), where it will be mucked and transported to the shaft loading pocket.. The potential for ore loss is reduced as the losses would only occur in the final stages of mucking and efforts to maximize extraction will reduce losses.
15.4 Cut-off Grade
The SEC defines cut off grade as "the grade that distinguishes material deemed to have no economic value (it will not be mined in underground mining or if mined in surface mining, its destination will be the waste dump) from material deemed to have economic value (its ultimate destination during mining will be a processing facility)". The calculated cut off grade for Pinyon Plain Mineral Reserves was based on modifying factors including metal prices, metallurgical recoveries, operating costs, and other operational constraints. Mine operating costs were based on historical operating costs for similar underground operations on the Arizona Strip operated by Energy Fuels and comparisons to underground mining cost models while mill operating costs and process recovery were based on current data.
Metal prices used for Mineral Reserves are based on industry institutions and other sources. For Mineral Resources, metal prices used are slightly higher than those for reserves. Metal pricing and the royalty cost are discussed in Sections 19.1 and 4.4 of this report, respectively.
The uranium cut off grade applied to the Mineral Reserves is 0.32% U3O8 for the Main Zone. Table 15-2 lists the assumptions used in determining the uranium cut off grade.
Table 15-2: Cut Off Grade Calculation for Mineral Reserves
Energy Fuels Inc. - Pinyon Plain Project
Item | Unit | Quantity |
Metal Price | US$/lb U3O8 | $60.00 |
Process Plant Recovery | % | 96.0% |
Mining Cost | US$/ton ore | $101.00 |
Surface Haulage Cost | US$/ton ore | $72.00 |
Item | Unit | Quantity |
Processing | US$/ton ore | $192.00 |
G&A Cost | | $7.00 |
Total Operating Cost | US$/ton ore | $372.00 |
Royalty Cost | US$/ton ore | $1.88 |
Break-Even Cut-off grade | % U3O8 | 0.32% |
15.5 Classification
Measured Mineral Resources were converted to Proven Mineral Reserves and Indicated Mineral Resources were converted to Probable Mineral Reserves. No Inferred Mineral Resources were converted to Mineral Reserves.
15.6 Reconciliation
Reconciliation cannot be performed on the Mineral Reserve estimate as there has been no ore production at the Project.
SLR recommends that EFR develop grade control and production reconciliation procedures to permit an ongoing evaluation of the Mineral Reserve estimation parameters (dilution and extraction) and to maximize the value of the production from the mine.
16.0 MINING METHODS
The mine is an underground, vertical shaft access mine which is planned to be mined using small scale mechanized rubber tired equipment. Energy Fuels and its predecessors have mined numerous uranium bearing breccia pipes by underground methods dating back to the 1980s. Because mineralization can be found in fractures which range from a single fracture to intersections of many, forming large zones, several mining methods will be employed based on the size and geometry of the mineralization.
Ore will be mined by a combination of longhole stoping and shrinkage mining to suit the irregular nature of the deposit. Ore will be hoisted to surface, stored in a surface ore stockpile, and then transported by highway trucks to a processing facility. The shaft is 1,470 ft deep with mine production planned over a 150 ft vertical interval, from 1,223 ft below surface (approximately the 1-4 level of the shaft) to 1,376 ft below surface (approximately the 1-5 level of the shaft). A spiral ramp will be driven up from the 1-5 level to connect the planned sublevels and to connect to the shaft at the 1-4 level.
Mineral Reserves are located on the outer side of a roughly cylindrical shape with a diameter of 300 ft and a barren center with a diameter of approximately 50 ft. Mining sublevels are spaced at irregular intervals of 20 ft to 35 ft. An eight foot diameter return air raise, also functioning as an emergency escapeway, will be developed in the barren center of the deposit to a depth of 1,400 ft below surface.
16.1 Mine Design
The mine is currently accessed via a production shaft. The shaft is 1,470 ft deep with the 1-4 shaft station at approximately 5,283 ft ASL and the 1-5 station at 5,130 ft ASL. The shaft is equipped with a double drum hoist and is used for personnel and materials.
The stope design at Pinyon Plain was completed using Maptek's Vulcan mine software (Vulcan) and based on a block model also completed in the software. A grade shell from the block model at a 0.15% U3O8 grade guided the mine design process, which is less than the breakeven cut off grade of 0.32% for the Project. This accounted for planned dilution due to blasting overbreak around a given stope shape. In some cases, because of the narrow nature of the mineralized fractures, internal dilution was also included in the stope designs.
Drifts in ore and waste were designed to a minimum size of 10 ft x 10 ft, which also accounts for blasting overbreak. Ore production will be realized from these drifts and supplemented by breasting the back, ribs, and in some cases, floor pulls. However, longhole stoping will contribute the majority of ore tons in the mine plan, accounting for 71% of contained U3O8. Longhole stopes vary in dimension from 10 ft to 55 ft wide and 20 ft to 35 ft in height.
Access to the orebody is through a 10 ft by 10 ft spiral ramp located on the south side of the breccia pipe. The ramp connects the shaft stations of the 1-4 and 1-5 levels and is driven at a 15% gradient. Flat cross cuts from the spiral ramp are developed at five mining levels referenced by their sill elevation above sea level: the 5130, 5175, 5215, 5255, and 5283 levels. The mining levels are spaced apart 30 ft to 35 ft vertically. From these mining levels, a circular drift is developed around the inside perimeter of the breccia pipe, alternating though ore and waste. Once drifts in ore are widened to the extent of mineralization, longhole drilling can begin. Ring drilling will be sequenced in a clockwise and counter clockwise direction, retreating back to the mine level entrance to develop two stope faces and facilitate optimal mine production. Longhole drilling will begin at the 5175 level and sequence upward. The bottom of the mine (the 5130 mining level) is the sole mucking level during the mine life.
An eight foot diameter exhaust ventilation raise is designed in the center of the breccia pipe. Depending on which mining levels are active at any one time, drifts will intersect the ventilation raise to exhaust air. A series of air doors or regulators will control the volume of air required for mining or block air flow once mining is completed on a given level.
Figure 16-1 shows the overall mine design and naming convention at Pinyon Plain.

Notes: View looking northwest.
Figure 16-1: Pinyon Plain Overall Mine Design and Naming Conventions
16.2 Mining Method
Energy Fuels and its predecessors have mined numerous uranium bearing breccia pipes by underground methods dating back to the 1980s. Because mineralization can be found in fractures which range from single high grade structures to intersections of many forming large zones, several mining methods will be employed based on the size and geometry of the mineralization.
The majority and largest ore zones at Pinyon Plain will be mined by longhole stoping using a ring drill due to this mining method's low cost and high productivity per employee-shift. Narrower mineralized zones will be mined as a single drift using handheld jackleg drills with breasting of the roof and ribs to the ore's extents. In some cases, the sill will be blasted and mucked out (termed a "floor pull"). All broken material will be hauled by diesel powered, low profile load-haul-dump loaders (LHDs) to a muck raise located on the mining level and dropped to the lowest mining level (the 5130 level) or the muck raise located off the spiral ramp. From either location, an LHD will rehandle the muck and tram it to the dump pocket located at the 1-5 shaft station. The ore control system at the mine will ensure ore and waste are not commingled.
Due to the circular nature of the breccia pipe in plan view, each level will be developed in a circular fashion from the mine access drift to the level and be connected. Longhole stoping will be initiated from the farthest point away from the access drift and sequenced in both a clockwise and counter clockwise fashion to facilitate broken rock to the mucking level (the 5130 level).
The current planned production rate, assuming day shift only, is 250 stpd ore, based on past production metrics at similar uranium breccia pipes and the Pinyon Plain hoisting capabilities. Hoisting at Pinyon Plain can achieve 400 stpd, assuming work on day shift only, which allows for skipping a significant amount of waste development during the mine life of mine (LOM). An opportunity exists to skip ore on night shift with a limited crew with day shift using muck bays and the 5130 level to store a sufficient broken ore inventory.
Longhole stoping, also known as blasthole or sublevel stoping, is an open stoping, high-production, bulk mining method applicable to large, steeply dipping, regular ore bodies having competent ore and host rock that requires little or no support. Typical production ranges from 15 tons to 40 tons per employee-shift, and individual stopes may produce in excess of 25,000 tons/month.
Sublevel stoping is very development intensive, although the cost of development is compensated by the fact that much of it is done in ore. It is limited to steeply inclined ore bodies where both ore and country rock are competent and broken ore flows under the influence of gravity. Ore bodies should be regular, because the method is not selective.
Production drilling is accomplished using longhole equipment utilizing large-diameter down-the-hole (DTH) drills because of their directional accuracy. Efficient use of large-scale blasting makes sublevel stoping one of the lowest-cost underground mining methods available.
Mining will start from the lowest mining level (the 5130 level) and progress upward through the four additional mining levels. Each one of these levels will have developed a circular, connected drift which will produce ore from drifting and subsequently breasting of backs and ribs. Longhole drilling will then begin, first on the 5175 level and blasted ore will drop to the mucking level (the 5130 level). Once the ore has been extracted from this level, sufficient mine development will have been completed to continue drifting in ore, breasting, and ring drilling from the next level (the 5215 level), and so on until the Reserve has been completed exploited. Once mining is completed, all development rock stored on surface will be placed back underground through the ventilation raise as part of the Project's reclamation plan, as agreed to with State regulators.
16.3 Geotechnical
In 1987, the geotechnical consulting firm of Dames and Moore completed an evaluation of mine stability and subsidence potential at the Project.
The scope of work was based on a review of geologic and geotechnical data from similar breccia pipe uranium mines on the Arizona Strip (the Orphan Mine, the Hack 2 Mine, Kanab North, and the Pigeon Mine), including the stability of existing underground stopes.
Numerical modelling of stopes was analyzed at depths of 800 ft, 1,200 ft, and 1,600 ft below surface with a surrounding rock strength of 3,000 psi. Stope dimensions at these mines varied from 60 ft high by 30 ft wide (Orphan Mine) to 350 ft high by 200 ft wide (Hack 2 Mine). Ground support was limited to rock bolts in the stope backs and no backfill.
The report concluded that stopes up to 350 ft high at a depth of 1,200 ft would not develop significant stability problems as long as prudent ground supports were employed, which EFR plans on installing during mining. In addition, the paper predicted mined out stopes would fill with rubblized rock as a result of subsidence reaching surface in several hundred years; the surface expression would be less than two feet over a broad area and would be difficult to observe in the field. Since the geotechnical report was produced, EFR has decided to fill stopes with waste rock, which will significantly reduce any post-mining surface expression from to-ground subsidence.
SLR recommends that EFR develop a program for monitoring the geotechnical conditions in the stopes to provide an early warning of potential ground condition problems or stope wall failures. Similarly, the geotechnical condition of the development headings should be noted and recorded to support any required changes in the ground support regimes.
16.4 Hydrological
Mine workings will be constructed within competent bedrock having low to very low permeability. The breccia pipe and bedrock underlying the workings (the Lower Supai) are both considered nearly impermeable.
Despite the low permeability of the Coconino sandstone at the site, workings (including the mine access shaft) that penetrate saturated portions of the Coconino sandstone are expected to experience water seepage, at rates similar to those currently measured at the shaft, due to the relatively large, saturated thickness (approximately 200 ft) of the Coconino sandstone. The transmissivity (the product of hydraulic conductivity and saturated thickness) is high enough that current seepage to the mine shaft is approximately 16 gpm.
Even where fully saturated, the Upper Supai is expected to have a hydraulic conductivity (and transmissivity) substantially lower than that of the Coconino sandstone, therefore, mine workings that penetrate the Upper Supai are expected to make very little water, as supported by the current low seepage entering the mine shaft from the Upper Supai, consistent with expectations.
Mine workings that penetrate the breccia pipe are expected to make little to no water due to the nearly impermeable nature of the breccia material.
Regardless of the amount of water that actually seeps into the mine workings, such water will drain or be pumped to a lined sump at the base of the shaft.
In addition, during mining operations, the workings will act as sinks for any perched groundwater encountered; flow will be directed from the country rock toward the workings rather than the reverse. Furthermore, the long-term impacts of the relatively small volume of workings penetrating a very large volume of low permeability rock will have a negligible impact on the overall average hydraulic properties of the surrounding rock.
16.4.1 Mine Shaft Seepage
As discussed above, although the Mine is located within an area of the Coconino Plateau where the Coconino sandstone contains only locally perched groundwater, perched groundwater encountered within the Coconino during sinking of the mine shaft is slightly higher than but comparable to that anticipated. Perched groundwater is currently seeping into the shaft at a rate of approximately 16 gpm. This water is currently collected in a lined sump at the base of the shaft, however, EFR has installed water rings within the shaft at the base of the Coconino and at the base of the Kaibab to separate this water from any other water that may seep into the shaft.
The rate of seepage of water from the Coconino into the shaft, which acts as a very large diameter well, is consistent with the low estimated hydraulic conductivity for the Coconino. The rate of seepage of water from the Kaibab into the shaft is minimal (a few gpm), which is consistent with expectation. Any water from the Coconino and Kaibab that overflows or is not otherwise captured by or pumped out of the water rings reports to the sump at the bottom of the mine shaft.
Seepage from the Coconino has created a cone of depression within the perched groundwater that directs flow inward towards the shaft. Effectively, the shaft acts as a well that is continuously overpumped to the extent that a seepage face is created. As long as the shaft is in use and water is being pumped from the lined sump at the bottom of the shaft, groundwater flow will be directed inward from the Coconino into the shaft.
Potential seepage from perched water zones in other formations penetrated by the shaft (such as the Kaibab, Toroweap, and Upper Supai) is relatively small, however, groundwater flow from these formations will also be directed inward toward the shaft.
As the ventilation shaft will be installed within the breccia pipe, which is comprised of a dense, well-cemented, compact and predominantly dry rock matrix, no additional water inflows are expected during the planned ventilation raise or after installation of the vent shaft. .
16.4.2 Drifts into Breccia Pipe Orebody
Drifts extending from the shaft into the orebody are expected to remain dry unless saturated materials are penetrated. If saturated materials are penetrated, water is expected to seep into the drifts, with the rate of seepage roughly proportional to the permeability of the saturated materials. As discussed above, workings penetrating any materials other than saturated Coconino are expected to make little or no water. In particular, drifts designed to access the main orebody will be completed in Hermit Shale or very low permeability Supai Formation materials and are expected to have an insignificant impact on the surrounding hydrogeology.
Because drifts will be designed to drain toward the shaft, any water seeping into the drifts will drain or be pumped to the lined sump at the base of the shaft. In general, drifts are expected to act much like horizontal wells and to collect, rather than discharge, water from surrounding materials.
16.5 Preproduction Schedule
Mine development recommenced at the site in mid 2022 and is ongoing. There are 1,595 ft of waste development before preproduction ore development commences. The ventilation raise construction is scheduled for June and July 2023 and this will be followed by installation of the ventilation facilities and emergency hoist pad.
SLR recommends that the ventilation raise development contractor be selected and the work scheduled to avoid delays in the project implementation.
16.6 Life of Mine Plan
The LOM development and ore production plan is summarized in Table 16-1. Mine development takes four months and the first development ore is hoisted and sent for processing in Month 5 of Year 0. The LOM production plan is shown in Table 16-2. Ore production totals 134,464 tons grading 0.58% U3O8 and containing 1.57 Mlb of uranium oxide. The total LOM recovered uranium oxide production totals 1.5 Mlb. Once ore production commences, mining is scheduled to be complete in 28 months.
Daily rock production averages 143 stpd of ore and 41 stpd of waste over the life of mine. The maximum daily production from the mine is 343 tons of ore plus waste.
This mine plan covers the Main zone only. There are uranium Mineral Resources in the Jupiter Zone that exist below the Main Zone.
Table 16-1: Life of Mine Development and Production Plan
Energy Fuels Inc. - Pinyon Plain Project
| | Ore Hoisted
(tons) | Waste
Hoisted
(tons) | Raise
Cuttings
Hoisted
(tons) | Total
Material
Hoisted
(tons) | Waste
Development
(ft) | Ventilation
Raise
(ft) | Total
Waste
(ft) |
Year 0 | Month 1 | - | 3,475 | | 3,475 | 424 | | 424 |
| Month 2 | - | 414 | | 414 | 51 | | 51 |
| Month 3 | - | 2,754 | | 2,754 | 336 | | 336 |
| Month 4 | - | 6,426 | | 6,426 | 784 | | 784 |
| Month 5 | 2,013 | 5,246 | | 7,259 | 640 | | 640 |
| Month 6 | 3,501 | 4,877 | 1,992 | 10,370 | 595 | 484 | 1,079 |
| Month 7 | 1,052 | 5,582 | 3,629 | 10,263 | 681 | 881 | 1,562 |
| Month 8 | 2,138 | 3,852 | | 5,991 | 470 | | 470 |
| Month 9 | 4,376 | 1,335 | | 5,711 | 128 | | 128 |
| Month 10 | 8,750 | - | | 8,750 | - | | - |
| Month 11 | 5,250 | 459 | | 5,709 | 56 | | 56 |
| Month 12 | 5,250 | 1,377 | | 6,627 | 168 | | 168 |
Year 1 | Month 1 | 5,250 | 344 | | 5,594 | 42 | | 42 |
| Month 2 | 7,000 | 66 | | 7,066 | 8 | | 8 |
| Month 3 | 8,750 | 1,887 | | 10,637 | 230 | | 230 |
| Month 4 | 7,000 | - | | 7,000 | - | | - |
| Month 5 | 6,164 | - | | 6,164 | - | | - |
| Month 6 | 8,750 | 267 | | 9,017 | 33 | | 33 |
| Month 7 | 5,250 | - | | 5,250 | - | | - |
| Month 8 | 7,000 | - | | 7,000 | - | | - |
| Month 9 | 7,000 | - | | 7,000 | - | | - |
| Month 10 | 7,000 | - | | 7,000 | - | | - |
| Month 11 | 5,250 | - | | 5,250 | - | | - |
| Month 12 | 5,250 | - | | 5,250 | - | | - |
Year 2 | Month 1 | 5,250 | - | | 5,250 | - | | - |
| Month 2 | 7,000 | - | | 7,000 | - | | - |
| Month 3 | 7,264 | 459 | | 7,723 | 56 | | 56 |
| Month 4 | 2,426 | 157 | | 2,583 | 19 | | 19 |
| Month 5 | 530 | - | | 530 | - | | - |
Total | | 134,464 | 38,978 | 5,621 | 179,063 | 4,720 | 1,365 | 6,085 |
Table 16-2: Life of Mine Production Plan
Energy Fuels Inc. - Pinyon Plain Project
| | Total Mill Feed
Processed
(tons) | Head
Grade, U3O8
(%) | Contained
U3O8
(lb) | Average
Metallurgical
Recovery
(%) | Recovered
U3O8
(lb) | U3O8
Sales
(lb) |
Year 0 | Month 5 | 2,013 | 0.37 | 15,051 | 96 | 14,449 | 14,449 |
| Month 6 | 3,501 | 0.37 | 26,178 | 96 | 25,131 | 25,131 |
| Month 7 | 1,052 | 0.58 | 12,155 | 96 | 11,669 | 11,669 |
| Month 8 | 2,138 | 0.61 | 25,972 | 96 | 24,933 | 24,933 |
| Month 9 | 4,376 | 0.61 | 53,203 | 96 | 51,074 | 51,074 |
| Month 10 | 8,750 | 0.61 | 106,523 | 96 | 102,262 | 102,262 |
| Month 11 | 5,250 | 0.61 | 63,914 | 96 | 61,357 | 61,357 |
| Month 12 | 5,250 | 0.61 | 64,137 | 96 | 61,571 | 61,571 |
Year 1 | Month 1 | 5,250 | 0.70 | 73,027 | 96 | 70,105 | 70,105 |
| Month 2 | 7,000 | 0.69 | 96,548 | 96 | 92,686 | 92,686 |
| Month 3 | 8,750 | 0.68 | 118,192 | 96 | 113,465 | 113,465 |
| Month 4 | 7,000 | 0.55 | 76,646 | 96 | 73,581 | 73,581 |
| Month 5 | 6,164 | 0.58 | 71,868 | 96 | 68,993 | 68,993 |
| Month 6 | 8,750 | 0.57 | 100,271 | 96 | 96,260 | 96,260 |
| Month 7 | 5,250 | 0.59 | 62,017 | 96 | 59,536 | 59,536 |
| Month 8 | 7,000 | 0.69 | 96,553 | 96 | 92,691 | 92,691 |
| Month 9 | 7,000 | 0.69 | 96,553 | 96 | 92,691 | 92,691 |
| Month 10 | 7,000 | 0.64 | 89,339 | 96 | 85,765 | 85,765 |
| Month 11 | 5,250 | 0.58 | 61,263 | 96 | 58,812 | 58,812 |
| Month 12 | 5,250 | 0.58 | 61,263 | 96 | 58,812 | 58,812 |
Year 2 | Month 1 | 5,250 | 0.49 | 51,143 | 96 | 49,098 | 49,098 |
| Month 2 | 7,000 | 0.48 | 67,396 | 96 | 64,700 | 64,700 |
| Month 3 | 7,264 | 0.46 | 67,480 | 96 | 64,781 | 64,781 |
| Month 4 | 2,426 | 0.19 | 9,046 | 96 | 8,684 | 8,684 |
| Month 5 | 530 | 0.19 | 1,975 | 96 | 1,896 | 1,896 |
Total | | 134,464 | 0.58 | 1,567,711 | 96 | 1,505,003 | 1,505,003 |
16.7 Mine Infrastructure
The Project has significant existing infrastructure and has been used for the storage of surplus materials and equipment from other similar mining projects. The existing infrastructure at the Project includes:
1,470 ft deep, three compartment shaft, measuring 19 ft 6 in by 8 ft 2 in
Shaft stations at depths of 1,230 ft and 1,400 ft below surface
Unsheeted steel headframe
Hoistroom and 400 hp double drum hoist with 10 ft diameter drums
Water tanks
Fuel tanks
455 kVA back up power generators
Six mile 12 kV power line to the site, 12kV/4160 V/480V transformers on site
Evaporation pond
Fenced yard
Offices
Maintenance shop
Air compressor
16.7.1 Mine Shaft and Hoist
The mine shaft is a conventional three compartment shaft; the shaft bottom is at a depth of 1,470 ft. below the collar. Two compartments are for hoisting and the third is for the manway, ventilation duct, and services. A plan view of the shaft is shown in Figure 16-2.
The shaft is equipped with steel sets on 10 ft spacing with wooden guides for conveyances. The shaft collar is at an elevation of 6,506 ft. The 1-3 level is approximately 1,000 ft below the collar, the 1-4 level is approximately 1,230 ft below the collar, and the lowest station is at the 1-5 level, 1,400 ft below the collar. It is currently planned to connect the 1-4 and 1-5 stations via a spiral ramp.
The loading pocket will be installed below the 1-5 station level. A decline to the shaft bottom is planned for shaft bottom clean up.
The shaft is serviced by a Nordberg 400 hp double drum hoist with 10 ft diameter drums grooved for 1.5 in wire rope. The hoisting speed is 800 feet per minute (fpm). The skips will have a capacity of 60 ft3. The head frame is an unsheeted steel structure.

Figure 16-2: Pinyon Plan Mine Shaft Plan View
16.7.2 Mine Ventilation
EFR contracted a consultant to complete the prefeasibility level ventilation design on the Main Zone of the Pinyon Plain mine (Rawlins, 2022). The planned production rate (250 tpd), existing shaft and drift openings, and planned future development drifts (10 ft x 10 ft) were utilized in the design.
EFR contracted a consultant to complete the prefeasibility level ventilation design on the Main Zone of the Pinyon Plain mine (Rawlins, 2022). The existing shaft and drift openings and planned future development drifts (10 ft x 10 ft) were utilized in the design.
The ventilation design follows the production schedule and meets all industry and regulatory standards for mining uranium in the US. Capital and operating costs are based on budgetary quotes based on specifications from the ventilation design.
The calculated air quantity was based on three factors, namely:
1. Diesel equipment fleet requirements
2. Radon exposure from exposed mineralization
3. Mine environmental conditions (heat, dust, noise, etc.).
Other aspects for the mine and ventilation design evaluation included determining acceptable and practical air velocities in intake and return airways.
The ventilation circuit at Pinyon Plain is a push-pull system with fresh air downcast from the Production Shaft and returning through the Ventilation Shaft located in the center of the orebody. The Ventilation Shaft, also referred to as the Return Air Raise (RAR) will be used for secondary egress if needed.
The mine ventilation design determined that the air quantity needed will be 136,000 cubic feet per minute (CFM) to allow for the following requirements:
• Legal aspects such as air supply for diesel equipment.
• Underground workshop air requirements.
• Radon air requirements from exposed mine workings.
• Air leakages.
• Avoiding critical velocities in the upcast shaft.
• Heat loads, including auto-compression effects.
The RAR is planned to have a diameter of eight feet. The surface shaft bend in the RAR ducting will include a hinged hatch that can open to allow an emergency man-cage to pass through the exhaust duct system to descend to the bottom of the ventilation shaft where miners can be loaded and brought to surface in an emergency.
The mine ventilation system was designed for both winter and summer conditions; during winter periods, where air temperatures fall below 32°F, a four million British Thermal Unit per Hour (BTUH) propane heater system will be needed to heat the ambient air to 38°F and force it down the five foot square manway compartment of the Production Shaft using a 250 hp fan. The single variable frequency drive (VFD) force fan will force 140, 000 CFM at 5.6 inches of water gauge (WG), using a 250 hp fan, into the manway compartment of the downcast mine access shaft. Approximately 10,000 CFM will upcast back to surface to allow the shaft collar and systems to remain above freezing during winter periods. The remainder of the fresh air will be pulled down the shaft via the exhaust fans on the RAR.
Fresh air will be distributed to the development and production sections of the mine via secondary force fans (60 hp, 25,000 CFM at 10 inches of WG) through 30-inch diameter rigid steel or rigid plastic type ducting positioned at the RAR through a vent door.
The recommended exhaust fan option includes two fans operating at the same time in both bifurcation legs. Each exhaust fan was specified as 68,000 CFM, 8.7 inches of WG, and motor size of 150 hp.
Ventilation doors will be positioned at mined out areas to minimize leakage and prevent air losses. Forced air fans in production and development areas will also utilize regulators to ensure airflow distribution is maintained and applied where needed. The ventilation design includes for additional allowances such as workshop, overall leakages, auto-compression effects, etc., to maintain both the legal and practical airflow distribution requirements, thereby establishing an effective and efficient operating system for the Main zone.
Figure 16-3 illustrates the ventilation design at Pinyon Plain.

Note: View looking southeast.
Figure 16-3: Pinyon Plain Ventilation Design
16.7.3 Water Management
The mine dewatering facilities consist of:
3 hp submersible shaft pump to move up to 50 gpm from the shaft bottom to the 1-5 station level
10 hp positive displacement pump (20 gpm capacity) with a four inch line from the 1-5 station level to surface
10 hp positive displacement pump (25 gpm capacity) with a two inch line from the1-4 station level to surface
The last pump listed handles the water from the shaft water ring. Mine inflow during care and maintenance has averaged less than 20 gpm. Mine inflow will continue to be collected in underground sumps for use in underground drills and other aspects of underground mining. Any excess water not needed for mine operations that collects in the lined sump will be pumped to the surface impoundment. Excess water from the water rings will be pumped to the surface and treated in existing facilities for beneficial use.
The Project has an existing evaporation pond and permitted rock stockpile areas on surface. It is anticipated that mineralized and non-mineralized rock will be stored in the permitted stockpile areas. No process tailings will be stored at the Project site. During mine operations, it is expected that excess water will be stored in the evaporation pond, or in some cases it may be beneficially used as per Arizona state law.
After closure, the site will be monitored for reclamation performance by state and federal agencies until reclamation is deemed complete and the bond(s) are released.
16.7.4 Compressed Air
Compressed air is supplied from surface from one of three units:
970 CFM Ingersoll Rand rotary screw compressor (SSR EP 200)
1,200 CFM Ingersoll Rand rotary screw compressor (SSR EP 300
1,500 CFM Quincy rotary screw compressor (QS1 1500)
The 970 CFM compressor is sufficient for development and the 1,500 CFM unit is a spare.
16.8 Mine Equipment
Surface support equipment was purchased or rehabilitated in 2022. Equipment purchased or rehabilitated in 2022 included three Bobcat loaders for underground, a surface front end loader, vans for personnel transportation to site, air compressors, a chippy hoist, and water truck which has a blade for snow removal. Additional equipment required for underground mining is listed in Table 16-3.
Table 16-3: Required Underground Mining Equipment Purchases and Rebuilds
Energy Fuels Inc. - Pinyon Plain Project
Equipment | Year 0 |
Stope Drill (Boart Stope Mate-rebuilt) | 1 |
Equipment | Year 0 |
Jackleg Drills (hammers and legs) | 6 |
Skid-Steer Loaders (new Bobcat model S510) | 3 |
LHD (rebuilt JCI 125, 1 ¼ yd) | 2 |
LHD (rebuilt LT 350, 2 ½ yd) | 2 |
Boss Buggy (side-by-side) | 1 |
16.9 Personnel Requirements
Staffing of personnel began in mid-2022 as the Project came out of care and maintenance. The Project is currently in preproduction. Current mine operations personnel provided an estimate of personnel requirements for the life of mine, as summarized in Table 16-4. Production will cease in year 2, after which some of the labor listed will assist in mine reclamation.
Table 16-4: Personnel Requirements
Energy Fuels Inc. - Pinyon Plain Project
Position | Year 0 | Year 1 | Year 2 |
Staff |
Mine Superintendent | 1 | 1 | 1 |
Assistant Mine Superintendent | 1 | 1 | 0 |
Engineer / Surveyor | 0.75 | 1 | 1 |
Geologist / Ore Control | 0.5 | 1 | 1 |
Environmental Scientist/Technician/Safety | 1 | 1 | 1 |
Total | 4.25 | 5 | 4 |
Hourly |
Water Truck / Compliance Technician | 2 | 2 | 2 |
Master Mechanic | 1 | 1 | 0 |
Master Electrician | 1 | 1 | 0 |
Lead Miner | 2 | 2 | 2 |
Miner | 8 | 12 | 2 |
Hoistman | 2 | 2 | 2 |
Toplander | 2 | 2 | 2 |
Electrician | 1 | 2 | 1 |
Mechanic | 3 | 3 | 1 |
Skip Tender | 2 | 2 | 2 |
Total | 24 | 29 | 14 |
17.0 RECOVERY METHODS
Ore mined at the Pinyon Plain Mine (the Project) will be milled at the Energy Fuels’ owned White Mesa Mill located near Blanding, Utah under a toll milling agreement. The White Mesa Mill was originally built in 1980. Since construction, the White Mesa Mill has processed approximately five million tons of uranium and vanadium containing ores from Arizona, Colorado, and Utah. The White Mesa Mill is currently operated on a campaign basis to process uranium ores. It can also process alternate feed materials.
Capable of processing 2,000 short tons per day (stpd), the White Mesa Mill will process ore from the Pinyon Plain Mine Project, mineralized material from other Energy Fuels’ uranium mines as well as potential toll milling mineralized material from other producers in the area, and alternate feed material. This report only addresses the costs and revenues of the Pinyon Plain Mine Project including project specific costs at the White Mesa Mill. The location of the White Mesa Mill is shown in Figure 17-1. The site features of the White Mesa Mill are shown in Figure 17-2.
17.1 Process Description
The White Mesa Mill process flow sheet is shown in Figure 17-3.
ORE RECEIVING
Ore will be hauled to the White Mesa Mill in 24-ton highway haul trucks. When trucks arrive at the White Mesa Mill, they will be weighed and probed prior to stockpiling. Samples will be collected to measure the dry weight, and to perform amenability testing for process control. Trucks will be washed in a contained area, and scanned for alpha, beta, and gamma radiation prior to leaving the White Mesa Mill site.
GRINDING
A front-end loader will transfer the ore from the stockpiles to the White Mesa Mill through the 20-in. stationary grizzly and into the ore receiving hopper. The ore is then transferred to the 6 ft. by 18 ft. diameter semi-autogenous grinding (SAG) mill via a 54-in. wide conveyor belt. Water is added into the SAG mill where the grinding is accomplished. The SAG mill is operated in closed circuit with vibrating screens. The coarse material, P80 +28 mesh (28 openings per linear inch) is returned to the SAG mill for additional grinding and the P80 -28 mesh portion is pumped to the pulp (wet) storage tanks.
LIQUID SOLID SEPARATION
After grinding, it is envisioned that the slurry will be dewatered using a vacuum filter belt. Details are pending on additional liquid solids separation test work.
DRYING AND ROASTING
The proposed copper process includes roasting the ore using a rotary kiln at a temperature of 650°C. Roasted material will be quenched using process solution before it is transferred to the pulp storage tanks before the leaching phase of the process.
LEACHING
From the pulp storage tanks, pre-leach and leaching are employed to dissolve the uranium and copper. A hot, strong acid treatment is utilized in the second stage to obtain adequate recoveries. This results in high concentrations of free acid in solution. Therefore, a first stage "acid kill" is employed, which is referred to as pre-leach. Solutions from the pulp storage tanks is metered into the pre-leach tanks at the desired flow rate. The slurried ore from the pulp storage tanks will usually be about 50% solids. This slurry is mixed in the pre-leach tanks with a strong acid solution from the counter current decantation (CCD) circuit resulting in a density of approximately 22% solids. The pre-leach material is pumped to the pre-leach thickener. Here, flocculent is added and the solids are separated from the liquid. The underflow solids are pumped into the second stage leach circuit where acid, heat, and an oxidant (sodium chlorate) are added. After leaching, the leach slurry is then pumped to the CCD circuit for washing and solid liquid separation. The liquid or solution from the pre-leach thickener overflow is pumped first to the clarifier and then the SX feed tank.
COUNTER CURRENT DECANTATION
The CCD circuit consists of a series of thickeners in which the pulp (underflow) goes in one direction, while the uranium/copper bearing solution (overflow) goes in a counter current direction. Flocculant is added to the feed of each thickener which assists the solids to settle to the bottom of each thickener. As the pulp is pumped from one thickener to the next, it is washed of its uranium and copper values. When the pulp leaves the last thickener, it is essentially barren solids that is disposed of in the tailings cells.
TAILINGS MANAGEMENT
Tailings solutions (approximately 50% solids) are pumped to the tailings cells for permanent disposal. The sands are allowed to settle and the solutions are reused in the milling process. Additional details on the tailings cells and mill water balance are discussed in the White Mesa Mill portion of Section 18 - Project Infrastructure.
SOLVENT EXTRACTION
The primary purpose of the uranium SX circuit is to concentrate the uranium. First, the uranium is transferred from the aqueous acid solution to an immiscible organic liquid by ion exchange. Alamine 336 is a long chain tertiary amine that is used to extract the uranium compound. Then a reverse ion exchange process strips the uranium from the solvent, using aqueous sodium chloride. The uranium SX circuit is utilized to selectively remove the dissolved uranium from the clarified leach solution. Dissolved uranium is loaded on kerosene advancing counter currently to the leach solution. The uranium-loaded kerosene and leach solution are allowed to settle where the loaded organic kerosene floats to the top allowing for separation. The uranium-loaded organic is transferred to the uranium stripping circuit where acidified brine (stripping solution) is added and strips the uranium from the kerosene. Within the SX circuit, the uranium concentrations increase by a factor of four when loading on the kerosene and again by a factor of ten when removed by the stripping solution.
The uranium-barren leach solution, still containing copper, will be transferred to the current vanadium SX circuit which will be converted to a copper SX circuit. The loaded copper strip solution will be transferred to a planned electro-winning circuit and copper will be produced as copper cathodes having a purity of 99.99% copper. The copper cathodes will be stripped from the cathode blanks, packaged and readied for shipment and sale. The final barren strip solution will be returned to the start of the copper SX circuit and recycled. The uranium/copper barren leach solution is pumped back to the CCD circuit to be used as wash water.
With respect to impurities removal, the uranium SX circuit of the White Mesa Mill is highly selective to uranium and consistently produces yellowcake in the 98% to 99% purity range. This includes ores that contain vanadium, arsenic, selenium, and copper which have shown to be problematic with other uranium recovery methods. Initial test work using high grade uranium and copper synthetic leach solutions indicates that the transfer of uranium during copper SX is minimal and following extraction of the uranium the levels should be below detection limits.
The White Mesa Mill has a vanadium recovery circuit, but it is only operated when the head grades are greater than 2 g/L vanadium. This high of a head grade is only expected when the vanadium to uranium ratio is greater than 3:1. Processing for vanadium recovery is not anticipated from the Pinyon Plain Mine ore based on the low vanadium content; therefore, the vanadium SX circuit may be converted to a copper SX circuit simply by changing out the extractant. Processing of copper is still being considered pending the market conditions at the time the ore may be processed.
PRECIPITATION, DRYING, AND PACKAGING
In the precipitation circuit, the uranium, which up to this point has been in solution, is caused to precipitate out of the solution. The addition of ammonia and heat to the precipitation circuit causes the uranium to become insoluble in the brine strip solution. During precipitation, the uranium solution is continuously agitated to keep the solid particles of uranium in suspension. Leaving the precipitation circuit, the uranium, now a solid particle in suspension, is pumped to a two-stage thickener circuit where the solid uranium particles are allowed to settle. From the bottom of the thickener, the precipitated uranium in the form of a slurry at about 50% solids, is pumped to an acid dissolution tank and mixed with wash water. The solution is then precipitated again with ammonia and allowed to settle in the second thickener. The slurry from the second thickener is de-watered in a centrifuge. From this centrifuge, the solid uranium product is augered to the multiple hearth dryer and dried at approximately 1,400ºF. From the dryer, the uranium oxide (U3O8) concentrated to +95%, is stored in a storage bin and packaged in 55-gallon drums. These drums are then labeled and readied for shipment.
17.2 Process Design Criteria
The principal design criteria selected are tabulated below in Table 17-1. The process operation parameters will be finalized following additional metallurgical testing of the uranium and copper SX process.
Table 17-1: Principal Process Operation Criteria
Energy Fuels Resources (USA) Inc. – Pinyon Plan Mine
| General | Criteria |
| Processing rate | 125,000 stpa |
| | 500 stpd |
| Feed grade | 0.65 % uranium
9.0 % copper |
| Uranium circuit | |
| Final grind | 100% passing 28 Mesh |
| Typical sulfuric acid consumption | 350 lb/t |
| | |
| Product assay | 97 % U3O8 |
| Recovery to final concentrate | 95% uranium in feed |

Table 17-1: White Mesa Mill - Location Map
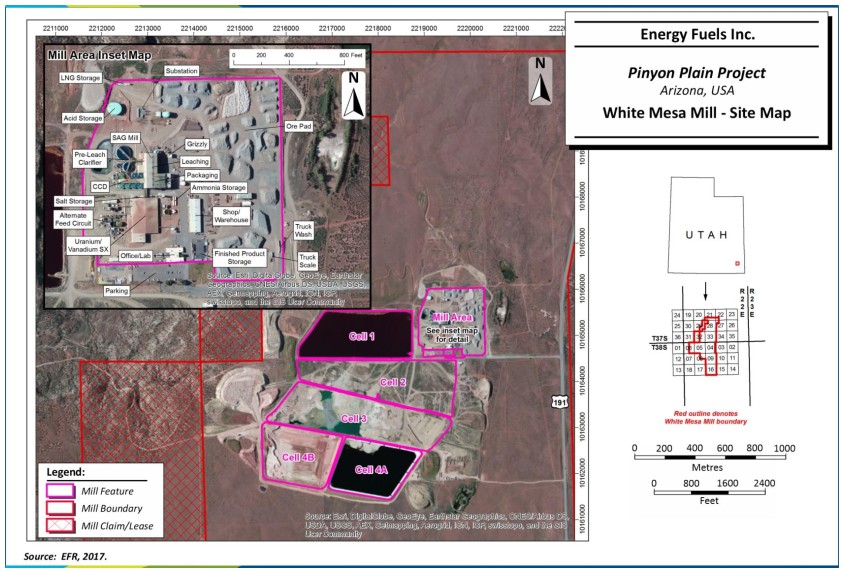
Table 17-2: White Mesa Mill - Site Map

Table 17-3: White Mesa Mill Block Diagram Flow Sheet
18.0 PROJECT INFRASTRUCTURE
Pinyon Plain is a developed site with gravel road access and facilities, including line power. Infrastructure at the Project has been designed to accommodate all mining and transportation requirements. In addition to the mine shaft, existing mine infrastructure includes offices, mine dry, warehousing, air compressor, water lines, development rock storage, standby generators, fueling station, fresh water well, monitor wells and water tanks, a containment pond, electrical power, rapid response services, explosive magazines, equipment utilities, and a workshop. Prior to mine production, EFR will construct the shaft load out, ore pad, ventilation raise, primary ventilation circuit and secondary egress apparatus. The Pinyon Plain Mine Project layout is shown in Figure 18-1.
18.1 Power
Electrical power to Pinyon Plain is available through an existing power line located along Arizona State Highway 64 from the Arizona Public Service (APS). An APS substation provides a six-mile powerline (12 KW) to the mine over a route that parallels the mine access road. Onsite, the power is stepped down to 4160, 480 and other voltages as needed through several transformers to power the hoist motor, pumps, ventilation fans, onsite buildings, and any remaining site power needs.
A 455 KVA diesel generator provides emergency backup power to operate the mine hoist, an air compressor, and the shaft pumps if line power is interrupted.
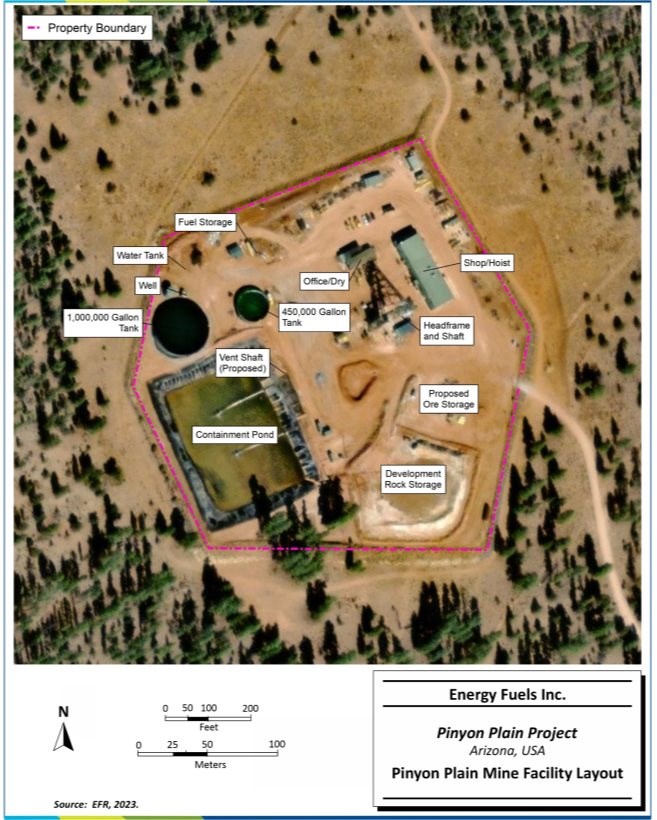
Figure 18-1: Pinyon Plain Mine Facility Layout
19.0 MARKET STUDIES AND CONTRACTS
19.1 Markets
Uranium does not trade on the open market, and many of the private sales contracts are not publicly disclosed since buyers and sellers negotiate contracts privately. Monthly long-term industry average uranium prices based on the month-end prices are published by Ux Consulting, LLC and TradeTech, LLC (TradeTech). EFR primarily utilizes the pricing forecasts from TradeTech, which is considered a leading independent provider of uranium prices and nuclear fuel market information.
19.1.1 Supply
According to the World Nuclear Association (World Nuclear, 2022), world uranium requirements totaled more than 48,300 t U in 2021, with the global pandemic accelerating a trend of slowly-decreasing production:
• 2017 - 60,514 t U
• 2018 - 54,154 t U
• 2019 - 54,742 t U
• 2020 - 47,731 t U
• 2021 - 48,332 t U
The top five producing countries (Kazakhstan, Namibia, Australia, Canada, and Uzbekistan) accounted for over 80% of world production in 2021.
The share of uranium produced by in situ recovery (ISR) mining has steadily increased, mainly due to the addition of ISR operations in Kazakhstan, and now accounts for over 50% of production.
Over half of uranium mine production is from state-owned mining companies, some of which prioritise secure supply over market considerations.
19.1.2 Demand
The primary demand is as a source for nuclear power plants. The use of nuclear power generation plants has become increasingly acceptable politically. Both China and India have indicated an intention to increase the percentage of power generated by nuclear plants. The largest increase in demand will come from those two countries.
Demand for uranium fuel is more predictable than for most other mineral commodities, due to the cost structure of nuclear power generation, with high capital and low fuel costs. Once reactors are built, it is very cost-effective to keep them running at high capacity and for utilities to make any adjustments to load trends by cutting back on fossil fuel use. Demand forecasts for uranium thus depend largely on installed and operable capacity, regardless of economic fluctuations.
The World Nuclear Association website notes that mineral price fluctuations are related to demand and perceptions of scarcity. The price cannot indefinitely stay below the cost of production, nor can it remain at a very high price for longer than it takes for new producers to enter the market and for supply anxiety to subside.
19.1.3 Price
Figure 19-1 and Table 19-1 show TradeTech's latest (Q3 2022) uranium price forecast through 2040 (TradeTech, 2022).
Table 19-1: TradeTech Uranium Market Price Forecast (Real & Nominal US$/lb U3O8)
Energy Fuels Inc. - Pinyon Plain Project
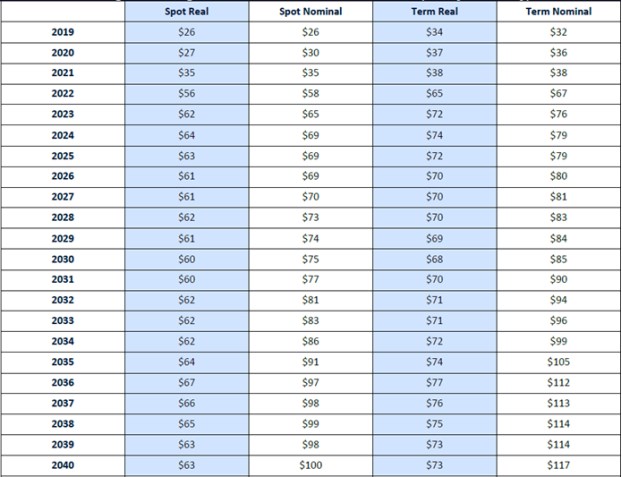

Figure 19-1: TradeTech Uranium Market Price Forecast (Real & Nominal US$/lb U3O8)
The production from the Project is planned to begin within the next five years; uranium spot prices during that time are expected to range between $61/lb and $64/lb. Based on this data, SLR used a constant uranium price of $60/lb for the cash flow analysis.
By their nature, all commodity price assumptions are forward-looking. No forward-looking statement can be guaranteed, and actual future results may vary materially.
19.2 Contracts
EFR has signed uranium sales contracts with major nuclear utilities for a portion of the production from the Project. These contracts provide for sales prices that are expected to be consistent with the prices forecast by TradeTech (Table 19-1) through the period of planned production from the property. In that event, realized uranium prices may be $2 to $4 higher that the $60/lb that SLR has used for the cash flow analysis if the Project operates within this timeframe.
20.0 ENVIRONMENTAL STUDIES, PERMITTING, AND PLANS, NEGOTIATIONS, OR AGREEMENTS WITH LOCAL INDIVIDUALS OR GROUPS
20.1 Environmental Studies
Environmental studies have been completed for the Pinyon Plain Mine as part of the permitting process through state and federal agencies. These studies include components such as land use, climate, geology and mineralization, seismicity, soils, vegetation, air quality, surface water, ground water, wildlife, radiological, and cultural and archaeological resources. There are no ongoing permit-related environmental studies beyond compliance-based data collection and reporting.
20.2 Social and Community Requirements
While development and operation of the Mine requires limited surface disturbance (less than 20 acres) and has minimal environmental impact, the Mine has been particularly contentious among local communities due to factors such as (a) its proximity to Grand Canyon National Park (b) claims by the Havasupai Indian Tribe that the Mine site has significant religious value and (c) its location within the US Bureau of Land Management's (BLMs) 2009 mineral withdrawal of approximately one million acres of public lands around Grand Canyon National Park. A discussion of these issues is presented in more detail below as it relates to project permitting requirements. As stated in its Environment, Health, Safety and Sustainability Policy, Energy Fuels is committed to the operation of its facilities in a manner that puts the safety of its workers, contractors and community, the protection of the environment, and the principles of sustainable development above all else. Accordingly, Energy Fuels considers environmental and social issues which may impact its stakeholders, including minority groups, local landholders, and the communities in which it operates.
20.3 Water Management
The Mine has been designed to have no discharge of fluids, to eliminate the possibility of migration of contaminants to groundwater, and to maintain structural integrity during a 500-year, 24-hour stormwater runoff event. All stormwater runoff from surface operations will be contained within the 17-acre mine site. The entire site is surrounded by diversion structures capable of diverting runoff from areas upslope around the perimeter of the facility from a 500-year, 24-hour storm event (ELMA, 1993). All runoff from precipitation that falls within the bermed Mine site drains to the lined Impoundment, as shown in the Site Plan provided in Figure 2. Surface water drainage within the Mine site is diverted away from the Mine access shaft and will be diverted away from the future ventilation shaft.
Figure 20-1: Process Flow Diagram for Pinyon Plain Mine

20.4 Permitting
In October 1984, Energy Fuels Nuclear submitted a proposed Plan of Operations (PoO) to mine uranium from the Pinyon Plain claims, approximately 7 miles south of Tusayan, Arizona. The US Forest Service (USFS) completed an Environmental Impact Statement (EIS) to evaluate the Plan, including significant comment and input from federally recognized tribes. The final EIS and Record of Decision (ROD) were issued on September 29, 1986, approving the PoO with modifications. Mine site surface preparation activities began in late 1986. Appeals of this decision were made to the Southwestern Regional Forester, and the Chief of the Forest Service, who both affirmed the Forest Supervisor's decision. The Havasupai Tribe and others then sued over this decision in the U.S. District Court for the District of Arizona. The District Court ruled for the USFS on all counts, and a subsequent appeal was filed with the U.S. Court of Appeals for the Ninth Circuit, which affirmed the District Court on August 16, 1991. In 1992, due to the economic downturn in the price of uranium, the Mine was put into standby status.
On September 13, 2011, Denison Mines informed the Kaibab Forest Supervisor they intended to resume operations at Pinyon Plain Mine under the existing PoO and ROD. On June 25, 2012, the USFS completed a review of the Pinyon Plain Mine PoO and associated approval documentation in anticipation of the resumption of operations. The USFS' review concluded that (a) no modification or amendment to the existing PoO was necessary, (b) no correction, supplementation, or revision to the environmental document was required and (c) that operations at the Pinyon Plain Mine could continue as a result of no further federal authorization being required.
On May 22, 2020, after the matters were briefed, the District Court issued its final order in favor of the Defendants, which the Pinyon Plaintiffs thereafter appealed to the Ninth Circuit. In December 2020, the Pinyon Plaintiffs filed their Appellant's Opening Brief with the Ninth Circuit and, in April 2021, the Defendants filed their respective Answering Briefs. Oral arguments were held remotely on August 30, 2021. On February 22, 2022, the Ninth Circuit filed its Opinion in favor of the USFS and the Company. The Pinyon Plaintiffs did not request a hearing on this matter in front of the U.S. Supreme Court. As such, this matter is now resolved.
In 2020, Energy Fuels submitted a clean closure plan to the USFS to provide a description of how the Company will reclaim the mine to clean closure standards after the cessation of mining operations, as contemplated in the USFS-approved PoO, ROD and modifications to the reclamation plan contained in Appendix B of the EIS. The clean closure plan included an update to the reclamation cost estimate, resulting in an increase in the reclamation bond from $461,245 to $1,407,235.
In September 2009, the groundwater General Aquifer Protection Permit (APP) was obtained for the water storage pond from the Arizona Department of Environmental Quality (ADEQ). This permit was up for renewal in 2019, and an application for renewal was timely submitted by the Company in 2019. General APPs were also obtained from ADEQ for the development rock stockpile and intermediate ore stockpile in December 2011 and renewed in 2018. At the request of the ADEQ, the three General APPs were consolidated into an Individual APP on April 28, 2022, which resulted in a supplemental reclamation bond through ADEQ in the amount of $132,581. The Individual APP was amended on October 26, 2022, to establish an alert level (AL) and aquifer quality limit (AQL) for arsenic and an AQL for uranium in a monitoring well completed in the regional Redwall-Muav aquifer. An Air Quality Permit was issued by the ADEQ in March 2011, renewed in 2016, amended in 2017, and renewed in 2021. The Company received EPA's approval under the Clean Air Act National Emissions Standard for Hazardous Air Pollutants (NESHAPs) for the Pinyon Plain Project in September of 2015.
Table 20-1 presents a list of active permits including the approving authority, validity period and expiry dates, status, and indicating if renewal is required or not.
Table 20-1: Environmental Permits for Operation
Energy Fuels Inc. - Pinyon Plain Project
Authority | Obligation/License | Date of
Issue
MM/DD/YY | Expiration
Date
MM/DD/YY | Status |
ADEQ | Class II Air Quality Permit No. 88788 | 10/20/21 | 10/19/26 | Active |
ADEQ | Individual APP, Minor Amendment (No. P-100333) (Includes previously approved; Development Rock Stockpile, Intermediate Ore Stockpile and Non-Stormwater Impoundment) | 10/26/22 | N/A | Active |
ADEQ | AZPDES Stormwater Multi-Sector General Permit - Industrial for Mining (#AZMS79829) | 01/01/20 | 12/31/24 | Active |
ADWR | Well Registration Number 55-515772 (Redwall-Muav Water Supply/Monitoring Well) | 10/07/86 | N/A | Active |
ADWR | Well Registration Numbers 55-924769 through 55-924771 (Coconino Monitoring Wells) | 08/21/20 | N/A | Active |
CCDPH | Permit to Construct No. 5918 (Septic System) | 12/17/86 | N/A | Active |
USEPA | Approval to Construct an Underground Uranium Mine (NESHAPs Subpart B) | 09/21/15 | N/A | Active |
USFS | Record of Decision | 09/26/86 | N/A | Active |
USFS | Road Use Permit | 01/20/23 | 10/31/27 | Active |
20.5 Mineral Examination
In July 2009, the BLM issued a Notice of Proposed Withdrawal (the 2009 Notice) under which it proposed that a total of approximately one million acres of public lands around the Grand Canyon National Park be withdrawn from location and entry under the Mining Law of 1872, subject to valid existing rights, for a period of two years. BLM stated that the purpose of the withdrawal, if determined to be appropriate, would be to protect the Grand Canyon watershed from any adverse effect of locatable hardrock mineral exploration and mining. This timeframe was extended an additional six months in July 21, 2011 to complete the EIS studies. In January 2012, the Secretary of the Interior implemented the withdrawal proposed in the 2009 Notice, subject to valid existing rights, for a 20-year period. Whether or not a mining claim is valid must be determined by a Mineral Examination conducted by BLM or the USFS. The Mineral Examination for the Mine deposit was completed by the USFS on April 18, 2012, and determined that the Pinyon Plain Mine has valid existing rights.
20.6 Negotiations and Agreements with Local Groups
Commitments to Ensure Local Procurement and Hiring
EFR is committed to supporting local businesses and labor markets in the region of their operations.
20.7 Mine Closure Remediation and Reclamation Plans
The costs to reclaim the project to its pre-mining land use is estimated to be approximately US$1,500,000. Reclamation performance bonds are in place with the USFS in the amount of $1,407,235 and through the state of Arizona in the amount of $132,581. At the conclusion of underground operations, the shafts will be backfilled, mine openings will be plugged and sealed, and most of the buildings and infrastructure will be dismantled and removed. The evaporation pond and other infrastructure such as the office trailer, electrical substation, power line, and perimeter fencing and berms are expected to remain on site for an additional 30 years during long-term monitoring of groundwater. At the end of long-term groundwater monitoring, the remaining infrastructure will be removed, wells will be abandoned, and final reclamation and clean closure activities will be completed. The water supply/monitoring well in the Redwall-Muav aquifer is expected to remain in place as a regional water supply well for livestock grazing or other uses as appropriate.
20.8 Opinion of Adequacy
EFR has all of the permits and authorizations necessary to construct, operate, and close the Project. Financial assurance is in place to guarantee reclamation and closure activities will occur. After closure, the site will be monitored for reclamation performance by state and federal agencies until reclamation is deemed complete and the bond(s) are released.
21.0 CAPITAL AND OPERATING COSTS
EFR has experience in operating several similar underground uranium mines on the Arizona Strip, an area located in northern Arizona, north of the Colorado River to the Colorado border. These past producers include Kanab North, Arizona 1, Pinenut, and EZ1 mines.
Based on the American Association of Cost Engineers (AACE) International classifications, Class 3 estimates have an accuracy range between -10% to -20% (low-end) to +10% to +30% (high-end) (AACE International, 2012). The base case capital and operating cost estimates are within the Class 3 ranges and would meet the S-K 1300 standard of ± 25% accuracy and ≤15% contingency.
21.1 Capital Costs
The capital costs for the Mine are estimated to be $10.4 million in current Q4 2022 dollars including $7.6 million in direct capital costs, $1.4 million in contingency, and $1.5 million for reclamation. In light of the short mine life, all sustaining costs are included in operating costs. No escalation was included in the project costs.
21.1.1 Development Capital
The type and size of underground and surface mining equipment was based on EFR's experience at the above mines. Capital costs for each item were sourced from Infomine's Mine Cost Handbook. No rebuild or replacement cost is included, due to the Project's short production schedule (3 years).
Table 21-1 shows the life of mine capital equipment and cost, including surface support equipment.
Table 21-1: Life of Mine Capital Equipment
Energy Fuels Inc. - Pinyon Plain Project
Description | Units | Total Cost |
Mine Development | $ 000 | 3,799 |
Loading Pocket & Installation | $ 000 | 129 |
Underground Equipment | $ 000 | 590 |
Ventilation Fans and heater | $ 000 | 1,726 |
Ventilation Raise | $ 000 | 1,219 |
Surface Works | $ 000 | 140 |
Subtotal UG Capital Before Contingency | $ 000 | 7,603 |
Contingency | $ 000 | 1,145 |
Total UG Capital Costs | $ 000 | 8,748 |
Reclamation | $ 000 | 1,407 |
Total Capital | $ 000 | 10,155 |
Mine development capital was based upon the mine design and a development cost of $1,200/ft. Mine development rates are based on past mining experience of similar EFR mine operations. Mine and ventilation equipment costs are based on budgetary estimates from suppliers with some allowances for additional items. The ventilation raise cost was based upon a 2016 bid for the Project which was escalated to current pricing.
21.1.2 Contingency
Contingency is an amount added to an estimate to allow for items, conditions, or events which are uncertain and that experience shows will likely result, in aggregate, in additional costs which are expected to be expended.
A capital cost contingency estimate was generated by reviewing the development capital cost elements and assigning a percentage of the costs based upon the level of detail in the estimate preparation, the operator's experience, the state of the Project and the QP's experience. The assigned percentages ranged from:
10% for mine development
15% for equipment overhauls and purchases
20% for the main ventilation installation
25% for the ventilation raise, surface ore pad, and emergency hoist preparation
The weighted average overall contingency was estimated to be 15% and this was applied as a single value. The QP considers this to be a reasonable estimate of contingency for this development capital estimate.
21.1.3 Sustaining Capital
Due to the short three year mine life of the Project, no sustaining capital has been budgeted in the estimate.
21.1.4 Working Capital
Working capital estimates assume 30 days account receivable and account payable terms. The Project has a large supply of consumable inventory at the site as EFR has consolidated material from prior mines and projects in the warehouse. Thus, the inventory working capital adjustment is estimated to be zero over LOM. All working capital will be recaptured at the end of mine life, so the net effect of LOM is zero.
21.1.5 Reclamation
Reclamation costs are based on the clean closure and reclamation cost estimate and surety bond, which EFR has with the USFS as the beneficiary. Table 21‑2 shows the reclamation cost at the Pinyon Plain project, which will start approximately three months before the end of mine life and take 20 months in total to complete.
Table 21-2: Reclamation Cost
Energy Fuels Inc. - Pinyon Plain Project
Item | Units | Total Cost |
Infrastructure Removal | $ 000 | 428 |
Future Environmental Monitoring | $ 000 | 45 |
Backfilling | $ 000 | 411 |
Item | Units | Total Cost |
Reclamation Plans & Surveys | $ 000 | 67 |
Subtotal Direct Costs | $ 000 | 951 |
Indirects1 | $ 000 | 314 |
Subtotal Before Contingency | $ 000 | 1,265 |
Contingency (15% of Directs) | $ 000 | 143 |
Total Reclamation Costs | $ 000 | 1,407 |
Notes:
1. Indirects include G&A, Engineering, and Contractor cost.
21.2 Operating Costs
Operating costs are based on EFR's operating experience. Table 21-3 shows the operating costs used in the economic evaluation of the Project.
Table 21-3: Operating Costs Summary
Energy Fuels Inc. - Pinyon Plain Project
Area | Cost | Unit |
Mining | $101.00 | $/ore ton mined |
Haulage | $72.00 | $/ore ton mined |
Processing | $192.00 | $/ore ton mined |
G&A | $7.00 | $/ore ton mined |
TOTAL OPEX | $372.00 | $/ore ton mined |
Notes:
1. Mining costs include labour, supplies, equipment operation, and sundries as well as an allowance for ongoing mine development over the life of the project.
2. Ore haulage covers the cost of trucking ore from the mine to White Mesa mill for toll processing. The contract haulage cost is based on a $0.225/ton mile unit rate and assumes a 5% moisture content of the ore.
3. Processing cost estimate is based on a toll milling arrangement between the Project and the White Mesa Mill.
4. General and Administrative (G&A) costs are based on the assumption that the Project will be supported by existing staff based in EFR's Lakewood, Colorado, office headquarters, with regular site visits as needed during the year. G&A costs, totaling $7.00/ton ore, are estimated as 2.5% of direct operating costs.
5. No contingency applied.
21.2.1 Personnel
Annual headcounts for the three year mine operations are detailed in Table 21-7.
Table 21-4: Processing Operating Costs
Energy Fuels Inc. - Pinyon Plain Project
Area | Year 0 | Year 1 | Year 2 |
Salaried |
Mine Superintendent | 1 | 1 | 1 |
Area | Year 0 | Year 1 | Year 2 |
Assistant Mine Superintendent | 1 | 1 | 0 |
Engineer/Surveyor | 0.75 | 1 | 1 |
Geologist/Ore Control | 0.5 | 1 | 1 |
Environmental Scientist/Technician/Safety | 1 | 1 | 1 |
Subtotal Salaried | 4.25 | 5 | 4 |
Hourly |
Water Truck/Compliance tech | 2 | 2 | 2 |
Master Mechanic | 1 | 1 | 0 |
Master Electrician | 1 | 1 | 0 |
Lead Miner | 2 | 2 | 2 |
Miner | 8 | 12 | 2 |
Hoistman | 2 | 2 | 2 |
Toplander | 2 | 2 | 2 |
Electrician | 1 | 2 | 1 |
Mechanic | 3 | 3 | 1 |
Skip Tender | 2 | 2 | 2 |
Subtotal Hourly | 24 | 29 | 14 |
Total Headcount | 28.25 | 34 | 18 |
22.0 ECONOMIC ANALYSIS
An after-tax Cash Flow Projection has been generated from the Life of Mine production schedule and capital and operating cost estimates, as summarized in Table 22-1. A summary of the key criteria is provided below.
22.1 Economic Criteria
22.1.1 Revenue
Total mill feed processed: 134 thousand tons
Average processing rate: 216 stpd (steady state)
U3O8 head grade: 0.58%
Average mill recovery: 96%
Recovered U3O8: 1.51 Mlb
Metal price: $60/lb U3O8
Yellowcake product trucking cost from the toll mill to customer: $0.175/lb U3O8
22.1.2 Capital and Operating Costs
- Pre-production period: Four months
- Mine life: 24 months
- LOM capital costs, excluding reclamation, of $8.7 million on Q4 2022 US dollar basis
- LOM operating cost (excluding royalties but including severance taxes) of $50.5 million or $372/ton milled on Q4 2022 US dollar basis
22.1.3 Royalties and Severance Taxes
A 3.5% private royalty is payable for the Project based on sliding scale of the value of production expressed in lb/t along with allowances for mining and ore hauling. The royalty payments over the mine life are approximately $1.88/t ore.
Arizona has a severance tax that is 2.5% of the net severance base, which is 50% of the difference between the gross value of production (revenue) and the production costs. Thus, a rate of 1.25% is used to reflect this 50% base reduction. The Arizona severance tax payable to the Project is estimated at $3.70/t ore during LOM.
22.1.4 Income Taxes
EFR states it is not liable for corporate income tax (CIT) expenditures as a corporation, including the period that the Project is expected to operate. In addition, the short mine life of 24 months makes an estimate of income tax payable using a standard tax methodology difficult. Therefore, a proforma CIT estimate was added with the assumption that the Project was a stand-alone entity for tax purposes and does not reflect the company's actual filing position with following assumptions:
- A Federal income tax rate of 10.5% is used in this analysis. This rate takes into account the percentage depletion deduction which allows profitable mining companies to reduce their taxable income by 50% and then the remaining amount is taxed at the current Federal tax rate of 21% so that the net rate is 10.5%.
The Arizona state income tax rate is 4.9% so the combined Federal and state rate is 15.4%%
The tax amounts may be negative some months as the pre-tax cash flow dips below zero. However, as taxable income is computed on an annual basis and as the annual amounts for the first 24 months are all positive, the sum of the monthly tax amounts will be positive. In the remaining 24 months after the mine ceases operation, there are negative cash flows which can be carried back to profitable years to receive a tax refund. Thus, the project total income tax is the pre-tax cash flow x 15.4%.
CIT payable for LOM totals $6.0 million.
22.2 Cash Flow Analysis
The Project production schedule is presented in Figure 22-1 and the resulting after-tax free cash flow profile is shown in Figure 22-2.

Figure 22-1: Annual Mine Production
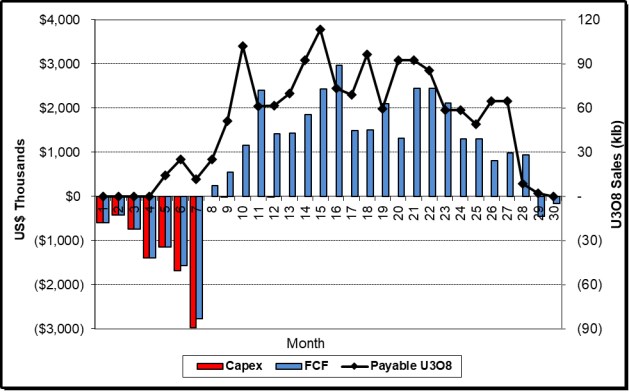
Figure 22-2: After-Tax Metrics Summary
Table 22-1 presents a summary of the Project economics at an average U3O8 price of $60.00/lb. The full annual cash flow model is presented in Appendix 1.
On a pre-tax basis, the undiscounted cash flow totals $29.1 million over the mine life. The pre-tax Net Present Value (NPV) at a 5% discount rate is $26.7 million and the Internal Rate of Return (IRR) is 14%.
On an after-tax basis, the undiscounted cash flow totals $23.0 million over the mine life. The after-tax NPV at 5% discount rate is $21.1 million and the IRR is 12%.
LOM Project cost metrics are as follows:
• Cash Operating Costs: $33.91/lb U3O8
• All-in Sustaining Costs: $34.84/lb U3O8
• All-in Costs: $40.66/lb U3O8
Table 22-1: After-Tax Cash Flow Summary
Energy Fuels Inc. - Pinyon Plain Project
Item | Unit | Value |
U3O8 Price | $/lb | $60.00 |
U3O8 Sales | klb | 1,505 |
Total Gross Revenue | US$ 000 | 90,300 |
Product Transport to Market | US$ 000 | (263) |
Royalties | US$ 000 | (253) |
Total Net Revenue | US$ 000 | 89,783 |
Mining Cost | US$ 000 | (13,581) |
Ore Trucking Cost | US$ 000 | (9,681) |
Process Cost | US$ 000 | (25,817) |
G & A Cost | US$ 000 | (941) |
Severance Tax | US$ 000 | (497) |
Total Operating Costs | US$ 000 | (50,518) |
Operating Margin | US$ 000 | 39,266 |
Corporate Income Tax | US$ 000 | (6,046) |
Working Capital | US$ 000 | 0 |
Operating Cash Flow | US$ 000 | 33,220 |
Development Capital | US$ 000 | (8,748) |
Closure/Reclamation Capital | US$ 000 | (1,407) |
Total Capital | US$ 000 | (10,155) |
| | |
Pre-tax Free Cash Flow | US$ 000 | 29,110 |
Pre-tax NPV @ 5% | US$ 000 | 26,682 |
Pre-tax NPV @ 8% | US$ 000 | 25,318 |
Pre-tax NPV @ 12% | US$ 000 | 23,602 |
Pre-tax IRR | % | 14% |
| | |
After-tax Free Cash Flow | US$ 000 | 23,064 |
After-tax NPV @ 5% | US$ 000 | 21,072 |
After-tax NPV @ 8% | US$ 000 | 19,954 |
After-tax NPV @ 12% | US$ 000 | 18,545 |
After-tax IRR | % | 12% |
Item | Unit | Value |
Cash Operating Costs | $/lb U3O8 | 33.91 |
All-in Sustaining Costs | $/lb U3O8 | 34.84 |
All-in Costs | $/lb U3O8 | 40.66 |
22.3 Sensitivity Analysis
Project risks can be identified in both economic and non-economic terms. Key economic risks were examined by running cash flow sensitivities calculated over a range of variations based on realistic fluctuations within the listed factors:
U3O8 price: 10% increments between $51/lb and $76/lb
Head grade: -/+ 20%
Recovery: -20%/+4% (96% is base case already)
Operating cost per ton milled: -10% to 25% (AACE Class 3 range)
Capital cost: -10% to 25% (AACE Class 3 range)
The after-tax cash flow sensitivities for the base case are shown in Table 22-2, Figure 22-3, and Figure 22-4. The Project is most sensitive to head grade, uranium price, and recovery, and only slightly less sensitive to operating cost and capital cost at a Class 3 accuracy level. The sensitivities to metallurgical recovery, head grade, and metal price are nearly identical.
Table 22-2: After-tax Sensitivity Analysis
Energy Fuels Inc. - Pinyon Plain Project
Factor Change | U3O8 Price
(US$/lb) | NPV at 5%
(US$ 000) | IRR
(%) |
0.80 | $48 | $6,996 | 6% |
0.90 | $54 | $14,034 | 9% |
1.00 | $60 | $21,072 | 12% |
1.10 | $66 | $28,111 | 15% |
1.20 | $72 | $35,149 | 17% |
Factor Change | Head Grade
(% U3O8) | NPV at 5%
(US$ 000) | IRR
(%) |
0.80 | 0.47% | $7,066 | 6% |
0.90 | 0.52% | $14,072 | 10% |
1.00 | 0.58% | $21,072 | 12% |
1.10 | 0.64% | $28,074 | 15% |
1.20 | 0.70% | $35,073 | 17% |
Factor Change | Metallurgical Recovery
(%) | NPV at 5%
(US$ 000) | IRR
(%) |
0.80 | 77% | $7,037 | 6% |
0.90 | 86% | $14,055 | 10% |
1.00 | 96% | $21,072 | 12% |
1.03 | 98% | $22,827 | 13% |
1.04 | 100% | $23,879 | 13% |
Factor Change | Operating Costs
(US$/ton milled) | NPV at 5%
(US$ 000) | IRR
(%) |
0.90 | $45,019 | $24,988 | 14% |
0.95 | $47,520 | $23,030 | 13% |
1.00 | $50,021 | $21,072 | 12% |
1.13 | $56,273 | $16,178 | 10% |
1.25 | $62,526 | $11,284 | 8% |
Factor Change | Capital Costs
(US$ M) | NPV at 5%
(US$ 000) | IRR
(%) |
0.90 | $9,481 | $21,928 | 13% |
0.95 | $9,930 | $21,500 | 13% |
1.00 | $10,378 | $21,072 | 12% |
1.13 | $11,500 | $20,002 | 11% |
1.25 | $12,621 | $18,932 | 10% |

Figure 22-3: After-tax NPV 5% Cash flow Sensitivity

Figure 22-4: After-tax IRR Cash flow Sensitivity
23.0 ADJACENT PROPERTIES
23.1 Other Breccia Pipes
There are two mineralized breccia pipes near the Pinyon Plain Mine. The Black Box and the New Years pipes are exploration properties located within two miles of Pinyon Plain. Drilling on both these pipes in the 1980s indicate the presence of uranium and some copper mineralization, but it was determined that neither had economic quantities of either mineral. The Orphan Mine, located approximately 13 miles north-northwest of Pinyon Plain produced both copper and uranium during its production run between 1956 and 1969. EFR has successfully mined and reclaimed the Pinenut and Arizona 1 breccia pipes, both of which are located on the north rim of the Grand Canyon.
The QP has not independently verified this information and this information is not necessarily indicative of the mineralization at the Pinyon Plain Project.
24.0 OTHER RELEVANT DATA AND INFORMATION
EFR knows of no other relevant data related to the Pinyon Plain Project.
25.0 INTERPRETATION AND CONCLUSIONS
SLR offers the following interpretations and conclusions on the Project:
25.1 Geology and Mineral Resources
• Mineral Resources have been classified in accordance with the definitions for Mineral Resources in S-K 1300, which are consistent with Canadian Institute of Mining, Metallurgy and Petroleum (CIM) Definition Standards for Mineral Resources and Mineral Reserves dated May 10, 2014 (CIM, 2014) definitions which are incorporated by reference in NI 43-101.
• In the SLR QP's opinion, the assumptions, parameters, and methodology used for the Pinyon Plain Mineral Resource estimate is appropriate for the style of mineralization and mining methods.
• The SLR QP is of the opinion the block models are adequate for public disclosure and to support mining activities. The effective date of the Mineral Resource estimate is December 31, 2022.
• Mineral Resource estimates exclude previously reported uranium mineralization from the Cap and Upper zones as a condition of current Arizona Department of Environmental Quality (ADEQ) Aquifer Protection Permit which limits mining between the elevations of 5,340 ft and 4,508 ft.
• Mineral Resources are based on a $65/lb uranium price at an equivalent uranium (% eU3O8, referring to radiometric logs converted to grades) cut-off grade of 0.30% based on a combination of longhole stoping, shrinkage stoping, and drifting underground mining methods; mineralized material from the Project will be trucked 320 miles to the White Mesa Mill located near Blanding, Utah. Development rock will be temporarily stored on surface, then will be used at the end of mining to fill the voids created by mining the breccia pipe and the developed shafts.
• Indicated uranium Mineral Resources total 37,000 tons at an average grade of 0.95% eU3O8 for a total of 703,000 lb U3O8. Inferred Mineral Resources total 5,000 tons at an average grade of 0.50% eU3O8 for a total of 48,000 lb U3O8.
• Sampling and assaying procedures have been adequately completed and carried out using industry standard quality assurance/quality control (QA/QC) practices. These practices include, but are not limited to, sampling, assaying, chain of custody of the samples, sample storage, use of third-party laboratories, standards, blanks, and duplicates.
• The SLR QP considers the estimation procedures employed at Pinyon Plain, including compositing, top-cutting, variography, block model construction, and interpolation to be reasonable and in line with industry standard practice.
• The SLR QP finds the classification criteria to be reasonable.
25.2 Mining and Mineral Reserves
• Mineral Reserve estimates, as prepared by EFR and reviewed and accepted by SLR, have been classified in accordance with the definitions for Mineral Reserves in S-K 1300 which are consistent with CIM (2014) definitions which are incorporated by reference in NI 43-101.
• The Proven and Probable Mineral Reserve estimate is 134,500 tons grading 0.58% U3O8 containing 1.57 Mlb of U3O8 and is comprised of 7,800 tons grading 0.33% U3O8 of Proven Mineral Reserves containing 0.05 Mlb of U3O8 plus 136,700 tons grading 0.60% U3O8 of Probable Mineral Reserves containing 1.52 Mlb of U3O8
• The Mineral Reserves are based upon a cut-off grade of 0.32% U3O8.
• Mineral Reserves were estimated based on stope designs utilizing a mine planning software within a 0.15% U3O8 wireframe.
• The Mineral Reserves include 35% dilution at zero grade.
• Measured Mineral Resources were converted to Proven Mineral Reserves and Probable Mineral Resources were converted to Probable Mineral Reserves.
• No Inferred Mineral Resources were converted into Mineral Reserves.
• The existing shaft will be used for the mine access and rock hoisting.
• The ore will be mined using longhole stoping for the majority of the ore and breasting of roofs and/or ribs for narrow mineralized zones.
• Ore will be mucked and hauled by load-haul-dump (LHD) loaders to a grizzly over the loading pocket feed.
• A ventilation raise will be bored in the centre of the orebody to provide an exhaust airway and emergency egress.
The SLR QP is not aware of any mining, metallurgical, infrastructure, permitting, or other relevant factors that could materially affect the Mineral Reserve estimate.
25.3 Mineral Processing
• There is sufficient metallurgical testing to support a uranium process recovery of 96% at the White Mesa Mill.
• The metallurgical test results provided by White Mesa Mill Laboratory personnel indicated that metallurgical recoveries using optimum roasting and leach conditions will be approximately 96% for uranium. The White Mesa Mill has a significant operating history for the uranium solvent extraction (SX) circuit which includes processing of relatively high copper content with no detrimental impact to the uranium recovery or product grade.
25.4 Infrastructure
• There is suitable existing or planned infrastructure to support the planned operations.
25.5 Environment
• EFR has secured all of the permits required to construct, operate, and close the Pinyon Plain Project.
o Some permits require regular update/renewal.
o These permits involved significant public participation opportunity.
• Financial assurance is in place to guarantee all reclamation will occur. This amount will be reviewed on a regular basis (at least every five years) to cover any changes at site and/or for any inflationary issue(s).
In SLR's opinion, there are not any significant risks and uncertainties that could reasonably be expected to affect the reliability or confidence in the exploration information, mineral resource, or mineral reserve estimates, or projected economic outcomes.
26.0 RECOMMENDATIONS
SLR offers the following recommendations regarding the advancement of the Project.
26.1 Geology and Mineral Resources
1. Convert Inferred Mineral Resources to Indicated Mineral Resources within the Main-Lower and Juniper zones by completing underground delineation drilling program per the estimated budget shown in Table 26-1.
Table 26-1: 2023 Proposed Underground Drilling Budget for Main-Lower and Juniper Zones
Energy Fuels Inc. - Pinyon Plain Project
Category | Number of Drill
Holes/Assay | Total Feet
Drilled | Unit Cost | Budget |
(US$/ft) | (US$) |
Underground Delineation Drilling | 45 | 11,250 | 31.00 | 349,000 |
26.2 Mining and Mineral Reserves
1. Continue preproduction development and preparations for production.
2. Develop grade control and production reconciliation procedures.
3. Develop a program of monitoring the geotechnical conditions in the stopes and development headings.
4. Monitor the water inflow rate of the ventilation raise pilot hole.
5. Prepare contingency plans for mine dewatering in the event that the ventilation raise encounters a water bearing strata.
6. Prepare contingency plans for additional dewatering due to water inflow to the ventilation raise.
Select the ventilation raise contractor and confirm the schedule for the work.
7. Secure contractor proposals for the ventilation raise development and prepare for development.
26.3 Mineral Processing
1. Investigate modifications require to recover copper at White Mesa Mill.
26.4 Infrastructure
None
26.5 Environment
1. Consider development of an environmental management system that lists environmental roles and responsibilities of site personnel, permit conditions, and monitoring requirements for use should someone else unfamiliar with environmental matters have to perform them.
2. Establish a reclamation revegetation test plot program to ensure species selected will work at the site.
27.0 REFERENCES
AACE International, 2012. Cost Estimate Classification System - As Applied in the Mining and Mineral Processing Industries, AACE International Recommended Practice No. 47R-11, 17 p.
ANSTO Minerals, 2017 Progress Note 1, Processing of Pinyon Plain Mine Ore, Dated May 16, 2017, ANSTO Minerals, 2017 Progress Note 2-Update on Batch Tests; Processing of Pinyon Plain Mine Ore, Dated June 14, 2017
Bennett, D. (n.d.). Orphan Mine. Retrieved November 2021, from Nature, Culture and History at the Grand Canyon: https://grcahistory.org/history/logging-mining-and-ranching/mining/orphan-mine/
Canadian Institute of Mining, Metallurgy and Petroleum (CIM), 2014: CIM Definition Standards for Mineral Resources and Mineral Reserves, adopted by CIM Council on May 10, 2014.
Cottrell, J.T., 1994, Internal Memorandum to I.W. Mathisen on Canyon Resource - 1994 Changes; written for Energy Fuels Nuclear, Inc., unpublished, June 27, 1994.
Dames and Moore, 1987: Evaluation of Underground Mine Stability and Subsidence Potential, Proposed Pinyon Plain Mine, Arizona.
Electronic Code of Federal Regulations, Title 17: Commodity and Securities Exchanges, Chapter II, Part 229 Standard Instructions for Filing Forms Under Securities Act of 1933, Securities Exchange Act of 1934 and Energy Policy and Conservation Act of 1975- Regulation S-K. (https://www.ecfr.gov/cgi-bin/text-idx?amp;node=17:3.0.1.1.11&rgn=div5#se17.3.229_11303)
Energy Fuels, 2016, Standard Operating Procedure: Core Handling, Sampling and QA/QC Protocols for Core Drilling at the Pinyon Plain Mine, internal report.
Energy Fuels, 2020, Application to Consolidate Existing Environmental Protections in an Individual Aquifer Protection Permit for the Pinyon Plain Mine, submitted to Arizona Department of Environmental Quality, November 11, 2020, Section 1.4.7, page 23.
Finch, W.I., 1992, Descriptive Model of Solution-Collapse Breccia Pipe Uranium Deposits, in, Bliss, J.D., ed., Developments in Mineral Deposit Modeling, U.S. Geological Survey Bulletin 2004, p. 33-35.
RME Consulting, 2022: Pinyon Plain & Juniper Underground Mine Ventilation Design, (August, 2022).
RPA, 2017: Technical Report on the Canyon Mine, Coconino County, Arizona, USA, RPA NI 43-101 report prepared for Energy Fuels Inc. Available at www.sedar.com
Mathisen, I.W., Jr., 1985, Internal Memorandum, written for Energy Fuels Nuclear, Inc., unpublished, January 15, 1985.
Mining Cost Service, 2021, Transportation, InfoMine USA, Inc. Section TR, Appendix A, p. TR A5.
Montgomery, E.L., et al., 1985, Appendix F -Groundwater Conditions Canyon Mine Region, Coconino County, Arizona, Draft Environmental Impact Statement Canyon Uranium Mine, p. 206
Parsons Behle & Latimer, 2022, Mining Claim Status Report - Pinyon Plain Mine, Coconino County, Arizona, letter report to Energy Fuels Resources (USA) Inc., January 19, 2022, 8 pp.
Pool, T.C., and Ross, D.A., 2012: Technical Report on the Arizona Strip Uranium Projects, Arizona, USA, RPA NI 43-101 Report prepared for Energy Fuels Inc. (June 27,2012), Available at www.sedar.com
Price, J.W. and Schwartz, R.L., 2018, Hazen Research Project 12493 Demonstration of Copper Extraction from Canyon Mine Uranium-Copper Ore, Revison1, prepared for Energy Fuels Resources, Inc, December 11, 2018, p. 313.
Scott, J.H., 1962: GAMLOG A Computer Program for Interpreting Gamma-Ray Logs; United States Atomic Energy Commission, Grand Junction Office, Production Evaluation Division, Ore Reserves Branch, TM-179, September 1962.
Shumway, L., 2017: Energy Fuels Nuclear, Inc. Internal Memorandum dated June 9, 2017
SLR, 2022, Technical Report on the Pinyon Plain Project, Coconino County, Arizona, USA, SLR NI 43-101 / S-K 1300 report prepared for Energy Fuels Inc., p. 119, Available at www.sedar.com
TradeTech, LLC, 2022: Uranium Market Study, 2022: Issue 4.
US Department of Agriculture, Forest Service, Southwestern Region, Kaibab National Forest, 1985: Draft Environmental Impact Statement, Pinyon Plain Uranium Mine, Appendix F Groundwater Conditions.
US Securities and Exchange Commission, 2018: Regulation S-K, Subpart 229.1300, Item 1300 of Regulation S-K, Disclosure by Registrants Engaged in Mining Operations and Item 601 (b)(96) of Regulation S-K, Technical Report Summary.
Wenrich, K.J., and Sutphin, H.B., 1989, Lithotectonic setting necessary for formation of a uranium rich, solution collapse breccia pipe province, Grand Canyon Region, Arizona, in Metallogenesis of uranium deposits; Technical committee meeting on metallogenesis of uranium deposits, organized by the International Atomic Energy Agency, Vienna, 9-12 March 1987, p. 307-344
Wenrich, K.J., 1992, Breccia Pipes in the Red Butte Area of the Kaibab National Forest, Arizona, U.S. Geological Survey, Open File Report 92-219, p. 14
World Nuclear, 2021. Uranium Production Figures, 2011-2020. Updated September 2021. Retrieved December 2021 from World Nuclear Association: https://www.world-nuclear.org/information-library/facts-and-figures/uranium-production-figures.aspx
28.0 DATE AND SIGNATURE PAGE
This report titled "Technical Report on the Pre-Feasibility Study on the Pinyon Plain Project, Coconino County, Arizona, USA" with an effective date of December 31, 2022, was prepared and signed by the following authors:
| | (Signed & Sealed) Mark B. Mathisen |
| | |
| | |
| Dated at Lakewood, CO | Mark B. Mathisen, CPG |
| March 6, 2024 | |
| | |
| | (Signed & Sealed) R. Dennis Bergen |
| | |
| | |
| Dated at Toronto, ON | R. Dennis Bergen, P.Eng. |
| March 6, 2024 | |
| | |
| | (Signed & Sealed) Jeffrey Woods |
| | |
| | |
| Dated at Sparks, NV | Jeffrey L. Woods, MMSA QP |
| March 6, 2024 | |
| | |
| | (Signed & Sealed) Lee (Pat) Gochnour |
| | |
| | |
Dated at Aberdeen, WA | Lee (Pat) Gochnour, MMSA QP |
| March 6, 2024 | |
| | |
| | (Signed & Sealed)Grant A. Malensek |
| | |
| | |
| Dated at Lakewood, CO | Grant A. Malensek, M.Eng., P.Eng. |
| March 6, 2024 | |
29.0 CERTIFICATE OF QUALIFIED PERSON
29.1 Grant A. Malensek
I, Grant A. Malensek, M.Eng., P.Eng., as an author of this report entitled"Technical Report on the Pre-Feasibility Study on the Pinyon Plain Project, Coconino County, Arizona, USA" with an effective date of December 31, 2022, prepared for Energy Fuels Inc., do hereby certify that:
1. I am Technical Director – US Mining Advisory with SLR International Corporation, of Suite 100, 1658 Cole Boulevard, Lakewood, CO, USA 80401.
2. I am a graduate of the University of British Columbia, Canada, in 1987 with a B.Sc. degree in Geological Sciences and Colorado School of Mines, USA in 1997 with a M.Eng. degree in Geological Engineering.
3. I am registered as a Professional Engineer/Geoscientist in the Province of British Columbia (Reg.# 23905). I have worked as a mining engineer for a total of 26 years since my graduation. My relevant experience for the purpose of the Technical Report is:
• Feasibility, Prefeasibility, and scoping studies
• Fatal flaw, due diligence, and Independent Engineer reviews for equity and project financings
• Financial and technical-economic modelling, analysis, budgeting, and forecasting
• Property and project valuations
• Capital cost estimates and reviews
• Mine strategy reviews
• Options analysis and project evaluations in connection with mergers and acquisitions
4. I have read the definition of "qualified person" set out in National Instrument 43-101 (NI 43-101) and certify that by reason of my education, affiliation with a professional association (as defined in NI 43-101) and past relevant work experience, I fulfill the requirements to be a "qualified person" for the purposes of NI 43-101.
5. I visited the Pinyon Plain Project on October 27, 2022.
6. I am responsible for Sections 1.2, 1.3.12, 1.3.14, 19, 21, 22, and 30, and contributions to Section 27 of the Technical Report.
7. I am independent of the Issuer applying the test set out in Section 1.5 of NI 43-101.
8. I was the Project Manager for the report entitled "Technical Report on the Pre-Feasibility Study on the Pinyon Plain Project, Coconino County, Arizona, USA" with an effective date of December 31, 2021.
9. I have read NI 43-101, and the Technical Report has been prepared in compliance with NI 43-101 and Form 43-101F1.
10. At the effective date of the Technical Report, to the best of my knowledge, information, and belief, the Sections 1.2, 1.3.11, 1.3.13, 19, 21, 22, and 30 of the Technical Report for which I am responsible contain all scientific and technical information that is required to be disclosed to make the Technical Report not misleading.
Dated this 6th day of March, 2024
(Signed & Sealed)Grant A. Malensek
Grant A. Malensek, M.Eng., P.Eng.
29.2 Mark B. Mathisen
I, Mark B. Mathisen, C.P.G., as an author of this report entitled "Technical Report on the Pre-Feasibility Study on the Pinyon Plain Project, Coconino County, Arizona, USA" with an effective date of December 31, 2022, prepared for Energy Fuels Inc., do hereby certify that:
1. I am Principal Geologist with SLR International Corporation, of Suite 100, 1658 Cole Boulevard, Lakewood, CO, USA 80401.
2. I am a graduate of Colorado School of Mines in 1984 with a B.Sc. degree in Geophysical Engineering.
3. I am a Registered Professional Geologist in the State of Wyoming (No. PG-2821), a Certified Professional Geologist with the American Institute of Professional Geologists (No. CPG-11648), and a Registered Member of SME (RM #04156896). I have worked as a geologist for a total of 24 years since my graduation. My relevant experience for the purpose of the Technical Report is:
• Mineral Resource estimation and preparation of NI 43-101 Technical Reports.
• Director, Project Resources, with Denison Mines Corp., responsible for resource evaluation and reporting for uranium projects in the USA, Canada, Africa, and Mongolia.
• Project Geologist with Energy Fuels Nuclear, Inc., responsible for planning and direction of field activities and project development for an in situ leach uranium project in the USA. Cost analysis software development.
• Design and direction of geophysical programs for US and international base metal and gold exploration joint venture programs.
4. I have read the definition of "qualified person" set out in National Instrument 43-101 (NI 43-101) and certify that by reason of my education, affiliation with a professional association (as defined in NI 43-101) and past relevant work experience, I fulfill the requirements to be a "qualified person" for the purposes of NI 43-101.
5. I visited the Pinyon Plain Project on November 16, 2021.
6. I am responsible for Sections 1.1.1.1, 1.1.2.1, 1.3.1- 1.3.7, 2-12, 14, 23, 24, 25.1, and 26.1, and contributions to Section 27 of the Technical Report.
7. I am independent of the Issuer applying the test set out in Section 1.5 of NI 43-101.
8. I was involved previously with the Project from 2006 to 2012 when serving as Director of Project Resources with Denison Mines. Since the Project was acquired by Energy Fuels Resources (USA) in 2012, I authored the report entitled "Technical Report on the Pre-Feasibility Study on the Pinyon Plain Project, Coconino County, Arizona, USA" with an effective date of December 31, 2021.
9. I have read NI 43-101, and the Technical Report has been prepared in compliance with NI 43-101 and Form 43-101F1.
10. At the effective date of the Technical Report, to the best of my knowledge, information, and belief, the Sections 1.1.1.1, 1.1.2.1, 1.3.1- 1.3.7, 2-12, 14, 23, 24, 25.1, and 26.1, and contributions to Section 27 of the Technical Report contain all scientific and technical information that is required to be disclosed to make the Technical Report not misleading.
Dated this 6th day of March, 2024
(Signed & Sealed) Mark B. Mathisen
Mark B. Mathisen, C.P.G.
29.3 R. Dennis Bergen
I, R. Dennis Bergen, P.Eng., as an author of this report entitled "Technical Report on the Pre-Feasibility Study on the Pinyon Plain Project, Coconino County, Arizona, USA" with an effective date of December 31, 2022, prepared for Energy Fuels Inc., do hereby certify that:
1. I am Associate Principal Mining Engineer with SLR Consulting (Canada) Ltd, of Suite 501, 55 University Ave., Toronto, ON M5J 2H7.
2. I am a graduate of the University of British Columbia, Vancouver, B.C., Canada, in 1979 with a Bachelor of Applied Science degree in Mineral Engineering. I am a graduate of the British Columbia Institute of Technology in Burnaby, B.C., Canada, in 1972 with a Diploma in Mining Technology.
3. I am registered as a Professional Engineer with the Association of Professional Engineers and Geoscientists of the Province of British Columbia (Reg. #16064). I have worked as an engineer for a over 40 years since my graduation. My relevant experience for the purpose of the Technical Report is:
• Practice as a mining engineer, production superintendent, mine manager, Vice President Operations and a consultant in the design, operation, and review of mining operations.
• Review and report, as an employee and as a consultant, on numerous mining operations and projects around the world for due diligence and operational review related to project acquisition and Technical Report preparation.
• Engineering and operating superintendent at the Con gold mine, a deep underground gold mine, Yellowknife, NWT, Canada
• General Manager of the Ketza River Mine, Yukon, Canada
• Vice President Operations in charge of the restart of the Golden Bear Mine, BC, Canada
• General Manager in Charge of the Reopening of the Cantung Mine, NWT, Canada
• Mine Manager at three different mines with open pit and underground operations.
• Consulting engineer (Associate Principal Mining Engineer with RPA, now part of SLR) for over ten years working on project reviews, engineering studies, Mineral Reserve audits, Technical Report preparation, and other studies for a wide range of worldwide projects.
4. I have read the definition of "qualified person" set out in National Instrument 43-101 (NI 43-101) and certify that by reason of my education, affiliation with a professional association (as defined in NI 43-101) and past relevant work experience, I fulfill the requirements to be a "qualified person" for the purposes of NI 43-101.
5. I have not visited the Pinyon Plain Project.
6. I am responsible for 1.1.1.2, 1.1.2.2, 1.3.8, 1.3.9, 15, 16, 25.2, 26.2 and contributions to Section 27 of the Technical Report.
7. I am independent of the Issuer applying the test set out in Section 1.5 of NI 43-101.
8. I have had no prior involvement with the property that is the subject of the Technical Report.
9. I have read NI 43-101, and the Technical Report has been prepared in compliance with NI 43-101 and Form 43-101F1.
10. At the effective date of the Technical Report, to the best of my knowledge, information, and belief, the Sections in the Technical Report for which I am responsible contain all scientific and technical information that is required to be disclosed to make the Technical Report not misleading.
Dated this 6th day of March, 2024
(Signed & Sealed)R. Dennis Bergen
R. Dennis Bergen, P.Eng.
29.4 Jeffery L. Woods
I, Jeffery L. Woods, MMSA QP, as an author of this report entitled "Technical Report on the Pre-Feasibility Study on the Pinyon Plain Project, Coconino County, Arizona, USA" with an effective date of December 31, 2022, prepared for Energy Fuels Inc., do hereby certify that:
1. I am Principal Consulting Metallurgist with Woods Process Services, of 1112 Fuggles Drive, Sparks, Nevada 89441.
2. I am a graduate of Mackay School of Mines, University of Nevada, Reno, Nevada, U.S.A., in 1988 with a B.S. degree in Metallurgical Engineering.
3. I am a member in good standing of Society for Mining, Metallurgy and Exploration, membership #4018591.I have practiced my profession continuously for 35 years since graduation. My relevant experience for the purpose of the Technical Report is:
• Review and report as a consultant on numerous exploration, development, and production mining projects around the world for due diligence and regulatory requirements
• Metallurgical engineering, test work review and development, process operations and metallurgical process analyses, involving copper, gold, silver, nickel, cobalt, uranium, and base metals located in the United States, Canada, Mexico, Honduras, Nicaragua, Chile, Turkey, Cameroon, Peru, Argentina, and Colombia
• Senior Process Engineer for a number of mining-related companies
• Manager and Business Development for a small, privately owned metallurgical testing laboratory in Plano, Texas, USA
• Vice President Process Engineering for at a large copper mining company in Sonora, Mexico
• Global Director Metallurgy and Processing Engineering for a mid-tier international mining company
4. I have read the definition of "qualified person" set out in National Instrument 43-101 (NI 43-101) and certify that by reason of my education, affiliation with a professional association (as defined in NI 43-101) and past relevant work experience, I fulfill the requirements to be a "qualified person" for the purposes of NI 43-101.
5. I have not visited the Pinyon Plain Project.
6. I am responsible for Section 1.1.1.4, 1.1.1.5, 1.1.2.4, 1.3.3, 1.3.10, 1.3.11, 5.5, 13, 17, 18, 25.3, 25.4, 26.3, and 26.4, and contributions to Section 27 of the Technical Report.
7. I am independent of the Issuer applying the test set out in Section 1.5 of NI 43-101.
8. I have had no prior involvement with the property that is the subject of the Technical Report.
9. I have read NI 43-101, and the Technical Report has been prepared in compliance with NI 43-101 and Form 43-101F1.
10. At the effective date of the Technical Report, to the best of my knowledge, information, and belief, the Sections in the Technical Report for which I am responsible contain all scientific and technical information that is required to be disclosed to make the Technical Report not misleading.
Dated this 6th day of March, 2024
(Signed & Sealed)Jeffrey L. Woods
Jeffery L. Woods, MMSA QP
29.5 Lee (Pat) Gochnour
I, Lee (Pat) Gochour, MMSA QP (#01160), as an author of this report entitled "Technical Report on the Pre-Feasibility Study on the Pinyon Plain Project, Coconino County, Arizona, USA" with an effective date of December 31, 2022, prepared for Energy Fuels Inc., do hereby certify that:
1. I am Associate Principal Environmental Specialist, and Principal of Gochnour & Associates, Inc. of 915 Fairway Lane, Aberdeen, Washington, 98520.
2. I am a graduate of Eastern Washington University in 1981 with a B.A. in Park Administration and Land Use Planning.
3. I am a member in good standing of Mining and Metallurgical Society of America. I have practiced my profession continuously for 43 years since graduation. My relevant experience for the purpose of the Technical Report is:
• Vice President of Environmental Services for Pincock, Allen & Holt
• Corporate Environmental Manager for St. Joe Minerals, Bond International Gold, LAC Minerals and MinVen Gold Corporation
• Environmental audits, permitting programs, developing Plan of Operations and EA/EIS, alternative siting studies, reclamation planning, environmental contingency planning, remediation and environmental litigation support
• Environmental and permitting feasibility support for project financing for domestic and international projects and clients
4. I have read the definition of "qualified person" set out in National Instrument 43-101 (NI 43-101) and certify that by reason of my education, affiliation with a professional association (as defined in NI 43-101) and past relevant work experience, I fulfill the requirements to be a "qualified person" for the purposes of NI 43-101.
5. I visited the Pinyon Plain Project on October 27, 2022.
6. I am responsible for Section 1.1.1.5, 1.1.2.5, 1.3.13, 4.3, 20, 25.5, and 26.5, and contributions to Section 27 of the Technical Report.
7. I am independent of the Issuer applying the test set out in Section 1.5 of NI 43-101.
8. I have had no prior involvement with the property that is the subject of the Technical Report.
9. I have read NI 43-101, and the Technical Report has been prepared in compliance with NI 43-101 and Form 43-101F1.
10. At the effective date of the Technical Report, to the best of my knowledge, information, and belief, the Sections in the Technical Report for which I am responsible contain all scientific and technical information that is required to be disclosed to make the Technical Report not misleading.
Dated this 6th day of March, 2024
(Signed & Sealed) Lee (Pat) Gochnour
Lee (Pat) Gochnour, MMSA QP
30.0 APPENDIX 1
Table 30-1: SLR Base Case Cash Flow Summary
Energy Fuels Inc. - Pinyon Plain Project
| | | USD and US Units | | | | | | | | | | | | | | | | | | | | | | | | | | | | | | | | | | | | | | | | | | | | | | | | | | | | | | | | |
| Months | INPUTS | UNITS | | TOTAL | | | 1 | | | 2 | | | 3 | | | 4 | | | 5 | | | 6 | | | 7 | | | 8 | | | 9 | | | 10 | | | 11 | | | 12 | | | 13 | | | 14 | | | 15 | | | 16 | | | 17 | | | 18 |
| MINING | | | | | | | | | | | | | | | | | | | | | | | | | | | | | | | | | | | | | | | | | | | | | | | | | | | | | | | | | | |
| | | | | | | | | | | | | | | | | | | | | | | | | | | | | | | | | | | | | | | | | | | | | | | | | | | | | | | | | | | |
| Underground | | | | | | | | | | | | | | | | | | | | | | | | | | | | | | | | | | | | | | | | | | | | | | | | | | | | | | | | | | |
| Mine Operating Days | | days | | 750 | | | 30 | | | 30 | | | 30 | | | 30 | | | 30 | | | 30 | | | 30 | | | 30 | | | 30 | | | 30 | | | 30 | | | 30 | | | 30 | | | 30 | | | 30 | | | 30 | | | 30 | | | 30 |
| Tons milled per day (Steady State) | | tons / day | | 219 | | | ‐ | | | ‐ | | | ‐ | | | ‐ | | | 67 | | | 117 | | | 35 | | | 71 | | | 146 | | | 292 | | | 175 | | | 175 | | | 175 | | | 233 | | | 292 | | | 233 | | | 205 | | | 292 |
| Tons moved per day (Steady State) | | tons / day | | 227 | | | 116 | | | 14 | | | 92 | | | 214 | | | 242 | | | 279 | | | 221 | | | 200 | | | 190 | | | 292 | | | 190 | | | 221 | | | 186 | | | 236 | | | 355 | | | 233 | | | 205 | | | 301 |
| | | | | | | | | | | | | | | | | | | | | | | | | | | | | | | | | | | | | | | | | | | | | | | | | | | | | | | | | | | |
| Production | | dry tons | | 134,464 | | | ‐ | | | ‐ | | | ‐ | | | ‐ | | | 2,013 | | | 3,501 | | | 1,052 | | | 2,138 | | | 4,376 | | | 8,750 | | | 5,250 | | | 5,250 | | | 5,250 | | | 7,000 | | | 8,750 | | | 7,000 | | | 6,164 | | | 8,750 |
| Ore Grade | | % U3O8 | | 0.58% | | | 0.00% | | | 0.00% | | | 0.00% | | | 0.00% | | | 0.37% | | | 0.37% | | | 0.58% | | | 0.61% | | | 0.61% | | | 0.61% | | | 0.61% | | | 0.61% | | | 0.70% | | | 0.69% | | | 0.68% | | | 0.55% | | | 0.58% | | | 0.57% |
| Contained U3O8 | | tons | | 784 | | | ‐ | | | ‐ | | | ‐ | | | ‐ | | | 8 | | | 13 | | | 6 | | | 13 | | | 27 | | | 53 | | | 32 | | | 32 | | | 37 | | | 48 | | | 59 | | | 38 | | | 36 | | | 50 |
| Waste | | tons | | 38,978 | | | 3,475 | | | 414 | | | 2,754 | | | 6,426 | | | 5,246 | | | 4,877 | | | 5,582 | | | 3,852 | | | 1,335 | | | ‐ | | | 459 | | | 1,377 | | | 344 | | | 66 | | | 1,887 | | | ‐ | | | ‐ | | | 267 |
| Total Moved | | tons | | 173,442 | | | 3,475 | | | 414 | | | 2,754 | | | 6,426 | | | 7,259 | | | 8,378 | | | 6,634 | | | 5,991 | | | 5,711 | | | 8,750 | | | 5,709 | | | 6,627 | | | 5,594 | | | 7,066 | | | 10,637 | | | 7,000 | | | 6,164 | | | 9,017 |
| PROCESSING | | | | | | | | | | | | | | | | | | | | | | | | | | | | | | | | | | | | | | | | | | | | | | | | | | | | | | | | | | |
| Ore to Milling and Flotation | | dry tons | | 134,464 | | | ‐ | | | ‐ | | | ‐ | | | ‐ | | | 2,013 | | | 3,501 | | | 1,052 | | | 2,138 | | | 4,376 | | | 8,750 | | | 5,250 | | | 5,250 | | | 5,250 | | | 7,000 | | | 8,750 | | | 7,000 | | | 6,164 | | | 8,750 |
| Head Grade U3O8 | | % U3O8 | | 0.58% | | | 0.00% | | | 0.00% | | | 0.00% | | | 0.00% | | | 0.37% | | | 0.37% | | | 0.58% | | | 0.61% | | | 0.61% | | | 0.61% | | | 0.61% | | | 0.61% | | | 0.70% | | | 0.69% | | | 0.68% | | | 0.55% | | | 0.58% | | | 0.57% |
| Contained U3O8 | | lbs U3O8 | | 1,567,712 | | | ‐ | | | ‐ | | | ‐ | | | ‐ | | | 15,051 | | | 26,178 | | | 12,155 | | | 25,972 | | | 53,203 | | | 106,523 | | | 63,914 | | | 64,137 | | | 73,027 | | | 96,548 | | | 118,192 | | | 76,646 | | | 71,868 | | | 100,271 |
| | | | | | | | | | | | | | | | | | | | | | | | | | | | | | | | | | | | | | | | | | | | | | | | | | | | | | | | | | | |
| U3O8 Recovery | | | | | | | | | | | | | | | | | | | | | | | | | | | | | | | | | | | | | | | | | | | | | | | | | | | | | | | | | | |
| Recovery | 96% | % | | 96% | | | 96% | | | 96% | | | 96% | | | 96% | | | 96% | | | 96% | | | 96% | | | 96% | | | 96% | | | 96% | | | 96% | | | 96% | | | 96% | | | 96% | | | 96% | | | 96% | | | 96% | | | 96% |
| Payable U3O8 | | lbs U3O8 | | 1,505,003 | | | ‐ | | | ‐ | | | ‐ | | | ‐ | | | 14,449 | | | 25,131 | | | 11,669 | | | 24,933 | | | 51,074 | | | 102,262 | | | 61,357 | | | 61,571 | | | 70,105 | | | 92,686 | | | 113,465 | | | 73,581 | | | 68,993 | | | 96,260 |
| REVENUE | | | | | | | | | | | | | | | | | | | | | | | | | | | | | | | | | | | | | | | | | | | | | | | | | | | | | | | | | | |
| Market Price | | Input Units US$/lb | | | | | | | | | | | | | | | | | | | | | | | | | | | | | | | | | | | | | | | | | | | | | | | | | | | | | | | | |
| Current Market Price | SLR | U3O8 | $ | 60 | | $ | 60 | | $ | 60 | | $ | 60 | | $ | 60 | | $ | 60 | | $ | 60 | | $ | 60 | | $ | 60 | | $ | 60 | | $ | 60 | | $ | 60 | | $ | 60 | | $ | 60 | | $ | 60 | | $ | 60 | | $ | 60 | | $ | 60 | | $ | 60 |
| % Sold At Market Price Long‐term | 100% | | | | | | | | | | | | | | | | | | | | | | | | | | | | | | | | | | | | | | | | | | | | | | | | | | | | | | | | | |
| Contract Price | $0.00 0% | US$/lb U3O8 | $ | ‐ | | $ | ‐ | | $ | ‐ | | $ | ‐ | | $ | ‐ | | $ | ‐ | | $ | ‐ | | $ | ‐ | | $ | ‐ | | $ | ‐ | | $ | ‐ | | $ | ‐ | | $ | ‐ | | $ | ‐ | | $ | ‐ | | $ | ‐ | | $ | ‐ | | $ | ‐ | | $ | ‐ |
| % Sold At Contract Price | | | | | | | | | | | | | | | | | | | | | | | | | | | | | | | | | | | | | | | | | | | | | | | | | | | | | | | | | | |
| | | | | | | | | | | | | | | | | | | | | | | | | | | | | | | | | | | | | | | | | | | | | | | | | | | | | | | | | | | |
| Total Gross Revenue | | US$ '000 | $ | 90,300 | | $ | ‐ | | $ | ‐ | | $ | ‐ | | $ | ‐ | | $ | 867 | | $ | 1,508 | | $ | 700 | | $ | 1,496 | | $ | 3,064 | | $ | 6,136 | | $ | 3,681 | | $ | 3,694 | | $ | 4,206 | | $ | 5,561 | | $ | 6,808 | | $ | 4,415 | | $ | 4,140 | | $ | 5,776 |
| | | | | | | | | | | | | | | | | | | | | | | | | | | | | | | | | | | | | | | | | | | | | | | | | | | | | | | | | | | |
| Concentrate Freight | $0.18/lb U3O8 | US$ '000 | $ | 263 | | $ | ‐ | | $ | ‐ | | $ | ‐ | | $ | ‐ | | $ | 3 | | $ | 4 | | $ | 2 | | $ | 4 | | $ | 9 | | $ | 18 | | $ | 11 | | $ | 11 | | $ | 12 | | $ | 16 | | $ | 20 | | $ | 13 | | $ | 12 | | $ | 17 |
| Total Charges | | US$ '000 | $ | 263 | | $ | ‐ | | $ | ‐ | | $ | ‐ | | $ | ‐ | | $ | 3 | | $ | 4 | | $ | 2 | | $ | 4 | | $ | 9 | | $ | 18 | | $ | 11 | | $ | 11 | | $ | 12 | | $ | 16 | | $ | 20 | | $ | 13 | | $ | 12 | | $ | 17 |
| | | | | | | | | | | | | | | | | | | | | | | | | | | | | | | | | | | | | | | | | | | | | | | | | | | | | | | | | | | |
| Gross Less Charges | | US$ '000 | $ | 90,037 | | $ | ‐ | | $ | ‐ | | $ | ‐ | | $ | ‐ | | $ | 864 | | $ | 1,503 | | $ | 698 | | $ | 1,492 | | $ | 3,056 | | $ | 6,118 | | $ | 3,671 | | $ | 3,683 | | $ | 4,194 | | $ | 5,545 | | $ | 6,788 | | $ | 4,402 | | $ | 4,128 | | $ | 5,759 |
| | | | | | | | | | | | | | | | | | | | | | | | | | | | | | | | | | | | | | | | | | | | | | | | | | | | | | | | | | | |
| Royalty | $1.88/t milled | US$ '000 | $ | 253 | | $ | ‐ | | $ | ‐ | | $ | ‐ | | $ | ‐ | | $ | 3 | | $ | 5 | | $ | 2 | | $ | 4 | | $ | 8 | | $ | 17 | | $ | 10 | | $ | 10 | | $ | 12 | | $ | 15 | | $ | 19 | | $ | 12 | | $ | 11 | | $ | 16 |
| | | | | | | | | | | | | | | | | | | | | | | | | | | | | | | | | | | | | | | | | | | | | | | | | | | | | | | | | | | |
| Net Smelter Return Unit NSR | | US$ '000 | $ | 89,783 | | $ | ‐ | | $ | ‐ | | $ | ‐ | | $ | ‐ | | $ | 862 | | $ | 1,499 | | $ | 696 | | $ | 1,487 | | $ | 3,047 | | $ | 6,101 | | $ | 3,661 | | $ | 3,673 | | $ | 4,183 | | $ | 5,530 | | $ | 6,769 | | $ | 4,390 | | $ | 4,116 | | $ | 5,743 |
| | | US$ / t milled | $ | 0.67 | | $ | ‐ | | $ | ‐ | | $ | ‐ | | $ | ‐ | | $ | 0.43 | | $ | 0.43 | | $ | 0.66 | | $ | 0.70 | | $ | 0.70 | | $ | 0.70 | | $ | 0.70 | | $ | 0.70 | | $ | 0.80 | | $ | 0.79 | | $ | 0.77 | | $ | 0.63 | | $ | 0.67 | | $ | 0.66 |
| OPERATING COST | | | | | | | | | | | | | | | | | | | | | | | | | | | | | | | | | | | | | | | | | | | | | | | | | | | | | | | | | | |
| Underground Mining Cost | $101.00/t milled | US$/t milled | $ | 101.00 | | $ | 101.00 | | $ | 101.00 | | $ | 101.00 | | $ | 101.00 | | $ | 101.00 | | $ | 101.00 | | $ | 101.00 | | $ | 101.00 | | $ | 101.00 | | $ | 101.00 | | $ | 101.00 | | $ | 101.00 | | $ | 101.00 | | $ | 101.00 | | $ | 101.00 | | $ | 101.00 | | $ | 101.00 | | $ | 101.00 |
| Ore Trucking Cost | $72.00/t milled | US$/t milled | $ | 72.00 | | $ | 72.00 | | $ | 72.00 | | $ | 72.00 | | $ | 72.00 | | $ | 72.00 | | $ | 72.00 | | $ | 72.00 | | $ | 72.00 | | $ | 72.00 | | $ | 72.00 | | $ | 72.00 | | $ | 72.00 | | $ | 72.00 | | $ | 72.00 | | $ | 72.00 | | $ | 72.00 | | $ | 72.00 | | $ | 72.00 |
| WMM Milling & Processing | $192.00/t milled | US$/t milled | $ | 192.00 | | $ | 192.00 | | $ | 192.00 | | $ | 192.00 | | $ | 192.00 | | $ | 192.00 | | $ | 192.00 | | $ | 192.00 | | $ | 192.00 | | $ | 192.00 | | $ | 192.00 | | $ | 192.00 | | $ | 192.00 | | $ | 192.00 | | $ | 192.00 | | $ | 192.00 | | $ | 192.00 | | $ | 192.00 | | $ | 192.00 |
| G&A | $7.00/t milled | US$/t milled | $ | 7.00 | | $ | 7.00 | | $ | 7.00 | | $ | 7.00 | | $ | 7.00 | | $ | 7.00 | | $ | 7.00 | | $ | 7.00 | | $ | 7.00 | | $ | 7.00 | | $ | 7.00 | | $ | 7.00 | | $ | 7.00 | | $ | 7.00 | | $ | 7.00 | | $ | 7.00 | | $ | 7.00 | | $ | 7.00 | | $ | 7.00 |
| Total Unit Operating Cost | | US$/t milled | $ | 372.00 | | $ | 372.00 | | $ | 372.00 | | $ | 372.00 | | $ | 372.00 | | $ | 372.00 | | $ | 372.00 | | $ | 372.00 | | $ | 372.00 | | $ | 372.00 | | $ | 372.00 | | $ | 372.00 | | $ | 372.00 | | $ | 372.00 | | $ | 372.00 | | $ | 372.00 | | $ | 372.00 | | $ | 372.00 | | $ | 372.00 |
| | | | | | | | | | | | | | | | | | | | | | | | | | | | | | | | | | | | | | | | | | | | | | | | | | | | | | | | | | | |
| Underground Mining Cost | | US$ '000 | $ | 13,581 | | $ | ‐ | | $ | ‐ | | $ | ‐ | | $ | ‐ | | $ | 203 | | $ | 354 | | $ | 106 | | $ | 216 | | $ | 442 | | $ | 884 | | $ | 530 | | $ | 530 | | $ | 530 | | $ | 707 | | $ | 884 | | $ | 707 | | $ | 623 | | $ | 884 |
| Ore Trucking Cost | | US$ '000 | $ | 9,681 | | $ | ‐ | | $ | ‐ | | $ | ‐ | | $ | ‐ | | $ | 145 | | $ | 252 | | $ | 76 | | $ | 154 | | $ | 315 | | $ | 630 | | $ | 378 | | $ | 378 | | $ | 378 | | $ | 504 | | $ | 630 | | $ | 504 | | $ | 444 | | $ | 630 |
| Milling & Processing | | US$ '000 | $ | 25,817 | | $ | ‐ | | $ | ‐ | | $ | ‐ | | $ | ‐ | | $ | 387 | | $ | 672 | | $ | 202 | | $ | 411 | | $ | 840 | | $ | 1,680 | | $ | 1,008 | | $ | 1,008 | | $ | 1,008 | | $ | 1,344 | | $ | 1,680 | | $ | 1,344 | | $ | 1,183 | | $ | 1,680 |
| G&A | | US$ '000 | $ | 941 | | $ | ‐ | | $ | ‐ | | $ | ‐ | | $ | ‐ | | $ | 14 | | $ | 25 | | $ | 7 | | $ | 15 | | $ | 31 | | $ | 61 | | $ | 37 | | $ | 37 | | $ | 37 | | $ | 49 | | $ | 61 | | $ | 49 | | $ | 43 | | $ | 61 |
| Subtotal Operating Cost | | US$ '000 | $ | 50,021 | | $ | ‐ | | $ | ‐ | | $ | ‐ | | $ | ‐ | | $ | 749 | | $ | 1,303 | | $ | 391 | | $ | 795 | | $ | 1,628 | | $ | 3,255 | | $ | 1,953 | | $ | 1,953 | | $ | 1,953 | | $ | 2,604 | | $ | 3,255 | | $ | 2,604 | | $ | 2,293 | | $ | 3,255 |
| AZ Severance Tax | 1.25% | US$ '000 | $ | 497 | | $ | ‐ | | $ | ‐ | | $ | ‐ | | $ | ‐ | | $ | 1 | | $ | 2 | | $ | 4 | | $ | 9 | | $ | 18 | | $ | 36 | | $ | 21 | | $ | 22 | | $ | 28 | | $ | 37 | | $ | 44 | | $ | 22 | | $ | 23 | | $ | 31 |
| Total Operating Cost with Severance Tax | | US$ '000 | $ | 50,518 | | $ | ‐ | | $ | ‐ | | $ | ‐ | | $ | ‐ | | $ | 750 | | $ | 1,305 | | $ | 395 | | $ | 804 | | $ | 1,646 | | $ | 3,291 | | $ | 1,974 | | $ | 1,975 | | $ | 1,981 | | $ | 2,641 | | $ | 3,299 | | $ | 2,626 | | $ | 2,316 | | $ | 3,286 |
| | | | | | | | | | | | | | | | | | | | | | | | | | | | | | | | | | | | | | | | | | | | | | | | | | | | | | | | | | | |
| Unit Operating Cost | | US$/t milled | $ | 372 | | $ | ‐ | | $ | ‐ | | $ | ‐ | | $ | ‐ | | $ | 373 | | $ | 373 | | $ | 376 | | $ | 376 | | $ | 376 | | $ | 376 | | $ | 376 | | $ | 376 | | $ | 377 | | $ | 377 | | $ | 377 | | $ | 375 | | $ | 376 | | $ | 376 |
| | | | | | | | | | | | | | | | | | | | | | | | | | | | | | | | | | | | | | | | | | | | | | | | | | | | | | | | | | | |
| Operating Margin | | US$ '000 | $ | 39,266 | | $ | ‐ | | $ | ‐ | | $ | ‐ | | $ | ‐ | | $ | 111 | | $ | 194 | | $ | 301 | | $ | 683 | | $ | 1,401 | | $ | 2,810 | | $ | 1,686 | | $ | 1,699 | | $ | 2,202 | | $ | 2,889 | | $ | 3,470 | | $ | 1,763 | | $ | 1,800 | | $ | 2,457 |
| CAPITAL COST | | | | | | | | | | | | | | | | | | | | | | | | | | | | | | | | | | | | | | | | | | | | | | | | | | | | | | | | | | |
| Direct Cost | | | | | | | | | | | | | | | | | | | | | | | | | | | | | | | | | | | | | | | | | | | | | | | | | | | | | | | | | | |
| Mine Development | $1200/ft | US$ '000 | $ | 3,799 | | $ | 509 | | $ | 61 | | $ | 403 | | $ | 941 | | $ | 970 | | $ | 916 | | | | | | | | | | | | | | | | | | | | | | | | | | | | | | | | | | | | |
| Loadout Installation | | US$ '000 | $ | 129 | | | | | $ | 129 | | | | | | | | | | | | | | | | | | | | | | | | | | | | | | | | | | | | | | | | | | | | | | | | |
| UG Mine Equip. | | US$ '000 | $ | 590 | | $ | ‐ | | $ | 166 | | $ | 90 | | $ | 240 | | $ | ‐ | | $ | 74 | | $ | ‐ | | $ | ‐ | | $ | 10 | | $ | ‐ | | $ | ‐ | | $ | 10 | | $ | ‐ | | $ | ‐ | | $ | ‐ | | $ | ‐ | | $ | ‐ | | $ | ‐ |
| Ventilation Fans | | US$ '000 | $ | 1,726 | | $ | ‐ | | $ | ‐ | | $ | ‐ | | $ | ‐ | | $ | ‐ | | $ | ‐ | | $ | 1,726 | | $ | ‐ | | $ | ‐ | | $ | ‐ | | $ | ‐ | | $ | ‐ | | $ | ‐ | | $ | ‐ | | $ | ‐ | | $ | ‐ | | $ | ‐ | | $ | ‐ |
| Ventilation Raise | | US$ '000 | $ | 1,219 | | $ | ‐ | | $ | ‐ | | $ | ‐ | | $ | ‐ | | $ | ‐ | | $ | 432 | | $ | 787 | | $ | ‐ | | $ | ‐ | | $ | ‐ | | $ | ‐ | | $ | ‐ | | $ | ‐ | | $ | ‐ | | $ | ‐ | | $ | ‐ | | $ | ‐ | | $ | ‐ |
| Surface Infrastructure | | US$ '000 | $ | 140 | | $ | ‐ | | $ | ‐ | | $ | 140 | | $ | ‐ | | $ | ‐ | | $ | ‐ | | $ | ‐ | | $ | ‐ | | $ | ‐ | | $ | ‐ | | $ | ‐ | | $ | ‐ | | $ | ‐ | | $ | ‐ | | $ | ‐ | | $ | ‐ | | $ | ‐ | | $ | ‐ |
| Total Direct Cost | | US$ '000 | $ | 7,603 | | $ | 509 | | $ | 355 | | $ | 633 | | $ | 1,181 | | $ | 970 | | $ | 1,422 | | $ | 2,513 | | $ | ‐ | | $ | 10 | | $ | ‐ | | $ | ‐ | | $ | 10 | | $ | ‐ | | $ | ‐ | | $ | ‐ | | $ | ‐ | | $ | ‐ | | $ | ‐ |
| | | | | | | | | | | | | | | | | | | | | | | | | | | | | | | | | | | | | | | | | | | | | | | | | | | | | | | | | | | |
| Other Costs | Incl. Above | | | | | | | | | | | | | | | | | | | | | | | | | | | | | | | | | | | | | | | | | | | | | | | | | | | | | | | | | |
| EPCM / Owners / Indirect Cost | | US$ '000 | $ | ‐ | | $ | ‐ | | $ | ‐ | | $ | ‐ | | $ | ‐ | | $ | ‐ | | $ | ‐ | | $ | ‐ | | $ | ‐ | | $ | ‐ | | $ | ‐ | | $ | ‐ | | $ | ‐ | | $ | ‐ | | $ | ‐ | | $ | ‐ | | $ | ‐ | | $ | ‐ | | $ | ‐ |
| Subtotal Costs | | US$ '000 | $ | 7,603 | | $ | 509 | | $ | 355 | | $ | 633 | | $ | 1,181 | | $ | 970 | | $ | 1,422 | | $ | 2,513 | | $ | ‐ | | $ | 10 | | $ | ‐ | | $ | ‐ | | $ | 10 | | $ | ‐ | | $ | ‐ | | $ | ‐ | | $ | ‐ | | $ | ‐ | | $ | ‐ |
| | | | | | | | | | | | | | | | | | | | | | | | | | | | | | | | | | | | | | | | | | | | | | | | | | | | | | | | | | | |
| Contingency | 15% | US$ '000 | $ | 1,145 | | $ | 77 | | $ | 54 | | $ | 95 | | $ | 178 | | $ | 146 | | $ | 214 | | $ | 379 | | $ | ‐ | | $ | 2 | | $ | ‐ | | $ | ‐ | | $ | 2 | | $ | ‐ | | $ | ‐ | | $ | ‐ | | $ | ‐ | | $ | ‐ | | $ | ‐ |
| Initial Capital Cost | | US$ '000 | $ | 8,748 | | $ | 585 | | $ | 409 | | $ | 729 | | $ | 1,359 | | $ | 1,116 | | $ | 1,636 | | $ | 2,892 | | $ | ‐ | | $ | 12 | | $ | ‐ | | $ | ‐ | | $ | 12 | | $ | ‐ | | $ | ‐ | | $ | ‐ | | $ | ‐ | | $ | ‐ | | $ | ‐ |
| | | | | | | | | | | | | | | | | | | | | | | | | | | | | | | | | | | | | | | | | | | | | | | | | | | | | | | | | | | |
| Sustaining | | US$ '000 | $ | ‐ | | $ | ‐ | | $ | ‐ | | $ | ‐ | | $ | ‐ | | $ | ‐ | | $ | ‐ | | $ | ‐ | | $ | ‐ | | $ | ‐ | | $ | ‐ | | $ | ‐ | | $ | ‐ | | $ | ‐ | | $ | ‐ | | $ | ‐ | | $ | ‐ | | $ | ‐ | | $ | ‐ |
| Working Capital | | US$ '000 | $ | (0 | ) | $ | ‐ | | $ | ‐ | | $ | ‐ | | $ | ‐ | | $ | 118 | | $ | 87 | | $ | 103 | | $ | 392 | | $ | 736 | | $ | 1,444 | | $ | (1,152 | ) | $ | 13 | | $ | 512 | | $ | 704 | | $ | 596 | | $ | (1,742 | ) | $ | 36 | | $ | 674 |
| Reclamation | | US$ '000 | $ | 1,407 | | $ | ‐ | | $ | ‐ | | $ | ‐ | | $ | ‐ | | $ | ‐ | | $ | ‐ | | $ | ‐ | | $ | ‐ | | $ | ‐ | | $ | ‐ | | $ | ‐ | | $ | ‐ | | $ | ‐ | | $ | ‐ | | $ | ‐ | | $ | ‐ | | $ | ‐ | | $ | ‐ |
| Total Capital Cost | | US$ '000 | $ | 10,155 | | $ | 585 | | $ | 409 | | $ | 729 | | $ | 1,359 | | $ | 1,234 | | $ | 1,723 | | $ | 2,995 | | $ | 392 | | $ | 748 | | $ | 1,444 | | $ | (1,152 | ) | $ | 24 | | $ | 512 | | $ | 704 | | $ | 596 | | $ | (1,742 | ) | $ | 36 | | $ | 674 |
| PRE‐TAX CASH FLOW | | | | | | | (600 | ) | | (419 | ) | | (747 | ) | | (1,393 | ) | | (1,151 | ) | | (1,571 | ) | | (2,768 | ) | | 292 | | | 654 | | | 1,366 | | | 2,839 | | | 1,674 | | | 1,690 | | | 2,185 | | | 2,875 | | | 3,505 | | | 1,765 | | | 1,783 |
| Net Pre‐Tax Cashflow Cumulative Pre‐Tax | | US$ '000 | $ | 29,110 | | $ | (585 | ) | $ | (409 | ) | $ | (729 | ) | $ | (1,359 | ) | $ | (1,122 | ) | $ | (1,529 | ) | $ | (2,694 | ) | $ | 292 | | $ | 654 | | $ | 1,366 | | $ | 2,839 | | $ | 1,674 | | $ | 1,690 | | $ | 2,185 | | $ | 2,875 | | $ | 3,505 | | $ | 1,765 | | $ | 1,783 |
| Cashflow | | US$ '000 | | | | $ | (585 | ) | $ | (994 | ) | $ | (1,723 | ) | $ | (3,081 | ) | $ | (4,204 | ) | $ | (5,733 | ) | $ | (8,428 | ) | $ | (8,136 | ) | $ | (7,482 | ) | $ | (6,116 | ) | $ | (3,277 | ) | $ | (1,603 | ) | $ | 87 | | $ | 2,272 | | $ | 5,147 | | $ | 8,652 | | $ | 10,417 | | $ | 12,199 |
| | | | | | | | | | | | | | | | | | | | | | | | | | | | | | | | | | | | | | | | | | | | | | | | | | | | | | | | | | | |
| Taxes | 15.4% | US$ '000 | $ | 6,046 | | $ | ‐ | | $ | ‐ | | $ | ‐ | | $ | ‐ | | $ | ‐ | | $ | ‐ | | $ | ‐ | | $ | 45 | | $ | 101 | | $ | 210 | | $ | 437 | | $ | 258 | | $ | 260 | | $ | 337 | | $ | 443 | | $ | 540 | | $ | 272 | | $ | 275 |
| | | | | | | | | | | | | | | | | | | | | | | | | | | | | | | | | | | | | | | | | | | | | | | | | | | | | | | | | | | |
| After‐Tax Cashflow | | US$ '000 | $ | 23,064 | | $ | (585 | ) | $ | (409 | ) | $ | (729 | ) | $ | (1,359 | ) | $ | (1,122 | ) | $ | (1,529 | ) | $ | (2,694 | ) | $ | 247 | | $ | 553 | | $ | 1,156 | | $ | 2,401 | | $ | 1,417 | | $ | 1,429 | | $ | 1,849 | | $ | 2,432 | | $ | 2,966 | | $ | 1,493 | | $ | 1,508 |
| Cumulative After‐Tax Cashflow | | US$ '000 | | | | $ | (585 | ) | $ | (994 | ) | $ | (1,723 | ) | $ | (3,081 | ) | $ | (4,204 | ) | $ | (5,733 | ) | $ | (8,428 | ) | $ | (8,181 | ) | $ | (7,628 | ) | $ | (6,472 | ) | $ | (4,071 | ) | $ | (2,654 | ) | $ | (1,225 | ) | $ | 624 | | $ | 3,056 | | $ | 6,022 | | $ | 7,515 | | $ | 9,023 |
| PROJECT ECONOMICS | | | | | | | | | | | | | | | | | | | | | | | | | | | | | | | | | | | | | | | | | | | | | | | | | | | | | | | | | | |
| Pre‐Tax IRR | | % | | 14 % | | | | | | | | | | | | | | | | | | | | | | | | | | | | | | | | | | | | | | | | | | | | | | | | | | | | | | |
| Pre‐tax NPV at 5% discounting | 5% | US$ '000 | $ | 26,682 | | | | | | | | | | | | | | | | | | | | | | | | | | | | | | | | | | | | | | | | | | | | | | | | | | | | | | |
| Pre‐tax NPV at 8% discounting | 8% | US$ '000 | $ | 25,318 | | | | | | | | | | | | | | | | | | | | | | | | | | | | | | | | | | | | | | | | | | | | | | | | | | | | | | |
| Pre‐tax NPV at 12% discounting | 12% | US$ '000 | $ | 23,602 | | | | | | | | | | | | | | | | | | | | | | | | | | | | | | | | | | | | | | | | | | | | | | | | | | | | | | |
| | | | | | | | | | | | | | | | | | | | | | | | | | | | | | | | | | | | | | | | | | | | | | | | | | | | | | | | | | | |
| After‐Tax IRR | | % | | 12 % | | | | | | | | | | | | | | | | | | | | | | | | | | | | | | | | | | | | | | | | | | | | | | | | | | | | | | |
| After‐Tax NPV at 5% discounting | 5% | US$ '000 | $ | 21,072 | | | | | | | | | | | | | | | | | | | | | | | | | | | | | | | | | | | | | | | | | | | | | | | | | | | | | | |
| After‐Tax NPV at 8% discounting | 8% | US$ '000 | $ | 19,954 | | | | | | | | | | | | | | | | | | | | | | | | | | | | | | | | | | | | | | | | | | | | | | | | | | | | | | |
| After‐tax NPV at 12% discounting | 12% | US$ '000 | $ | 18,545 | | | | | | | | | | | | | | | | | | | | | | | | | | | | | | | | | | | | | | | | | | | | | | | | | | | | | | |
| PROJECT CASH COSTS | | | | | | | | | | | | | | | | | | | | | | | | | | | | | | | | | | | | | | | | | | | | | | | | | | | | | | | | | | |
| Operating Cash Costs | | $/lb U3O8 | | 33.91 | | | 0.00 | | | 0.00 | | | 0.00 | | | 0.00 | | | 52.29 | | | 52.29 | | | 34.21 | | | 32.59 | | | 32.56 | | | 32.52 | | | 32.52 | | | 32.41 | | | 28.59 | | | 28.83 | | | 29.41 | | | 36.03 | | | 33.91 | | | 34.48 |
| All‐in Sustaining Costs | | $/lb U3O8 | | 34.84 | | | 0.00 | | | 0.00 | | | 0.00 | | | 0.00 | | | 60.46 | | | 55.76 | | | 43.07 | | | 48.30 | | | 46.97 | | | 46.64 | | | 13.74 | | | 32.62 | | | 35.90 | | | 36.42 | | | 34.66 | | | 12.36 | | | 34.42 | | | 41.48 |
| All‐in Costs | | $/lb U3O8 | | 40.66 | | | 0.00 | | | 0.00 | | | 0.00 | | | 0.00 | | | 137.68 | | | 120.86 | | | 290.91 | | | 48.30 | | | 47.20 | | | 46.64 | | | 13.74 | | | 32.80 | | | 35.90 | | | 36.42 | | | 34.66 | | | 12.36 | | | 34.42 | | | 41.48 |
| WORKING CAPITAL | | | | | | | | | | | | | | | | | | | | | | | | | | | | | | | | | | | | | | | | | | | | | | | | | | | | | | | | | | |
| Accounts Receivable | 30 | Days O/S | | (0 | ) | | ‐ | | | ‐ | | | ‐ | | | ‐ | | | 867 | | | 641 | | | (808 | ) | | 796 | | | 1,569 | | | 3,071 | | | (2,454 | ) | | 13 | | | 512 | | | 1,355 | | | 1,247 | | | (2,393 | ) | | (275 | ) | | 1,636 |
| Accounts Payable | 30 | Days O/S | | 0 | | | ‐ | | | ‐ | | | ‐ | | | ‐ | | | 749 | | | 554 | | | (911 | ) | | 404 | | | 832 | | | 1,627 | | | (1,302 | ) | | ‐ | | | ‐ | | | 651 | | | 651 | | | (651 | ) | | (311 | ) | | 962 |
| Working Capital Adjustments | | | | (0 | ) | | ‐ | | | ‐ | | | ‐ | | | ‐ | | | 118 | | | 87 | | | 103 | | | 392 | | | 736 | | | 1,444 | | | (1,152 | ) | | 13 | | | 512 | | | 704 | | | 596 | | | (1,742 | ) | | 36 | | | 674 |