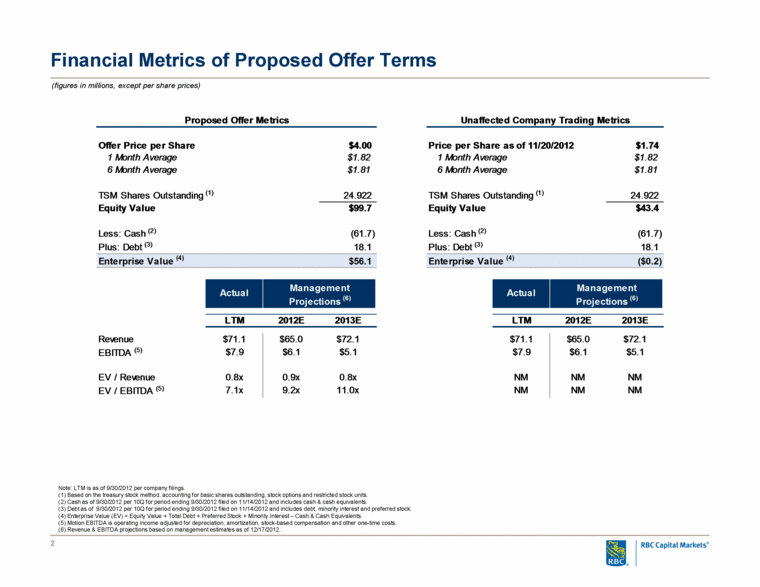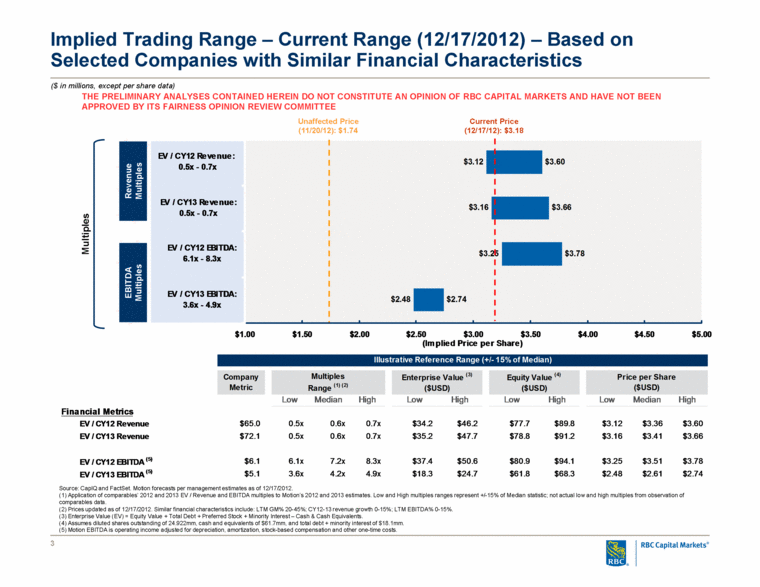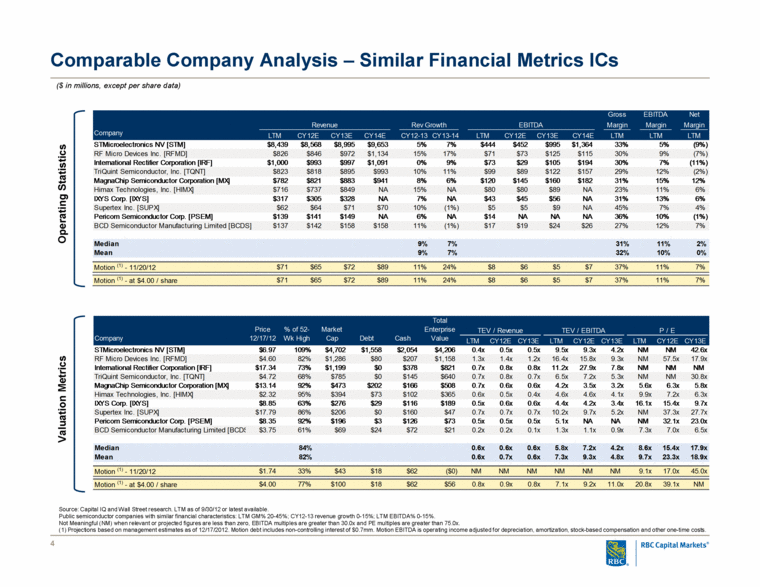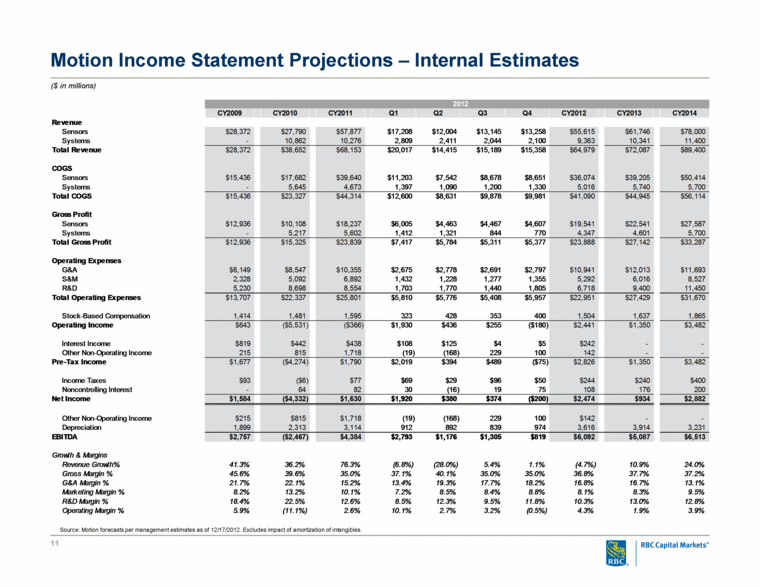
| Motion Income Statement Projections – Internal Estimates Source: Motion forecasts per management estimates as of 12/17/2012. Excludes impact of amortization of intangibles. ($ in millions) ($ in millions) 2012 CY2009 CY2010 CY2011 Q1 Q2 Q3 Q4 CY2012 CY2013 CY2014 Revenue Sensors $28,372 $27,790 $57,877 $17,208 $12,004 $13,145 $13,258 $55,615 $61,746 $78,000 Systems - 10,862 10,276 2,809 2,411 2,044 2,100 9,363 10,341 11,400 Total Revenue $28,372 $38,652 $68,153 $20,017 $14,415 $15,189 $15,358 $64,979 $72,087 $89,400 COGS Sensors $15,436 $17,682 $39,640 $11,203 $7,542 $8,678 $8,651 $36,074 $39,205 $50,414 Systems - 5,645 4,673 1,397 1,090 1,200 1,330 5,016 5,740 5,700 Total COGS $15,436 $23,327 $44,314 $12,600 $8,631 $9,878 $9,981 $41,090 $44,945 $56,114 Gross Profit Sensors $12,936 $10,108 $18,237 $6,005 $4,463 $4,467 $4,607 $19,541 $22,541 $27,587 Systems - 5,217 5,602 1,412 1,321 844 770 4,347 4,601 5,700 Total Gross Profit $12,936 $15,325 $23,839 $7,417 $5,784 $5,311 $5,377 $23,888 $27,142 $33,287 Operating Expenses G&A $6,149 $8,547 $10,355 $2,675 $2,778 $2,691 $2,797 $10,941 $12,013 $11,693 S&M 2,328 5,092 6,892 1,432 1,228 1,277 1,355 5,292 6,016 8,527 R&D 5,230 8,698 8,554 1,703 1,770 1,440 1,805 6,718 9,400 11,450 Total Operating Expenses $13,707 $22,337 $25,801 $5,810 $5,776 $5,408 $5,957 $22,951 $27,429 $31,670 Stock-Based Compensation 1,414 1,481 1,595 323 428 353 400 1,504 1,637 1,865 Operating Income $643 ($5,531) ($366) $1,930 $436 $255 ($180) $2,441 $1,350 $3,482 Interest Income $819 $442 $438 $108 $125 $4 $5 $242 - - Other Non-Operating Income 215 815 1,718 (19) (168) 229 100 142 - - Pre-Tax Income $1,677 ($4,274) $1,790 $2,019 $394 $489 ($75) $2,826 $1,350 $3,482 Income Taxes $93 ($6) $77 $69 $29 $96 $50 $244 $240 $400 Noncontrolling Interest - 64 82 30 (16) 19 75 108 176 200 Net Income $1,584 ($4,332) $1,630 $1,920 $380 $374 ($200) $2,474 $934 $2,882 Other Non-Operating Income $215 $815 $1,718 (19) (168) 229 100 $142 - - Depreciation 1,899 2,313 3,114 912 892 839 974 3,616 3,914 3,231 EBITDA $2,757 ($2,467) $4,384 $2,793 $1,176 $1,305 $819 $6,092 $5,087 $6,513 Growth & Margins Revenue Growth% 41.3% 36.2% 76.3% (6.8%) (28.0%) 5.4% 1.1% (4.7%) 10.9% 24.0% Gross Margin % 45.6% 39.6% 35.0% 37.1% 40.1% 35.0% 35.0% 36.8% 37.7% 37.2% G&A Margin % 21.7% 22.1% 15.2% 13.4% 19.3% 17.7% 18.2% 16.8% 16.7% 13.1% Marketing Margin % 8.2% 13.2% 10.1% 7.2% 8.5% 8.4% 8.8% 8.1% 8.3% 9.5% R&D Margin % 18.4% 22.5% 12.6% 8.5% 12.3% 9.5% 11.8% 10.3% 13.0% 12.8% Operating Margin % 5.9% (11.1%) 2.6% 10.1% 2.7% 3.2% (0.5%) 4.3% 1.9% 3.9% |
